Embed Size (px)
Citation preview
Integrated DYC and ASR Mixed Control ofDistributed Drive Electric Vehicle Using Co-Simulation MethodologyXinwen Zhang
Zhejiang University of Science and TechnologyQiang Li ( [email protected] )
Zhejiang University of Science and TechnologyAgyei Philip
Zhejiang University of Science and TechnologyLu Zhao
Zhejiang University of Science and TechnologyXeihui Wang
Zhejiang University of Science and TechnologyTakura Marufu Baldwin
Zhejiang University of Science and Technology
Research Article
Keywords: Distributed drive electric vehicle(DDEV), mixed control, co-simulation, Direct Yaw Control(DYC), Anti-slip Regulation(ASR).
Posted Date: June 16th, 2021
DOI: https://doi.org/10.21203/rs.3.rs-604895/v1
License: This work is licensed under a Creative Commons Attribution 4.0 International License. Read Full License
Integrated DYC and ASR Mixed Control of Distributed Drive Electric Vehicle Using Co-Simulation Methodology
Xinwen Zhang1, Qiang Li2,*, Agyei Philip3, Lu Zhao4, Xeihui Wang5, and Takura Marufu Baldwin6
1-6Xinwen Zhang et,al are with the School of Mechanical and Energy Engineering, Zhejiang University of Science and Technology, Hangzhou,310023. This work was supported in the part by the Natural Science Foundation of Zhejiang Province under grant under Grant LY21E050001. *[email protected].
ABSTRACT
The improvement of handling and stability performance of distributed drive electric vehicle (DDEV) is analyzed, visualized and designed by proposing and deploying the mixed control strategies in this paper including Direct Yaw Control (DYC), Anti-slip Regulation (ASR) and dual-mode switching control. The practicability and real time visualization of driving efficiency and timeliness of DDEV is achieved to reduce the margin of error for the desired torque value by employing the DYC strategy which uses fuzzy PID algorithm. Furthermore the ASR strategy which adopts the optimal slip rate algorithm to determine the requirement of desired torque value based on the different road conditions is used to reduce slip phenomenon effectively and to maintain handling control of DDEV. In response to different scenes especially conflict and coexistence between DYC and ASR, the dual-mode switching control strategy is applied to find more suitable slip rate range by using the root mean square error method (REME). Finally, co-simulation platform of ADAMS/Car and MATLAB/Simulink is built to simulate the mixed control strategies by integrating dual-mode switching control, DYC and ASR. The simulation results show that this strategy has a more significant control effect needed to meet the requirements of normal vehicle handling and stability. The mixed control strategy is adopted and downloaded into the electronic control unit of our student type formula vehicle called Flash V6 which was designed and developed by a team of students, the ZUST ATTACKER Team.
Keywords: Distributed drive electric vehicle(DDEV), mixed control, co-simulation, Direct Yaw Control (DYC), Anti-slip Regulation(ASR).
Introduction
Distributed drive electric vehicle (DDEV) is an important development and design direction of future electric vehicles. Their main features are that, the drive motor is embedded in the wheel, the transmission chain is shorter, speed response is faster and the torque control accuracy is high1. The wheels equipped with the drive motors can not only be independently controlled but also the wheel torque can be arbitrarily distributed to achieve optimum and better control effect. Based on these characteristics, a torque optimization control algorithm was designed2 and combined with the quadratic programming method to design torque average distribution algorithm3. Zhu et al.4 proposed a particle swarm optimization and nonlinear predictive control algorithm through torque optimization and distribution to improve the vehicle stability while Liu et al.5 used the expected additional torque obtained by a linear quadratic regulator (LQR).
The more common schemes in torque control include uses the yaw rate as the feedback object which is obtained by the optimal allocation strategy6 and combined with the slip rate normally used to construct ABS which prevent vehicle instability7. The yaw rate and the side slip angle are not only used as parameters to observe the vehicle response8−9 but also combined with sliding mode controller. These strategies based on multiple sliding mode controls10−12 were used to design a torque distribution system needed for torque redistribution while ensuring the stability of vehicle braking.
Meanwhile, the slip rate can also be used as a reference value to study the ASR strategy. Based on the independent driving electric vehicles models, the conventional method of slip rate calculations were used to improve the vehicle longitudinal driving stability13. Through fuzzy PID controller, the motor torque is adjusted to obtain the best slip rate control14−16 which shortens the driving acceleration distance and improves the steering stability17. Based on fuzzy PID control theory18, the integrated control strategy of ASR and DYC with a feed forward-feedback method were designed as the active front wheel steering controller (AFS) and DYC which are used as new controllers to obtain a target drive torque that could effectively improve vehicle stability19. A dynamic DYC combined with feed forward and feedback control system was proposed to improve the stability of the vehicle20. The path tracking and MPC controller were introduced in DYC to achieve the purpose of correcting the driving state of the vehicle21. Multi-mode control strategies were designed to improve the longitudinal stability of the vehicle22. A multi-mode switching control strategy was designed based on the longitudinal acceleration
2/14
characteristics of the vehicle. The effectiveness and practicability of the control strategies were finally verified using a real vehicle.
Based on the above excellent research works, a mixed control strategy can be integrated into the dual-mode switching control of DYC algorithm with fuzzy PID controller and ASR algorithm with optimal slip rate PID controller. The strategy can be established based on the DDEV under normal motion conditions.
A co-simulation platform can be set up to simulate the vehicle model with single lane change and step steer tests using ADAMS®/Car and MATLAB®/Simulink.
The results from the mixed control strategy integration consisting of DYC and ASR can effectively prevent DDEV from entering the dangerous limit driving state when turning and driving. The outcome can greatly improves the driving safety of the vehicle.
Vehicle modeling
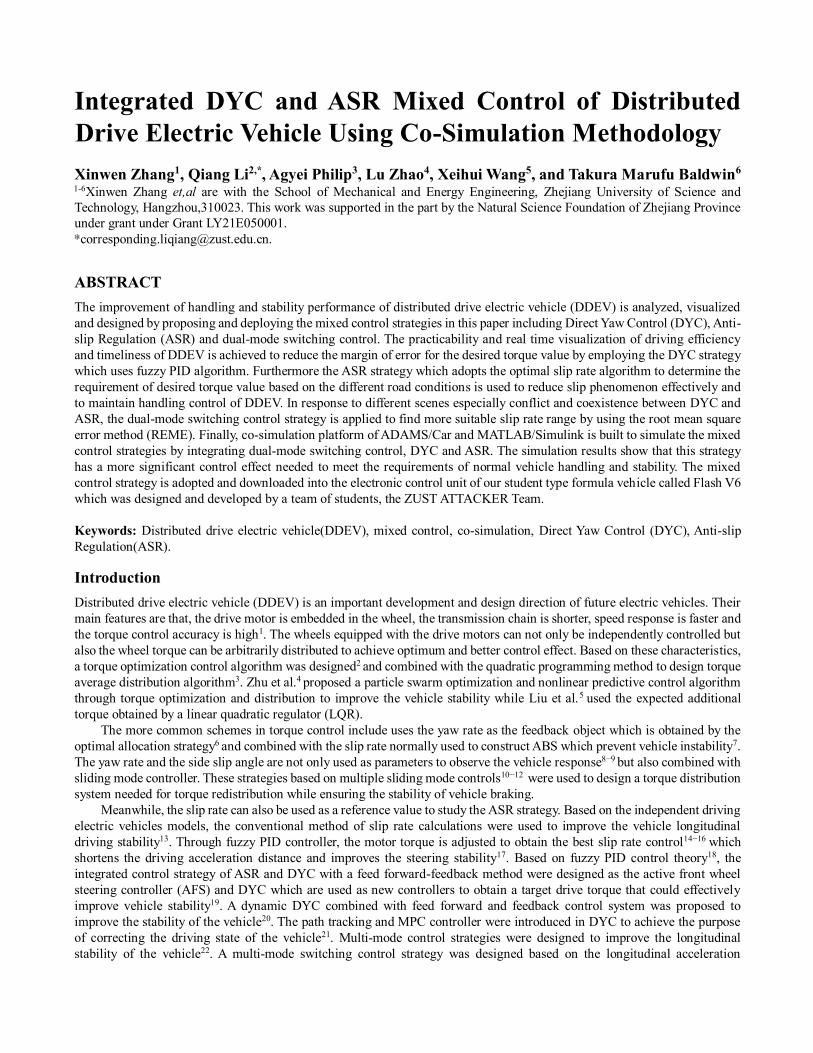
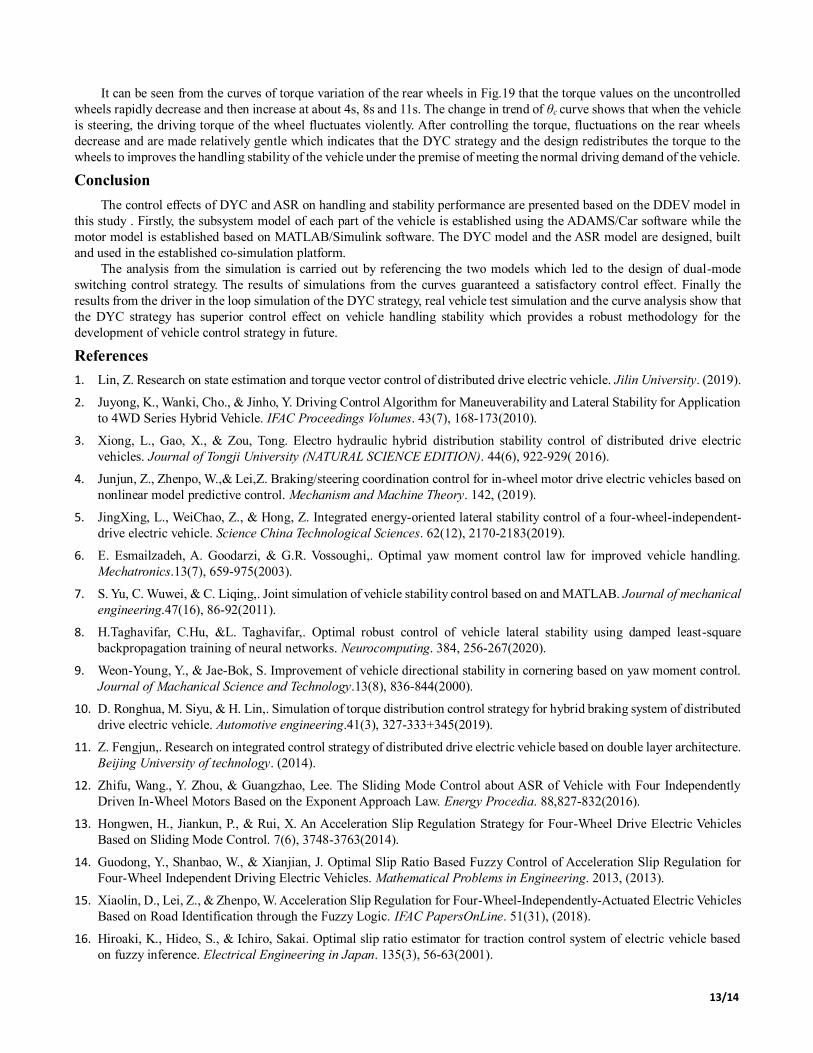
The electric vehicle model with distributed driven wheels was constructed using ADAMS/Car software while the motor model and control strategy with the MATLAB/Simulink software. Setting the relevant parameters at the communication interface between ADAMS/Car and MATLAB/Simulink, the real-time data interaction channel of ADAMS/Car and MATLAB/Simulink was established, and the two parts of the model were jointly simulated. The overall architecture is illustrated as shown in in Fig.1.
Figure 1. Schematic diagram of vehicle and control models architecture.
Establishment of ADAMS/Car model
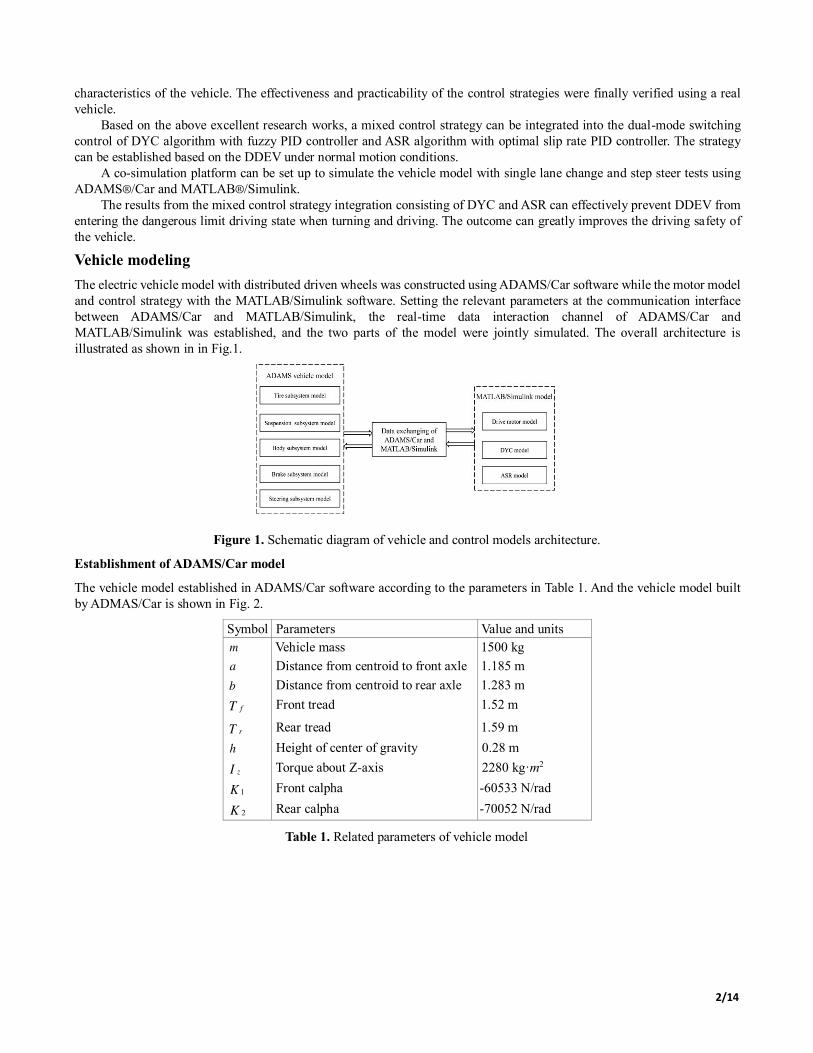
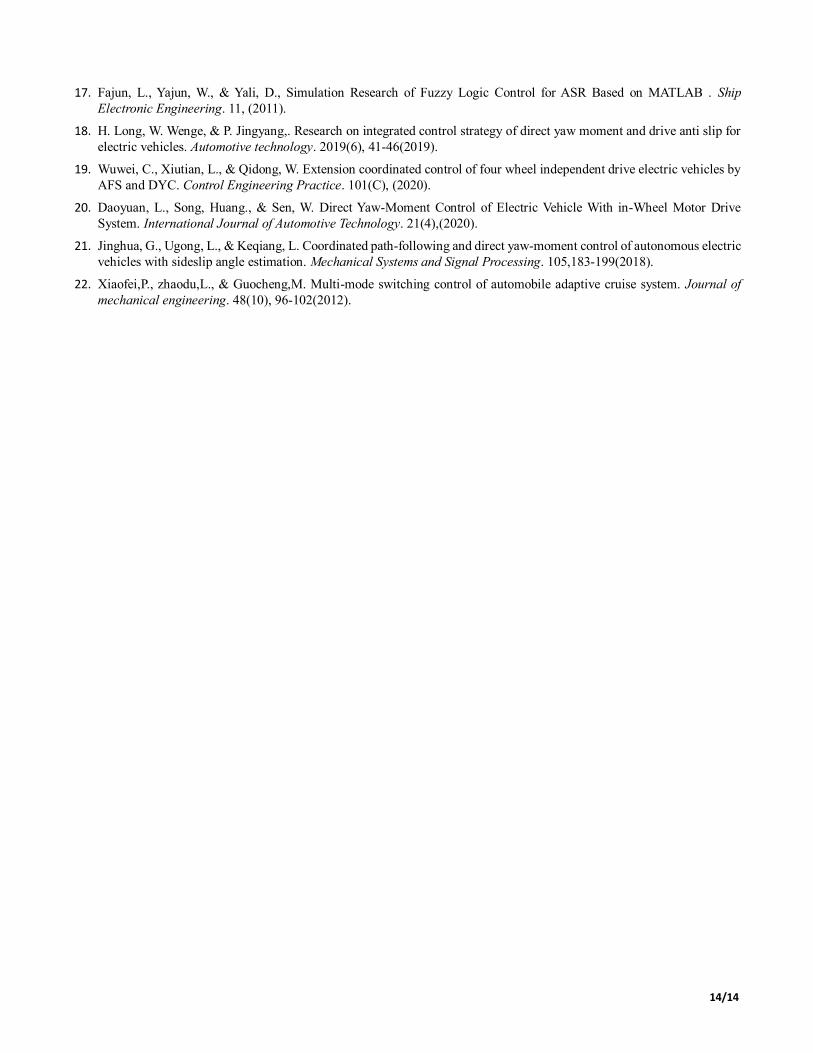
The vehicle model established in ADAMS/Car software according to the parameters in Table 1. And the vehicle model built by ADMAS/Car is shown in Fig. 2.
Symbol Parameters Value and units m Vehicle mass 1500 kg
a Distance from centroid to front axle 1.185 m
b Distance from centroid to rear axle 1.283 m
fT Front tread 1.52 m
rT Rear tread 1.59 m
h Height of center of gravity 0.28 m
zI Torque about Z-axis 2280 kg·m2
1K Front calpha -60533 N/rad
2K Rear calpha -70052 N/rad
Table 1. Related parameters of vehicle model
3/14
Figure 2. ADAMS/Car vehicle model. 1-Front and rear tire system 2-Rear suspension system 3-Body subsystem 4-Steering subsystem 5-Brake subsystem 6-Front suspension system
Establishment of two degree of freedom (2-DOF) model
In order to design the control model, the 2-DOF linear vehicle model9 is used as the reference model:
d d2f yd d d
d d2 zfd d d
+ - + - = +
+ - + - =
a bm uvK K
v v
a bbaK K I
v v
(1)
According to the transformation formula: 2 2
1 2 1 2 1fd d
z z z
1 2 1 2 1fd dd 2
+ -= + -
- += -1 + -
a b aa bK K K K K
vI I I
a bK K K K K
m mv mvv
(2)
Where v is the longitudinal speed; yv is the velocity of the center of mass; f is the front wheel angle.
According to formula (2), f with v are used as input variables; the desired yaw rate d and side slip angle
d are obtained by establishing 2-DOF linear vehicle model in Simulink.
Modeling of simulink motor
Emrax 188 motor is used in the DDEV, because of the reliability of permanent magnet synchronous motors. Their mechanical characteristics include simple structure, small volume, less cumbersome, rapid response, high power density and efficiency. According to the relevant parameters in Table 2, a simplified motor model is established as the torque demand command actuator in the vehicle control strategy. By adjusting the current in the motor model, the motor can output smooth torque to the driving wheel.
Symbol Parameters Value and units 𝑷𝒕 Peak power 65 kw 𝑷𝒄 Continuous power 35 kw 𝑻𝒕 Peak torque 90 N·m 𝑻𝒄 Continuous torque 50 N·m 𝒏𝒆 Rated speed 7000 rpm 𝒏𝒕 Max. speed 8500 rpm
Table 2. Related parameters of EMRAX 188 motor
In order to make the motor torque command response as close to the real motor characteristics as possible, the motor driver is regarded as the first-order inertial link when building the simplified model of the motor as shown in the formula:
4/14
w m
1=
1+T Tτs
(3)
Where wT is the actual torque of the motor, τ is the time constant obtained from the motor characteristic parameters, mT is the
external characteristic torque of the motor.
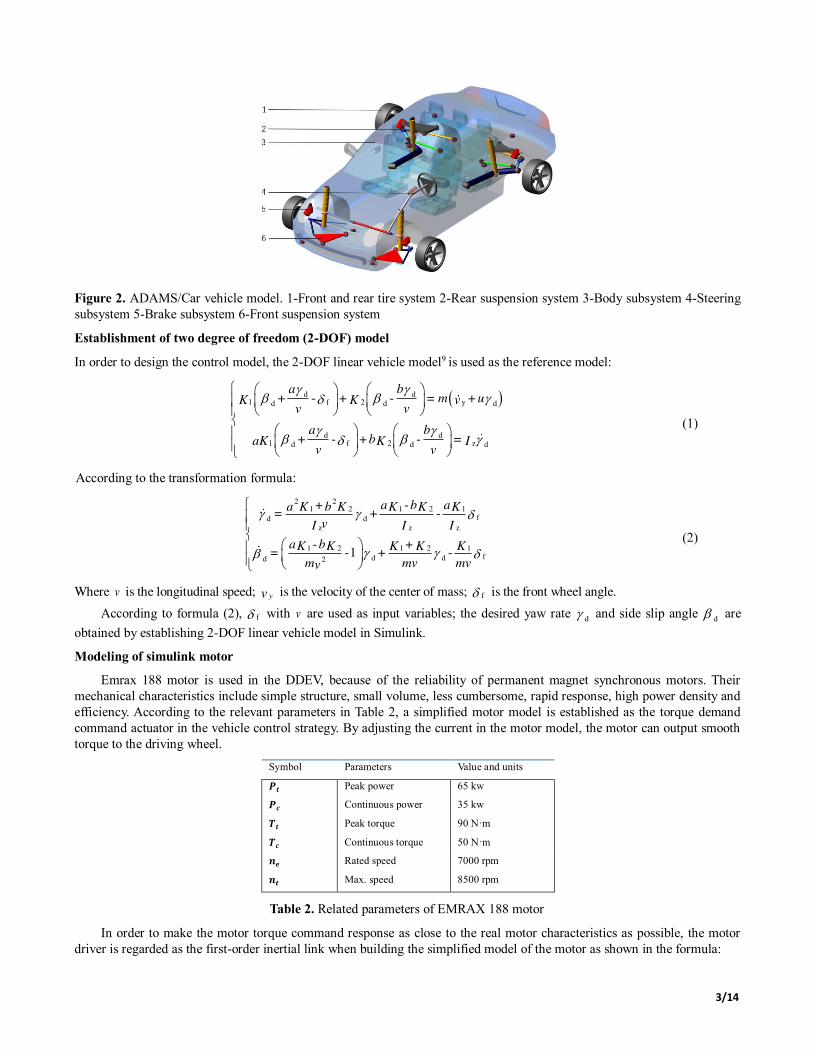
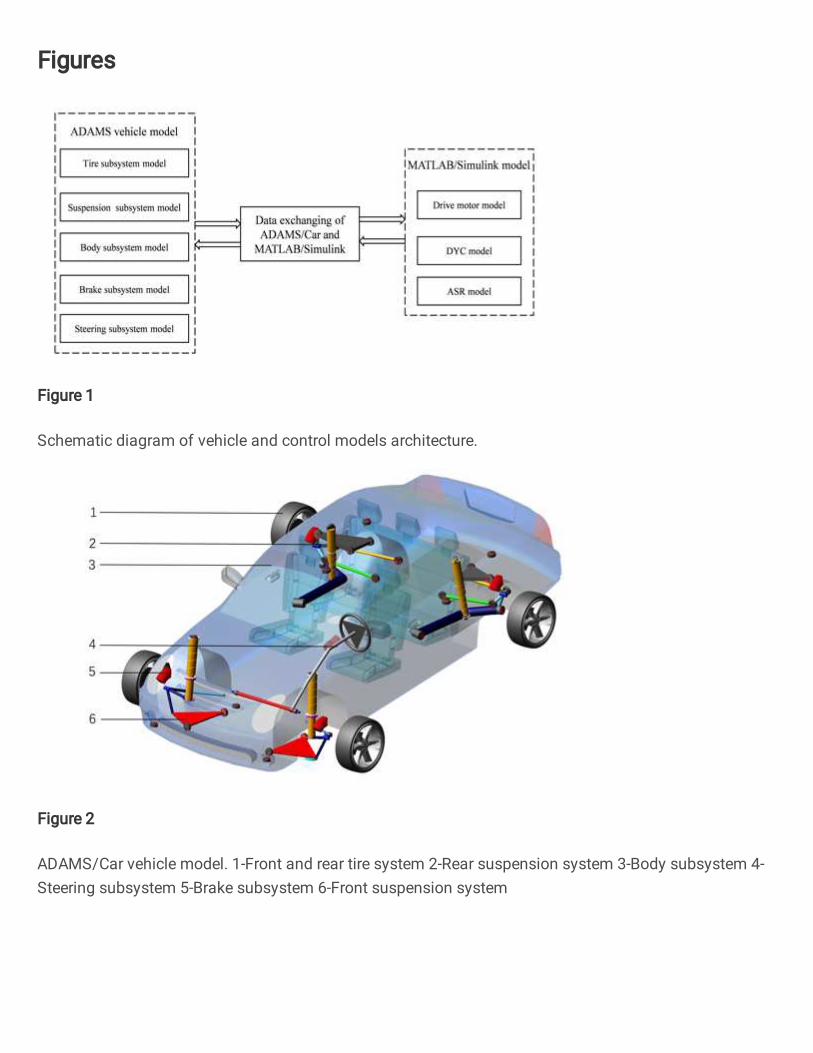
In order to describe the characteristics of the motor, the transfer function equation of the motor is established and combined
with the motor parameters. The model diagram is shown in Fig. 3.
Figure 3. Motor model diagram.
Where dlT is target torque of left wheel, drT represents right wheel target torque, Te is the torque difference, xU is the motor terminal voltage value, Ue is the voltage difference, I is the armature current, eK is the electromagnetic torque constant, wK
is the induced electromotive force constant, wU is the induced electromotive force value, mlT is the left wheel motor output torque, mrT is the right wheel motor output torque, rrw actual angular velocity of right wheel, rlw actual angular velocity of left wheel, rlT is the actual torque of left wheel, rrT is the actual torque of right wheel.
Vehicle model
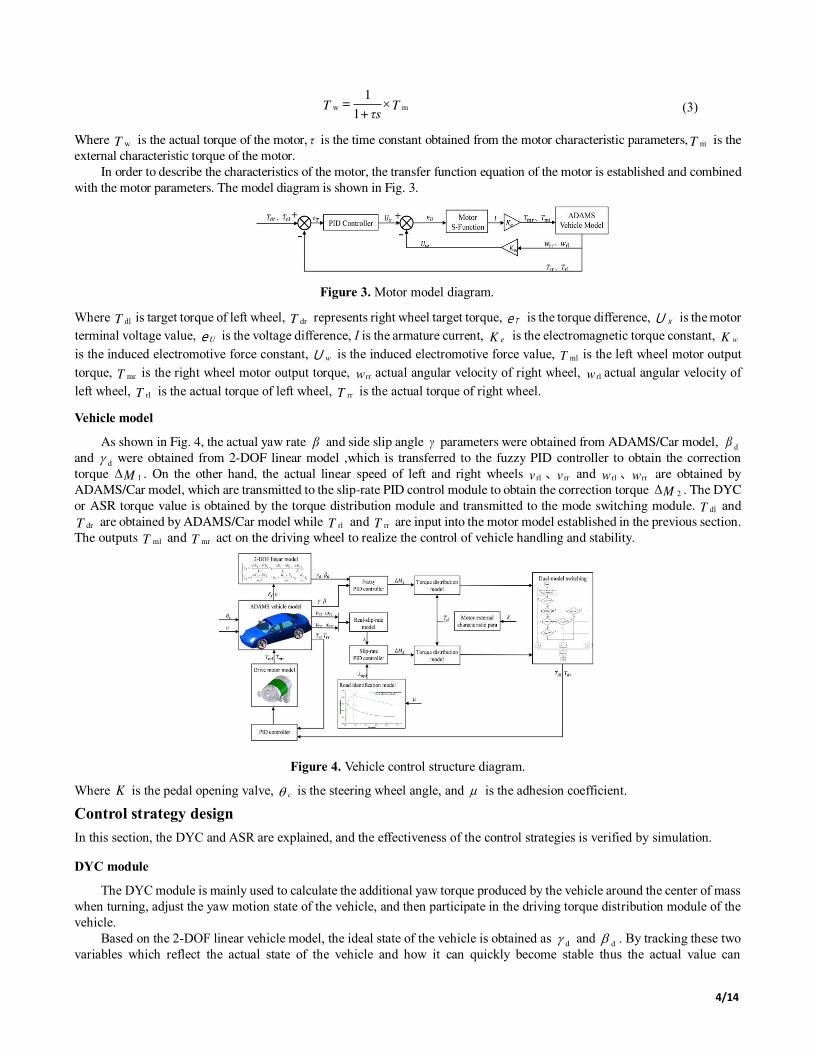
As shown in Fig. 4, the actual yaw rate β and side slip angle γ parameters were obtained from ADAMS/Car model, dβ
and d were obtained from 2-DOF linear model ,which is transferred to the fuzzy PID controller to obtain the correction
torque 1M . On the other hand, the actual linear speed of left and right wheels rlv 、 rrv and rlw 、 rrw are obtained by
ADAMS/Car model, which are transmitted to the slip-rate PID control module to obtain the correction torque 2M . The DYC
or ASR torque value is obtained by the torque distribution module and transmitted to the mode switching module. dlT and drT are obtained by ADAMS/Car model while rlT and rrT are input into the motor model established in the previous section.
The outputs mlT and mrT act on the driving wheel to realize the control of vehicle handling and stability.
Figure 4. Vehicle control structure diagram.
Where K is the pedal opening valve, c is the steering wheel angle, and is the adhesion coefficient.
Control strategy design
In this section, the DYC and ASR are explained, and the effectiveness of the control strategies is verified by simulation.
DYC module
The DYC module is mainly used to calculate the additional yaw torque produced by the vehicle around the center of mass when turning, adjust the yaw motion state of the vehicle, and then participate in the driving torque distribution module of the vehicle.
Based on the 2-DOF linear vehicle model, the ideal state of the vehicle is obtained as d and
d . By tracking these two variables which reflect the actual state of the vehicle and how it can quickly become stable thus the actual value can
5/14
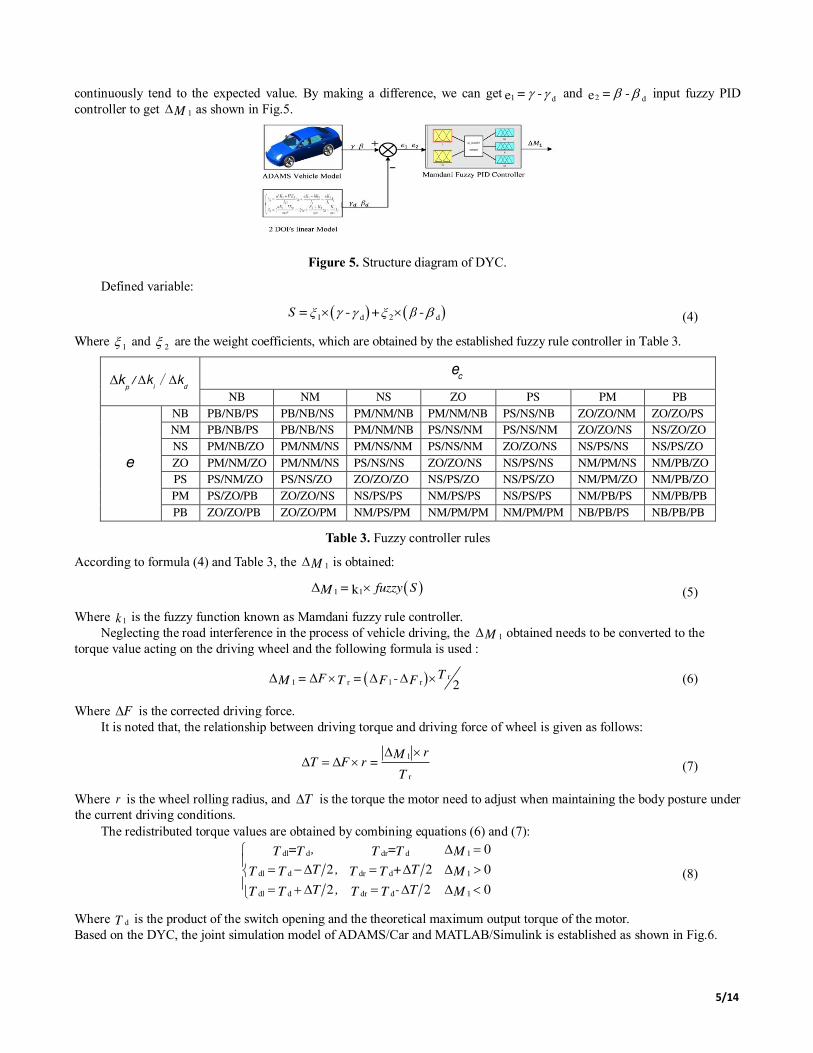
continuously tend to the expected value. By making a difference, we can get 1 d= -e and 2 d
= -e input fuzzy PID controller to get 1M as shown in Fig.5.
Figure 5. Structure diagram of DYC.
Defined variable:
1 2d d= - + -S βξ ξ (4)
Where 1 and
2 are the weight coefficients, which are obtained by the established fuzzy rule controller in Table 3.
Δp
k /Δi
k /Δd
k ce
NB NM NS ZO PS PM PB
e
NB PB/NB/PS PB/NB/NS PM/NM/NB PM/NM/NB PS/NS/NB ZO/ZO/NM ZO/ZO/PS
NM PB/NB/PS PB/NB/NS PM/NM/NB PS/NS/NM PS/NS/NM ZO/ZO/NS NS/ZO/ZO
NS PM/NB/ZO PM/NM/NS PM/NS/NM PS/NS/NM ZO/ZO/NS NS/PS/NS NS/PS/ZO
ZO PM/NM/ZO PM/NM/NS PS/NS/NS ZO/ZO/NS NS/PS/NS NM/PM/NS NM/PB/ZO
PS PS/NM/ZO PS/NS/ZO ZO/ZO/ZO NS/PS/ZO NS/PS/ZO NM/PM/ZO NM/PB/ZO
PM PS/ZO/PB ZO/ZO/NS NS/PS/PS NM/PS/PS NS/PS/PS NM/PB/PS NM/PB/PB
PB ZO/ZO/PB ZO/ZO/PM NM/PS/PM NM/PM/PM NM/PM/PM NB/PB/PS NB/PB/PB
Table 3. Fuzzy controller rules
According to formula (4) and Table 3, the 1M is obtained:
1 1Δ = k fuzzy SM (5)
Where 1k is the fuzzy function known as Mamdani fuzzy rule controller. Neglecting the road interference in the process of vehicle driving, the 1M obtained needs to be converted to the
torque value acting on the driving wheel and the following formula is used :
r1 r l rΔ = Δ = -
2TFM T F F (6)
Where F is the corrected driving force. It is noted that, the relationship between driving torque and driving force of wheel is given as follows:
1
r
=rM
T F rT
(7)
Where r is the wheel rolling radius, and T is the torque the motor need to adjust when maintaining the body posture under the current driving conditions.
The redistributed torque values are obtained by combining equations (6) and (7): dl d dr d 1
dl d dr d 1
dl d dr d 1
0
2 2 0
2 2 0
= , =T T T T M
T , + TT T T T M
T , - TT T T T M
(8)
Where dT is the product of the switch opening and the theoretical maximum output torque of the motor. Based on the DYC, the joint simulation model of ADAMS/Car and MATLAB/Simulink is established as shown in Fig.6.
6/14
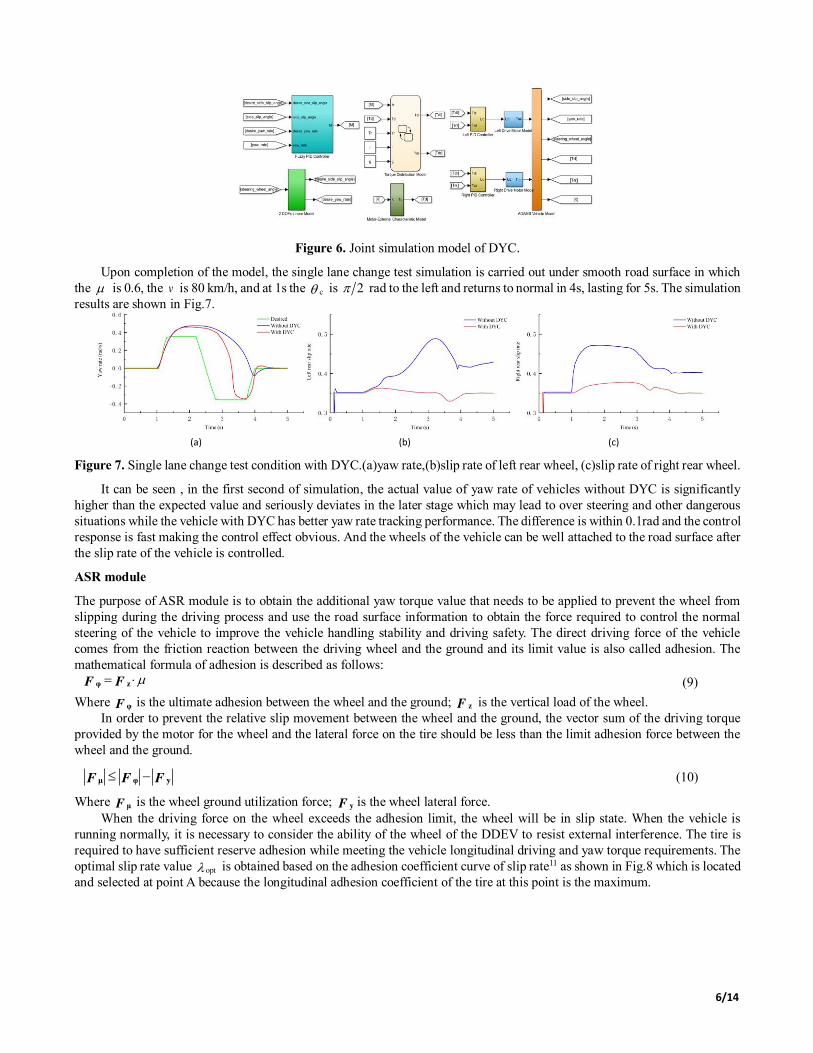
Figure 6. Joint simulation model of DYC.
Upon completion of the model, the single lane change test simulation is carried out under smooth road surface in which the is 0.6, the v is 80 km/h, and at 1s the c is 2 rad to the left and returns to normal in 4s, lasting for 5s. The simulation results are shown in Fig.7.
(a) (b) (c)
Figure 7. Single lane change test condition with DYC.(a)yaw rate,(b)slip rate of left rear wheel, (c)slip rate of right rear wheel.
It can be seen , in the first second of simulation, the actual value of yaw rate of vehicles without DYC is significantly higher than the expected value and seriously deviates in the later stage which may lead to over steering and other dangerous situations while the vehicle with DYC has better yaw rate tracking performance. The difference is within 0.1rad and the control response is fast making the control effect obvious. And the wheels of the vehicle can be well attached to the road surface after the slip rate of the vehicle is controlled.
ASR module
The purpose of ASR module is to obtain the additional yaw torque value that needs to be applied to prevent the wheel from slipping during the driving process and use the road surface information to obtain the force required to control the normal steering of the vehicle to improve the vehicle handling stability and driving safety. The direct driving force of the vehicle comes from the friction reaction between the driving wheel and the ground and its limit value is also called adhesion. The mathematical formula of adhesion is described as follows:
φ zF F (9)
Where φF is the ultimate adhesion between the wheel and the ground; zF is the vertical load of the wheel. In order to prevent the relative slip movement between the wheel and the ground, the vector sum of the driving torque
provided by the motor for the wheel and the lateral force on the tire should be less than the limit adhesion force between the wheel and the ground.
μ φ yF F F
(10)
Where μF is the wheel ground utilization force; yF is the wheel lateral force. When the driving force on the wheel exceeds the adhesion limit, the wheel will be in slip state. When the vehicle is
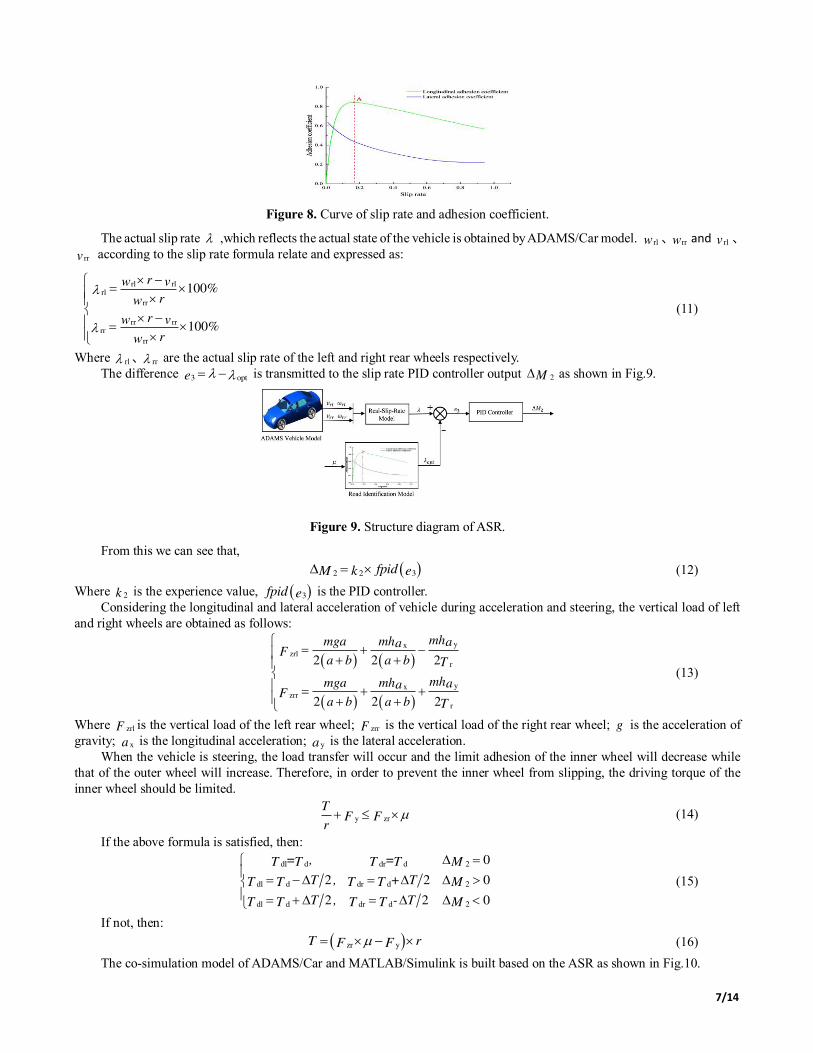
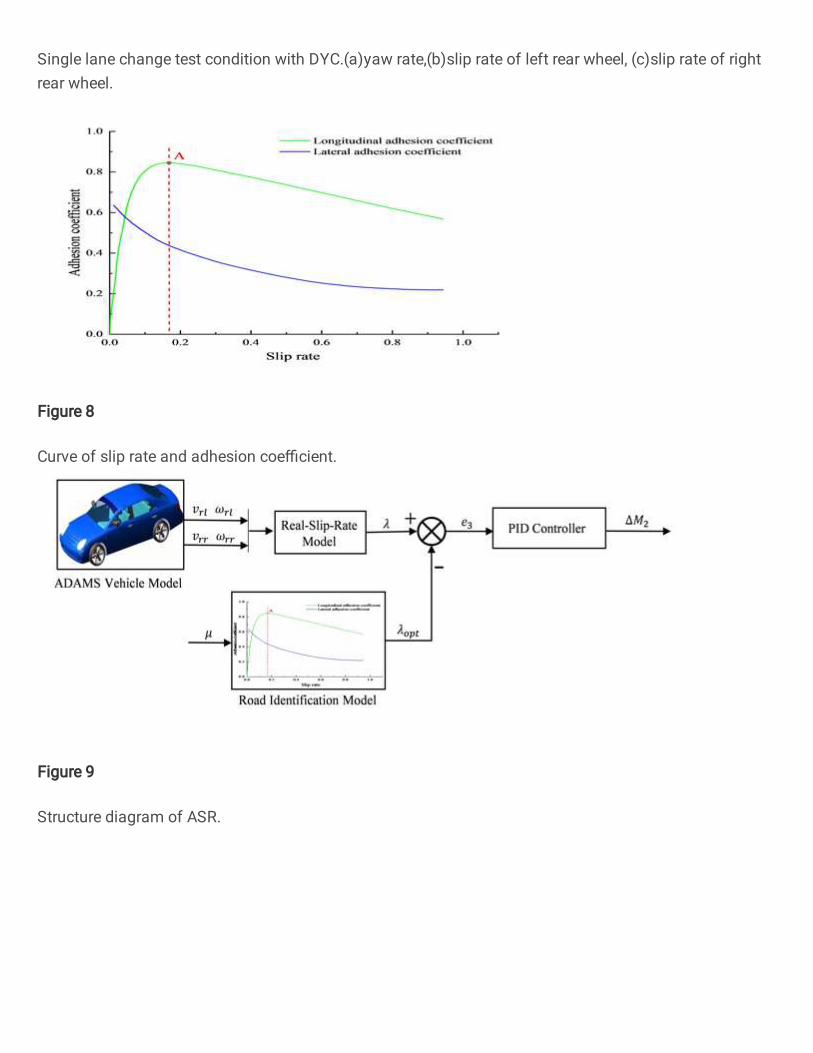
running normally, it is necessary to consider the ability of the wheel of the DDEV to resist external interference. The tire is required to have sufficient reserve adhesion while meeting the vehicle longitudinal driving and yaw torque requirements. The optimal slip rate value opt is obtained based on the adhesion coefficient curve of slip rate11 as shown in Fig.8 which is located and selected at point A because the longitudinal adhesion coefficient of the tire at this point is the maximum.
7/14
Figure 8. Curve of slip rate and adhesion coefficient.
The actual slip rate ,which reflects the actual state of the vehicle is obtained by ADAMS/Car model. rlw 、 rrw and rlv 、rrv according to the slip rate formula relate and expressed as:
rl rlrl
rr
rr rrrr
rr
100
100
rw v%
rw
rw v%
rw
(11)
Where rl 、 rr are the actual slip rate of the left and right rear wheels respectively. The difference 3 opte is transmitted to the slip rate PID controller output 2M as shown in Fig.9.
Figure 9. Structure diagram of ASR.
From this we can see that, 2 2 3fpidk eM (12)
Where 2k is the experience value, 3fpid e is the PID controller. Considering the longitudinal and lateral acceleration of vehicle during acceleration and steering, the vertical load of left
and right wheels are obtained as follows:
yxzrl
r
yxzrr
r
2 2 2
2 2 2
mhmga mh aaF
a b a b T
mhmga mh aaF
a b a b T
(13)
Where zrlF is the vertical load of the left rear wheel; zrrF is the vertical load of the right rear wheel; g is the acceleration of gravity; xa is the longitudinal acceleration; ya is the lateral acceleration.
When the vehicle is steering, the load transfer will occur and the limit adhesion of the inner wheel will decrease while that of the outer wheel will increase. Therefore, in order to prevent the inner wheel from slipping, the driving torque of the inner wheel should be limited.
y zr
TF F
r (14)
If the above formula is satisfied, then: dl d dr d 2
dl d dr d 2
dl d dr d 2
0
2 2 0
2 2 0
= , =T T T T M
T , + TT T T T M
T , - TT T T T M
(15)
If not, then: zr yT rF F (16)
The co-simulation model of ADAMS/Car and MATLAB/Simulink is built based on the ASR as shown in Fig.10.
8/14
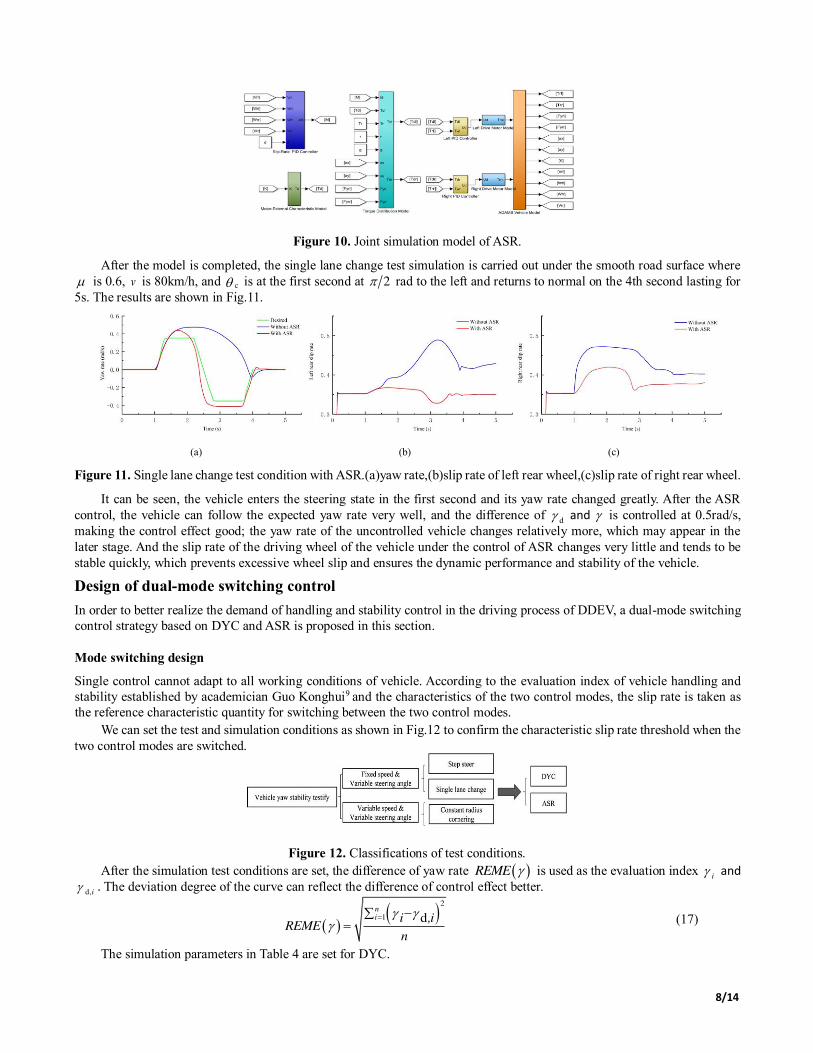
Figure 10. Joint simulation model of ASR.
After the model is completed, the single lane change test simulation is carried out under the smooth road surface where is 0.6, v is 80km/h, and c is at the first second at 2 rad to the left and returns to normal on the 4th second lasting for 5s. The results are shown in Fig.11.
(a) (b) (c)
Figure 11. Single lane change test condition with ASR.(a)yaw rate,(b)slip rate of left rear wheel,(c)slip rate of right rear wheel.
It can be seen, the vehicle enters the steering state in the first second and its yaw rate changed greatly. After the ASR control, the vehicle can follow the expected yaw rate very well, and the difference of
d and is controlled at 0.5rad/s, making the control effect good; the yaw rate of the uncontrolled vehicle changes relatively more, which may appear in the later stage. And the slip rate of the driving wheel of the vehicle under the control of ASR changes very little and tends to be stable quickly, which prevents excessive wheel slip and ensures the dynamic performance and stability of the vehicle.
Design of dual-mode switching control In order to better realize the demand of handling and stability control in the driving process of DDEV, a dual-mode switching control strategy based on DYC and ASR is proposed in this section.
Mode switching design
Single control cannot adapt to all working conditions of vehicle. According to the evaluation index of vehicle handling and stability established by academician Guo Konghui9 and the characteristics of the two control modes, the slip rate is taken as the reference characteristic quantity for switching between the two control modes.
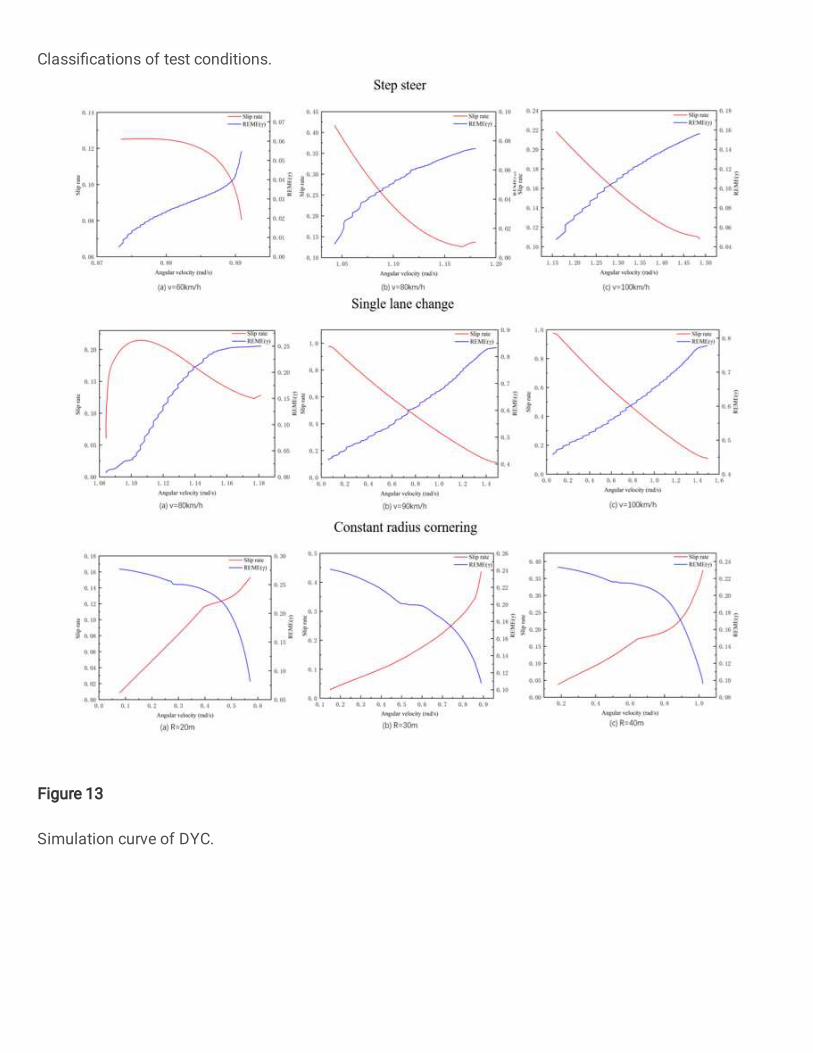
We can set the test and simulation conditions as shown in Fig.12 to confirm the characteristic slip rate threshold when the two control modes are switched.
Figure 12. Classifications of test conditions. After the simulation test conditions are set, the difference of yaw rate REME is used as the evaluation index
i andd,i . The deviation degree of the curve can reflect the difference of control effect better.
2
1 dni i ,i
REMEn
(17)
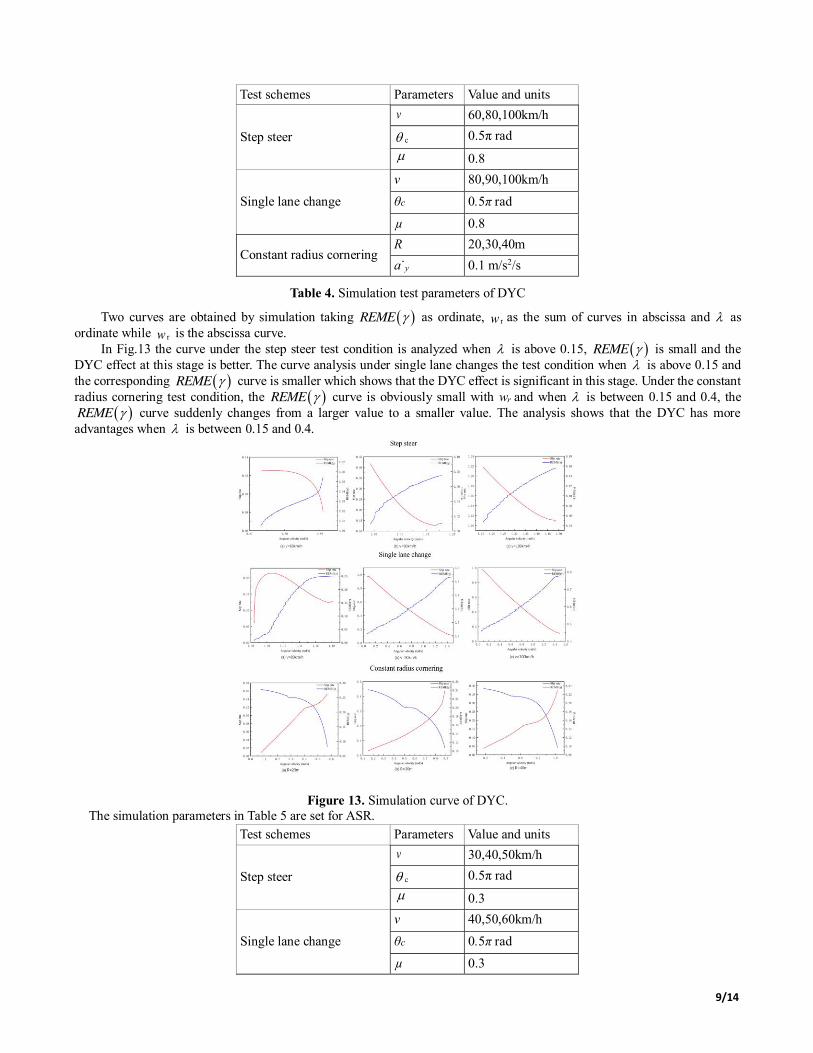
The simulation parameters in Table 4 are set for DYC.
9/14
Test schemes Parameters Value and units
Step steer
v 60,80,100km/h
c 0.5π rad
0.8
Single lane change
v 80,90,100km/h
θc 0.5π rad
µ 0.8
Constant radius cornering R 20,30,40m
a˙y 0.1 m/s2/s
Table 4. Simulation test parameters of DYC
Two curves are obtained by simulation taking REME as ordinate, rw as the sum of curves in abscissa and as ordinate while rw is the abscissa curve.
In Fig.13 the curve under the step steer test condition is analyzed when is above 0.15, REME is small and the DYC effect at this stage is better. The curve analysis under single lane changes the test condition when is above 0.15 and the corresponding REME curve is smaller which shows that the DYC effect is significant in this stage. Under the constant radius cornering test condition, the REME curve is obviously small with wr and when is between 0.15 and 0.4, the
REME curve suddenly changes from a larger value to a smaller value. The analysis shows that the DYC has more advantages when is between 0.15 and 0.4.
Figure 13. Simulation curve of DYC. The simulation parameters in Table 5 are set for ASR.
Test schemes Parameters Value and units
Step steer
v 30,40,50km/h
c 0.5π rad
0.3
Single lane change
v 40,50,60km/h
θc 0.5π rad
µ 0.3
10/14
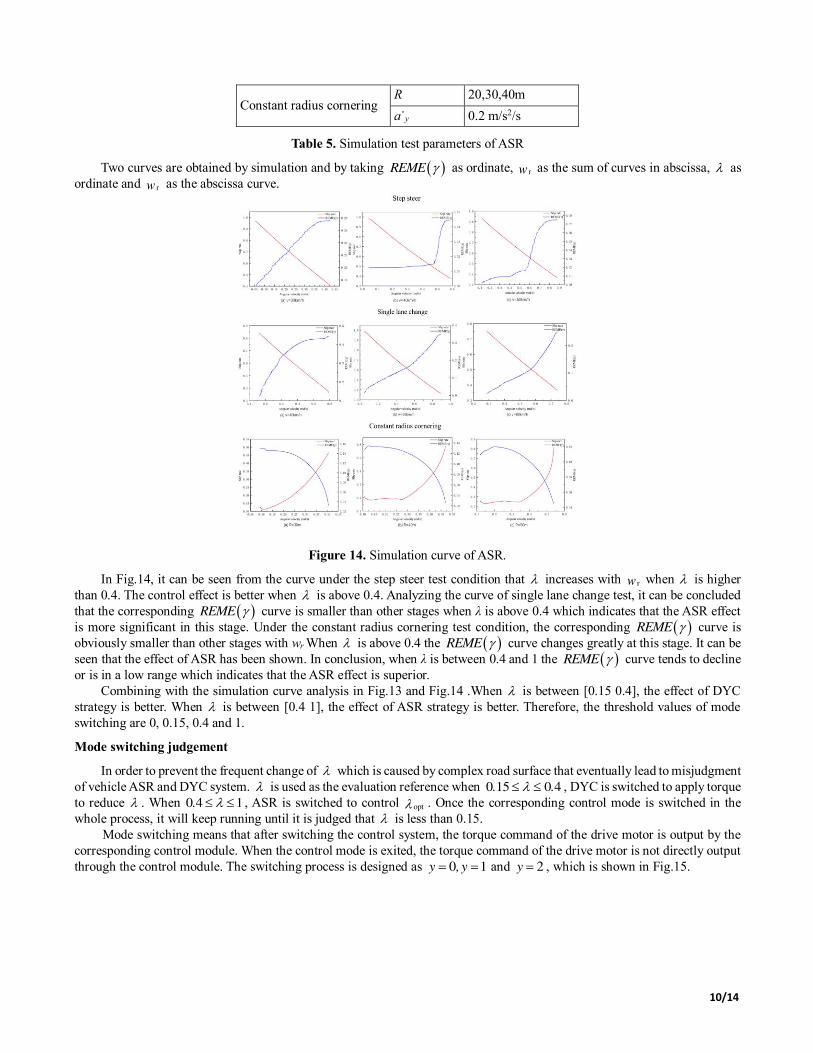
Constant radius cornering R 20,30,40m
a˙y 0.2 m/s2/s
Table 5. Simulation test parameters of ASR
Two curves are obtained by simulation and by taking REME as ordinate, rw as the sum of curves in abscissa, as ordinate and rw as the abscissa curve.
Figure 14. Simulation curve of ASR.
In Fig.14, it can be seen from the curve under the step steer test condition that increases with rw when is higher than 0.4. The control effect is better when is above 0.4. Analyzing the curve of single lane change test, it can be concluded that the corresponding REME curve is smaller than other stages when λ is above 0.4 which indicates that the ASR effect is more significant in this stage. Under the constant radius cornering test condition, the corresponding REME curve is obviously smaller than other stages with wr When is above 0.4 the REME curve changes greatly at this stage. It can be seen that the effect of ASR has been shown. In conclusion, when λ is between 0.4 and 1 the REME curve tends to decline or is in a low range which indicates that the ASR effect is superior.
Combining with the simulation curve analysis in Fig.13 and Fig.14 .When is between [0.15 0.4], the effect of DYC strategy is better. When is between [0.4 1], the effect of ASR strategy is better. Therefore, the threshold values of mode switching are 0, 0.15, 0.4 and 1.
Mode switching judgement
In order to prevent the frequent change of which is caused by complex road surface that eventually lead to misjudgment of vehicle ASR and DYC system. is used as the evaluation reference when 0 15 0 4. . , DYC is switched to apply torque to reduce . When 0 4 1. , ASR is switched to control opt . Once the corresponding control mode is switched in the whole process, it will keep running until it is judged that is less than 0.15.
Mode switching means that after switching the control system, the torque command of the drive motor is output by the corresponding control module. When the control mode is exited, the torque command of the drive motor is not directly output through the control module. The switching process is designed as 0 1y ,y and 2y , which is shown in Fig.15.
11/14
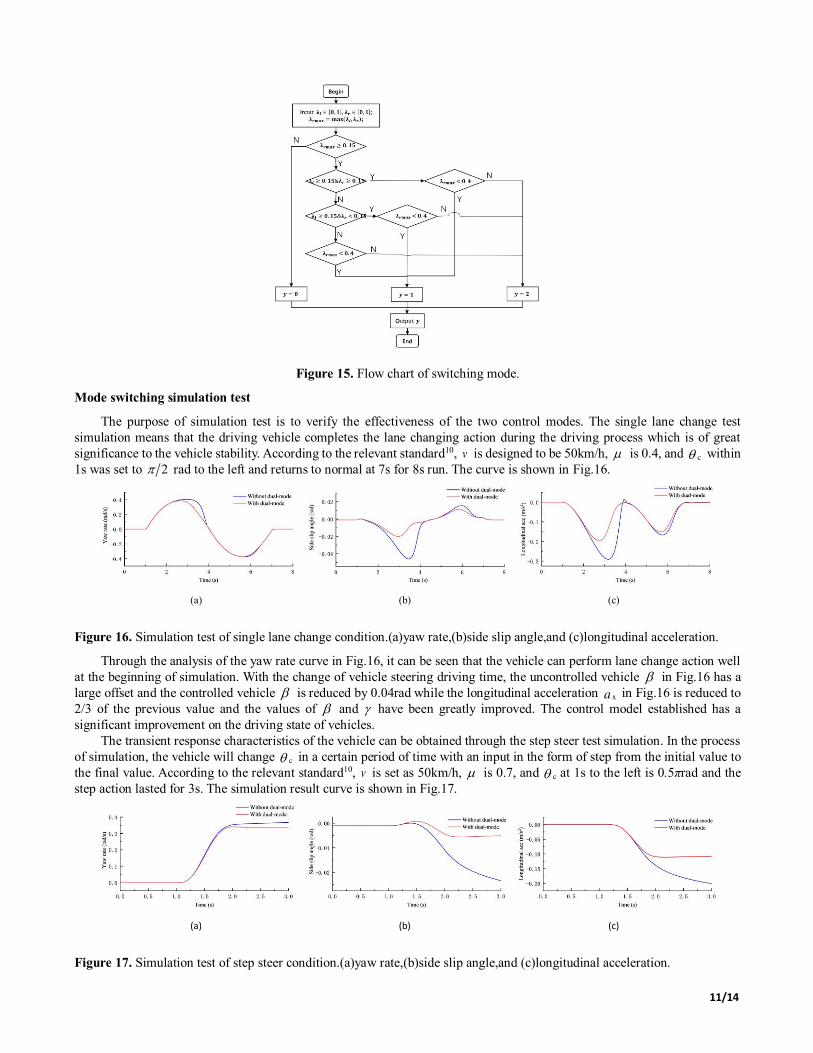
Figure 15. Flow chart of switching mode.
Mode switching simulation test
The purpose of simulation test is to verify the effectiveness of the two control modes. The single lane change test simulation means that the driving vehicle completes the lane changing action during the driving process which is of great significance to the vehicle stability. According to the relevant standard10, v is designed to be 50km/h, is 0.4, and c within 1s was set to 2 rad to the left and returns to normal at 7s for 8s run. The curve is shown in Fig.16.
(a) (b) (c)
Figure 16. Simulation test of single lane change condition.(a)yaw rate,(b)side slip angle,and (c)longitudinal acceleration.
Through the analysis of the yaw rate curve in Fig.16, it can be seen that the vehicle can perform lane change action well at the beginning of simulation. With the change of vehicle steering driving time, the uncontrolled vehicle in Fig.16 has a large offset and the controlled vehicle is reduced by 0.04rad while the longitudinal acceleration xa in Fig.16 is reduced to 2/3 of the previous value and the values of and have been greatly improved. The control model established has a significant improvement on the driving state of vehicles.
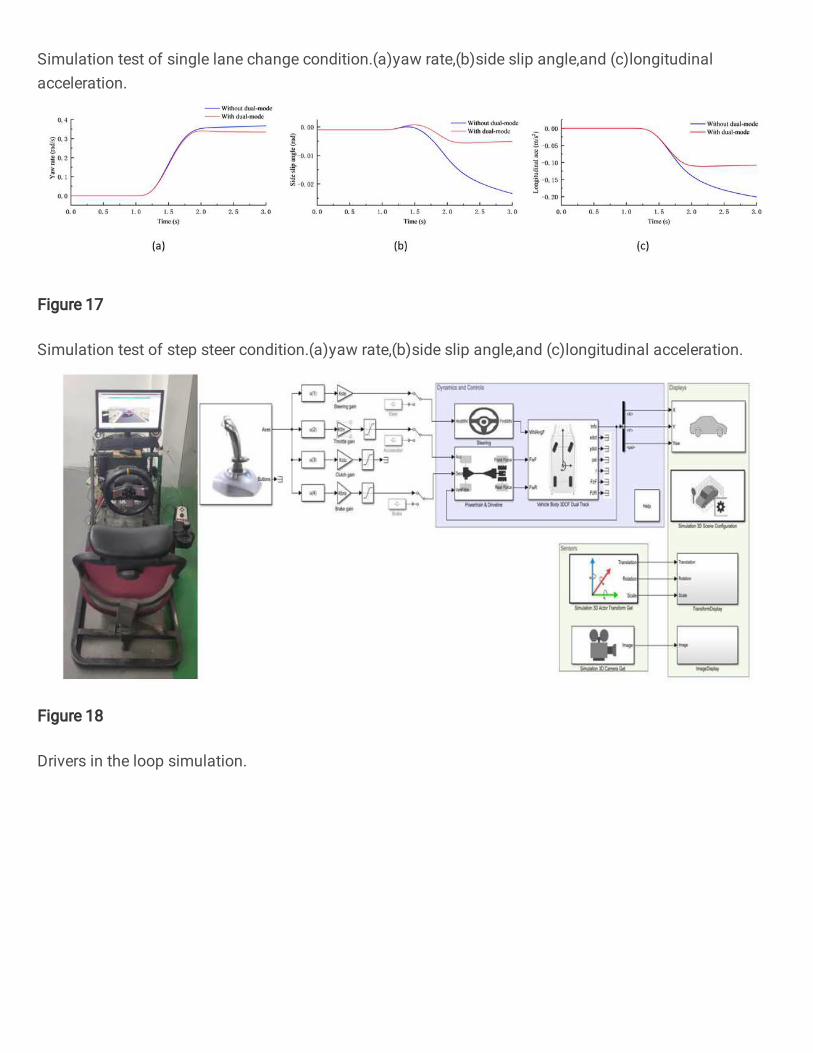
The transient response characteristics of the vehicle can be obtained through the step steer test simulation. In the process of simulation, the vehicle will change c in a certain period of time with an input in the form of step from the initial value to the final value. According to the relevant standard10, v is set as 50km/h, is 0.7, and c at 1s to the left is 0.5πrad and the step action lasted for 3s. The simulation result curve is shown in Fig.17.
(a) (b) (c)
Figure 17. Simulation test of step steer condition.(a)yaw rate,(b)side slip angle,and (c)longitudinal acceleration.
12/14
According to the yaw rate response curve in Fig.17, it can be seen that when the vehicle is in 1s due to c input, the vehicle may be turning or overtaking and its changes greatly. After about 1s adjustment, the controlled quickly reaches stability and the steady state value is 0.35rad/s making the control effect very good. After the steering action of the uncontrolled vehicle is finished in a second, the curve is still in the growth trend and the whole vehicle has the tendency to side slip which is not conducive for stable driving of the vehicle. It can be seen from the curve in Fig.17 that the uncontrolled and controlled changes have taken place near 1.5s and the controlled curve change is controlled within 0.005rad making the stability of the vehicle better. The change of curve without control to -0.025rad is 5s of the maximum value of with control. The xa curve also shows that the controlled vehicle value is 1/2 of the uncontrolled value, indicating that the vehicle has better handling stability after control.
Driver in the loop simulation test In order to further verify the real effect of the DYC strategy, it is necessary to observe the control effect via real vehicle
test. However, due to the difficulty of real vehicle verification, the existing driver simulator Logitech G27 equipment is used to verify the control strategy to continuously optimize the strategy.
In Fig.18, the serial communication port between G27 and MATLAB/Simulink is established first and the joystick output module in MATLAB/Simulink is used to adjust the c of Logitech G27 Pedal (switch) opening K and other signals are collected. For the vehicle model in this paper, we mainly collected the c of G27 and K signals. In particular, due to the c
of Logitech G27, the total travel range is 5π rad in the vehicle’s mathematical model in MATLAB/Simulink. The travel range of c is 6πrad making it is necessary to collect the c of joystick output signal when processed by gain to satisfy the c of vehicle mathematical model.
Figure 18. Drivers in the loop simulation.
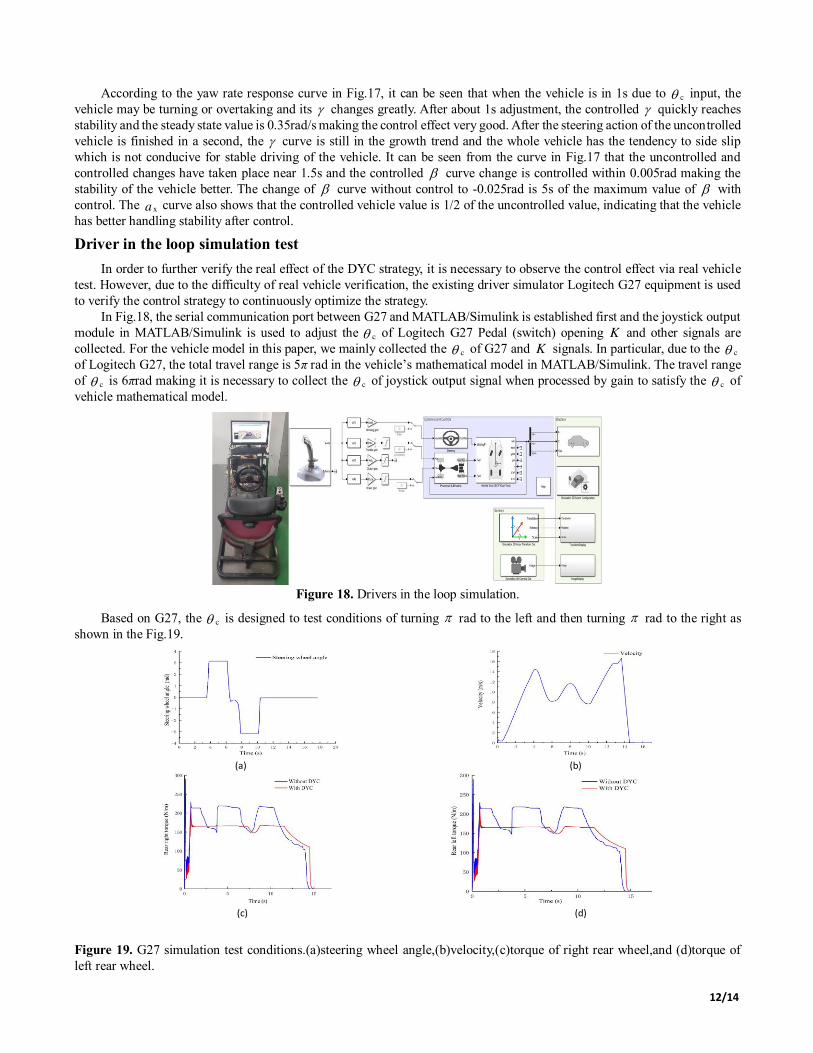
Based on G27, the c is designed to test conditions of turning rad to the left and then turning rad to the right as shown in the Fig.19.
(a) (b)
(c) (d)
Figure 19. G27 simulation test conditions.(a)steering wheel angle,(b)velocity,(c)torque of right rear wheel,and (d)torque of left rear wheel.
13/14
It can be seen from the curves of torque variation of the rear wheels in Fig.19 that the torque values on the uncontrolled wheels rapidly decrease and then increase at about 4s, 8s and 11s. The change in trend of θc curve shows that when the vehicle is steering, the driving torque of the wheel fluctuates violently. After controlling the torque, fluctuations on the rear wheels decrease and are made relatively gentle which indicates that the DYC strategy and the design redistributes the torque to the wheels to improves the handling stability of the vehicle under the premise of meeting the normal driving demand of the vehicle.
Conclusion
The control effects of DYC and ASR on handling and stability performance are presented based on the DDEV model in this study . Firstly, the subsystem model of each part of the vehicle is established using the ADAMS/Car software while the motor model is established based on MATLAB/Simulink software. The DYC model and the ASR model are designed, built and used in the established co-simulation platform.
The analysis from the simulation is carried out by referencing the two models which led to the design of dual-mode switching control strategy. The results of simulations from the curves guaranteed a satisfactory control effect. Finally the results from the driver in the loop simulation of the DYC strategy, real vehicle test simulation and the curve analysis show that the DYC strategy has superior control effect on vehicle handling stability which provides a robust methodology for the development of vehicle control strategy in future.
References
1. Lin, Z. Research on state estimation and torque vector control of distributed drive electric vehicle. Jilin University. (2019). 2. Juyong, K., Wanki, Cho., & Jinho, Y. Driving Control Algorithm for Maneuverability and Lateral Stability for Application
to 4WD Series Hybrid Vehicle. IFAC Proceedings Volumes. 43(7), 168-173(2010). 3. Xiong, L., Gao, X., & Zou, Tong. Electro hydraulic hybrid distribution stability control of distributed drive electric
vehicles. Journal of Tongji University (NATURAL SCIENCE EDITION). 44(6), 922-929( 2016). 4. Junjun, Z., Zhenpo, W.,& Lei,Z. Braking/steering coordination control for in-wheel motor drive electric vehicles based on
nonlinear model predictive control. Mechanism and Machine Theory. 142, (2019). 5. JingXing, L., WeiChao, Z., & Hong, Z. Integrated energy-oriented lateral stability control of a four-wheel-independent-
drive electric vehicle. Science China Technological Sciences. 62(12), 2170-2183(2019). 6. E. Esmailzadeh, A. Goodarzi, & G.R. Vossoughi,. Optimal yaw moment control law for improved vehicle handling.
Mechatronics.13(7), 659-975(2003). 7. S. Yu, C. Wuwei, & C. Liqing,. Joint simulation of vehicle stability control based on and MATLAB. Journal of mechanical
engineering.47(16), 86-92(2011). 8. H.Taghavifar, C.Hu, &L. Taghavifar,. Optimal robust control of vehicle lateral stability using damped least-square
backpropagation training of neural networks. Neurocomputing. 384, 256-267(2020). 9. Weon-Young, Y., & Jae-Bok, S. Improvement of vehicle directional stability in cornering based on yaw moment control.
Journal of Machanical Science and Technology.13(8), 836-844(2000). 10. D. Ronghua, M. Siyu, & H. Lin,. Simulation of torque distribution control strategy for hybrid braking system of distributed
drive electric vehicle. Automotive engineering.41(3), 327-333+345(2019). 11. Z. Fengjun,. Research on integrated control strategy of distributed drive electric vehicle based on double layer architecture.
Beijing University of technology. (2014). 12. Zhifu, Wang., Y. Zhou, & Guangzhao, Lee. The Sliding Mode Control about ASR of Vehicle with Four Independently
Driven In-Wheel Motors Based on the Exponent Approach Law. Energy Procedia. 88,827-832(2016). 13. Hongwen, H., Jiankun, P., & Rui, X. An Acceleration Slip Regulation Strategy for Four-Wheel Drive Electric Vehicles
Based on Sliding Mode Control. 7(6), 3748-3763(2014). 14. Guodong, Y., Shanbao, W., & Xianjian, J. Optimal Slip Ratio Based Fuzzy Control of Acceleration Slip Regulation for
Four-Wheel Independent Driving Electric Vehicles. Mathematical Problems in Engineering. 2013, (2013). 15. Xiaolin, D., Lei, Z., & Zhenpo, W. Acceleration Slip Regulation for Four-Wheel-Independently-Actuated Electric Vehicles
Based on Road Identification through the Fuzzy Logic. IFAC PapersOnLine. 51(31), (2018). 16. Hiroaki, K., Hideo, S., & Ichiro, Sakai. Optimal slip ratio estimator for traction control system of electric vehicle based
on fuzzy inference. Electrical Engineering in Japan. 135(3), 56-63(2001).
14/14
17. Fajun, L., Yajun, W., & Yali, D., Simulation Research of Fuzzy Logic Control for ASR Based on MATLAB . Ship Electronic Engineering. 11, (2011).
18. H. Long, W. Wenge, & P. Jingyang,. Research on integrated control strategy of direct yaw moment and drive anti slip for electric vehicles. Automotive technology. 2019(6), 41-46(2019).
19. Wuwei, C., Xiutian, L., & Qidong, W. Extension coordinated control of four wheel independent drive electric vehicles by AFS and DYC. Control Engineering Practice. 101(C), (2020).
20. Daoyuan, L., Song, Huang., & Sen, W. Direct Yaw-Moment Control of Electric Vehicle With in-Wheel Motor Drive System. International Journal of Automotive Technology. 21(4),(2020).
21. Jinghua, G., Ugong, L., & Keqiang, L. Coordinated path-following and direct yaw-moment control of autonomous electric vehicles with sideslip angle estimation. Mechanical Systems and Signal Processing. 105,183-199(2018).
22. Xiaofei,P., zhaodu,L., & Guocheng,M. Multi-mode switching control of automobile adaptive cruise system. Journal of mechanical engineering. 48(10), 96-102(2012).
Figures
Figure 1
Schematic diagram of vehicle and control models architecture.
Figure 2
ADAMS/Car vehicle model. 1-Front and rear tire system 2-Rear suspension system 3-Body subsystem 4-Steering subsystem 5-Brake subsystem 6-Front suspension system
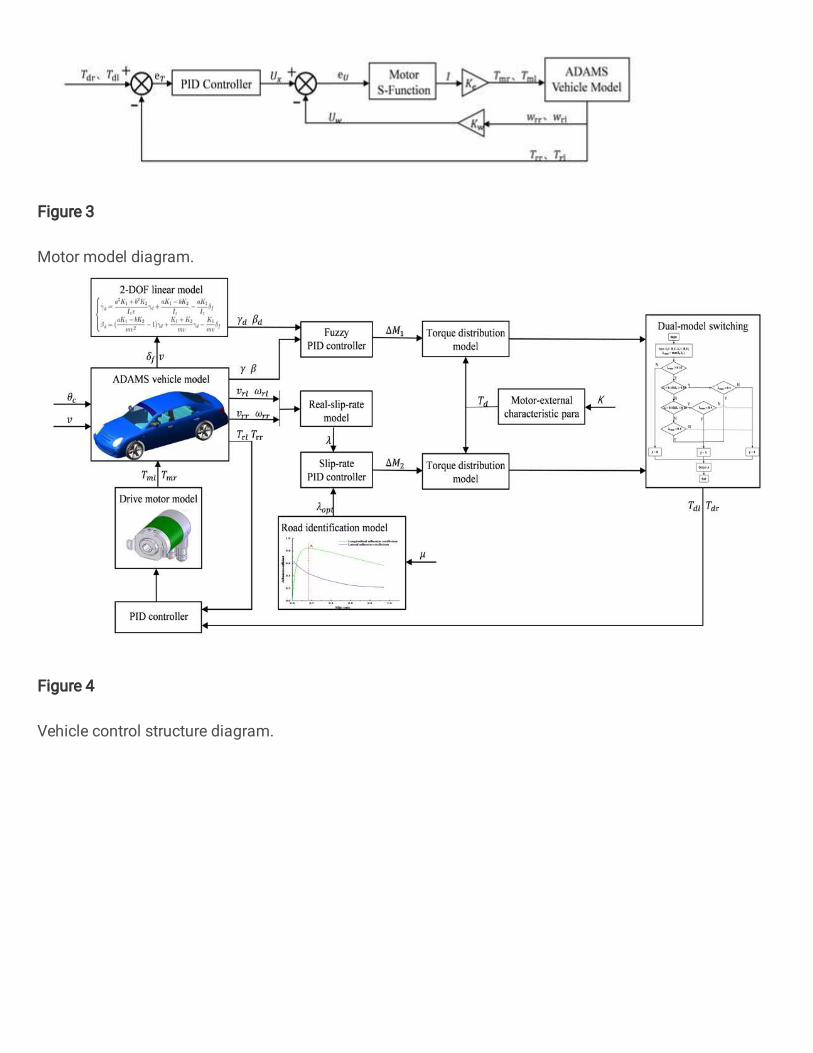
Figure 3
Motor model diagram.
Figure 4
Vehicle control structure diagram.
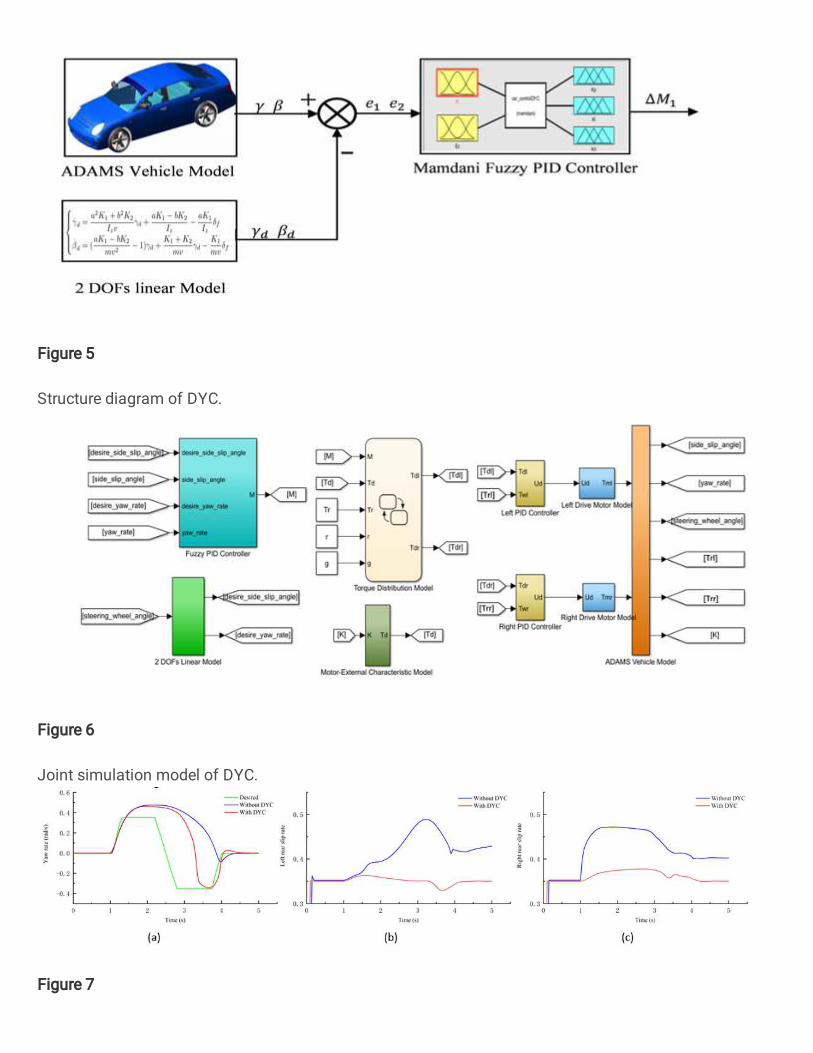
Figure 5
Structure diagram of DYC.
Figure 6
Joint simulation model of DYC.
Figure 7
Single lane change test condition with DYC.(a)yaw rate,(b)slip rate of left rear wheel, (c)slip rate of rightrear wheel.
Figure 8
Curve of slip rate and adhesion coe�cient.
Figure 9
Structure diagram of ASR.
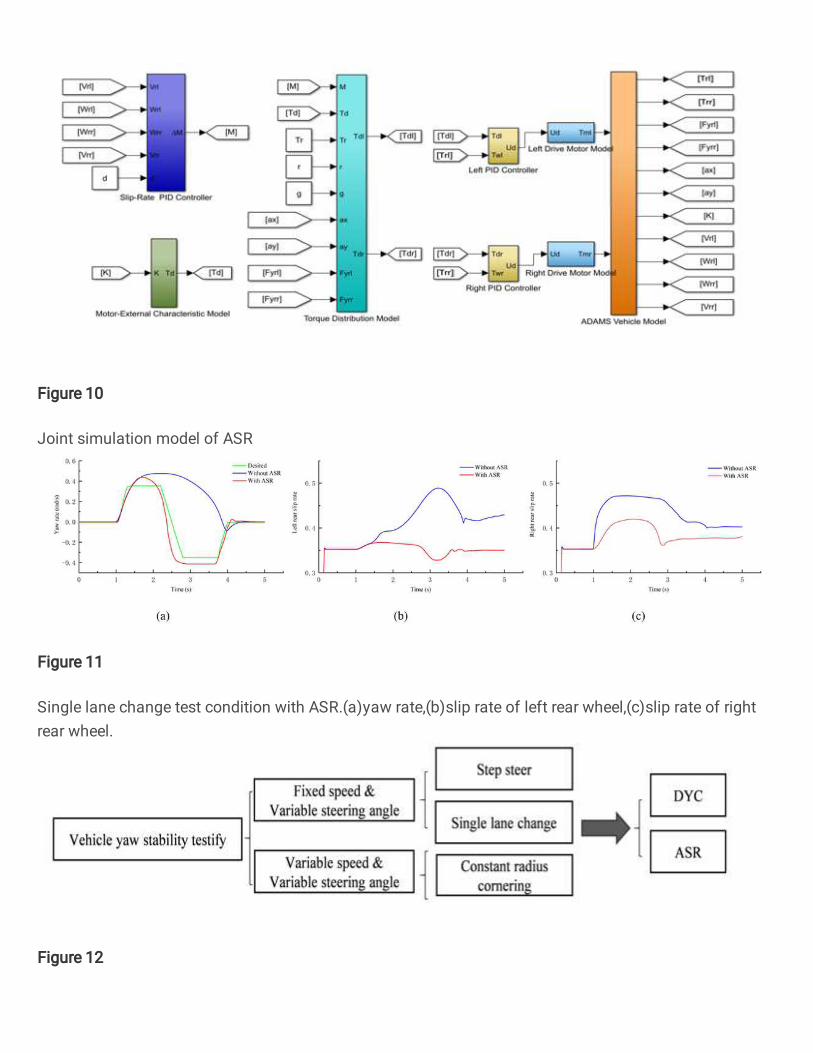
Figure 10
Joint simulation model of ASR
Figure 11
Single lane change test condition with ASR.(a)yaw rate,(b)slip rate of left rear wheel,(c)slip rate of rightrear wheel.
Figure 12
Classi�cations of test conditions.
Figure 13
Simulation curve of DYC.
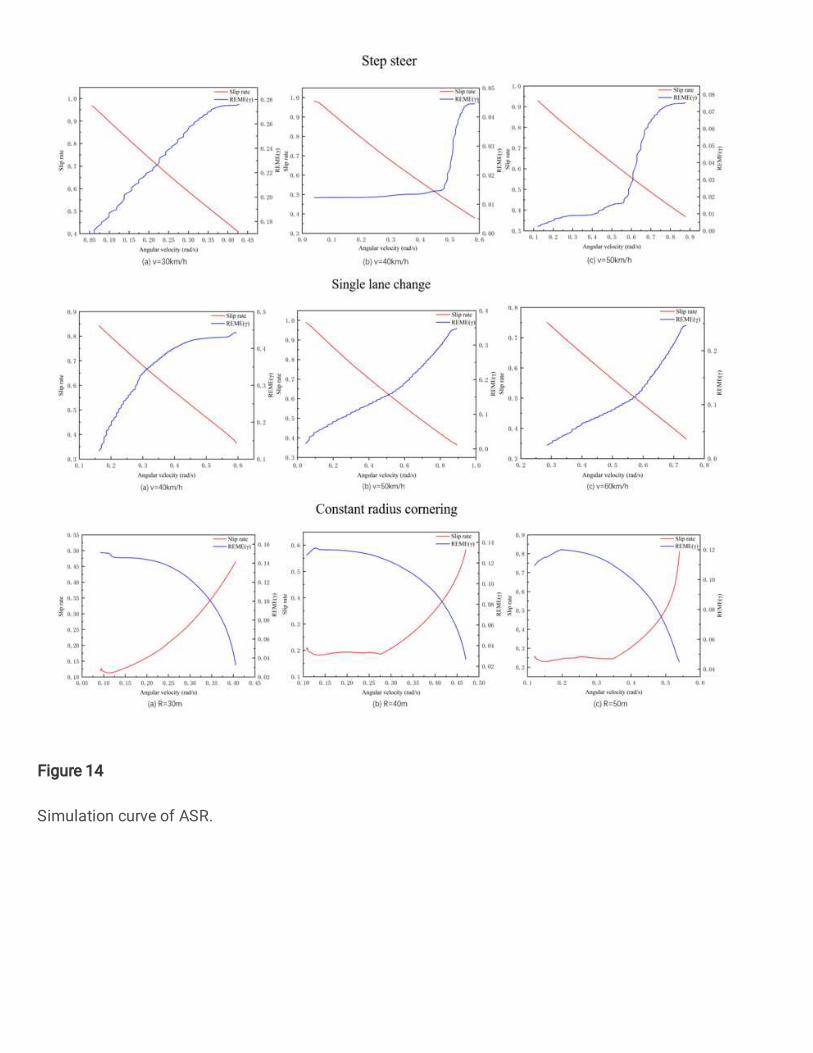
Figure 14
Simulation curve of ASR.
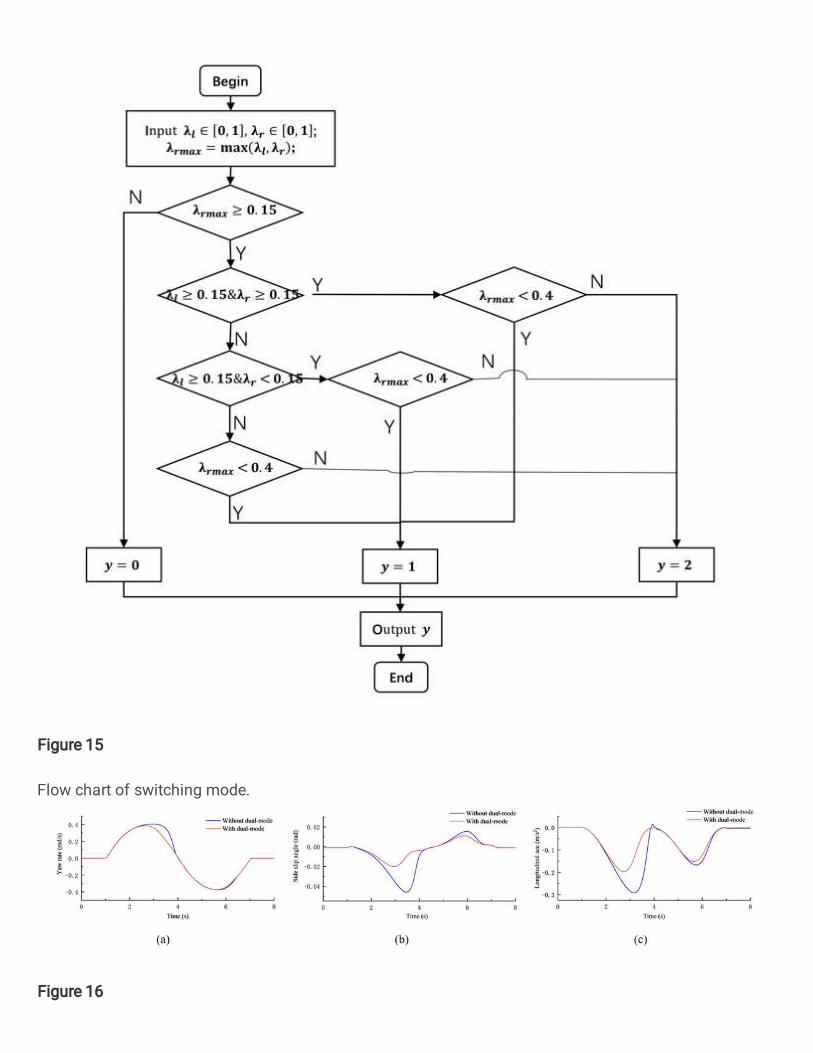
Figure 15
Flow chart of switching mode.
Figure 16
Simulation test of single lane change condition.(a)yaw rate,(b)side slip angle,and (c)longitudinalacceleration.
Figure 17
Simulation test of step steer condition.(a)yaw rate,(b)side slip angle,and (c)longitudinal acceleration.
Figure 18
Drivers in the loop simulation.
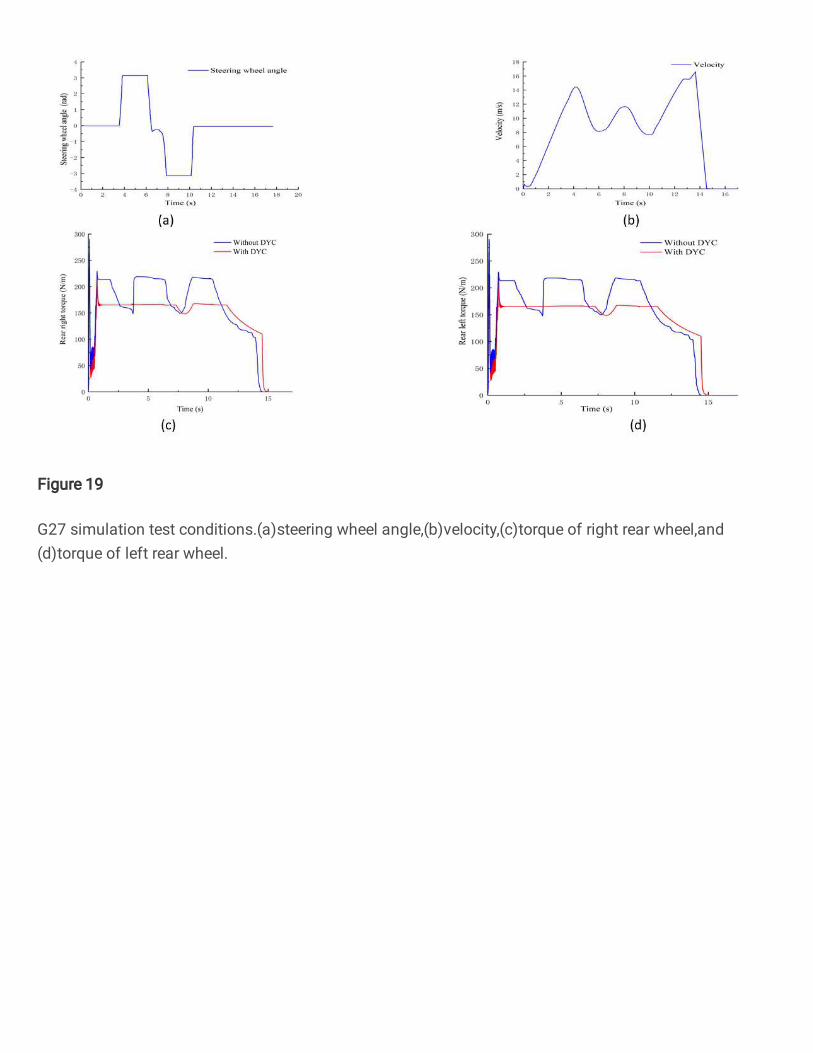
Figure 19
G27 simulation test conditions.(a)steering wheel angle,(b)velocity,(c)torque of right rear wheel,and(d)torque of left rear wheel.