Embed Size (px)
Citation preview

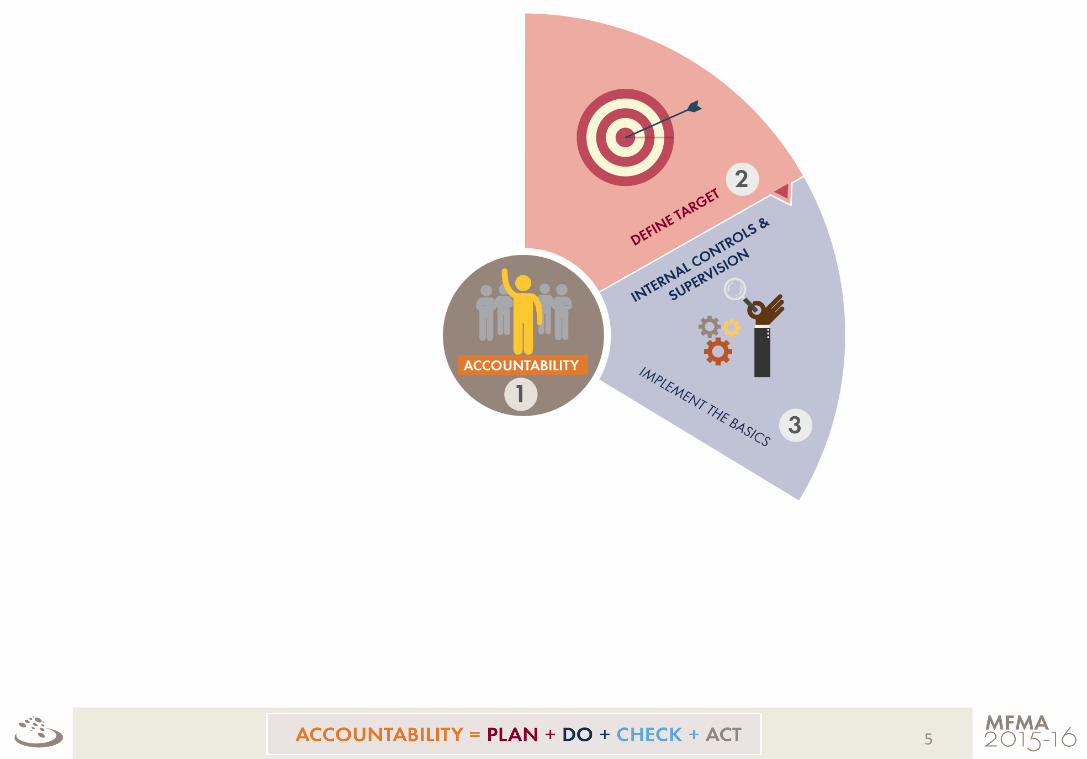
Taking accountability to improve audit outcomes

INTEGRATED DEVELOPMENT PLAN (IDP)

3
“Plan-Do-Check-Act Cycle”, also the Deming cycle , courtesy of the International Organization for Standardization

4
5

6

7

8

9

DO
PLAN
CHECK ACT
10

The AGSA has a constitutional
mandate and exists to strengthen
our democracy by enabling
oversight, accountability and good governance in the public
sector through auditing, thereby
building public confidence
Delivering a valuable and relevant product
focusing on the things that matter
We have improved our audit methodology and audit report
11
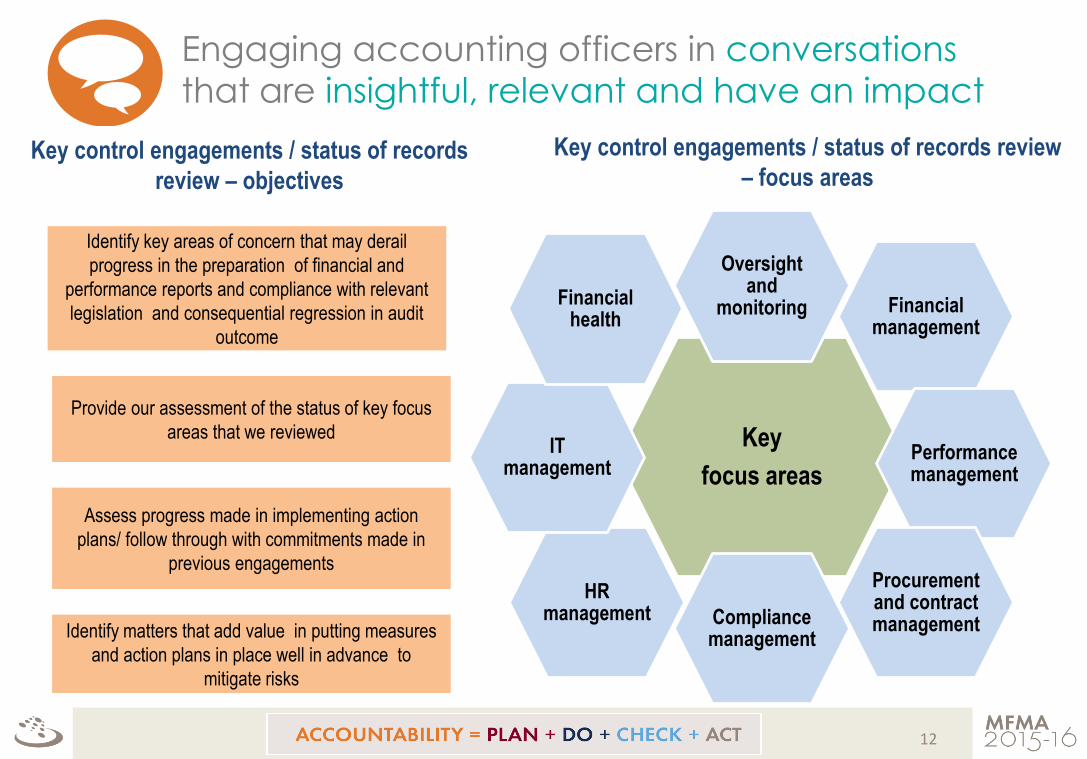
Key control engagements / status of records
review – objectives
Identify matters that add value in putting measures
and action plans in place well in advance to
mitigate risks
Assess progress made in implementing action
plans/ follow through with commitments made in
previous engagements
Provide our assessment of the status of key focus
areas that we reviewed
Identify key areas of concern that may derail
progress in the preparation of financial and
performance reports and compliance with relevant
legislation and consequential regression in audit
outcome
Key
focus areas
Oversight and
monitoring Financial management
Performance management
Procurement and contract management Compliance
management
HR management
IT management
Financial health
Key control engagements / status of records review
– focus areas
12
Engaging accounting officers in conversations
that are insightful, relevant and have an impact
13
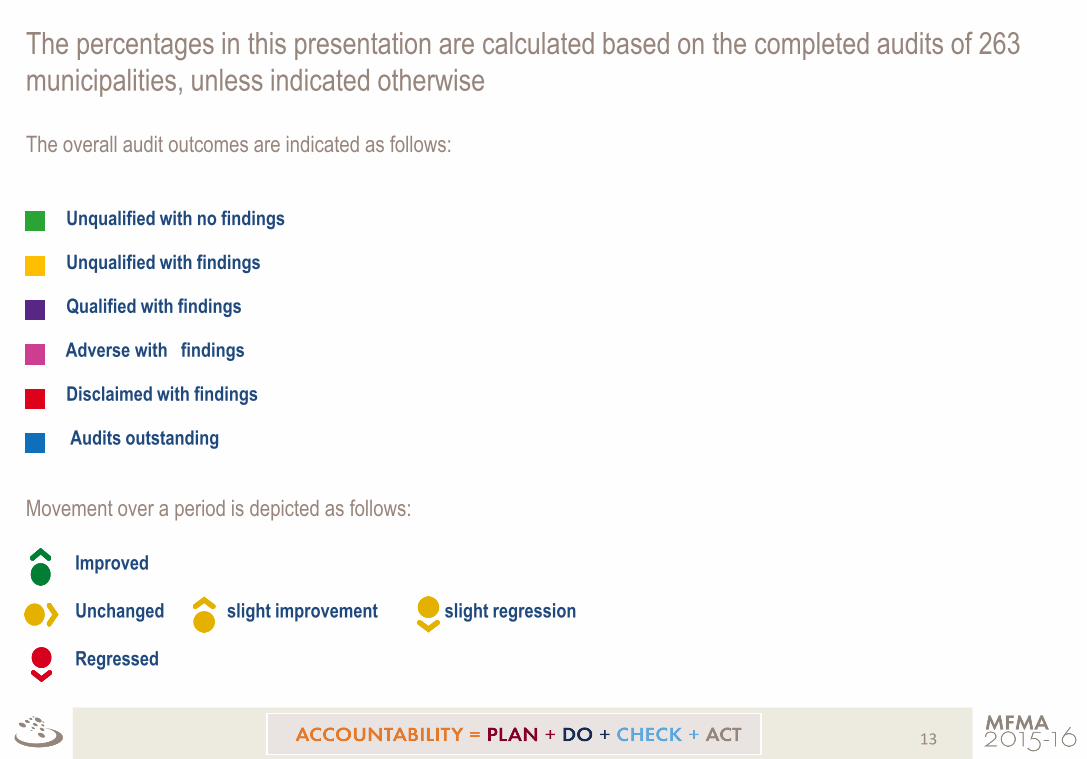
The percentages in this presentation are calculated based on the completed audits of 263
municipalities, unless indicated otherwise
The overall audit outcomes are indicated as follows:
Unqualified with no findings
Unqualified with findings
Qualified with findings
Adverse with findings
Disclaimed with findings
Audits outstanding
Movement over a period is depicted as follows:
Improved
Unchanged slight improvement slight regression
Regressed
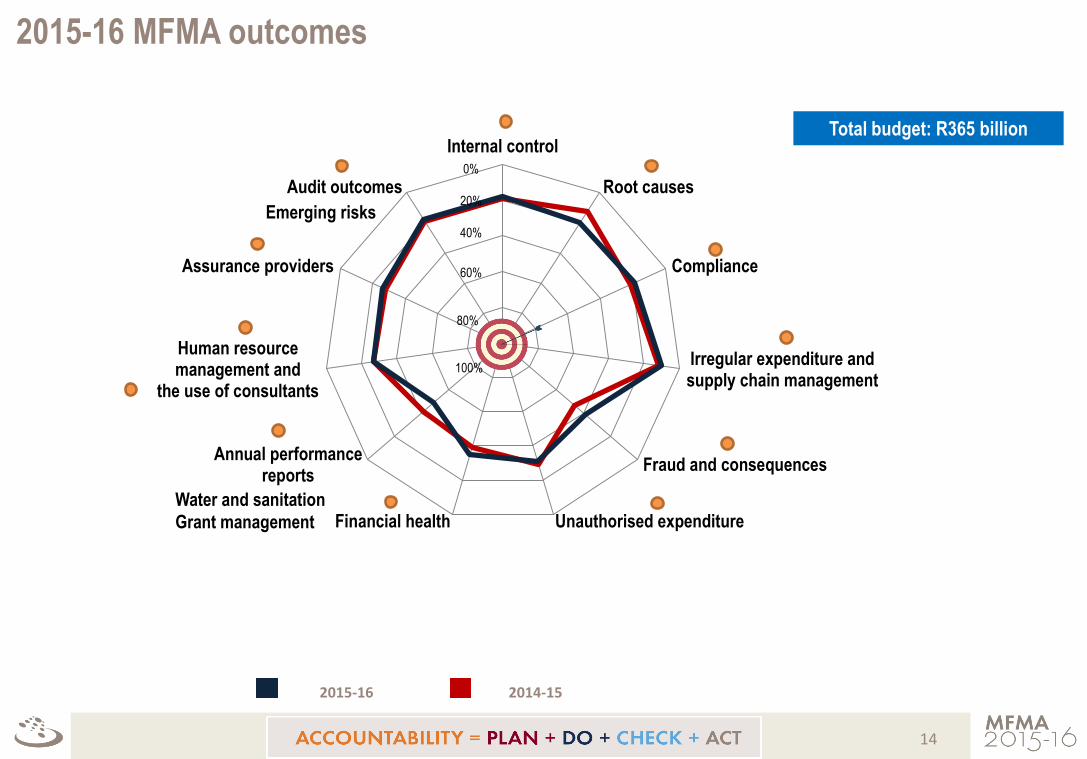
2015-16 MFMA outcomes
Internal control
Root causes
Compliance
Irregular expenditure andsupply chain management
Fraud and consequences
Unauthorised expenditureFinancial health
Annual performancereports
Human resourcemanagement and
the use of consultants
Assurance providers
Audit outcomes
Total budget: R365 billion
14
2015-16 2014-15
80%
100%
60%
40%
20%
0%
Water and sanitation
Grant management
Emerging risks

25% 43% 32% Leadership
Internal controls
23% 47% 30%
Financial andperformancemanagement
37% 38% 25% Governance
Good Of concern Intervention required
18%
15
Good controls =

Root causes
86% (185)
73% (157)
73% (158)
Slow response to improving key controls and addressing risk areas
Inadequate consequences for poor performance and transgressions
Instability or vacancies in key positions
16
Management (accounting officers and senior management), the political
leadership (mayor and council) and oversight bodies MPACs and portfolio
committees) do not respond with the required urgency to our messages
about addressing risks and improving internal controls
If officials who deliberately or negligently ignore their duties and contravene
legislation are not held accountable for their actions, such behaviour can
be seen as acceptable and tolerated.
The instability and prolonged vacancies in key positions can cause a
competency gap that leads to a high demand for consultants and
support.
18% Best practices =

73% (191)
68% (178)
63% (167)
52% (136)
45% (119)
Prevention of unauthorised, irregular and fruitless and wasteful expenditure
Quality of financial statements submitted
Management ofprocurement and/ or contracts
Consequence management
Expenditure management
Little improvement in areas of compliance
17
19% With no findings =

Irregular expenditure over three years 2015-16
MFMA
R10 791 m (64%)
R6 999 m (63%)
R5 369 m (47%)
R6 019 m (36%)
R4 137 m (37%)
R5 965 m (53%)
2015-16 2014-15 2013-14
R16 810 m
(236 municipalities [90%])
R11 334 m
(225 municipalities [86%]) R11 136 m
(232 municipalities [88%])
Identified by auditees Identified during audit
31% (R5 269 m)
19% (R2 179 m)
24%
(R2 662 m)
Incurred in previous years – identified in current year
18
10% 98% (2014-15: 96%) of occurrences were related to contraventions of SCM prescripts
EC R5 657 million (34%)
FS R361 million
(2%) GP R1 499
million (9%)
KZN R2 361 million (14%)
LP R1 636 million (10%)
MP R2 279 million (13%)
NC R287 million
(2%)
NW R2 520 million (15%)
WC R210 million
(1%)
Provincial breakdown of
irregular expenditure incurred
With no IE =
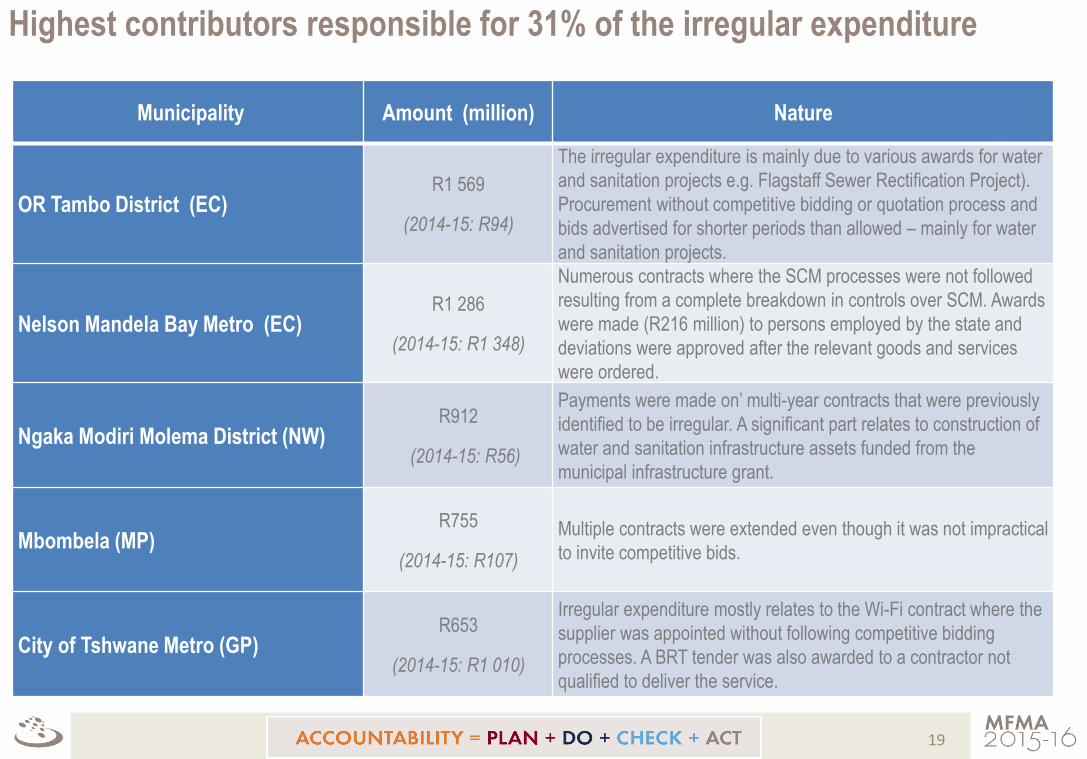
Highest contributors responsible for 31% of the irregular expenditure
19
Municipality Amount (million) Nature
OR Tambo District (EC) R1 569
(2014-15: R94)
The irregular expenditure is mainly due to various awards for water
and sanitation projects e.g. Flagstaff Sewer Rectification Project).
Procurement without competitive bidding or quotation process and
bids advertised for shorter periods than allowed – mainly for water
and sanitation projects.
Nelson Mandela Bay Metro (EC) R1 286
(2014-15: R1 348)
Numerous contracts where the SCM processes were not followed
resulting from a complete breakdown in controls over SCM. Awards
were made (R216 million) to persons employed by the state and
deviations were approved after the relevant goods and services
were ordered.
Ngaka Modiri Molema District (NW) R912
(2014-15: R56)
Payments were made on’ multi-year contracts that were previously
identified to be irregular. A significant part relates to construction of
water and sanitation infrastructure assets funded from the
municipal infrastructure grant.
Mbombela (MP) R755
(2014-15: R107)
Multiple contracts were extended even though it was not impractical
to invite competitive bids.
City of Tshwane Metro (GP) R653
(2014-15: R1 010)
Irregular expenditure mostly relates to the Wi-Fi contract where the
supplier was appointed without following competitive bidding
processes. A BRT tender was also awarded to a contractor not
qualified to deliver the service.

Little movement in SCM findings since previous year
10% (26)
14% (36)
19% (51)
18% (46)
41% (107)
23% (64)
10% (26)
6% (16)
9% (23)
26% (69)
17% (46)
59% (155)
Limitation in planned scope of audit awards
Awards to employees
Awards to close familymembers of employees
Inadequate contract management
Awards to other state officials
Uncompetitive or unfairprocurement processes
20% (52)
20% (52), R56 million
28% (74), R1 396 million
44% (115)
58% (153), R2 520 million
83% (219)
20
With findings With material findings (reported in audit report)

21
Recommendations for improving SCM findings
• A less tolerant approach by all parties, including those charged with governance and oversight, will result in
accountability and consequences being enforced against those who intentionally fail to comply with legislation
• Strengthen the SCM control environment by appointing suitably skilled and qualified heads of SCM where
vacancies exist and conduct regular training to improve skills – this will reduce possible irregular expenditure
• Implement SCM compliance checklists to supplement policies and procedures
• Submit regular reports to management and governance structures on compliance with key legislation
• Corrective or disciplinary action for misconduct
• Focus on preventing irregular expenditure and non-compliance – these should be a key performance
measure in senior official’s contracts

Fraud and consequence management
46% (118)
54% (136)
254
MUN
22
Not investigated Investigated
Allegations of financial and/or fraud and
SCM misconduct (151 municipalities)
39%
Control environment
101 (38%) municipalities did not have sufficient mechanisms for reporting and investigating transgressions or possible fraud
Most common findings:
• Disciplinary board not established at 73 municipalities
• No hot-line at 53 municipalities
• No policies for investigations at 50 municipalities
Previous year unauthorised, irregular and fruitless and
wasteful expenditure reported for investigation
28% (43)
17% (26)
9% (14)
Allegations not investigated
Investigations took longer than three months
Allegations not properly investigated

23
R22 763 m (82%)
R18 824 m (78%)
R2 088 m (89%)
R3 937 m (14%)
R3 639 m (15%)
R242 m (10%)
R1 m <1%
R 7 m < 1%
R6 m (1%)
Irregular expenditure(R27 887 million)
Unauthorisedexpenditure
(R24 259 million)
Fruitless and wastefulexpenditure
(R2 336 million)
Recovered Condoned or authorised through
adjustment budget Written off Not dealt with
R6 012 m (54%)
R7 296 m (57%)
R893 m (78%)
R3 937 m (35%)
R3 639 m (29%)
R242 m (21%)
R 1 m < 1%
R 7 m < 1%
R6 m (1%)
Irregular expenditure(R11 136 million)
Unauthorisedexpenditure
(R12 731 million)
Fruitless and wastefulexpenditure
(R1 141 million)
Movement of unauthorised, irregular and
fruitless and wasteful expenditure as a
percentage of amount incurred in previous year
Movement of unauthorised, irregular and
fruitless and wasteful expenditure as a
percentage of previous year’s closing balance
R1 186 m (4%)
R1 789 m (7%)
R1 186 m (11%)
R1 789 m (14%)
Movement in UIFW balances
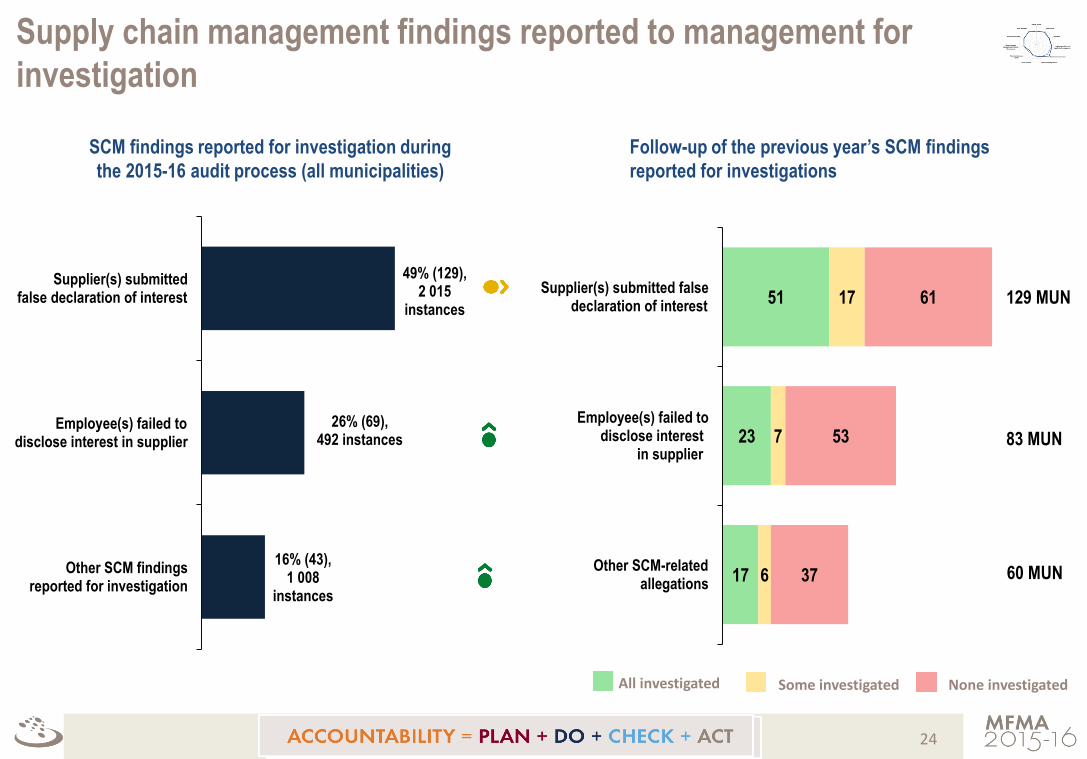
Supply chain management findings reported to management for
investigation
16% (43), 1 008
instances
26% (69), 492 instances
49% (129), 2 015
instances
Other SCM findingsreported for investigation
Employee(s) failed todisclose interest in supplier
Supplier(s) submittedfalse declaration of interest
SCM findings reported for investigation during
the 2015-16 audit process (all municipalities)
24
Follow-up of the previous year’s SCM findings
reported for investigations
All investigated Some investigated None investigated
17
23
51
6
7
17
37
53
61
Other SCM-related allegations
Employee(s) failed to disclose interest in supplier
Supplier(s) submitted false declaration of interest
129 MUN
83 MUN
60 MUN

Unauthorised expenditure over three years 2015-16
MFMA
R10 181 m (80%)
R9 029 m (72%)
R7 006 m (70%)
R2 590 m (20%) R3 702 m
(28%)
R3 067 m (30%)
2015-16 2014-15 2013-14
R12 771 m
(181 municipalities [69%])
R10 073 m
(187 municipalities [71%])
R12 731 m
(190 municipalities [72%])
Identified by auditees Identified during audit
55% (R7 024 m)
64% (R8 146 m)
59% (R5 939 m)
Non-cash items including depreciations, impairments, debt
written off etc.
25
31%
99% (2014-15: 97%) of occurrences caused by overspending of budget / main sections in budget
EC R856 million
(7%) FS R1 294 million (10%)
GP R3 536 million (28%) KZN
R1 623 million (13%) LP
R1 017 million (8%)
MP R1 713 million (13%)
NC R568 million
(4%)
NW R1 954 million (15%)
WC R210 million
(2%)
Provincial breakdown of
unauthorised expenditure incurred

Financial health
35% (93)
33% (86)
32% (84)
Financial viability of municipalities is on a steady decline
• incurred a deficit
• in net current liability position
• were able to pay their creditors in less than 30 days
• took more than 120 days to pay their creditors
• are able to collect monies owed to them in less than 90 days
• took more than 120 days to collect money owed to them
• deem more than 10% of their debt to be non-recoverable
26
Good
Of concern
Intervention required
35%
93%
44%
46%
40%
17%
33%
44%

Planning, managing and reporting on performance
27
The process
Plan and budget
Monitor and in-year reporting
Report performance in annual
performance report (APR)
49%
The findings
• 37 municipalities (14%) did not set key performance indicators for delivery of
basic services (water, electricity, sanitation and refuse removal)
• Indicators not well defined (23%) or verifiable (21%)
• Targets not measurable (18%) or specific enough (16%)
• 27 municipalities (10%) had no performance management systems
• 26 municipalities (10%) had inadequate performance management systems
• 17 municipalities (6%) had no mechanisms to monitor or review performance
• 3% did not prepare APR – 6 from the Northern Cape
• Reported information not consistent with what was included in the plan (24%)
• Reported achievement was not reliable at 45% municipalities
• 80% of APR submitted for audit was materially misstated. After corrections were made, it was 49%, an improvement from the 38% in 2014-15
• Progress made towards useful and reliable performance reporting is slow. This affects the ability of communities to hold municipalities
accountable and makes it difficult for provincial and national government to track progress towards the service delivery goals.

Water and sanitation – grant funding and performance reporting
79% (117)
18% (27)
3% (4)
85% (127)
13% (20)
2% (2)
Sanitation (150 WSA) Water (148 WSA)
72% (107)
14% (21)
14% (20)
75% (113)
16% (24)
9% (13)
Grant funding
Performance
reporting
Reliable reporting
Reported but not reliable
No reporting
Grant used
Grant not fully used
Grant funding used for other purposes
28
16 of these municipalities also
did not plan for the provision
of water services in the
SDBIP/IDP
21 of these municipalities also
did not plan for the provision
of sanitation services in the
SDBIP/IDP

29
Performance audit report on Water infrastructure
• Focused on the planning, project management
and implementation of projects in ten district
municipalities in six provinces
• Tabled on 30 November 2016
• Weaknesses identified in areas of leadership
and oversight, funding, project management
and operations and intergovernmental
coordination

The projects in progress do not address the cause of the water backlog reported
Projects exceeded planned completion date
Projects had significant findings on supply chain management
Findings on water infrastructure projects and maintenance in local government
Water infrastructure projects
at 148 municipalities
Maintenance of water infrastructure
at 148 municipalities
20%
28%
22%
No policy on maintenance of water infrastructure
No maintenance plan
Conditional assessment not done to inform the maintenance plan and budget
Maintenance was not budgeted for
Appropriate steps not taken to prevent over-/underspending of the budget allocation for routine water infrastructure maintenance
Targets and time frames for routine maintenance of water infrastructure were not achieved
56%
45%
34%
24%
20%
16%
30

Sanitation infrastructure projects and maintenance
Sanitation infrastructure projects at 150 municipalities
The projects do not address the cause of the sanitation backlog reported
Projects exceeded planned completion date
Projects had significant findings on supply chain management
18%
25%
19%
31

65% (426)
35% (226)
Key projects funded by the municipal infrastructure grant (MIG)
32
Targets achieved Targets not achieved / not evaluated
• 652 key projects audited at 234 municipalities
• municipalities did not use grants in line with the grants framework
• Only of the R15,04 billion in grants was not spent
SCM findings and incorrect
accounting identified
Achievement of planned targets - projects
29% (192)
13% (84)
SCM findings(652 projects)
Incorrect accounting(652 projects)
Projects managed by municipalities
18%( 7)
3% (1)
SCM findings(38 projects)
Incorrect accounting(38 projects)
Projects managed by implementing agents
652
projects 7%
15

Management of USDG and PTNG
Urban settlements
development grant (USDG)
2015-16
R10,55 billion
(7 municipalities [3%])
89% (16)
11% (2)
2015-16
18 projects
2015-16
84% (16)
16% (3)
2015-16
33
Public transport
network grant (PTNG)
R5,36 billion
(11 municipalities [4%]) R0,54 billion (5%)
R10,01 billion (95%) R0,55 billion (10%)
R4,8 billion (90%)
19 projects
Spent Not spent
Targets achieved Targets not achieved/ not evaluated
• Projects have generally been
successfully implemented and
goods and services received for
the money spent
• In some projects, delays resulted in
variation orders; quality issues due
to lack of maintenance and project
management failures due to
inadequate planning
• All design specifications were not
approved before tenders were invited
for projects
• SCM findings on grant projects were
reported in some cases.

Human resource management
27% (72)
47% (122)
26% (69)
• Biggest improvements in EC
• Biggest regression in KZN
• Inadequate performance management at 125 municipalities (no signed performance contracts for some senior managers at 38 municipalities)
• 59 of 72 (82%) municipalities maintained their status of “good” assessment
• 57 of 69 (83%) municipalities remained in the red zone from the previous year
34
Good
Of concern
Intervention required
27%
Status of human resource management controls

Vacancies, stability and achievement of competency requirements –
municipal managers and chief financial officers
35
7% (18)
8% (20)
5% (14)
4% (11)
13% (35)
19% (50)
12% (30)
16% (41)
2014-15
2015-16
2014-15
2015-16 20% (52)
17% (44)
27% (70)
20% (53)
Vacant for less than 6 months Vacant for 6 months
or more
Average number of months in
position
Did not meet minimum
competency requirements
Minimum competencies
not assessed/ limitation
40 months
47 months
43 months
50 months
2014-15
2015-16
2014-15
2015-16
8% (17)
9% (20)
8% (16)
12% (26)
6% (12)
7% (16)
3% (6)
6% (12)
2015-16
2014-15
2015-16
2014-15
14% (29)
16% (36)
11% (22)
18% (38)
Vacancy at
year-end
Stability (average of
months in
position)
Competency (non-achievement
of minimum
competency
requirements)
Municipal managers
Chief financial officers
Municipal managers
Chief financial officers
Municipal managers
Chief financial officers

33% (85)
49% (125)
60% (152)
Inadequate planning and appointment process
No transfer of skills
Poor performance management and monitoring
Effective use of consultants – overall
Findings from the audit on the use of consultants at 254 municipalities where consulting services were intellectual or advisory in
nature on financial reporting services, preparation of performance information, IT related services or other services.
36
• Measures to monitor contract performance and delivery not defined and/ or implemented
(82 municipalities)
• No evaluation performed to determine if the consultancy rendered, meet the initial project objectives,
needs and deliverables (36 municipalities)
• No evidence that skills transfer or training programmes took place (101 municipalities)
• Measures to monitor the transfer of skills according to contract not implemented (80 municipalities)
• Requirements/ objectives/ key details of transfer of skills not included in the terms of reference
(65 municipalities)
• Consultants appointed without conducting needs assessment or gap analysis (65 municipalities)
• Consultants appointed without any terms of reference (34 municipalities)
• Inadequate terms of reference used (19 municipalities)
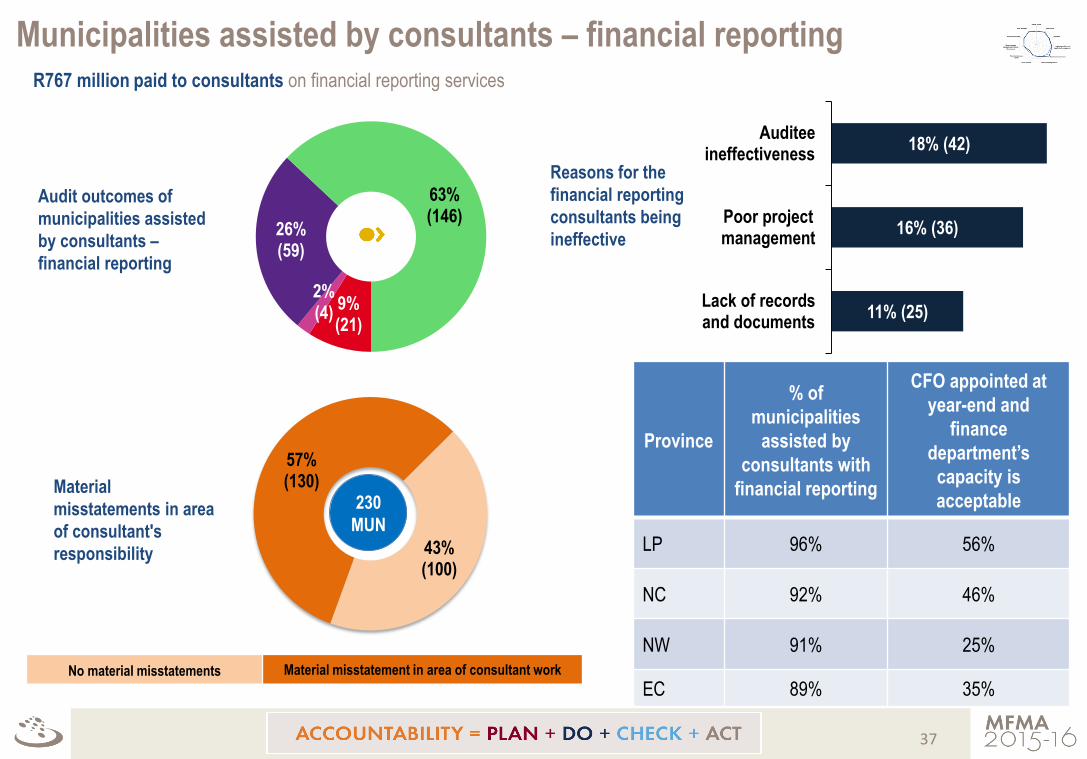
9% (21)
2% (4)
26% (59)
63% (146)
Municipalities assisted by consultants – financial reporting
Audit outcomes of
municipalities assisted
by consultants –
financial reporting
37
Province
% of
municipalities
assisted by
consultants with
financial reporting
CFO appointed at
year-end and
finance
department’s
capacity is
acceptable
LP 96% 56%
NC 92% 46%
NW 91% 25%
EC 89% 35%
57% (130)
43% (100)
230
MUN
No material misstatements Material misstatement in area of consultant work
Material
misstatements in area
of consultant's
responsibility
11% (25)
16% (36)
18% (42)
Lack of recordsand documents
Poor projectmanagement
Auditeeineffectiveness
Reasons for the
financial reporting
consultants being
ineffective
R767 million paid to consultants on financial reporting services

27% 23% 25%
60% 61%
49%
13% 16% 26%
Sen
ior
m
anag
emen
t
Mun
icip
al m
anag
ers
/ ch
ief e
xecu
tive
offic
ers
May
ors
First level of assurance – management/leadership
Assurance
provider
Responsibility
Senior
managers
• Task/project leadership
• “Doing the basics right”
• Supervision and review
• Timely implementation of action plans and recommendations
Municipal
managers/
CFOs
• Administrative leadership, guidance and oversight
• Enabling delivery
• Monitor and report on progress of action plans
• Hold staff accountable
• Investigate all allegations of fraud
• Reporting channel between administrative and political leadership
Mayors
• Political leadership, guidance and oversight
• Reporting channel between executive leadership and legislature
• Political accountability
38
Provides assurance Provides some assurance Provides limited/no assurance
26%

Inte
rnal
aud
it
units
Aud
it co
mm
ittee
s
Second level of assurance – Internal independent assurance and
oversight
Tre
asur
ies,
coo
pera
tive
gove
rnan
ce
depa
rtm
ents
,
prem
ier’s
offi
ces
1% 3%
17% 16% 28%
45% 43%
62%
37% 38%
10%
Assurance
provider
Responsibility
Internal audit
• Report to strengthen control environment
• Advise on organisational systems, processes and practices
• Advise on organisational effectiveness
Audit
committee
• Interrogate and advise management
• Review financial and performance reporting before audit
• Ensure appropriate reaction to findings
Coordinating /
monitoring
departments
• Guide and enable service delivery in coordinated effort (OTP)
• Ensure proper inter-governmental coordination (OTP)
• Hold cabinet / executive committee accountable (OTP)
• Monitor and provide oversight (OTP)
• Guide proper financial management / SCM (Treasuries)
• Skills development (Treasuries)
• Guide proper strategic planning and performance management
(Cogta)
• Facilitate the fight against corruption (Cogta)
39
Provides assurance Provides some assurance Provides limited/no assurance Not established

Third level of assurance – external independent assurance
and oversight M
unic
ipal
cou
ncils
Mun
icip
al p
ublic
ac
coun
ts
com
mitt
ees
1%
27% 32%
40%
47% 43%
60%
26% 24%
Por
tfolio
com
mitt
ees
on
loca
l gov
ernm
ent
Assurance
provider
Responsibility
Municipal
council/
MPAC
• Enable proper financial oversight
• Interrogate the audit outcomes
• Ensure corrective action / proper consequence management
Portfolio
committees
• Review strategic plans and related budgets, and guide government
on appropriate delivery targets and resource use
• Review performance reports and guiding appropriate action
• Ensure proper consequence management
External
audits
• Engage pro-actively
• Conducti annual audits and reporting on these
• Engage with governance structures
• Enable the work of oversight
40
Provides assurance Provides some assurance Provides limited/no assurance Not established

Audit outcomes over three years
5% (15)
9% (25) 12% (33)
20% (55)
1% (4) 1% (4)
1% (3)
23% (63) 27% (76)
26% (71)
44% (122) 41% (111)
39% (109)
18% (49) 19% (54) 14% (40)
2015-16 2014-15 2013-14
41
18%
278 municipalities

Improved
Unchanged
Regressed
Outstanding
audits
Unqualified with no
findings = 49 2 (DM), 7 (LM)
1 (MET)
12 (DM)
27 (LM)
Unqualified with
findings = 122
3 (DM), 16 (LM)
2 (LM)
2 (MET)
11 (DM)
75 (LM)
2 (MET)
4 (DM)
7 (LM)
1 (MET)
2 (LM)
Qualified with
findings = 63
1 (LM)
8 (LM)
2 (MET)
4 (DM)
38 (LM)
1 (LM)
3 (DM), 6 (LM) 3 (LM)
Adverse with
findings = 4 2 (DM), 1 (LM) 1 (LM)
Disclaimed with
findings = 25
2 (DM)
11 (LM)
1 (LM)
10 (LM)
1 (DM)
9 (LM)
Movement table (2015-16 over 2014-15)
42 36 185 15
MET – metro
DM – district municipality
LM – local municipality
Colour of the number
indicates the audit opinion
from which the auditee has
moved.
42

Status of audits that were outstanding at 15 January 2017
43
• 15 audits were outstanding on 15 January 2017 (our cut-off date), compared to
six in 2014-15
• Reasons include late (eight) or non-submission of annual financial statements (four)
and disagreements on accounting and other matters (three)
• Eleven audits were subsequently finalised resulting in:
˗ four unqualified (Mangaung Metro, Matjhabeng and Phumelela – FS, Gamagara
- NC)
˗ six qualified (Maluti-A-Phofung – FS, Grater Giyani and Mutale – LP, Dikgatlong
and Tsantsabane – NC, Rustenburg – NW)
˗ one adverse opinions (Mogalakwena – LP)

Gau
ten
g
2
6 11
4
1
2014-15 2015-16
Lim
po
po
4 5 2 1 1
14 10
10 13
2014-15 2015-16
Mp
um
alan
ga
4 2
5 8
10 8
2 3
2014-15 2015-16
Kw
aZu
lu-N
atal
1 2 1 7 5
35 42
18 11
2014-15 2015-16
Fre
e S
tate
4 3
3 8
3
12 13
1 1
2014-15 2015-16
No
rth
Wes
t 1
7 7
10 11
6 4
2014-15 2015-16
Eas
tern
Cap
e
5 4 2
19 14
16 18
5 7
2014-15 2015-16
No
rth
ern
Cap
e
6 8
4
13 11
9 9
2 2
2014-15 2015-16
Wes
tern
Cap
e
1 1 1 7 4
22 24
2014-15 2015-16
Movement per province
(municipalities)
44
1
1
2
3
1 6
2
4
4
2
2
7
14
7 4
3
5
6
1
2
3
1
2 10
3
7
1
1
1
1

Gau
ten
g
2
16 24
15 10
2014-15 2015-16
Lim
po
po
4 6 2
1 1
14 10
12 16
2014-15 2015-16
Mp
um
alan
ga
4 2
5 8
10 8
2 3
2014-15 2015-16
Kw
aZu
lu-N
atal
1 2 1 8 6
37 43
22 16
2014-15 2015-16
Fre
e S
tate
4 3
3 8
3
15 16
1 1
2014-15 2015-16
No
rth
Wes
t 1
7 7
10 12
9 6
2014-15 2015-16
Eas
tern
Cap
e
6 4 2
20 15
22 25
7 10
2014-15 2015-16
No
rth
ern
Cap
e
6 8
4
13 11
9 9
2 2
2014-15 2015-16
Wes
tern
Cap
e
1 1 1 8 5
23 25
2014-15 2015-16
Movement per province
(all auditees)
45
2
5
3
7
2
5
4
2
2
8
14
6
4
3
1
14
4
10
3
1
2
5
7
2
1
2
1

Emerging risks
1. mSCOA will be implemented from 1 July 2017
2. The use of the central supplier database (CSD) and the eTender portal was compulsory from 1 July 2016
• The SCM policy at 139 municipalities was not updated to invite quotations from suppliers registered on the CSD
• 118 municipalities still use their own database of prospective suppliers that is not synchronised with the CSD
• The SCM policy at 144 municipalities was not updated to invite competitive bids through the eTender portal
3. Contracts of municipal managers and senior management (including CFOs) are ending in 2016-17
46
18% (43)
72% (176)
10% (26)
Ready for implementation
Readiness is of concern
Readiness requires intervention
47
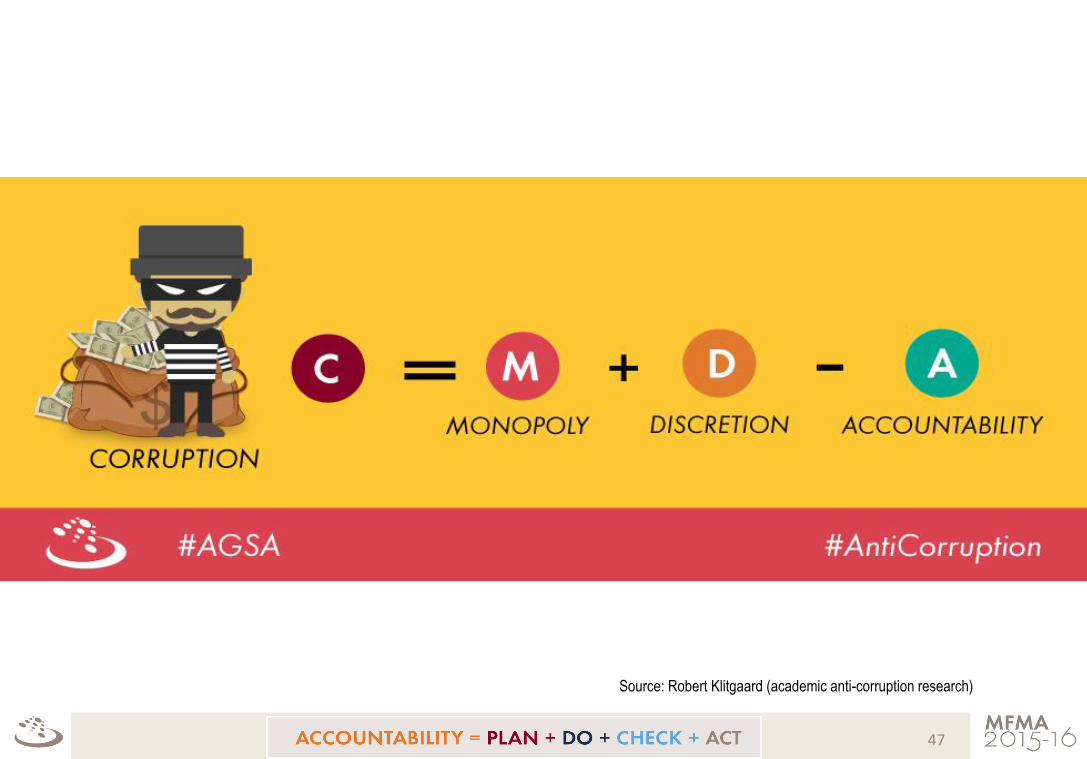
Source: Robert Klitgaard (academic anti-corruption research)

48
Source: Robert Klitgaard (academic anti-corruption research)

49
Source: Robert Klitgaard (academic anti-corruption research)

Stay in touch with the AGSA
50