Embed Size (px)
Citation preview
INTEGRATED DEVELOPMENT PLAN
2016/17 TO 2020/21
PREPARED
IN-HOUSE: West Rand District Municipality
Private Bag x 033
Randfontein
1760
Tel. 011 – 411 5000

2
AAT - Association for Accounting Technicians
AEL - Atmospheric Emission Licenses
AELS - Air Quality Emission Licenses
AFS - Annual Financial Statements
AIDS - Acquired Immunodeficiency Syndrome
ALC - Active Leak Control
AMD - Acid Mine Drainage
AQMP - Air Quality Management Plan
BNG - Breaking New Ground
CBD - Central Business District
CRDP - Comprehensive Rural Development Programme
CCTV - Closed Circuit Television
CFO - Chief Financial Officer
CPF - Community Policing Forum
CPTR - Current Public Transport Record
CoGTA - Cooperative Governance and Traditional Affairs
DBSA - Development Bank of Southern Africa
DHC - District Health Council
DEA - Department of Environmental Affairs
DEC - Durban Exhibition Centre
DITP - District Integrated Transport Plan
DLECC - District Law Enforcement Coordinating Committee
DRT - Department of Roads and Transport
DWAFF - Department of Water Affairs Fishery and Forestry
ECDC - Early Childhood Development Centre
EOC - Emergency Operations Centre
EMT - Emergency Medical Technician
LIST OF ABBREVIATIONS

3
EMS - Emergency Medical Services
EMF - Environmental Management Framework
EHP - Environmental Health Practitioners
EAP - Economically Active Participants
FPA - Fire Protection Association
GCIS - Government Communication and Information System
GDLG&H - Gauteng Department Local Government & Housing
GDP - Gross Domestic Product
GDP-R - Gross Domestic Product by Region
GDS - Growth and Development Strategy
GDARD - Gauteng Department of Agriculture Rural Development
GFA - Gauteng Funding Agency
GIS - Geographic Information System
GRAP - Generally Recognized Accounting Practice
HIV - Human Immunodeficiency Virus
HCT - HIV Counselling and Testing
HSD - Health Social Development
IDASA - Institute for Democracy in South Africa
IDP - Integrated Development Plan
ICT - Information Communication Technology
ICD - Integrated Community Development
IGR - Intergovernmental Relations
IMATU - Independent Municipal and Allied Trade Union
ISPMTT - Intervention Support Projects Monitoring Task Team
IT - Information Technology
ITS - Information Technology Support
IWMP - Integrated Waste Management Plan
KPI - Key Performance Indicator
LED - Local Economic Development
LM - Local Municipality
4
MFMA - Municipal Financial Management Act, Act No. 56 of 2003
MHS - Municipal Health Services
MIG - Municipal Infrastructure Grant
MLAP - Management Letter Action Plan
MMC - Member of Mayoral Committee
MMMTT - Municipal Mitigation Monitoring Task Team
MPAC - Municipal Public Accounts Committee
MSA - Municipal Systems Act, Act No. 32 of 2000
MSIG - Municipal Service Infrastructure Grant
NDFG - Neighbourhood Development Fund Grant
NDP - Neighbourhood Development Programme
NDP - National Development Plan
NEMWA - National Environmental Management Waste Act
NEMA - National Environmental Management Act
NGO - Non-Governmental Organization
NSDP - National Spatial Development Perspective
NT - National Treasury
NNR - National Nuclear Regulator
NYS - National Youth Services
OLS - Operating Licence Strategy
OPCA - Operation Clean Audit
PCF - Premier’s Coordinating Forum
PHC - Primary Health Care
PIER - Public Information Education Relations
PMS - Performance Management System
RMC - Risk Management Committee
PSO - Project Support Office
RTO - Regional Tourism Organization
RWG - Rail Working Group
SODA - State of the District Address
5
SALGA - South African Local Government Association
SAMWU - South African Municipal Workers Union
SANS - South African National Standard
SANTACO - South African National Taxi Council
SAPS - South African Police Services
SETA - Skills Education Training Authority
SCM - Supply Chain Management
SOER - State of the Environment Report
SPLUMA - Spatial Planning and Land Use Management Act
Stats SA - Statistics South Africa
TB - Tuberculosis
TOLAB - Transport Operating Licence
UNESCO - United Nations Educational, Scientific and Cultural Organization
WHBO - Construction Company in terms of Company’s Act
WRDA - West Rand Development Agency
WRDM - West Rand District Municipality
WRT - West Rand Tourism
WRFLH - West Rand Freight and Logistics Hub
WESMET - West Rand Metropolitan Transport Forum
6
LIST OF ABBREVIATIONS……………………………………………………………………2
SECTION A: 1. BACKGROUND AND INTRODUCTION……………………………………….7
1.1 WEST RAND DISTRICT MUNICIPALITY CONTEXTUALISATION………………………..8
SECTION B: 1.2 DEMOGRAPHIC PROFILE OF THE MUNICIPALITY (SITUATIONAL ANALYSIS)……………………………………………………………………………………12
SECTION C: 1.3 POWERS AND FUNCTIONS OF THE MUNICIPALITY……………………….29
SECTION D: 1.4 PROCESS FOLLOWED IN DEVELOPING THE IDP…………………………..30
SECTION E: 1.5 SPATIAL ECONOMY AND DEVELOPMENT RATIONALE…………………..83
SECTION F: 1.6 ASSESSMENT/ANALYSIS OF THE MUNICIPALITY’S STRENGTHS, WEAKNESSES, OPPORTUNITIES AND THREATS (SWOT)………………………………...87
SECTION G: 1.7 DEVELOPMENT PRIORITIES……………………………………………….90
SECTION H: 1.8 THE STRATEGIC APPROACH………………………………………………91
SECTION I: 1.9 AMALGAMATIONS AND MERGERS: SINGLE TIER MUNICIPALITY IN THE WEST RAND…………………………………………………………………………………93
SECTION J: 1.10. DEVELOPMENT STRATEGIES AND IMPLEMENTATION PLAN…………96
SECTION K: 1.11. WRDM PROPOSED HIGH LEVEL ORGANISATIONAL STRUCTURE…….172
SECTION L: 1.12 CONSTITUENT LOCAL MUNICIPALITIES 2016/17 - onwards PROJECTS AND PROGRAMMES…………………………………………………………………………….173
SECTION M: 1.13 ALIGNMENT WITH NATIONAL AND PROVINCIAL OBJECTIVES AND PROGRAMMES…………………………………………………………………………….186
SECTION N: 1.14 PROGRAMMES AND PROJECTS FROM OTHER SPHERES……………..195
SECTION O: 1.15 2016/17 BUDGET REPORT (SUMMARY)………………………...199
TABLE OF CONTENTS
7
WRDM VISION, MISSION AND CORE VALUES
The WRDM Vision, Mission and Values were reviewed for relevance against the new Five
Year plan and confirmed the relevancy and applicability of the current Vision and Mission.
However, it was agreed to add Transparency and Accountability to the core values, in order
to capture the sceptre of the whole Good Governance, since only one principles of Good
Governance was captured then, which was Responsibility.
VISION:
Integrating District Governance to achieve a better life for all
MISSION:
To provide an integrated and excellent developmental district governance system in the
West Rand
SLOGAN:
Green is the new Gold
CORE VALUES
Service excellence;
Pride;
Integrity;
Responsibility;
Transparency;
Accountability;
Innovation; and
Teamwork
SECTION A: 1. BACKGROUND AND INTRODUCTION
8
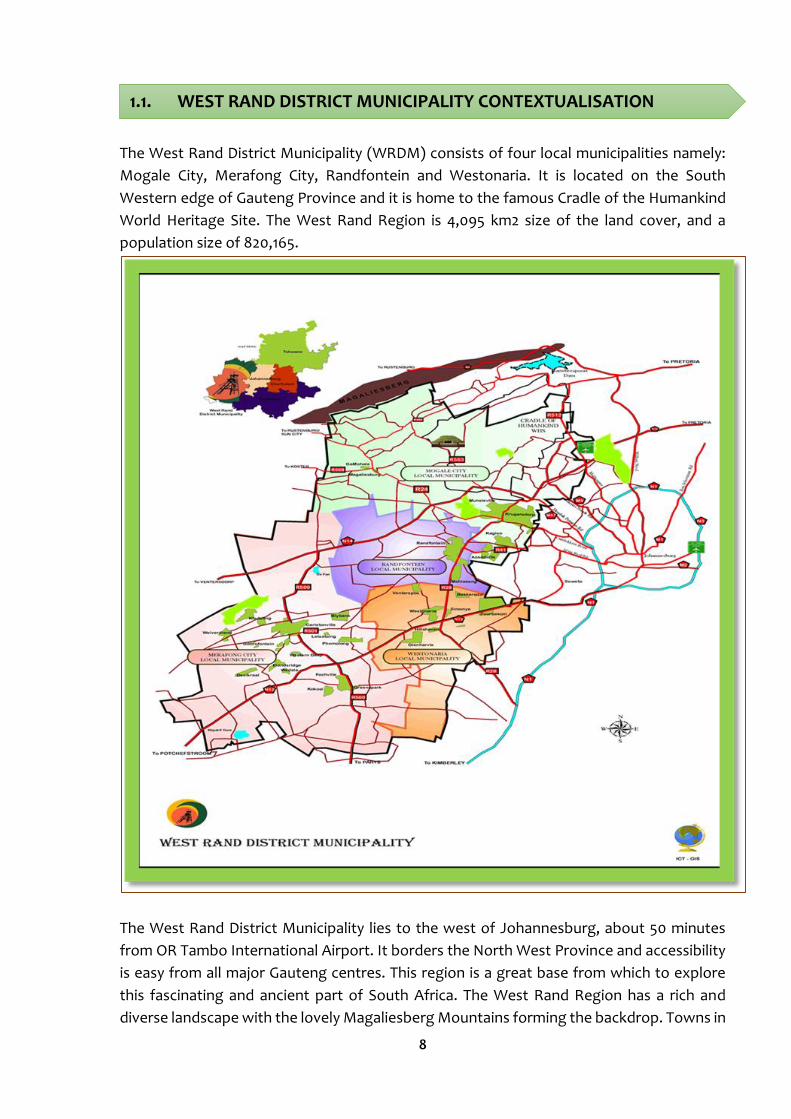
The West Rand District Municipality (WRDM) consists of four local municipalities namely:
Mogale City, Merafong City, Randfontein and Westonaria. It is located on the South
Western edge of Gauteng Province and it is home to the famous Cradle of the Humankind
World Heritage Site. The West Rand Region is 4,095 km2 size of the land cover, and a
population size of 820,165.
The West Rand District Municipality lies to the west of Johannesburg, about 50 minutes
from OR Tambo International Airport. It borders the North West Province and accessibility
is easy from all major Gauteng centres. This region is a great base from which to explore
this fascinating and ancient part of South Africa. The West Rand Region has a rich and
diverse landscape with the lovely Magaliesberg Mountains forming the backdrop. Towns in
1.1. WEST RAND DISTRICT MUNICIPALITY CONTEXTUALISATION
9
the region include Krugersdorp, Randfontein; Westonaria and Carletonville. Each of these
is in easy reach of the peaceful countryside well known for its warm hospitality.
There is a wonderful selection of things to do in this area, such as game drives, hiking and
mountain biking trails, horse-riding and visiting art galleries. Two tourist routes, the
Magalies Meander and Crocodile Ramble, provide excellent day trips from Johannesburg
and Pretoria. The area is also world-renowned for its rich archaeological and anthropology
sites. The highlight of these is the Cradle of Humankind, which is home to the Sterkfontein
Caves and the Maropeng Visitors‟ Centre, which has been developed in Kromdraai, an area
so rich in anthropology that it has been declared a Unesco World Heritage Site. It is here
where evidence of the ancient hominid habitation has been documented, stretching back
over two million years.
Another great attraction in the West Rand is the world’s deepest mining shaft, plunging to
3.6 kilometers into the earth. Gold and uranium mining are major economic contributors in
the District, and old mine tailings are reprocessed using modern technology. The District is
focused on attracting downstream mining industries like refining and beneficiation. The
West Rand District Municipality contributes the most of all the district municipalities
(excluding metropolitan municipalities) in Gauteng to the Province’s economy in terms of
sectors. The District Municipality contributes over R15 billion. Its economy is driven by
manufacturing, community services, mining and trade and finance.
The West Rand District Municipality has consistently enjoyed comparative advantages in
the following sectors:
Mining (Westonaria, Merafong City and Randfontein);
Manufacturing (Mogale City and Randfontein); and
Construction (Randfontein and Mogale City)
In terms of the location quotient, mining appears to be the leading sector but has been
experiencing a steady decline since 2005. Mining in Westonaria and Merafong City
dominates in terms of sector contribution, but mining will not be sustainable in the future
and thus the economy for Westonaria and Merafong City needs to be diversified. The area
is endowed with abundant pockets of land with medium to high agricultural potential as
well as favourable climatic conditions. The District also forms part of the Maize Triangle and
consequently the Gauteng Provincial Government is reinforcing this strength by investing
in the area as part of the roll-out of Agricultural Hubs.
Proximity to Lanseria International Airport increases the area’s neighbouring African
countries and international profiles, and creates a number of opportunities in terms of
manufacturing, agro-processing and distribution. The West Rand municipal area is serviced
by National, Provincial and Local roads. The N12 and N14 are the two National roads that
cross the district in a west to north eastern direction. These routes generally provide good
regional access between the WRDM and Johannesburg to the east, Pretoria to the north
10
and the North-West Province to the north-west. Movement linkages are essential as they
increase a region’s connectivity and access to economic and learning opportunities.
The district is well serviced in terms of east-west regional linkages and these directly link
the West Rand to the northern and central Gauteng economic powerhouses to its east and
the agricultural and mining zones of the North West Province to its west. On the other hand,
the north-south linkages centralise it between the Free State Province and the eastern parts
of the North West Province such as the Bojanala Local Municipality. Taxis dominate the
public transport operations in the District. Bus transport in the district is very limited with
no subsidised commuter services, apart from contracted learner transport services that are
provided in the predominantly rural area. A lot of people commute to Mogale City,
Merafong City and Randfontein within the region as these are main towns where economic
activity happens. Outside the region, the movement of people is mainly towards the City of
Johannesburg.
Commuter rail services operate in the West Rand and these connect the far western side of
the region (Merafong City) with the City of Johannesburg. There are training services
operating in Mogale City and Westonaria. The Lanseria airport node is an important
development for the entire region and could influence the development of the K29
corridor. The K29 road serves as a regional corridor between Johannesburg area and
Rustenburg area and also connects with the Platinum Toll Road as a spatial corridor. The
main developmental and commercial nodes within the West Rand municipal areas are in
Mogale City and Randfontein. Merafong City is comparatively a bigger node than
Westonaria, with both nodes mainly having mining as the anchor economic development
activity. Despite the developmental limitations faced by the individual municipalities in
varying degrees, due to among other things, prevalence of dolomitic conditions, the West
Rand region as a whole has the potential to attract development towards the western part
of Gauteng. This is a developmental opportunity emanating from the fact that the western
part of Gauteng still has pristine development areas that could still be exploited and
contribute towards the integration of the various municipal areas within the West Rand and
also with Tshwane in the North and City of Johannesburg in the East. The main business
districts and industrial areas are predominantly situated in Mogale City and Randfontein.
Though Merafong City and Westonaria have business districts and industrial areas, the main
anchor economic activity is mining.
The strategic location of the WRDM in relation to the Gauteng Province creates a huge
potential for the agriculture sector to grow and stimulate economic development in the
region. The advantage held by farmers within the West Rand is their close proximity to the
largest consumer market of perishable goods in South Africa (i.e. City of Tshwane and City
of Johannesburg), coupled with the fact that the region has areas with good to excellent
agricultural potential. Furthermore, the region possesses the potential to develop agro-
processing within its borders, as the majority of required resources are available. Mining is
still a very important economic sector in the West Rand, both in terms of production and
employment and its influence in the economy of the West Rand is still to be felt for many

11
years to come. Therefore it’s critical that the mining sector be used as a catalyst for
developing other economic activities within the region.
12
Note: The statistical data used during the compilation of this report was sourced from
different sources and therefore, some information is subject to revision.
THE WEST RAND REGION PROFILE
The Birthplace of Mankind
According to Forbes, South Africa is considered one of the “ultimate bucket list countries
to visit”. (http://www.forbes.com/sites/larryolmsted/2013/03/18/ultimate-bucket-list-trip-
south-africa/). Several tourists, academics, scholars and scientists visit South Africa for the
sole purpose of visiting the Caves and the Cradle of Humankind. The West Rand, City of
Human Origin in Mogale City, is privileged to be the home of the 2.2 million year old skull of
Mrs. Ples, found at the Sterkfontein Caves in the Cradle of Humankind – a UNESCO World
Heritage Site.
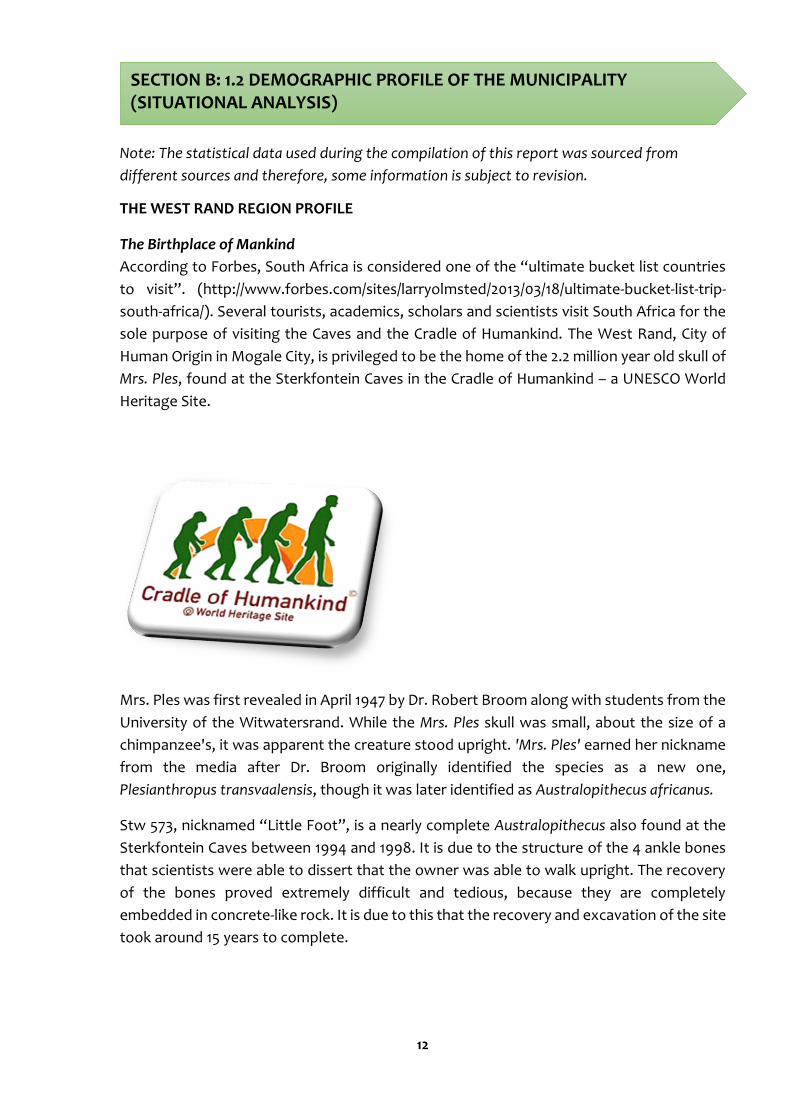
Mrs. Ples was first revealed in April 1947 by Dr. Robert Broom along with students from the
University of the Witwatersrand. While the Mrs. Ples skull was small, about the size of a
chimpanzee's, it was apparent the creature stood upright. 'Mrs. Ples' earned her nickname
from the media after Dr. Broom originally identified the species as a new one,
Plesianthropus transvaalensis, though it was later identified as Australopithecus africanus.
Stw 573, nicknamed “Little Foot”, is a nearly complete Australopithecus also found at the
Sterkfontein Caves between 1994 and 1998. It is due to the structure of the 4 ankle bones
that scientists were able to dissert that the owner was able to walk upright. The recovery
of the bones proved extremely difficult and tedious, because they are completely
embedded in concrete-like rock. It is due to this that the recovery and excavation of the site
took around 15 years to complete.
SECTION B: 1.2 DEMOGRAPHIC PROFILE OF THE MUNICIPALITY (SITUATIONAL ANALYSIS)
13
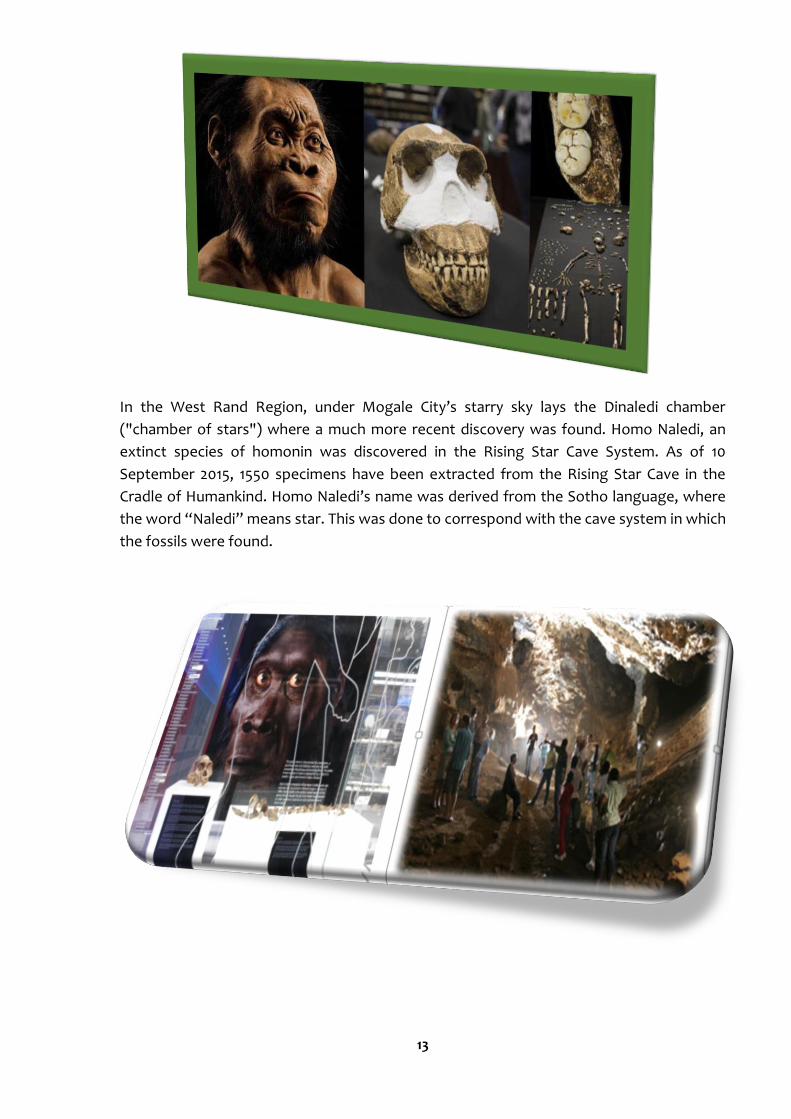
In the West Rand Region, under Mogale City’s starry sky lays the Dinaledi chamber
("chamber of stars") where a much more recent discovery was found. Homo Naledi, an
extinct species of homonin was discovered in the Rising Star Cave System. As of 10
September 2015, 1550 specimens have been extracted from the Rising Star Cave in the
Cradle of Humankind. Homo Naledi’s name was derived from the Sotho language, where
the word “Naledi” means star. This was done to correspond with the cave system in which
the fossils were found.
14
1.2.1. POPULATION PROFILE
This section looks at the population profiles of the West Rand’s district municipalities.
Table 1.1: Population by Population Group, Districts, 2012
Source: IHS Global Insight, 2013
Table 1.1 shows the district populations by population group in 2012, the Black population
group made up the largest proportion in West Rand at 654,998 persons (79.9 percent). The
White population group was the second largest at 135,209 persons (16.5 percent) in West
Rand. The Coloured and Asian population groups were the third and fourth largest groups
in the West Rand at 20,781 persons (2.5 percent) and 9,177 persons (1.1 percent) respectively
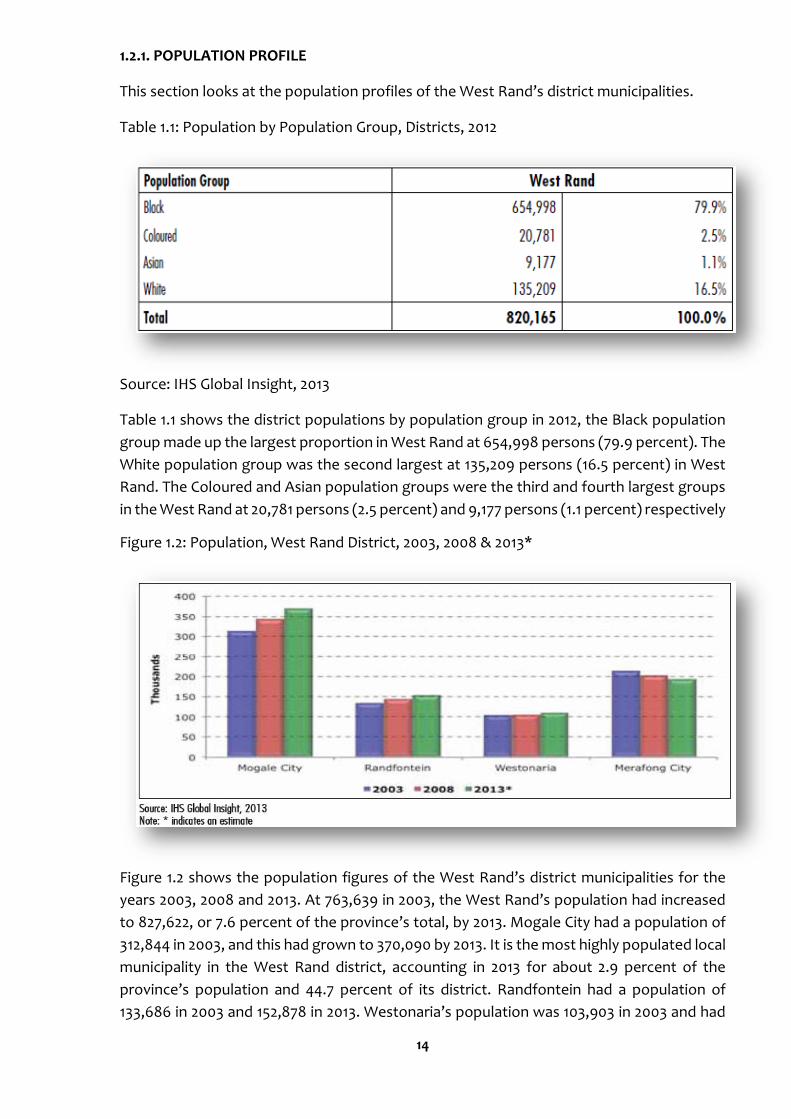
Figure 1.2: Population, West Rand District, 2003, 2008 & 2013*
Figure 1.2 shows the population figures of the West Rand’s district municipalities for the
years 2003, 2008 and 2013. At 763,639 in 2003, the West Rand’s population had increased
to 827,622, or 7.6 percent of the province’s total, by 2013. Mogale City had a population of
312,844 in 2003, and this had grown to 370,090 by 2013. It is the most highly populated local
municipality in the West Rand district, accounting in 2013 for about 2.9 percent of the
province’s population and 44.7 percent of its district. Randfontein had a population of
133,686 in 2003 and 152,878 in 2013. Westonaria’s population was 103,903 in 2003 and had
15
increased to 110,211 by 2013. Merafong City has the third largest population of the Gauteng
local municipalities. However, in contrast to almost all local municipalities in the province,
which had growth rates of between 0.6 and 4.8 percent between 2003 and 2013, it is the
only local municipality to have had a negative population growth rate over the period.
From 213,206 in 2003 it had decreased to 194,443 by 2013. It is probable that this drop in
population is related to Merafong City having the highest death rate of Gauteng’s local
municipalities, with the conditions that give rise to the persistently higher death rate likely
to encourage out-migration from and discourage in-migration to the municipality.
1.2.2 MORTALITY
This section looks at mortality and fertility in Gauteng’s local municipalities.
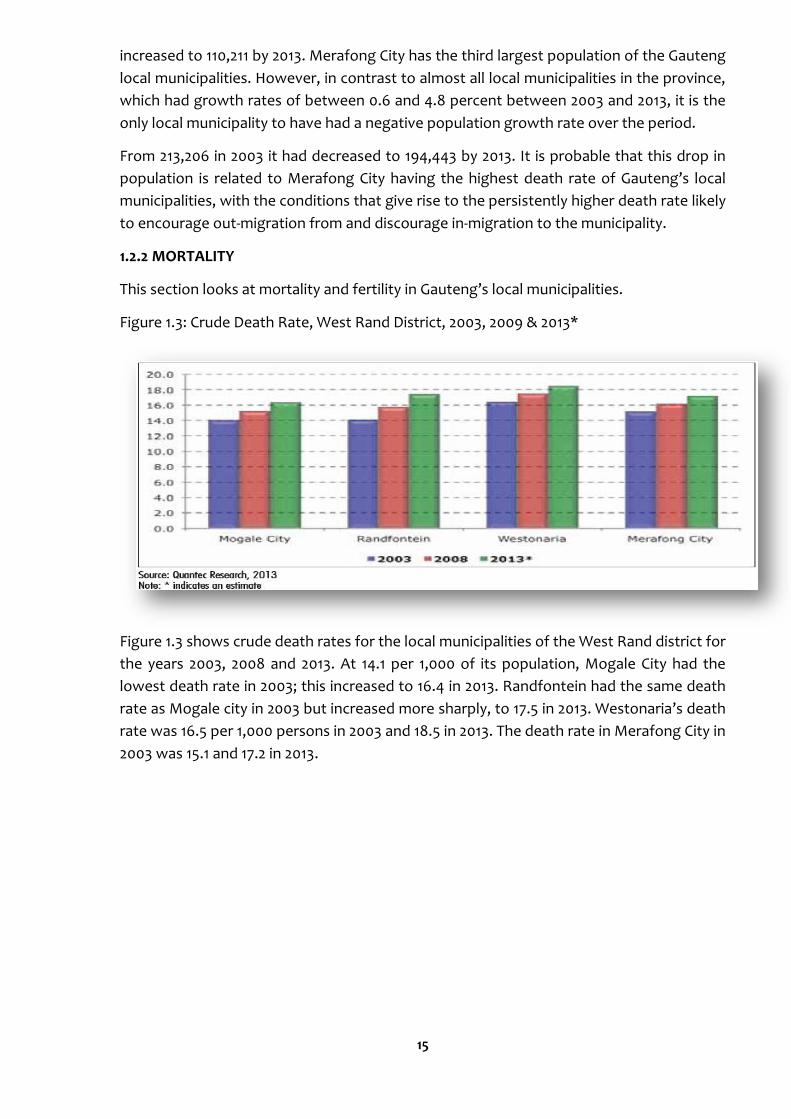
Figure 1.3: Crude Death Rate, West Rand District, 2003, 2009 & 2013*
Figure 1.3 shows crude death rates for the local municipalities of the West Rand district for
the years 2003, 2008 and 2013. At 14.1 per 1,000 of its population, Mogale City had the
lowest death rate in 2003; this increased to 16.4 in 2013. Randfontein had the same death
rate as Mogale city in 2003 but increased more sharply, to 17.5 in 2013. Westonaria’s death
rate was 16.5 per 1,000 persons in 2003 and 18.5 in 2013. The death rate in Merafong City in
2003 was 15.1 and 17.2 in 2013.
16
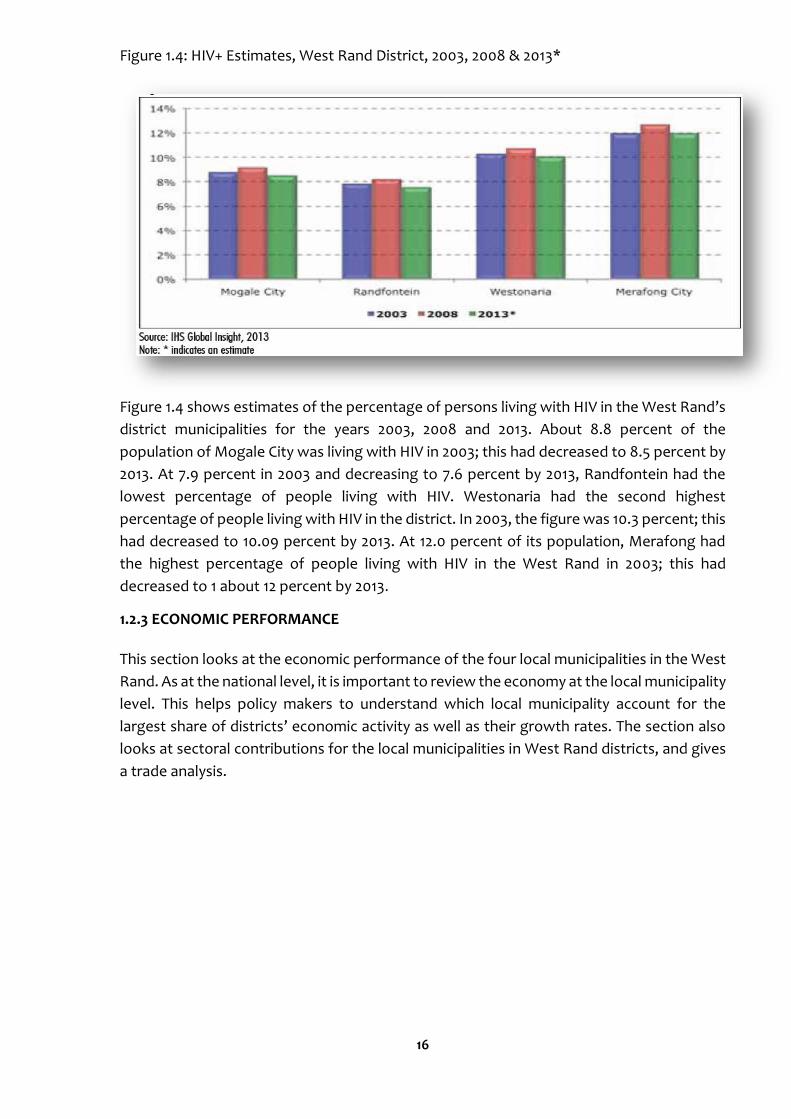
Figure 1.4: HIV+ Estimates, West Rand District, 2003, 2008 & 2013*
Figure 1.4 shows estimates of the percentage of persons living with HIV in the West Rand’s
district municipalities for the years 2003, 2008 and 2013. About 8.8 percent of the
population of Mogale City was living with HIV in 2003; this had decreased to 8.5 percent by
2013. At 7.9 percent in 2003 and decreasing to 7.6 percent by 2013, Randfontein had the
lowest percentage of people living with HIV. Westonaria had the second highest
percentage of people living with HIV in the district. In 2003, the figure was 10.3 percent; this
had decreased to 10.09 percent by 2013. At 12.0 percent of its population, Merafong had
the highest percentage of people living with HIV in the West Rand in 2003; this had
decreased to 1 about 12 percent by 2013.
1.2.3 ECONOMIC PERFORMANCE
This section looks at the economic performance of the four local municipalities in the West
Rand. As at the national level, it is important to review the economy at the local municipality
level. This helps policy makers to understand which local municipality account for the
largest share of districts’ economic activity as well as their growth rates. The section also
looks at sectoral contributions for the local municipalities in West Rand districts, and gives
a trade analysis.
17
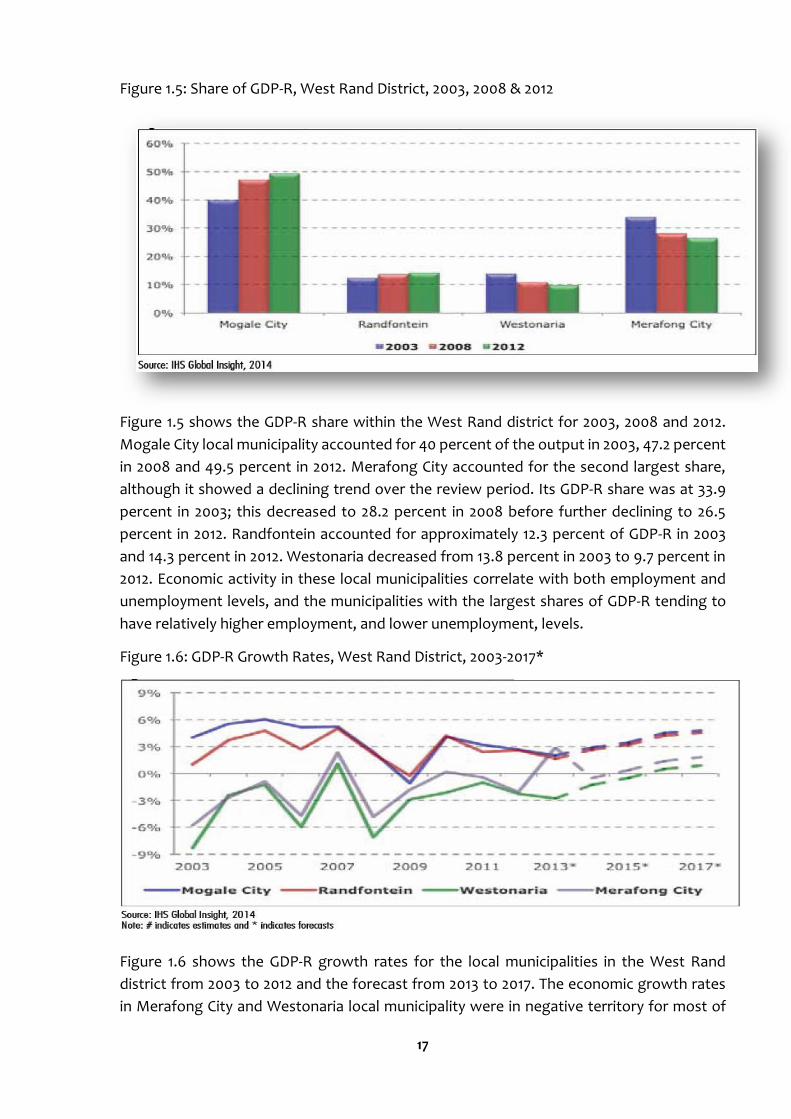
Figure 1.5: Share of GDP-R, West Rand District, 2003, 2008 & 2012
Figure 1.5 shows the GDP-R share within the West Rand district for 2003, 2008 and 2012.
Mogale City local municipality accounted for 40 percent of the output in 2003, 47.2 percent
in 2008 and 49.5 percent in 2012. Merafong City accounted for the second largest share,
although it showed a declining trend over the review period. Its GDP-R share was at 33.9
percent in 2003; this decreased to 28.2 percent in 2008 before further declining to 26.5
percent in 2012. Randfontein accounted for approximately 12.3 percent of GDP-R in 2003
and 14.3 percent in 2012. Westonaria decreased from 13.8 percent in 2003 to 9.7 percent in
2012. Economic activity in these local municipalities correlate with both employment and
unemployment levels, and the municipalities with the largest shares of GDP-R tending to
have relatively higher employment, and lower unemployment, levels.
Figure 1.6: GDP-R Growth Rates, West Rand District, 2003-2017*
Figure 1.6 shows the GDP-R growth rates for the local municipalities in the West Rand
district from 2003 to 2012 and the forecast from 2013 to 2017. The economic growth rates
in Merafong City and Westonaria local municipality were in negative territory for most of
18
the review period. Merafong City commenced the review period with a growth rate of
negative 5.8 percent. At negative 1.8 percent in 2009 and negative 2.1 percent in 2012, it is
forecast to return to positive territory by 2014 and to reach 1.9 percent in 2017. Westonaria
had a growth rate of negative 8.1 percent in 2003. In 2008, it was negative 7.1 and remained
negative in 2009 at 2.9 percent. It is forecast to reach positive 0.9 percent in 2017. Except
during the 2009 recession, Mogale City and Randfontein had positive growth rates. The
recent labour unrest in the mining industry is likely to affect economic growth in the West
Rand; it therefore remains fragile.
1.2.3.1 Sectoral Contributions
According to Fine (2011)25, when policymakers aim to affect growth in an economy it is
important that they choose sub-sectors with high multiplier effects and develop measures
to monitor them. Sectoral composition analysis provides a means of identifying the sub-
sectors which contribute most, and least, to economic growth.
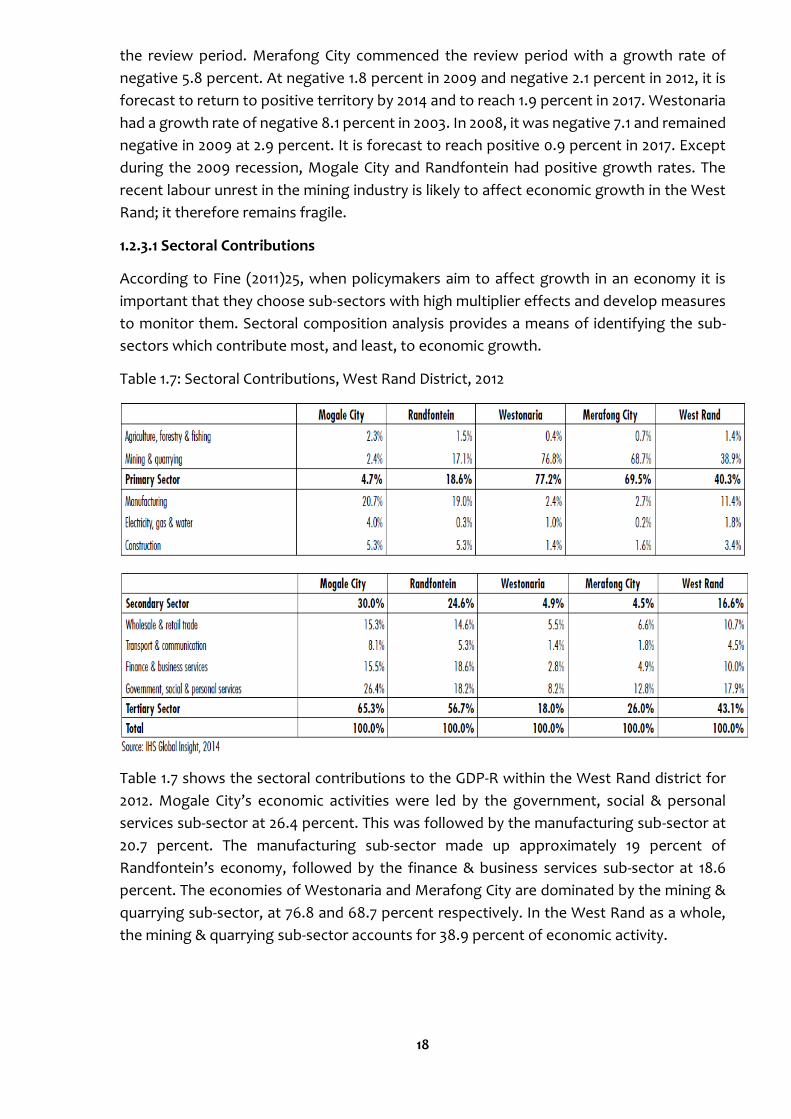
Table 1.7: Sectoral Contributions, West Rand District, 2012
Table 1.7 shows the sectoral contributions to the GDP-R within the West Rand district for
2012. Mogale City’s economic activities were led by the government, social & personal
services sub-sector at 26.4 percent. This was followed by the manufacturing sub-sector at
20.7 percent. The manufacturing sub-sector made up approximately 19 percent of
Randfontein’s economy, followed by the finance & business services sub-sector at 18.6
percent. The economies of Westonaria and Merafong City are dominated by the mining &
quarrying sub-sector, at 76.8 and 68.7 percent respectively. In the West Rand as a whole,
the mining & quarrying sub-sector accounts for 38.9 percent of economic activity.
19
1.2.3.2 TRADE POSITION
This section looks at the share of imports and exports for the four West Rand local
municipalities.
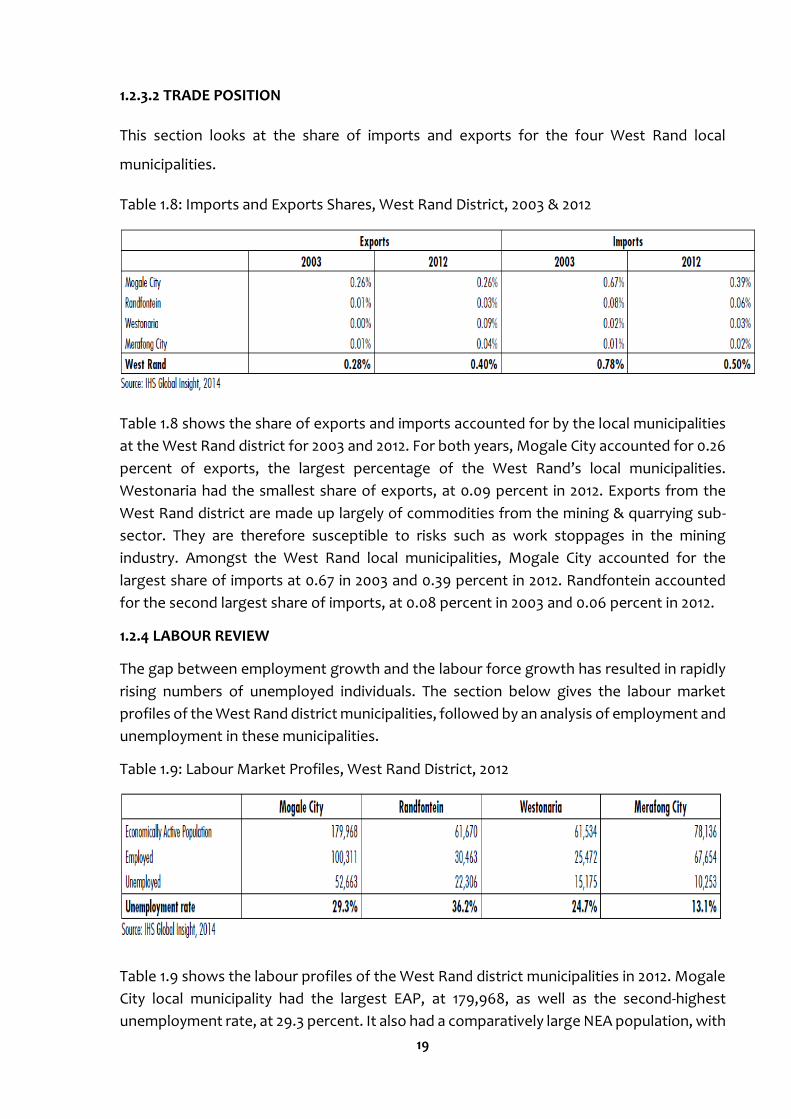
Table 1.8: Imports and Exports Shares, West Rand District, 2003 & 2012
Table 1.8 shows the share of exports and imports accounted for by the local municipalities
at the West Rand district for 2003 and 2012. For both years, Mogale City accounted for 0.26
percent of exports, the largest percentage of the West Rand’s local municipalities.
Westonaria had the smallest share of exports, at 0.09 percent in 2012. Exports from the
West Rand district are made up largely of commodities from the mining & quarrying sub-
sector. They are therefore susceptible to risks such as work stoppages in the mining
industry. Amongst the West Rand local municipalities, Mogale City accounted for the
largest share of imports at 0.67 in 2003 and 0.39 percent in 2012. Randfontein accounted
for the second largest share of imports, at 0.08 percent in 2003 and 0.06 percent in 2012.
1.2.4 LABOUR REVIEW
The gap between employment growth and the labour force growth has resulted in rapidly
rising numbers of unemployed individuals. The section below gives the labour market
profiles of the West Rand district municipalities, followed by an analysis of employment and
unemployment in these municipalities.
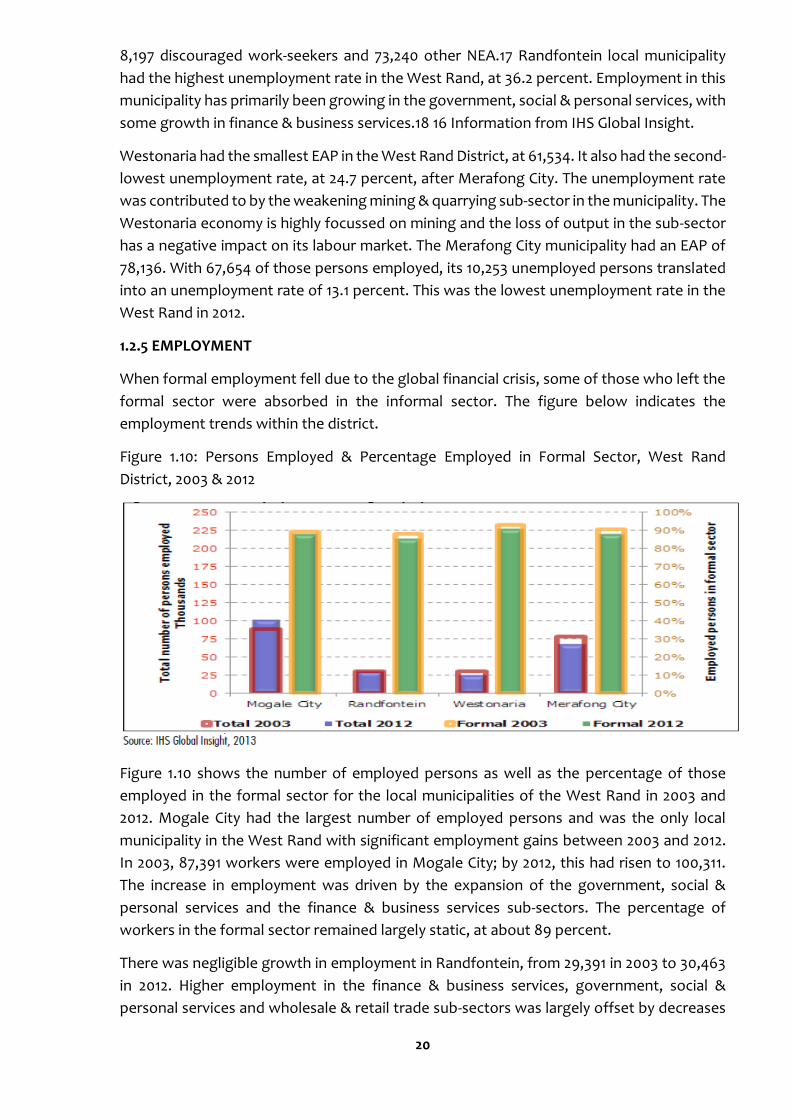
Table 1.9: Labour Market Profiles, West Rand District, 2012
Table 1.9 shows the labour profiles of the West Rand district municipalities in 2012. Mogale
City local municipality had the largest EAP, at 179,968, as well as the second-highest
unemployment rate, at 29.3 percent. It also had a comparatively large NEA population, with
20
8,197 discouraged work-seekers and 73,240 other NEA.17 Randfontein local municipality
had the highest unemployment rate in the West Rand, at 36.2 percent. Employment in this
municipality has primarily been growing in the government, social & personal services, with
some growth in finance & business services.18 16 Information from IHS Global Insight.
Westonaria had the smallest EAP in the West Rand District, at 61,534. It also had the second-
lowest unemployment rate, at 24.7 percent, after Merafong City. The unemployment rate
was contributed to by the weakening mining & quarrying sub-sector in the municipality. The
Westonaria economy is highly focussed on mining and the loss of output in the sub-sector
has a negative impact on its labour market. The Merafong City municipality had an EAP of
78,136. With 67,654 of those persons employed, its 10,253 unemployed persons translated
into an unemployment rate of 13.1 percent. This was the lowest unemployment rate in the
West Rand in 2012.
1.2.5 EMPLOYMENT
When formal employment fell due to the global financial crisis, some of those who left the
formal sector were absorbed in the informal sector. The figure below indicates the
employment trends within the district.
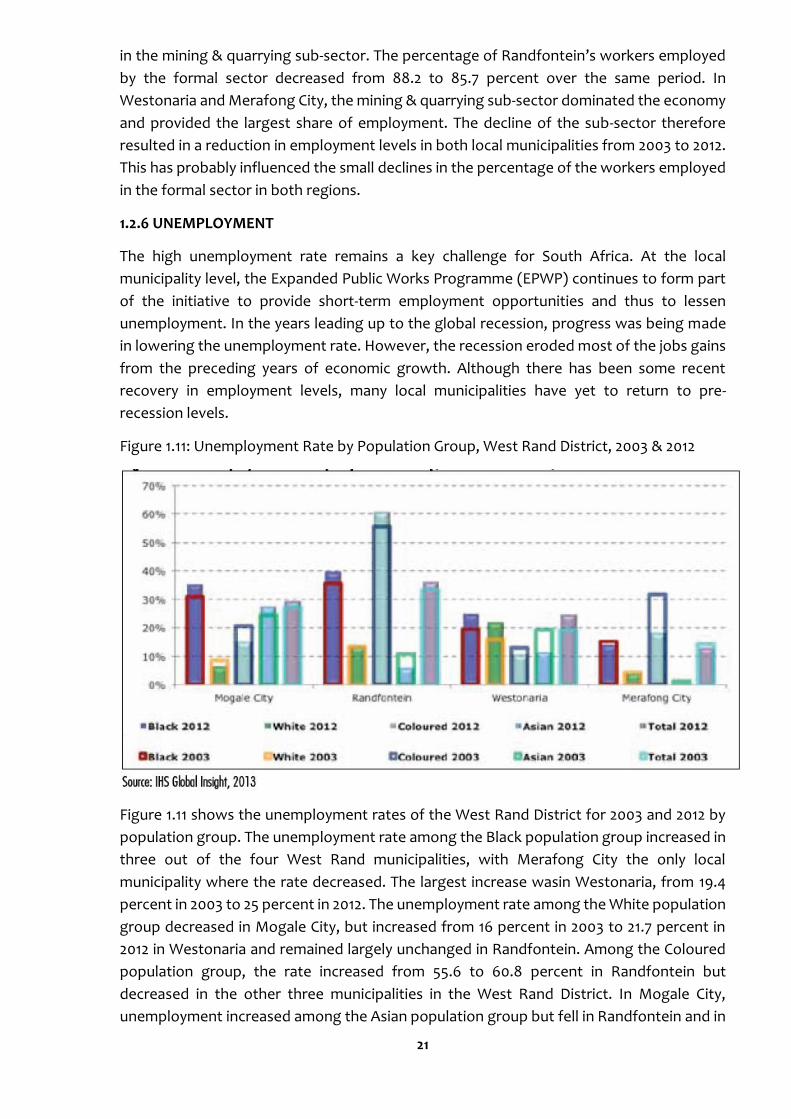
Figure 1.10: Persons Employed & Percentage Employed in Formal Sector, West Rand
District, 2003 & 2012
Figure 1.10 shows the number of employed persons as well as the percentage of those
employed in the formal sector for the local municipalities of the West Rand in 2003 and
2012. Mogale City had the largest number of employed persons and was the only local
municipality in the West Rand with significant employment gains between 2003 and 2012.
In 2003, 87,391 workers were employed in Mogale City; by 2012, this had risen to 100,311.
The increase in employment was driven by the expansion of the government, social &
personal services and the finance & business services sub-sectors. The percentage of
workers in the formal sector remained largely static, at about 89 percent.
There was negligible growth in employment in Randfontein, from 29,391 in 2003 to 30,463
in 2012. Higher employment in the finance & business services, government, social &
personal services and wholesale & retail trade sub-sectors was largely offset by decreases
21
in the mining & quarrying sub-sector. The percentage of Randfontein’s workers employed
by the formal sector decreased from 88.2 to 85.7 percent over the same period. In
Westonaria and Merafong City, the mining & quarrying sub-sector dominated the economy
and provided the largest share of employment. The decline of the sub-sector therefore
resulted in a reduction in employment levels in both local municipalities from 2003 to 2012.
This has probably influenced the small declines in the percentage of the workers employed
in the formal sector in both regions.
1.2.6 UNEMPLOYMENT
The high unemployment rate remains a key challenge for South Africa. At the local
municipality level, the Expanded Public Works Programme (EPWP) continues to form part
of the initiative to provide short-term employment opportunities and thus to lessen
unemployment. In the years leading up to the global recession, progress was being made
in lowering the unemployment rate. However, the recession eroded most of the jobs gains
from the preceding years of economic growth. Although there has been some recent
recovery in employment levels, many local municipalities have yet to return to pre-
recession levels.
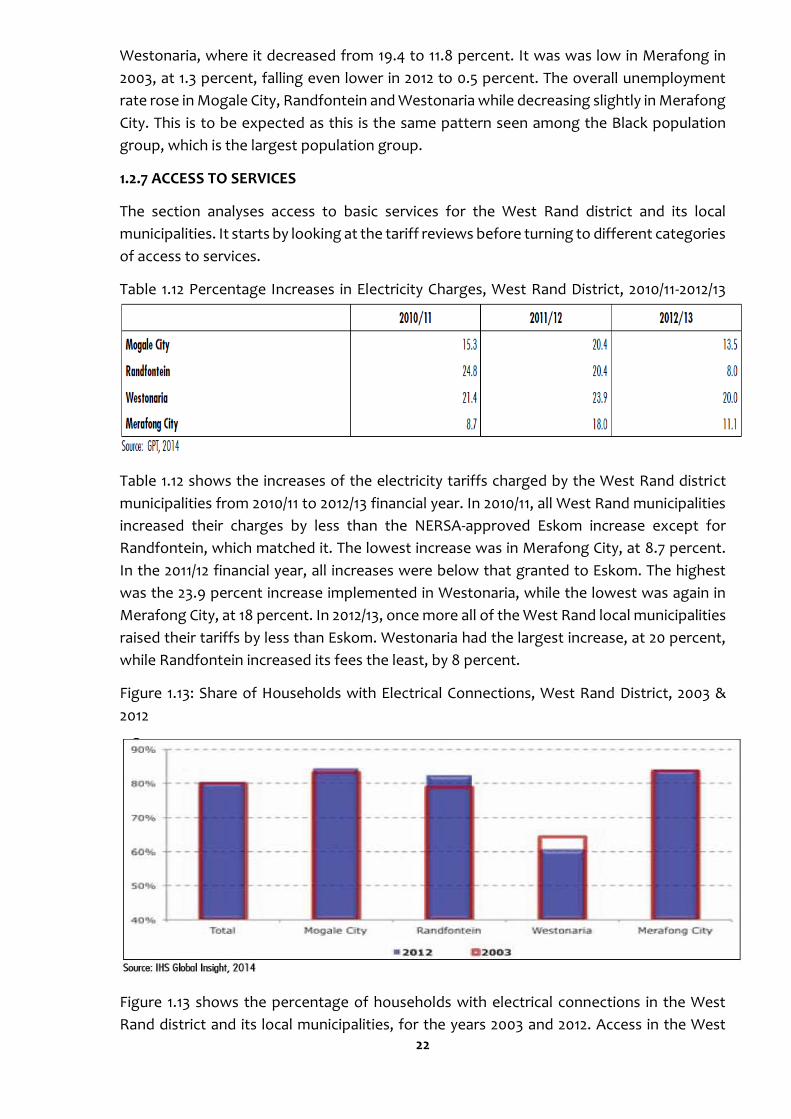
Figure 1.11: Unemployment Rate by Population Group, West Rand District, 2003 & 2012
Figure 1.11 shows the unemployment rates of the West Rand District for 2003 and 2012 by
population group. The unemployment rate among the Black population group increased in
three out of the four West Rand municipalities, with Merafong City the only local
municipality where the rate decreased. The largest increase wasin Westonaria, from 19.4
percent in 2003 to 25 percent in 2012. The unemployment rate among the White population
group decreased in Mogale City, but increased from 16 percent in 2003 to 21.7 percent in
2012 in Westonaria and remained largely unchanged in Randfontein. Among the Coloured
population group, the rate increased from 55.6 to 60.8 percent in Randfontein but
decreased in the other three municipalities in the West Rand District. In Mogale City,
unemployment increased among the Asian population group but fell in Randfontein and in
22
Westonaria, where it decreased from 19.4 to 11.8 percent. It was was low in Merafong in
2003, at 1.3 percent, falling even lower in 2012 to 0.5 percent. The overall unemployment
rate rose in Mogale City, Randfontein and Westonaria while decreasing slightly in Merafong
City. This is to be expected as this is the same pattern seen among the Black population
group, which is the largest population group.
1.2.7 ACCESS TO SERVICES
The section analyses access to basic services for the West Rand district and its local
municipalities. It starts by looking at the tariff reviews before turning to different categories
of access to services.
Table 1.12 Percentage Increases in Electricity Charges, West Rand District, 2010/11-2012/13
Table 1.12 shows the increases of the electricity tariffs charged by the West Rand district
municipalities from 2010/11 to 2012/13 financial year. In 2010/11, all West Rand municipalities
increased their charges by less than the NERSA-approved Eskom increase except for
Randfontein, which matched it. The lowest increase was in Merafong City, at 8.7 percent.
In the 2011/12 financial year, all increases were below that granted to Eskom. The highest
was the 23.9 percent increase implemented in Westonaria, while the lowest was again in
Merafong City, at 18 percent. In 2012/13, once more all of the West Rand local municipalities
raised their tariffs by less than Eskom. Westonaria had the largest increase, at 20 percent,
while Randfontein increased its fees the least, by 8 percent.
Figure 1.13: Share of Households with Electrical Connections, West Rand District, 2003 &
2012
Figure 1.13 shows the percentage of households with electrical connections in the West
Rand district and its local municipalities, for the years 2003 and 2012. Access in the West

23
Rand remained largely static, at 79.9 and 80.5 percent respectively. The level of household
access to electrical connections also remained relatively static in Mogale City and Merafong
City, at approximately 83 percent. A small increase, from 78.8 percent in 2003 to 82.4 in
2012, was recorded in Randfontein.
Over the same period, access in Westonaria fell from 64.4 to 60.6 percent. As shown in
Chapter One, this municipality has experienced population growth over the same period
and has increased the share of its population living in formal dwellings, as shown in Figure
4.20. It is possible that Westonaria households that do not have electricity connections live
in new informal settlements and areas that have only recently been formalised. If this is the
case, it could be expected that access to electricity will increase in the near future.
Figure 1.14: Share of Households in Formal Housing, West Rand District, 2003 & 2012
Figure 1.14 shows the share of households in the West Rand and its local municipalities living
in formal dwellings in 2003 and 2012. In 2003, 63.3 percent of West Rand households were
living in formal dwellings, with a relatively large percentage living in informal dwellings and
in the ‘Other’ category23 which includes dwellings such as caravans and tents. By 2012, the
share of households living in formal housing had increased to 70.9 percent.
While the share of those in informal dwellings had also risen slightly, the share in ‘Other’
dwellings was greatly reduced. Mogale City and Randfontein both recorded small increases
in their shares of households in formal dwellings. In 2012, 71.7 percent of Mogale City’s and
76.1 percent of Randfontein’s households resided in formal housing. While Westonaria had
the smallest share of its households in formal dwelling places, between 2003 and 2012 it
had the largest increase, from 28.5 percent to 55.7 percent.
24
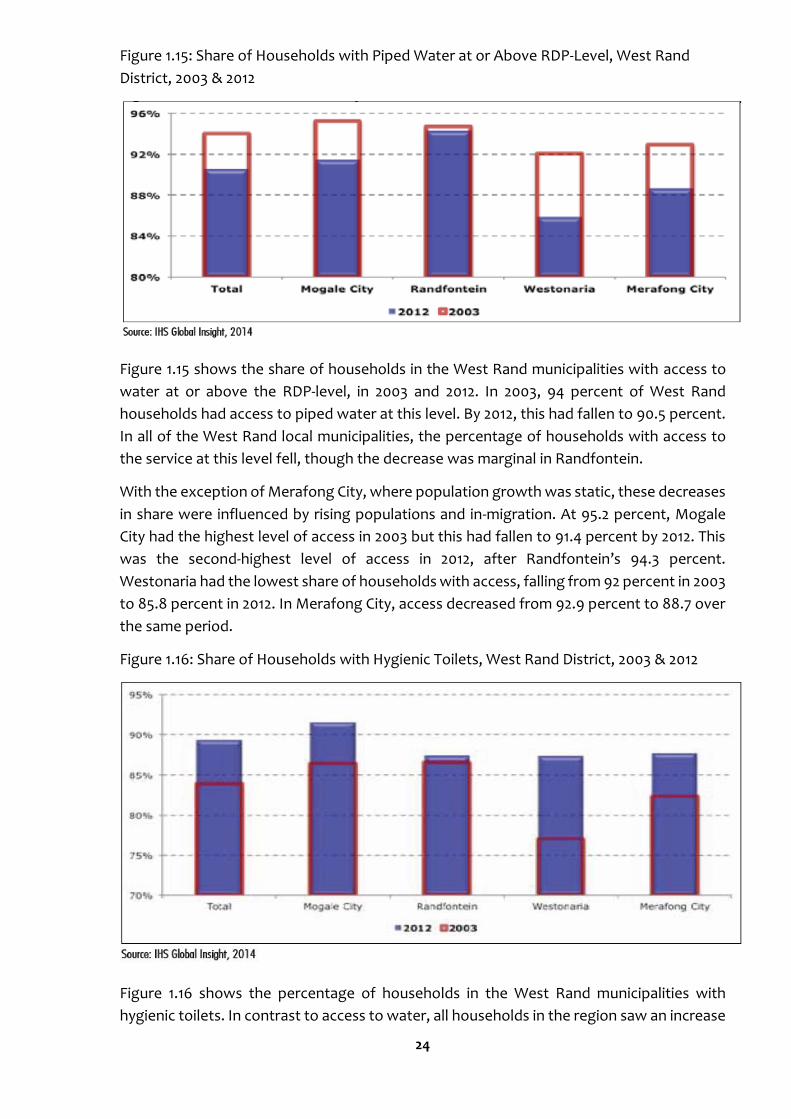
Figure 1.15: Share of Households with Piped Water at or Above RDP-Level, West Rand
District, 2003 & 2012
Figure 1.15 shows the share of households in the West Rand municipalities with access to
water at or above the RDP-level, in 2003 and 2012. In 2003, 94 percent of West Rand
households had access to piped water at this level. By 2012, this had fallen to 90.5 percent.
In all of the West Rand local municipalities, the percentage of households with access to
the service at this level fell, though the decrease was marginal in Randfontein.
With the exception of Merafong City, where population growth was static, these decreases
in share were influenced by rising populations and in-migration. At 95.2 percent, Mogale
City had the highest level of access in 2003 but this had fallen to 91.4 percent by 2012. This
was the second-highest level of access in 2012, after Randfontein’s 94.3 percent.
Westonaria had the lowest share of households with access, falling from 92 percent in 2003
to 85.8 percent in 2012. In Merafong City, access decreased from 92.9 percent to 88.7 over
the same period.
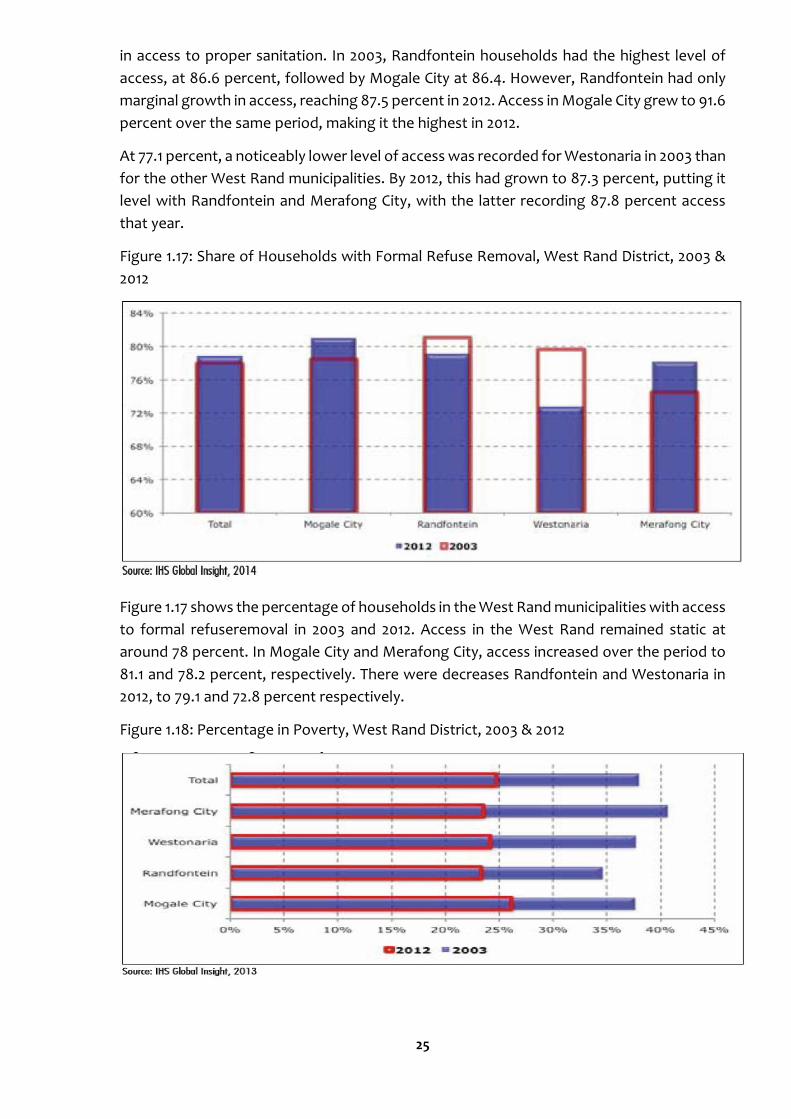
Figure 1.16: Share of Households with Hygienic Toilets, West Rand District, 2003 & 2012
Figure 1.16 shows the percentage of households in the West Rand municipalities with
hygienic toilets. In contrast to access to water, all households in the region saw an increase
25
in access to proper sanitation. In 2003, Randfontein households had the highest level of
access, at 86.6 percent, followed by Mogale City at 86.4. However, Randfontein had only
marginal growth in access, reaching 87.5 percent in 2012. Access in Mogale City grew to 91.6
percent over the same period, making it the highest in 2012.
At 77.1 percent, a noticeably lower level of access was recorded for Westonaria in 2003 than
for the other West Rand municipalities. By 2012, this had grown to 87.3 percent, putting it
level with Randfontein and Merafong City, with the latter recording 87.8 percent access
that year.
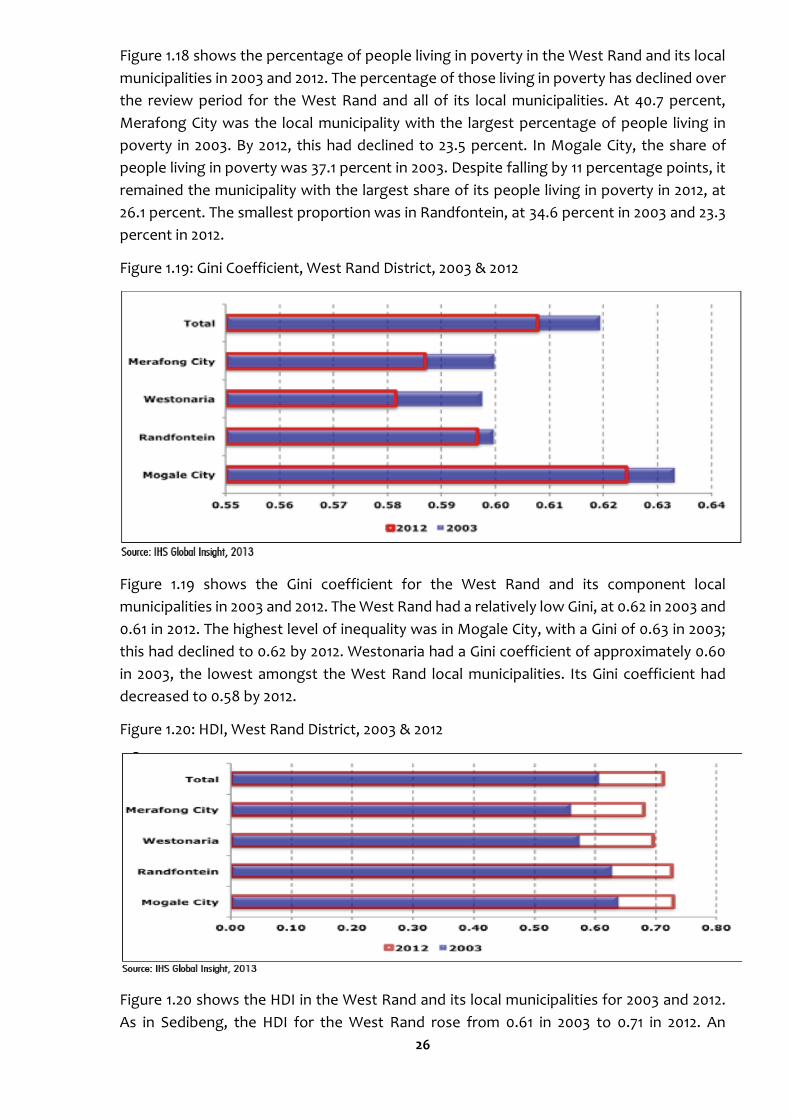
Figure 1.17: Share of Households with Formal Refuse Removal, West Rand District, 2003 &
2012
Figure 1.17 shows the percentage of households in the West Rand municipalities with access
to formal refuseremoval in 2003 and 2012. Access in the West Rand remained static at
around 78 percent. In Mogale City and Merafong City, access increased over the period to
81.1 and 78.2 percent, respectively. There were decreases Randfontein and Westonaria in
2012, to 79.1 and 72.8 percent respectively.
Figure 1.18: Percentage in Poverty, West Rand District, 2003 & 2012
26
Figure 1.18 shows the percentage of people living in poverty in the West Rand and its local
municipalities in 2003 and 2012. The percentage of those living in poverty has declined over
the review period for the West Rand and all of its local municipalities. At 40.7 percent,
Merafong City was the local municipality with the largest percentage of people living in
poverty in 2003. By 2012, this had declined to 23.5 percent. In Mogale City, the share of
people living in poverty was 37.1 percent in 2003. Despite falling by 11 percentage points, it
remained the municipality with the largest share of its people living in poverty in 2012, at
26.1 percent. The smallest proportion was in Randfontein, at 34.6 percent in 2003 and 23.3
percent in 2012.
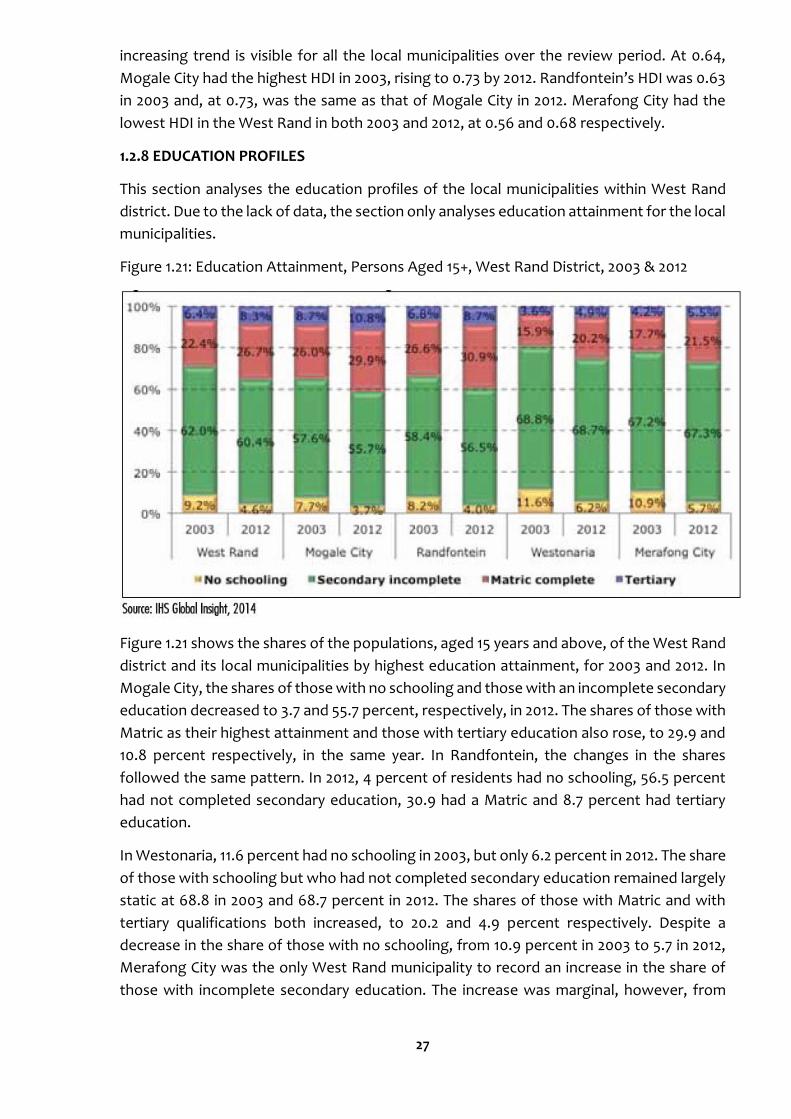
Figure 1.19: Gini Coefficient, West Rand District, 2003 & 2012
Figure 1.19 shows the Gini coefficient for the West Rand and its component local
municipalities in 2003 and 2012. The West Rand had a relatively low Gini, at 0.62 in 2003 and
0.61 in 2012. The highest level of inequality was in Mogale City, with a Gini of 0.63 in 2003;
this had declined to 0.62 by 2012. Westonaria had a Gini coefficient of approximately 0.60
in 2003, the lowest amongst the West Rand local municipalities. Its Gini coefficient had
decreased to 0.58 by 2012.
Figure 1.20: HDI, West Rand District, 2003 & 2012
Figure 1.20 shows the HDI in the West Rand and its local municipalities for 2003 and 2012.
As in Sedibeng, the HDI for the West Rand rose from 0.61 in 2003 to 0.71 in 2012. An
27
increasing trend is visible for all the local municipalities over the review period. At 0.64,
Mogale City had the highest HDI in 2003, rising to 0.73 by 2012. Randfontein’s HDI was 0.63
in 2003 and, at 0.73, was the same as that of Mogale City in 2012. Merafong City had the
lowest HDI in the West Rand in both 2003 and 2012, at 0.56 and 0.68 respectively.
1.2.8 EDUCATION PROFILES
This section analyses the education profiles of the local municipalities within West Rand
district. Due to the lack of data, the section only analyses education attainment for the local
municipalities.
Figure 1.21: Education Attainment, Persons Aged 15+, West Rand District, 2003 & 2012
Figure 1.21 shows the shares of the populations, aged 15 years and above, of the West Rand
district and its local municipalities by highest education attainment, for 2003 and 2012. In
Mogale City, the shares of those with no schooling and those with an incomplete secondary
education decreased to 3.7 and 55.7 percent, respectively, in 2012. The shares of those with
Matric as their highest attainment and those with tertiary education also rose, to 29.9 and
10.8 percent respectively, in the same year. In Randfontein, the changes in the shares
followed the same pattern. In 2012, 4 percent of residents had no schooling, 56.5 percent
had not completed secondary education, 30.9 had a Matric and 8.7 percent had tertiary
education.
In Westonaria, 11.6 percent had no schooling in 2003, but only 6.2 percent in 2012. The share
of those with schooling but who had not completed secondary education remained largely
static at 68.8 in 2003 and 68.7 percent in 2012. The shares of those with Matric and with
tertiary qualifications both increased, to 20.2 and 4.9 percent respectively. Despite a
decrease in the share of those with no schooling, from 10.9 percent in 2003 to 5.7 in 2012,
Merafong City was the only West Rand municipality to record an increase in the share of
those with incomplete secondary education. The increase was marginal, however, from

28
67.2 percent in 2003 to 67.3 by 2012. In that year, 21.5 percent of residents had a Matric and
5.5 percent had tertiary education.
29
Division of powers and functions between the WRDM and the Local Municipalities: Section
84(1) of the Municipal Structures Act states the following competencies of a district
municipality:
Integrated development planning;
Municipal roads and airports;
Municipal health services and firefighting services;
Establishment, conduct and control of fresh produce markets;
Promotion of local tourism;
Municipal public works relating to the above functions;
Receipt, allocation and, if applicable, the distribution of grants;
Regulation of passenger transport services
Imposition and collection of taxes, levies and duties;
Disaster Management; and
107 National Emergency Telephone Service.
The Minister for Local Government authorized the local municipalities to perform the
following district municipal functions:
Potable water;
Bulk supply of electricity; and
Domestic waste water and sewage disposal systems.
SECTION C: 1.3 POWERS AND FUNCTIONS OF THE MUNICIPALITY
30
1.4.1. IDP FRAMEWORK PLAN BACKGROUND
In terms of section 34 of the Municipal Systems Act, each district municipality must adopt
a framework for integrated development planning in the area as a whole, and it must be
agreed upon by both local municipalities and district municipality. The IDP framework is
therefore developed to ensure coordination and alignment in the whole IDP process by all
role players.
WHAT IS THE FRAMEWORK PLAN? The function of the Framework Plan is to ensure that
the process of the district IDP and local IDPs are mutually linked and can inform each other,
ensuring co-operative governance as contained in section 41 of the Constitution. The
Framework must:
a) Identify the plans and planning requirements binding in terms of national and
provincial legislation and identify those which were omitted in the past IDP process;
b) Identify the matters to be included in the district and local IDPs that require
alignment;
c) Specify the principles to be applied and co-ordinate the approach to be adopted;
d) Determine procedures for consultation between the district municipality and the
local municipalities;
e) Determine the procedures to effect amendments to the Framework Plan;
f) Incorporate comments from the MEC and those derived from self-assessments; and
g) Provide guidelines for the Performance Management System (PMS) and Integrated
Development Plan (IDP) implementation and communication plans.
Therefore the Framework Plan is a co-ordination tool for the WRDM to ensure that
interrelated parallel planning processes within the district are coordinated to obtain
maximum benefit for the district as a whole.
The IDP Framework Plan comprises the following:
Elements of the IDP;
Framework programme with time frames;
Mechanisms and procedures for alignment;
Mechanisms and procedures for consultation;
Binding plans and planning requirements at Provincial and National level; and
Procedures and principles for monitoring the planning process and amendment
LEGISLATIVE BACKGROUND
Constitution Act 108 of 1996 - the Constitution mandates that a municipality must
undertake developmentally-orientated planning so as to ensure that it:
a. strives to achieve the objectives of local government set out in section 152;
b. gives effect to its developmental duties as required by section 153;
SECTION D: 1.4 PROCESS FOLLOWED IN DEVELOPING THE IDP
31
c. together with other organs of state contributes to the progressive realization of
fundamental rights contained in sections 24, 25, 26, 27 and 29;
White Paper - “South Africa has been given a rare and historic opportunity to transform
local government to meet the challenges of the next century”. The White Paper establishes
the basis for a new developmental local government and characterizes it as a system, which
is committed to working with citizens, groups and communities to create sustainable
human settlements which provide for a decent quality of life and meet the social, economic
and material needs of communities in a holistic way.
To achieve developmental outcomes will require significant changes in the way local
government works. The White Paper further puts forward three interrelated approaches
which can assist municipalities to become more developmental:
Integrated development planning and budgeting;
Performance management; and
Working together with local citizens and partners.
Municipal Systems Act 32 of 2000 - the Municipal Systems Act (32 of 2000) is the key
legislation that gives direction and guidance on the development processes of the IDP.
Chapter five of the act details the process as follows:
Section 25(1) mandates that each municipal council must, upon election adopt a single,
inclusive and strategic plan which:
a. links, integrates and co-ordinates plans;
b. aligns the resources and capacity with the implementation of the plan;
Section 27 mandates the district municipality, in consultation with the local municipalities –
to adopt a framework for integrated development planning, which shall bind both the
district municipality and its local municipalities. On the basis of the agreed framework plan,
Section 28 mandates that each municipal council must adopt a process plan to guide the
planning, drafting and adoption and reviewing of its integrated development plan.
Local Government: Municipal Planning and Performance Management Regulations, 2001 –
The regulations were issued in 2001so as to develop further guidelines and clarity in the
issues of the IDPs, The Municipal Planning and Performance Management Regulations set
out in detail requirements for Integrated Development Plans.
Municipal Finance Management Act 56 of 2003 - the MFMA (56 of 2003) speaks about
promotion of cooperative governance and makes special emphasis on alignment of the IDP
and the Budget. This is enshrined in chapter 5 of the MFMA (Act 56 of 2003). Consequently,
the West Rand District Municipality, in pursuit of the above legislative directives, presented
the IDP framework to guide its process plans and consequently the IDP plans of both the
district itself and the local municipalities within the area of its jurisdiction.
IDP Process is undertaken in order to achieve the following:
32
- To inform other components of the municipal business process, including
institutional and financial planning and budgeting; and
- To inform the cyclical intergovernmental planning and budgeting cycles.
The IDP process will focus and be influenced by the following areas:
- Local Government MEC‟s comments;
- Improvement on the IDP/Budget Process based on the previous
performance;
- Amendments on the existing documents/newly adopted policies; and
- Adjustment of powers and functions.
As per legislative requirement, an adopted IDP is submitted to the MEC of Local
Government for comments. These comments will be incorporated during the review
process to influence the finalization of the process. However, it is necessary that they are
received on time to allow municipalities’ ample time to process and put them in effect.
In summing up the above, the outlined IDP Framework with timeframes, role players,
mechanisms of alignment and the binding legislations, ensures that the WRDM will table
the IDP and Budget on time. Compliance with the timeframes provided will allow enough
time to table the Draft IDP and Budget on or before March and take it to council for
approval on or before in May each financial year.
The way forward is for all municipalities to prepare Process Plans in concurrence with the
District Framework Plan and set out the following:
HOW the planning process will unfold per municipality;
WHAT actions are required;
WHO will be responsible for implementing these actions;
WHEN will the action have to be implemented; and
WHAT will the actions COST?
The achievement of an aligned IDP process depends on the co-operation of all
municipalities in order to achieve their developmental objectives in a spirit of co-operative
governance.
1.4.2. PUBLIC PARTICIPATION
The West Rand District Municipality prioritizes community engagement in the IDP
processes. In August 2015, the IDP Representative Forum meeting was held wherein the
IDP Review Framework was tabled for deliberation by stakeholders. Accordingly
presentations were offered to various stakeholders as part of the development of the IDP,
as outlined in the IDP Review Framework.
The IDP week was held in October to November 2015 wherein the various interactive
engagements were held through the various sector meetings. In these sessions the
performance for the 2014/15 and progress made thus far in 2015/16 was presented and also
33
deliberated by the various stakeholders. Furthermore these sessions served as a platform
for soliciting community input that is incorporated in the 2016/17 IDP process.
1.4.3. STRATEGIC PLANNING
The West Rand District Municipality (WRDM), embarked upon a four day Strategic Planning
Workshop to plan and design a roadmap for the next five year Municipal term of office
(Period 2016/17 – 2020/21). The Strategic Planning Workshop was held on the 14th to the 17th
of March 2016 at the Engedi Conference Centre in the West Rand.
This workshop was held as a follow up to previous planning sessions to enhance the
effectiveness and efficiency of the Municipality to improve Service Delivery. Hence the
workshop was planned, delivered and reported against a fitting Theme being ‘Service
Delivery through Integration, Coordination and Innovation’.
This report comprises the outputs of the various presentations and reflections / insights
from each presentation, the Planning Outputs from the various groups and outputs from
the Review Meeting held with the Mayoral Committee and a Roadmap on the next steps to
formalise the Plan, Development of the Annual Plan (SDBIP) and preparation of
Performance Agreements for the period 2016/17 2021.
The workshop commenced with the Municipal Manager Mr David Mokoena welcoming the
Mayoral Committee, external Representatives and delegates. Delegates were then
engaged on the approach, programme and basis of design for the workshop which was
based on an Approach of WHERE WE COME FROM? WHERE ARE WE AT THE MOMENT and
WHERE DO WANT TO GO?
WHERE WE COME - Was contextualised against the Planning Commission and the National
Development Plan. This provided an opportunity for reflection against our achievements as
a Nation over the past few years.
WHERE ARE WE NOW? Was contextualised against the Good to Great Programme to build
a robust Institutional framework to enable the Municipality to deliver its mandate and
improve service delivery.
WHERE WE WANT TO GO? Was contextualised against the 2016 State of the Nation Address
and the 2016 Budget Address.
Following the above context to the workshop, The Executive Mayor, The Honourable
Alderman Mpho Nawa formally opened the Strategy Workshop and outlined the aspiration
for the workshop and shared the State of the District.
Strategic inputs from key stakeholders dominated the first day of the workshop. Strategic
Inputs were obtained from Office of The Presidency, Office of the Premier (Gauteng),
34
COGTA National, COGTA Gauteng, SALGA Gauteng, Treasury Gauteng, Auditor General
Gauteng, West Rand Audit Committee, West Rand Performance Audit Committee, West
Rand Risk Management Committee and the Mining Houses.
Day Two opened with an analytical review of the various Strategic Inputs from the previous
day’s presentations. This session involved the groups analysing the various Strategic Input
from the following perspectives:
General reflections / insights from the respective presentations
Potential Challenges /Problems that the Municipality could face in the future
resulting from the presentations
New opportunities that could be presented to the Municipality
Implications for new Legislative / Impact Compliance for the Municipality
This session enabled the groups to foster a collaborative working spirit which sowed the
seeds for constructive and participative dialogue for the remaining duration of the
workshop.
The day concluded with each group defining a “Blue Sky” scenario planning for the next
fifteen years. The groups completed an initial brainstorm session and presented their initial
thoughts during a constructive and challenging plenary feedback session. This session
enabled groups to review their feedback and to then escalate the planning of their initial
brainstorm to a more results / impact oriented scenario which then set the scene for the
detailed planning for the next day.
Day three was a long day and was dictated by detailed planning around the fifteen year
results, definition of underpinning projects to achieve the results and definition of key
success criteria to achieve the projects. The plan included alignment to the Freedom
Charter, Local Government Mandate, National Outcomes, NDP, COGTA Performance
Indicators, Ten Pillars, Millennium Challenge Goals, Sustainable Development Goals and
Strategic Goals. Following a high level plenary review of the draft plan by each Department,
the groups then engaged around the completion of:
a SWOT analysis for the Municipality,
a Review of the Mandate for the Municipality,
a Review of Vision, Mission and Values for the Municipality,
Identification of Key Issues that need to be addressed in the short term
A Review of Organisational Structure as an immediate response to the cost
challenge
Day four involved the presentation of the Planning to the Mayoral Committee for initial
review. The Honourable Mayor, Alderman Mpho Nawa closed the workshop with an
acknowledgement and appreciation of the good work done to enable a future roadmap for
the Municipality.
35
1.4.3.1 STRATEGIC PLANNING INPUTS
The Strategic Inputs were planned into six Strategic Input Sessions as depicted below.
These sessions were aimed at the respective Organisations sharing their current
perspectives about their organisations and general trends and happenings that could have
a direct or indirect impact on the Municipality. These sessions were aimed at providing
inputs into the planning sessions by the respective Municipal Departments.
Summarised below are inputs from the actual presentations made during the respective
sessions:
STRATEGIC INPUT SESSION 1 This Session comprised presentations made by the Office of the Presidency and Office of
The Premier Gauteng.
Outlined below are some of the key highlights from their presentations:
Detailed presentations were distributed to the Municipal Departments at the end of the
session.
STRATEGIC INPUT
Local Government Management Improvement
Model (LGMIM)
Mr Ngaka Machete and Ms Ndilakazi Dinga
This presentation covered:
1. LGMIM Concept
2. LGMIM Journey
3. LGMIM Results Outlook
36
1. LGMIM Concept
LGMIM is a model / technique that is used to measure or benchmark the institutional
performance of municipalities across 6 Key Performance Areas: Integrated Planning
and Implementation, Service delivery, Human Resource Management, Financial
Management, Community Engagement and Governance. The model looks at the
Municipality from various angles at the same time, thus adopting a holistic approach to
institutional performance analysis. As required by legislation / regulation, it draws on
existing documents from various departments and oversight bodies as evidence and
secondary data to jointly arrive at an accurate and fair reflection of management
practices and workplace capabilities of the municipal leadership in a Municipality.
LGMIM does not include: assessment of policy and programme results, assessment of
actual deliverables against planned deliverables. These are the focus of the Auditor-
General’s performance audits. LGMIM is not a performance audit. LGMIM does not
duplicate existing legal, regulatory and prescribed best practices. It draws on these
together to formulate a single coherent framework.
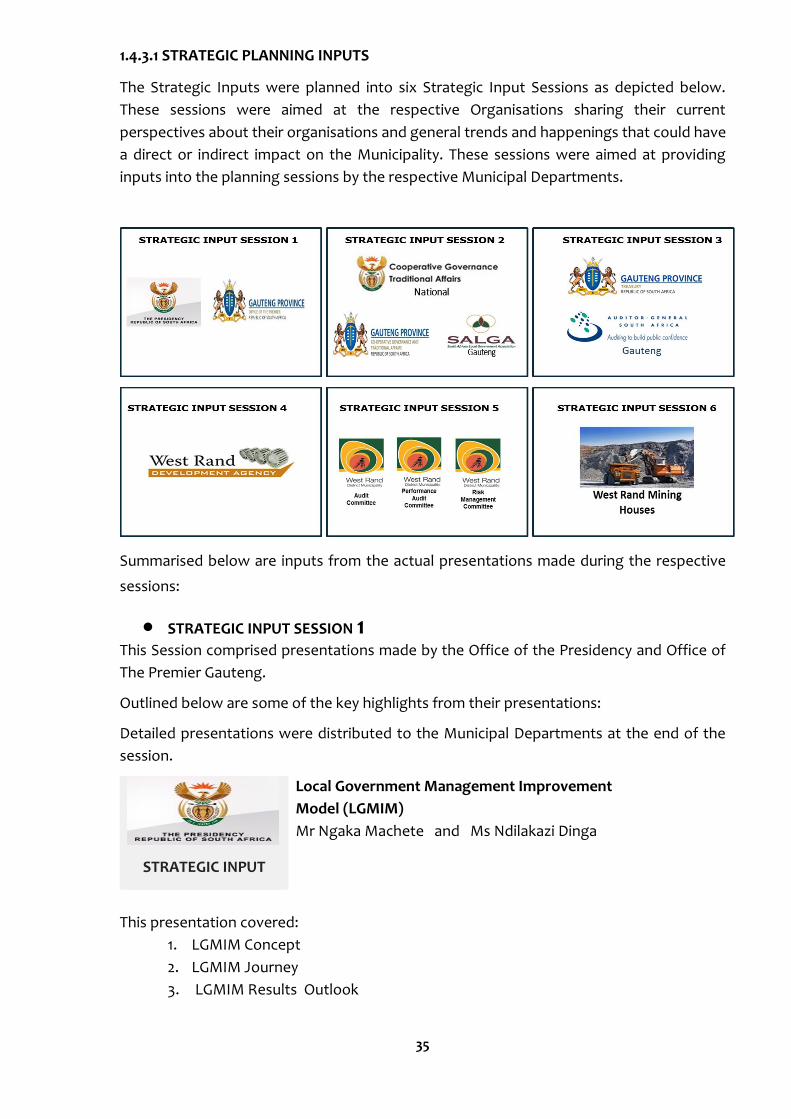
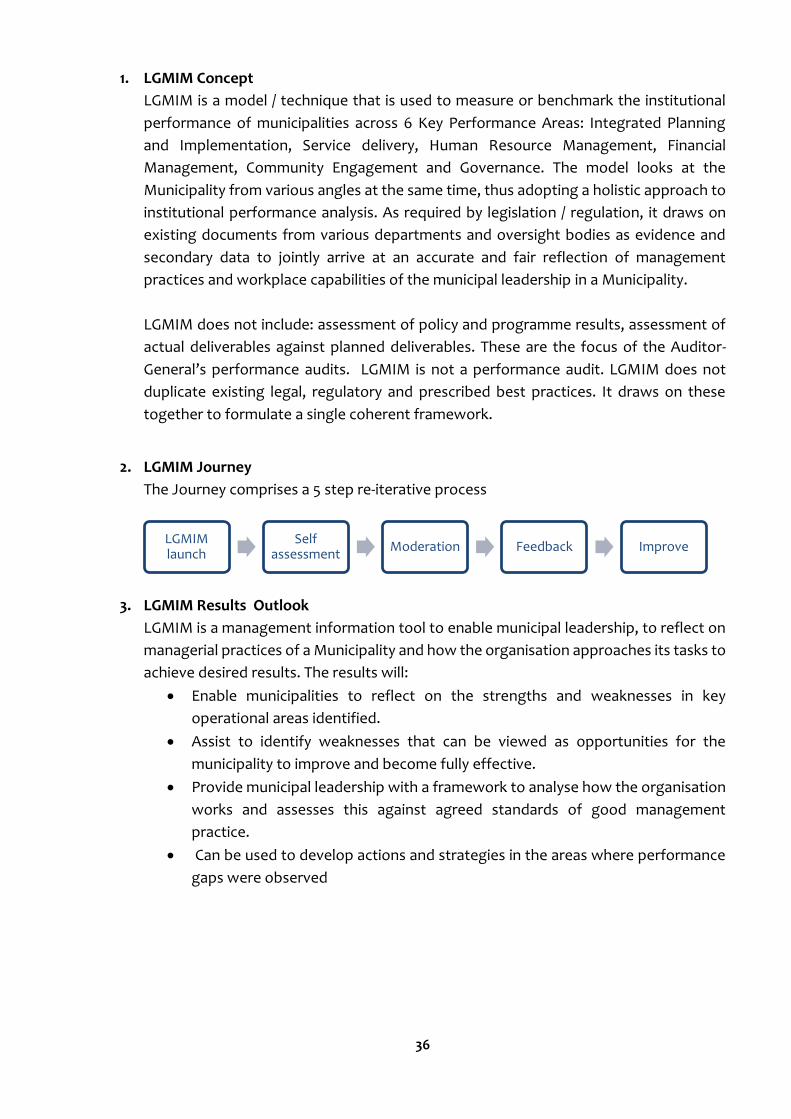
2. LGMIM Journey
The Journey comprises a 5 step re-iterative process
3. LGMIM Results Outlook
LGMIM is a management information tool to enable municipal leadership, to reflect on
managerial practices of a Municipality and how the organisation approaches its tasks to
achieve desired results. The results will:
Enable municipalities to reflect on the strengths and weaknesses in key
operational areas identified.
Assist to identify weaknesses that can be viewed as opportunities for the
municipality to improve and become fully effective.
Provide municipal leadership with a framework to analyse how the organisation
works and assesses this against agreed standards of good management
practice.
Can be used to develop actions and strategies in the areas where performance
gaps were observed
LGMIM launch
Self assessment
Moderation Feedback Improve
37
STRATEGIC INPUT
Transformation, Modernisation and Re-
Industrialisation (TMR), the role of WRDM in
delivery against TMR agenda
MS N Naicker
This presentation comprised:
1. Overview of South African Landscape
2. Overview of the Gauteng City Region
3. Gauteng’s Roadmap to Vision 2030
4. Initiatives to Improve Integrated Planning and
Delivery
5. Perspectives on Economic Development
6. Low Infrastructure Competitiveness
7. Five Corridors of Gauteng Region
8. West Rand Transformational Agenda
9. Western Corridor Vision
10. West Rand Corridor Infrastructure
11. Western Corridor Game Changer Projects
12. Western Corridor Strategic Projects
13. Western Corridor Access to Services
14. Western Corridor Municipal Expenditure
15. Western Corridor High Level Priorities
16. Western Corridor Future Plans
17. Western Corridor: Critical Gaps
1. Overview of South African Landscape
This comprised an overview of the South African landscape in terms of population, national
demographics trends, migration trends, ANC Manifesto and the NDP.
2. Overview of the Gauteng City Region
This overview covered Gauteng City Region in terms of the geographical, economical,
demographical, population, employment, income, social profile, human settlement,
household changes, spatial profile, transportation profile, and income inequality
landscape).
3. Gauteng’s Roadmap to Vision 2030
Gauteng’s Roadmap to Vision 2030 was adopted as a Ten-pillar programme of
Transformation, Modernisation and Re-industrialisation of the GCR comprising radical
economic transformation, Decisive Spatial Transformation, Accelerated Social
Transformation, Transformation of the State and Governance, Modernisation of the
Economy, Modernisation of the Public Service and the State, Modernisation of Human
Settlements and Urban Development, Modernisation of Public Transport and other
38
infrastructure, Re-industrialising Gauteng as our country’s economic hub, Taking a lead in
Africa’s new industrial revolution
4. Initiatives to Improve Integrated Planning and Delivery
Initiatives to improve integrated planning and delivery which comprised a Review of
Gauteng Spatial Development Framework (GSDF), Gauteng Integrated Infrastructure
Master Plan (GIIMP), Strengthening of Gauteng Infrastructure Financing Agency (GIFA) to
package projects for alternative financing (Vereeniging Market Precinct, Vaal Logistics Hub,
Sedibeng Waste to Energy etc.). The Gauteng Infrastructure Investment Conference was
held in July 2015 to pitch projects to the private sector and the establishment of GCR Game
Changers Programme.
5. Perspectives on Economic Development
The five big priorities that will grow the economy comprise of: advanced manufacturing,
infrastructure, natural gas, service exports and agricultural value chain and could create 3.4
million jobs but only 22% of the jobs created could employ entry level matriculants.
6. Low Infrastructure Competitiveness
Low Infrastructure Competitiveness is impacted by Availability and reliability of electricity
supply, Medium term water security concerns, Congested freight and logistics system with
high export costs, Sub-optimal levels of infrastructure maintenance, Comparatively slow
broadband speeds at high cost and low levels of access, Infrastructure inefficiency resulting
from spatial mismatch and Insufficient public transport coverage.
7. Five Corridors of Gauteng Region
Five Corridors of the Gauteng City Region comprising:
Tshwane: Administrative Capital. Will be hub of the automotive sector, research,
development, innovation & knowledge-based economy
West Rand: Focus on tourism, agriculture, agro-processing; Lanseria Airport City &
renewable energy industries
Johannesburg: Hub of finance, services, ICT & pharmaceutical industries
Ekhuruleni: Manufacturing, logistics & transport hub industries. Anchor of the
Aerotropolis of the GCR
Sedibeng: Vaal River City’s tourism potential, logistics, agro-processing and urban
agriculture
8. West Rand Transformational Agenda
West Rand Transformation Agenda which is working towards amalgamating all the
municipalities in the District into a single municipal system. Working towards shared
services in order to: - Create economies of scale, - Standardise systems and processes,
Enable best practice and cost saving technology and to create culture of continuous
improvement & cost reduction.
39
9. West Rand Vision
Western Corridor Vision comprises: Creation of new industries, new economic nodes and
new cities, focus on the green and blue economy initiatives, tourism, agro-processing and
logistics, Lanseria Airport and Maropeng World Heritage Site will be the main anchors of
the new city, Inclusion of communities that were previously excluded from services and
facilities through urban restructuring and consolidation, Functionally linking main growth
centres in the District to one another and to the regional economy of the GCR, Create a
more consolidated settlement structure to allow for cost-effective and sustainable
provision of infrastructure
10. West Rand Corridor Infrastructure
Western Corridor Infrastructure: New cities at Lanseria and Syferfontein , Logistics hub
along N12, 122 500 housing units in Mega Human Settlements, New Kagiso Industrial Park
to be based on Automotive Hub established by AIDC in Winterveld, Khutsong Industrial
Park to be further expanded and upgraded - TER
11. Western Corridor Game Changer Projects
Western Corridor Game Changer projects: Township Economy Revitalisation, Gauteng e-
Government, Zuurbekom Regional Sanitation Scheme, Lanseria integrated development /
Lion Park
12. Western Corridor Strategic Projects
Western Corridor Strategic Projects: Bus manufacturing plant, Green manufacturing hub,
Aquaculture, Water security, Energy security, Bus/BRT extensions, West Rand Logistics
Hub, Mega Human Settlements, Mining town regeneration
13. Western Corridor Access to Services
Western Corridor Access to Services: generally below Provincial average, Closure of mines
leading to services being cut-off to some communities (Blyvooruitzicht in Merafong),
Maintenance and refurbishment of old infrastructure requires more focus
14. Western Corridor Municipal Expenditure
Western Corridor - Municipal expenditure: R2.877 billion municipal capital budget over
MTEF, Only Mogale City showing substantial growth in capital spending, Revenue (low
economic growth) and MIG unable to meet needs of smaller municipalities
15. Western Corridor High Level Priorities
Western Corridor - High Level Priorities: 2011 – 2016: Contributing towards Green agenda
(becoming the Greenest Region in the Country), Undertaking the Building Blocks towards
the amalgamation of all the municipalities, Contributing towards the 12 National Outcomes,
Contributing towards the NDP, Resource Mobilisation, Implementation of the Shared
Services within the Region, Achieving Clean Audit by 2014 in the whole Region, Use the
Green Economy to grow the GDP of the West Rand, Create jobs to combat poverty and
dependence, Build a united and prosperous non-racial society, Commit to training and
40
skilling West Rand communities, Build better neighbourhoods throughout the District with
equitable access to municipal services
16. Western Corridor Future Plans
Western Corridor Future Plans: N12 upgrading to be completed 2016/2017 (currently 70%),
K11 (Mogale Western Bypass) at detailed design stage (completion 2017/18); Feasibility
being considered for public transport (bus) links to CoJ: Mogale City / Ruimsig, Randfontein
/ Roodepoort, Mohlakeng / Protea South; R605 million to be spent on education
infrastructure: 8 new schools and renovations and replacements of 13 schools, 131
additional classrooms (including 26 Grade R), 37 libraries and 61 laboratories; R866 million
for health infrastructure (including maintenance), 11 New facilities and full replacements,
Upgrades and additions to 6 facilities, Rehabilitation and refurbishment of 1 facility
17. Western Corridor - Critical Gaps
Western Corridor - Critical Gaps: Regional co-operation to develop Lanseria and
Syferfontein Precinct planning for Maropeng to unlock economic potential, Zuurbekom
WWTW (Syferfontein) – R1 billion Regional Bulk Infrastructure Grant (RBIG) from
Department of Water and Sanitation, Lindley WWTW (Lanseria) – feasibility underway by
GIFA, New water reservoir in Merafong for Kokosi – R100 million, Roads and storm water
for Khutsong resettlement – R775 million to address EIA conditions (dolomitic concerns),
Bulk electricity supply to Mohlakeng (630 completed houses without electricity with a
further 900 houses planned), Upgrading of ageing electrical infrastructure in Randfontein,
Future funding sources for Bekkersdal infrastructure upgrades.
STRATEGIC INPUT SESSION 2
This Session comprised a presentations made by the COGTA (National), COGTA Provincial
and SALGA:
STRATEGIC INPUT
COGTA National : Sectoral and Spatial convergence IDPs
Mr. Rabothata
This presentation covered:
1. Constitutional Imperative
2. Lagging and Declining Regions
3. District IDP’s that reflect Sectoral and Spatial Convergence
4. Prioritisation and Alignment
5. 2030 Vision
6. Logical Sectoral Planning and Integration Process
1. Constitutional Imperative
This presentation comprised DCOG’s approach on the support to District Municipalities to
develop IDPs that reflect sectorial and spatial convergence and comprised:
41
Contextualisation of the Constitution relative to three spheres of government and the need
for them to work in cohesion to deliver on their respective portfolios.
2. Lagging and Declining Regions
Challenges characterising lagging and declining regions, viz, Over-reliance on one economic
sector (e.g. mining), High unemployment often resulting from the decline of the dominant
economic sector, Limited economic diversification, Poor socio-economic conditions and
Deterioration of economic and household infrastructure.
3. District IDP’s that Reflect Sectoral and Spatial Convergence
• Integrated development is a function of “sectoral convergence”
• All three spheres are key role players, including government entities and SALGA.
• Sectoral and spatial convergence requires the development of overarching
development frameworks such as; long term growth and development strategies and
spatial development frameworks.
• These frameworks will articulate the outcomes that are to be persuaded and form the
basis of the development and implementation of sector specific plans.
• The Plans for District IDPS that reflect Sectoral and spatial convergence must
demonstrate: How the desired outcomes will be achieved?, What needs to be done?,
What will be required?, Which sphere / entity will be responsible? And What and when
should the implementation of specific elements in the plans take place?
4. Prioritisation and Alignment
Municipal Development Planning and IDP development processes must ensure that IDPs
respond to the following:
• Global or International Commitments (Sustainable Development Goals, Local
Agenda 21, Climate Response)
• Continental and Regional Commitments (NEPAD, Bilateral and Cooperation,
Agreements, Regional Treaties, Peer Reviews)
• National and Provincial Priorities and Commitments (National Priorities, NDP (Vision
2030), NSDP, New Growth Path, MTSF, MTEF, Provincial Priorities, PGDS (Ten point
Pillars).
5. 2030 Vision
2030 Vision: Provision off a decent life for all
• Direct Role of Local Government to plan and deliver: Water, Sanitation, Electricity,
Waste Management, Housing, Roads
• Indirect Role of local Government: To plan and guide the delivery of safety, health,
education and job creation.
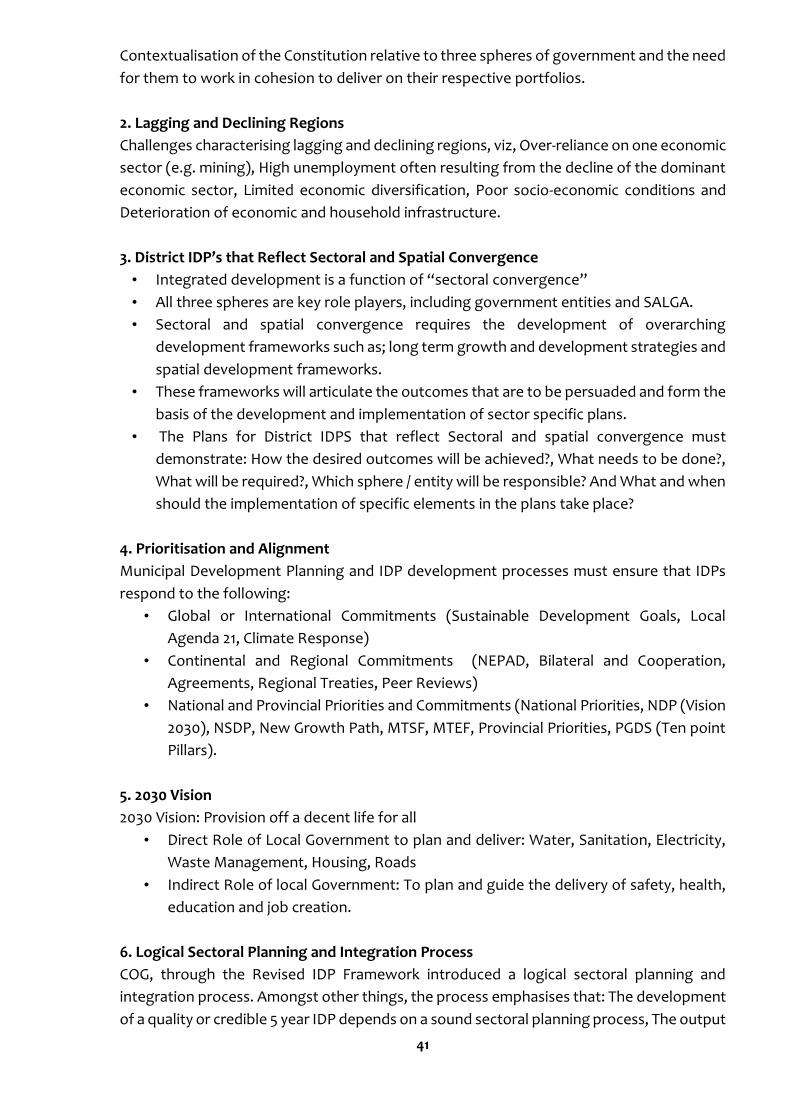
6. Logical Sectoral Planning and Integration Process
COG, through the Revised IDP Framework introduced a logical sectoral planning and
integration process. Amongst other things, the process emphasises that: The development
of a quality or credible 5 year IDP depends on a sound sectoral planning process, The output
42
of this process is the cornerstone of the 5 year IDP, The strategies, programmes and plans
contained in these sector plans must be integrated in the IDP, therefore, it is important to
follow a particular logic when developing sector plans and understand their relationship
(science of integration) as illustrated below:
Development planning processes should embrace the sectoral logic to ensure integration
and to enable municipalities to identify and demonstrate relationships between the various
plans which will result in coordinated implementation of programmes and projects that are
aligned and contribute to vision of the District Municipality
STRATEGIC INPUT
Overview on Back to Basics phases two (2), the relevance to Local Government Mr Nkoko
This presentation covered:
1. Context of Phase 1 Back to Basics
2. Lessons Learnt from Phase 1
3. Orientation for Phase 2 Back to Basics
4. The 10 Point Plan for Phase 2
5. Key Programmes for the West Rand
1. Context of Phase 1 Back to Basics
The context provided a status overview of Municipalities in the West Rand against the
Phase 1 Back to Basics Perspective of: Putting People and their Concerns first, Delivering
municipal services to the right quality and standards, good governance and sound
administration, sound financial management and accounting and building of Institutional
Administrative capabilities
43
2. Lessons Learnt from Phase 1
Key Questions from the Lessons of Phase to Back to Basics
• How do we move dysfunctional municipalities to the next level?
• How do we get municipalities to substantially improve their operations
on a wide scale?
• What are the root causes of dysfunctionality and poor service delivery at
municipal level?
• What exactly should national and provincial CoGTA and other partners do
to address the root causes?
• What is the smartest way of doing this?
• What capabilities, organisational structures, and work processes do
national and provincial CoGTA need to have in place to do this?
Socio Economic Context within which Back to Basics Phase 2 is rolled out:
• Economic decline and fiscal constraints.
• Rising unemployment.
• Increasing indebtedness of citizens (middle class and poor).
• Increasing debt owed to municipalities (government, business and
residents).
• Declining household income and increasing surcharges for basic services,
e.g. electricity.
• Low revenue base for municipalities and increasing demand for
maintenance.
• Drought, heatwave and shortage of water.
• Energy pressures and bulk water provision demands.
• Municipalities being at coalface of citizens experience of the above reality
3. Orientation for Phase 2 Back to Basics
• Improve performance and build effective system and resilient institutions of Local
Government - Work smarter and innovatively to increase impact
• Focus on 20% of actions that will deliver 80% of impact.
• Move dysfunctional municipalities to the next level; stop at-risk municipalities from
becoming dysfunctional; and maintain well performing municipalities at that level.
• Establish programmes to address generic systemic problems – e.g. weaknesses in
HRM, SCM, infrastructure procurement and financial management
• Mobilise multi-departmental teams to tackle municipalities at risks of dysfunctional
(mobilise national and provincial resources)
• Strengthen community engagement and local government accountability to
citizens through innovative platforms (e.g. social media, community radio).
• Continue and accelerate the hands-on approach.
• Prioritise and focus on campaign, programme and projects that have high visibility,
broader mobilisation, impactful on delivery and messaging of core B2B objectives in
the pre & post-election period.
• Use the available levers to incentivise and enforce good behaviour and practice.
44
• Strengthen communication and feedback on good stories and good progress on
B2B implementation.
4. The 10 Point Plan for the Next Phase
1. Positive Community Experiences
Develop ward based service delivery dashboard;
Community feedback mechanism; (sms community feedback system)
Implementation of ward improvement plans that addresses basic services, e.g.
cutting of grass, working street lights and robots, water leaks, etc.;
Improvement of complaints management systems and municipal frontline offices;
Use of Community Development Workers, Community Work Programme
participants and Ward Committee members into the implementation of B2B
programme
2. Municipalities Receiving Disclaimers over 5 Years
Prioritise and target municipalities receiving disclaimers for more
than 3 years;
Analysis of the AG management letters and Post Audit Action Plans of
municipalities;
Develop hands on programme to reverse this trend with clear and
achievable interventions based on issues consistently raised AG
management letters;
Mobilise and work with critical stakeholders such as, AG, PT and SA
Institute of Auditors, etc.; and
Minister and MEC’s engagement with these municipalities and post-
election priorities
3. Revenue Enhancement Programme
Consider a workable model for allocation and distribution of powers
and functions, e.g. District performing both WSA and WSP functions
against roles of Local municipalities;
Consolidated Bill for municipal services rendered to residents;
Issues of metering and credibility of data and bills;
Address tariff setting challenges;
Non-revenue electricity and water, e.g. System losses (e.g. leaking
pipes, house connection leaks, storage overflow), Commercial losses
(e.g. billing anomalies, metering errors, water theft, Electricity theft
Address government debt, municipal debt, business and residents
debt; and
Other critical issues related to revenue generation by municipality.
4. Appointment of Senior Managers in Municipalities
45
Analysis of the current state of affairs, data on vacancies, number of
senior managers compliant with minimum competency regulations,
number of senior managers affected by the National Treasury CPMD
competency requirements, number of senior managers contract
coming to an end;
Strong oversight over the pre – election and post - election phases as
it relate to illegal cancellation of contracts and removal of senior
managers and costs implications and court challenges on municipal
budgets;
Strategy for monitoring the post- election tasks, in relation to new
appointments and meeting appropriate skills requirements;
Affordable organogram aligned to core business;
Resolve the misalignment between NT and COGTA regulations on
minimum competency requirements
5. Service and Infrastructure
State of municipal technical capacity and capability, in terms of
Technical Units organograms, alignment of structure with core
function, existing capacity and vacancies.
Analysis of the municipal absorption capacity and capability to
manage infrastructure grants, e.g. whether all critical post are filled
with appropriate expertise and critical functions such as SCM’s are in
place.
Increase access to quality, reliable and sustainable basic levels of
service in prioritised districts, through diagnostic analysis leading to
support and intervention to address key challenges.
Put in place regional support contractors to assist municipalities to
improve infrastructure delivery and operation.
Mobilise more funding for rehabilitation, refurbishment and
replacement of ageing infrastructure, from government grants and
loan funding.
Make municipal infrastructure procurement more efficient and
effective through putting in place national framework contract.
6. Implementation of Forensic Reports
State of forensic reports, (collation of the forensic investigation
undertaken by Province and Municipalities).
Analysis of the reports.
Status of reports in Councils and consequence management and
accountability.
Monitor municipal implementation plans; and
Role of MEC and other agencies in enforcing consequence
management.
46
7. Metropolitan B2B Programme (This is important for the District as the next Term will be
moving towards establishment of a Metro in the Region)
Priorities issues that have immediate impact on the citizens;
Better understanding of the complexity of urban voter / variety of
needs and interest to serve;
Effective complaints management systems and improving frontline
services;
Enforcement mechanisms for service norms and standards, quicker
response times and improve communication / feedback to citizens;
Provision of interim services to informal settlements;
Role of Metro in the declining economy – infrastructure investment
that stimulates economy (These municipalities are key drivers of
economic growth and economic activity).
Visible and impactful spatial transformation and integration initiatives
8. Strengthening Roles of District Municipalities
Clarify allocation and distribution of powers and functions;
Regional integrated planning and delivery of services
District and local IGR coordination model
Shared service model and strong district support plans for weaker
local municipalities
9. Spatial Regional Integration Zones / Spatial Contracts
The development of a spatial development strategy for various
localities and spaces (District, Locals, small vibrant towns, mining
towns and possible new towns)
The development of an infrastructure development/implementation
plan to underpin the spatial development programme. The plan
should outline the infrastructure requirements (catalytic regional and
local infrastructure projects) in support of the proposed development
and financial modelling;
The development of more detailed spatial development strategies for
individual municipalities / towns / growth points which nest with the
district strategies;
High-level designs / conceptual frameworks for the new cities / towns; and
The development of programmes of action (and the projects associated with each) at both District and municipal level and the sequencing of actions (across all spheres) that need to give effect to the plan
47
10. Strengthen Capacity and Role of Provincial COGTA Departments
Clarify core functions and mandates / structure (constitutional and
Legislative)
Empowering provisions and levers
Capacity and expertise required
Operational and Funding model
Municipal support plans
5. Key Programmes for the West Rand District
5.1 Capacity to Support Municipalities
The two local municipalities of Westonaria and Randfontein will be merged into one
local municipality in 2016.
There are structures (work streams) established to support the merger process,
which are closely aligned with the B2B pillars and support programmes.
The MEC will establish a technical team of specialists to support the merger. The
technical team will report directly to the HoD and the MEC.
The Department has a Senior Manager appointed to the role of B2B Coordinator,
and is supported by Task Teams established per region.
There are various other GPG-wide structures established to support the B2B
Programme, which include the following:
o OPCA-PCC
o - A Forum for MECs of CoGTA and Finance and MMC for Finance
o - Provincial Debt Management Committee (PDMC), chaired by MEC: Finance
o - Ntirhisano Service Delivery War Room
o - Various other Multi-Stakeholder Committees (e.g., Human Settlement Inter-
Departmental Task Team)
5.2 Strategic Support Programmes
Strategy 1: Improve Financial Management and Compliance
The Gauteng Municipal Finance Hands-on Support Program is central
to improving compliance to the MFMA, Strengthening Financial
Management, Improving Financial Governance and Building Financial
Management Capacity in the West Rand municipalities & Gauteng at
large
Strategy 2: Synergy in Planning and Budgeting
The Provincial Treasury together with GCoGTA coordinate and align
municipal IDP’s to the NDP, the Provincial Development Corridor, and
the Back-to-Basics Programme;
Draft Infrastructure Master Plan has been developed by GPD for
approval by EXCO in the current FY. GCoGTA is responsible for
coordinating individual master plans of municipalities;
48
Key focus is placed on institutionalizing the merger governance
structures and reflecting on the costs necessary to support the
integration of new merged municipalities
Strategy 3: Revenue Optimisation
Attaining sustainable budgets can only be achieved by optimising the
West Rand revenues; and
A detailed viability assessment has been completed and a Viability
Strategy is in place (INCA Report).
Strategy 4: Improving Grant and Capital Expenditure
Provincial CAPEX war room and CAPEX committees to improve CAPEX
and Grant expenditure have been established. The Provincial CAPEX
Task Team has also been established to assist municipalities; and
Development of Infrastructure Asset Management Plans including
Repairs and Maintenance Plans by municipalities – Guidance is
provided by GCoGTA in this regard.
Strategy 5: Improve Municipal Governance
Induction and Training of Audit Committee Members , MPAC
members;
Assist in implementation of new annual report process; and
Provide support to municipalities through OPCA strategy on AFS and
Audit matters.
Strategy 6: Build Finance Management Capacity
Monitor and ensure implementation of Financial Internships and
absorption by institutions;
Ensure finance officials register and complete minimum competency
training and to monitor skills transfer by Service Providers and GPT
Advisors.
5.3 Corridors of Development in Gauteng Regions In order to address the triple
challenge of unemployment, poverty and inequality in the West Rand District of
Gauteng, the following Programmes have been approved by the Provincial Executive for
the development of the WESTERN CORRIDOR
New economic nodes & new cities
Transform, modernise and diversify the West Rand economy
Revitalise the mining towns
Focus on green and blue economy initiatives, tourism, agro-processing and logistics
Lanseria Airport & Maropeng as main anchors
Hub of our agri-business and agro-processing industry
5.4 Key GPG Projects for the Western Corridor
Lanseria Airport logistics hub
o R 500m investment in Capex for airport development
o Investment of over R10 billion expected in Lanseria over the next 15 years

49
Randfontein milling facility
o To transform the agricultural sector and ensure food-security
Aquaculture
o Breeding of prawns
o 6 512 jobs in the West Rand over 3 years
Renewable energy industrial development
o Deployment of solar technologies and solar manufacturing plant or solar
farm
5.5 Provincial Cabinets Programme for Action
In line with the provincial Cabinet’s Programme of Action, the following are critical
to be cognisant of:
• Radically take forward the Tshepo 500 000 Programme of creating job
opportunities for youth;
• Ensure that the local suppliers are registered in the province so that they can
benefit from Township Economy Revitalization (TER) strategy as the TER spent
in the West Rand is rather slow.
STRATEGIC INPUT
SALGA Gauteng Briefing
Mr Leseane
This presentation covered :
1. An Overview of Member Municipalities
2. The State of SA Local Government
3. Challenges facing Gauteng Province Local Government
4. What Needs to be done?
5. Game Changers for GCR Growth and Renewal
6. Key Areas for Discussion
1. An Overview of Member Municipalities
The Overview comprises a definition of Member municipalities in Gauteng and a SALGA
Roadmap as depicted below:
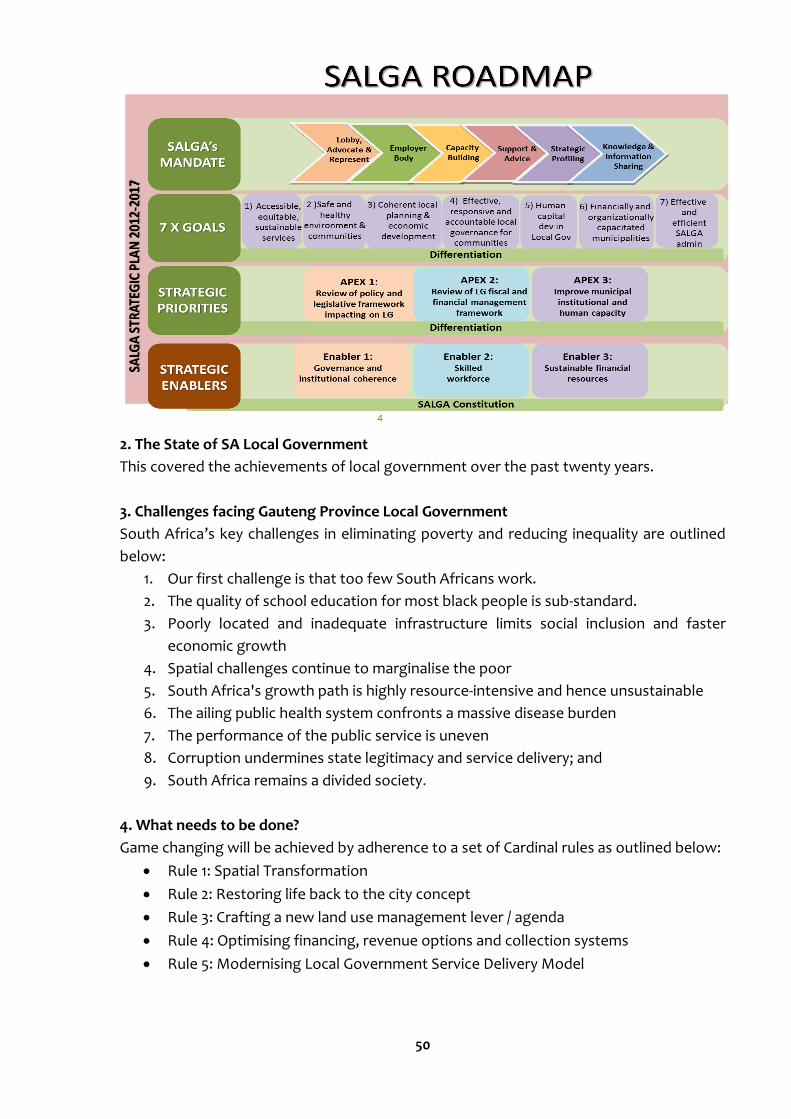
50
2. The State of SA Local Government
This covered the achievements of local government over the past twenty years.
3. Challenges facing Gauteng Province Local Government
South Africa’s key challenges in eliminating poverty and reducing inequality are outlined
below:
1. Our first challenge is that too few South Africans work.
2. The quality of school education for most black people is sub-standard.
3. Poorly located and inadequate infrastructure limits social inclusion and faster
economic growth
4. Spatial challenges continue to marginalise the poor
5. South Africa's growth path is highly resource-intensive and hence unsustainable
6. The ailing public health system confronts a massive disease burden
7. The performance of the public service is uneven
8. Corruption undermines state legitimacy and service delivery; and
9. South Africa remains a divided society.
4. What needs to be done?
Game changing will be achieved by adherence to a set of Cardinal rules as outlined below:
Rule 1: Spatial Transformation
Rule 2: Restoring life back to the city concept
Rule 3: Crafting a new land use management lever / agenda
Rule 4: Optimising financing, revenue options and collection systems
Rule 5: Modernising Local Government Service Delivery Model
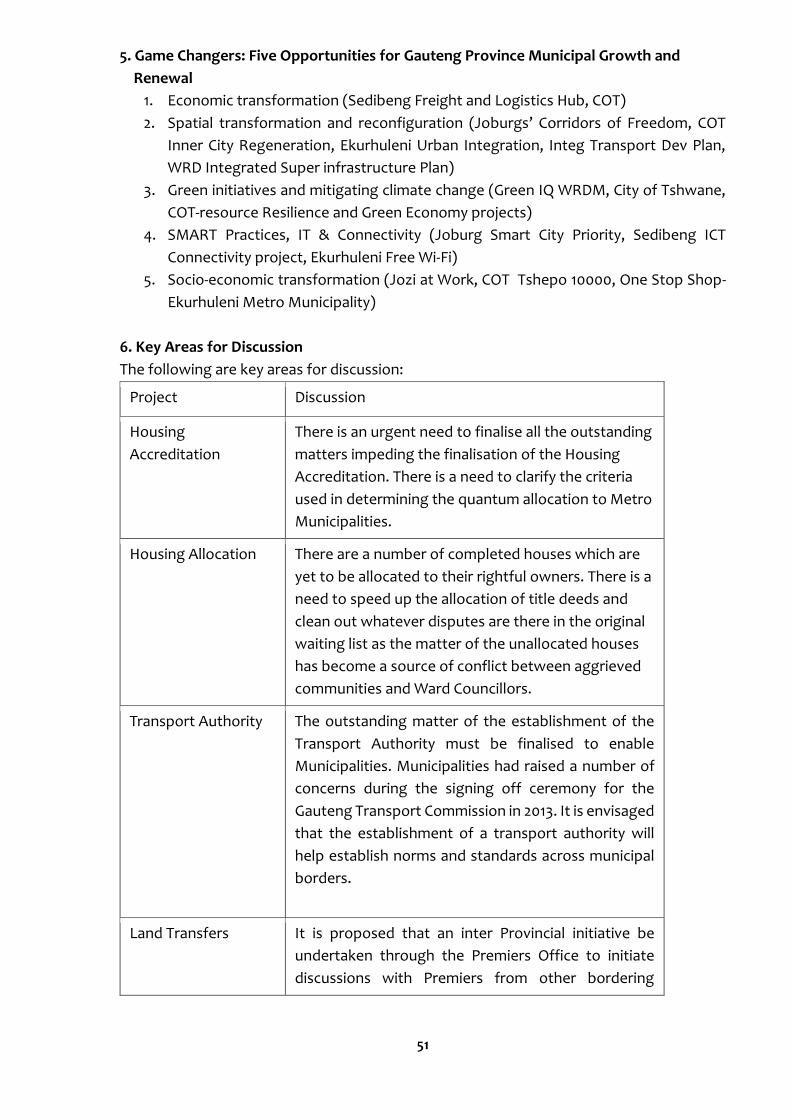
51
5. Game Changers: Five Opportunities for Gauteng Province Municipal Growth and
Renewal
1. Economic transformation (Sedibeng Freight and Logistics Hub, COT)
2. Spatial transformation and reconfiguration (Joburgs’ Corridors of Freedom, COT
Inner City Regeneration, Ekurhuleni Urban Integration, Integ Transport Dev Plan,
WRD Integrated Super infrastructure Plan)
3. Green initiatives and mitigating climate change (Green IQ WRDM, City of Tshwane,
COT-resource Resilience and Green Economy projects)
4. SMART Practices, IT & Connectivity (Joburg Smart City Priority, Sedibeng ICT
Connectivity project, Ekurhuleni Free Wi-Fi)
5. Socio-economic transformation (Jozi at Work, COT Tshepo 10000, One Stop Shop-
Ekurhuleni Metro Municipality)
6. Key Areas for Discussion
The following are key areas for discussion:
Project Discussion
Housing
Accreditation
There is an urgent need to finalise all the outstanding
matters impeding the finalisation of the Housing
Accreditation. There is a need to clarify the criteria
used in determining the quantum allocation to Metro
Municipalities.
Housing Allocation There are a number of completed houses which are
yet to be allocated to their rightful owners. There is a
need to speed up the allocation of title deeds and
clean out whatever disputes are there in the original
waiting list as the matter of the unallocated houses
has become a source of conflict between aggrieved
communities and Ward Councillors.
Transport Authority The outstanding matter of the establishment of the
Transport Authority must be finalised to enable
Municipalities. Municipalities had raised a number of
concerns during the signing off ceremony for the
Gauteng Transport Commission in 2013. It is envisaged
that the establishment of a transport authority will
help establish norms and standards across municipal
borders.
Land Transfers It is proposed that an inter Provincial initiative be
undertaken through the Premiers Office to initiate
discussions with Premiers from other bordering

52
Provinces for the release of Land parcels which a
inhibiting development in Municipalities.
Municipal Pooled
Funding Mechanisms
The need to acquire additional revenue to help
Municipalities deal with the urgent infrastructure
investment in housing, transportation, water and
sanitation etc., brought about by increased
urbanisation.
Improve the image of
LG
The Provincial Government should join hands with
Organised Local Government in Developing a
programme to help improve the image of Local
Government.
RandWest
Municipality merger.
SALGA is currently playing a role in the merger of the
Randfontein and Westonaria merger through
participating in the Transformation Change
Management Committee.
Social Plan for
Councillors
Discussions are currently underway to finalise the
criteria for the payment of once-off gratuity payment
for non-returning councillors. An amount of R309
million has been set aside by DCOG for the
disbursement to non-returning councillors.
The Councillor
Induction
Programme (The CIP)
The CIP is aimed at ensuring that the newly elected
councillors are inducted and capacitated with a
general knowledge on their role as councillors.
Curricula proposals have already been submitted to
the LGSETA for consideration
STRATEGIC INPUT SESSION 3
This Session comprised a presentations made by the Treasury (Gauteng) and Auditor
General (Gauteng)
STRATEGIC INPUT
Issues to be aware of when preparing the 2016/17 Final Budget to ensure compliance with the MBRR and the MFMA
Mr Pitso Zwane
This presentation covered
1. Legislation background to note
2. Role of the WRDM in the merger within the District
3. Budget preparation process and other matters to note
4. Brief errors identified in the prior years of the budgets assessment
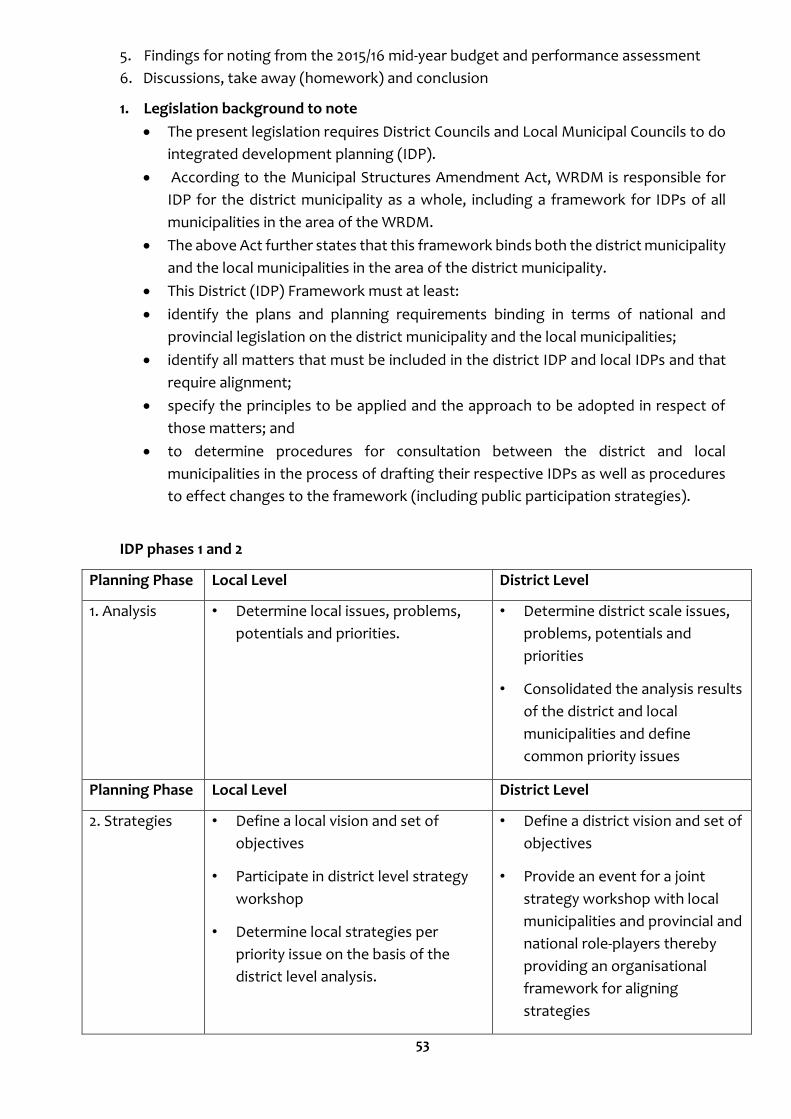
53
5. Findings for noting from the 2015/16 mid-year budget and performance assessment
6. Discussions, take away (homework) and conclusion
1. Legislation background to note
The present legislation requires District Councils and Local Municipal Councils to do
integrated development planning (IDP).
According to the Municipal Structures Amendment Act, WRDM is responsible for
IDP for the district municipality as a whole, including a framework for IDPs of all
municipalities in the area of the WRDM.
The above Act further states that this framework binds both the district municipality
and the local municipalities in the area of the district municipality.
This District (IDP) Framework must at least:
identify the plans and planning requirements binding in terms of national and
provincial legislation on the district municipality and the local municipalities;
identify all matters that must be included in the district IDP and local IDPs and that
require alignment;
specify the principles to be applied and the approach to be adopted in respect of
those matters; and
to determine procedures for consultation between the district and local
municipalities in the process of drafting their respective IDPs as well as procedures
to effect changes to the framework (including public participation strategies).
IDP phases 1 and 2
Planning Phase Local Level District Level
1. Analysis • Determine local issues, problems,
potentials and priorities.
• Determine district scale issues,
problems, potentials and
priorities
• Consolidated the analysis results
of the district and local
municipalities and define
common priority issues
Planning Phase Local Level District Level
2. Strategies • Define a local vision and set of
objectives
• Participate in district level strategy
workshop
• Determine local strategies per
priority issue on the basis of the
district level analysis.
• Define a district vision and set of
objectives
• Provide an event for a joint
strategy workshop with local
municipalities and provincial and
national role-players thereby
providing an organisational
framework for aligning
strategies
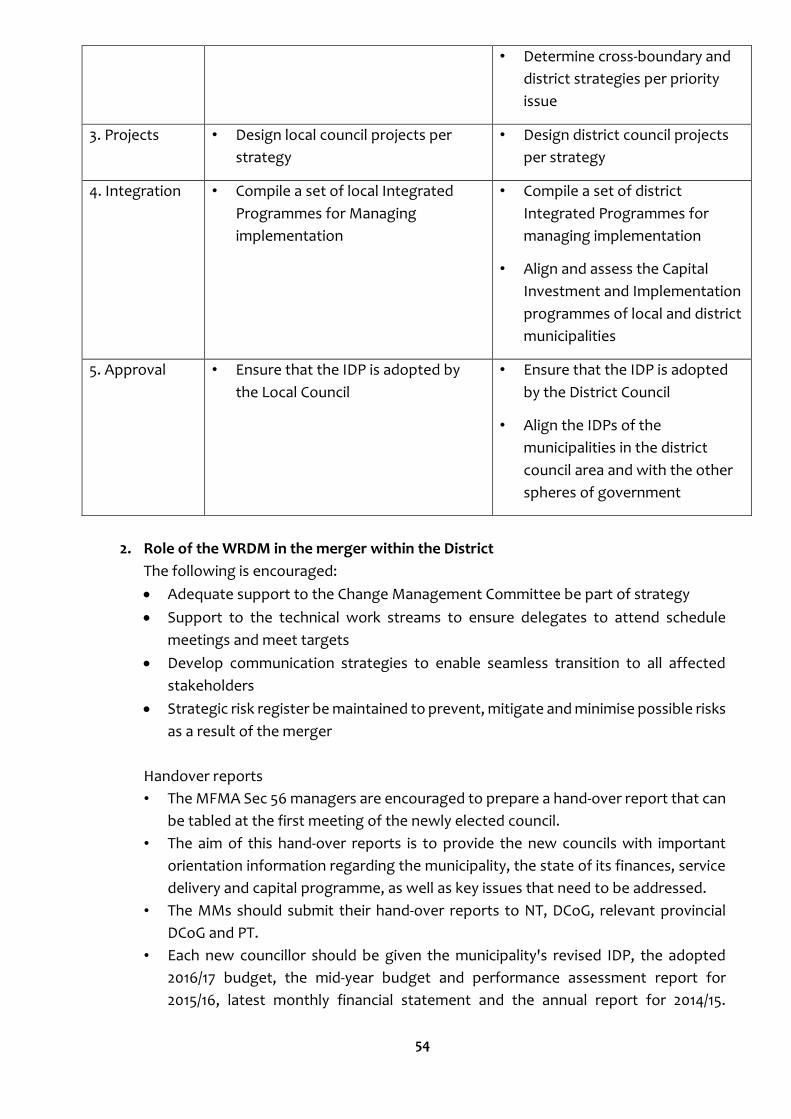
54
• Determine cross-boundary and
district strategies per priority
issue
3. Projects • Design local council projects per
strategy
• Design district council projects
per strategy
4. Integration • Compile a set of local Integrated
Programmes for Managing
implementation
• Compile a set of district
Integrated Programmes for
managing implementation
• Align and assess the Capital
Investment and Implementation
programmes of local and district
municipalities
5. Approval • Ensure that the IDP is adopted by
the Local Council
• Ensure that the IDP is adopted
by the District Council
• Align the IDPs of the
municipalities in the district
council area and with the other
spheres of government
2. Role of the WRDM in the merger within the District
The following is encouraged:
Adequate support to the Change Management Committee be part of strategy
Support to the technical work streams to ensure delegates to attend schedule
meetings and meet targets
Develop communication strategies to enable seamless transition to all affected
stakeholders
Strategic risk register be maintained to prevent, mitigate and minimise possible risks
as a result of the merger
Handover reports
• The MFMA Sec 56 managers are encouraged to prepare a hand-over report that can
be tabled at the first meeting of the newly elected council.
• The aim of this hand-over reports is to provide the new councils with important
orientation information regarding the municipality, the state of its finances, service
delivery and capital programme, as well as key issues that need to be addressed.
• The MMs should submit their hand-over reports to NT, DCoG, relevant provincial
DCoG and PT.
• Each new councillor should be given the municipality's revised IDP, the adopted
2016/17 budget, the mid-year budget and performance assessment report for
2015/16, latest monthly financial statement and the annual report for 2014/15.
55
3. Budget preparation process and other matters to note
2016/17 MTREF Budget preparation
2016 LG elections and the budget process
• The following risks need to be explicitly managed:
• New tariffs for property rates, service charges, similar tariffs and other taxes may
only be implemented from the start of the municipal FY
• A municipal council must approve the annual budget before the start of the FY,
failure to do so – s 26
• The outgoing council may be tempted to prepare an election friend budget which
could threaten financial sustainability and service delivery
• Municipal public budget consultations may be neglected or used to serve the
narrow interests of political parties
Demarcation changes guidance
Election held before 1 July 2016 Election held after 1 July 2016
• Merging municipality will be expected
to compile individual budgets for the
2016/17 MTREF and work as a team
with other affected municipality on the
planning and technical processes in
compiling the consolidated budget for
the newly demarcated municipality.
• Complete the remaining period of the
FY on their existing structures.
• The allocation published in the 2016
DoRB will then be transferred to the
re-demarcated municipality from 01
July 2016.
Revised allocations to be transferred to the
current municipalities for the period
between 01 July 2016 and the date of the
elections.
The remaining allocations will be
transferred to the re-demarcated
municipality after the elections.
Merging municipalities to compile individual
budgets for the 2016/17 MTREF and work as
a team with other affected municipality on
planning and technical processes in
compiling the consolidated budget for the
newly demarcated municipality.
Municipalities to implement the individual
budgets until the new re-demarcations
come into effect.
2016/17 MTREF Budget preparation
• IDP is a five year strategic document of council, however the norm has been that the
first year of such a new council is primarily confined to implement the last adopted
IDP.
• The Mayor + MM should engage in the process of review of the fifth year of IDP and
budget preparation process of 2016/17 FY.
56
• The outgoing Council is advised to critically consider financial implications before
entering into long-contracts that are not of priority to the municipality and avoid
financially burdening the incoming council.
2016/17 MTREF Budget assessment and cost cutting
• The budget assessment will critically consider the following inter alia:
1. Cost reflective tariffs were applicable;
2. Appropriateness of budget assumptions;
3. Credibility and level of funding of the budget;
4. Provision for asset renewal and maintenance; and
5. Alignment of the budgets to the Municipality’s plans (IDP, SDBIP, APA, and
business plans).
• NT is in the process of reviewing the instruction on cost containment measures
which was issued to Accounting Officers of departments and secondly, determine
its applicability to LG.
• Once the process has been concluded, a Regulation on cost containment measures
applicable to LG will be issued.
Municipal standard Chart of accounts (mSCOA)
• The mSCOA regulations apply to all municipalities and entities with effect from 1 July
2017 and only seven months remain for preparation and implementation readiness
as the 2017/18 MTREF budgets will have to be aligned to mSCOA.
• The mSCOA chart has been revised four times giving rise to mSCOA version 5.4
• The implementation of mSCOA must be considered a business reform and it requires
a significant change in municipal business processes; and it involves systems
conversion and or re-implementation.
• The 2016/17 tabled budget must include an annexure containing the municipality’s
mSCOA project plan and progress to date.
• The MBRR Schedules will remain as is until further notice.
4. Brief errors identified in the prior years of the budgets assessment
Prior Years errors and finding identified
• 2013/14 MTREF budget not prepared in accordance with MBRR Schedule
• Errors identified in the budget numbers, i.e. numbers not properly reconciling as a
result of under capacity
• 2013/14 – 2014/15 Budget supplemented (funded) by depleting cash reserves
• Under funded mandate on EMS
• 2013/14 – 2015/16 mid-year report not prepared i.t.o of MBRR Schedules
• IYR not published in time on municipal website
• Critical posts being vacant and lack of transferring of skills (BTO)
• Value for money not realised – Agency
• Slow or inadequate contributions from locals threatens financial health of District
5. Findings for noting from the 2015/16 mid-year budget and performance assessment
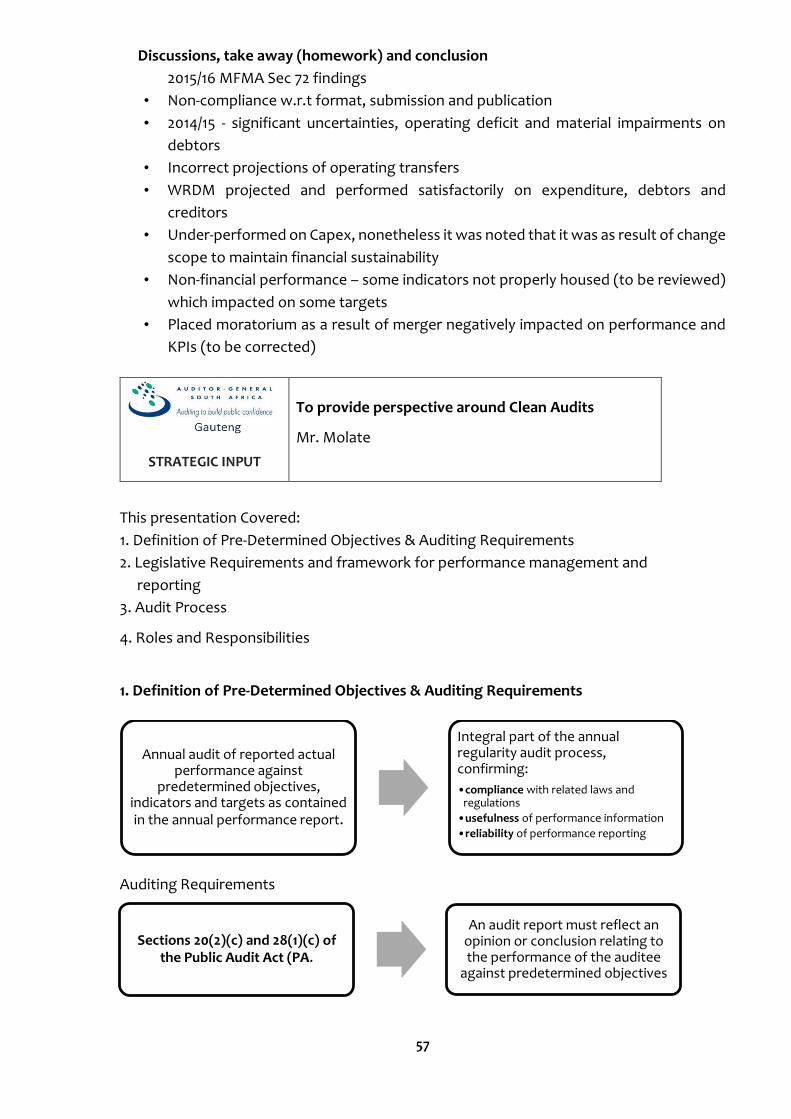
57
Discussions, take away (homework) and conclusion
2015/16 MFMA Sec 72 findings
• Non-compliance w.r.t format, submission and publication
• 2014/15 - significant uncertainties, operating deficit and material impairments on
debtors
• Incorrect projections of operating transfers
• WRDM projected and performed satisfactorily on expenditure, debtors and
creditors
• Under-performed on Capex, nonetheless it was noted that it was as result of change
scope to maintain financial sustainability
• Non-financial performance – some indicators not properly housed (to be reviewed)
which impacted on some targets
• Placed moratorium as a result of merger negatively impacted on performance and
KPIs (to be corrected)
STRATEGIC INPUT
To provide perspective around Clean Audits
Mr. Molate
This presentation Covered:
1. Definition of Pre-Determined Objectives & Auditing Requirements
2. Legislative Requirements and framework for performance management and
reporting
3. Audit Process
4. Roles and Responsibilities
1. Definition of Pre-Determined Objectives & Auditing Requirements
Auditing Requirements
Annual audit of reported actual performance against
predetermined objectives, indicators and targets as contained in the annual performance report.
Integral part of the annual regularity audit process, confirming:
•compliance with related laws and regulations
•usefulness of performance information
•reliability of performance reporting
Sections 20(2)(c) and 28(1)(c) of the Public Audit Act (PA.
An audit report must reflect an opinion or conclusion relating to the performance of the auditee
against predetermined objectives

58
2. Legislative Requirements and framework for performance management and
reporting
This represents the performance management and reporting framework against
which the performance information should be managed and reported. Principles
and requirements from framework are used as a basis for the audit
LG: Municipal planning and performance management regulations, 2001 –
GNR.796 of 24 August 2001
LG: Municipal performance regulations for municipal managers and managers
directly reporting to municipal managers, 2006 –GNR.805 of 1 August 2006
NT Framework for managing programme performance information –issued by the
National Treasury in May 2007
Good Performance Indicators
Reliable: Accurate enough for its intended use and respond to changes
Verifiable: Possible to validate the processes and systems
Appropriate: Avoid unintended consequences and encourage service delivery
improvements
Well defined: Clear, unambiguous definition so that data will be collected
consistently and easy to understand and use
Cost-effective: Usefulness of the indicator must justify the cost of collecting the
data
Relevant: Relate logically and directly to an aspect of the institution’s mandate
Source: NT FMPPI
SMART Performance Targets
Specific: Nature and required level of performance can be clearly identified
Measurable: Required performance can be measured
Achievable: Realistic given existing capacity
Relevant Required performance is linked to achievement of goal
Time Bound: Time period/deadline for delivery is specified
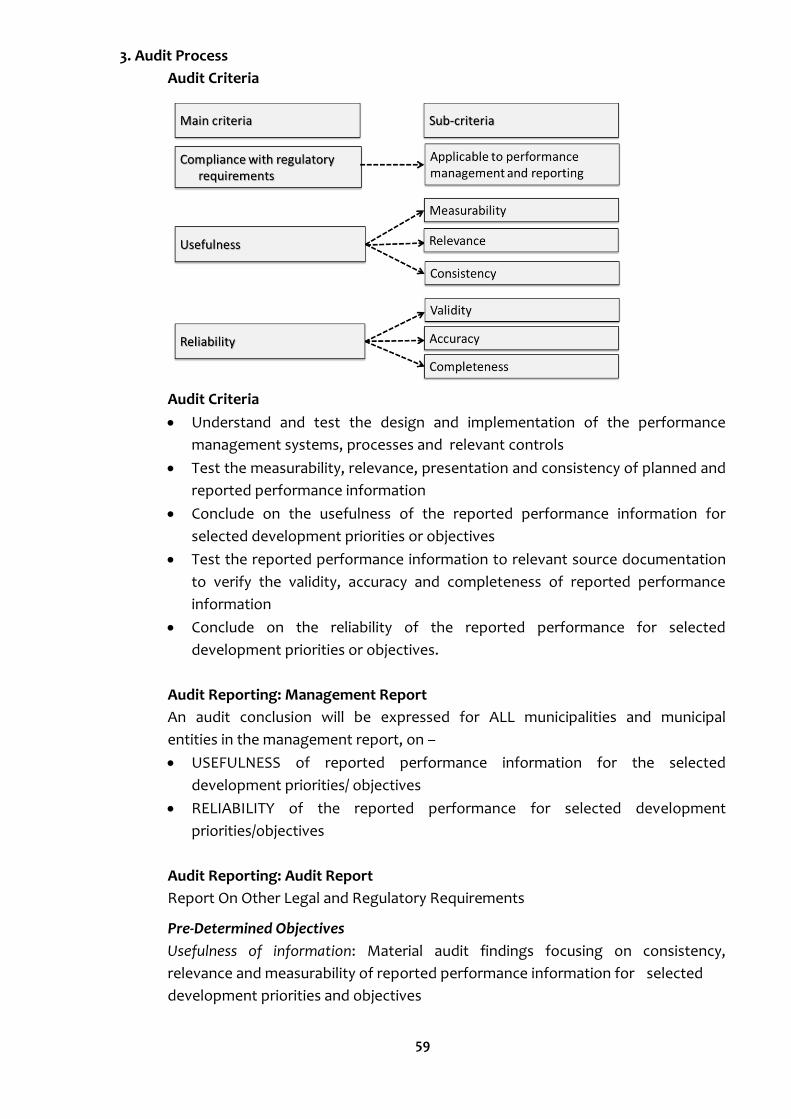
59
3. Audit Process
Audit Criteria
Audit Criteria
Understand and test the design and implementation of the performance
management systems, processes and relevant controls
Test the measurability, relevance, presentation and consistency of planned and
reported performance information
Conclude on the usefulness of the reported performance information for
selected development priorities or objectives
Test the reported performance information to relevant source documentation
to verify the validity, accuracy and completeness of reported performance
information
Conclude on the reliability of the reported performance for selected
development priorities or objectives.
Audit Reporting: Management Report
An audit conclusion will be expressed for ALL municipalities and municipal
entities in the management report, on –
USEFULNESS of reported performance information for the selected
development priorities/ objectives
RELIABILITY of the reported performance for selected development
priorities/objectives
Audit Reporting: Audit Report
Report On Other Legal and Regulatory Requirements
Pre-Determined Objectives
Usefulness of information: Material audit findings focusing on consistency,
relevance and measurability of reported performance information for selected
development priorities and objectives
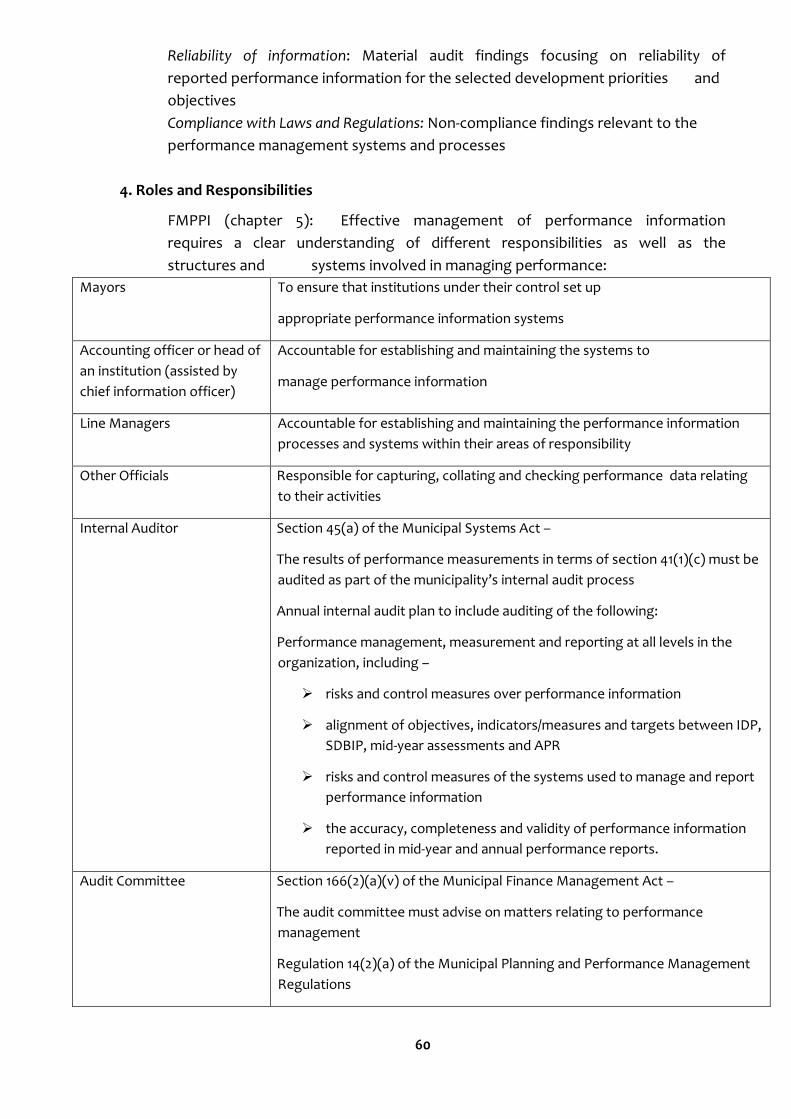
60
Reliability of information: Material audit findings focusing on reliability of
reported performance information for the selected development priorities and
objectives
Compliance with Laws and Regulations: Non-compliance findings relevant to the
performance management systems and processes
4. Roles and Responsibilities
FMPPI (chapter 5): Effective management of performance information
requires a clear understanding of different responsibilities as well as the
structures and systems involved in managing performance:
Mayors To ensure that institutions under their control set up
appropriate performance information systems
Accounting officer or head of
an institution (assisted by
chief information officer)
Accountable for establishing and maintaining the systems to
manage performance information
Line Managers Accountable for establishing and maintaining the performance information
processes and systems within their areas of responsibility
Other Officials Responsible for capturing, collating and checking performance data relating
to their activities
Internal Auditor Section 45(a) of the Municipal Systems Act –
The results of performance measurements in terms of section 41(1)(c) must be
audited as part of the municipality’s internal audit process
Annual internal audit plan to include auditing of the following:
Performance management, measurement and reporting at all levels in the
organization, including –
risks and control measures over performance information
alignment of objectives, indicators/measures and targets between IDP,
SDBIP, mid-year assessments and APR
risks and control measures of the systems used to manage and report
performance information
the accuracy, completeness and validity of performance information
reported in mid-year and annual performance reports.
Audit Committee Section 166(2)(a)(v) of the Municipal Finance Management Act –
The audit committee must advise on matters relating to performance
management
Regulation 14(2)(a) of the Municipal Planning and Performance Management
Regulations
61
A municipality must annually appoint and budget for a performance audit
committee or alternatively use the audit committee to fulfil the role of the
performance audit committee.
A performance audit committee (or audit committee) must –
review the internal audits’ quarterly reports on the audit of
performance measurements
review the municipality’s performance management system and make
recommendations
at least twice a year submit an audit report to the council concerned
STRATEGIC INPUT SESSION 4 This Session comprised a presentations made by the West Rand District Audit Committee
and West Rand District Performance Audit Committee
STRATEGIC INPUT
WRDM : Audit Committee : To outline challenges and experiences with regards to Oversight
Mr. Ahmed
This presentation Covered:
1. Role Players
2. Role of Council
3. Role of the Audit Committee
4. Interaction between Municipal Council and Audit Committee
5. Risk and Control
6. Assurance
7. Finance
8. Compliance
9. Performance Management
10. General
11. Challenges
12. Conclusion
1. Role Players
Audit Committee is appointed and reports to Municipal Council and Council is
accountable to the Communities
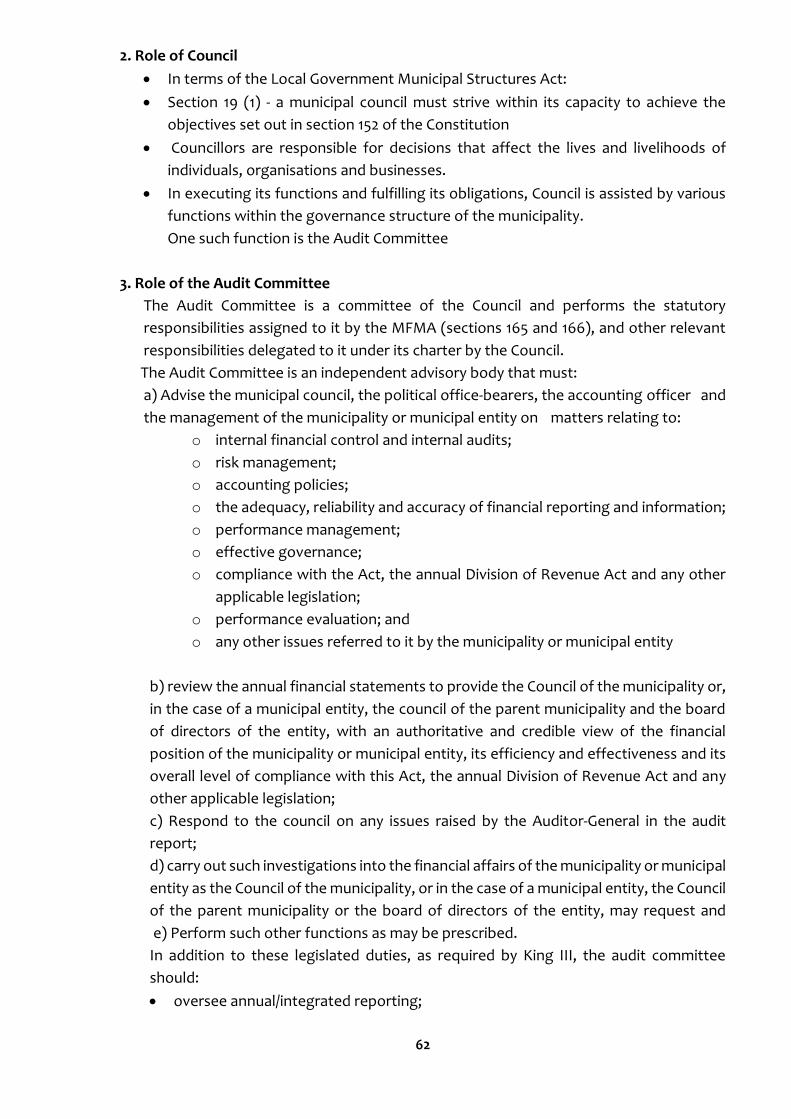
62
2. Role of Council
In terms of the Local Government Municipal Structures Act:
Section 19 (1) - a municipal council must strive within its capacity to achieve the
objectives set out in section 152 of the Constitution
Councillors are responsible for decisions that affect the lives and livelihoods of
individuals, organisations and businesses.
In executing its functions and fulfilling its obligations, Council is assisted by various
functions within the governance structure of the municipality.
One such function is the Audit Committee
3. Role of the Audit Committee
The Audit Committee is a committee of the Council and performs the statutory
responsibilities assigned to it by the MFMA (sections 165 and 166), and other relevant
responsibilities delegated to it under its charter by the Council.
The Audit Committee is an independent advisory body that must:
a) Advise the municipal council, the political office-bearers, the accounting officer and
the management of the municipality or municipal entity on matters relating to:
o internal financial control and internal audits;
o risk management;
o accounting policies;
o the adequacy, reliability and accuracy of financial reporting and information;
o performance management;
o effective governance;
o compliance with the Act, the annual Division of Revenue Act and any other
applicable legislation;
o performance evaluation; and
o any other issues referred to it by the municipality or municipal entity
b) review the annual financial statements to provide the Council of the municipality or,
in the case of a municipal entity, the council of the parent municipality and the board
of directors of the entity, with an authoritative and credible view of the financial
position of the municipality or municipal entity, its efficiency and effectiveness and its
overall level of compliance with this Act, the annual Division of Revenue Act and any
other applicable legislation;
c) Respond to the council on any issues raised by the Auditor-General in the audit
report;
d) carry out such investigations into the financial affairs of the municipality or municipal
entity as the Council of the municipality, or in the case of a municipal entity, the Council
of the parent municipality or the board of directors of the entity, may request and
e) Perform such other functions as may be prescribed.
In addition to these legislated duties, as required by King III, the audit committee
should:
oversee annual/integrated reporting;
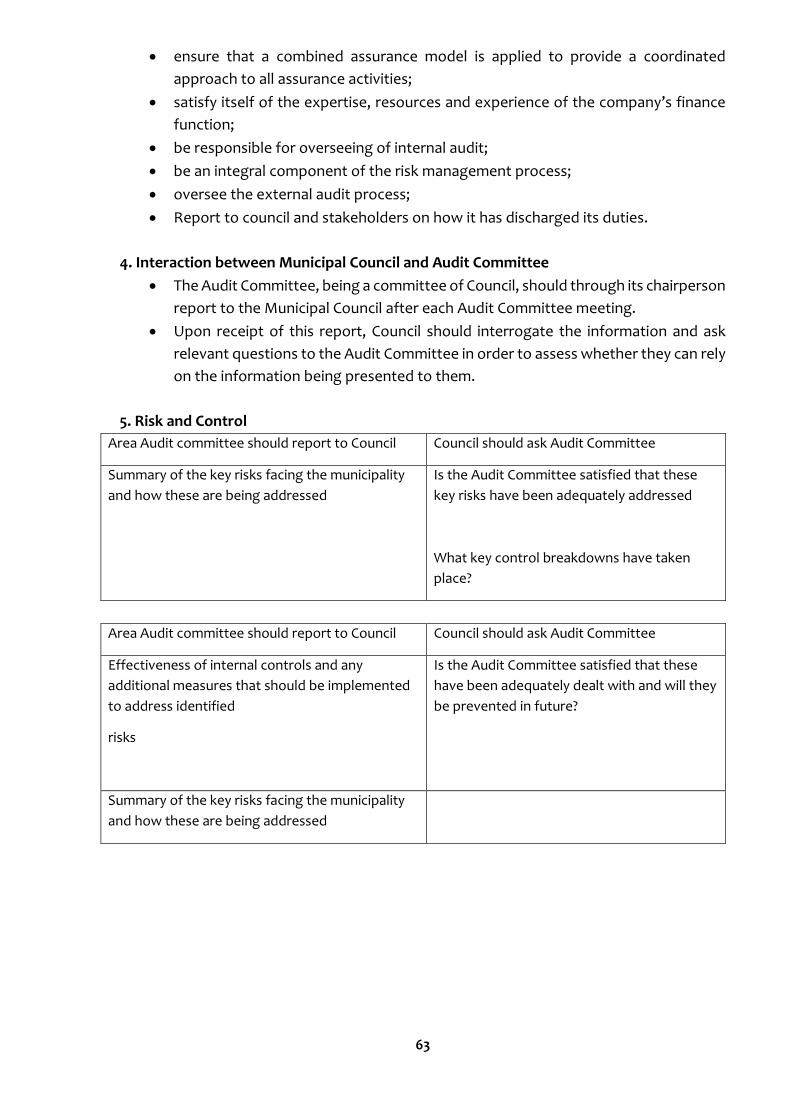
63
ensure that a combined assurance model is applied to provide a coordinated
approach to all assurance activities;
satisfy itself of the expertise, resources and experience of the company’s finance
function;
be responsible for overseeing of internal audit;
be an integral component of the risk management process;
oversee the external audit process;
Report to council and stakeholders on how it has discharged its duties.
4. Interaction between Municipal Council and Audit Committee
The Audit Committee, being a committee of Council, should through its chairperson
report to the Municipal Council after each Audit Committee meeting.
Upon receipt of this report, Council should interrogate the information and ask
relevant questions to the Audit Committee in order to assess whether they can rely
on the information being presented to them.
5. Risk and Control
Area Audit committee should report to Council Council should ask Audit Committee
Summary of the key risks facing the municipality
and how these are being addressed
Is the Audit Committee satisfied that these
key risks have been adequately addressed
What key control breakdowns have taken
place?
Area Audit committee should report to Council Council should ask Audit Committee
Effectiveness of internal controls and any
additional measures that should be implemented
to address identified
risks
Is the Audit Committee satisfied that these
have been adequately dealt with and will they
be prevented in future?
Summary of the key risks facing the municipality
and how these are being addressed
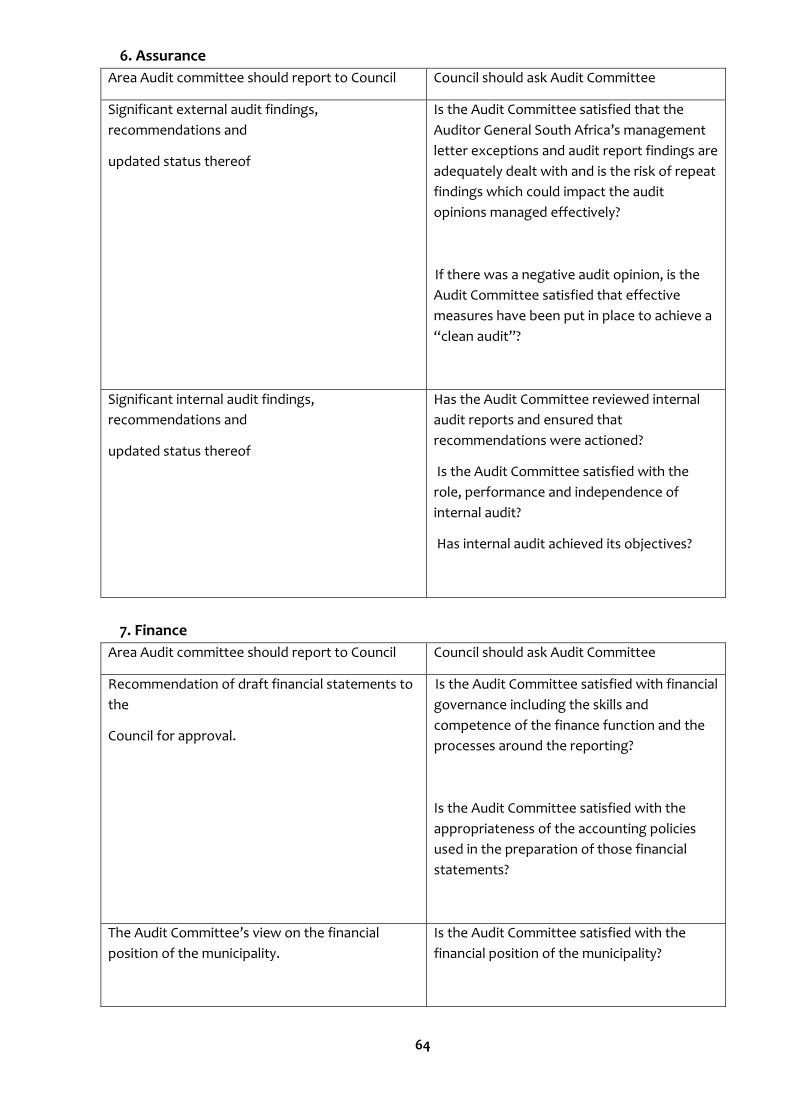
64
6. Assurance
Area Audit committee should report to Council Council should ask Audit Committee
Significant external audit findings,
recommendations and
updated status thereof
Is the Audit Committee satisfied that the
Auditor General South Africa’s management
letter exceptions and audit report findings are
adequately dealt with and is the risk of repeat
findings which could impact the audit
opinions managed effectively?
If there was a negative audit opinion, is the
Audit Committee satisfied that effective
measures have been put in place to achieve a
“clean audit”?
Significant internal audit findings,
recommendations and
updated status thereof
Has the Audit Committee reviewed internal
audit reports and ensured that
recommendations were actioned?
Is the Audit Committee satisfied with the
role, performance and independence of
internal audit?
Has internal audit achieved its objectives?
7. Finance
Area Audit committee should report to Council Council should ask Audit Committee
Recommendation of draft financial statements to
the
Council for approval.
Is the Audit Committee satisfied with financial
governance including the skills and
competence of the finance function and the
processes around the reporting?
Is the Audit Committee satisfied with the
appropriateness of the accounting policies
used in the preparation of those financial
statements?
The Audit Committee’s view on the financial
position of the municipality.
Is the Audit Committee satisfied with the
financial position of the municipality?
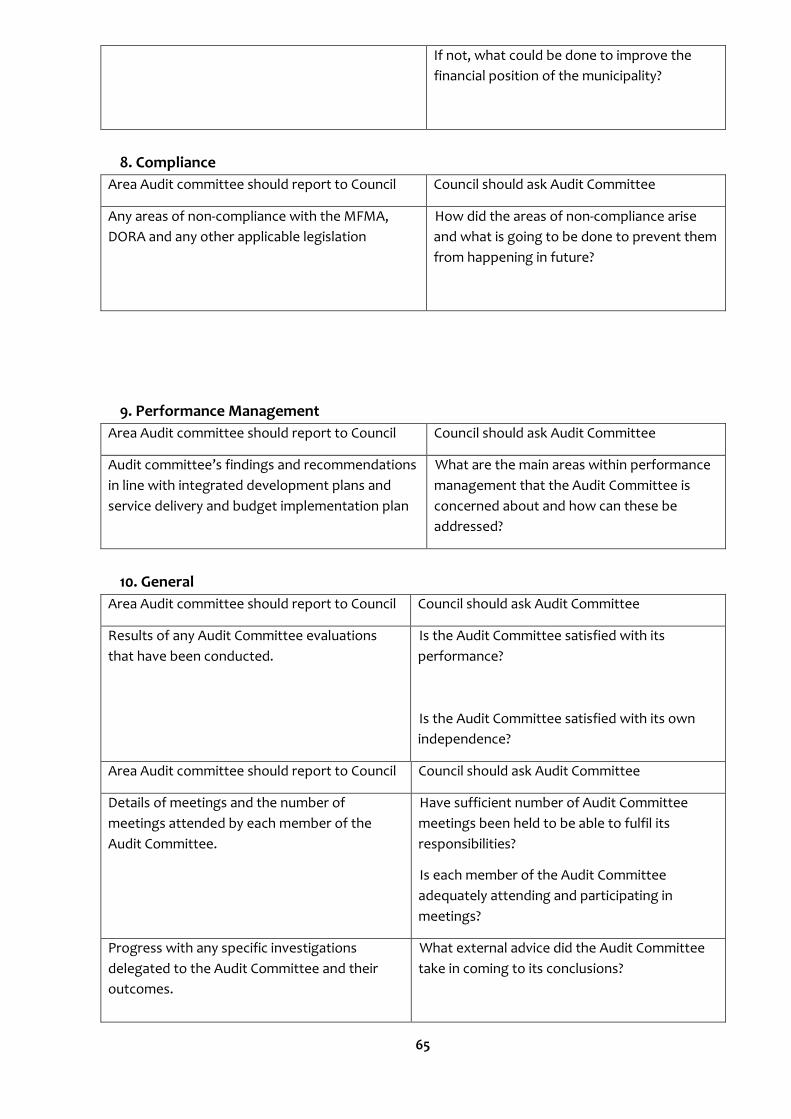
65
If not, what could be done to improve the
financial position of the municipality?
8. Compliance
Area Audit committee should report to Council Council should ask Audit Committee
Any areas of non-compliance with the MFMA,
DORA and any other applicable legislation
How did the areas of non-compliance arise
and what is going to be done to prevent them
from happening in future?
9. Performance Management
Area Audit committee should report to Council Council should ask Audit Committee
Audit committee’s findings and recommendations
in line with integrated development plans and
service delivery and budget implementation plan
What are the main areas within performance
management that the Audit Committee is
concerned about and how can these be
addressed?
10. General
Area Audit committee should report to Council Council should ask Audit Committee
Results of any Audit Committee evaluations
that have been conducted.
Is the Audit Committee satisfied with its
performance?
Is the Audit Committee satisfied with its own
independence?
Area Audit committee should report to Council Council should ask Audit Committee
Details of meetings and the number of
meetings attended by each member of the
Audit Committee.
Have sufficient number of Audit Committee
meetings been held to be able to fulfil its
responsibilities?
Is each member of the Audit Committee
adequately attending and participating in
meetings?
Progress with any specific investigations
delegated to the Audit Committee and their
outcomes.
What external advice did the Audit Committee
take in coming to its conclusions?
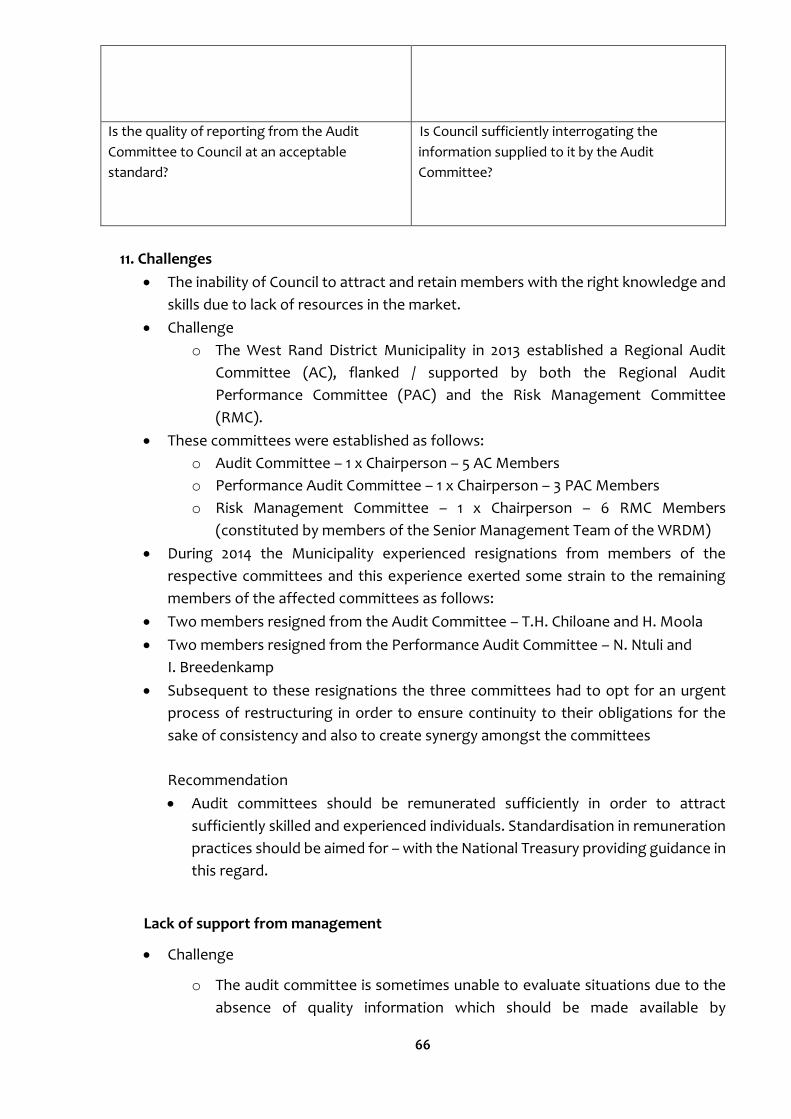
66
Is the quality of reporting from the Audit
Committee to Council at an acceptable
standard?
Is Council sufficiently interrogating the
information supplied to it by the Audit
Committee?
11. Challenges
The inability of Council to attract and retain members with the right knowledge and
skills due to lack of resources in the market.
Challenge
o The West Rand District Municipality in 2013 established a Regional Audit
Committee (AC), flanked / supported by both the Regional Audit
Performance Committee (PAC) and the Risk Management Committee
(RMC).
These committees were established as follows:
o Audit Committee – 1 x Chairperson – 5 AC Members
o Performance Audit Committee – 1 x Chairperson – 3 PAC Members
o Risk Management Committee – 1 x Chairperson – 6 RMC Members
(constituted by members of the Senior Management Team of the WRDM)
During 2014 the Municipality experienced resignations from members of the
respective committees and this experience exerted some strain to the remaining
members of the affected committees as follows:
Two members resigned from the Audit Committee – T.H. Chiloane and H. Moola
Two members resigned from the Performance Audit Committee – N. Ntuli and
I. Breedenkamp
Subsequent to these resignations the three committees had to opt for an urgent
process of restructuring in order to ensure continuity to their obligations for the
sake of consistency and also to create synergy amongst the committees
Recommendation
Audit committees should be remunerated sufficiently in order to attract
sufficiently skilled and experienced individuals. Standardisation in remuneration
practices should be aimed for – with the National Treasury providing guidance in
this regard.
Lack of support from management
Challenge
o The audit committee is sometimes unable to evaluate situations due to the
absence of quality information which should be made available by

67
management. The audit committee therefore cannot fulfil all its
responsibilities.
Recommendation
o The audit committee’s evaluation and oversight should be designed in a
manner that ensures that management fulfils its responsibility.
o Audit committee members must align submissions from management to the
topics listed in the yearly planning calendar. The quality of documents
submitted by management needs to be evaluated to determine the quality
of information and the necessary feedback should be provided to
management.
12. Conclusion
An audit committee should never be seen or treated as a necessary evil but
rather as a trusted ally
Its greatest virtue is its independence which allows it to challenge management
decisions and evaluate corporate performance from a completely free and
objective perspective
STRATEGIC INPUT
WRDM : Audit Committee : To outline
challenges and experiences with regards to
Oversight
Dr R Govender
This presentation Covered:
1. Quality of Measures / Indicators
2. Management Accountability
3. Oversight against SDBIP
4. Clean Audit
1. Quality of Measures / Indicators
Improve quality off Measures in qualitative and quantitative terms
2. Management Accountability
Management to take greater ownership and accountability with regards to progress
reporting and monitoring
3. Oversight against SDBIP
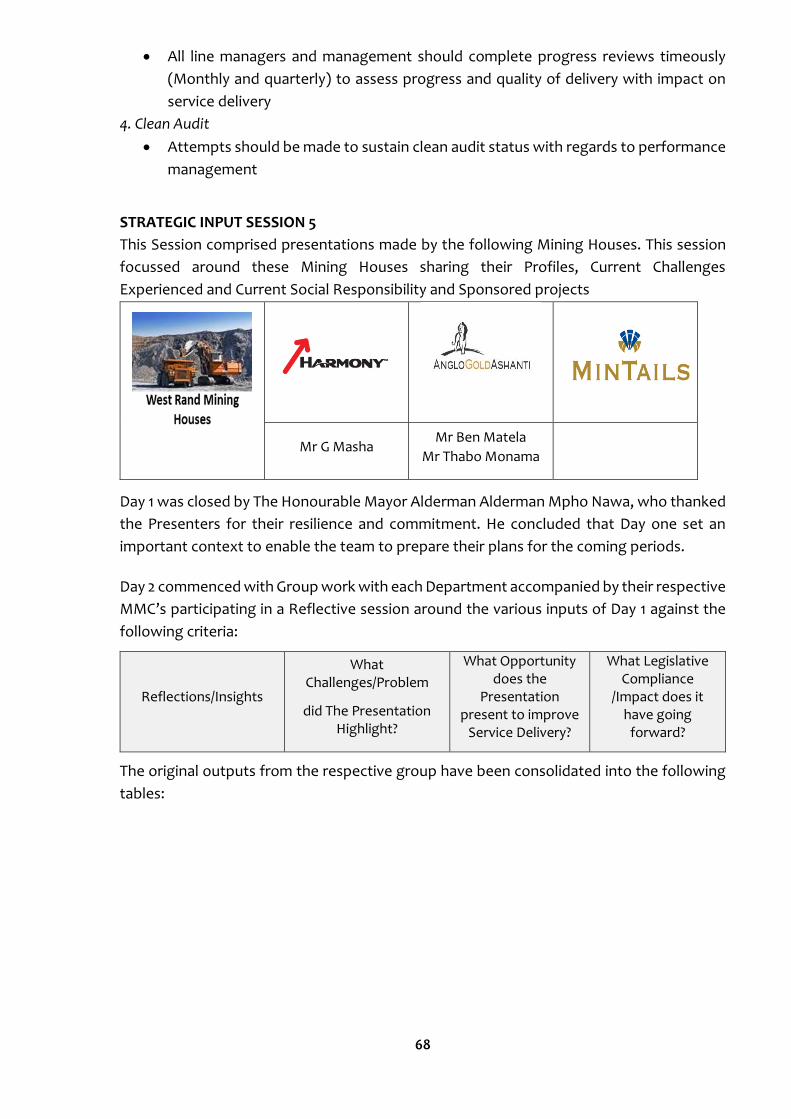
68
All line managers and management should complete progress reviews timeously
(Monthly and quarterly) to assess progress and quality of delivery with impact on
service delivery
4. Clean Audit
Attempts should be made to sustain clean audit status with regards to performance
management
STRATEGIC INPUT SESSION 5
This Session comprised presentations made by the following Mining Houses. This session
focussed around these Mining Houses sharing their Profiles, Current Challenges
Experienced and Current Social Responsibility and Sponsored projects
Mr G Masha Mr Ben Matela
Mr Thabo Monama
Day 1 was closed by The Honourable Mayor Alderman Alderman Mpho Nawa, who thanked
the Presenters for their resilience and commitment. He concluded that Day one set an
important context to enable the team to prepare their plans for the coming periods.
Day 2 commenced with Group work with each Department accompanied by their respective
MMC’s participating in a Reflective session around the various inputs of Day 1 against the
following criteria:
Reflections/Insights
What Challenges/Problem
did The Presentation Highlight?
What Opportunity does the
Presentation present to improve
Service Delivery?
What Legislative Compliance
/Impact does it have going
forward?
The original outputs from the respective group have been consolidated into the following
tables:
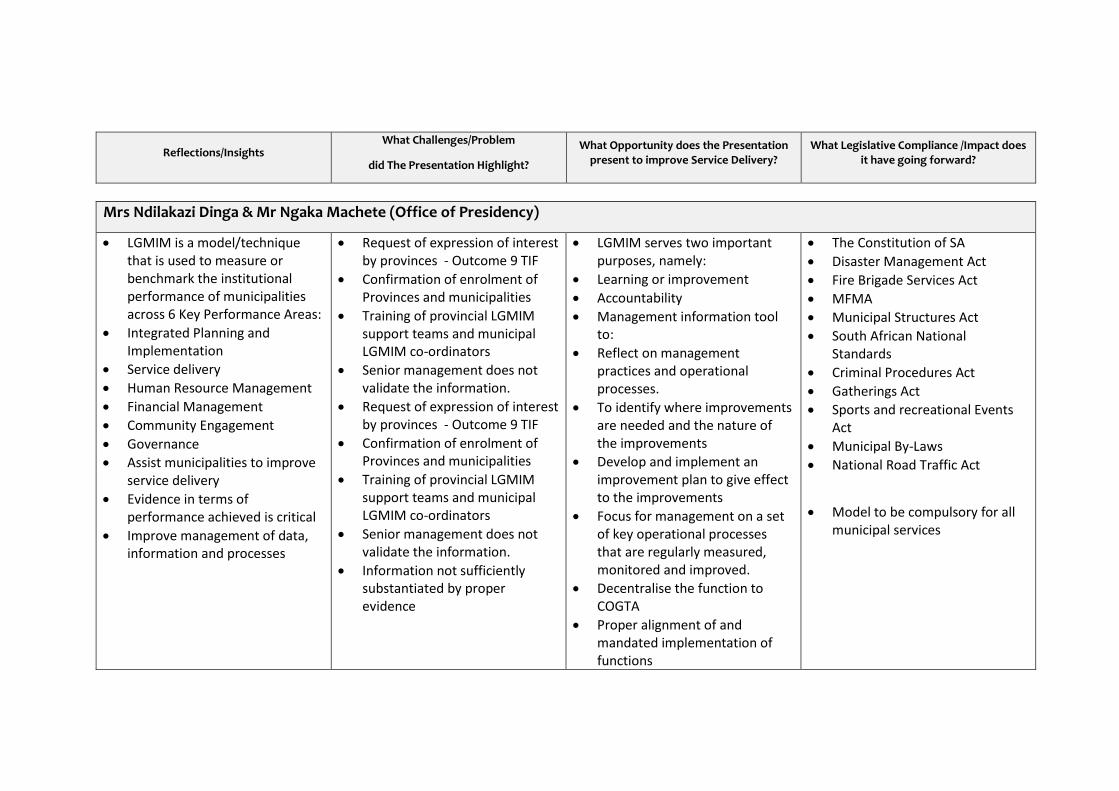
Reflections/Insights What Challenges/Problem
did The Presentation Highlight?
What Opportunity does the Presentation present to improve Service Delivery?
What Legislative Compliance /Impact does it have going forward?
Mrs Ndilakazi Dinga & Mr Ngaka Machete (Office of Presidency)
LGMIM is a model/technique that is used to measure or benchmark the institutional performance of municipalities across 6 Key Performance Areas:
Integrated Planning and Implementation
Service delivery
Human Resource Management
Financial Management
Community Engagement
Governance
Assist municipalities to improve service delivery
Evidence in terms of performance achieved is critical
Improve management of data, information and processes
Request of expression of interest by provinces - Outcome 9 TIF
Confirmation of enrolment of Provinces and municipalities
Training of provincial LGMIM support teams and municipal LGMIM co-ordinators
Senior management does not validate the information.
Request of expression of interest by provinces - Outcome 9 TIF
Confirmation of enrolment of Provinces and municipalities
Training of provincial LGMIM support teams and municipal LGMIM co-ordinators
Senior management does not validate the information.
Information not sufficiently substantiated by proper evidence
LGMIM serves two important purposes, namely:
Learning or improvement
Accountability
Management information tool to:
Reflect on management practices and operational processes.
To identify where improvements are needed and the nature of the improvements
Develop and implement an improvement plan to give effect to the improvements
Focus for management on a set of key operational processes that are regularly measured, monitored and improved.
Decentralise the function to COGTA
Proper alignment of and mandated implementation of functions
The Constitution of SA
Disaster Management Act
Fire Brigade Services Act
MFMA
Municipal Structures Act
South African National Standards
Criminal Procedures Act
Gatherings Act
Sports and recreational Events Act
Municipal By-Laws
National Road Traffic Act
Model to be compulsory for all municipal services
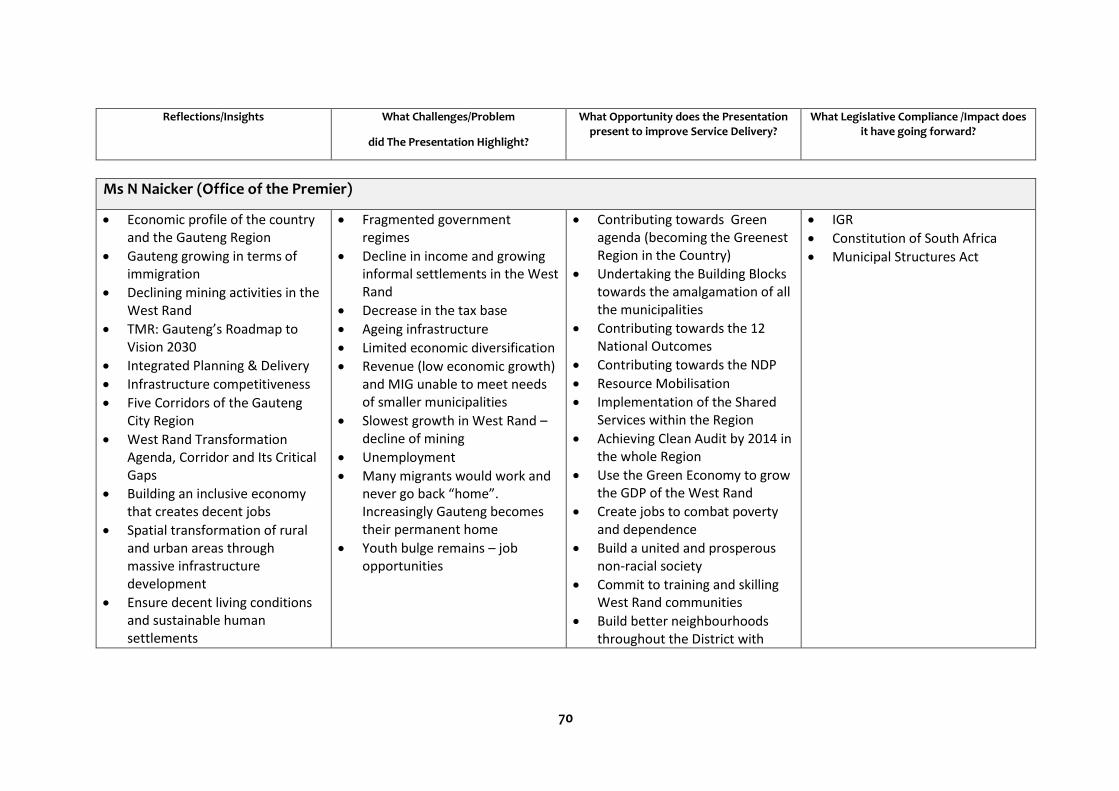
70
Reflections/Insights What Challenges/Problem
did The Presentation Highlight?
What Opportunity does the Presentation present to improve Service Delivery?
What Legislative Compliance /Impact does it have going forward?
Ms N Naicker (Office of the Premier)
Economic profile of the country and the Gauteng Region
Gauteng growing in terms of immigration
Declining mining activities in the West Rand
TMR: Gauteng’s Roadmap to Vision 2030
Integrated Planning & Delivery
Infrastructure competitiveness
Five Corridors of the Gauteng City Region
West Rand Transformation Agenda, Corridor and Its Critical Gaps
Building an inclusive economy that creates decent jobs
Spatial transformation of rural and urban areas through massive infrastructure development
Ensure decent living conditions and sustainable human settlements
Fragmented government regimes
Decline in income and growing informal settlements in the West Rand
Decrease in the tax base
Ageing infrastructure
Limited economic diversification
Revenue (low economic growth) and MIG unable to meet needs of smaller municipalities
Slowest growth in West Rand – decline of mining
Unemployment
Many migrants would work and never go back “home”. Increasingly Gauteng becomes their permanent home
Youth bulge remains – job opportunities
Contributing towards Green agenda (becoming the Greenest Region in the Country)
Undertaking the Building Blocks towards the amalgamation of all the municipalities
Contributing towards the 12 National Outcomes
Contributing towards the NDP
Resource Mobilisation
Implementation of the Shared Services within the Region
Achieving Clean Audit by 2014 in the whole Region
Use the Green Economy to grow the GDP of the West Rand
Create jobs to combat poverty and dependence
Build a united and prosperous non-racial society
Commit to training and skilling West Rand communities
Build better neighbourhoods throughout the District with
IGR
Constitution of South Africa
Municipal Structures Act
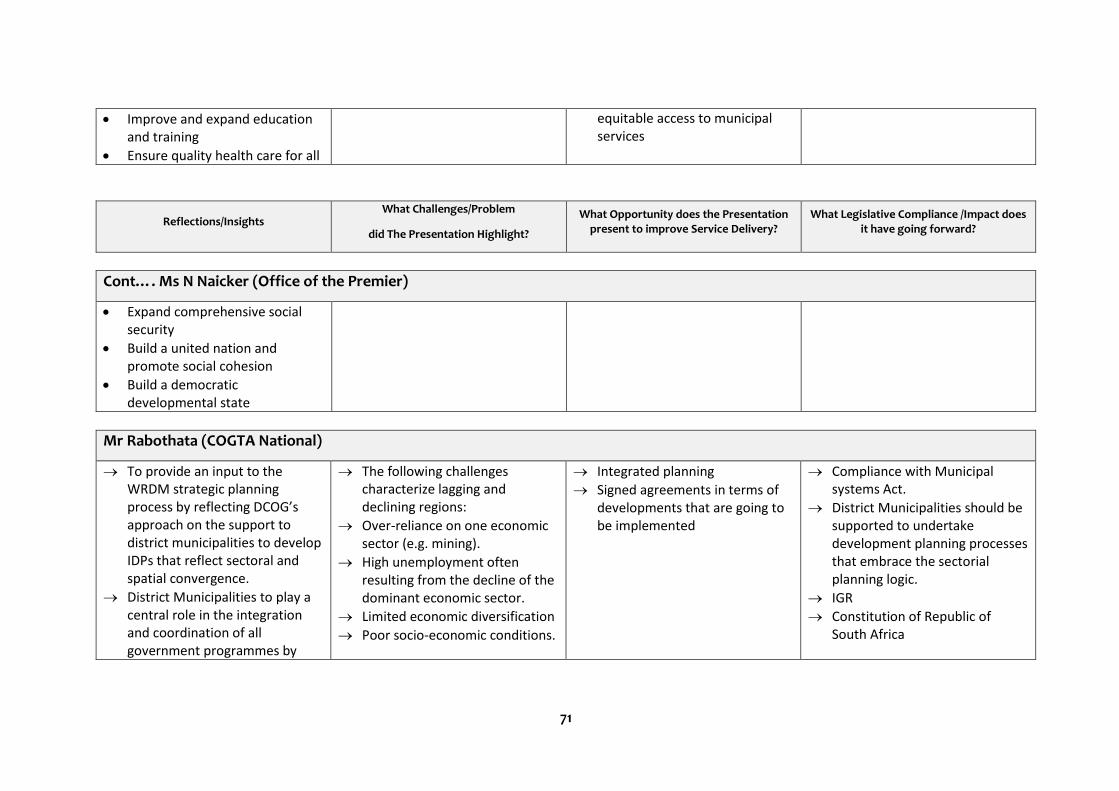
71
Improve and expand education and training
Ensure quality health care for all
equitable access to municipal services
Reflections/Insights What Challenges/Problem
did The Presentation Highlight?
What Opportunity does the Presentation present to improve Service Delivery?
What Legislative Compliance /Impact does it have going forward?
Cont…. Ms N Naicker (Office of the Premier)
Expand comprehensive social security
Build a united nation and promote social cohesion
Build a democratic developmental state
Mr Rabothata (COGTA National)
To provide an input to the WRDM strategic planning process by reflecting DCOG’s approach on the support to district municipalities to develop IDPs that reflect sectoral and spatial convergence.
District Municipalities to play a central role in the integration and coordination of all government programmes by
The following challenges characterize lagging and declining regions:
Over-reliance on one economic sector (e.g. mining).
High unemployment often resulting from the decline of the dominant economic sector.
Limited economic diversification
Poor socio-economic conditions.
Integrated planning
Signed agreements in terms of developments that are going to be implemented
Compliance with Municipal systems Act.
District Municipalities should be supported to undertake development planning processes that embrace the sectorial planning logic.
IGR
Constitution of Republic of South Africa
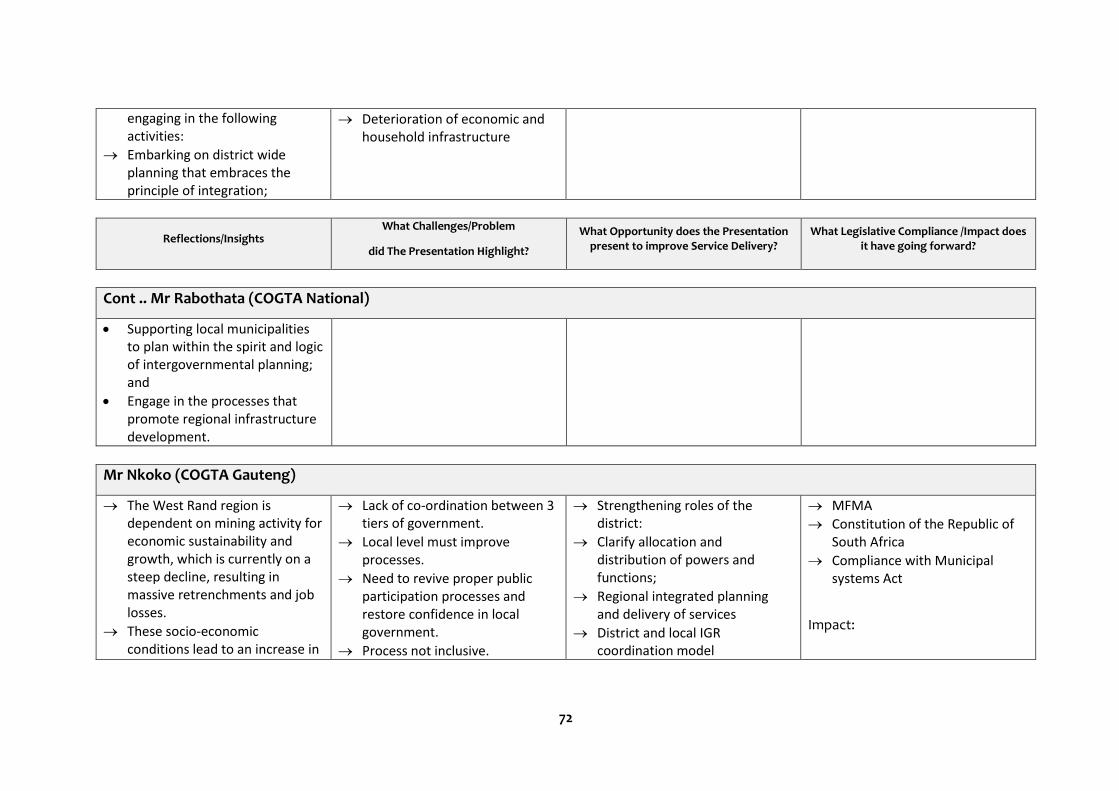
72
engaging in the following activities:
Embarking on district wide planning that embraces the principle of integration;
Deterioration of economic and household infrastructure
Reflections/Insights What Challenges/Problem
did The Presentation Highlight?
What Opportunity does the Presentation present to improve Service Delivery?
What Legislative Compliance /Impact does it have going forward?
Cont .. Mr Rabothata (COGTA National)
Supporting local municipalities to plan within the spirit and logic of intergovernmental planning; and
Engage in the processes that promote regional infrastructure development.
Mr Nkoko (COGTA Gauteng)
The West Rand region is dependent on mining activity for economic sustainability and growth, which is currently on a steep decline, resulting in massive retrenchments and job losses.
These socio-economic conditions lead to an increase in
Lack of co-ordination between 3 tiers of government.
Local level must improve processes.
Need to revive proper public participation processes and restore confidence in local government.
Process not inclusive.
Strengthening roles of the district:
Clarify allocation and distribution of powers and functions;
Regional integrated planning and delivery of services
District and local IGR coordination model
MFMA
Constitution of the Republic of South Africa
Compliance with Municipal systems Act
Impact:
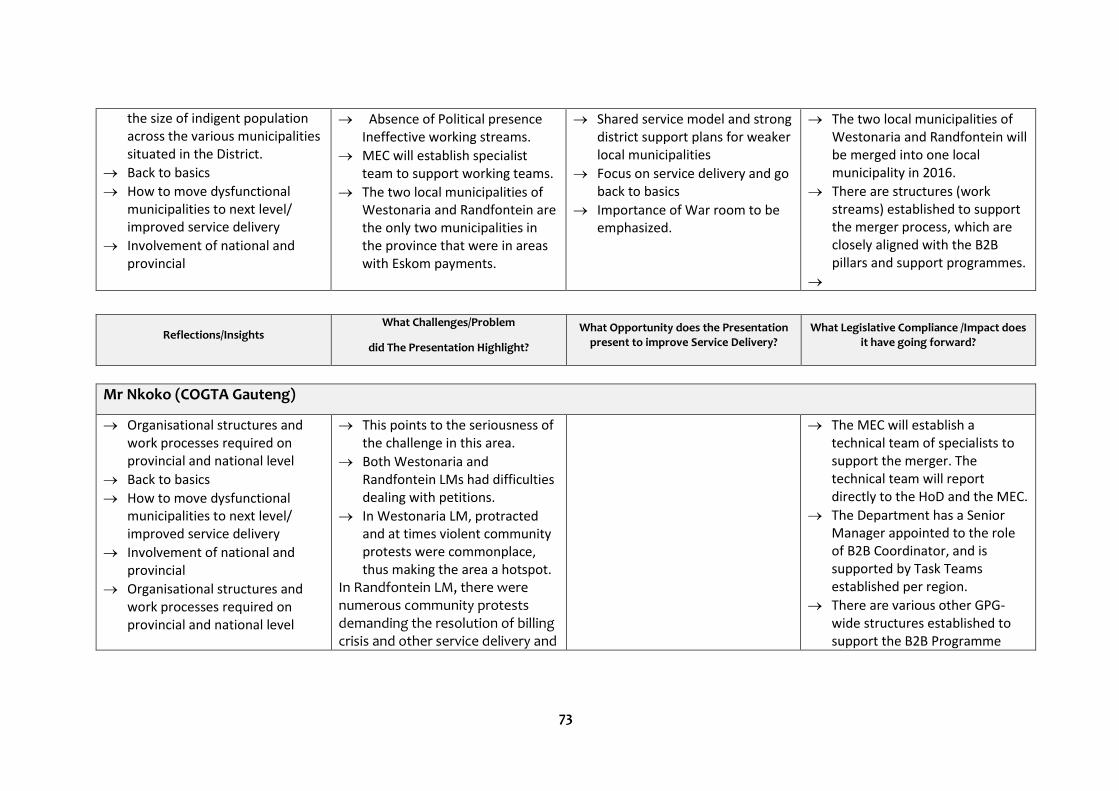
73
the size of indigent population across the various municipalities situated in the District.
Back to basics
How to move dysfunctional municipalities to next level/ improved service delivery
Involvement of national and provincial
Absence of Political presence Ineffective working streams.
MEC will establish specialist team to support working teams.
The two local municipalities of Westonaria and Randfontein are the only two municipalities in the province that were in areas with Eskom payments.
Shared service model and strong district support plans for weaker local municipalities
Focus on service delivery and go back to basics
Importance of War room to be emphasized.
The two local municipalities of Westonaria and Randfontein will be merged into one local municipality in 2016.
There are structures (work streams) established to support the merger process, which are closely aligned with the B2B pillars and support programmes.
Reflections/Insights What Challenges/Problem
did The Presentation Highlight?
What Opportunity does the Presentation present to improve Service Delivery?
What Legislative Compliance /Impact does it have going forward?
Mr Nkoko (COGTA Gauteng)
Organisational structures and work processes required on provincial and national level
Back to basics
How to move dysfunctional municipalities to next level/ improved service delivery
Involvement of national and provincial
Organisational structures and work processes required on provincial and national level
This points to the seriousness of the challenge in this area.
Both Westonaria and Randfontein LMs had difficulties dealing with petitions.
In Westonaria LM, protracted and at times violent community protests were commonplace, thus making the area a hotspot.
In Randfontein LM, there were numerous community protests demanding the resolution of billing crisis and other service delivery and
The MEC will establish a technical team of specialists to support the merger. The technical team will report directly to the HoD and the MEC.
The Department has a Senior Manager appointed to the role of B2B Coordinator, and is supported by Task Teams established per region.
There are various other GPG-wide structures established to support the B2B Programme
74
governance matters, including the removal of the Exec Mayor.
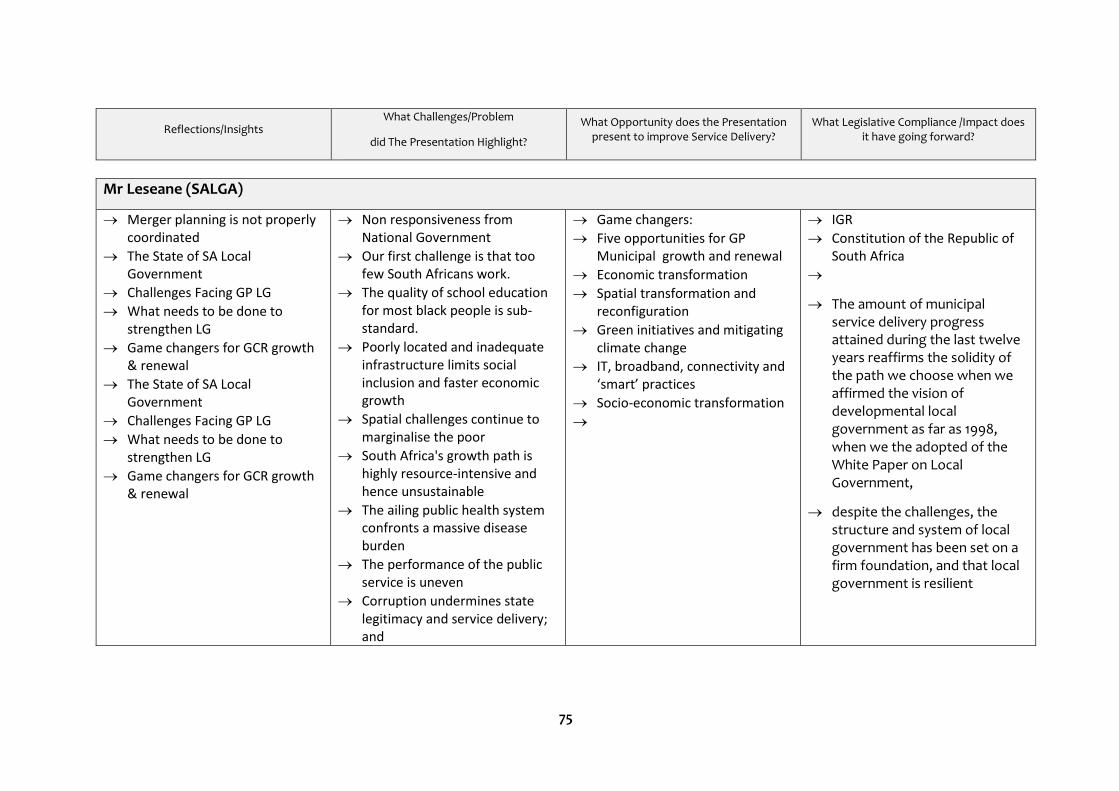
75
Reflections/Insights What Challenges/Problem
did The Presentation Highlight?
What Opportunity does the Presentation present to improve Service Delivery?
What Legislative Compliance /Impact does it have going forward?
Mr Leseane (SALGA)
Merger planning is not properly coordinated
The State of SA Local Government
Challenges Facing GP LG
What needs to be done to strengthen LG
Game changers for GCR growth & renewal
The State of SA Local Government
Challenges Facing GP LG
What needs to be done to strengthen LG
Game changers for GCR growth & renewal
Non responsiveness from National Government
Our first challenge is that too few South Africans work.
The quality of school education for most black people is sub-standard.
Poorly located and inadequate infrastructure limits social inclusion and faster economic growth
Spatial challenges continue to marginalise the poor
South Africa's growth path is highly resource-intensive and hence unsustainable
The ailing public health system confronts a massive disease burden
The performance of the public service is uneven
Corruption undermines state legitimacy and service delivery; and
Game changers:
Five opportunities for GP Municipal growth and renewal
Economic transformation
Spatial transformation and reconfiguration
Green initiatives and mitigating climate change
IT, broadband, connectivity and ‘smart’ practices
Socio-economic transformation
IGR
Constitution of the Republic of South Africa
The amount of municipal service delivery progress attained during the last twelve years reaffirms the solidity of the path we choose when we affirmed the vision of developmental local government as far as 1998, when we the adopted of the White Paper on Local Government,
despite the challenges, the structure and system of local government has been set on a firm foundation, and that local government is resilient
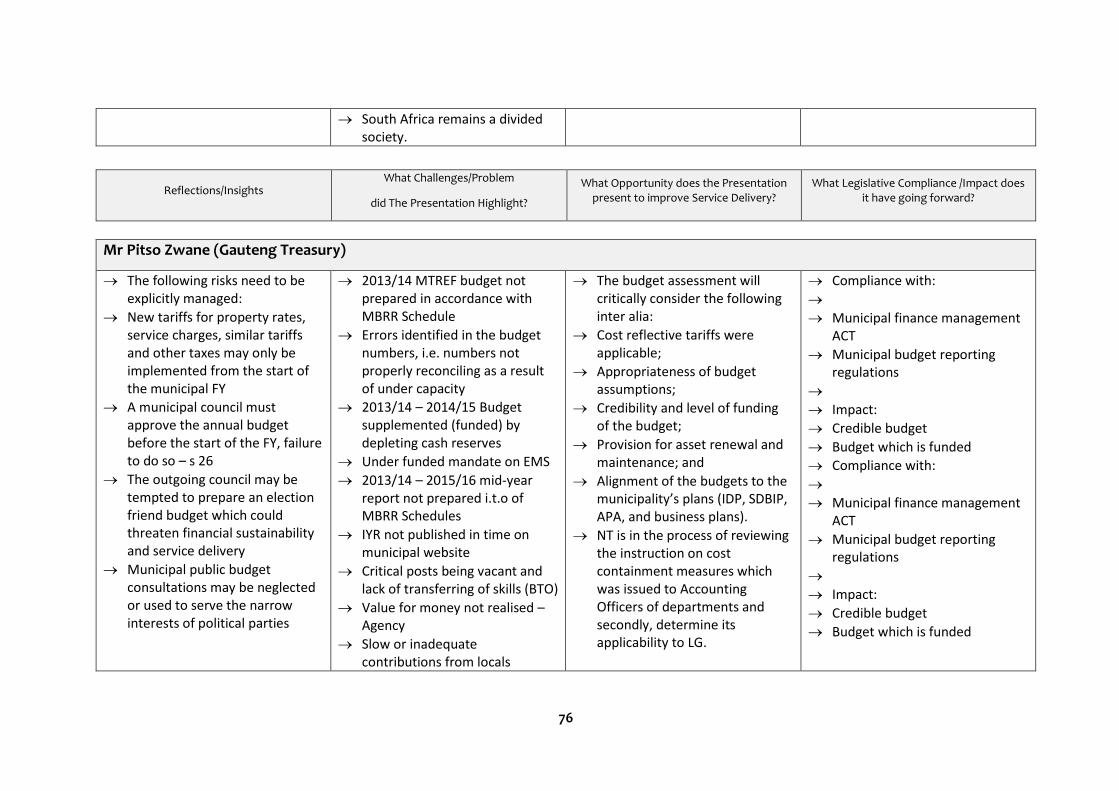
76
South Africa remains a divided society.
Reflections/Insights What Challenges/Problem
did The Presentation Highlight?
What Opportunity does the Presentation present to improve Service Delivery?
What Legislative Compliance /Impact does it have going forward?
Mr Pitso Zwane (Gauteng Treasury)
The following risks need to be explicitly managed:
New tariffs for property rates, service charges, similar tariffs and other taxes may only be implemented from the start of the municipal FY
A municipal council must approve the annual budget before the start of the FY, failure to do so – s 26
The outgoing council may be tempted to prepare an election friend budget which could threaten financial sustainability and service delivery
Municipal public budget consultations may be neglected or used to serve the narrow interests of political parties
2013/14 MTREF budget not prepared in accordance with MBRR Schedule
Errors identified in the budget numbers, i.e. numbers not properly reconciling as a result of under capacity
2013/14 – 2014/15 Budget supplemented (funded) by depleting cash reserves
Under funded mandate on EMS
2013/14 – 2015/16 mid-year report not prepared i.t.o of MBRR Schedules
IYR not published in time on municipal website
Critical posts being vacant and lack of transferring of skills (BTO)
Value for money not realised – Agency
Slow or inadequate contributions from locals
The budget assessment will critically consider the following inter alia:
Cost reflective tariffs were applicable;
Appropriateness of budget assumptions;
Credibility and level of funding of the budget;
Provision for asset renewal and maintenance; and
Alignment of the budgets to the municipality’s plans (IDP, SDBIP, APA, and business plans).
NT is in the process of reviewing the instruction on cost containment measures which was issued to Accounting Officers of departments and secondly, determine its applicability to LG.
Compliance with:
Municipal finance management ACT
Municipal budget reporting regulations
Impact:
Credible budget
Budget which is funded
Compliance with:
Municipal finance management ACT
Municipal budget reporting regulations
Impact:
Credible budget
Budget which is funded
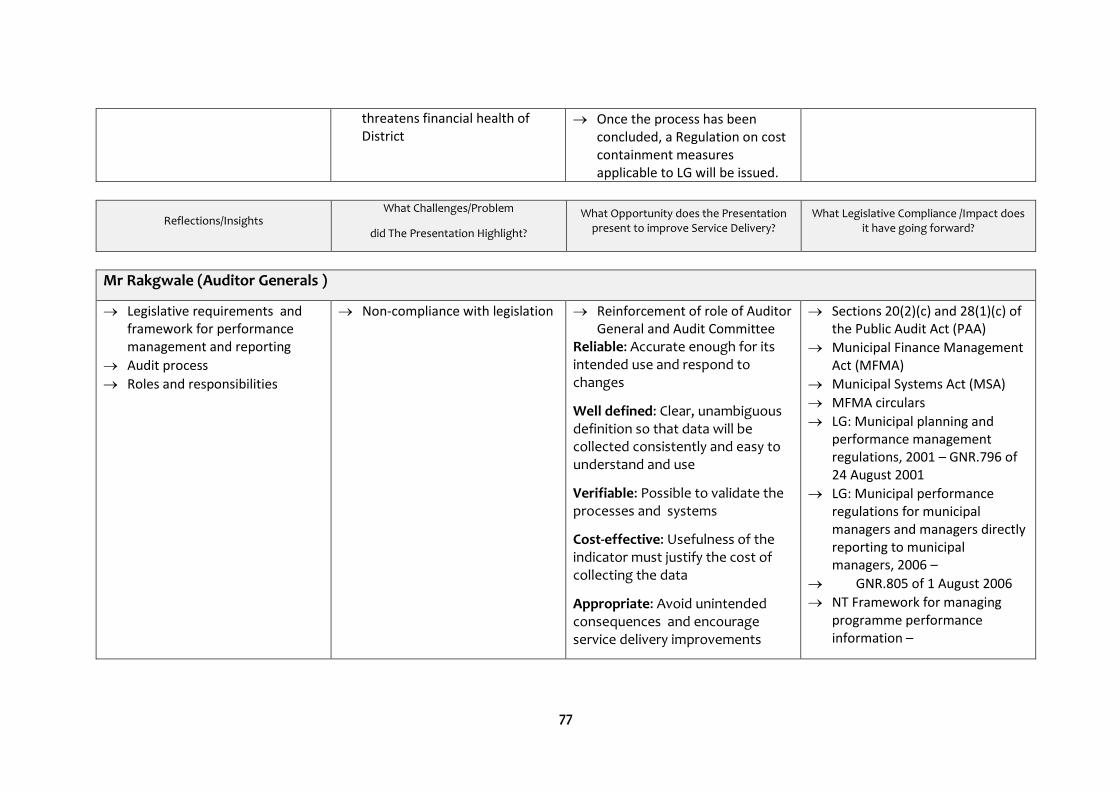
77
threatens financial health of District
Once the process has been concluded, a Regulation on cost containment measures applicable to LG will be issued.
Reflections/Insights What Challenges/Problem
did The Presentation Highlight?
What Opportunity does the Presentation present to improve Service Delivery?
What Legislative Compliance /Impact does it have going forward?
Mr Rakgwale (Auditor Generals )
Legislative requirements and framework for performance management and reporting
Audit process
Roles and responsibilities
Non-compliance with legislation Reinforcement of role of Auditor General and Audit Committee
Reliable: Accurate enough for its intended use and respond to changes
Well defined: Clear, unambiguous definition so that data will be collected consistently and easy to understand and use
Verifiable: Possible to validate the processes and systems
Cost-effective: Usefulness of the indicator must justify the cost of collecting the data
Appropriate: Avoid unintended consequences and encourage service delivery improvements
Sections 20(2)(c) and 28(1)(c) of the Public Audit Act (PAA)
Municipal Finance Management Act (MFMA)
Municipal Systems Act (MSA)
MFMA circulars
LG: Municipal planning and performance management regulations, 2001 – GNR.796 of 24 August 2001
LG: Municipal performance regulations for municipal managers and managers directly reporting to municipal managers, 2006 –
GNR.805 of 1 August 2006
NT Framework for managing programme performance information –
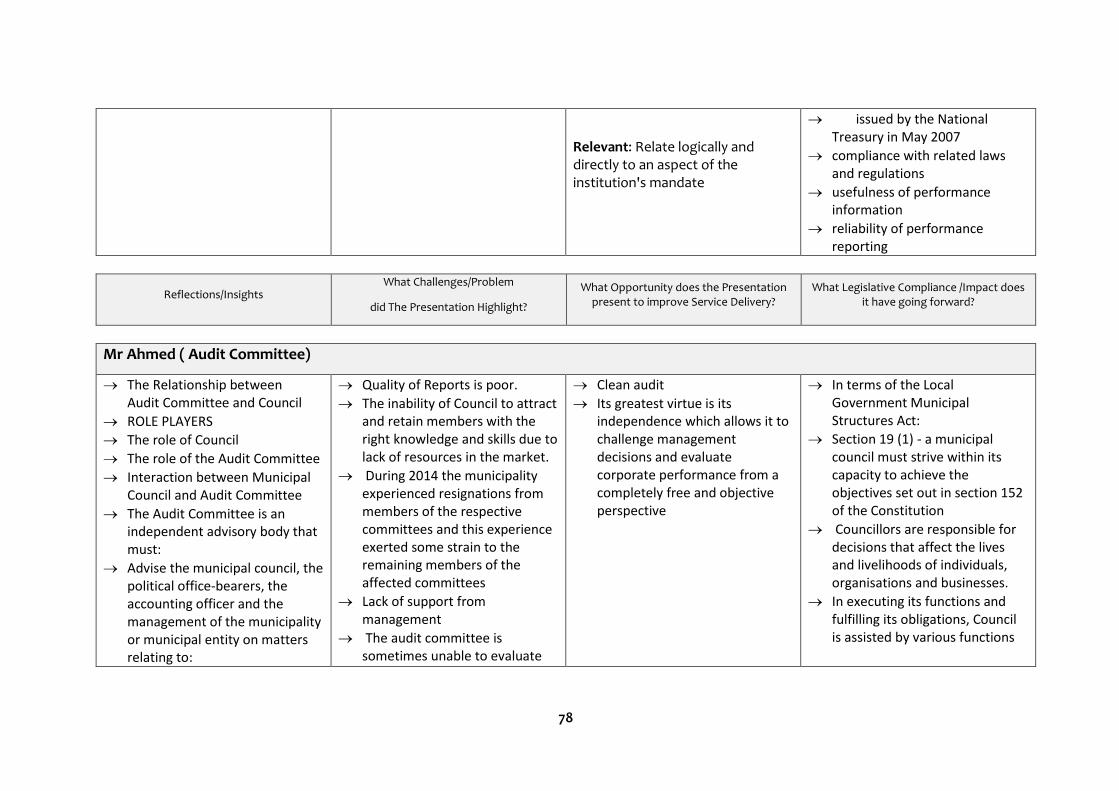
78
Relevant: Relate logically and directly to an aspect of the institution's mandate
issued by the National Treasury in May 2007
compliance with related laws and regulations
usefulness of performance information
reliability of performance reporting
Reflections/Insights What Challenges/Problem
did The Presentation Highlight?
What Opportunity does the Presentation present to improve Service Delivery?
What Legislative Compliance /Impact does it have going forward?
Mr Ahmed ( Audit Committee)
The Relationship between Audit Committee and Council
ROLE PLAYERS
The role of Council
The role of the Audit Committee
Interaction between Municipal Council and Audit Committee
The Audit Committee is an independent advisory body that must:
Advise the municipal council, the political office-bearers, the accounting officer and the management of the municipality or municipal entity on matters relating to:
Quality of Reports is poor.
The inability of Council to attract and retain members with the right knowledge and skills due to lack of resources in the market.
During 2014 the municipality experienced resignations from members of the respective committees and this experience exerted some strain to the remaining members of the affected committees
Lack of support from management
The audit committee is sometimes unable to evaluate
Clean audit
Its greatest virtue is its independence which allows it to challenge management decisions and evaluate corporate performance from a completely free and objective perspective
In terms of the Local Government Municipal Structures Act:
Section 19 (1) - a municipal council must strive within its capacity to achieve the objectives set out in section 152 of the Constitution
Councillors are responsible for decisions that affect the lives and livelihoods of individuals, organisations and businesses.
In executing its functions and fulfilling its obligations, Council is assisted by various functions
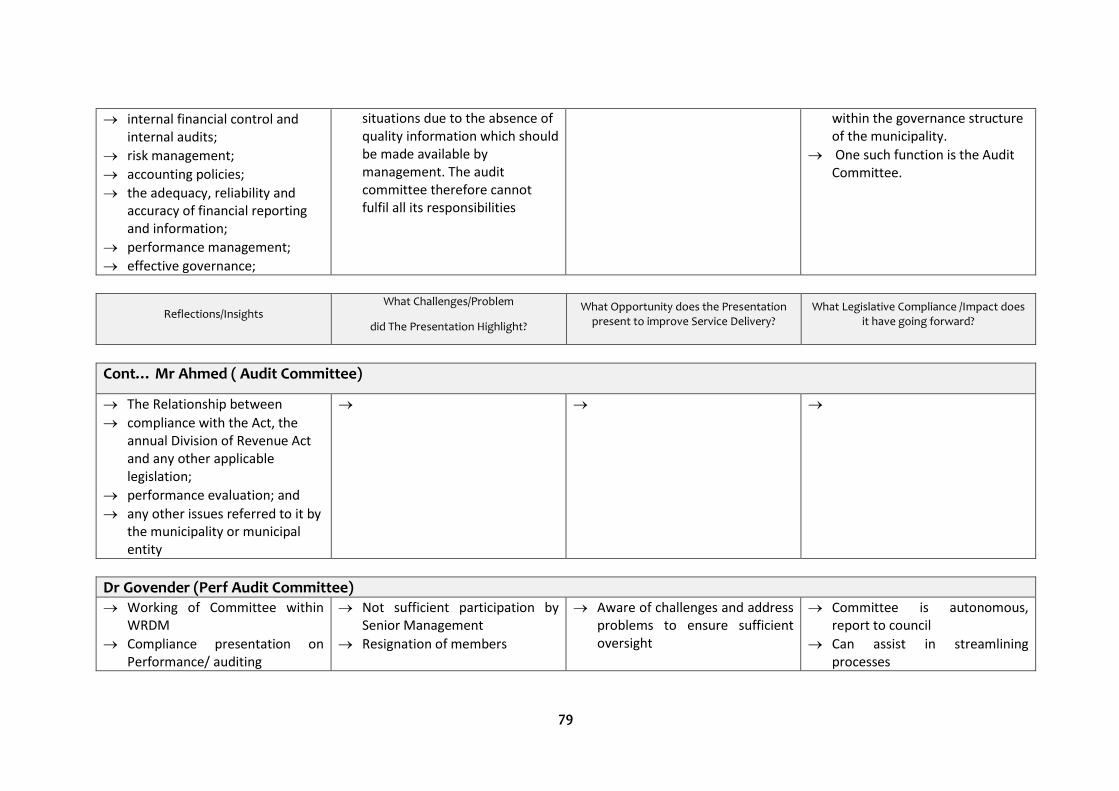
79
internal financial control and internal audits;
risk management;
accounting policies;
the adequacy, reliability and accuracy of financial reporting and information;
performance management;
effective governance;
situations due to the absence of quality information which should be made available by management. The audit committee therefore cannot fulfil all its responsibilities
within the governance structure of the municipality.
One such function is the Audit Committee.
Reflections/Insights What Challenges/Problem
did The Presentation Highlight?
What Opportunity does the Presentation present to improve Service Delivery?
What Legislative Compliance /Impact does it have going forward?
Cont… Mr Ahmed ( Audit Committee)
The Relationship between
compliance with the Act, the annual Division of Revenue Act and any other applicable legislation;
performance evaluation; and
any other issues referred to it by the municipality or municipal entity
Dr Govender (Perf Audit Committee) Working of Committee within
WRDM
Compliance presentation on Performance/ auditing
Not sufficient participation by Senior Management
Resignation of members
Aware of challenges and address problems to ensure sufficient oversight
Committee is autonomous, report to council
Can assist in streamlining processes
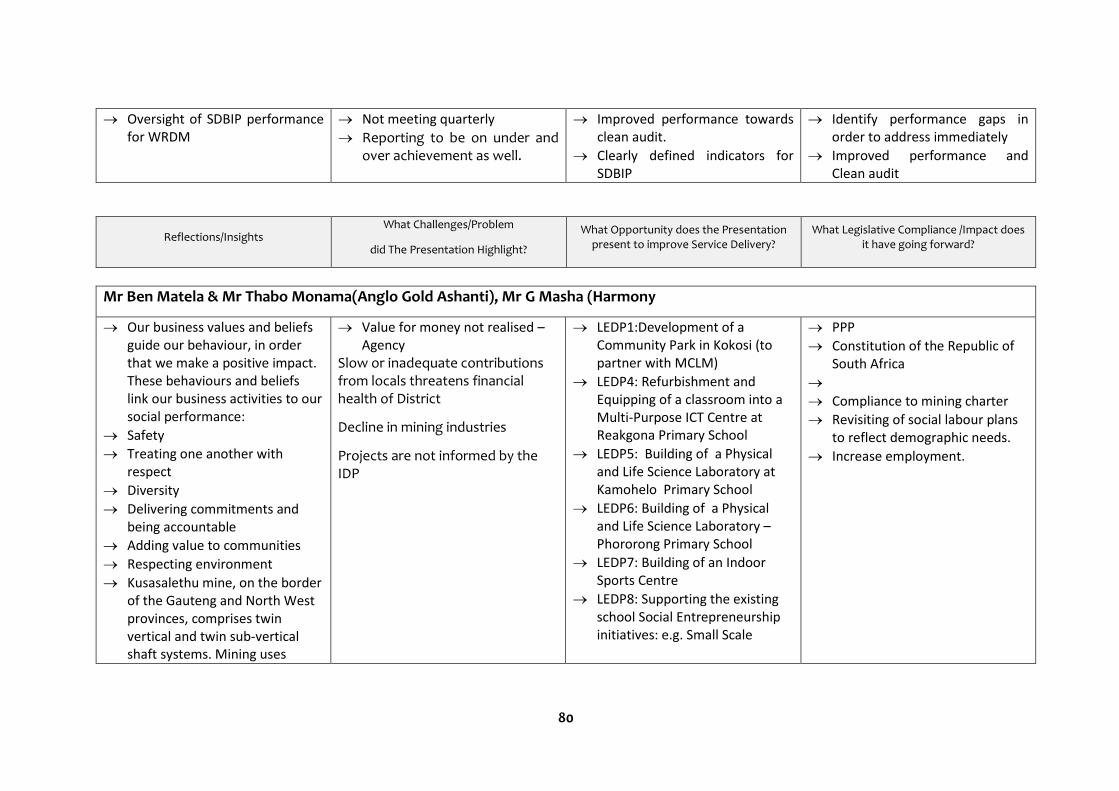
80
Oversight of SDBIP performance for WRDM
Not meeting quarterly
Reporting to be on under and over achievement as well.
Improved performance towards clean audit.
Clearly defined indicators for SDBIP
Identify performance gaps in order to address immediately
Improved performance and Clean audit
Reflections/Insights What Challenges/Problem
did The Presentation Highlight?
What Opportunity does the Presentation present to improve Service Delivery?
What Legislative Compliance /Impact does it have going forward?
Mr Ben Matela & Mr Thabo Monama(Anglo Gold Ashanti), Mr G Masha (Harmony
Our business values and beliefs guide our behaviour, in order that we make a positive impact. These behaviours and beliefs link our business activities to our social performance:
Safety
Treating one another with respect
Diversity
Delivering commitments and being accountable
Adding value to communities
Respecting environment
Kusasalethu mine, on the border of the Gauteng and North West provinces, comprises twin vertical and twin sub-vertical shaft systems. Mining uses
Value for money not realised – Agency
Slow or inadequate contributions from locals threatens financial health of District
Decline in mining industries
Projects are not informed by the IDP
LEDP1:Development of a Community Park in Kokosi (to partner with MCLM)
LEDP4: Refurbishment and Equipping of a classroom into a Multi-Purpose ICT Centre at Reakgona Primary School
LEDP5: Building of a Physical and Life Science Laboratory at Kamohelo Primary School
LEDP6: Building of a Physical and Life Science Laboratory – Phororong Primary School
LEDP7: Building of an Indoor Sports Centre
LEDP8: Supporting the existing school Social Entrepreneurship initiatives: e.g. Small Scale
PPP
Constitution of the Republic of South Africa
Compliance to mining charter
Revisiting of social labour plans to reflect demographic needs.
Increase employment.
81
conventional methods in a sequential grid layout. Ore mined is treated at the Kusasalethu plant:
Safety
Treating one another with respect
Diversity
Delivering commitments and being accountable
Adding value to communities
Respecting environment
Income Generating and poverty alleviation Agricultural projects
LEDP9:Building and equipping of Physical Science Laboratory at Wedela Primary School
LED : Business Development Park (EDC) – In Partnership with Jobs Fund
WW ED 1: Youth Business Hubs
WW ED 2: Agricultural Project
LED 1: Urban Planning & Formalisation of Non-Urban AGA Land and Property Holdings
Merafong Digital Hub
Merafong Waste Recycling
SMME Development –Branding of Stalls
Nooidgedaght Farmer Support
Deelkraal Community Rental Units
Khutsong Business Centre
Laboratories and Computer Centre at Khutsong
Sports and Recreation Programme
Project-based Entrepreneurial Skills Development
Merafong Digital Hub
82
Merafong Waste Recycling
SMME Development –Branding of Stalls
Nooidgedaght Farmer Support
Deelkraal Community Rental Units
Khutsong Business Centre
Laboratories and Computer Centre at Khutsong
Sports and Recreation Programme
Project-based Entrepreneurial Skills Development
83
1.5.1. UNDERSTANDING THE SPATIAL ECONOMY
This IDP is formulated within the context of the new policy directive in the form of the
National Spatial Development Perspective. This policy context should be recognized as it is to
shape the analysis of the challenges at hand as well as the interventions in terms of
development objectives, strategies and projects. The NSDP argues that poverty, inequality
and deprivation are manifested in space. This policy directive appreciates that while strategic
planning is important and probably the correct approach given the challenges at hand, its
effectiveness is reliant on mixing it with spatial planning.
The approach of spatially referencing our analysis and intervention maximises overall social
and economic impact of government investment and provides a rigorous basis for
interpreting strategic direction in terms of what type of intervention is effective, in what type
of areas. In line with the NSDP principles that, given our objective to grow the economy,
create jobs, address poverty and promote social cohesion, our IDP should enable us to say:
Where should government direct its investment and development initiatives to ensure
sustainable and maximum impact; and
What kinds of spatial forms and arrangements would be more conducive to the
achievement of our objectives of democratic nation building and social and economic
inclusion
Success is mainly achieved through focused and polarised investment. Taking its cue from
theory and studies discussed above, the National Spatial Development Perspective (NSDP)
argues that:
Location is critical to enable the poor to exploit opportunities for growth;
Poor people concentrated around economic centres have greater opportunity to gain
from economic growth;
Areas with demonstrated economic potential provide greater protection due to
greater diversity of income sources; and
Areas with demonstrated economic potential are well positioned to contribute in
overcoming poverty.
Again, to take this proven theory on the space economy the NSDP puts forward a set of five
normative principles in order to contribute to the broader growth and development policy
objectives of government:
Principle 1
Rapid economic growth that is sustained and inclusive is a pre-requisite for the
achievement of other policy objectives, amongst which poverty alleviation is a key
issue.
SECTION E: 1.5 SPATIAL ECONOMY AND DEVELOPMENT RATIONALE
84
Principle 2
Government has a constitutional obligation to provide basic services to all citizens
(e.g. water, energy, health and educational facilities) wherever they reside.
Principle 3
Beyond the constitutional obligation identified in Principle 2 above, government
spending on fixed investment should be focused on localities of economic growth
and/or economic potential in order to gear up private sector investment, stimulate
sustainable economic activities and create long-term employment opportunities.
Principle 4
Efforts to address past and current social inequalities should focus on people, not
places.
In localities where there are both high levels of poverty and demonstrated economic
potential, this could include fixed capital investment to exploit the potential of those
localities.
In localities with low economic potential, government should, beyond the provision of
essential services, concentrate primarily on human capital development. This can be
done by providing social transfers such as grants, education and training poverty relief
programmes and reducing migration costs by providing labour market intelligence so
as to give people better information, opportunities and capabilities. This would enable
people to gravitate, if they so desired, to localities that are more likely to provide
sustainable employment and economic opportunities. In addition, sound rural
development planning, aggressive land and agrarian reform as well as expansion of
agricultural extension services are crucial
Principle 5
In order to overcome the spatial distortions of apartheid, future settlement and
economic development opportunities should be channelled into activity corridors
and nodes that are adjacent to or link the main growth centres. Infrastructure
investment should primarily support localities that will become major growth
nodes;
The NSDP further gives a directive that investment and development plans should
support the country‟s growth and development objectives by focusing growth and
employment in areas where it is effective and sustainable;
supporting restructuring to ensure competitiveness;
fostering development on the basis of development potential; and
ensuring that basic needs are addressed
1.5.2. DEVELOPMENT RATIONALE
Two fundamental theories influence the formulation or development of all policies adopted
by all structures of the South African State at all levels. The first theory is that local
government should be a developmental local government i.e. it should be an agent for
development of communities and also the approach to service provision needs to be
developmental. The second theory is that of understanding the space economy in the sense
85
that different geographic spaces in any country, province or municipality have different social
and economic potential. It further argues that investment should be targeted according to
the varying potential.
1.5.2.1 DEVELOPMENTAL LOCAL GOVERNMENT
A developmental local government is best understood when defined through the
developmental state. A prerequisite to developmental local government is a developmental
state, as it never exists in isolation and always within the framework of a broader state. Ours
is not just a developmental state, but a democratic developmental state. A democratic
developmental state is not only able to transform its economic base by promoting productive,
income generating economic activities, but must ensure that economic growth has the
resultant effect of improving the living conditions of the majority of its population.
To position a state in such a way that it realises its intentions to be developmental, it needs
to have clearly defined socio-economic objectives that require active state intervention.
According to research, what sets a developmental state apart from others is that not only is
it able to clearly set its development objectives, it also establishes institutional structures
geared to achieve the set objectives.
1.5.2.2. DEFINING THE INTEGRATED DEVELOPMENT PLAN
The Municipal Systems Act (Act No. 32 of 2000) stipulates that all municipalities in South
Africa must prepare an Integrated Development Planning (IDP) for their area of jurisdiction.
IDP is a continuous process whereby municipalities prepare a five year strategic
developmental plan. These plans are reviewed annually in consultation with communities and
stakeholders. These plans seek to promote integration by balancing social, economic and
ecological pillars of sustainability without compromising the institutional capacity required in
the implementation, and by co-ordinating actions across sectors and spheres of government.
An IDP is a single inclusive strategic plan for municipalities that:
integrates and co-ordinates service delivery within a municipality;
forms the general basis on which annual budgets must be based;
aligns the resources and capacity of the municipality within the implementation of the
plan; and
Assists a municipality in fulfilling its constitutional mandate as a developmental local
government; and, facilitates the process of democratisation through vigorous public
participation.
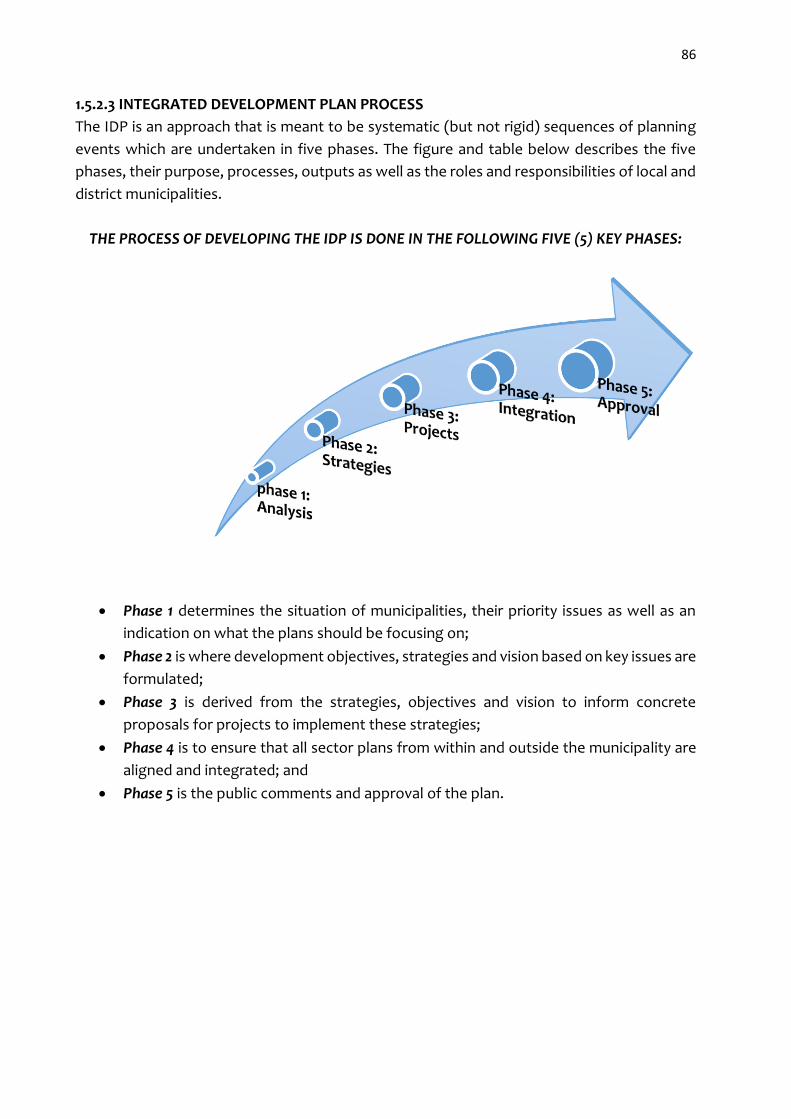
86
1.5.2.3 INTEGRATED DEVELOPMENT PLAN PROCESS
The IDP is an approach that is meant to be systematic (but not rigid) sequences of planning
events which are undertaken in five phases. The figure and table below describes the five
phases, their purpose, processes, outputs as well as the roles and responsibilities of local and
district municipalities.
THE PROCESS OF DEVELOPING THE IDP IS DONE IN THE FOLLOWING FIVE (5) KEY PHASES:
Phase 1 determines the situation of municipalities, their priority issues as well as an
indication on what the plans should be focusing on;
Phase 2 is where development objectives, strategies and vision based on key issues are
formulated;
Phase 3 is derived from the strategies, objectives and vision to inform concrete
proposals for projects to implement these strategies;
Phase 4 is to ensure that all sector plans from within and outside the municipality are
aligned and integrated; and
Phase 5 is the public comments and approval of the plan.
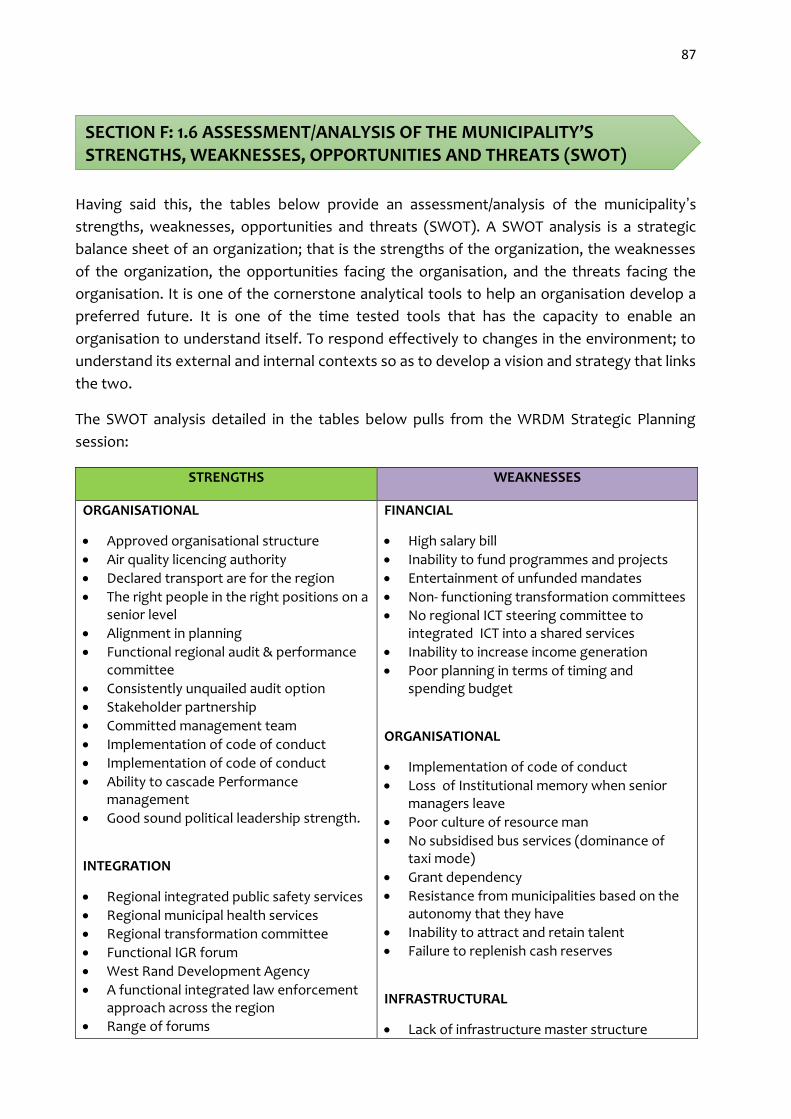
87
Having said this, the tables below provide an assessment/analysis of the municipality’s
strengths, weaknesses, opportunities and threats (SWOT). A SWOT analysis is a strategic
balance sheet of an organization; that is the strengths of the organization, the weaknesses
of the organization, the opportunities facing the organisation, and the threats facing the
organisation. It is one of the cornerstone analytical tools to help an organisation develop a
preferred future. It is one of the time tested tools that has the capacity to enable an
organisation to understand itself. To respond effectively to changes in the environment; to
understand its external and internal contexts so as to develop a vision and strategy that links
the two.
The SWOT analysis detailed in the tables below pulls from the WRDM Strategic Planning
session:
STRENGTHS WEAKNESSES
ORGANISATIONAL
Approved organisational structure
Air quality licencing authority
Declared transport are for the region
The right people in the right positions on a senior level
Alignment in planning
Functional regional audit & performance committee
Consistently unquailed audit option
Stakeholder partnership
Committed management team
Implementation of code of conduct
Implementation of code of conduct
Ability to cascade Performance management
Good sound political leadership strength.
INTEGRATION
Regional integrated public safety services
Regional municipal health services
Regional transformation committee
Functional IGR forum
West Rand Development Agency
A functional integrated law enforcement approach across the region
Range of forums
FINANCIAL
High salary bill
Inability to fund programmes and projects
Entertainment of unfunded mandates
Non- functioning transformation committees
No regional ICT steering committee to integrated ICT into a shared services
Inability to increase income generation
Poor planning in terms of timing and spending budget
ORGANISATIONAL
Implementation of code of conduct
Loss of Institutional memory when senior managers leave
Poor culture of resource man
No subsidised bus services (dominance of taxi mode)
Grant dependency
Resistance from municipalities based on the autonomy that they have
Inability to attract and retain talent
Failure to replenish cash reserves
INFRASTRUCTURAL
Lack of infrastructure master structure
SECTION F: 1.6 ASSESSMENT/ANALYSIS OF THE MUNICIPALITY’S STRENGTHS, WEAKNESSES, OPPORTUNITIES AND THREATS (SWOT)
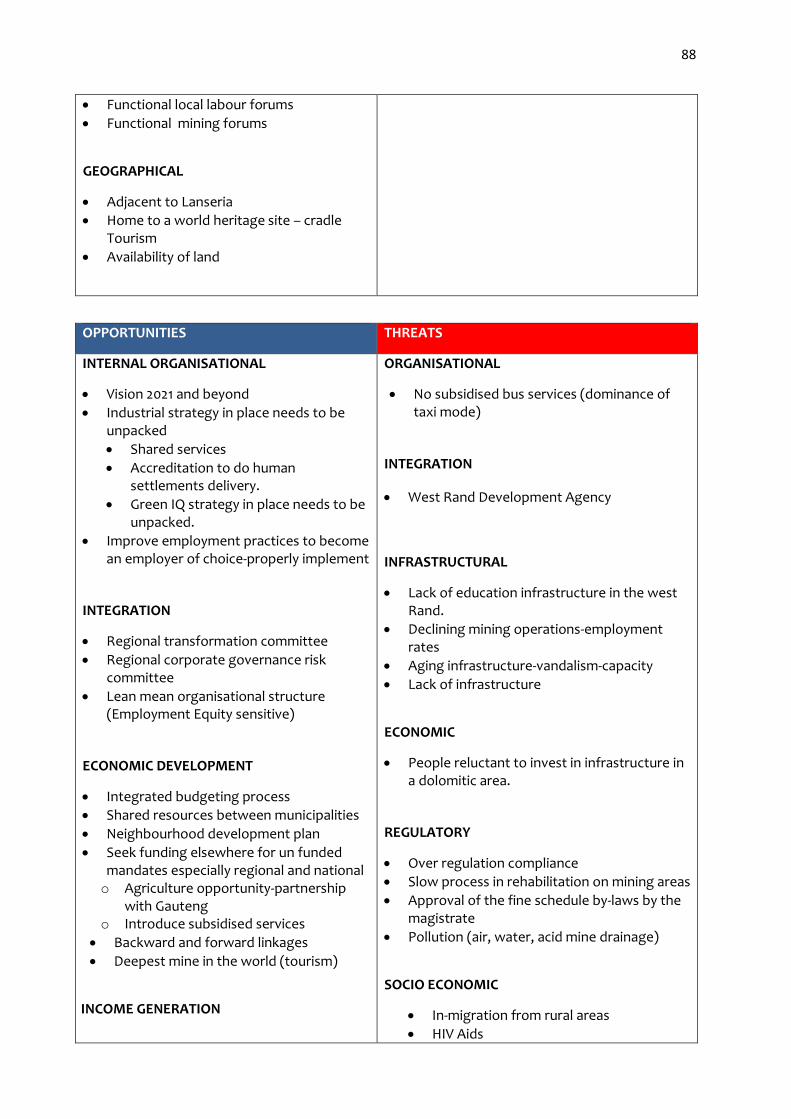
88
Functional local labour forums
Functional mining forums
GEOGRAPHICAL
Adjacent to Lanseria
Home to a world heritage site – cradle Tourism
Availability of land
OPPORTUNITIES THREATS
INTERNAL ORGANISATIONAL
Vision 2021 and beyond
Industrial strategy in place needs to be unpacked
Shared services
Accreditation to do human settlements delivery.
Green IQ strategy in place needs to be unpacked.
Improve employment practices to become an employer of choice-properly implement
INTEGRATION
Regional transformation committee
Regional corporate governance risk committee
Lean mean organisational structure (Employment Equity sensitive)
ECONOMIC DEVELOPMENT
Integrated budgeting process
Shared resources between municipalities
Neighbourhood development plan
Seek funding elsewhere for un funded mandates especially regional and national o Agriculture opportunity-partnership
with Gauteng o Introduce subsidised services
Backward and forward linkages
Deepest mine in the world (tourism)
INCOME GENERATION
ORGANISATIONAL
No subsidised bus services (dominance of taxi mode)
INTEGRATION
West Rand Development Agency
INFRASTRUCTURAL
Lack of education infrastructure in the west Rand.
Declining mining operations-employment rates
Aging infrastructure-vandalism-capacity
Lack of infrastructure
ECONOMIC
People reluctant to invest in infrastructure in a dolomitic area.
REGULATORY
Over regulation compliance
Slow process in rehabilitation on mining areas
Approval of the fine schedule by-laws by the magistrate
Pollution (air, water, acid mine drainage)
SOCIO ECONOMIC
In-migration from rural areas
HIV Aids
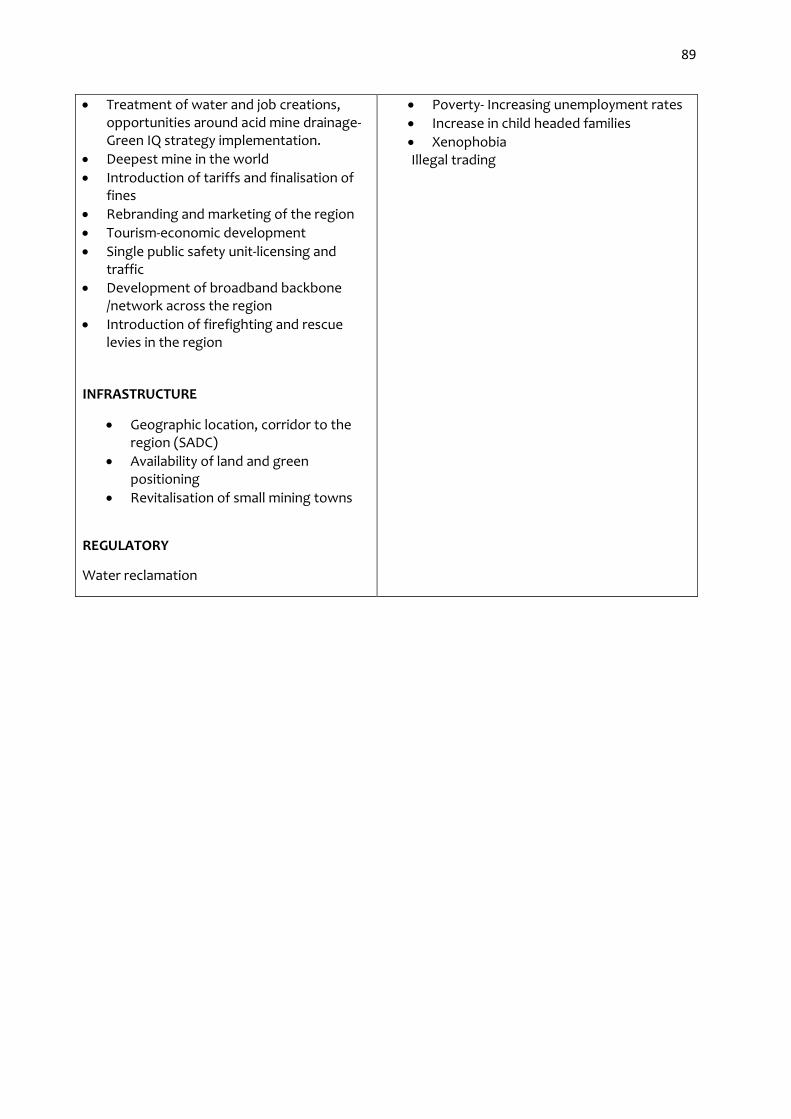
89
Treatment of water and job creations, opportunities around acid mine drainage-Green IQ strategy implementation.
Deepest mine in the world
Introduction of tariffs and finalisation of fines
Rebranding and marketing of the region
Tourism-economic development
Single public safety unit-licensing and traffic
Development of broadband backbone /network across the region
Introduction of firefighting and rescue levies in the region
INFRASTRUCTURE
Geographic location, corridor to the region (SADC)
Availability of land and green positioning
Revitalisation of small mining towns
REGULATORY
Water reclamation
Poverty- Increasing unemployment rates
Increase in child headed families
Xenophobia Illegal trading
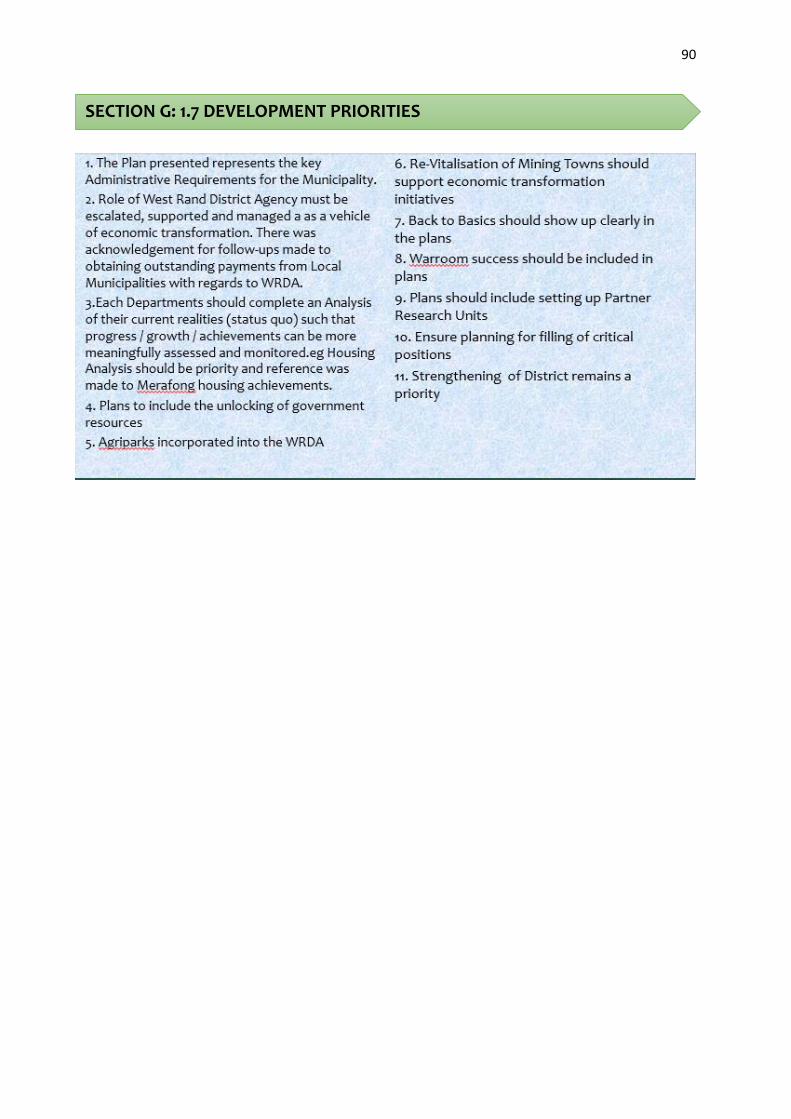
90
SECTION G: 1.7 DEVELOPMENT PRIORITIES
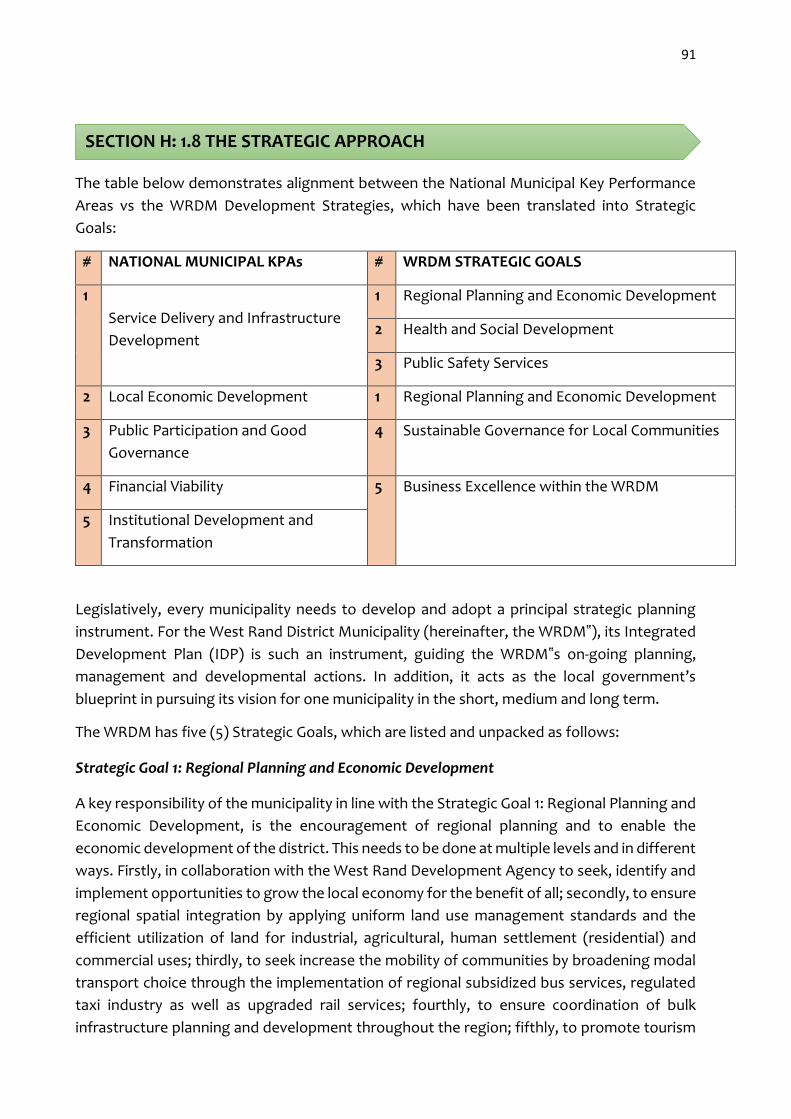
91
The table below demonstrates alignment between the National Municipal Key Performance
Areas vs the WRDM Development Strategies, which have been translated into Strategic
Goals:
# NATIONAL MUNICIPAL KPAs # WRDM STRATEGIC GOALS
1
Service Delivery and Infrastructure
Development
1 Regional Planning and Economic Development
2 Health and Social Development
3 Public Safety Services
2 Local Economic Development 1 Regional Planning and Economic Development
3 Public Participation and Good
Governance
4 Sustainable Governance for Local Communities
4 Financial Viability 5 Business Excellence within the WRDM
5 Institutional Development and
Transformation
Legislatively, every municipality needs to develop and adopt a principal strategic planning
instrument. For the West Rand District Municipality (hereinafter, the WRDM‟), its Integrated
Development Plan (IDP) is such an instrument, guiding the WRDM‟s on-going planning,
management and developmental actions. In addition, it acts as the local government’s
blueprint in pursuing its vision for one municipality in the short, medium and long term.
The WRDM has five (5) Strategic Goals, which are listed and unpacked as follows:
Strategic Goal 1: Regional Planning and Economic Development
A key responsibility of the municipality in line with the Strategic Goal 1: Regional Planning and
Economic Development, is the encouragement of regional planning and to enable the
economic development of the district. This needs to be done at multiple levels and in different
ways. Firstly, in collaboration with the West Rand Development Agency to seek, identify and
implement opportunities to grow the local economy for the benefit of all; secondly, to ensure
regional spatial integration by applying uniform land use management standards and the
efficient utilization of land for industrial, agricultural, human settlement (residential) and
commercial uses; thirdly, to seek increase the mobility of communities by broadening modal
transport choice through the implementation of regional subsidized bus services, regulated
taxi industry as well as upgraded rail services; fourthly, to ensure coordination of bulk
infrastructure planning and development throughout the region; fifthly, to promote tourism
SECTION H: 1.8 THE STRATEGIC APPROACH
92
as comparative advantage in support of diversification of the regional economy; and finally,
to give effect to the principles of Green IQ by creating awareness of natural environment,
protecting environmental resources and improving compliance with air quality standards
throughout the region.
Strategic Goal 2: Health and Social Development
This relates to the provision of environmental health services and promotion of a healthy
lifestyle among communities. In addition, the department runs programs that build the nation
in terms of creating a platform to promote sport, art, culture and recreation thereby bringing
people together.
Strategic Goal 3: Public Safety Services
The West Rand District Municipality's Public Safety Strategic Goal is aimed at harnessing all
multi-disciplinary and multi-sectoral contributions, into the establishment and sustaining of a
safe and healthy living environment. Within which, risk and vulnerability is effectively
managed and mitigated through a collective process of participation tenacity and
commitment. This phenomenon is also encouraged by the provisions of the National
Outcome 3, which requires the West Rand District Municipality to ensure that its communities
are and feel safe. Therefore, creating a healthy and safe living environment for communities
becomes a fundamental Constitutional mandate for the WRDM and its four constituent local
municipalities.
Strategic Goal 4: Sustainable Governance for Local Communities
The municipality ensures high level of corporate governance through the implementation of
adequate and effective internal controls, risk management and governance processes that
enables deepening democracy and fostering social cohesion.
Strategic Goal 5: Business Excellence within the WRDM
In an effort to excel in business operations, the WRDM ensures effective and efficient
implementation of its strategic plan, while at the same time, focusing on compliance to
legislative requirements, performance monitoring and reporting against the predetermined
objectives. The WRDM also envisages receiving a Clean Audit report, through fairly presented
Annual Financial Statements to the Auditor General of South Africa; processing tenders within
90 days after the closing date as well as paying of creditors within 30 days. Having said this,
the WRDM also aims to have a highly productive and work engaged workforce with an
established ICT Governance Framework.
93
As early as 2003, a need had been recognized for a newer and bigger city on the West Rand
as part of the Global City Region concept. It was envisaged that this would finally undermine
former apartheid-era demarcations and structures.
In 2007, a feasibility study was commissioned and this recommended a single tier of local
government, which became known as a “Unicity”. The feasibility study had drawn
comparisons with other secondary cities such as Buffalo City and Mangaung. The case study
of Johannesburg was also utilized. The proposal was for a single governance structure for the
geographic areas of Mogale City, Randfontein, Westonaria and Merafong City with integrated
governance powers and functions.
The West Rand lobbied the entire government, from National, Provincial to Local and
organised local government (SALGA). In 2009, a Transformation Committee was established
by resolutions of all the relevant Councils. In 2011 the Transformation Committee was
reconstituted. It is currently a multi-party committee composed of 15 councillors and
supported by technical committees which do research and develop items for consideration.
It should be noted that the West Rand was aspiring to what was called a “B1 municipality”.
This meant that the unification into a metro would be preceded by a single municipality or
secondary city which was aspiring to become a metro. However, changes to legislation would
be necessary before a category B1 municipality could exist without a District.
Therefore in 2011, due to existing legislation, the West Rand submission to the Municipal
Demarcation Board (MDB) proposed a category A municipality by 2016 instead of a B1
Municipality. Subsequent engagements and submissions proposing that the West Rand
municipalities and District should amalgamate as a single category A municipality, have not
had a positive response from the MDB.
The Transformation Committee is convinced after comparative studies that West Rand does
qualify as a Unicity. In 2012, SALGA seconded a Transformation Manager to the WRDM and a
secretariat was also established to administer transformation issues. It was also noted that
the weakness in some merger proposals had been the lack of community consultation. In
contrast the West Rand had started the communication process before the 2011 elections.
This ultimately was localized as the Council Manifesto.
In March 2013, a multi-pronged media campaign was launched to consult and inform residents
of the Unicity proposal, branded as Vision 2016.
Three Regional Strategic Sessions have been convened (2010, 2011 and 2013) at which
strategic action plans were drawn. The action plans focused on the challenges, strategies to
be implemented and the responsibilities of the respective technical committees and the time
frames and target dates for implementation.
SECTION I: 1.9 AMALGAMATIONS AND MERGERS: SINGLE TIER MUNICIPALITY IN THE WEST RAND
94
MUNICIPAL DEMARCATION BOARD PROCESSES
The Constitution of South Africa, 1996, (Section 155) demands that legislation must take into
account the need to provide municipal services in an equitable and sustainable manner. In
this context the Demarcation Act of 1998 provides for criteria and procedures for the
determination of municipal boundaries. The Act empowers the Municipal Demarcation Board
(MDB) to determine boundaries and categories of municipalities taking into account “the
need for cohesive, integrated and unfragmented areas” (Section 25(b)). The MDB may
determine that an area must have a category A municipality only after consultation with the
Minister, the MEC for local government in the province concerned and SALGA.
The Municipal Demarcation Board issued Circular 2/2011 during November 2011, informing
municipalities of the closing date for submission of new requests for municipal boundary
changes. On the 15 December 2011 the proposal on a single category A municipality in line with
Circular 2/2011, was presented to the MDB. On the 6th February 2012 a follow up submission
with additional information was made. Comprehensive written submissions to the MDB were
forwarded according to set timeframes and a meeting was held with the MDB in Imbizo
Chamber, WRDM Offices, on 15 August 2012.
The MDB published a Section 26 Notice in newspapers on 9th December 2012, in which the
MDB proposed amalgamation of Randfontein and Westonaria into a single category B
municipality whilst retaining the category C District. The MDB invited written views on the
matters in Notice 26 by 10 December. WRDM complied and declared that we were not in
agreement with the proposal.
The West Rand District Municipality and its four local (category B) municipalities believe that
the formation of a single municipal structure in the West Rand will improve the quality of
governance, delivery of services and a better life for all in the West Rand.
BENEFITS:
There is a need to further rationalise the total number of municipalities to achieve the
objectives of effective and sustainable delivery;
The rationalisation of the number of municipalities will assist in the financial viability
of smaller municipalities;
A major advantage will be the cost-saving because of economies of scale, e.g. for
procurement and reduced political salaries in a single Council;
A single area is desirable for integrated development planning;
The strengthening of social and economic linkages and development of infrastructure
to link communities;
Sharing and redistributing of financial and administrative resources;
The attraction of investment capital and less competition between locals will lead to
economic stability in the region;
The strengthening of the tax base through inclusivity and additional opportunities;
95
Uniformity of transport services and public safety and traffic services will be beneficial
to communities; and
Enabling effective local governance by eliminating the superfluous two-tier system.
MERGER OF RANDFONTEIN AND WESTONARIA
The decision by the Municipal Demarcations Board (MDB) to merger Westonaria Local
Municipality (WLM) and Randfontein Local Municipality (RLM), as per Circular 4/2014, was
nullified by the withdrawal of the said Circular by the Minister of COGTA on the 12 December,
2014. A new proposal for the creation of a Category A Municipality within the West Rand
Region, was pronounced. This proposal was also set aside due to perceived time constraints
that were going to be experienced in finalizing the consultation process to establish a
Category A Municipality.
However, the merger between Westonaria and Randfontein Local Municipalities was re-
endorsed and it was confirmed by the signing off of this process by the Gauteng MEC for
Cooperative Governance and Traditional Affairs and Human Settlements Mr. SP Mashatile on
the 25th of February 2015.
A Merger Joint Business Plan was prepared and signed by Executive Mayors and Municipal
Managers of the merging Municipalities of Randfontein and Westonaria which outlined the
Terms of Governance for the Merger. A Transformation Manager was appointed to manage
the Implementation Process of the Merger. The West Rand District Municipality assumed a
coordinating Role to the Implementation of the Merger.
In November 2015, the two municipalities embarked on separate public participation
processes to request proposals for the new municipality. The process was finalized in early
December. A joint Council meeting was held to consider the shortlisted names and Rand West
Local Municipality was unanimously adopted as the official name of the new municipality.
As the process of the merger between Westonaria Local Municipality and Randfontein Local
Municipality gained momentum, both municipalities, as well as the West Rand District
Municipality held a Joint Strategic Planning Session to develop a framework that served as a
roadmap to guide, monitor and measure the progress on the implementation of the merger
process including the compilation of the IDP for Randwest City Local Municipality.
The compilation of the Randwest IDP was guided by the intention to ensure that it becomes
a stepping stone and a bridge that will enable and facilitate a smooth passage towards the
Randwest City Local Municipality, the ‘City of Choice’.
96
The preparation of the plan comprised the following:
Step 1: Team Engagement on the Results Based Planning Template enabled planning for a
fifteen year scenario, definition of projects, alignment to various processes, and provision
to develop outcome, outputs, KPI’s and targets for the next five years.
Step 2: Completion of the Templates by each Department
Step 3: Plenary Presentation of by each team
Step 4 : MayCom review of the high level plans
Step 5 : Team Consolidation of MayCom comments and enhancement of the quality of
deliverables planning framework on the templates
Step 6 : Presentation to MayCom
Copies of the plans are presented in the following section in the following sequence:
10.1.1 RPED DEPARTMENT IMPLEMENTATION PLANS
REGIONAL HUMAN SETTLEMENT IMPLEMENTATION PLAN
ECONOMIC DEVELOPMENT IMPLEMENTATION PLAN
TECHNICAL SUPPORT AND TRANSPORT IMPLEMENTATION PLAN
ENVIRONMENTAL MANAGEMENT IMPLEMENTATION PLAN
10.1.2 HEALTH AND SOCIAL SERVICES IMPLEMENTATIONPLAN
10.1.3 PUBLIC SAFETY IMPLEMENTATION PLANS
EMERGENCY SERVICES IMPLEMENTATION PLAN
COMMUNITY SAFETY IMPLEMENTATION PLAN
DISASTER MANAGEMENT IMPLEMENTATION PLAN
10.1.4 SUSTAINABLE GOVERNANCE FOR LOCAL COMMUNITIES IMPLEMENTATION PLANS
POLITICAL OFFICE IMPLEMENTATION PLAN
INTERNAL AUDIT IMPLEMENTATION PLAN
ENTERPRISE RISK MANAGEMENT IMPLEMENTATION PLAN
IDP AND PMS IMPLEMENTATION PLAN
10.1.5 BUSINESS EXCELLENCE IMPLEMENTATION PLAN
FINANCE IMPLEMENTATION PLAN
CORPORATE SERVICES LEGAL & COMMITTEE SERVICES IMPLEMENTATION PLAN
CORPORATE SERVICES: COMMUNICATION PLAN
SECTION J: 1.10. DEVELOPMENT STRATEGIES AND IMPLEMENTATION PLAN
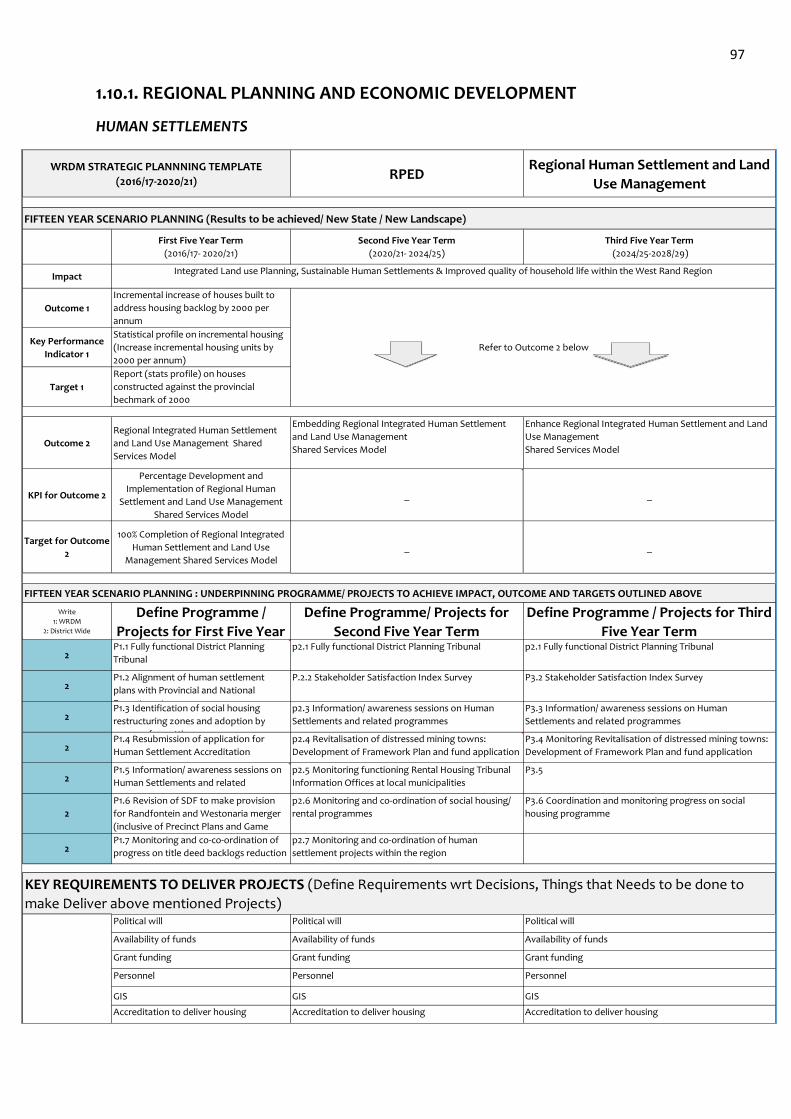
97
1.10.1. REGIONAL PLANNING AND ECONOMIC DEVELOPMENT
HUMAN SETTLEMENTS
FIFTEEN YEAR SCENARIO PLANNING (Results to be achieved/ New State / New Landscape)
Impact
Outcome 1
Key Performance
Indicator 1
Target 1
Outcome 2
KPI for Outcome 2
Target for Outcome
2
FIFTEEN YEAR SCENARIO PLANNING : UNDERPINNING PROGRAMME/ PROJECTS TO ACHIEVE IMPACT, OUTCOME AND TARGETS OUTLINED ABOVE
Write
1: WRDM
2: District Wide
2
2
2
2
2
2
2
Refer to Outcome 2 below
Availability of funds Availability of funds Availability of funds
Regional Integrated Human Settlement
and Land Use Management Shared
Services Model
Grant funding Grant funding Grant funding
Personnel Personnel Personnel
Accreditation to deliver housing Accreditation to deliver housing Accreditation to deliver housing
WRDM STRATEGIC PLANNNING TEMPLATE
(2016/17-2020/21)RPED
Regional Human Settlement and Land
Use Management
First Five Year Term
(2016/17- 2020/21)
Second Five Year Term
(2020/21- 2024/25)
Third Five Year Term
(2024/25-2028/29)
Define Programme /
Projects for First Five Year
Define Programme/ Projects for
Second Five Year Term
Define Programme / Projects for Third
Five Year Term
Statistical profile on incremental housing
(Increase incremental housing units by
2000 per annum)
Report (stats profile) on houses
constructed against the provincial
bechmark of 2000
Integrated Land use Planning, Sustainable Human Settlements & Improved quality of household life within the West Rand Region
Embedding Regional Integrated Human Settlement
and Land Use Management
Shared Services Model
Enhance Regional Integrated Human Settlement and Land
Use Management
Shared Services Model
Percentage Development and
Implementation of Regional Human
Settlement and Land Use Management
Shared Services Model
_ _
100% Completion of Regional Integrated
Human Settlement and Land Use
Management Shared Services Model
_ _
Incremental increase of houses built to
address housing backlog by 2000 per
annum
P1.1 Fully functional District Planning
Tribunal
p2.1 Fully functional District Planning Tribunal p2.1 Fully functional District Planning Tribunal
P1.2 Alignment of human settlement
plans with Provincial and National
Departments
P.2.2 Stakeholder Satisfaction Index Survey P3.2 Stakeholder Satisfaction Index Survey
P1.3 Identification of social housing
restructuring zones and adoption by
means of gazetting
p2.3 Information/ awareness sessions on Human
Settlements and related programmes
P1.6 Revision of SDF to make provision
for Randfontein and Westonaria merger
(inclusive of Precinct Plans and Game
Changers)
p2.6 Monitoring and co-ordination of social housing/
rental programmes
P3.6 Coordination and monitoring progress on social
housing programme
P1.7 Monitoring and co-co-ordination of
progress on title deed backlogs reduction
p2.7 Monitoring and co-ordination of human
settlement projects within the region
P3.3 Information/ awareness sessions on Human
Settlements and related programmes
P1.4 Resubmission of application for
Human Settlement Accreditation
p2.4 Revitalisation of distressed mining towns:
Development of Framework Plan and fund application
P3.4 Monitoring Revitalisation of distressed mining towns:
Development of Framework Plan and fund application
P1.5 Information/ awareness sessions on
Human Settlements and related
programmes
p2.5 Monitoring functioning Rental Housing Tribunal
Information Offices at local municipalities
P3.5
KEY REQUIREMENTS TO DELIVER PROJECTS (Define Requirements wrt Decisions, Things that Needs to be done to
make Deliver above mentioned Projects)Political will Political will Political will
GISGISGIS
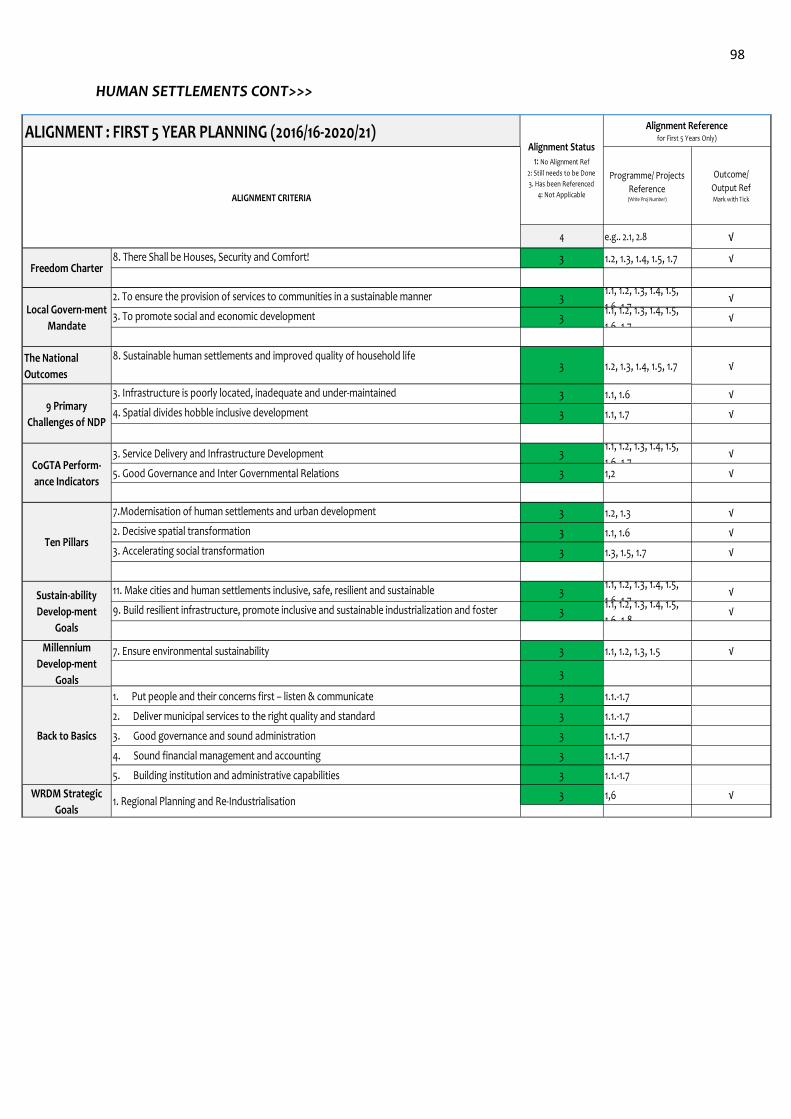
98
HUMAN SETTLEMENTS CONT>>>
ALIGNMENT : FIRST 5 YEAR PLANNING (2016/16-2020/21)
Programme/ Projects
Reference(Write Proj Number)
Outcome/
Output RefMark with Tick
4 e.g.. 2.1, 2.8 √
3 1.2, 1.3, 1.4, 1.5, 1.7 √
31.1, 1.2, 1.3, 1.4, 1.5,
1.6, 1.7√
31.1, 1.2, 1.3, 1.4, 1.5,
1.6, 1.7√
The National
Outcomes3 1.2, 1.3, 1.4, 1.5, 1.7 √
3 1.1, 1.6 √
3 1.1, 1.7 √
31.1, 1.2, 1.3, 1.4, 1.5,
1.6, 1.7√
3 1,2 √
3 1.2, 1.3 √
3 1.1, 1.6 √
3 1.3, 1.5, 1.7 √
31.1, 1.2, 1.3, 1.4, 1.5,
1.6, 1.7√
31.1, 1.2, 1.3, 1.4, 1.5,
1.6, 1.8√
3 1.1, 1.2, 1.3, 1.5 √
3
3 1.1.-1.7
3 1.1.-1.7
3 1.1.-1.7
3 1.1.-1.7
3 1.1.-1.7
3 1,6 √WRDM Strategic
Goals
Sustain-ability
Develop-ment
Goals
Millennium
Develop-ment
Goals
7. Ensure environmental sustainability
Back to Basics
3. To promote social and economic development
Alignment Status1: No Alignment Ref
2: Still needs to be Done
3. Has been Referenced
4: Not Applicable
Alignment Referencefor First 5 Years Only)
ALIGNMENT CRITERIA
Freedom Charter8. There Shall be Houses, Security and Comfort!
Local Govern-ment
Mandate
2. To ensure the provision of services to communities in a sustainable manner
9 Primary
Challenges of NDP
3. Infrastructure is poorly located, inadequate and under-maintained
4. Spatial divides hobble inclusive development
8. Sustainable human settlements and improved quality of household life
CoGTA Perform-
ance Indicators
3. Service Delivery and Infrastructure Development
5. Good Governance and Inter Governmental Relations
Ten Pillars
7.Modernisation of human settlements and urban development
2. Decisive spatial transformation
3. Accelerating social transformation
1. Put people and their concerns first – listen & communicate
2. Deliver municipal services to the right quality and standard
3. Good governance and sound administration
4. Sound financial management and accounting
5. Building institution and administrative capabilities
11. Make cities and human settlements inclusive, safe, resilient and sustainable
9. Build resilient infrastructure, promote inclusive and sustainable industrialization and foster
innovation
1. Regional Planning and Re-Industrialisation
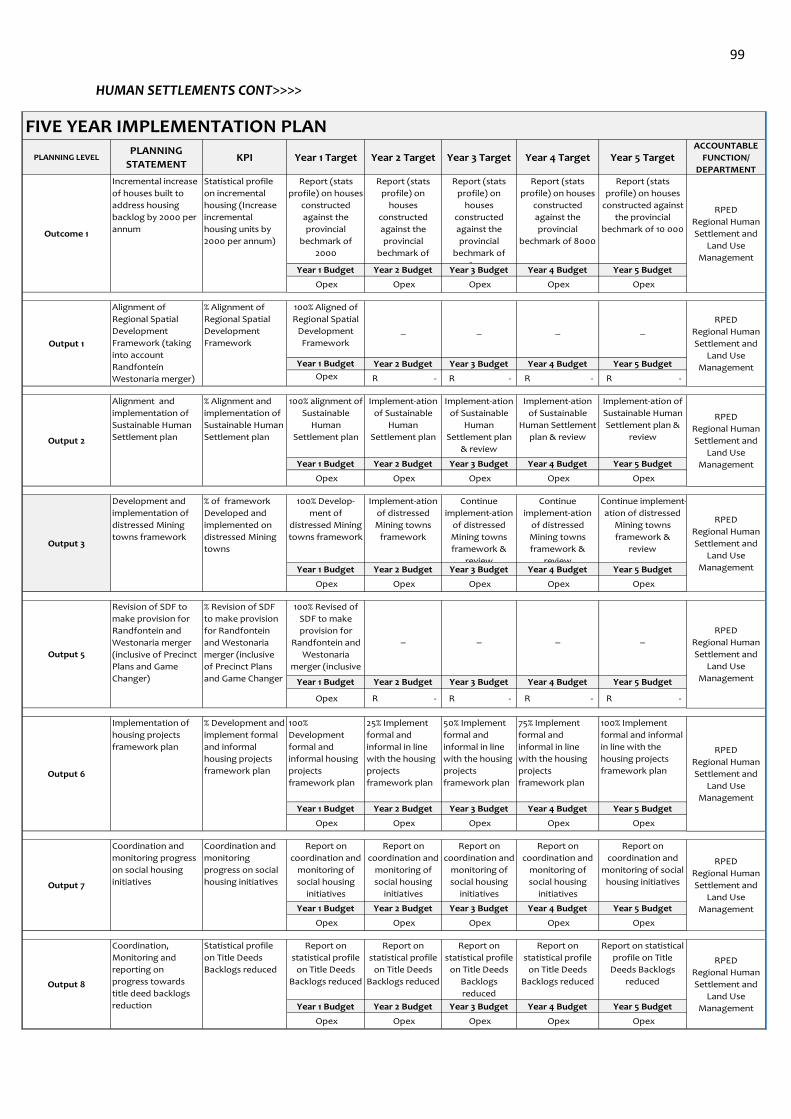
99
HUMAN SETTLEMENTS CONT>>>>
PLANNING LEVELPLANNING
STATEMENTKPI Year 1 Target Year 2 Target Year 3 Target Year 4 Target Year 5 Target
ACCOUNTABLE
FUNCTION/
DEPARTMENT
Report (stats
profile) on houses
constructed
against the
provincial
bechmark of
2000
Report (stats
profile) on
houses
constructed
against the
provincial
bechmark of
4000
Report (stats
profile) on
houses
constructed
against the
provincial
bechmark of
6000
Report (stats
profile) on houses
constructed
against the
provincial
bechmark of 8000
Report (stats
profile) on houses
constructed against
the provincial
bechmark of 10 000
Year 1 Budget Year 2 Budget Year 3 Budget Year 4 Budget Year 5 Budget
Opex Opex Opex Opex Opex
100% Aligned of
Regional Spatial
Development
Framework
_ _ _ _
Year 1 Budget Year 2 Budget Year 3 Budget Year 4 Budget Year 5 Budget
Opex R - R - R - R -
100% alignment of
Sustainable
Human
Settlement plan
Implement-ation
of Sustainable
Human
Settlement plan
Implement-ation
of Sustainable
Human
Settlement plan
& review
Implement-ation
of Sustainable
Human Settlement
plan & review
Implement-ation of
Sustainable Human
Settlement plan &
review
Year 1 Budget Year 2 Budget Year 3 Budget Year 4 Budget Year 5 Budget
Opex Opex Opex Opex Opex
100% Develop-
ment of
distressed Mining
towns framework
Implement-ation
of distressed
Mining towns
framework
Continue
implement-ation
of distressed
Mining towns
framework &
review
Continue
implement-ation
of distressed
Mining towns
framework &
review
Continue implement-
ation of distressed
Mining towns
framework &
review
Year 1 Budget Year 2 Budget Year 3 Budget Year 4 Budget Year 5 Budget
Opex Opex Opex Opex Opex
100% Revised of
SDF to make
provision for
Randfontein and
Westonaria
merger (inclusive
of Precinct Plans
_ _ _ _
Year 1 Budget Year 2 Budget Year 3 Budget Year 4 Budget Year 5 Budget
Opex R - R - R - R -
100%
Development
formal and
informal housing
projects
framework plan
25% Implement
formal and
informal in line
with the housing
projects
framework plan
50% Implement
formal and
informal in line
with the housing
projects
framework plan
75% Implement
formal and
informal in line
with the housing
projects
framework plan
100% Implement
formal and informal
in line with the
housing projects
framework plan
Year 1 Budget Year 2 Budget Year 3 Budget Year 4 Budget Year 5 Budget
Opex Opex Opex Opex Opex
Report on
coordination and
monitoring of
social housing
initiatives
Report on
coordination and
monitoring of
social housing
initiatives
Report on
coordination and
monitoring of
social housing
initiatives
Report on
coordination and
monitoring of
social housing
initiatives
Report on
coordination and
monitoring of social
housing initiatives
Year 1 Budget Year 2 Budget Year 3 Budget Year 4 Budget Year 5 Budget
Opex Opex Opex Opex Opex
Report on
statistical profile
on Title Deeds
Backlogs reduced
Report on
statistical profile
on Title Deeds
Backlogs reduced
Report on
statistical profile
on Title Deeds
Backlogs
reduced
Report on
statistical profile
on Title Deeds
Backlogs reduced
Report on statistical
profile on Title
Deeds Backlogs
reduced
Year 1 Budget Year 2 Budget Year 3 Budget Year 4 Budget Year 5 Budget
Opex Opex Opex Opex Opex
Output 5
Revision of SDF to
make provision for
Randfontein and
Westonaria merger
(inclusive of Precinct
Plans and Game
Changer)
% Revision of SDF
to make provision
for Randfontein
and Westonaria
merger (inclusive
of Precinct Plans
and Game Changer
RPED
Regional Human
Settlement and
Land Use
Management
Output 8
Coordination,
Monitoring and
reporting on
progress towards
title deed backlogs
reduction
Statistical profile
on Title Deeds
Backlogs reducedRPED
Regional Human
Settlement and
Land Use
Management
Output 1
Alignment of
Regional Spatial
Development
Framework (taking
into account
Randfontein
Westonaria merger)
% Alignment of
Regional Spatial
Development
Framework
RPED
Regional Human
Settlement and
Land Use
Management
Output 2
Alignment and
implementation of
Sustainable Human
Settlement plan
% Alignment and
implementation of
Sustainable Human
Settlement plan
RPED
Regional Human
Settlement and
Land Use
Management
FIVE YEAR IMPLEMENTATION PLAN
RPED
Regional Human
Settlement and
Land Use
Management
Outcome 1
Incremental increase
of houses built to
address housing
backlog by 2000 per
annum
Output 7
Coordination and
monitoring progress
on social housing
initiatives
Coordination and
monitoring
progress on social
housing initiatives
RPED
Regional Human
Settlement and
Land Use
Management
Output 6
Implementation of
housing projects
framework plan
% Development and
implement formal
and informal
housing projects
framework plan
RPED
Regional Human
Settlement and
Land Use
Management
Statistical profile
on incremental
housing (Increase
incremental
housing units by
2000 per annum)
Output 3
Development and
implementation of
distressed Mining
towns framework
% of framework
Developed and
implemented on
distressed Mining
towns
RPED
Regional Human
Settlement and
Land Use
Management
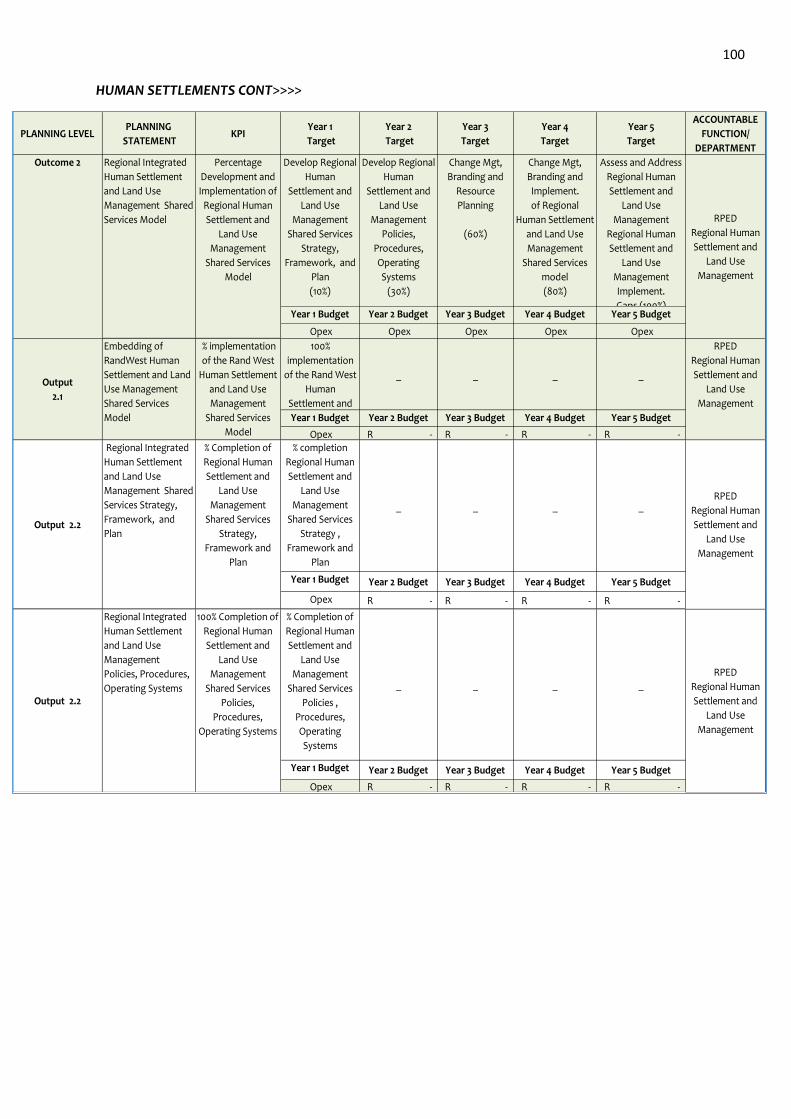
100
HUMAN SETTLEMENTS CONT>>>>
PLANNING LEVELPLANNING
STATEMENTKPI
Year 1
Target
Year 2
Target
Year 3
Target
Year 4
Target
Year 5
Target
ACCOUNTABLE
FUNCTION/
DEPARTMENT
Develop Regional
Human
Settlement and
Land Use
Management
Shared Services
Strategy,
Framework, and
Plan
(10%)
Develop Regional
Human
Settlement and
Land Use
Management
Policies,
Procedures,
Operating
Systems
(30%)
Change Mgt,
Branding and
Resource
Planning
(60%)
Change Mgt,
Branding and
Implement.
of Regional
Human Settlement
and Land Use
Management
Shared Services
model
(80%)
Assess and Address
Regional Human
Settlement and
Land Use
Management
Regional Human
Settlement and
Land Use
Management
Implement.
Gaps (100%)Year 1 Budget Year 2 Budget Year 3 Budget Year 4 Budget Year 5 Budget
Opex Opex Opex Opex Opex
100%
implementation
of the Rand West
Human
Settlement and
_ _ _ _
Year 1 Budget Year 2 Budget Year 3 Budget Year 4 Budget Year 5 Budget
Opex R - R - R - R - % completion
Regional Human
Settlement and
Land Use
Management
Shared Services
Strategy ,
Framework and
Plan
_ _ _ _
Year 1 Budget Year 2 Budget Year 3 Budget Year 4 Budget Year 5 Budget
Opex R - R - R - R -
% Completion of
Regional Human
Settlement and
Land Use
Management
Shared Services
Policies ,
Procedures,
Operating
Systems
_ _ _ _
Year 1 Budget Year 2 Budget Year 3 Budget Year 4 Budget Year 5 Budget
Opex R - R - R - R -
Output 2.2
Regional Integrated
Human Settlement
and Land Use
Management
Policies, Procedures,
Operating Systems
100% Completion of
Regional Human
Settlement and
Land Use
Management
Shared Services
Policies,
Procedures,
Operating Systems
RPED
Regional Human
Settlement and
Land Use
Management
Outcome 2 Regional Integrated
Human Settlement
and Land Use
Management Shared
Services Model
Percentage
Development and
Implementation of
Regional Human
Settlement and
Land Use
Management
Shared Services
Model
RPED
Regional Human
Settlement and
Land Use
Management
Output
2.1
Embedding of
RandWest Human
Settlement and Land
Use Management
Shared Services
Model
% implementation
of the Rand West
Human Settlement
and Land Use
Management
Shared Services
Model
RPED
Regional Human
Settlement and
Land Use
Management
Output 2.2
Regional Integrated
Human Settlement
and Land Use
Management Shared
Services Strategy,
Framework, and
Plan
% Completion of
Regional Human
Settlement and
Land Use
Management
Shared Services
Strategy,
Framework and
Plan
RPED
Regional Human
Settlement and
Land Use
Management
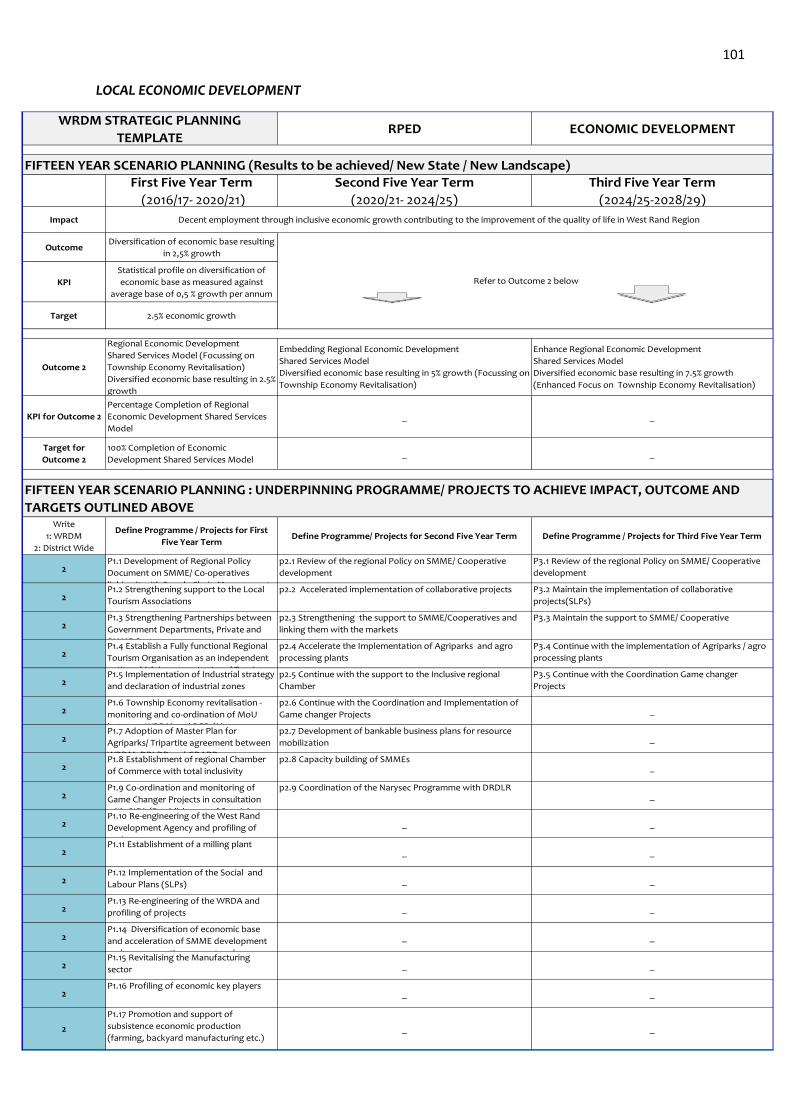
101
LOCAL ECONOMIC DEVELOPMENT
FIFTEEN YEAR SCENARIO PLANNING (Results to be achieved/ New State / New Landscape)
Impact
Outcome
KPI
Target
Outcome 2
KPI for Outcome 2
Target for
Outcome 2
Write
1: WRDM
2: District Wide
2
2
2
2
2
2
2
2
2
2
2
2
2
2
2
2
2
Regional Economic Development
Shared Services Model (Focussing on
Township Economy Revitalisation)
Diversified economic base resulting in 2.5%
growth
Embedding Regional Economic Development
Shared Services Model
Diversified economic base resulting in 5% growth (Focussing on
Township Economy Revitalisation)
Enhance Regional Economic Development
Shared Services Model
Diversified economic base resulting in 7.5% growth
(Enhanced Focus on Township Economy Revitalisation)
Percentage Completion of Regional
Economic Development Shared Services
Model
_ _
100% Completion of Economic
Development Shared Services Model _ _
P1.17 Promotion and support of
subsistence economic production
(farming, backyard manufacturing etc.)_ _
P1.15 Revitalising the Manufacturing
sector _ _
P1.16 Profiling of economic key players_ _
P1.3 Strengthening Partnerships between
Government Departments, Private and
SMME Sectors
p2.3 Strengthening the support to SMME/Cooperatives and
linking them with the markets
P1.13 Re-engineering of the WRDA and
profiling of projects _ _
P1.14 Diversification of economic base
and acceleration of SMME development
and co-cooperative support and
_ _
P1.11 Establishment of a milling plant_ _
P1.12 Implementation of the Social and
Labour Plans (SLPs) _ _
p2.7 Development of bankable business plans for resource
mobilization _
P1.8 Establishment of regional Chamber
of Commerce with total inclusivity
p2.8 Capacity building of SMMEs_
P1.5 Implementation of Industrial strategy
and declaration of industrial zones
p2.5 Continue with the support to the Inclusive regional
Chamber
P3.5 Continue with the Coordination Game changer
Projects
P1.6 Township Economy revitalisation -
monitoring and co-ordination of MoU
between WRDM and DED (Massmart
p2.6 Continue with the Coordination and Implementation of
Game changer Projects _
WRDM STRATEGIC PLANNING
TEMPLATE RPED ECONOMIC DEVELOPMENT
First Five Year Term
(2016/17- 2020/21)
Second Five Year Term
(2020/21- 2024/25)
Third Five Year Term
(2024/25-2028/29)
Diversification of economic base resulting
in 2,5% growth
Decent employment through inclusive economic growth contributing to the improvement of the quality of life in West Rand Region
Refer to Outcome 2 belowStatistical profile on diversification of
economic base as measured against
average base of 0,5 % growth per annum
2.5% economic growth
P1.2 Strengthening support to the Local
Tourism Associations
p2.2 Accelerated implementation of collaborative projects P3.2 Maintain the implementation of collaborative
projects(SLPs)
Define Programme / Projects for First
Five Year TermDefine Programme/ Projects for Second Five Year Term Define Programme / Projects for Third Five Year Term
P1.1 Development of Regional Policy
Document on SMME/ Co-operatives
linking it with Supply Chain Management
p2.1 Review of the regional Policy on SMME/ Cooperative
development
P3.1 Review of the regional Policy on SMME/ Cooperative
development
FIFTEEN YEAR SCENARIO PLANNING : UNDERPINNING PROGRAMME/ PROJECTS TO ACHIEVE IMPACT, OUTCOME AND
TARGETS OUTLINED ABOVE
P3.3 Maintain the support to SMME/ Cooperative
P1.4 Establish a Fully functional Regional
Tourism Organisation as an independent
entity which incorporates Local Tourism
p2.4 Accelerate the Implementation of Agriparks and agro
processing plants
P3.4 Continue with the implementation of Agriparks / agro
processing plants
P1.9 Co-ordination and monitoring of
Game Changer Projects in consultation
with GIFA (Establishment of Special
p2.9 Coordination of the Narysec Programme with DRDLR_
P1.10 Re-engineering of the West Rand
Development Agency and profiling of
projects
_ _
P1.7 Adoption of Master Plan for
Agriparks/ Tripartite agreement between
WRDM, DRLDR and GDARD
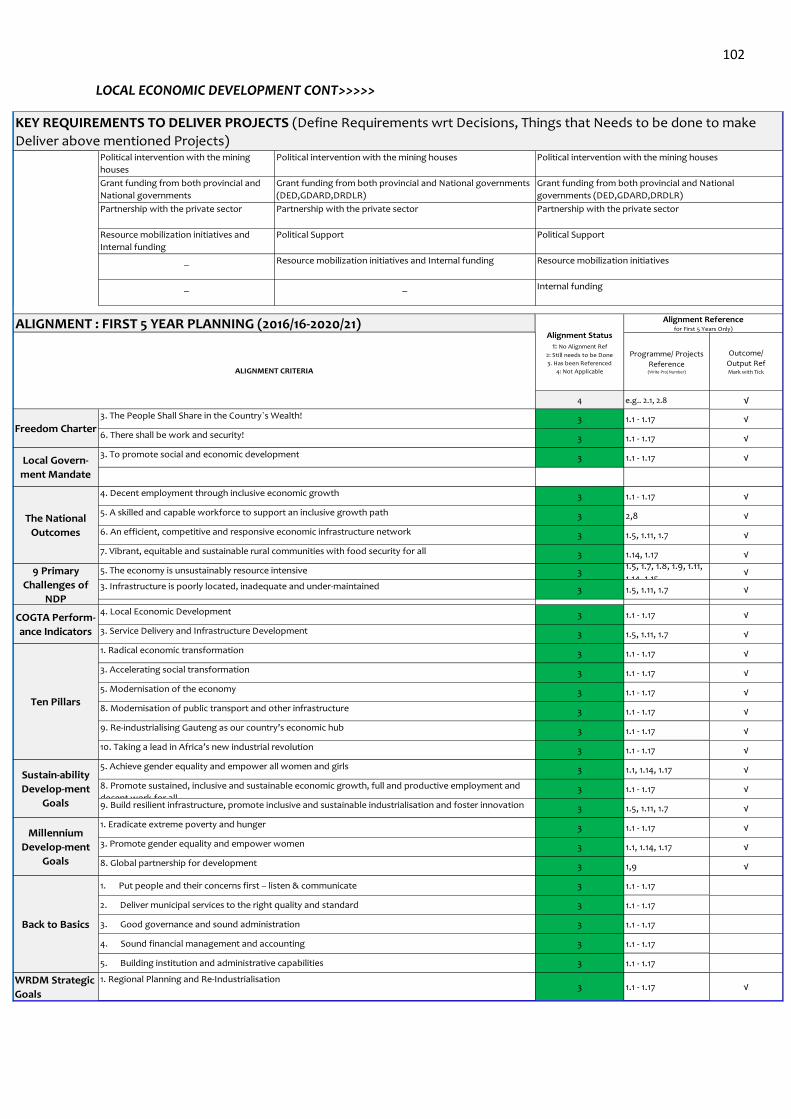
102
LOCAL ECONOMIC DEVELOPMENT CONT>>>>>
ALIGNMENT : FIRST 5 YEAR PLANNING (2016/16-2020/21)
Programme/ Projects
Reference(Write Proj Number)
Outcome/
Output RefMark with Tick
4 e.g.. 2.1, 2.8 √
3 1.1 - 1.17 √
3 1.1 - 1.17 √
3 1.1 - 1.17 √
3 1.1 - 1.17 √
3 2,8 √
3 1.5, 1.11, 1.7 √
3 1.14, 1.17 √
31.5, 1.7, 1.8, 1.9, 1.11,
1.14, 1.15√
3 1.5, 1.11, 1.7 √
3 1.1 - 1.17 √
3 1.5, 1.11, 1.7 √
3 1.1 - 1.17 √
3 1.1 - 1.17 √
3 1.1 - 1.17 √
3 1.1 - 1.17 √
3 1.1 - 1.17 √
3 1.1 - 1.17 √
3 1.1, 1.14, 1.17 √
3 1.1 - 1.17 √
3 1.5, 1.11, 1.7 √
3 1.1 - 1.17 √
3 1.1, 1.14, 1.17 √
3 1,9 √
3 1.1 - 1.17
3 1.1 - 1.17
3 1.1 - 1.17
3 1.1 - 1.17
3 1.1 - 1.17
WRDM Strategic
Goals3 1.1 - 1.17 √
The National
Outcomes
9 Primary
Challenges of
NDP
COGTA Perform-
ance Indicators
4. Local Economic Development
3. Service Delivery and Infrastructure Development
3. Accelerating social transformation
5. Modernisation of the economy
5. The economy is unsustainably resource intensive
3. Infrastructure is poorly located, inadequate and under-maintained
4. Decent employment through inclusive economic growth
7. Vibrant, equitable and sustainable rural communities with food security for all
5. A skilled and capable workforce to support an inclusive growth path
6. An efficient, competitive and responsive economic infrastructure network
1. Radical economic transformation
5. Building institution and administrative capabilities
5. Achieve gender equality and empower all women and girls
8. Promote sustained, inclusive and sustainable economic growth, full and productive employment and
decent work for all9. Build resilient infrastructure, promote inclusive and sustainable industrialisation and foster innovation
Ten Pillars
Sustain-ability
Develop-ment
Goals
10. Taking a lead in Africa’s new industrial revolution
8. Modernisation of public transport and other infrastructure
9. Re-industrialising Gauteng as our country’s economic hub
1. Eradicate extreme poverty and hunger
3. Promote gender equality and empower women
8. Global partnership for development
1. Put people and their concerns first – listen & communicate
2. Deliver municipal services to the right quality and standard
3. Good governance and sound administration
4. Sound financial management and accounting
1. Regional Planning and Re-Industrialisation
Local Govern-
ment Mandate
3. To promote social and economic development
3. The People Shall Share in the Country`s Wealth!
6. There shall be work and security!Freedom Charter
Alignment Status1: No Alignment Ref
2: Still needs to be Done
3. Has been Referenced
4: Not Applicable
Alignment Referencefor First 5 Years Only)
ALIGNMENT CRITERIA
KEY REQUIREMENTS TO DELIVER PROJECTS (Define Requirements wrt Decisions, Things that Needs to be done to make
Deliver above mentioned Projects)Political intervention with the mining
houses
Political intervention with the mining houses Political intervention with the mining houses
Grant funding from both provincial and
National governments
(DED,GDARD,DRDLR)
Grant funding from both provincial and National governments
(DED,GDARD,DRDLR)
Grant funding from both provincial and National
governments (DED,GDARD,DRDLR)
Partnership with the private sector Partnership with the private sector Partnership with the private sector
Resource mobilization initiatives and
Internal funding
Political Support Political Support
_ Resource mobilization initiatives and Internal funding Resource mobilization initiatives
_ _ Internal funding
Millennium
Develop-ment
Goals
Back to Basics
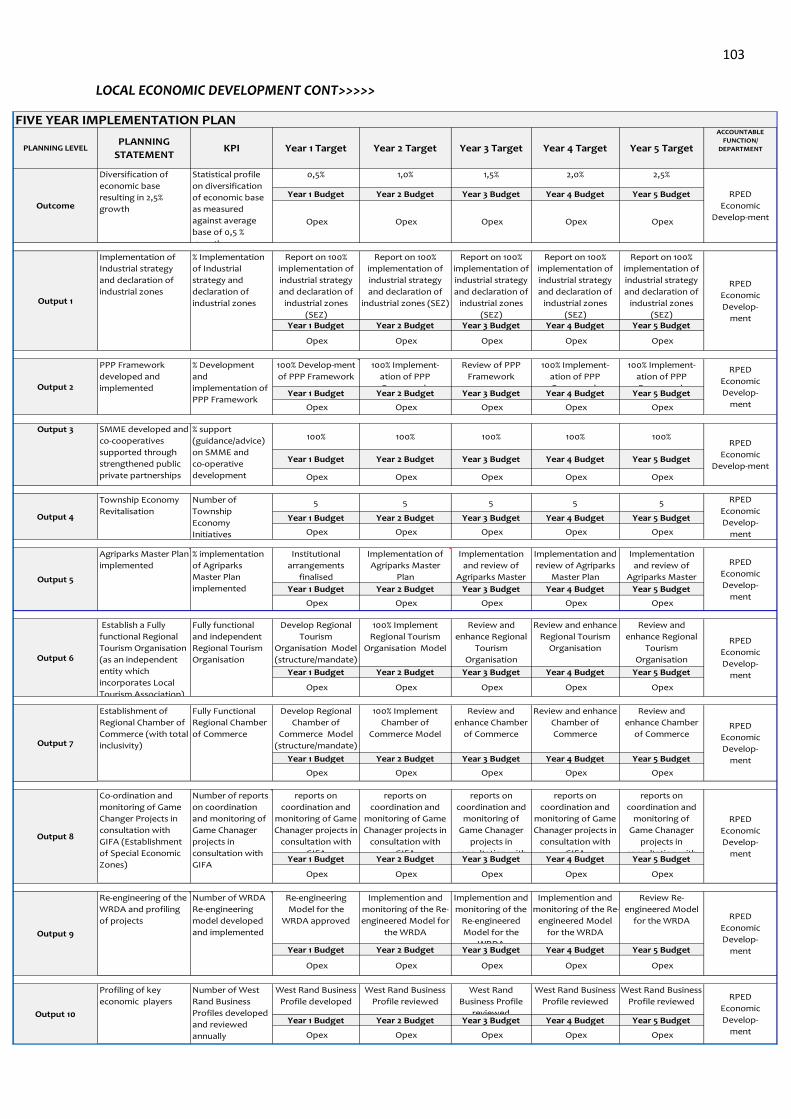
103
LOCAL ECONOMIC DEVELOPMENT CONT>>>>>
PLANNING LEVELPLANNING
STATEMENTKPI Year 1 Target Year 2 Target Year 3 Target Year 4 Target Year 5 Target
ACCOUNTABLE
FUNCTION/
DEPARTMENT
0,5% 1,0% 1,5% 2,0% 2,5%
Year 1 Budget Year 2 Budget Year 3 Budget Year 4 Budget Year 5 Budget
Opex Opex Opex Opex Opex
Report on 100%
implementation of
industrial strategy
and declaration of
industrial zones
(SEZ)
Report on 100%
implementation of
industrial strategy
and declaration of
industrial zones (SEZ)
Report on 100%
implementation of
industrial strategy
and declaration of
industrial zones
(SEZ)
Report on 100%
implementation of
industrial strategy
and declaration of
industrial zones
(SEZ)
Report on 100%
implementation of
industrial strategy
and declaration of
industrial zones
(SEZ) Year 1 Budget Year 2 Budget Year 3 Budget Year 4 Budget Year 5 Budget
Opex Opex Opex Opex Opex
100% Develop-ment
of PPP Framework
100% Implement-
ation of PPP
Framework
Review of PPP
Framework
100% Implement-
ation of PPP
Framework
100% Implement-
ation of PPP
Framework Year 1 Budget Year 2 Budget Year 3 Budget Year 4 Budget Year 5 Budget
Opex Opex Opex Opex Opex
100% 100% 100% 100% 100%
Year 1 Budget Year 2 Budget Year 3 Budget Year 4 Budget Year 5 Budget
Opex Opex Opex Opex Opex
5 5 5 5 5
Year 1 Budget Year 2 Budget Year 3 Budget Year 4 Budget Year 5 Budget
Opex Opex Opex Opex Opex
Institutional
arrangements
finalised
Implementation of
Agriparks Master
Plan
Implementation
and review of
Agriparks Master
Plan
Implementation and
review of Agriparks
Master Plan
Implementation
and review of
Agriparks Master
Plan Year 1 Budget Year 2 Budget Year 3 Budget Year 4 Budget Year 5 Budget
Opex Opex Opex Opex Opex
Develop Regional
Tourism
Organisation Model
(structure/mandate)
100% Implement
Regional Tourism
Organisation Model
Review and
enhance Regional
Tourism
Organisation
Review and enhance
Regional Tourism
Organisation
Review and
enhance Regional
Tourism
Organisation
Year 1 Budget Year 2 Budget Year 3 Budget Year 4 Budget Year 5 Budget
Opex Opex Opex Opex Opex
Develop Regional
Chamber of
Commerce Model
(structure/mandate)
100% Implement
Chamber of
Commerce Model
Review and
enhance Chamber
of Commerce
Review and enhance
Chamber of
Commerce
Review and
enhance Chamber
of Commerce
Year 1 Budget Year 2 Budget Year 3 Budget Year 4 Budget Year 5 Budget
Opex Opex Opex Opex Opex
reports on
coordination and
monitoring of Game
Chanager projects in
consultation with
GIFA
reports on
coordination and
monitoring of Game
Chanager projects in
consultation with
GIFA
reports on
coordination and
monitoring of
Game Chanager
projects in
consultation with
reports on
coordination and
monitoring of Game
Chanager projects in
consultation with
GIFA
reports on
coordination and
monitoring of
Game Chanager
projects in
consultation with Year 1 Budget Year 2 Budget Year 3 Budget Year 4 Budget Year 5 Budget
Opex Opex Opex Opex Opex
Re-engineering
Model for the
WRDA approved
Implemention and
monitoring of the Re-
engineered Model for
the WRDA
Implemention and
monitoring of the
Re-engineered
Model for the
WRDA
Implemention and
monitoring of the Re-
engineered Model
for the WRDA
Review Re-
engineered Model
for the WRDA
Year 1 Budget Year 2 Budget Year 3 Budget Year 4 Budget Year 5 Budget
Opex Opex Opex Opex Opex
West Rand Business
Profile developed
West Rand Business
Profile reviewed
West Rand
Business Profile
reviewed
West Rand Business
Profile reviewed
West Rand Business
Profile reviewed
Year 1 Budget Year 2 Budget Year 3 Budget Year 4 Budget Year 5 Budget
Opex Opex Opex Opex Opex
Output 8
Co-ordination and
monitoring of Game
Changer Projects in
consultation with
GIFA (Establishment
of Special Economic
Zones)
Number of reports
on coordination
and monitoring of
Game Chanager
projects in
consultation with
GIFA
RPED
Economic
Develop-
ment
Output 9
Re-engineering of the
WRDA and profiling
of projects
Number of WRDA
Re-engineering
model developed
and implemented
RPED
Economic
Develop-
ment
Output 1
Implementation of
Industrial strategy
and declaration of
industrial zones
% Implementation
of Industrial
strategy and
declaration of
industrial zones
RPED
Economic
Develop-
ment
Output 6
Establish a Fully
functional Regional
Tourism Organisation
(as an independent
entity which
incorporates Local
Tourism Association)
Fully functional
and independent
Regional Tourism
Organisation
RPED
Economic
Develop-
ment
Output 7
Establishment of
Regional Chamber of
Commerce (with total
inclusivity)
Fully Functional
Regional Chamber
of CommerceRPED
Economic
Develop-
ment
% implementation
of Agriparks
Master Plan
implemented
RPED
Economic
Develop-
ment
% Development
and
implementation of
PPP Framework
RPED
Economic
Develop-
ment
FIVE YEAR IMPLEMENTATION PLAN
Output 10
Profiling of key
economic players
Number of West
Rand Business
Profiles developed
and reviewed
annually
RPED
Economic
Develop-
ment
Outcome
Diversification of
economic base
resulting in 2,5%
growth
Statistical profile
on diversification
of economic base
as measured
against average
base of 0,5 %
growth per annum
RPED
Economic
Develop-ment
Output 3 SMME developed and
co-cooperatives
supported through
strengthened public
private partnerships
% support
(guidance/advice)
on SMME and
co-operative
development
RPED
Economic
Develop-ment
Output 4
Township Economy
Revitalisation
Number of
Township
Economy
Initiatives
RPED
Economic
Develop-
ment
Output 2
PPP Framework
developed and
implemented
Output 5
Agriparks Master Plan
implemented
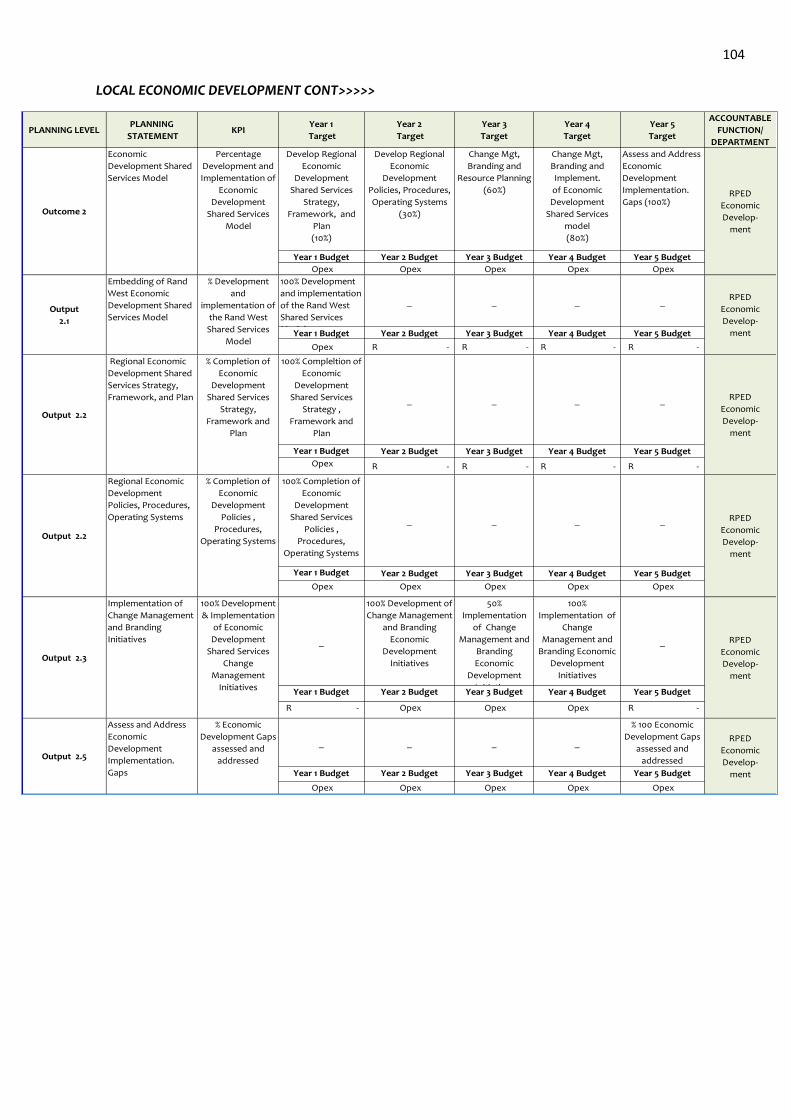
104
LOCAL ECONOMIC DEVELOPMENT CONT>>>>>
PLANNING LEVELPLANNING
STATEMENTKPI
Year 1
Target
Year 2
Target
Year 3
Target
Year 4
Target
Year 5
Target
ACCOUNTABLE
FUNCTION/
DEPARTMENT
Develop Regional
Economic
Development
Shared Services
Strategy,
Framework, and
Plan
(10%)
Develop Regional
Economic
Development
Policies, Procedures,
Operating Systems
(30%)
Change Mgt,
Branding and
Resource Planning
(60%)
Change Mgt,
Branding and
Implement.
of Economic
Development
Shared Services
model
(80%)
Assess and Address
Economic
Development
Implementation.
Gaps (100%)
Year 1 Budget Year 2 Budget Year 3 Budget Year 4 Budget Year 5 Budget
Opex Opex Opex Opex Opex
100% Development
and implementation
of the Rand West
Shared Services
Model
_ _ _ _
Year 1 Budget Year 2 Budget Year 3 Budget Year 4 Budget Year 5 Budget
Opex R - R - R - R -
100% Compleltion of
Economic
Development
Shared Services
Strategy ,
Framework and
Plan
_ _ _ _
Year 1 Budget Year 2 Budget Year 3 Budget Year 4 Budget Year 5 Budget
Opex R - R - R - R -
100% Completion of
Economic
Development
Shared Services
Policies ,
Procedures,
Operating Systems
_ _ _ _
Year 1 Budget Year 2 Budget Year 3 Budget Year 4 Budget Year 5 Budget
Opex Opex Opex Opex Opex
_
100% Development of
Change Management
and Branding
Economic
Development
Initiatives
50%
Implementation
of Change
Management and
Branding
Economic
Development
Initiatives
100%
Implementation of
Change
Management and
Branding Economic
Development
Initiatives
_
Year 1 Budget Year 2 Budget Year 3 Budget Year 4 Budget Year 5 Budget
R - Opex Opex Opex R -
_ _ _ _
% 100 Economic
Development Gaps
assessed and
addressed
Year 1 Budget Year 2 Budget Year 3 Budget Year 4 Budget Year 5 Budget
Opex Opex Opex Opex Opex
Output 2.5
Assess and Address
Economic
Development
Implementation.
Gaps
% Economic
Development Gaps
assessed and
addressed
RPED
Economic
Develop-
ment
Output 2.2
Regional Economic
Development Shared
Services Strategy,
Framework, and Plan
% Completion of
Economic
Development
Shared Services
Strategy,
Framework and
Plan
RPED
Economic
Develop-
ment
Output 2.2
Regional Economic
Development
Policies, Procedures,
Operating Systems
% Completion of
Economic
Development
Policies ,
Procedures,
Operating Systems
RPED
Economic
Develop-
ment
Output 2.3
Implementation of
Change Management
and Branding
Initiatives
100% Development
& Implementation
of Economic
Development
Shared Services
Change
Management
Initiatives
RPED
Economic
Develop-
ment
Outcome 2
Economic
Development Shared
Services Model
Percentage
Development and
Implementation of
Economic
Development
Shared Services
Model
RPED
Economic
Develop-
ment
Output
2.1
Embedding of Rand
West Economic
Development Shared
Services Model
% Development
and
implementation of
the Rand West
Shared Services
Model
RPED
Economic
Develop-
ment
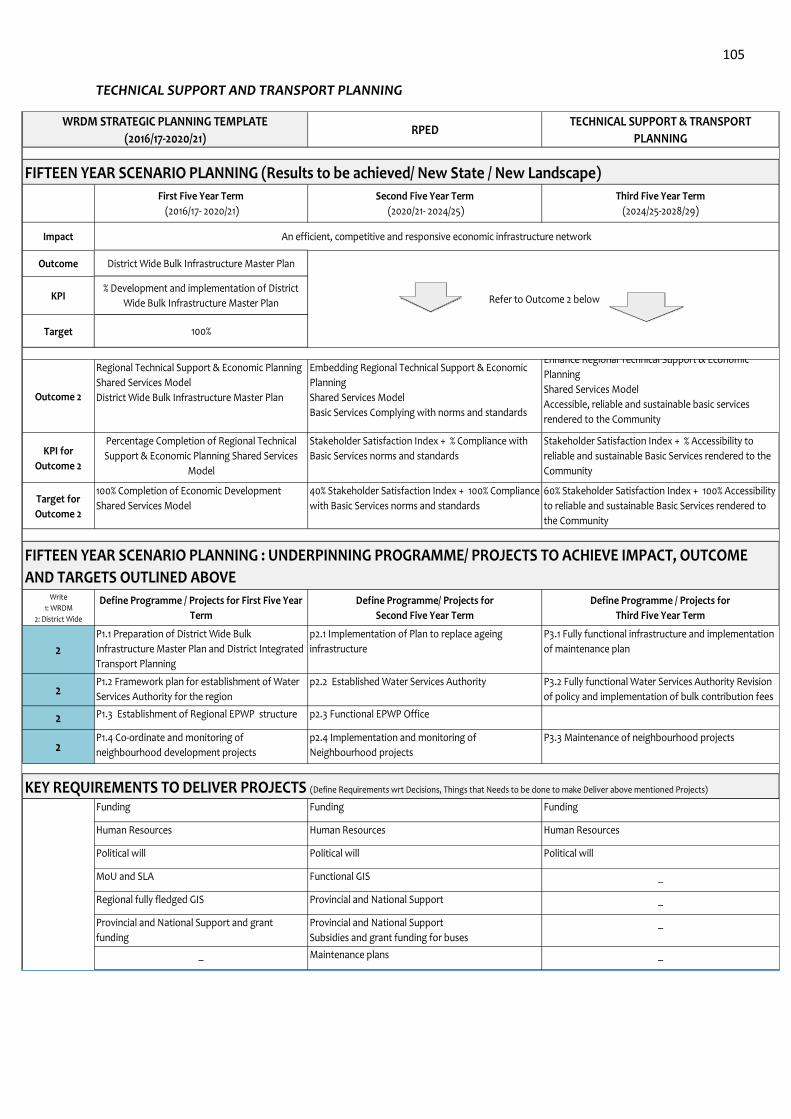
105
TECHNICAL SUPPORT AND TRANSPORT PLANNING
FIFTEEN YEAR SCENARIO PLANNING (Results to be achieved/ New State / New Landscape)
Impact
Outcome
KPI
Target
Outcome 2
KPI for
Outcome 2
Target for
Outcome 2
Write
1: WRDM
2: District Wide
2
2
2
2
KEY REQUIREMENTS TO DELIVER PROJECTS (Define Requirements wrt Decisions, Things that Needs to be done to make Deliver above mentioned Projects)
Percentage Completion of Regional Technical
Support & Economic Planning Shared Services
Model
Stakeholder Satisfaction Index + % Compliance with
Basic Services norms and standards
Stakeholder Satisfaction Index + % Accessibility to
reliable and sustainable Basic Services rendered to the
Community
100% Completion of Economic Development
Shared Services Model
40% Stakeholder Satisfaction Index + 100% Compliance
with Basic Services norms and standards
60% Stakeholder Satisfaction Index + 100% Accessibility
to reliable and sustainable Basic Services rendered to
the Community
Political will Political will
MoU and SLA Functional GIS _
Regional fully fledged GIS Provincial and National Support
Provincial and National Support and grant
funding
Provincial and National Support
Subsidies and grant funding for buses
_
_ Maintenance plans _
_
Funding Funding Funding
Human Resources Human Resources Human Resources
Political will
P1.3 Establishment of Regional EPWP structure p2.3 Functional EPWP Office
P1.4 Co-ordinate and monitoring of
neighbourhood development projects
p2.4 Implementation and monitoring of
Neighbourhood projects
P3.3 Maintenance of neighbourhood projects
WRDM STRATEGIC PLANNING TEMPLATE
(2016/17-2020/21)RPED
TECHNICAL SUPPORT & TRANSPORT
PLANNING
First Five Year Term
(2016/17- 2020/21)
Second Five Year Term
(2020/21- 2024/25)
Third Five Year Term
(2024/25-2028/29)
P1.1 Preparation of District Wide Bulk
Infrastructure Master Plan and District Integrated
Transport Planning
p2.1 Implementation of Plan to replace ageing
infrastructure
P3.1 Fully functional infrastructure and implementation
of maintenance plan
District Wide Bulk Infrastructure Master Plan
% Development and implementation of District
Wide Bulk Infrastructure Master Plan
An efficient, competitive and responsive economic infrastructure network
100%
Refer to Outcome 2 below
Define Programme / Projects for First Five Year
Term
Define Programme/ Projects for
Second Five Year Term
Define Programme / Projects for
Third Five Year Term
FIFTEEN YEAR SCENARIO PLANNING : UNDERPINNING PROGRAMME/ PROJECTS TO ACHIEVE IMPACT, OUTCOME
AND TARGETS OUTLINED ABOVE
Regional Technical Support & Economic Planning
Shared Services Model
District Wide Bulk Infrastructure Master Plan
Embedding Regional Technical Support & Economic
Planning
Shared Services Model
Basic Services Complying with norms and standards
Enhance Regional Technical Support & Economic
Planning
Shared Services Model
Accessible, reliable and sustainable basic services
rendered to the Community
P1.2 Framework plan for establishment of Water
Services Authority for the region
p2.2 Established Water Services Authority P3.2 Fully functional Water Services Authority Revision
of policy and implementation of bulk contribution fees
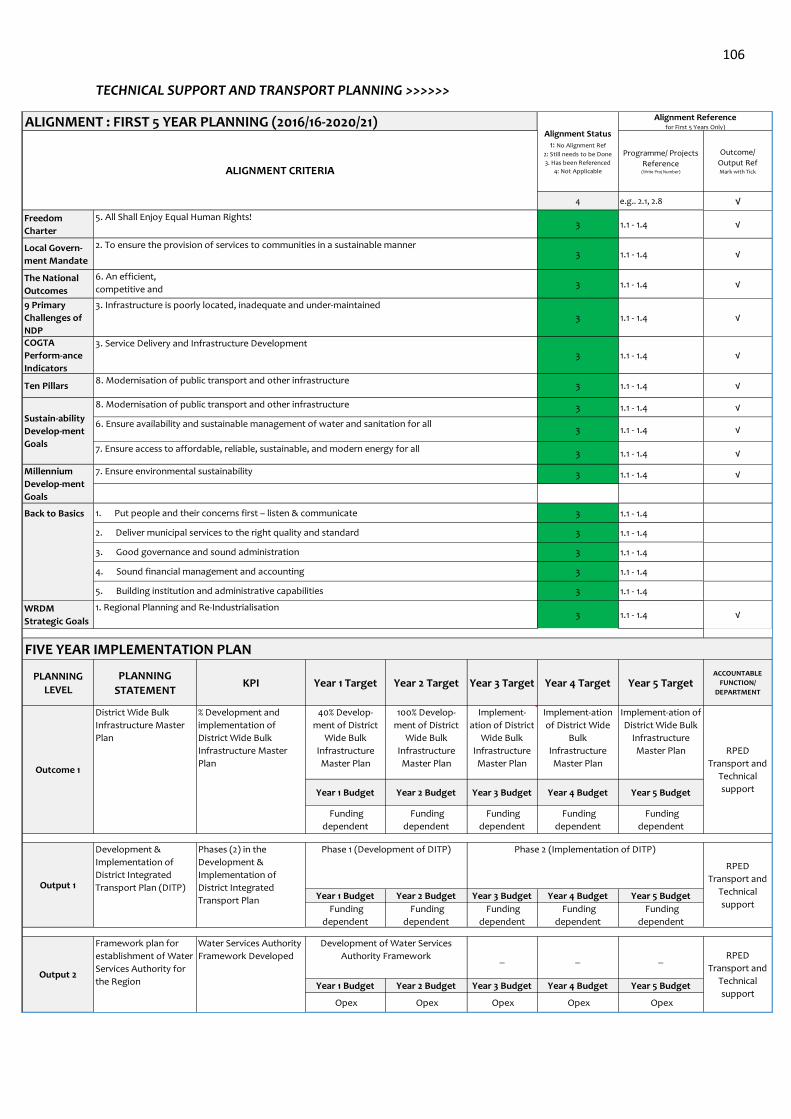
106
TECHNICAL SUPPORT AND TRANSPORT PLANNING >>>>>>
ALIGNMENT : FIRST 5 YEAR PLANNING (2016/16-2020/21)
Programme/ Projects
Reference(Write Proj Number)
Outcome/
Output RefMark with Tick
4 e.g.. 2.1, 2.8 √
Freedom
Charter3 1.1 - 1.4 √
Local Govern-
ment Mandate3 1.1 - 1.4 √
The National
Outcomes
6. An efficient,
competitive and
responsive economic
3 1.1 - 1.4 √
9 Primary
Challenges of
NDP
3 1.1 - 1.4 √
COGTA
Perform-ance
Indicators
3 1.1 - 1.4 √
Ten Pillars 3 1.1 - 1.4 √
3 1.1 - 1.4 √
3 1.1 - 1.4 √
3 1.1 - 1.4 √
3 1.1 - 1.4 √
Back to Basics 3 1.1 - 1.4
3 1.1 - 1.4
3 1.1 - 1.4
3 1.1 - 1.4
3 1.1 - 1.4
WRDM
Strategic Goals3 1.1 - 1.4 √
FIVE YEAR IMPLEMENTATION PLAN
PLANNING
LEVEL
PLANNING
STATEMENTKPI Year 1 Target Year 2 Target Year 3 Target Year 4 Target Year 5 Target
ACCOUNTABLE
FUNCTION/
DEPARTMENT
40% Develop-
ment of District
Wide Bulk
Infrastructure
Master Plan
100% Develop-
ment of District
Wide Bulk
Infrastructure
Master Plan
Implement-
ation of District
Wide Bulk
Infrastructure
Master Plan
Implement-ation
of District Wide
Bulk
Infrastructure
Master Plan
Implement-ation of
District Wide Bulk
Infrastructure
Master Plan
Year 1 Budget Year 2 Budget Year 3 Budget Year 4 Budget Year 5 Budget
Funding
dependent
Funding
dependent
Funding
dependent
Funding
dependent
Funding
dependent
Year 1 Budget Year 2 Budget Year 3 Budget Year 4 Budget Year 5 Budget
Funding
dependent
Funding
dependent
Funding
dependent
Funding
dependent
Funding
dependent
_ _ _
Year 1 Budget Year 2 Budget Year 3 Budget Year 4 Budget Year 5 Budget
Opex Opex Opex Opex Opex
Millennium
Develop-ment
Goals
Output 1
Development &
Implementation of
District Integrated
Transport Plan (DITP)
Phases (2) in the
Development &
Implementation of
District Integrated
Transport Plan
RPED
Transport and
Technical
support
1. Regional Planning and Re-Industrialisation
Outcome 1
District Wide Bulk
Infrastructure Master
Plan
% Development and
implementation of
District Wide Bulk
Infrastructure Master
Plan
RPED
Transport and
Technical
support
Phase 1 (Development of DITP) Phase 2 (Implementation of DITP)
Development of Water Services
Authority Framework
Output 2
Framework plan for
establishment of Water
Services Authority for
the Region
Water Services Authority
Framework Developed RPED
Transport and
Technical
support
1. Put people and their concerns first – listen & communicate
2. Deliver municipal services to the right quality and standard
3. Good governance and sound administration
4. Sound financial management and accounting
5. Building institution and administrative capabilities
3. Service Delivery and Infrastructure Development
2. To ensure the provision of services to communities in a sustainable manner
3. Infrastructure is poorly located, inadequate and under-maintained
Alignment Status1: No Alignment Ref
2: Still needs to be Done
3. Has been Referenced
4: Not Applicable
Alignment Referencefor First 5 Years Only)
ALIGNMENT CRITERIA
5. All Shall Enjoy Equal Human Rights!
8. Modernisation of public transport and other infrastructure
8. Modernisation of public transport and other infrastructure
Sustain-ability
Develop-ment
Goals
6. Ensure availability and sustainable management of water and sanitation for all
7. Ensure access to affordable, reliable, sustainable, and modern energy for all
7. Ensure environmental sustainability
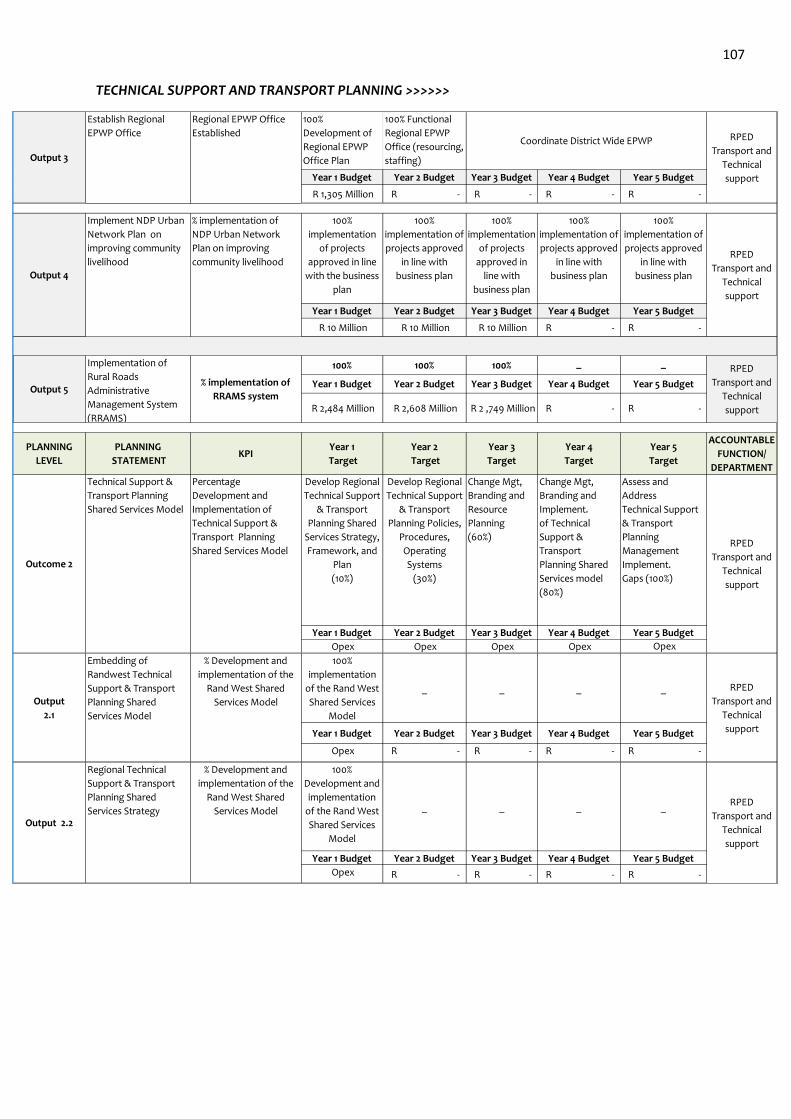
107
TECHNICAL SUPPORT AND TRANSPORT PLANNING >>>>>>
100%
Development of
Regional EPWP
Office Plan
100% Functional
Regional EPWP
Office (resourcing,
staffing)
Year 1 Budget Year 2 Budget Year 3 Budget Year 4 Budget Year 5 Budget
R 1,305 Million R - R - R - R -
100%
implementation
of projects
approved in line
with the business
plan
100%
implementation of
projects approved
in line with
business plan
100%
implementation
of projects
approved in
line with
business plan
100%
implementation of
projects approved
in line with
business plan
100%
implementation of
projects approved
in line with
business plan
Year 1 Budget Year 2 Budget Year 3 Budget Year 4 Budget Year 5 Budget
R 10 Million R 10 Million R 10 Million R - R -
100% 100% 100% _ _
Year 1 Budget Year 2 Budget Year 3 Budget Year 4 Budget Year 5 Budget
R 2,484 Million R 2,608 Million R 2 ,749 Million R - R -
PLANNING
LEVEL
PLANNING
STATEMENTKPI
Year 1
Target
Year 2
Target
Year 3
Target
Year 4
Target
Year 5
Target
ACCOUNTABLE
FUNCTION/
DEPARTMENT
Develop Regional
Technical Support
& Transport
Planning Shared
Services Strategy,
Framework, and
Plan
(10%)
Develop Regional
Technical Support
& Transport
Planning Policies,
Procedures,
Operating
Systems
(30%)
Change Mgt,
Branding and
Resource
Planning
(60%)
Change Mgt,
Branding and
Implement.
of Technical
Support &
Transport
Planning Shared
Services model
(80%)
Assess and
Address
Technical Support
& Transport
Planning
Management
Implement.
Gaps (100%)
Year 1 Budget Year 2 Budget Year 3 Budget Year 4 Budget Year 5 Budget
Opex Opex Opex Opex Opex
100%
implementation
of the Rand West
Shared Services
Model
_ _ _ _
Year 1 Budget Year 2 Budget Year 3 Budget Year 4 Budget Year 5 Budget
Opex R - R - R - R -
100%
Development and
implementation
of the Rand West
Shared Services
Model
_ _ _ _
Year 1 Budget Year 2 Budget Year 3 Budget Year 4 Budget Year 5 Budget
Opex R - R - R - R -
Output 4
Implement NDP Urban
Network Plan on
improving community
livelihood
% implementation of
NDP Urban Network
Plan on improving
community livelihoodRPED
Transport and
Technical
support
Output 3
Establish Regional
EPWP Office
Regional EPWP Office
Established RPED
Transport and
Technical
support
Outcome 2
Technical Support &
Transport Planning
Shared Services Model
Percentage
Development and
Implementation of
Technical Support &
Transport Planning
Shared Services ModelRPED
Transport and
Technical
support
Output
2.1
Embedding of
Randwest Technical
Support & Transport
Planning Shared
Services Model
% Development and
implementation of the
Rand West Shared
Services Model
RPED
Transport and
Technical
support
Output 2.2
Regional Technical
Support & Transport
Planning Shared
Services Strategy
% Development and
implementation of the
Rand West Shared
Services ModelRPED
Transport and
Technical
support
Implementation of
Rural Roads
Administrative
Management System
(RRAMS)
Output 5% implementation of
RRAMS system
RPED
Transport and
Technical
support
Coordinate District Wide EPWP
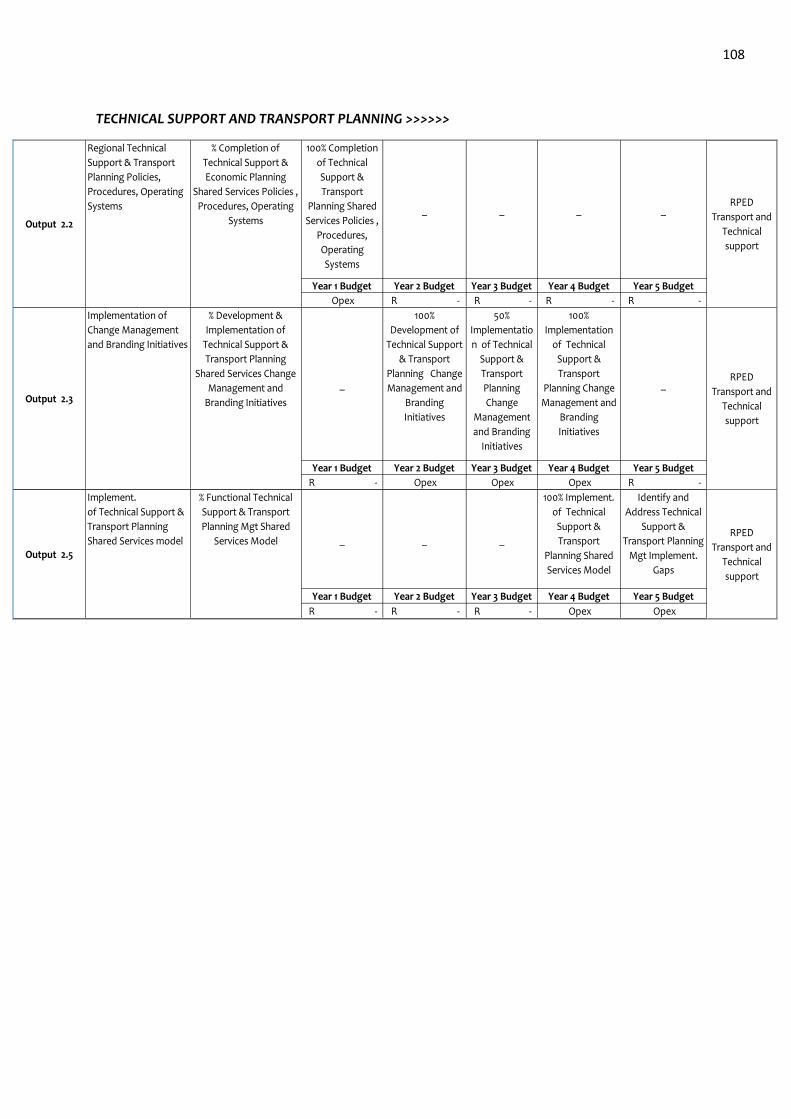
108
TECHNICAL SUPPORT AND TRANSPORT PLANNING >>>>>>
100% Completion
of Technical
Support &
Transport
Planning Shared
Services Policies ,
Procedures,
Operating
Systems
_ _ _ _
Year 1 Budget Year 2 Budget Year 3 Budget Year 4 Budget Year 5 Budget
Opex R - R - R - R -
_
100%
Development of
Technical Support
& Transport
Planning Change
Management and
Branding
Initiatives
50%
Implementatio
n of Technical
Support &
Transport
Planning
Change
Management
and Branding
Initiatives
100%
Implementation
of Technical
Support &
Transport
Planning Change
Management and
Branding
Initiatives
_
Year 1 Budget Year 2 Budget Year 3 Budget Year 4 Budget Year 5 Budget
R - Opex Opex Opex R -
_ _ _
100% Implement.
of Technical
Support &
Transport
Planning Shared
Services Model
Identify and
Address Technical
Support &
Transport Planning
Mgt Implement.
Gaps
Year 1 Budget Year 2 Budget Year 3 Budget Year 4 Budget Year 5 Budget
R - R - R - Opex Opex
Output 2.5
Implement.
of Technical Support &
Transport Planning
Shared Services model
% Functional Technical
Support & Transport
Planning Mgt Shared
Services ModelRPED
Transport and
Technical
support
Output 2.3
Implementation of
Change Management
and Branding Initiatives
% Development &
Implementation of
Technical Support &
Transport Planning
Shared Services Change
Management and
Branding Initiatives
RPED
Transport and
Technical
support
Output 2.2
Regional Technical
Support & Transport
Planning Policies,
Procedures, Operating
Systems
% Completion of
Technical Support &
Economic Planning
Shared Services Policies ,
Procedures, Operating
Systems
RPED
Transport and
Technical
support
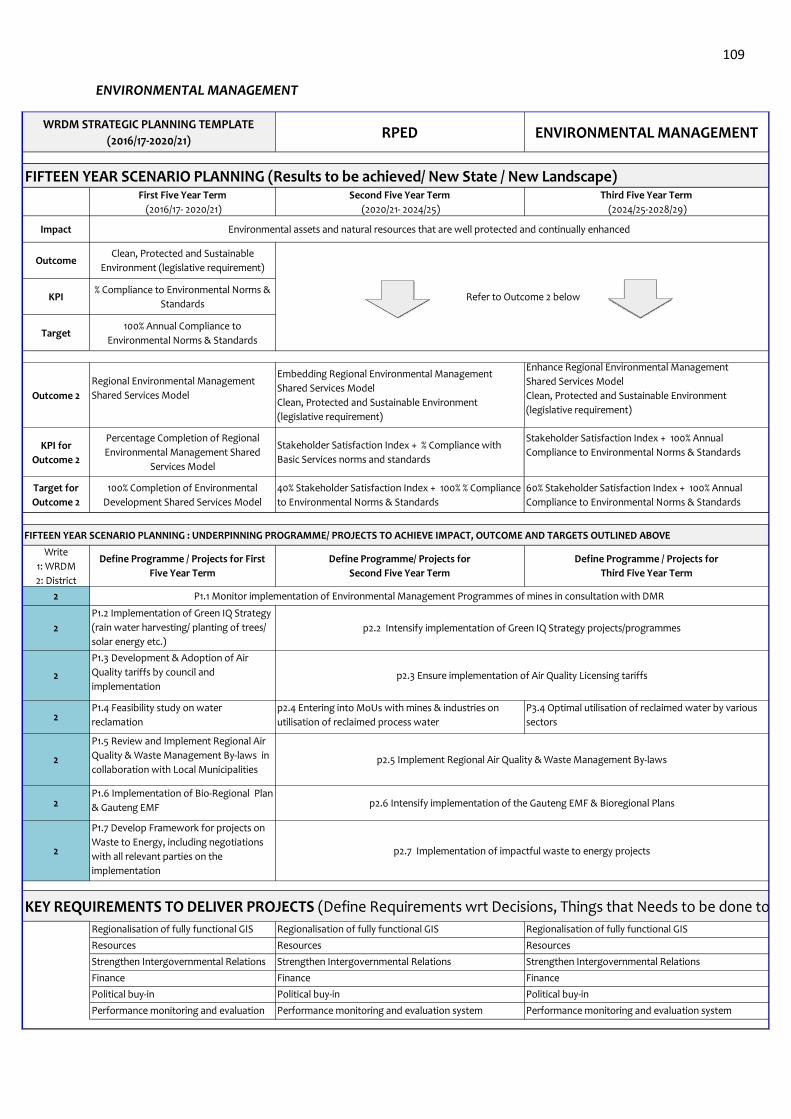
109
ENVIRONMENTAL MANAGEMENT
FIFTEEN YEAR SCENARIO PLANNING (Results to be achieved/ New State / New Landscape)
Impact
Outcome
KPI
Target
Outcome 2
KPI for
Outcome 2
Target for
Outcome 2
Write
1: WRDM
2: District
2
2
2
2
2
2
2
Clean, Protected and Sustainable
Environment (legislative requirement)
% Compliance to Environmental Norms &
Standards
100% Annual Compliance to
Environmental Norms & Standards
Refer to Outcome 2 below
Regional Environmental Management
Shared Services Model
Embedding Regional Environmental Management
Shared Services Model
Clean, Protected and Sustainable Environment
(legislative requirement)
Enhance Regional Environmental Management
Shared Services Model
Clean, Protected and Sustainable Environment
(legislative requirement)
Percentage Completion of Regional
Environmental Management Shared
Services Model
Stakeholder Satisfaction Index + % Compliance with
Basic Services norms and standards
Stakeholder Satisfaction Index + 100% Annual
Compliance to Environmental Norms & Standards
100% Completion of Environmental
Development Shared Services Model
40% Stakeholder Satisfaction Index + 100% % Compliance
to Environmental Norms & Standards
60% Stakeholder Satisfaction Index + 100% Annual
Compliance to Environmental Norms & Standards
Performance monitoring and evaluation
system
Performance monitoring and evaluation system Performance monitoring and evaluation system
Strengthen Intergovernmental Relations Strengthen Intergovernmental Relations
Finance Finance Finance
Political buy-in Political buy-in Political buy-in
KEY REQUIREMENTS TO DELIVER PROJECTS (Define Requirements wrt Decisions, Things that Needs to be done to make Deliver above mentioned Projects)
Regionalisation of fully functional GIS Regionalisation of fully functional GIS Regionalisation of fully functional GIS
Resources Resources Resources
Strengthen Intergovernmental Relations
p2.3 Ensure implementation of Air Quality Licensing tariffs
p2.5 Implement Regional Air Quality & Waste Management By-laws
p2.6 Intensify implementation of the Gauteng EMF & Bioregional Plans
P1.7 Develop Framework for projects on
Waste to Energy, including negotiations
with all relevant parties on the
implementation
p2.7 Implementation of impactful waste to energy projects
WRDM STRATEGIC PLANNING TEMPLATE
(2016/17-2020/21)RPED ENVIRONMENTAL MANAGEMENT
First Five Year Term
(2016/17- 2020/21)
Second Five Year Term
(2020/21- 2024/25)
Third Five Year Term
(2024/25-2028/29)
P1.2 Implementation of Green IQ Strategy
(rain water harvesting/ planting of trees/
solar energy etc.)
Define Programme / Projects for First
Five Year Term
Define Programme/ Projects for
Second Five Year Term
Define Programme / Projects for
Third Five Year Term
P1.1 Monitor implementation of Environmental Management Programmes of mines in consultation with DMR
p2.2 Intensify implementation of Green IQ Strategy projects/programmes
Environmental assets and natural resources that are well protected and continually enhanced
P1.5 Review and Implement Regional Air
Quality & Waste Management By-laws in
collaboration with Local Municipalities
P1.6 Implementation of Bio-Regional Plan
& Gauteng EMF
FIFTEEN YEAR SCENARIO PLANNING : UNDERPINNING PROGRAMME/ PROJECTS TO ACHIEVE IMPACT, OUTCOME AND TARGETS OUTLINED ABOVE
P1.3 Development & Adoption of Air
Quality tariffs by council and
implementation
P1.4 Feasibility study on water
reclamation
p2.4 Entering into MoUs with mines & industries on
utilisation of reclaimed process water
P3.4 Optimal utilisation of reclaimed water by various
sectors
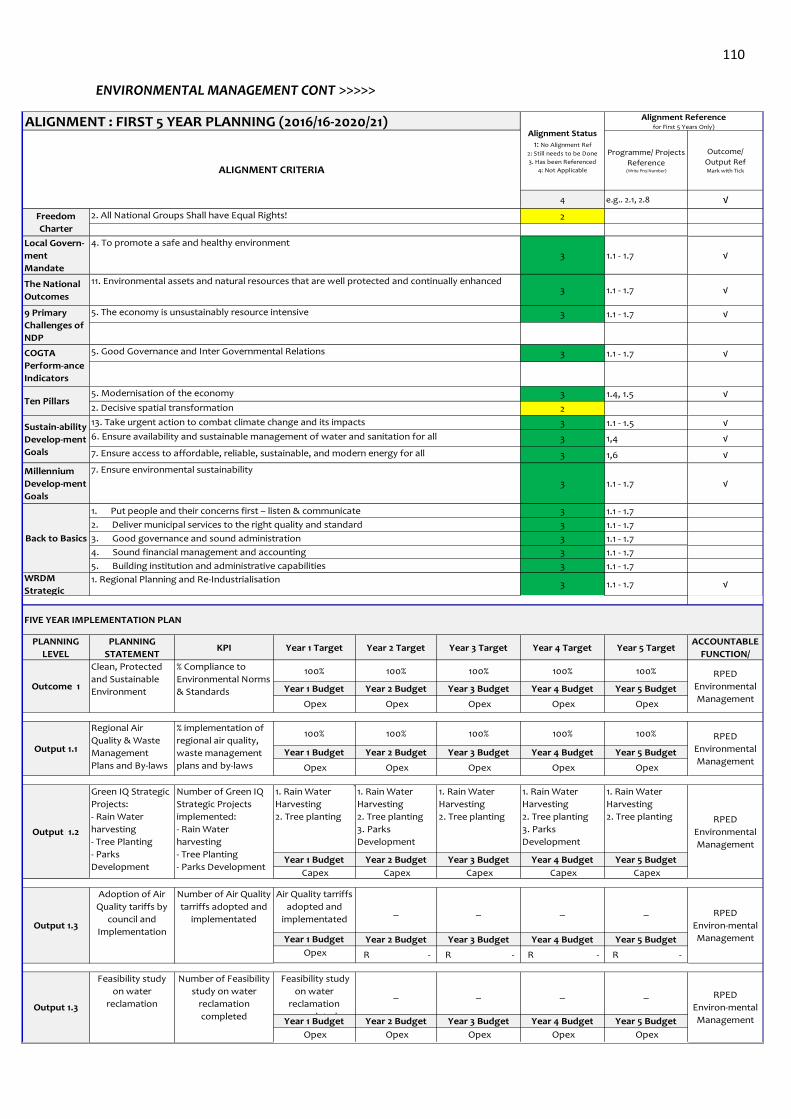
110
ENVIRONMENTAL MANAGEMENT CONT >>>>>
ALIGNMENT : FIRST 5 YEAR PLANNING (2016/16-2020/21)
Programme/ Projects
Reference(Write Proj Number)
Outcome/
Output RefMark with Tick
4 e.g.. 2.1, 2.8 √
2
Local Govern-
ment
Mandate
3 1.1 - 1.7 √
The National
Outcomes3 1.1 - 1.7 √
3 1.1 - 1.7 √
3 1.1 - 1.7 √
3 1.4, 1.5 √
2
3 1.1 - 1.5 √
3 1,4 √
3 1,6 √
Millennium
Develop-ment
Goals
3 1.1 - 1.7 √
3 1.1 - 1.7
3 1.1 - 1.7
3 1.1 - 1.7
3 1.1 - 1.7
3 1.1 - 1.7WRDM
Strategic 3 1.1 - 1.7 √
PLANNING
LEVEL
PLANNING
STATEMENTKPI Year 1 Target Year 2 Target Year 3 Target Year 4 Target Year 5 Target
ACCOUNTABLE
FUNCTION/
100% 100% 100% 100% 100%
Year 1 Budget Year 2 Budget Year 3 Budget Year 4 Budget Year 5 Budget
Opex Opex Opex Opex Opex
100% 100% 100% 100% 100%
Year 1 Budget Year 2 Budget Year 3 Budget Year 4 Budget Year 5 Budget
Opex Opex Opex Opex Opex
1. Rain Water
Harvesting
2. Tree planting
1. Rain Water
Harvesting
2. Tree planting
3. Parks
Development
1. Rain Water
Harvesting
2. Tree planting
1. Rain Water
Harvesting
2. Tree planting
3. Parks
Development
1. Rain Water
Harvesting
2. Tree planting
Year 1 Budget Year 2 Budget Year 3 Budget Year 4 Budget Year 5 Budget
Capex Capex Capex Capex Capex
Year 1 Budget Year 2 Budget Year 3 Budget Year 4 Budget Year 5 Budget
Opex R - R - R - R -
Feasibility study
on water
reclamation
completed
_ _ _ _
Year 1 Budget Year 2 Budget Year 3 Budget Year 4 Budget Year 5 Budget
Opex Opex Opex Opex Opex
Output 1.3
Feasibility study
on water
reclamation RPED
Environ-mental
Management
Output 1.3
Adoption of Air
Quality tariffs by
council and
Implementation
RPED
Environ-mental
Management
____
Air Quality tarriffs
adopted and
implementated
Number of Air Quality
tarriffs adopted and
implementated
Number of Feasibility
study on water
reclamation
completed
RPED
Environmental
Management
FIVE YEAR IMPLEMENTATION PLAN
Outcome 1
Clean, Protected
and Sustainable
Environment
% Compliance to
Environmental Norms
& Standards
RPED
Environmental
Management
% implementation of
regional air quality,
waste management
plans and by-laws
RPED
Environmental
Management
Regional Air
Quality & Waste
Management
Plans and By-laws
Back to Basics
2. Deliver municipal services to the right quality and standard
3. Good governance and sound administration
4. Sound financial management and accounting
5. Building institution and administrative capabilities
Output 1.2
Green IQ Strategic
Projects:
- Rain Water
harvesting
- Tree Planting
- Parks
Development
Number of Green IQ
Strategic Projects
implemented:
- Rain Water
harvesting
- Tree Planting
- Parks Development
COGTA
Perform-ance
Indicators
5. Good Governance and Inter Governmental Relations
9 Primary
Challenges of
NDP
5. The economy is unsustainably resource intensive
11. Environmental assets and natural resources that are well protected and continually enhanced
4. To promote a safe and healthy environment
Freedom
Charter
2. All National Groups Shall have Equal Rights!
Alignment Status1: No Alignment Ref
2: Still needs to be Done
3. Has been Referenced
4: Not Applicable
Alignment Referencefor First 5 Years Only)
ALIGNMENT CRITERIA
6. Ensure availability and sustainable management of water and sanitation for all
7. Ensure access to affordable, reliable, sustainable, and modern energy for all
7. Ensure environmental sustainability
Ten Pillars5. Modernisation of the economy
Sustain-ability
Develop-ment
Goals
13. Take urgent action to combat climate change and its impacts
2. Decisive spatial transformation
Output 1.1
1. Regional Planning and Re-Industrialisation
1. Put people and their concerns first – listen & communicate
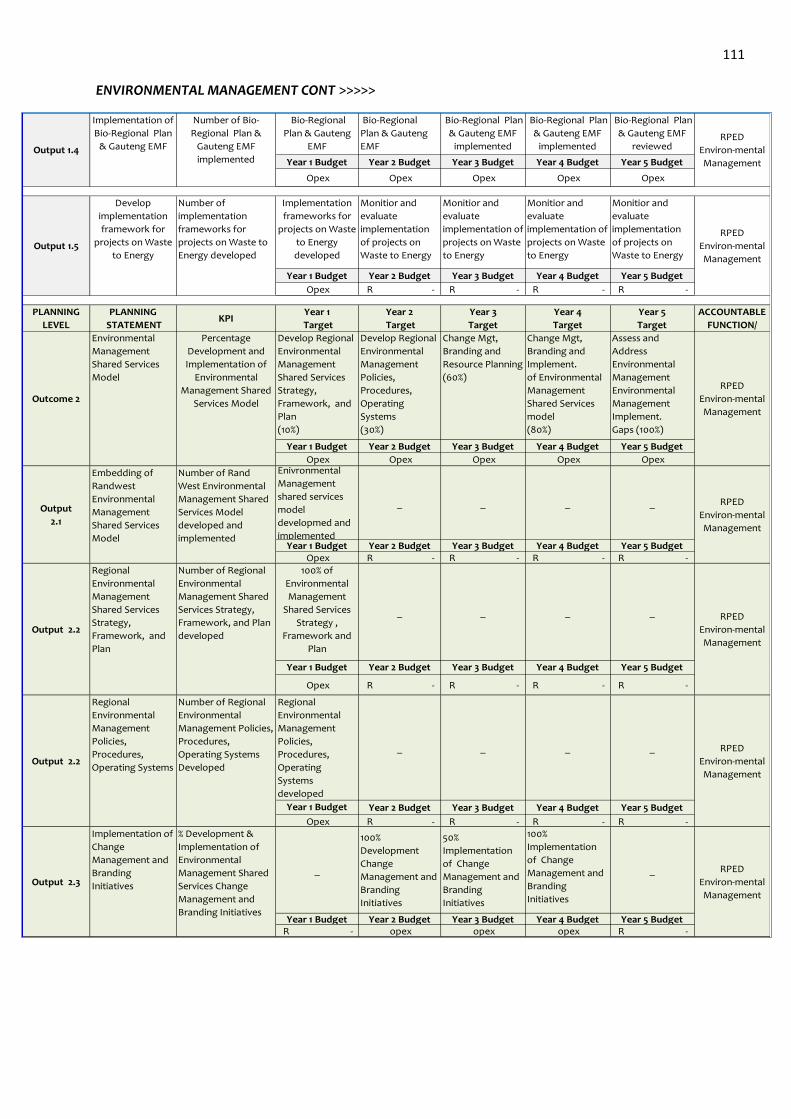
111
ENVIRONMENTAL MANAGEMENT CONT >>>>>
Bio-Regional
Plan & Gauteng
EMF
implemented
Bio-Regional
Plan & Gauteng
EMF
implemented
Bio-Regional Plan
& Gauteng EMF
implemented
Bio-Regional Plan
& Gauteng EMF
implemented
Bio-Regional Plan
& Gauteng EMF
reviewed
Year 1 Budget Year 2 Budget Year 3 Budget Year 4 Budget Year 5 Budget
Opex Opex Opex Opex Opex
Implementation
frameworks for
projects on Waste
to Energy
developed
Monitior and
evaluate
implementation
of projects on
Waste to Energy
Monitior and
evaluate
implementation of
projects on Waste
to Energy
Monitior and
evaluate
implementation of
projects on Waste
to Energy
Monitior and
evaluate
implementation
of projects on
Waste to Energy
Year 1 Budget Year 2 Budget Year 3 Budget Year 4 Budget Year 5 Budget
Opex R - R - R - R -
PLANNING
LEVEL
PLANNING
STATEMENTKPI
Year 1
Target
Year 2
Target
Year 3
Target
Year 4
Target
Year 5
Target
ACCOUNTABLE
FUNCTION/
Develop Regional
Environmental
Management
Shared Services
Strategy,
Framework, and
Plan
(10%)
Develop Regional
Environmental
Management
Policies,
Procedures,
Operating
Systems
(30%)
Change Mgt,
Branding and
Resource Planning
(60%)
Change Mgt,
Branding and
Implement.
of Environmental
Management
Shared Services
model
(80%)
Assess and
Address
Environmental
Management
Environmental
Management
Implement.
Gaps (100%)
Year 1 Budget Year 2 Budget Year 3 Budget Year 4 Budget Year 5 Budget
Opex Opex Opex Opex Opex Enivronmental
Management
shared services
model
developmed and
implemented
_ _ _ _
Year 1 Budget Year 2 Budget Year 3 Budget Year 4 Budget Year 5 Budget Opex R - R - R - R -
100% of
Environmental
Management
Shared Services
Strategy ,
Framework and
Plan
_ _ _ _
Year 1 Budget Year 2 Budget Year 3 Budget Year 4 Budget Year 5 Budget
Opex R - R - R - R -
Regional
Environmental
Management
Policies,
Procedures,
Operating
Systems
developed
_ _ _ _
Year 1 Budget Year 2 Budget Year 3 Budget Year 4 Budget Year 5 Budget
Opex R - R - R - R -
_
100%
Development
Change
Management and
Branding
Initiatives
50%
Implementation
of Change
Management and
Branding
Initiatives
100%
Implementation
of Change
Management and
Branding
Initiatives
_
Year 1 Budget Year 2 Budget Year 3 Budget Year 4 Budget Year 5 Budget R - opex opex opex R -
Number of Regional
Environmental
Management Policies,
Procedures,
Operating Systems
Developed
RPED
Environ-mental
Management
Output 2.3
Implementation of
Change
Management and
Branding
Initiatives
% Development &
Implementation of
Environmental
Management Shared
Services Change
Management and
Branding Initiatives
RPED
Environ-mental
Management
Output 2.2
Regional
Environmental
Management
Policies,
Procedures,
Operating Systems
Outcome 2
Environmental
Management
Shared Services
Model
Percentage
Development and
Implementation of
Environmental
Management Shared
Services Model
RPED
Environ-mental
Management
Output
2.1
Embedding of
Randwest
Environmental
Management
Shared Services
Model
Output 1.4
Implementation of
Bio-Regional Plan
& Gauteng EMFRPED
Environ-mental
Management
Output 2.2
Regional
Environmental
Management
Shared Services
Strategy,
Framework, and
Plan
Number of Regional
Environmental
Management Shared
Services Strategy,
Framework, and Plan
developed
RPED
Environ-mental
Management
Number of Rand
West Environmental
Management Shared
Services Model
developed and
implemented
RPED
Environ-mental
Management
Output 1.5
Develop
implementation
framework for
projects on Waste
to Energy
RPED
Environ-mental
Management
Number of Bio-
Regional Plan &
Gauteng EMF
implemented
Number of
implementation
frameworks for
projects on Waste to
Energy developed
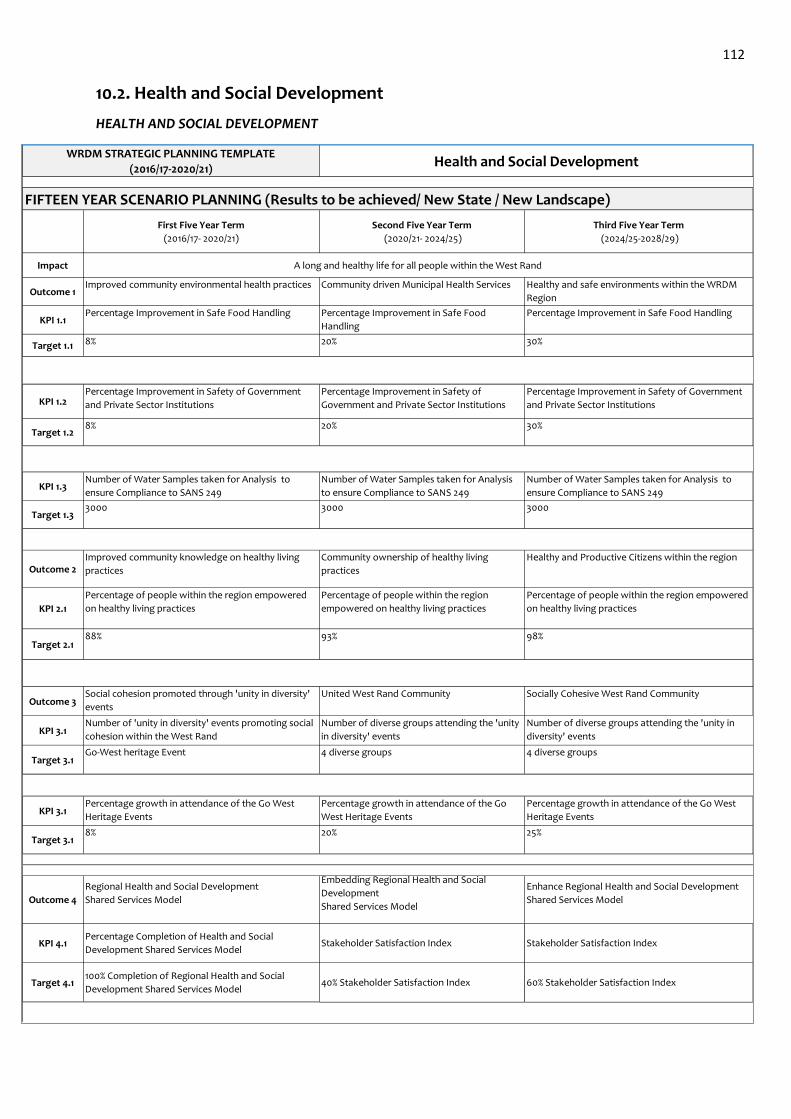
112
10.2. Health and Social Development
HEALTH AND SOCIAL DEVELOPMENT
FIFTEEN YEAR SCENARIO PLANNING (Results to be achieved/ New State / New Landscape)
Impact
Outcome 1
KPI 1.1
Target 1.1
KPI 1.2
Target 1.2
KPI 1.3
Target 1.3
Outcome 2
KPI 2.1
Target 2.1
Outcome 3
KPI 3.1
Target 3.1
KPI 3.1
Target 3.1
Outcome 4
KPI 4.1
Target 4.1
Percentage growth in attendance of the Go West
Heritage Events
Percentage growth in attendance of the Go
West Heritage Events
Percentage growth in attendance of the Go West
Heritage Events
8% 20% 25%
Social cohesion promoted through 'unity in diversity'
events
United West Rand Community Socially Cohesive West Rand Community
WRDM STRATEGIC PLANNING TEMPLATE
(2016/17-2020/21)
First Five Year Term
(2016/17- 2020/21)
Second Five Year Term
(2020/21- 2024/25)
Third Five Year Term
(2024/25-2028/29)
Improved community environmental health practices Community driven Municipal Health Services Healthy and safe environments within the WRDM
Region
A long and healthy life for all people within the West Rand
Health and Social Development
Percentage Improvement in Safe Food Handling Percentage Improvement in Safe Food
Handling
Percentage Improvement in Safe Food Handling
8% 20% 30%
Improved community knowledge on healthy living
practices
Community ownership of healthy living
practices
Healthy and Productive Citizens within the region
Percentage Improvement in Safety of Government
and Private Sector Institutions
Percentage Improvement in Safety of
Government and Private Sector Institutions
Percentage Improvement in Safety of Government
and Private Sector Institutions
8% 20% 30%
Number of Water Samples taken for Analysis to
ensure Compliance to SANS 249
Number of Water Samples taken for Analysis
to ensure Compliance to SANS 249
Number of Water Samples taken for Analysis to
ensure Compliance to SANS 249
3000 3000 3000
Percentage of people within the region
empowered on healthy living practices
Percentage of people within the region empowered
on healthy living practices
88% 93% 98%
Percentage of people within the region empowered
on healthy living practices
Number of 'unity in diversity' events promoting social
cohesion within the West Rand
Number of diverse groups attending the 'unity
in diversity' events
Number of diverse groups attending the 'unity in
diversity' events
Go-West heritage Event 4 diverse groups 4 diverse groups
Regional Health and Social Development
Shared Services Model
Embedding Regional Health and Social
Development
Shared Services Model
Enhance Regional Health and Social Development
Shared Services Model
Percentage Completion of Health and Social
Development Shared Services Model Stakeholder Satisfaction Index Stakeholder Satisfaction Index
100% Completion of Regional Health and Social
Development Shared Services Model 40% Stakeholder Satisfaction Index 60% Stakeholder Satisfaction Index
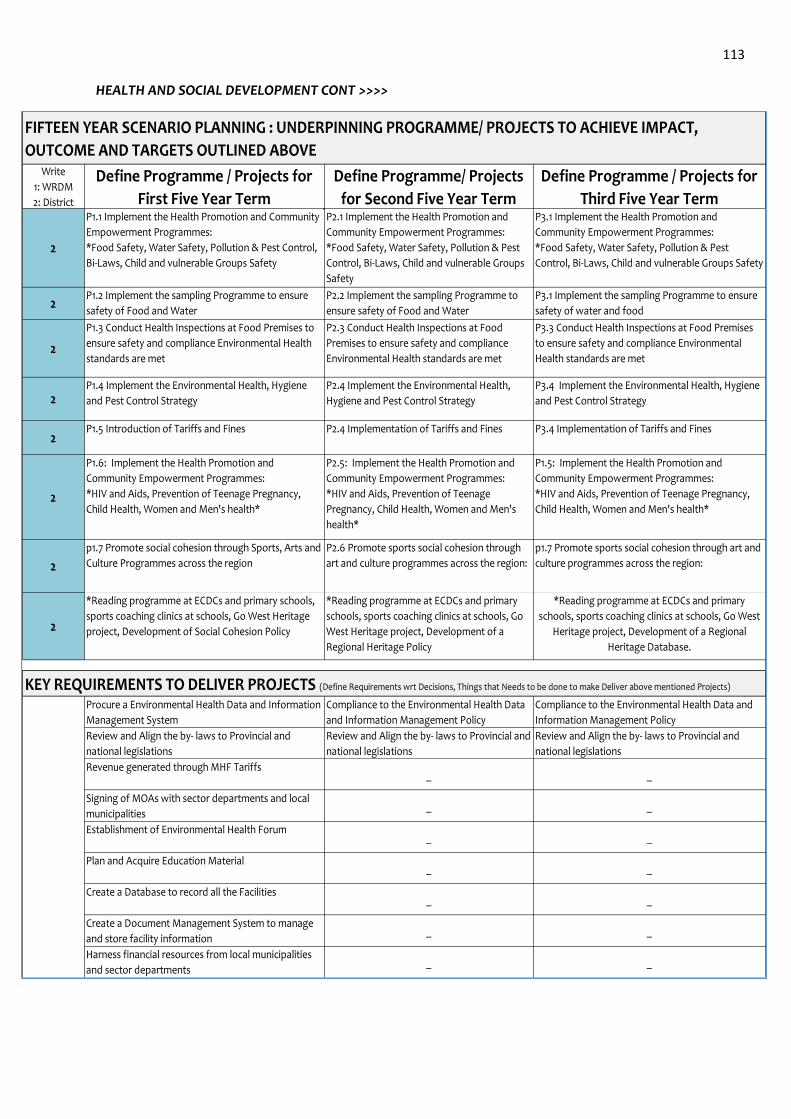
113
HEALTH AND SOCIAL DEVELOPMENT CONT >>>>
Write
1: WRDM
2: District
2
2
2
2
2
2
2
2
KEY REQUIREMENTS TO DELIVER PROJECTS (Define Requirements wrt Decisions, Things that Needs to be done to make Deliver above mentioned Projects)
Establishment of Environmental Health Forum
Define Programme / Projects for
Third Five Year Term
FIFTEEN YEAR SCENARIO PLANNING : UNDERPINNING PROGRAMME/ PROJECTS TO ACHIEVE IMPACT,
OUTCOME AND TARGETS OUTLINED ABOVE
p1.7 Promote sports social cohesion through art and
culture programmes across the region:
p1.7 Promote social cohesion through Sports, Arts and
Culture Programmes across the region
P2.6 Promote sports social cohesion through
art and culture programmes across the region:
P1.6: Implement the Health Promotion and
Community Empowerment Programmes:
*HIV and Aids, Prevention of Teenage Pregnancy,
Child Health, Women and Men's health*
P2.5: Implement the Health Promotion and
Community Empowerment Programmes:
*HIV and Aids, Prevention of Teenage
Pregnancy, Child Health, Women and Men's
health*
P1.5: Implement the Health Promotion and
Community Empowerment Programmes:
*HIV and Aids, Prevention of Teenage Pregnancy,
Child Health, Women and Men's health*
*Reading programme at ECDCs and primary schools,
sports coaching clinics at schools, Go West Heritage
project, Development of Social Cohesion Policy
*Reading programme at ECDCs and primary
schools, sports coaching clinics at schools, Go
West Heritage project, Development of a
Regional Heritage Policy
*Reading programme at ECDCs and primary
schools, sports coaching clinics at schools, Go West
Heritage project, Development of a Regional
Heritage Database.
Plan and Acquire Education Material_ _
Review and Align the by- laws to Provincial and
national legislations
Review and Align the by- laws to Provincial and
national legislations
Review and Align the by- laws to Provincial and
national legislations
Revenue generated through MHF Tariffs_ _
Signing of MOAs with sector departments and local
municipalities_ _
Procure a Environmental Health Data and Information
Management System
Compliance to the Environmental Health Data
and Information Management Policy
Compliance to the Environmental Health Data and
Information Management Policy
Harness financial resources from local municipalities
and sector departments_ _
Create a Document Management System to manage
and store facility information_ _
_ _
P3.3 Conduct Health Inspections at Food Premises
to ensure safety and compliance Environmental
Health standards are met
P1.5 Introduction of Tariffs and Fines P2.4 Implementation of Tariffs and Fines P3.4 Implementation of Tariffs and Fines
P1.1 Implement the Health Promotion and Community
Empowerment Programmes:
*Food Safety, Water Safety, Pollution & Pest Control,
Bi-Laws, Child and vulnerable Groups Safety
P2.1 Implement the Health Promotion and
Community Empowerment Programmes:
*Food Safety, Water Safety, Pollution & Pest
Control, Bi-Laws, Child and vulnerable Groups
Safety
P3.1 Implement the Health Promotion and
Community Empowerment Programmes:
*Food Safety, Water Safety, Pollution & Pest
Control, Bi-Laws, Child and vulnerable Groups Safety
P1.2 Implement the sampling Programme to ensure
safety of Food and Water
P2.2 Implement the sampling Programme to
ensure safety of Food and Water
P3.1 Implement the sampling Programme to ensure
safety of water and food
P1.3 Conduct Health Inspections at Food Premises to
ensure safety and compliance Environmental Health
standards are met
P2.3 Conduct Health Inspections at Food
Premises to ensure safety and compliance
Environmental Health standards are met
P1.4 Implement the Environmental Health, Hygiene
and Pest Control Strategy
P2.4 Implement the Environmental Health,
Hygiene and Pest Control Strategy
P3.4 Implement the Environmental Health, Hygiene
and Pest Control Strategy
Define Programme / Projects for
First Five Year Term
Define Programme/ Projects
for Second Five Year Term
Create a Database to record all the Facilities_ _
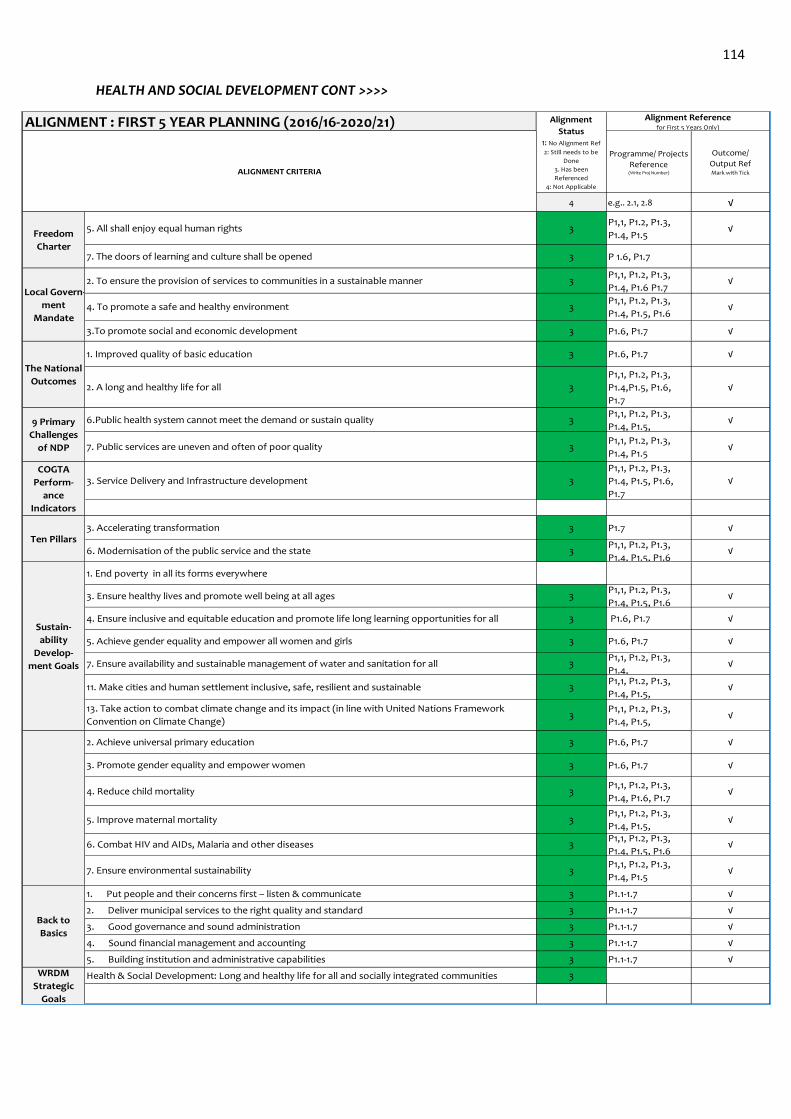
114
HEALTH AND SOCIAL DEVELOPMENT CONT >>>>
ALIGNMENT : FIRST 5 YEAR PLANNING (2016/16-2020/21)
Programme/ Projects
Reference(Write Proj Number)
Outcome/
Output RefMark with Tick
4 e.g.. 2.1, 2.8 √
3P1,1, P1.2, P1.3,
P1.4, P1.5√
3 P 1.6, P1.7
3P1,1, P1.2, P1.3,
P1.4, P1.6 P1.7√
3P1,1, P1.2, P1.3,
P1.4, P1.5, P1.6√
3 P1.6, P1.7 √
3 P1.6, P1.7 √
3
P1,1, P1.2, P1.3,
P1.4,P1.5, P1.6,
P1.7
√
3P1,1, P1.2, P1.3,
P1.4, P1.5,√
3P1,1, P1.2, P1.3,
P1.4, P1.5√
3
P1,1, P1.2, P1.3,
P1.4, P1.5, P1.6,
P1.7
√
3 P1.7 √
3P1,1, P1.2, P1.3,
P1.4, P1.5, P1.6√
3P1,1, P1.2, P1.3,
P1.4, P1.5, P1.6√
3 P1.6, P1.7 √
3 P1.6, P1.7 √
3P1,1, P1.2, P1.3,
P1.4, √
3P1,1, P1.2, P1.3,
P1.4, P1.5, √
3P1,1, P1.2, P1.3,
P1.4, P1.5,√
3 P1.6, P1.7 √
3 P1.6, P1.7 √
3P1,1, P1.2, P1.3,
P1.4, P1.6, P1.7√
3P1,1, P1.2, P1.3,
P1.4, P1.5, √
3P1,1, P1.2, P1.3,
P1.4, P1.5, P1.6 √
3P1,1, P1.2, P1.3,
P1.4, P1.5√
3 P1.1-1.7 √
3 P1.1-1.7 √
3 P1.1-1.7 √
3 P1.1-1.7 √
3 P1.1-1.7 √
3
3. Service Delivery and Infrastructure developmentCOGTA
Perform-
ance
Indicators
7. Ensure environmental sustainability
3. Accelerating transformationTen Pillars
6. Modernisation of the public service and the state
Sustain-
ability
Develop-
ment Goals
1. End poverty in all its forms everywhere
3. Ensure healthy lives and promote well being at all ages
7. Ensure availability and sustainable management of water and sanitation for all
13. Take action to combat climate change and its impact (in line with United Nations Framework
Convention on Climate Change)
1. Put people and their concerns first – listen & communicate
11. Make cities and human settlement inclusive, safe, resilient and sustainable
3. Good governance and sound administration
4. Sound financial management and accounting
5. Building institution and administrative capabilities
Back to
Basics
4. Ensure inclusive and equitable education and promote life long learning opportunities for all
5. Achieve gender equality and empower all women and girls
2. Achieve universal primary education
3. Promote gender equality and empower women
6. Combat HIV and AIDs, Malaria and other diseases
5. Improve maternal mortality
4. Reduce child mortality
Health & Social Development: Long and healthy life for all and socially integrated communitiesWRDM
Strategic
Goals
2. Deliver municipal services to the right quality and standard
Freedom
Charter
5. All shall enjoy equal human rights
4. To promote a safe and healthy environment
9 Primary
Challenges
of NDP
6.Public health system cannot meet the demand or sustain quality
The National
Outcomes
1. Improved quality of basic education
7. Public services are uneven and often of poor quality
2. A long and healthy life for all
Local Govern-
ment
Mandate
2. To ensure the provision of services to communities in a sustainable manner
3.To promote social and economic development
7. The doors of learning and culture shall be opened
Alignment
Status1: No Alignment Ref
2: Still needs to be
Done
3. Has been
Referenced
4: Not Applicable
Alignment Referencefor First 5 Years Only)
ALIGNMENT CRITERIA
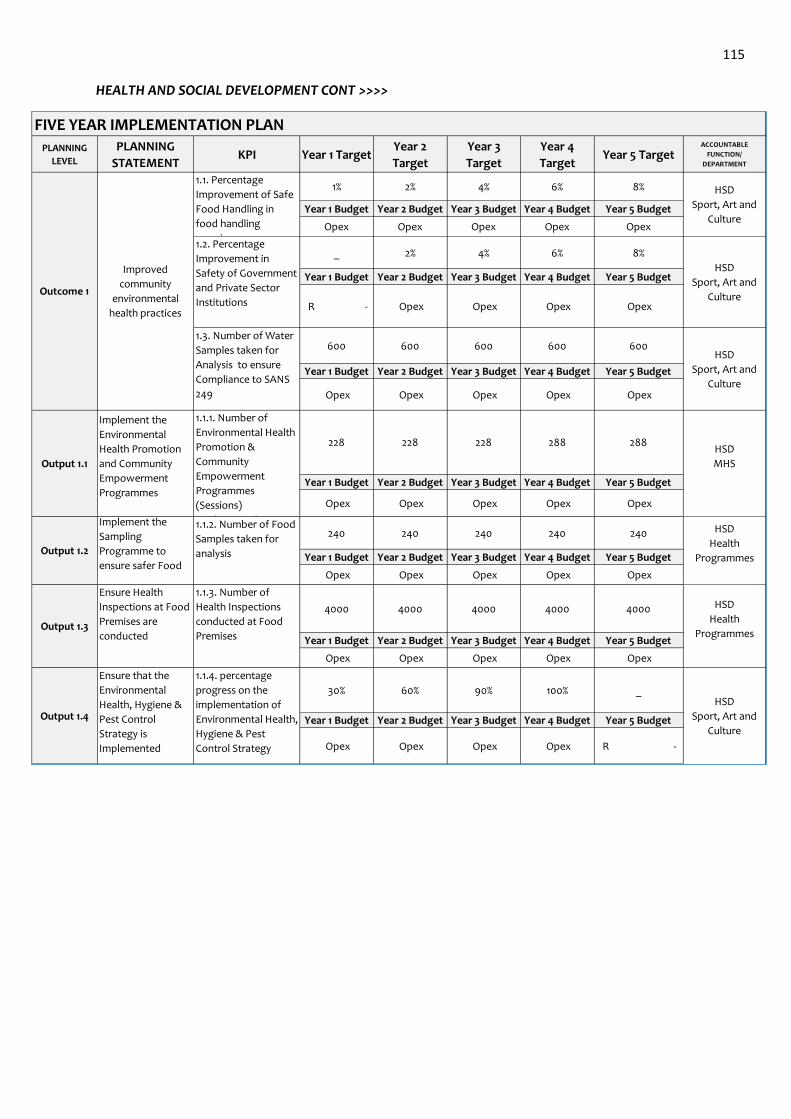
115
HEALTH AND SOCIAL DEVELOPMENT CONT >>>>
FIVE YEAR IMPLEMENTATION PLAN
PLANNING
LEVEL
PLANNING
STATEMENTKPI Year 1 Target
Year 2
Target
Year 3
Target
Year 4
TargetYear 5 Target
ACCOUNTABLE
FUNCTION/
DEPARTMENT
1% 2% 4% 6% 8%
Year 1 Budget Year 2 Budget Year 3 Budget Year 4 Budget Year 5 Budget
Opex Opex Opex Opex Opex
_ 2% 4% 6% 8%
Year 1 Budget Year 2 Budget Year 3 Budget Year 4 Budget Year 5 Budget
R - Opex Opex Opex Opex
600 600 600 600 600
Year 1 Budget Year 2 Budget Year 3 Budget Year 4 Budget Year 5 Budget
Opex Opex Opex Opex Opex
228 228 228 288 288
Year 1 Budget Year 2 Budget Year 3 Budget Year 4 Budget Year 5 Budget
Opex Opex Opex Opex Opex
240 240 240 240 240
Year 1 Budget Year 2 Budget Year 3 Budget Year 4 Budget Year 5 Budget
Opex Opex Opex Opex Opex
4000 4000 4000 4000 4000
Year 1 Budget Year 2 Budget Year 3 Budget Year 4 Budget Year 5 Budget
Opex Opex Opex Opex Opex
30% 60% 90% 100% _
Year 1 Budget Year 2 Budget Year 3 Budget Year 4 Budget Year 5 Budget
Opex Opex Opex Opex R -
Ensure that the
Environmental
Health, Hygiene &
Pest Control
Strategy is
Implemented
Output 1.2
Implement the
Sampling
Programme to
ensure safer Food
1.1.2. Number of Food
Samples taken for
analysis
HSD
Health
Programmes
1.1.4. percentage
progress on the
implementation of
Environmental Health,
Hygiene & Pest
Control Strategy
HSD
Sport, Art and
Culture
Output 1.3
Ensure Health
Inspections at Food
Premises are
conducted
1.1.3. Number of
Health Inspections
conducted at Food
Premises
HSD
Health
Programmes
Output 1.4
HSD
Sport, Art and
Culture
Output 1.1
Implement the
Environmental
Health Promotion
and Community
Empowerment
Programmes
1.1.1. Number of
Environmental Health
Promotion &
Community
Empowerment
Programmes
(Sessions)
Implemented
HSD
MHS
1.1. Percentage
Improvement of Safe
Food Handling in
food handling
premises1.2. Percentage
Improvement in
Safety of Government
and Private Sector
Institutions
HSD
Sport, Art and
Culture
1.3. Number of Water
Samples taken for
Analysis to ensure
Compliance to SANS
249
HSD
Sport, Art and
Culture
Outcome 1
Improved
community
environmental
health practices
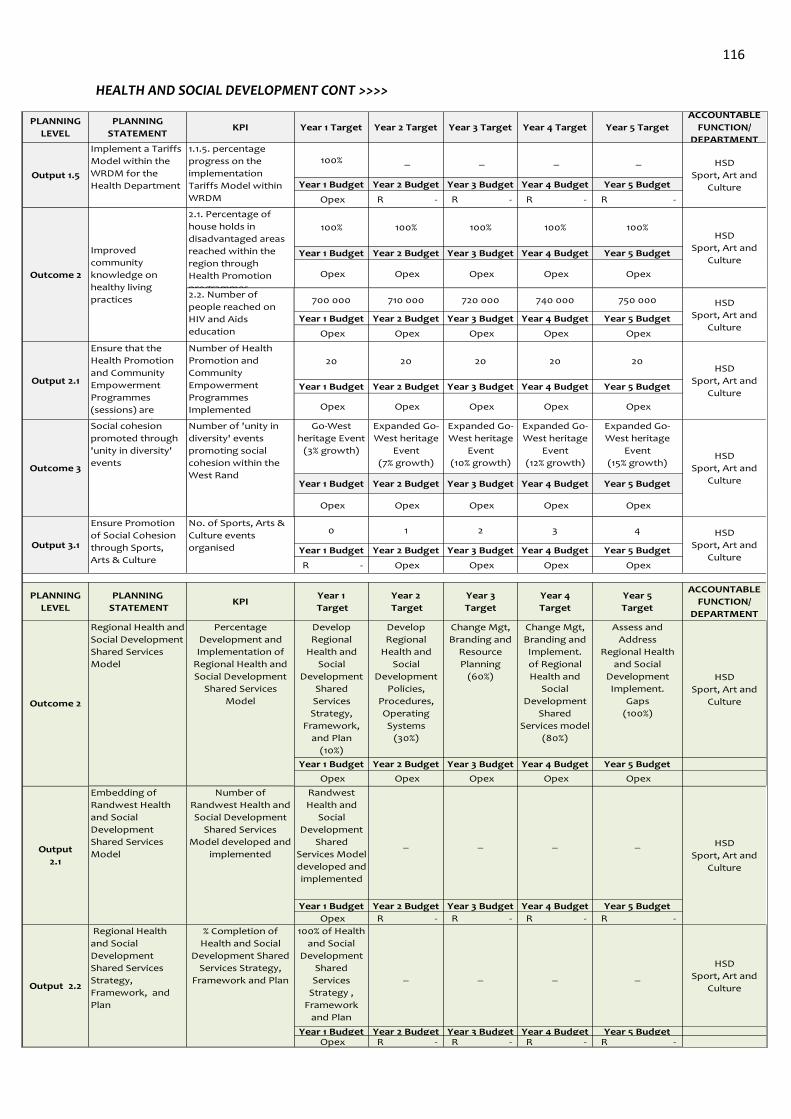
116
HEALTH AND SOCIAL DEVELOPMENT CONT >>>>
PLANNING
LEVEL
PLANNING
STATEMENTKPI Year 1 Target Year 2 Target Year 3 Target Year 4 Target Year 5 Target
ACCOUNTABLE
FUNCTION/
DEPARTMENT
100% _ _ _ _
Year 1 Budget Year 2 Budget Year 3 Budget Year 4 Budget Year 5 Budget
Opex R - R - R - R -
100% 100% 100% 100% 100%
Year 1 Budget Year 2 Budget Year 3 Budget Year 4 Budget Year 5 Budget
Opex Opex Opex Opex Opex
700 000 710 000 720 000 740 000 750 000
Year 1 Budget Year 2 Budget Year 3 Budget Year 4 Budget Year 5 Budget
Opex Opex Opex Opex Opex
20 20 20 20 20
Year 1 Budget Year 2 Budget Year 3 Budget Year 4 Budget Year 5 Budget
Opex Opex Opex Opex Opex
Go-West
heritage Event
(3% growth)
Expanded Go-
West heritage
Event
(7% growth)
Expanded Go-
West heritage
Event
(10% growth)
Expanded Go-
West heritage
Event
(12% growth)
Expanded Go-
West heritage
Event
(15% growth)
Year 1 Budget Year 2 Budget Year 3 Budget Year 4 Budget Year 5 Budget
Opex Opex Opex Opex Opex
0 1 2 3 4
Year 1 Budget Year 2 Budget Year 3 Budget Year 4 Budget Year 5 Budget
R - Opex Opex Opex Opex
PLANNING
LEVEL
PLANNING
STATEMENTKPI
Year 1
Target
Year 2
Target
Year 3
Target
Year 4
Target
Year 5
Target
ACCOUNTABLE
FUNCTION/
DEPARTMENT
Develop
Regional
Health and
Social
Development
Shared
Services
Strategy,
Framework,
and Plan
(10%)
Develop
Regional
Health and
Social
Development
Policies,
Procedures,
Operating
Systems
(30%)
Change Mgt,
Branding and
Resource
Planning
(60%)
Change Mgt,
Branding and
Implement.
of Regional
Health and
Social
Development
Shared
Services model
(80%)
Assess and
Address
Regional Health
and Social
Development
Implement.
Gaps
(100%)
HSD
Sport, Art and
Culture
Year 1 Budget Year 2 Budget Year 3 Budget Year 4 Budget Year 5 Budget
Opex Opex Opex Opex Opex
Randwest
Health and
Social
Development
Shared
Services Model
developed and
implemented
_ _ _ _
Year 1 Budget Year 2 Budget Year 3 Budget Year 4 Budget Year 5 Budget
Opex R - R - R - R -
100% of Health
and Social
Development
Shared
Services
Strategy ,
Framework
and Plan
_ _ _ _
HSD
Sport, Art and
Culture
Year 1 Budget Year 2 Budget Year 3 Budget Year 4 Budget Year 5 Budget Opex R - R - R - R -
Outcome 2
Regional Health and
Social Development
Shared Services
Model
Percentage
Development and
Implementation of
Regional Health and
Social Development
Shared Services
Model
Outcome 3
Social cohesion
promoted through
'unity in diversity'
events
HSD
Sport, Art and
Culture
Output 1.5
Implement a Tariffs
Model within the
WRDM for the
Health Department
1.1.5. percentage
progress on the
implementation
Tariffs Model within
WRDM
HSD
Sport, Art and
Culture
Output 2.2
Regional Health
and Social
Development
Shared Services
Strategy,
Framework, and
Plan
% Completion of
Health and Social
Development Shared
Services Strategy,
Framework and Plan
Output
2.1
Embedding of
Randwest Health
and Social
Development
Shared Services
Model
Number of
Randwest Health and
Social Development
Shared Services
Model developed and
implementedHSD
Sport, Art and
Culture
2.2. Number of
people reached on
HIV and Aids
education
HSD
Sport, Art and
Culture
Outcome 2
Improved
community
knowledge on
healthy living
practices
2.1. Percentage of
house holds in
disadvantaged areas
reached within the
region through
Health Promotion
programmes
Number of 'unity in
diversity' events
promoting social
cohesion within the
West Rand
HSD
Sport, Art and
Culture
Output 3.1
Ensure Promotion
of Social Cohesion
through Sports,
Arts & Culture
No. of Sports, Arts &
Culture events
organised
HSD
Sport, Art and
Culture
Output 2.1
Ensure that the
Health Promotion
and Community
Empowerment
Programmes
(sessions) are
Implemented
Number of Health
Promotion and
Community
Empowerment
Programmes
Implemented
HSD
Sport, Art and
Culture
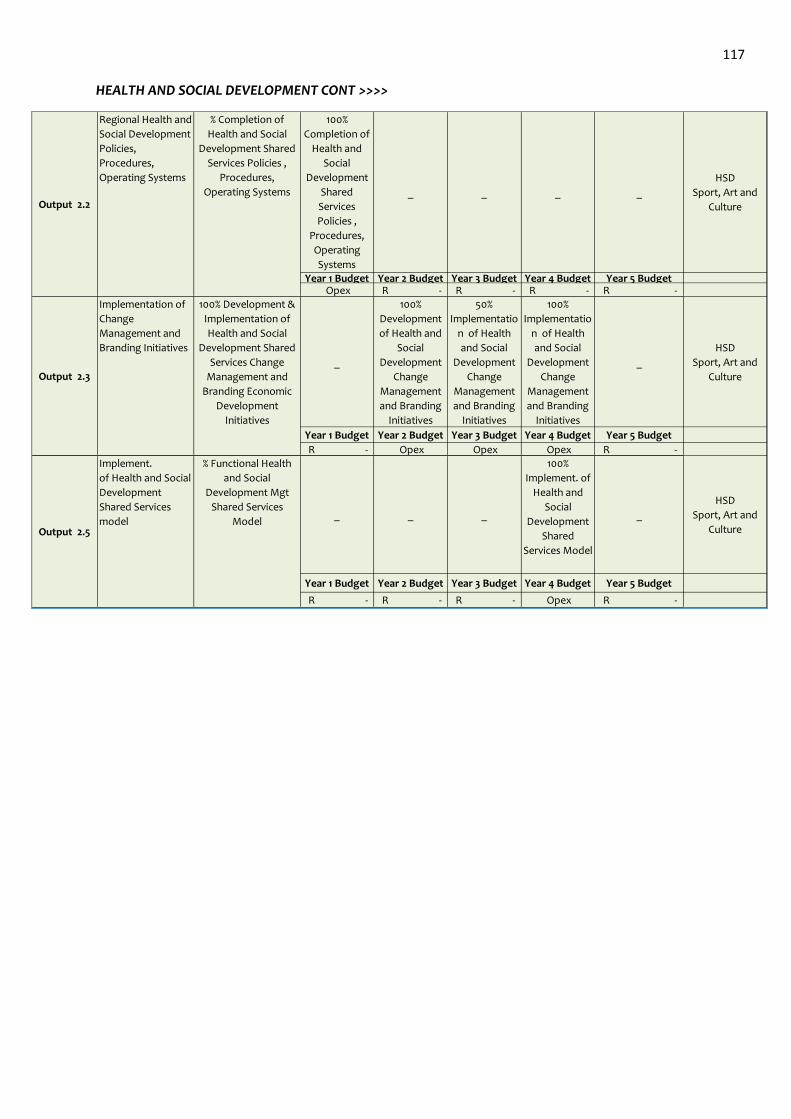
117
HEALTH AND SOCIAL DEVELOPMENT CONT >>>>
100%
Completion of
Health and
Social
Development
Shared
Services
Policies ,
Procedures,
Operating
Systems
_ _ _ _
HSD
Sport, Art and
Culture
Year 1 Budget Year 2 Budget Year 3 Budget Year 4 Budget Year 5 Budget Opex R - R - R - R -
_
100%
Development
of Health and
Social
Development
Change
Management
and Branding
Initiatives
50%
Implementatio
n of Health
and Social
Development
Change
Management
and Branding
Initiatives
100%
Implementatio
n of Health
and Social
Development
Change
Management
and Branding
Initiatives
_
HSD
Sport, Art and
Culture
Year 1 Budget Year 2 Budget Year 3 Budget Year 4 Budget Year 5 Budget
R - Opex Opex Opex R -
_ _ _
100%
Implement. of
Health and
Social
Development
Shared
Services Model
_
HSD
Sport, Art and
Culture
Year 1 Budget Year 2 Budget Year 3 Budget Year 4 Budget Year 5 Budget
R - R - R - Opex R -
Output 2.5
Implement.
of Health and Social
Development
Shared Services
model
% Functional Health
and Social
Development Mgt
Shared Services
Model
Output 2.2
Regional Health and
Social Development
Policies,
Procedures,
Operating Systems
% Completion of
Health and Social
Development Shared
Services Policies ,
Procedures,
Operating Systems
Output 2.3
Implementation of
Change
Management and
Branding Initiatives
100% Development &
Implementation of
Health and Social
Development Shared
Services Change
Management and
Branding Economic
Development
Initiatives
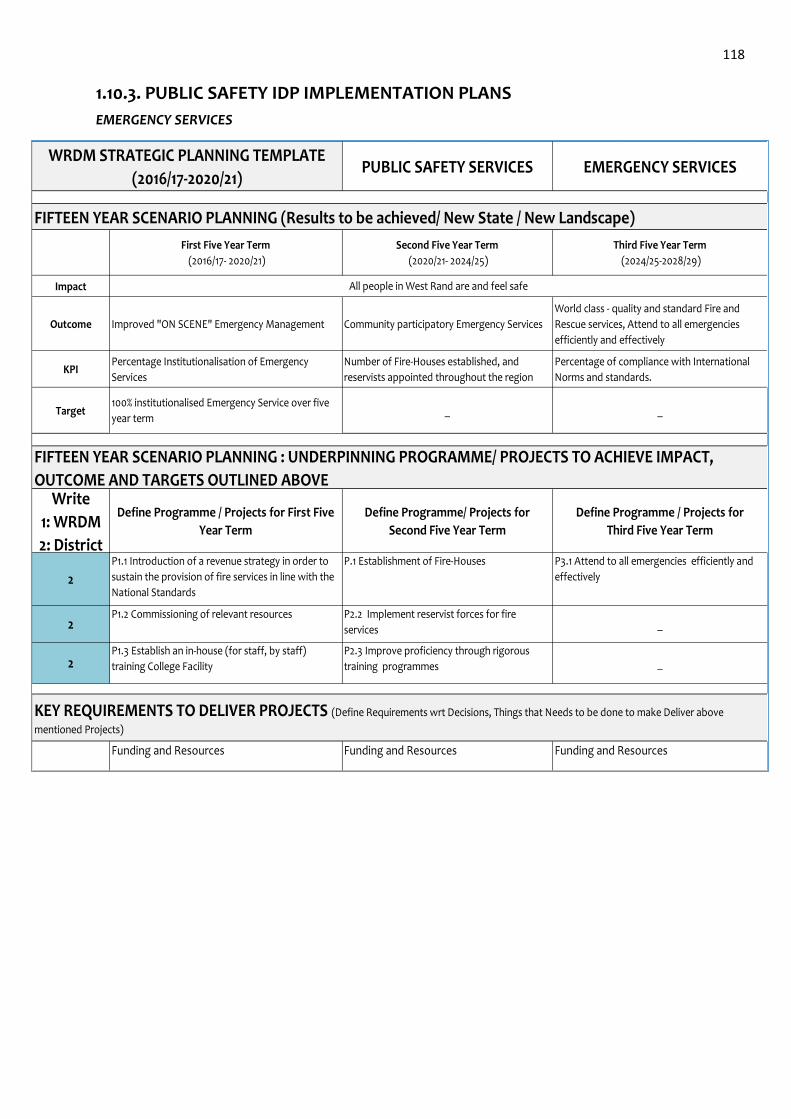
118
1.10.3. PUBLIC SAFETY IDP IMPLEMENTATION PLANS
EMERGENCY SERVICES
FIFTEEN YEAR SCENARIO PLANNING (Results to be achieved/ New State / New Landscape)
Impact
Outcome
KPI
Target
Write
1: WRDM
2: District
2
2
2
Funding and Resources Funding and Resources Funding and Resources
P1.3 Establish an in-house (for staff, by staff)
training College Facility
P2.3 Improve proficiency through rigorous
training programmes _
KEY REQUIREMENTS TO DELIVER PROJECTS (Define Requirements wrt Decisions, Things that Needs to be done to make Deliver above
mentioned Projects)
P1.1 Introduction of a revenue strategy in order to
sustain the provision of fire services in line with the
National Standards
P.1 Establishment of Fire-Houses P3.1 Attend to all emergencies efficiently and
effectively
P1.2 Commissioning of relevant resources P2.2 Implement reservist forces for fire
services _
100% institutionalised Emergency Service over five
year term_ _
Define Programme / Projects for First Five
Year Term
Define Programme/ Projects for
Second Five Year Term
Define Programme / Projects for
Third Five Year Term
FIFTEEN YEAR SCENARIO PLANNING : UNDERPINNING PROGRAMME/ PROJECTS TO ACHIEVE IMPACT,
OUTCOME AND TARGETS OUTLINED ABOVE
Percentage Institutionalisation of Emergency
Services
Number of Fire-Houses established, and
reservists appointed throughout the region
Percentage of compliance with International
Norms and standards.
WRDM STRATEGIC PLANNING TEMPLATE
(2016/17-2020/21)PUBLIC SAFETY SERVICES EMERGENCY SERVICES
First Five Year Term
(2016/17- 2020/21)
Second Five Year Term
(2020/21- 2024/25)
Third Five Year Term
(2024/25-2028/29)
Improved "ON SCENE" Emergency Management Community participatory Emergency Services
World class - quality and standard Fire and
Rescue services, Attend to all emergencies
efficiently and effectively
All people in West Rand are and feel safe
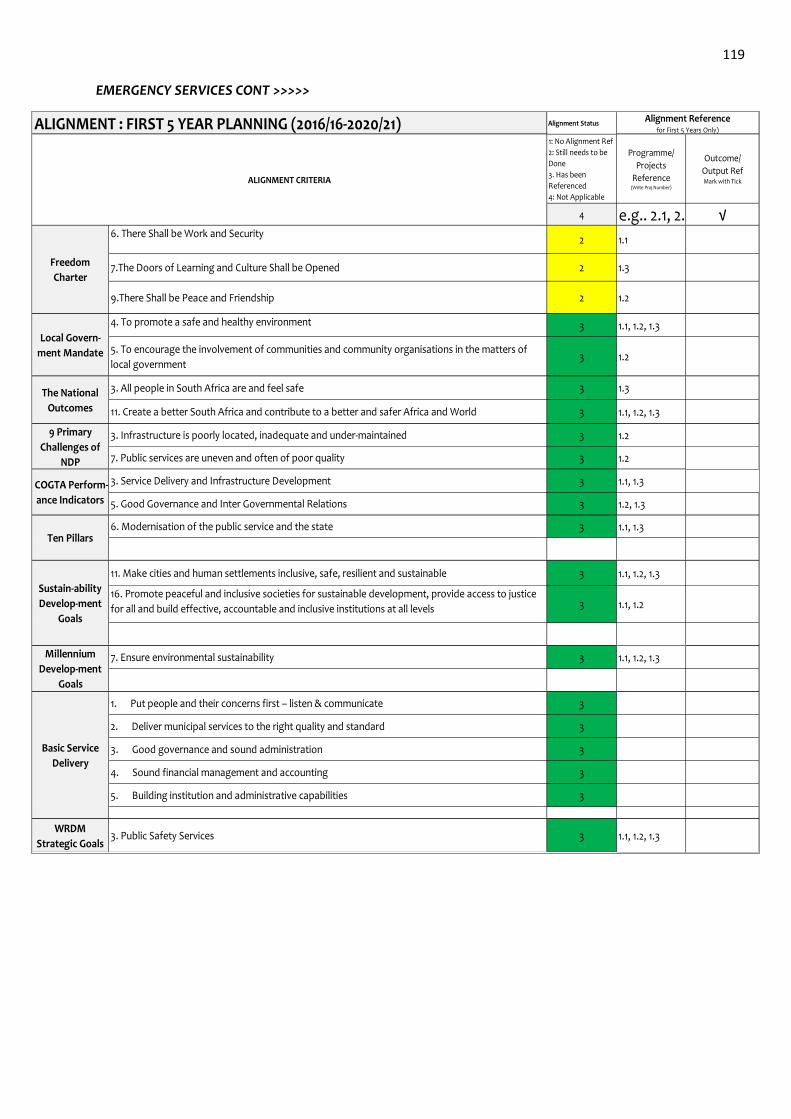
119
EMERGENCY SERVICES CONT >>>>>
ALIGNMENT : FIRST 5 YEAR PLANNING (2016/16-2020/21) Alignment Status
1: No Alignment Ref
2: Still needs to be
Done
3. Has been
Referenced
4: Not Applicable
Programme/
Projects
Reference(Write Proj Number)
Outcome/
Output RefMark with Tick
4 e.g.. 2.1, 2.8 √
2 1.1
2 1.3
2 1.2
3 1.1, 1.2, 1.3
3 1.2
3 1.3
3 1.1, 1.2, 1.3
3 1.2
3 1.2
3 1.1, 1.3
3 1.2, 1.3
3 1.1, 1.3
3 1.1, 1.2, 1.3
3 1.1, 1.2
3 1.1, 1.2, 1.3
3
3
3
3
3
WRDM
Strategic Goals3 1.1, 1.2, 1.33. Public Safety Services
Millennium
Develop-ment
Goals
7. Ensure environmental sustainability
Sustain-ability
Develop-ment
Goals
11. Make cities and human settlements inclusive, safe, resilient and sustainable
16. Promote peaceful and inclusive societies for sustainable development, provide access to justice
for all and build effective, accountable and inclusive institutions at all levels
Ten Pillars6. Modernisation of the public service and the state
COGTA Perform-
ance Indicators
3. Service Delivery and Infrastructure Development
5. Good Governance and Inter Governmental Relations
9 Primary
Challenges of
NDP
3. Infrastructure is poorly located, inadequate and under-maintained
7. Public services are uneven and often of poor quality
The National
Outcomes
3. All people in South Africa are and feel safe
11. Create a better South Africa and contribute to a better and safer Africa and World
Local Govern-
ment Mandate
4. To promote a safe and healthy environment
5. To encourage the involvement of communities and community organisations in the matters of
local government
Alignment Referencefor First 5 Years Only)
ALIGNMENT CRITERIA
Freedom
Charter
6. There Shall be Work and Security
7.The Doors of Learning and Culture Shall be Opened
9.There Shall be Peace and Friendship
Basic Service
Delivery
1. Put people and their concerns first – listen & communicate
2. Deliver municipal services to the right quality and standard
3. Good governance and sound administration
4. Sound financial management and accounting
5. Building institution and administrative capabilities
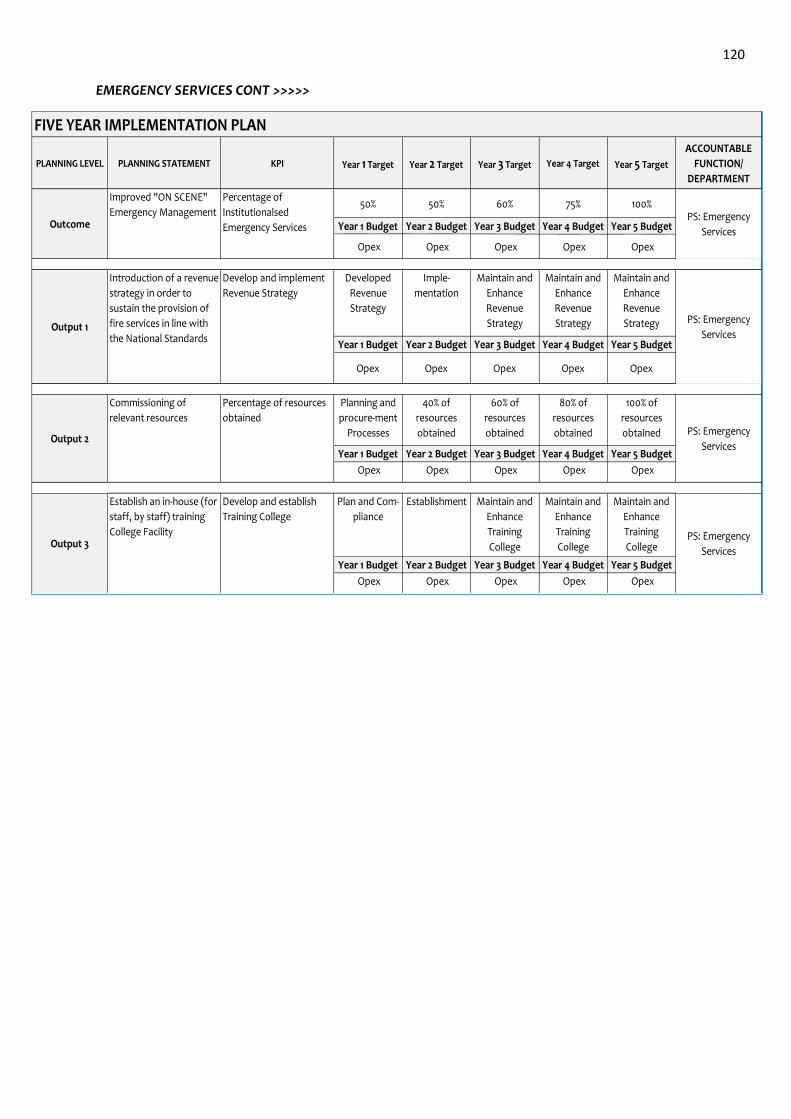
120
EMERGENCY SERVICES CONT >>>>>
PLANNING LEVEL PLANNING STATEMENT KPI Year 1 Target Year 2 Target Year 3 Target Year 4 Target Year 5 Target
ACCOUNTABLE
FUNCTION/
DEPARTMENT
50% 50% 60% 75% 100%
Year 1 Budget Year 2 Budget Year 3 Budget Year 4 Budget Year 5 Budget
Opex Opex Opex Opex Opex
Developed
Revenue
Strategy
Imple-
mentation
Maintain and
Enhance
Revenue
Strategy
Maintain and
Enhance
Revenue
Strategy
Maintain and
Enhance
Revenue
Strategy
Year 1 Budget Year 2 Budget Year 3 Budget Year 4 Budget Year 5 Budget
Opex Opex Opex Opex Opex
Planning and
procure-ment
Processes
40% of
resources
obtained
60% of
resources
obtained
80% of
resources
obtained
100% of
resources
obtained
Year 1 Budget Year 2 Budget Year 3 Budget Year 4 Budget Year 5 Budget
Opex Opex Opex Opex Opex
Plan and Com-
pliance
Establishment Maintain and
Enhance
Training
College
Maintain and
Enhance
Training
College
Maintain and
Enhance
Training
College
Year 1 Budget Year 2 Budget Year 3 Budget Year 4 Budget Year 5 Budget
Opex Opex Opex Opex Opex
Output 2
Commissioning of
relevant resources
Percentage of resources
obtainedPS: Emergency
Services
Output 3
Establish an in-house (for
staff, by staff) training
College Facility
Develop and establish
Training College
PS: Emergency
Services
Output 1
Introduction of a revenue
strategy in order to
sustain the provision of
fire services in line with
the National Standards
Develop and implement
Revenue Strategy
Outcome
Improved "ON SCENE"
Emergency Management
Percentage of
Institutionalsed
Emergency Services
FIVE YEAR IMPLEMENTATION PLAN
PS: Emergency
Services
PS: Emergency
Services
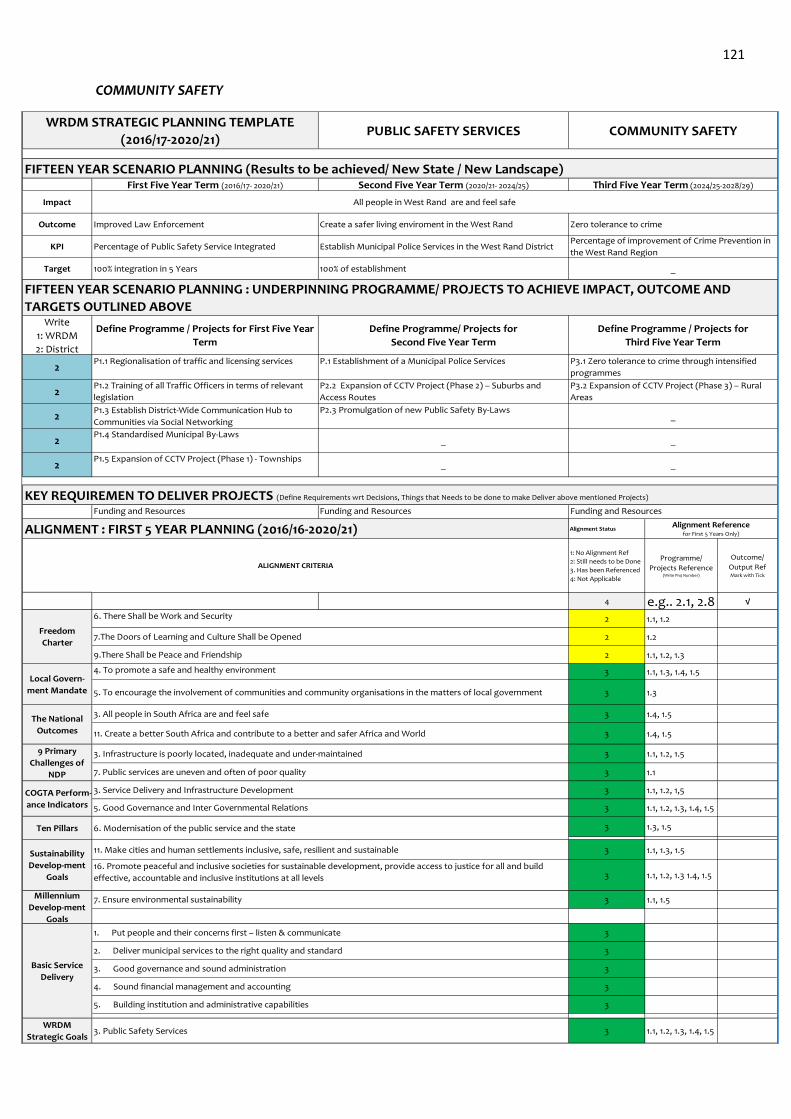
121
COMMUNITY SAFETY
FIFTEEN YEAR SCENARIO PLANNING (Results to be achieved/ New State / New Landscape)
Impact
Outcome
KPI
Target
Write
1: WRDM
2: District
2
2
2
2
2
KEY REQUIREMEN TO DELIVER PROJECTS (Define Requirements wrt Decisions, Things that Needs to be done to make Deliver above mentioned Projects)
ALIGNMENT : FIRST 5 YEAR PLANNING (2016/16-2020/21) Alignment Status
1: No Alignment Ref
2: Still needs to be Done
3. Has been Referenced
4: Not Applicable
Programme/
Projects Reference(Write Proj Number)
Outcome/
Output RefMark with Tick
4 e.g.. 2.1, 2.8 √
2 1.1, 1.2
2 1.2
2 1.1, 1.2, 1.3
3 1.1, 1.3, 1.4, 1.5
3 1.3
3 1.4, 1.5
3 1.4, 1.5
3 1.1, 1.2, 1.5
3 1.1
3 1.1, 1.2, 1,5
3 1.1, 1.2, 1.3, 1.4, 1.5
3 1.3, 1.5
3 1.1, 1.3, 1.5
3 1.1, 1.2, 1.3 1.4, 1.5
3 1.1, 1.5
3
3
3
3
3
WRDM
Strategic Goals3 1.1, 1.2, 1.3, 1.4, 1.5
FIFTEEN YEAR SCENARIO PLANNING : UNDERPINNING PROGRAMME/ PROJECTS TO ACHIEVE IMPACT, OUTCOME AND
TARGETS OUTLINED ABOVE
_
_
Ten Pillars 6. Modernisation of the public service and the state
COGTA Perform-
ance Indicators
100% of establishment
3. Public Safety Services
Millennium
Develop-ment
Goals
7. Ensure environmental sustainability
Basic Service
Delivery
1. Put people and their concerns first – listen & communicate
2. Deliver municipal services to the right quality and standard
3. Good governance and sound administration
4. Sound financial management and accounting
5. Building institution and administrative capabilities
Sustainability
Develop-ment
Goals
11. Make cities and human settlements inclusive, safe, resilient and sustainable
16. Promote peaceful and inclusive societies for sustainable development, provide access to justice for all and build
effective, accountable and inclusive institutions at all levels
3. Service Delivery and Infrastructure Development
5. Good Governance and Inter Governmental Relations
9 Primary
Challenges of
NDP
3. Infrastructure is poorly located, inadequate and under-maintained
7. Public services are uneven and often of poor quality
The National
Outcomes
3. All people in South Africa are and feel safe
11. Create a better South Africa and contribute to a better and safer Africa and World
Local Govern-
ment Mandate
4. To promote a safe and healthy environment
5. To encourage the involvement of communities and community organisations in the matters of local government
Alignment Referencefor First 5 Years Only)
Freedom
Charter
6. There Shall be Work and Security
7.The Doors of Learning and Culture Shall be Opened
9.There Shall be Peace and Friendship
ALIGNMENT CRITERIA
All people in West Rand are and feel safe
WRDM STRATEGIC PLANNING TEMPLATE
(2016/17-2020/21)PUBLIC SAFETY SERVICES COMMUNITY SAFETY
First Five Year Term (2016/17- 2020/21) Second Five Year Term (2020/21- 2024/25) Third Five Year Term (2024/25-2028/29)
Improved Law Enforcement Create a safer living enviroment in the West Rand Zero tolerance to crime
100% integration in 5 Years
Establish Municipal Police Services in the West Rand District
_
Define Programme / Projects for First Five Year
Term
Define Programme/ Projects for
Second Five Year Term
Define Programme / Projects for
Third Five Year Term
Percentage of Public Safety Service Integrated
_ _
P1.1 Regionalisation of traffic and licensing services P.1 Establishment of a Municipal Police Services P3.1 Zero tolerance to crime through intensified
programmes
Percentage of improvement of Crime Prevention in
the West Rand Region
P1.3 Establish District-Wide Communication Hub to
Communities via Social Networking
P2.3 Promulgation of new Public Safety By-Laws
P1.4 Standardised Municipal By-Laws
Funding and Resources Funding and Resources Funding and Resources
P1.5 Expansion of CCTV Project (Phase 1) - Townships_
P1.2 Training of all Traffic Officers in terms of relevant
legislation
P2.2 Expansion of CCTV Project (Phase 2) – Suburbs and
Access Routes
P3.2 Expansion of CCTV Project (Phase 3) – Rural
Areas
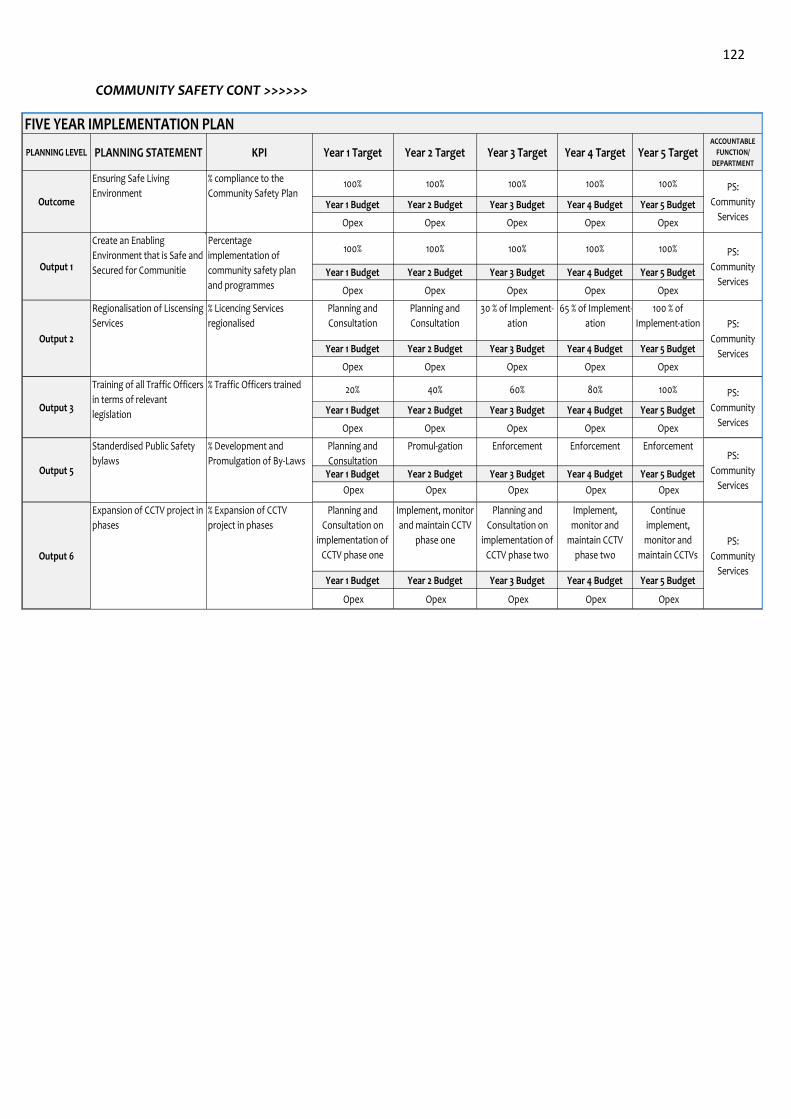
122
COMMUNITY SAFETY CONT >>>>>>
PLANNING LEVEL PLANNING STATEMENT KPI Year 1 Target Year 2 Target Year 3 Target Year 4 Target Year 5 TargetACCOUNTABLE
FUNCTION/
DEPARTMENT
100% 100% 100% 100% 100%
Year 1 Budget Year 2 Budget Year 3 Budget Year 4 Budget Year 5 Budget
Opex Opex Opex Opex Opex
100% 100% 100% 100% 100%
Year 1 Budget Year 2 Budget Year 3 Budget Year 4 Budget Year 5 Budget
Opex Opex Opex Opex Opex
Planning and
Consultation
Planning and
Consultation
30 % of Implement-
ation
65 % of Implement-
ation
100 % of
Implement-ation
Year 1 Budget Year 2 Budget Year 3 Budget Year 4 Budget Year 5 Budget
Opex Opex Opex Opex Opex
20% 40% 60% 80% 100%
Year 1 Budget Year 2 Budget Year 3 Budget Year 4 Budget Year 5 Budget
Opex Opex Opex Opex Opex
Planning and
Consultation
Promul-gation Enforcement Enforcement Enforcement
Year 1 Budget Year 2 Budget Year 3 Budget Year 4 Budget Year 5 Budget
Opex Opex Opex Opex Opex
Planning and
Consultation on
implementation of
CCTV phase one
Implement, monitor
and maintain CCTV
phase one
Planning and
Consultation on
implementation of
CCTV phase two
Implement,
monitor and
maintain CCTV
phase two
Continue
implement,
monitor and
maintain CCTVs
Year 1 Budget Year 2 Budget Year 3 Budget Year 4 Budget Year 5 Budget
Opex Opex Opex Opex Opex
Output 5
Standerdised Public Safety
bylaws
% Development and
Promulgation of By-Laws PS:
Community
Services
Output 6
Expansion of CCTV project in
phases
% Expansion of CCTV
project in phases
PS:
Community
Services
Output 3
Training of all Traffic Officers
in terms of relevant
legislation
% Traffic Officers trainedPS:
Community
Services
Output 1
Create an Enabling
Environment that is Safe and
Secured for Communitie
Percentage
implementation of
community safety plan
and programmes
PS:
Community
Services
Output 2
Regionalisation of Liscensing
Services
% Licencing Services
regionalised PS:
Community
Services
FIVE YEAR IMPLEMENTATION PLAN
Outcome
Ensuring Safe Living
Environment
% compliance to the
Community Safety PlanPS:
Community
Services
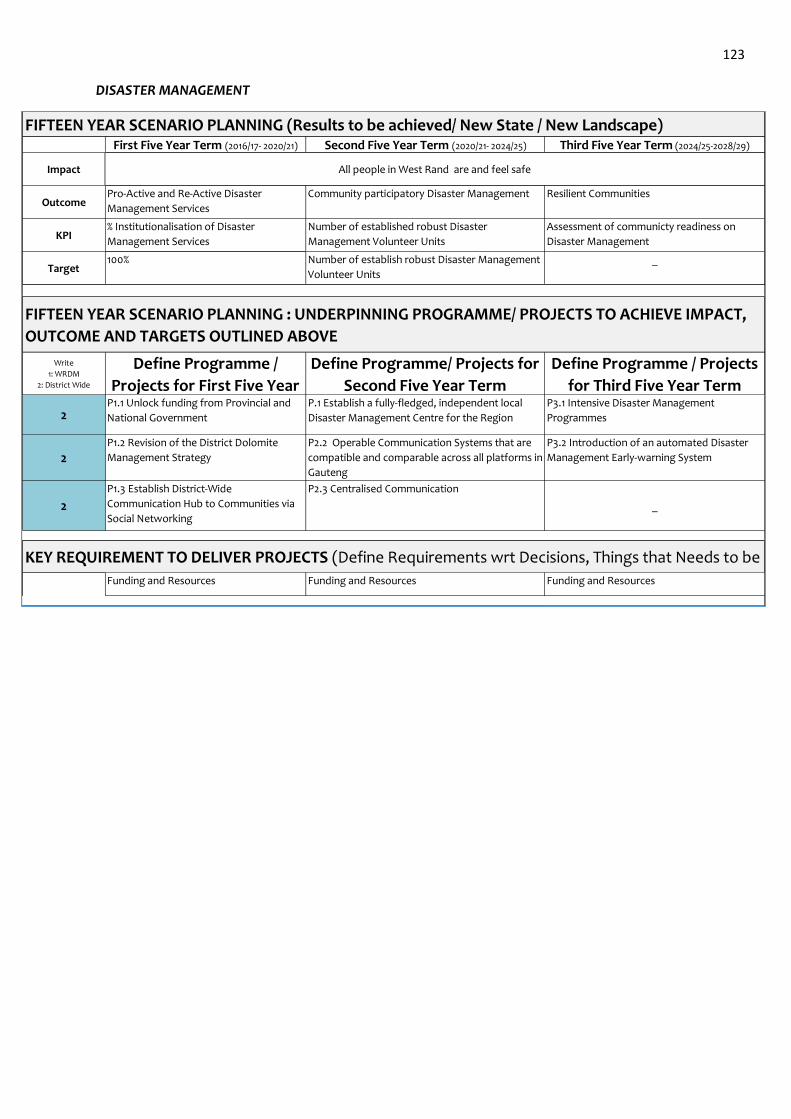
123
DISASTER MANAGEMENT
FIFTEEN YEAR SCENARIO PLANNING (Results to be achieved/ New State / New Landscape)
Impact
Outcome
KPI
Target
Write
1: WRDM
2: District Wide
2
2
2
All people in West Rand are and feel safe
First Five Year Term (2016/17- 2020/21) Second Five Year Term (2020/21- 2024/25) Third Five Year Term (2024/25-2028/29)
100% Number of establish robust Disaster Management
Volunteer Units
_
% Institutionalisation of Disaster
Management Services
Pro-Active and Re-Active Disaster
Management Services
Number of established robust Disaster
Management Volunteer Units
Assessment of communicty readiness on
Disaster Management
Community participatory Disaster Management Resilient Communities
_
P1.1 Unlock funding from Provincial and
National Government
P.1 Establish a fully-fledged, independent local
Disaster Management Centre for the Region
P3.1 Intensive Disaster Management
Programmes
P1.2 Revision of the District Dolomite
Management Strategy
P2.2 Operable Communication Systems that are
compatible and comparable across all platforms in
Gauteng
P3.2 Introduction of an automated Disaster
Management Early-warning System
P1.3 Establish District-Wide
Communication Hub to Communities via
Social Networking
P2.3 Centralised Communication
Define Programme /
Projects for First Five Year
Define Programme/ Projects for
Second Five Year Term
Define Programme / Projects
for Third Five Year Term
FIFTEEN YEAR SCENARIO PLANNING : UNDERPINNING PROGRAMME/ PROJECTS TO ACHIEVE IMPACT,
OUTCOME AND TARGETS OUTLINED ABOVE
KEY REQUIREMENT TO DELIVER PROJECTS (Define Requirements wrt Decisions, Things that Needs to be done to make Deliver above mentioned Projects)
Funding and Resources Funding and Resources Funding and Resources
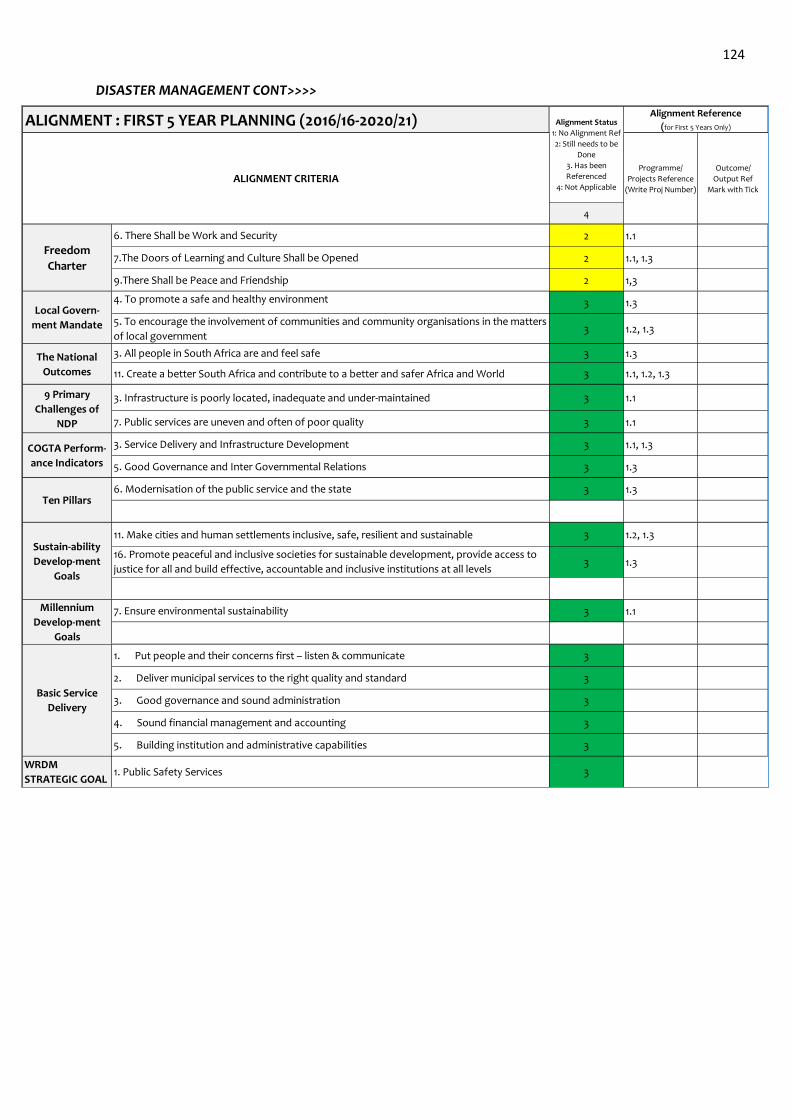
124
DISASTER MANAGEMENT CONT>>>>
ALIGNMENT : FIRST 5 YEAR PLANNING (2016/16-2020/21)
4
2 1.1
2 1.1, 1.3
2 1,3
3 1.3
3 1.2, 1.3
3 1.3
3 1.1, 1.2, 1.3
3 1.1
3 1.1
3 1.1, 1.3
3 1.3
3 1.3
3 1.2, 1.3
3 1.3
3 1.1
3
3
3
3
3
WRDM
STRATEGIC GOAL3
Local Govern-
ment Mandate
4. To promote a safe and healthy environment
5. To encourage the involvement of communities and community organisations in the matters
of local government
Alignment Status
1: No Alignment Ref
2: Still needs to be
Done
3. Has been
Referenced
4: Not Applicable
Alignment Reference
(for First 5 Years Only)
ALIGNMENT CRITERIA
Freedom
Charter7.The Doors of Learning and Culture Shall be Opened
9.There Shall be Peace and Friendship
6. There Shall be Work and Security
Programme/
Projects Reference
(Write Proj Number)
Outcome/
Output Ref
Mark with Tick
9 Primary
Challenges of
NDP
3. Infrastructure is poorly located, inadequate and under-maintained
7. Public services are uneven and often of poor quality
The National
Outcomes
3. All people in South Africa are and feel safe
11. Create a better South Africa and contribute to a better and safer Africa and World
Sustain-ability
Develop-ment
Goals
11. Make cities and human settlements inclusive, safe, resilient and sustainable
16. Promote peaceful and inclusive societies for sustainable development, provide access to
justice for all and build effective, accountable and inclusive institutions at all levels
COGTA Perform-
ance Indicators
3. Service Delivery and Infrastructure Development
5. Good Governance and Inter Governmental Relations
Ten Pillars6. Modernisation of the public service and the state
Millennium
Develop-ment
Goals
7. Ensure environmental sustainability
1. Put people and their concerns first – listen & communicate
2. Deliver municipal services to the right quality and standard
3. Good governance and sound administration
4. Sound financial management and accounting
1. Public Safety Services
Basic Service
Delivery
5. Building institution and administrative capabilities
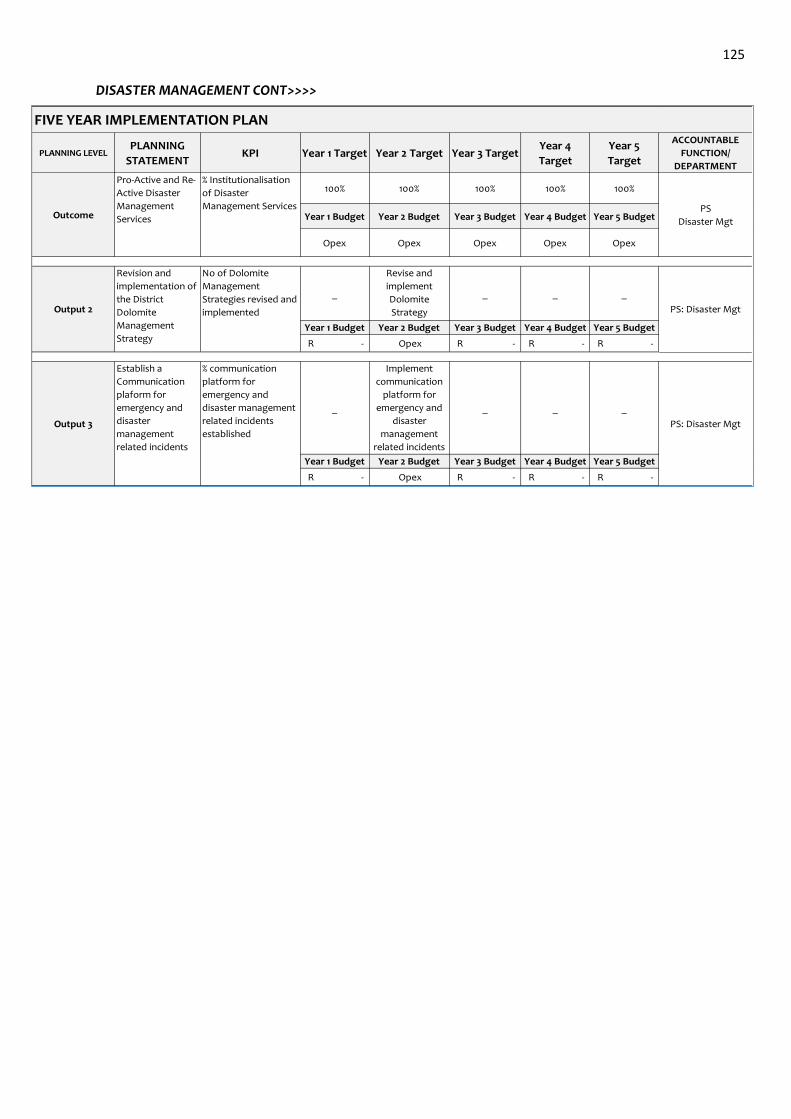
125
DISASTER MANAGEMENT CONT>>>>
PLANNING LEVELPLANNING
STATEMENTKPI Year 1 Target Year 2 Target Year 3 Target
Year 4
Target
Year 5
Target
ACCOUNTABLE
FUNCTION/
DEPARTMENT
100% 100% 100% 100% 100%
Year 1 Budget Year 2 Budget Year 3 Budget Year 4 Budget Year 5 Budget
Opex Opex Opex Opex Opex
_
Revise and
implement
Dolomite
Strategy
_ _ _
Year 1 Budget Year 2 Budget Year 3 Budget Year 4 Budget Year 5 Budget
R - Opex R - R - R -
_
Implement
communication
platform for
emergency and
disaster
management
related incidents
_ _ _
Year 1 Budget Year 2 Budget Year 3 Budget Year 4 Budget Year 5 Budget
R - Opex R - R - R -
PS: Disaster Mgt
FIVE YEAR IMPLEMENTATION PLAN
PS
Disaster MgtOutcome
Pro-Active and Re-
Active Disaster
Management
Services
% Institutionalisation
of Disaster
Management Services
Output 3
Establish a
Communication
plaform for
emergency and
disaster
management
related incidents
% communication
platform for
emergency and
disaster management
related incidents
established
Output 2
Revision and
implementation of
the District
Dolomite
Management
Strategy
No of Dolomite
Management
Strategies revised and
implemented PS: Disaster Mgt
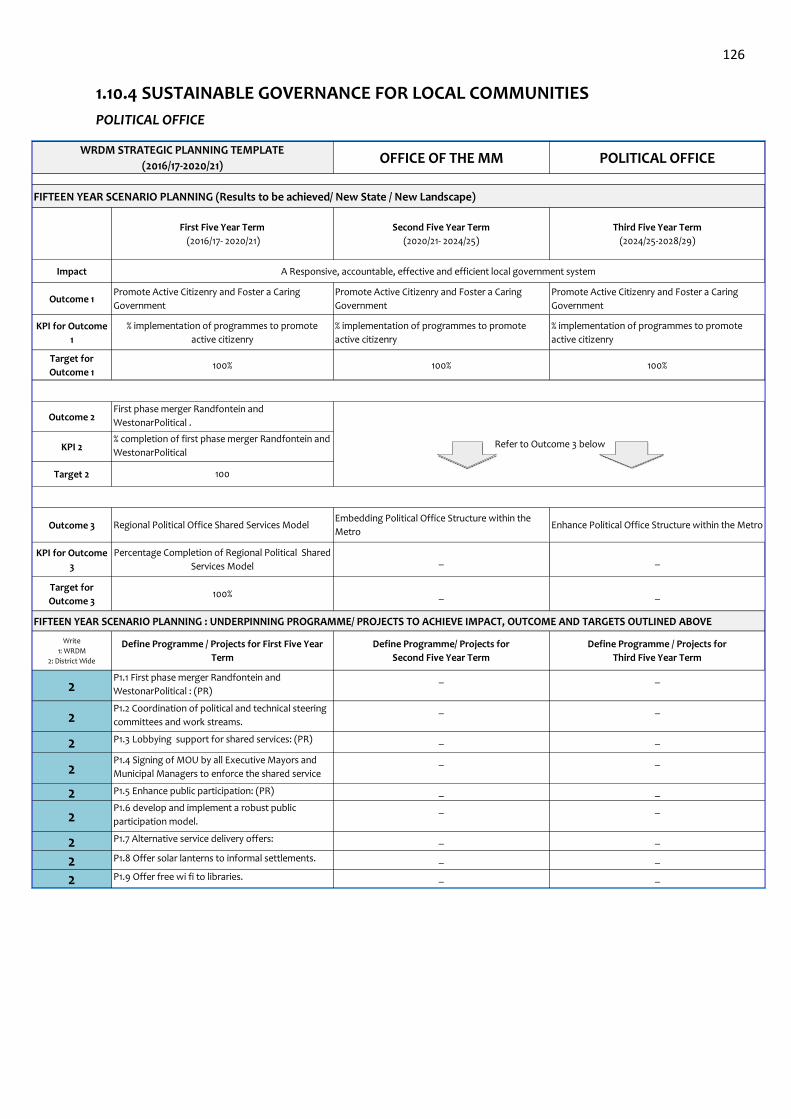
126
1.10.4 SUSTAINABLE GOVERNANCE FOR LOCAL COMMUNITIES
POLITICAL OFFICE
FIFTEEN YEAR SCENARIO PLANNING (Results to be achieved/ New State / New Landscape)
Impact
Outcome 1
KPI for Outcome
1
Target for
Outcome 1
Outcome 2
KPI 2
Target 2
Outcome 3
KPI for Outcome
3
Target for
Outcome 3
FIFTEEN YEAR SCENARIO PLANNING : UNDERPINNING PROGRAMME/ PROJECTS TO ACHIEVE IMPACT, OUTCOME AND TARGETS OUTLINED ABOVE
Write
1: WRDM
2: District Wide
2
2
2
2
2
2
222
P1.8 Offer solar lanterns to informal settlements. _ _
P1.9 Offer free wi fi to libraries. _ _
P1.6 develop and implement a robust public
participation model.
_ _
P1.7 Alternative service delivery offers: _ _
_ _
P1.4 Signing of MOU by all Executive Mayors and
Municipal Managers to enforce the shared service
model.
_ _
P1.5 Enhance public participation: (PR) _ _
P1.2 Coordination of political and technical steering
committees and work streams.
_ _
P1.3 Lobbying support for shared services: (PR) _ _
WRDM STRATEGIC PLANNING TEMPLATE
(2016/17-2020/21)OFFICE OF THE MM POLITICAL OFFICE
First Five Year Term
(2016/17- 2020/21)
Second Five Year Term
(2020/21- 2024/25)
Third Five Year Term
(2024/25-2028/29)
A Responsive, accountable, effective and efficient local government system
Refer to Outcome 3 below
% implementation of programmes to promote
active citizenry
100% 100% 100%
% completion of first phase merger Randfontein and
WestonarPolitical
100
Promote Active Citizenry and Foster a Caring
Government
Promote Active Citizenry and Foster a Caring
Government
Promote Active Citizenry and Foster a Caring
Government
% implementation of programmes to promote
active citizenry
% implementation of programmes to promote
active citizenry
First phase merger Randfontein and
WestonarPolitical .
Define Programme / Projects for First Five Year
Term
Define Programme/ Projects for
Second Five Year Term
Define Programme / Projects for
Third Five Year Term
P1.1 First phase merger Randfontein and
WestonarPolitical : (PR)
_ _
Regional Political Office Shared Services ModelEmbedding Political Office Structure within the
MetroEnhance Political Office Structure within the Metro
Percentage Completion of Regional Political Shared
Services Model_ _
100%
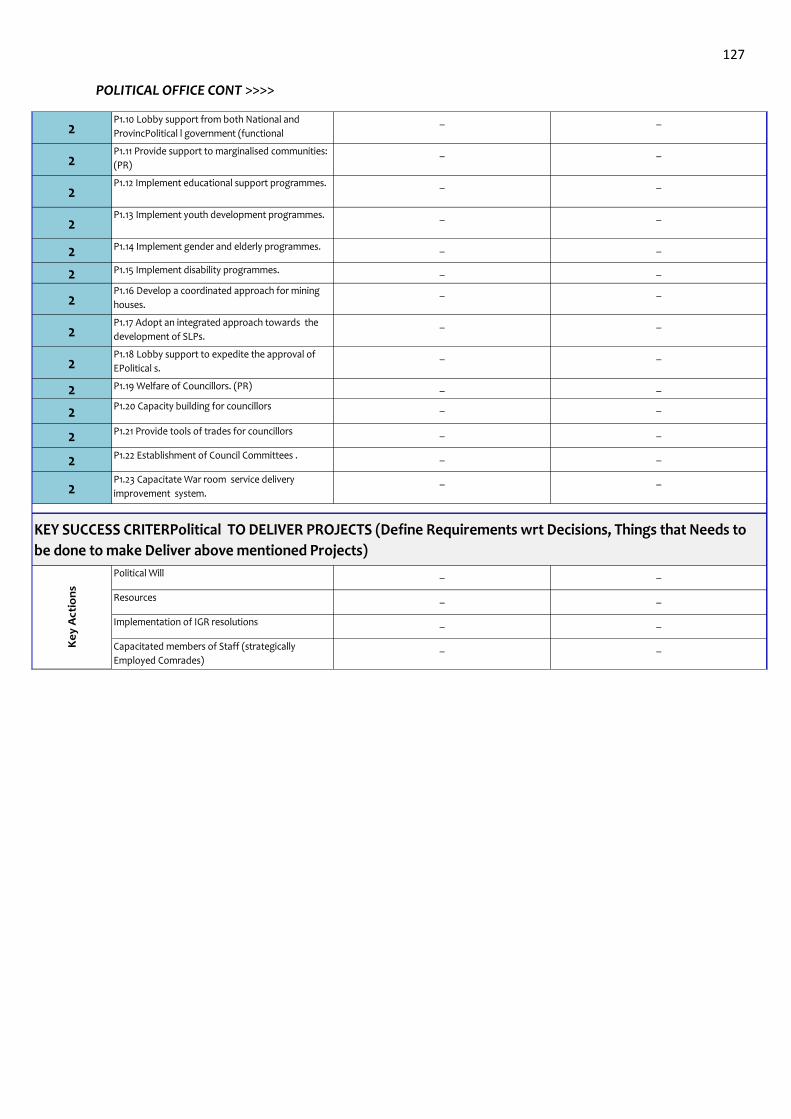
127
POLITICAL OFFICE CONT >>>>
2
2
2
2
2
2
2
2
2
2
2
2
2
2
P1.22 Establishment of Council Committees . _ _
_ _
Implementation of IGR resolutions _ _
Capacitated members of Staff (strategically
Employed Comrades)
_ _
P1.23 Capacitate War room service delivery
improvement system.
_ _
KEY SUCCESS CRITERPolitical TO DELIVER PROJECTS (Define Requirements wrt Decisions, Things that Needs to
be done to make Deliver above mentioned Projects)
Ke
y A
ctio
ns
Political Will _ _
Resources
P1.20 Capacity building for councillors _ _
P1.21 Provide tools of trades for councillors _ _
P1.18 Lobby support to expedite the approval of
EPolitical s.
_ _
P1.19 Welfare of Councillors. (PR) _ _
P1.16 Develop a coordinated approach for mining
houses.
_ _
P1.17 Adopt an integrated approach towards the
development of SLPs.
_ _
P1.14 Implement gender and elderly programmes. _ _
P1.15 Implement disability programmes. _ _
P1.12 Implement educational support programmes. _ _
P1.13 Implement youth development programmes. _ _
P1.10 Lobby support from both National and
ProvincPolitical l government (functional
arrangement and fiscal base) for achievement of
_ _
P1.11 Provide support to marginalised communities:
(PR)
_ _
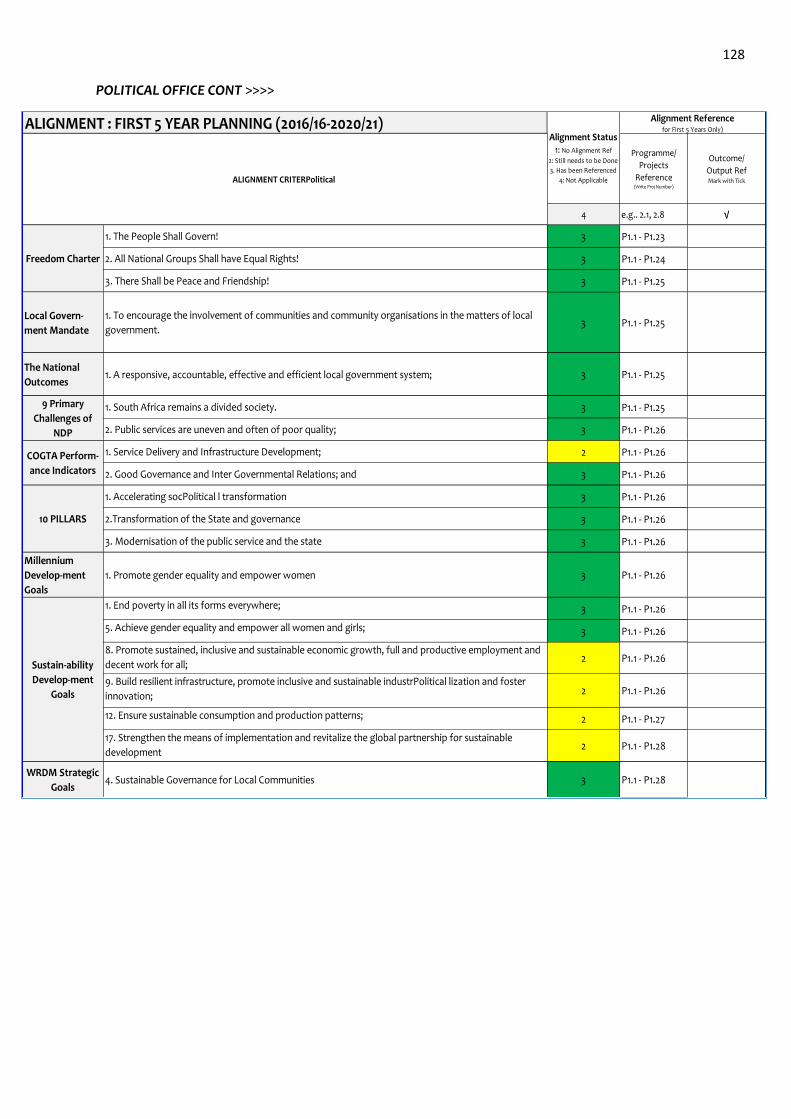
128
POLITICAL OFFICE CONT >>>>
ALIGNMENT : FIRST 5 YEAR PLANNING (2016/16-2020/21)
Programme/
Projects
Reference(Write Proj Number)
Outcome/
Output RefMark with Tick
4 e.g.. 2.1, 2.8 √
3 P1.1 - P1.23
3 P1.1 - P1.24
3 P1.1 - P1.25
Local Govern-
ment Mandate3 P1.1 - P1.25
The National
Outcomes3 P1.1 - P1.25
3 P1.1 - P1.25
3 P1.1 - P1.26
2 P1.1 - P1.26
3 P1.1 - P1.26
3 P1.1 - P1.26
3 P1.1 - P1.26
3 P1.1 - P1.26
Millennium
Develop-ment
Goals
3 P1.1 - P1.26
3 P1.1 - P1.26
3 P1.1 - P1.26
2 P1.1 - P1.26
2 P1.1 - P1.26
2 P1.1 - P1.27
2 P1.1 - P1.28
WRDM Strategic
Goals3 P1.1 - P1.28
1. South Africa remains a divided society.
2. Public services are uneven and often of poor quality;
1. A responsive, accountable, effective and efficient local government system;
1. To encourage the involvement of communities and community organisations in the matters of local
government.
Alignment Status1: No Alignment Ref
2: Still needs to be Done
3. Has been Referenced
4: Not Applicable
Alignment Referencefor First 5 Years Only)
ALIGNMENT CRITERPolitical
4. Sustainable Governance for Local Communities
Freedom Charter
5. Achieve gender equality and empower all women and girls;
1. Service Delivery and Infrastructure Development;
2. Good Governance and Inter Governmental Relations; and
1. Promote gender equality and empower women
1. Accelerating socPolitical l transformation
2.Transformation of the State and governance
3. Modernisation of the public service and the state
1. End poverty in all its forms everywhere;
9. Build resilient infrastructure, promote inclusive and sustainable industrPolitical lization and foster
innovation;
12. Ensure sustainable consumption and production patterns;
17. Strengthen the means of implementation and revitalize the global partnership for sustainable
development
8. Promote sustained, inclusive and sustainable economic growth, full and productive employment and
decent work for all;
1. The People Shall Govern!
2. All National Groups Shall have Equal Rights!
3. There Shall be Peace and Friendship!
9 Primary
Challenges of
NDP
COGTA Perform-
ance Indicators
10 PILLARS
Sustain-ability
Develop-ment
Goals
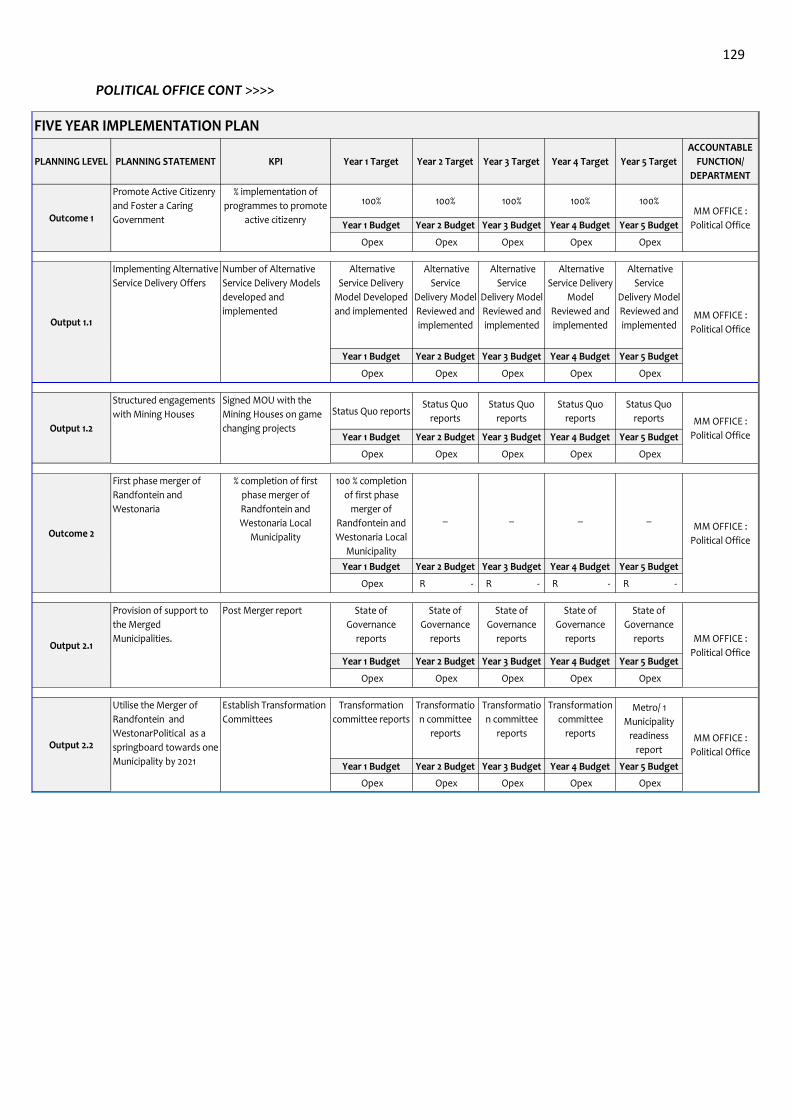
129
POLITICAL OFFICE CONT >>>>
PLANNING LEVEL PLANNING STATEMENT KPI Year 1 Target Year 2 Target Year 3 Target Year 4 Target Year 5 Target
ACCOUNTABLE
FUNCTION/
DEPARTMENT
100% 100% 100% 100% 100%
Year 1 Budget Year 2 Budget Year 3 Budget Year 4 Budget Year 5 Budget
Opex Opex Opex Opex Opex
Alternative
Service Delivery
Model Developed
and implemented
Alternative
Service
Delivery Model
Reviewed and
implemented
Alternative
Service
Delivery Model
Reviewed and
implemented
Alternative
Service Delivery
Model
Reviewed and
implemented
Alternative
Service
Delivery Model
Reviewed and
implemented
Year 1 Budget Year 2 Budget Year 3 Budget Year 4 Budget Year 5 Budget
Opex Opex Opex Opex Opex
Status Quo reportsStatus Quo
reports
Status Quo
reports
Status Quo
reports
Status Quo
reports
Year 1 Budget Year 2 Budget Year 3 Budget Year 4 Budget Year 5 Budget
Opex Opex Opex Opex Opex
100 % completion
of first phase
merger of
Randfontein and
Westonaria Local
Municipality
_ _ _ _
Year 1 Budget Year 2 Budget Year 3 Budget Year 4 Budget Year 5 Budget
Opex R - R - R - R -
State of
Governance
reports
State of
Governance
reports
State of
Governance
reports
State of
Governance
reports
State of
Governance
reports
Year 1 Budget Year 2 Budget Year 3 Budget Year 4 Budget Year 5 Budget
Opex Opex Opex Opex Opex
Transformation
committee reports
Transformatio
n committee
reports
Transformatio
n committee
reports
Transformation
committee
reports
Metro/ 1
Municipality
readiness
report
Year 1 Budget Year 2 Budget Year 3 Budget Year 4 Budget Year 5 Budget
Opex Opex Opex Opex Opex
Outcome 1
FIVE YEAR IMPLEMENTATION PLAN
Output 2.2
Utilise the Merger of
Randfontein and
WestonarPolitical as a
springboard towards one
Municipality by 2021
Establish Transformation
Committees
MM OFFICE :
Political Office
Output 1.2
Structured engagements
with Mining Houses
Signed MOU with the
Mining Houses on game
changing projectsMM OFFICE :
Political Office
Output 1.1
Implementing Alternative
Service Delivery Offers
Number of Alternative
Service Delivery Models
developed and
implemented MM OFFICE :
Political Office
Output 2.1
Provision of support to
the Merged
Municipalities.
Post Merger report
MM OFFICE :
Political Office
Outcome 2
Promote Active Citizenry
and Foster a Caring
Government
First phase merger of
Randfontein and
Westonaria
% completion of first
phase merger of
Randfontein and
Westonaria Local
MunicipalityMM OFFICE :
Political Office
% implementation of
programmes to promote
active citizenry MM OFFICE :
Political Office

130
POLITICAL OFFICE CONT >>>>
PLANNING LEVELPLANNING
STATEMENTKPI
Year 1
Target
Year 2
Target
Year 3
Target
Year 4
Target
Year 5
Target
ACCOUNTABLE
FUNCTION/
DEPARTMENT
Develop Regional
Political Shared
Services Strategy,
Framework, and
Plan
(10%)
Develop
Regional
Political
Policies,
Procedures,
Operating
Systems
(30%)
Change Mgt,
Branding and
Resource
Planning
(60%)
Change Mgt,
Branding and
Implement.
of Political
Shared Services
model
(80%)
Assess and
Address
Political
Management
Political
Implement.
Gaps
(100%)
Year 1 Budget Year 2 Budget Year 3 Budget Year 4 Budget Year 5 Budget
Opex Opex Opex Opex Opex
Rand West
Political Shared
Services Model
developed and
implemented
_ _ _ _
Year 1 Budget Year 2 Budget Year 3 Budget Year 4 Budget Year 5 Budget
Opex R - R - R - R -
100% of Political
Shared Services
Strategy ,
Framework and
Plan
_ _ _ _
Year 1 Budget Year 2 Budget Year 3 Budget Year 4 Budget Year 5 Budget
Opex R - R - R - R -
100% Completion
of Political Shared
Services Policies ,
Procedures,
Operating Systems
_ _ _ _
Year 1 Budget Year 2 Budget Year 3 Budget Year 4 Budget Year 5 Budget
Opex R - R - R - R -
_
100%
Development
Change
Mangement
and Branding
Political
initiatives
50%
Implementatio
n of Change
Mangement
and Branding
Political
initiatives
100%
Implementation
of Change
Mangement
and Branding
Political
initiatives
_
Year 1 Budget Year 2 Budget Year 3 Budget Year 4 Budget Year 5 Budget
R - Opex Opex Opex R -
_ _ _
100%
Implement. of
Political Shared
Services Model
Identify and
Addres
Political Mgt
Implement.
Gaps
Year 1 Budget Year 2 Budget Year 3 Budget Year 4 Budget Year 5 Budget
R - R - R - Opex Opex
Output 2.5
Implement.
of Political Shared
Services model
% Functional Political
Mgt Shared Services
Model
MM Office
Political
Output 2.2
Regional Political
Policies, Procedures,
Operating Systems
100% Completion of
Political Shared Services
Policies , Procedures,
Operating SystemsMM Office
Political
Output 2.3
Implementation of
Change Management
and Branding Political
initiatives
100% Development &
Implementation of
Political Shared Services
Change Mangement and
Branding Political
initiatives
MM Office
Political
Outcome 2 Political Shared Services
Model
% Development and
Implementation of
Political Shared Services
Model
MM Office
Political
Output
2.1
Embedding of Randwest
Political Shared Services
Model
Number of Rand West
Political Shared Services
Model developed and
implemented MM Office
Political
Output 2.2
Regional Political
Shared Services Strategy,
Framework, and Plan
100% Completion of
Political Shared Services
Strategy, Framework and
PlanMM Office
Political
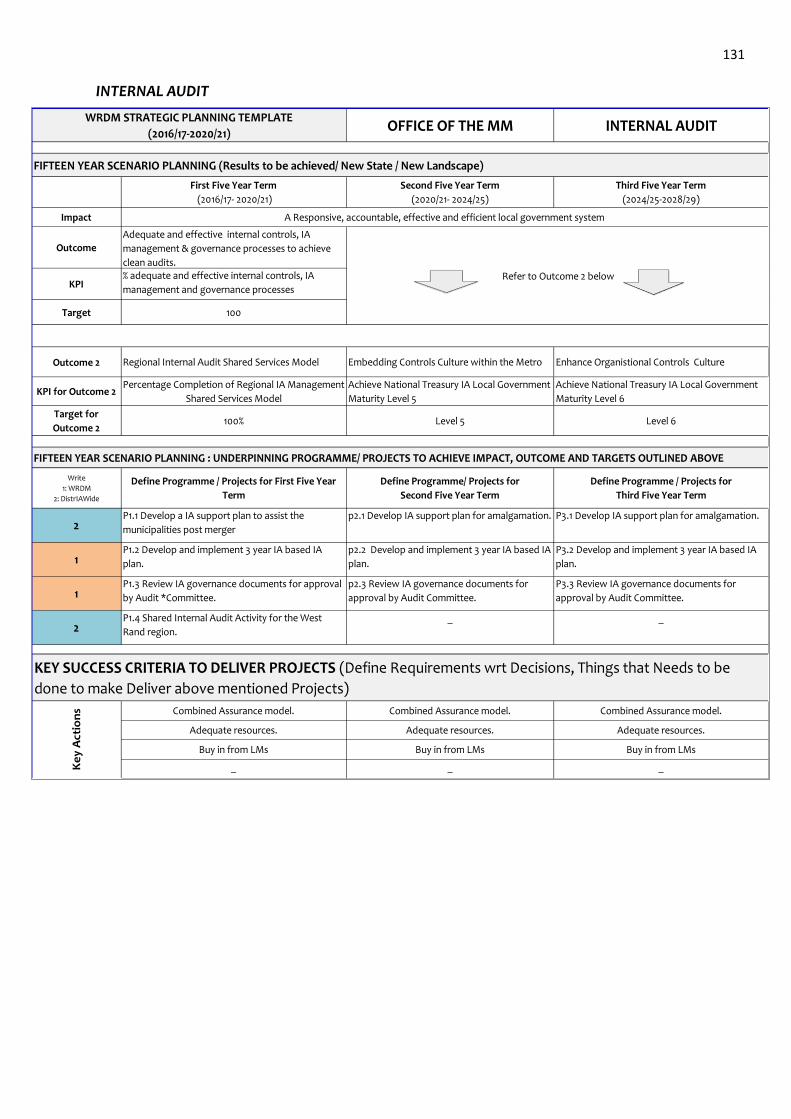
131
INTERNAL AUDIT
FIFTEEN YEAR SCENARIO PLANNING (Results to be achieved/ New State / New Landscape)
Impact
Outcome
KPI
Target
Outcome 2
KPI for Outcome 2
Target for
Outcome 2
FIFTEEN YEAR SCENARIO PLANNING : UNDERPINNING PROGRAMME/ PROJECTS TO ACHIEVE IMPACT, OUTCOME AND TARGETS OUTLINED ABOVE
Write
1: WRDM
2: DistrIAWide
2
1
1
2
Adequate resources. Adequate resources.
Buy in from LMs Buy in from LMs Buy in from LMs
_ _ _
KEY SUCCESS CRITERIA TO DELIVER PROJECTS (Define Requirements wrt Decisions, Things that Needs to be
done to make Deliver above mentioned Projects)
Ke
y A
ctio
ns Combined Assurance model. Combined Assurance model. Combined Assurance model.
Adequate resources.
Achieve National Treasury IA Local Government
Maturity Level 5
Achieve National Treasury IA Local Government
Maturity Level 6
100% Level 5 Level 6
P1.4 Shared Internal Audit Activity for the West
Rand region.
_ _
P1.2 Develop and implement 3 year IA based IA
plan.
p2.2 Develop and implement 3 year IA based IA
plan.
P3.2 Develop and implement 3 year IA based IA
plan.
P1.3 Review IA governance documents for approval
by Audit *Committee.
p2.3 Review IA governance documents for
approval by Audit Committee.
P3.3 Review IA governance documents for
approval by Audit Committee.
Adequate and effective internal controls, IA
management & governance processes to achieve
clean audits.
WRDM STRATEGIC PLANNING TEMPLATE
(2016/17-2020/21)OFFICE OF THE MM INTERNAL AUDIT
First Five Year Term
(2016/17- 2020/21)
Second Five Year Term
(2020/21- 2024/25)
Third Five Year Term
(2024/25-2028/29)
A Responsive, accountable, effective and efficient local government system
Refer to Outcome 2 below
Define Programme / Projects for First Five Year
Term
Define Programme/ Projects for
Second Five Year Term
Define Programme / Projects for
Third Five Year Term
P1.1 Develop a IA support plan to assist the
municipalities post merger
p2.1 Develop IA support plan for amalgamation. P3.1 Develop IA support plan for amalgamation.
% adequate and effective internal controls, IA
management and governance processes
100
Regional Internal Audit Shared Services Model Embedding Controls Culture within the Metro Enhance Organistional Controls Culture
Percentage Completion of Regional IA Management
Shared Services Model
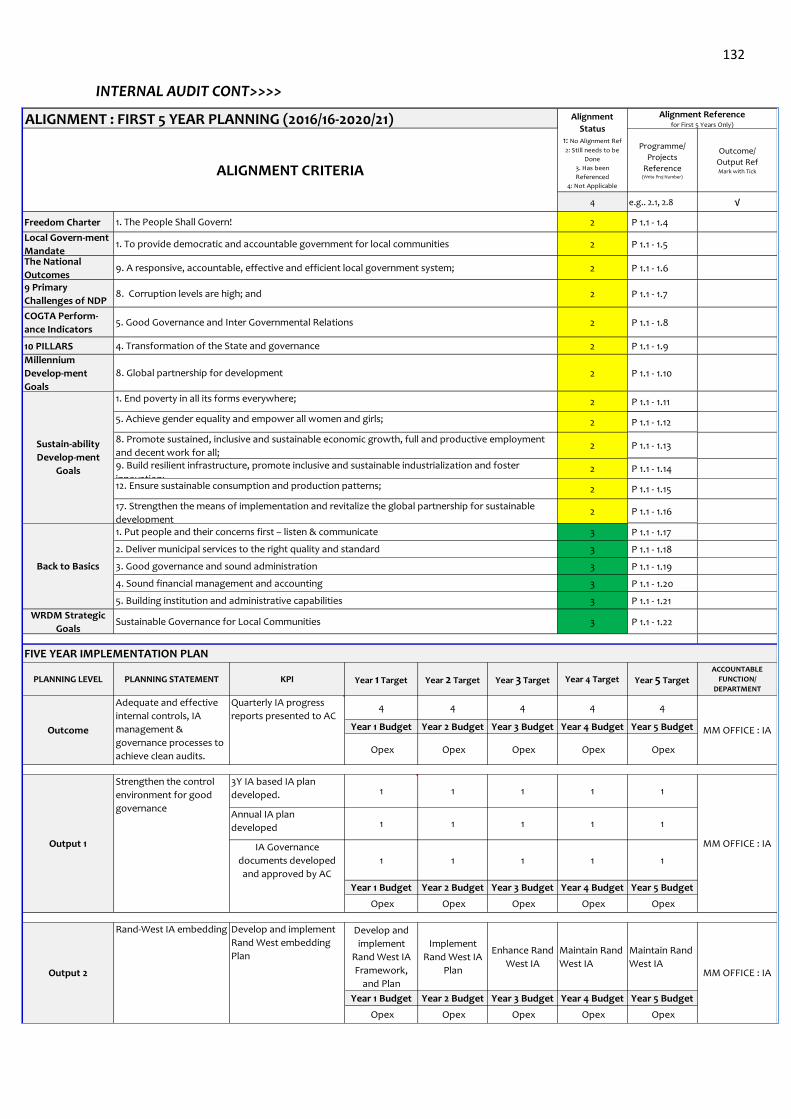
132
INTERNAL AUDIT CONT>>>>
ALIGNMENT : FIRST 5 YEAR PLANNING (2016/16-2020/21)
Programme/
Projects
Reference(Write Proj Number)
Outcome/
Output RefMark with Tick
4 e.g.. 2.1, 2.8 √
Freedom Charter 2 P 1.1 - 1.4
Local Govern-ment
Mandate2 P 1.1 - 1.5
The National
Outcomes2 P 1.1 - 1.6
9 Primary
Challenges of NDP2 P 1.1 - 1.7
COGTA Perform-
ance Indicators 2 P 1.1 - 1.8
10 PILLARS 2 P 1.1 - 1.9
Millennium
Develop-ment
Goals
2 P 1.1 - 1.10
2 P 1.1 - 1.11
2 P 1.1 - 1.12
2 P 1.1 - 1.13
2 P 1.1 - 1.14
2 P 1.1 - 1.15
2 P 1.1 - 1.16
3 P 1.1 - 1.17
3 P 1.1 - 1.18
3 P 1.1 - 1.19
3 P 1.1 - 1.20
3 P 1.1 - 1.21
WRDM Strategic
Goals3 P 1.1 - 1.22
PLANNING LEVEL PLANNING STATEMENT KPI Year 1 Target Year 2 Target Year 3 Target Year 4 Target Year 5 TargetACCOUNTABLE
FUNCTION/
DEPARTMENT
4 4 4 4 4
Year 1 Budget Year 2 Budget Year 3 Budget Year 4 Budget Year 5 Budget
Opex Opex Opex Opex Opex
3Y IA based IA plan
developed. 1 1 1 1 1
Annual IA plan
developed 1 1 1 1 1
1 1 1 1 1
Year 1 Budget Year 2 Budget Year 3 Budget Year 4 Budget Year 5 Budget
Opex Opex Opex Opex Opex
Develop and
implement
Rand West IA
Framework,
and Plan
Implement
Rand West IA
Plan
Enhance Rand
West IA
Maintain Rand
West IA
Maintain Rand
West IA
Year 1 Budget Year 2 Budget Year 3 Budget Year 4 Budget Year 5 Budget
Opex Opex Opex Opex Opex
9. A responsive, accountable, effective and efficient local government system;
4. Transformation of the State and governance
5. Good Governance and Inter Governmental Relations
8. Corruption levels are high; and
Output 2
Rand-West IA embedding Develop and implement
Rand West embedding
Plan
MM OFFICE : IA
Output 1
Strengthen the control
environment for good
governance
MM OFFICE : IA
Sustainable Governance for Local Communities
FIVE YEAR IMPLEMENTATION PLAN
1. To provide democratic and accountable government for local communities
Alignment
Status1: No Alignment Ref
2: Still needs to be
Done
3. Has been
Referenced
4: Not Applicable
Alignment Referencefor First 5 Years Only)
ALIGNMENT CRITERIA
1. The People Shall Govern!
Outcome
Adequate and effective
internal controls, IA
management &
governance processes to
achieve clean audits.
Quarterly IA progress
reports presented to AC
MM OFFICE : IA
8. Global partnership for development
1. End poverty in all its forms everywhere;
8. Promote sustained, inclusive and sustainable economic growth, full and productive employment
and decent work for all;
12. Ensure sustainable consumption and production patterns;
17. Strengthen the means of implementation and revitalize the global partnership for sustainable
development
5. Building institution and administrative capabilities
5. Achieve gender equality and empower all women and girls;
9. Build resilient infrastructure, promote inclusive and sustainable industrialization and foster
innovation;
Sustain-ability
Develop-ment
Goals
1. Put people and their concerns first – listen & communicate
2. Deliver municipal services to the right quality and standard
3. Good governance and sound administration
4. Sound financial management and accounting
Back to Basics
IA Governance
documents developed
and approved by AC
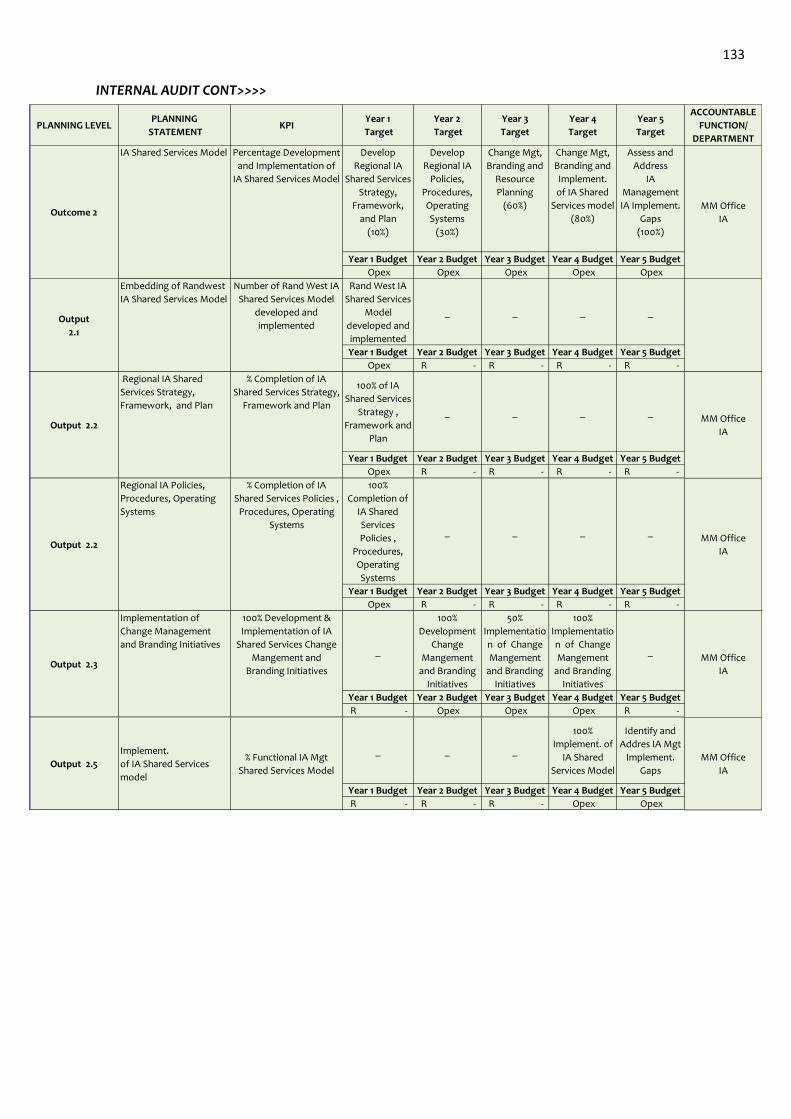
133
INTERNAL AUDIT CONT>>>>
PLANNING LEVELPLANNING
STATEMENTKPI
Year 1
Target
Year 2
Target
Year 3
Target
Year 4
Target
Year 5
Target
ACCOUNTABLE
FUNCTION/
DEPARTMENT
Develop
Regional IA
Shared Services
Strategy,
Framework,
and Plan
(10%)
Develop
Regional IA
Policies,
Procedures,
Operating
Systems
(30%)
Change Mgt,
Branding and
Resource
Planning
(60%)
Change Mgt,
Branding and
Implement.
of IA Shared
Services model
(80%)
Assess and
Address
IA
Management
IA Implement.
Gaps
(100%)
Year 1 Budget Year 2 Budget Year 3 Budget Year 4 Budget Year 5 Budget
Opex Opex Opex Opex Opex
Rand West IA
Shared Services
Model
developed and
implemented
_ _ _ _
Year 1 Budget Year 2 Budget Year 3 Budget Year 4 Budget Year 5 Budget
Opex R - R - R - R -
100% of IA
Shared Services
Strategy ,
Framework and
Plan
_ _ _ _
Year 1 Budget Year 2 Budget Year 3 Budget Year 4 Budget Year 5 Budget
Opex R - R - R - R -
100%
Completion of
IA Shared
Services
Policies ,
Procedures,
Operating
Systems
_ _ _ _
Year 1 Budget Year 2 Budget Year 3 Budget Year 4 Budget Year 5 Budget
Opex R - R - R - R -
_
100%
Development
Change
Mangement
and Branding
Initiatives
50%
Implementatio
n of Change
Mangement
and Branding
Initiatives
100%
Implementatio
n of Change
Mangement
and Branding
Initiatives
_
Year 1 Budget Year 2 Budget Year 3 Budget Year 4 Budget Year 5 Budget
R - Opex Opex Opex R -
_ _ _
100%
Implement. of
IA Shared
Services Model
Identify and
Addres IA Mgt
Implement.
Gaps
Year 1 Budget Year 2 Budget Year 3 Budget Year 4 Budget Year 5 Budget
R - R - R - Opex Opex
Output 2.5
Implement.
of IA Shared Services
model
% Functional IA Mgt
Shared Services Model
MM Office
IA
Output 2.2
Regional IA Shared
Services Strategy,
Framework, and Plan
% Completion of IA
Shared Services Strategy,
Framework and Plan
MM Office
IA
Output 2.2
Regional IA Policies,
Procedures, Operating
Systems
% Completion of IA
Shared Services Policies ,
Procedures, Operating
Systems
MM Office
IA
Output 2.3
Implementation of
Change Management
and Branding Initiatives
100% Development &
Implementation of IA
Shared Services Change
Mangement and
Branding Initiatives
MM Office
IA
Outcome 2
IA Shared Services Model Percentage Development
and Implementation of
IA Shared Services Model
MM Office
IA
Output
2.1
Embedding of Randwest
IA Shared Services Model
Number of Rand West IA
Shared Services Model
developed and
implemented
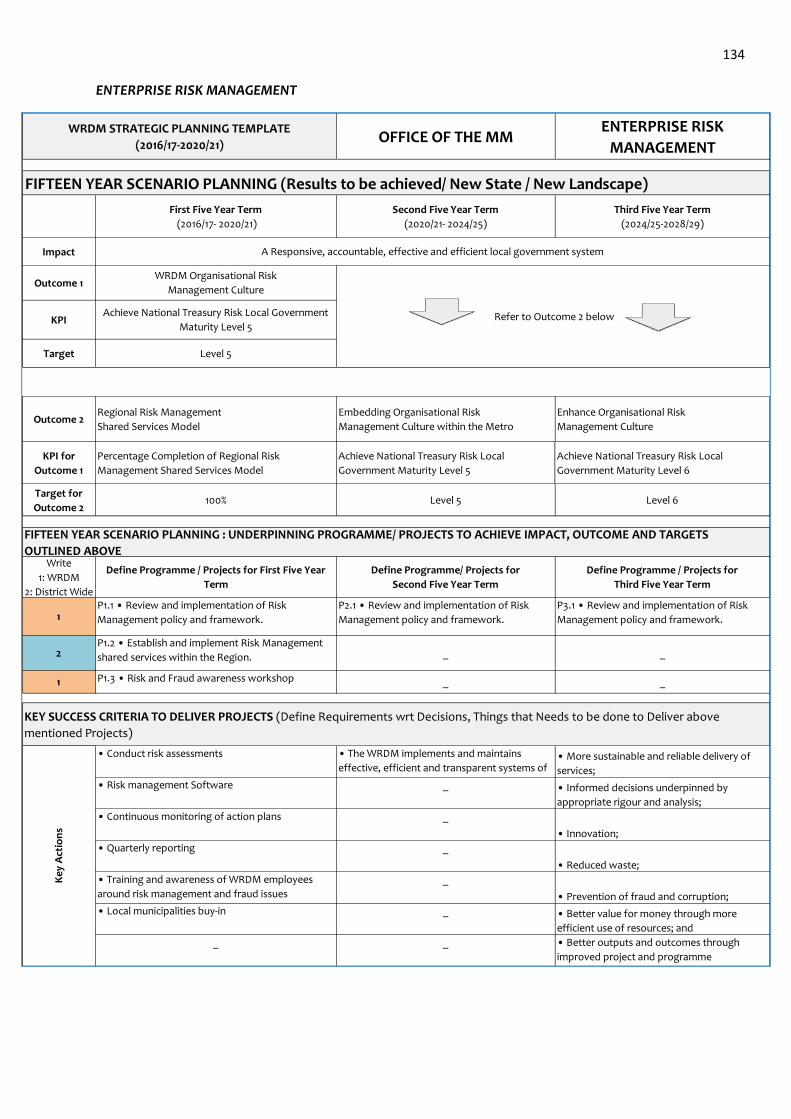
134
ENTERPRISE RISK MANAGEMENT
FIFTEEN YEAR SCENARIO PLANNING (Results to be achieved/ New State / New Landscape)
Impact
Outcome 1
KPI
Target
Outcome 2
KPI for
Outcome 1
Target for
Outcome 2
Write
1: WRDM
2: District Wide
1
2
1
• Informed decisions underpinned by
appropriate rigour and analysis;
• Innovation;
• Reduced waste;
• Risk management Software
• Continuous monitoring of action plans
• Better value for money through more
efficient use of resources; and
_
_
• Prevention of fraud and corruption;
_ _ • Better outputs and outcomes through
improved project and programme
management
• Local municipalities buy-in _
• Training and awareness of WRDM employees
around risk management and fraud issues
P1.2 • Establish and implement Risk Management
shared services within the Region. _ _
P1.3 • Risk and Fraud awareness workshop _ _
KEY SUCCESS CRITERIA TO DELIVER PROJECTS (Define Requirements wrt Decisions, Things that Needs to be done to Deliver above
mentioned Projects)
Ke
y A
ctio
ns
• Conduct risk assessments • The WRDM implements and maintains
effective, efficient and transparent systems of
risk management and internal control.
• More sustainable and reliable delivery of
services;
• Quarterly reporting
_
_
Regional Risk Management
Shared Services Model
Embedding Organisational Risk
Management Culture within the Metro
Enhance Organisational Risk
Management Culture
Percentage Completion of Regional Risk
Management Shared Services Model
Achieve National Treasury Risk Local
Government Maturity Level 5
Achieve National Treasury Risk Local
Government Maturity Level 6
100% Level 5 Level 6
WRDM Organisational Risk
Management Culture
WRDM STRATEGIC PLANNING TEMPLATE
(2016/17-2020/21)OFFICE OF THE MM
ENTERPRISE RISK
MANAGEMENT
First Five Year Term
(2016/17- 2020/21)
Second Five Year Term
(2020/21- 2024/25)
Third Five Year Term
(2024/25-2028/29)
A Responsive, accountable, effective and efficient local government system
Refer to Outcome 2 below
Define Programme / Projects for First Five Year
Term
Define Programme/ Projects for
Second Five Year Term
Define Programme / Projects for
Third Five Year Term
P1.1 • Review and implementation of Risk
Management policy and framework.
P2.1 • Review and implementation of Risk
Management policy and framework.
P3.1 • Review and implementation of Risk
Management policy and framework.
Achieve National Treasury Risk Local Government
Maturity Level 5
Level 5
FIFTEEN YEAR SCENARIO PLANNING : UNDERPINNING PROGRAMME/ PROJECTS TO ACHIEVE IMPACT, OUTCOME AND TARGETS
OUTLINED ABOVE
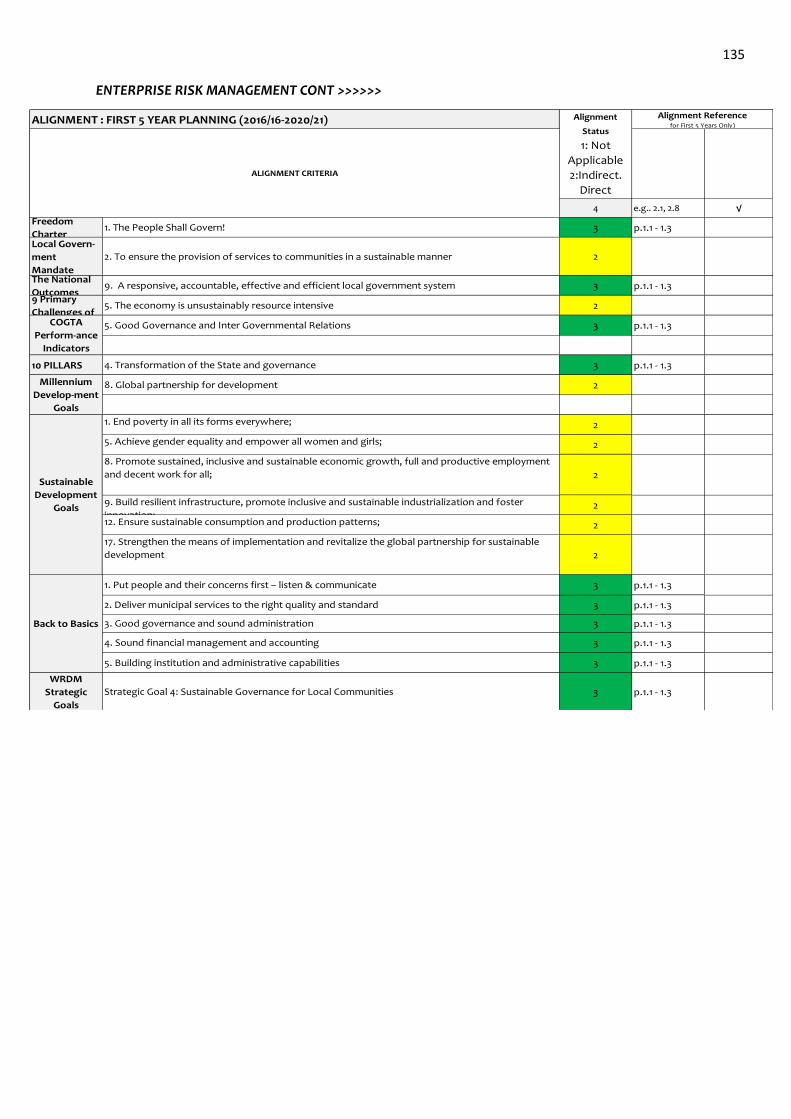
135
ENTERPRISE RISK MANAGEMENT CONT >>>>>>
ALIGNMENT : FIRST 5 YEAR PLANNING (2016/16-2020/21)
4 e.g.. 2.1, 2.8 √Freedom
Charter3 p.1.1 - 1.3
Local Govern-
ment
Mandate
2
The National
Outcomes3 p.1.1 - 1.3
9 Primary
Challenges of 2
3 p.1.1 - 1.3
10 PILLARS 3 p.1.1 - 1.3
2
2
2
2
2
2
2
3 p.1.1 - 1.3
3 p.1.1 - 1.3
3 p.1.1 - 1.3
3 p.1.1 - 1.3
3 p.1.1 - 1.3
WRDM
Strategic
Goals
3 p.1.1 - 1.3
Sustainable
Development
Goals
Back to Basics
1. Put people and their concerns first – listen & communicate
2. Deliver municipal services to the right quality and standard
3. Good governance and sound administration
4. Sound financial management and accounting
1. End poverty in all its forms everywhere;
9. Build resilient infrastructure, promote inclusive and sustainable industrialization and foster
innovation;12. Ensure sustainable consumption and production patterns;
17. Strengthen the means of implementation and revitalize the global partnership for sustainable
development
5. Building institution and administrative capabilities
5. Achieve gender equality and empower all women and girls;
8. Promote sustained, inclusive and sustainable economic growth, full and productive employment
and decent work for all;
Millennium
Develop-ment
Goals
8. Global partnership for development
4. Transformation of the State and governance
COGTA
Perform-ance
Indicators
5. Good Governance and Inter Governmental Relations
Alignment
Status
1: Not
Applicable
2:Indirect.
Direct
Alignment Referencefor First 5 Years Only)
ALIGNMENT CRITERIA
1. The People Shall Govern!
5. The economy is unsustainably resource intensive
9. A responsive, accountable, effective and efficient local government system
2. To ensure the provision of services to communities in a sustainable manner
Strategic Goal 4: Sustainable Governance for Local Communities
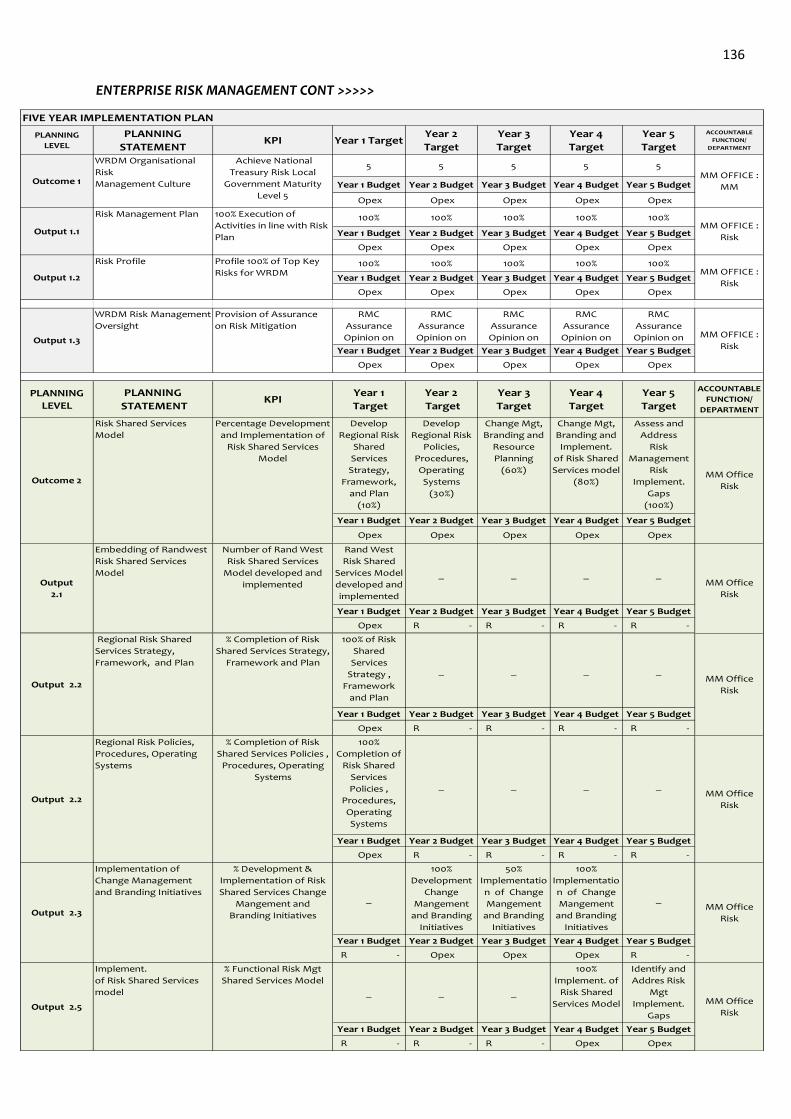
136
ENTERPRISE RISK MANAGEMENT CONT >>>>>
PLANNING
LEVEL
PLANNING
STATEMENTKPI Year 1 Target
Year 2
Target
Year 3
Target
Year 4
Target
Year 5
Target
ACCOUNTABLE
FUNCTION/
DEPARTMENT
5 5 5 5 5
Year 1 Budget Year 2 Budget Year 3 Budget Year 4 Budget Year 5 Budget
Opex Opex Opex Opex Opex
100% 100% 100% 100% 100%
Year 1 Budget Year 2 Budget Year 3 Budget Year 4 Budget Year 5 Budget
Opex Opex Opex Opex Opex
100% 100% 100% 100% 100%
Year 1 Budget Year 2 Budget Year 3 Budget Year 4 Budget Year 5 Budget
Opex Opex Opex Opex Opex
RMC
Assurance
Opinion on
Risk Status
RMC
Assurance
Opinion on
Risk Status
RMC
Assurance
Opinion on
Risk Status
RMC
Assurance
Opinion on
Risk Status
RMC
Assurance
Opinion on
Risk Status Year 1 Budget Year 2 Budget Year 3 Budget Year 4 Budget Year 5 Budget
Opex Opex Opex Opex Opex
PLANNING
LEVEL
PLANNING
STATEMENTKPI
Year 1
Target
Year 2
Target
Year 3
Target
Year 4
Target
Year 5
Target
ACCOUNTABLE
FUNCTION/
DEPARTMENT
Develop
Regional Risk
Shared
Services
Strategy,
Framework,
and Plan
(10%)
Develop
Regional Risk
Policies,
Procedures,
Operating
Systems
(30%)
Change Mgt,
Branding and
Resource
Planning
(60%)
Change Mgt,
Branding and
Implement.
of Risk Shared
Services model
(80%)
Assess and
Address
Risk
Management
Risk
Implement.
Gaps
(100%)
Year 1 Budget Year 2 Budget Year 3 Budget Year 4 Budget Year 5 Budget
Opex Opex Opex Opex Opex
Rand West
Risk Shared
Services Model
developed and
implemented
_ _ _ _
Year 1 Budget Year 2 Budget Year 3 Budget Year 4 Budget Year 5 Budget
Opex R - R - R - R -
100% of Risk
Shared
Services
Strategy ,
Framework
and Plan
_ _ _ _
Year 1 Budget Year 2 Budget Year 3 Budget Year 4 Budget Year 5 Budget
Opex R - R - R - R -
100%
Completion of
Risk Shared
Services
Policies ,
Procedures,
Operating
Systems
_ _ _ _
Year 1 Budget Year 2 Budget Year 3 Budget Year 4 Budget Year 5 Budget
Opex R - R - R - R -
_
100%
Development
Change
Mangement
and Branding
Initiatives
50%
Implementatio
n of Change
Mangement
and Branding
Initiatives
100%
Implementatio
n of Change
Mangement
and Branding
Initiatives
_
Year 1 Budget Year 2 Budget Year 3 Budget Year 4 Budget Year 5 Budget
R - Opex Opex Opex R -
_ _ _
100%
Implement. of
Risk Shared
Services Model
Identify and
Addres Risk
Mgt
Implement.
Gaps
Year 1 Budget Year 2 Budget Year 3 Budget Year 4 Budget Year 5 Budget
R - R - R - Opex Opex
Output 2.5
Implement.
of Risk Shared Services
model
% Functional Risk Mgt
Shared Services Model
MM Office
Risk
Output 2.2
Regional Risk Policies,
Procedures, Operating
Systems
% Completion of Risk
Shared Services Policies ,
Procedures, Operating
Systems
MM Office
Risk
Output 2.3
Implementation of
Change Management
and Branding Initiatives
% Development &
Implementation of Risk
Shared Services Change
Mangement and
Branding InitiativesMM Office
Risk
MM OFFICE :
RiskOutput 1.1
Risk Management Plan 100% Execution of
Activities in line with Risk
Plan
FIVE YEAR IMPLEMENTATION PLAN
Outcome 1
WRDM Organisational
Risk
Management CultureMM OFFICE :
MM
Achieve National
Treasury Risk Local
Government Maturity
Level 5
Output 1.2
Risk Profile Profile 100% of Top Key
Risks for WRDM MM OFFICE :
Risk
Output 2.2
Regional Risk Shared
Services Strategy,
Framework, and Plan
% Completion of Risk
Shared Services Strategy,
Framework and Plan
MM Office
Risk
Output
2.1
Embedding of Randwest
Risk Shared Services
Model
Number of Rand West
Risk Shared Services
Model developed and
implemented MM Office
Risk
Output 1.3
WRDM Risk Management
Oversight
Provision of Assurance
on Risk Mitigation MM OFFICE :
Risk
Outcome 2
Risk Shared Services
Model
Percentage Development
and Implementation of
Risk Shared Services
Model
MM Office
Risk

137
10.1.5 BUSINESS EXCELLENCE FIVE IMPLEMENTATION PLANS
IDP & PMS
FIFTEEN YEAR SCENARIO PLANNING (Results to be achieved/ New State / New Landscape)
Impact
Outcome 1
KPI for Outcome 1
Target
Outcome 2
KPI for Outcome 2
Target for
Outcome 2
Write
1: WRDM
2: District Wide
2
2
1
2
2
1
1
1
1
_ _
P1.3 Develop IDP that reflects sectoral and spatial
convergence _
FIFTEEN YEAR SCENARIO PLANNING : UNDERPINNING PROGRAMME/ PROJECTS TO ACHIEVE IMPACT, OUTCOME
AND TARGETS OUTLINED ABOVE
P1.8 Paperless and virtual PMS. _ _
P1.9 Good to Great workshop report
implementation_ _
P1.6 Coordinate and facilitate the implementation
of Good to Great report_ _
P1.7 System based IDP, that incorporates Project
Management _ _
WRDM STRATEGIC PLANNING TEMPLATE
(2016/17-2020/21)OFFICE OF THE MM IDP AND PMS
First Five Year Term
(2016/17- 2020/21)
Second Five Year Term
(2020/21- 2024/25)
Third Five Year Term
(2024/25-2028/29)
Define Programme / Projects for First Five
Year Term
Define Programme/ Projects for
Second Five Year Term
Define Programme / Projects for
Third Five Year Term
% Development and maintainance of a performance
driven culture
95%
High Performance Organisation
A Responsive, accountable, effective and efficient local government system
Regional IDP and PMS Management
Shared Services Model
Embedding a High Performance Culture within the
Metro
Enhance High Performance
Culture sustained
Percentage Completion of Regional Risk
Management Shared Services Model
Refer to Outcome 2 below
% achievement of organistional annual tragets % achievement of organistional annual tragets
100% 80% 90%
_
_ _
P1.5 Standardise SOPs_ _
P1.1 Rand West planning and performance
information consolidation (PR)
_ _
P1.2 Regionalisation of planning and performance
information (PR)
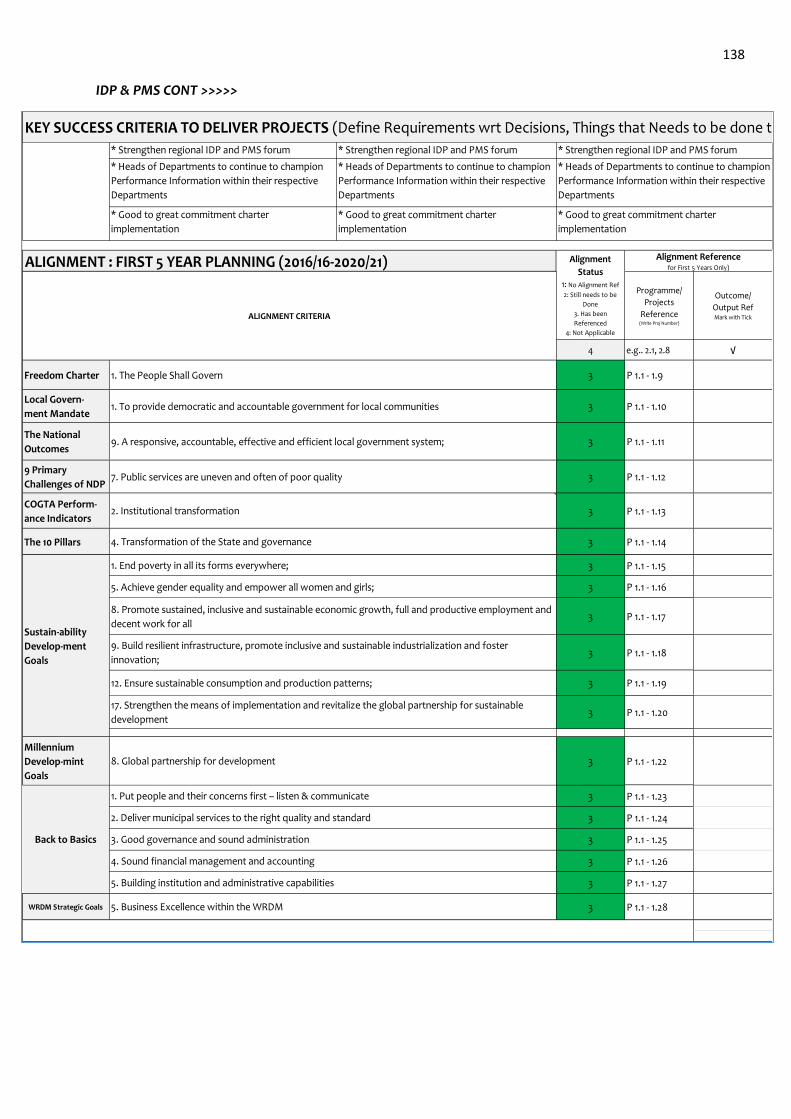
138
IDP & PMS CONT >>>>>
ALIGNMENT : FIRST 5 YEAR PLANNING (2016/16-2020/21)
Programme/
Projects
Reference(Write Proj Number)
Outcome/
Output RefMark with Tick
4 e.g.. 2.1, 2.8 √
Freedom Charter 3 P 1.1 - 1.9
Local Govern-
ment Mandate3 P 1.1 - 1.10
The National
Outcomes3 P 1.1 - 1.11
9 Primary
Challenges of NDP3 P 1.1 - 1.12
COGTA Perform-
ance Indicators 3 P 1.1 - 1.13
The 10 Pillars 3 P 1.1 - 1.14
3 P 1.1 - 1.15
3 P 1.1 - 1.16
3 P 1.1 - 1.17
3 P 1.1 - 1.18
3 P 1.1 - 1.19
3 P 1.1 - 1.20
Millennium
Develop-mint
Goals
3 P 1.1 - 1.22
3 P 1.1 - 1.23
3 P 1.1 - 1.24
3 P 1.1 - 1.25
3 P 1.1 - 1.26
3 P 1.1 - 1.27
WRDM Strategic Goals 3 P 1.1 - 1.28
4. Transformation of the State and governance
Back to Basics
4. Sound financial management and accounting
5. Business Excellence within the WRDM
8. Global partnership for development
1. Put people and their concerns first – listen & communicate
2. Deliver municipal services to the right quality and standard
3. Good governance and sound administration
5. Building institution and administrative capabilities
Sustain-ability
Develop-ment
Goals
1. End poverty in all its forms everywhere;
8. Promote sustained, inclusive and sustainable economic growth, full and productive employment and
decent work for all
17. Strengthen the means of implementation and revitalize the global partnership for sustainable
development
5. Achieve gender equality and empower all women and girls;
9. Build resilient infrastructure, promote inclusive and sustainable industrialization and foster
innovation;
12. Ensure sustainable consumption and production patterns;
1. To provide democratic and accountable government for local communities
Alignment
Status1: No Alignment Ref
2: Still needs to be
Done
3. Has been
Referenced
4: Not Applicable
Alignment Referencefor First 5 Years Only)
ALIGNMENT CRITERIA
1. The People Shall Govern
2. Institutional transformation
7. Public services are uneven and often of poor quality
9. A responsive, accountable, effective and efficient local government system;
* Heads of Departments to continue to champion
Performance Information within their respective
Departments
* Heads of Departments to continue to champion
Performance Information within their respective
Departments
* Good to great commitment charter
implementation
* Good to great commitment charter
implementation
* Good to great commitment charter
implementation
KEY SUCCESS CRITERIA TO DELIVER PROJECTS (Define Requirements wrt Decisions, Things that Needs to be done to Deliver above mentioned Projects)
* Strengthen regional IDP and PMS forum * Strengthen regional IDP and PMS forum * Strengthen regional IDP and PMS forum
* Heads of Departments to continue to champion
Performance Information within their respective
Departments

139
IDP & PMS CONT >>>>>
PLANNING LEVELPLANNING
STATEMENTKPI Year 1 Target
Year 2
Target
Year 3
Target
Year 4
Target
Year 5
Target
ACCOUNTABLE
FUNCTION/
DEPARTMENT
91% 92% 93% 94% 95%
Year 1 Budget Year 2 Budget Year 3 Budget Year 4 Budget Year 5 Budget
Opex Opex Opex Opex Opex
Regional IDP
developed and
implement-ation
Implementatio
n of IDP
Implementatio
n of IDP
Implementatio
n of IDP
Implementatio
n of IDP
Year 1 Budget Year 2 Budget Year 3 Budget Year 4 Budget Year 5 Budget
Opex Opex Opex Opex Opex
Standardised
performance
information
frameworks
developed and
implemented
_ _ _ _
Year 1 Budget Year 2 Budget Year 3 Budget Year 4 Budget Year 5 Budget
Opex R - R - R - R -
System
implement-ation
report
System
implement-
ation report
System
implement-
ation report
System
implement-
ation report
System
implement-
ation report
Year 1 Budget Year 2 Budget Year 3 Budget Year 4 Budget Year 5 Budget
Opex Opex Opex Opex Opex
70% employees
achieving targets
as per
performance
agreements
75% employees
achieving
targets as per
performance
agreements
85% employees
achieving
targets as per
performance
agreements
95% employees
achieving
targets as per
performance
agreements
100%
employees
achieving
targets as per
performance
agreements
Year 1 Budget Year 2 Budget Year 3 Budget Year 4 Budget Year 5 Budget
Opex Opex Opex Opex Opex
50% Development
System based IDP
linking project
management
100%
Development
System based
IDP linking
project
management
50%
Implementatio
n System
based IDP
linking project
management
100%
Implementatio
n System
based IDP
linking project
management
Review &
Improve
System based
IDP linking
project
management
Year 1 Budget Year 2 Budget Year 3 Budget Year 4 Budget Year 5 Budget
Opex Opex Opex Opex Opex
report on
coordinating and
facilitating 90%
performance
within the region
report on
coordinating,
facilitating and
sustaining 90%
performance
within the
region
report on
coordinating,
facilitating and
sustaining 90%
performance
within the
region
report on
coordinating,
facilitating and
sustaining 90%
performance
within the
region
report on
coordinating,
facilitating and
sustaining 90%
performance
within the
region
Year 1 Budget Year 2 Budget Year 3 Budget Year 4 Budget Year 5 Budget
Opex Opex Opex Opex Opex
Report on
coordination of
regional Clean
Audit opinion
Report on
coordination
of regional
Clean Audit
opinion
Report on
coordination
of regional
Clean Audit
opinion
Report on
coordination
of regional
Clean Audit
opinion
Report on
coordination
of regional
Clean Audit
opinion
Year 1 Budget Year 2 Budget Year 3 Budget Year 4 Budget Year 5 Budget
Opex Opex Opex Opex Opex
Level 3 rating on
LGMIM
Level 4 rating
on LGMIM
Maintain Level
4 rating on
LGMIM
Maintain Level
4 rating on
LGMIM
Maintain Level
4 rating on
LGMIM
Year 1 Budget Year 2 Budget Year 3 Budget Year 4 Budget Year 5 Budget
Opex Opex Opex Opex Opex
MM Office : IDP
and PMS
Output 2
Standardised
Performance Information
frameworks
No. of standardised
performance information
frameworks developed
and implemented
Output 3
Paperless and virtual
PMS.
ePMS full
implementationMM Office : IDP
and PMS
Output 4
Total staff compliment
participating on
Performance
Management System
% of employees achieving
targets as per
performance agreements
FIVE YEAR IMPLEMENTATION PLAN
MM Office : IDP
and PMS
Output 1
Regional IDP developed
and implemented
No. of regional IDP
developed and
implemented
Output 8
Improved management
practices
% implementation of the
Good to Great reportMM Office : IDP
and PMS
Output 7
Clean audit on
performance information
across the region
Report on coordination
of regional Clean Audit
opinionMM Office : IDP
and PMS
Output 6
Coordinate and facilitate
high performance culture
within the region
Number of reports on
coordinating and
facilitating 90%
performance within the
region MM Office : IDP
and PMS
Output 5
System based IDP linking
project management
100% Implementation
System based IDP linking
project management
MM Office : IDP
and PMS
MM Office : IDP
and PMS
Outcome
High Performance
Organisation
% Development and
maintainance of a
performance driven
culture
MM Office : IDP
and PMS
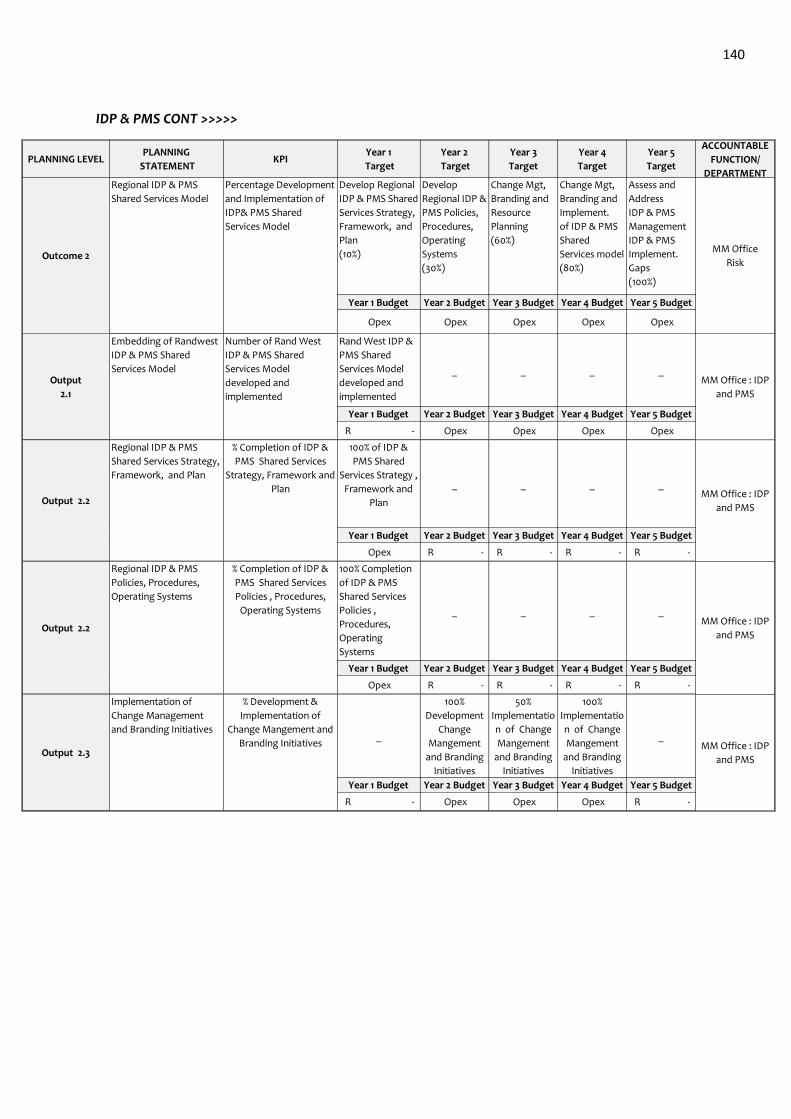
140
IDP & PMS CONT >>>>>
PLANNING LEVELPLANNING
STATEMENTKPI
Year 1
Target
Year 2
Target
Year 3
Target
Year 4
Target
Year 5
Target
ACCOUNTABLE
FUNCTION/
DEPARTMENTDevelop Regional
IDP & PMS Shared
Services Strategy,
Framework, and
Plan
(10%)
Develop
Regional IDP &
PMS Policies,
Procedures,
Operating
Systems
(30%)
Change Mgt,
Branding and
Resource
Planning
(60%)
Change Mgt,
Branding and
Implement.
of IDP & PMS
Shared
Services model
(80%)
Assess and
Address
IDP & PMS
Management
IDP & PMS
Implement.
Gaps
(100%)
Year 1 Budget Year 2 Budget Year 3 Budget Year 4 Budget Year 5 Budget
Opex Opex Opex Opex Opex
Rand West IDP &
PMS Shared
Services Model
developed and
implemented
_ _ _ _
Year 1 Budget Year 2 Budget Year 3 Budget Year 4 Budget Year 5 Budget
R - Opex Opex Opex Opex
100% of IDP &
PMS Shared
Services Strategy ,
Framework and
Plan
_ _ _ _
Year 1 Budget Year 2 Budget Year 3 Budget Year 4 Budget Year 5 Budget
Opex R - R - R - R -
100% Completion
of IDP & PMS
Shared Services
Policies ,
Procedures,
Operating
Systems
_ _ _ _
Year 1 Budget Year 2 Budget Year 3 Budget Year 4 Budget Year 5 Budget
Opex R - R - R - R -
_
100%
Development
Change
Mangement
and Branding
Initiatives
50%
Implementatio
n of Change
Mangement
and Branding
Initiatives
100%
Implementatio
n of Change
Mangement
and Branding
Initiatives
_
Year 1 Budget Year 2 Budget Year 3 Budget Year 4 Budget Year 5 Budget
R - Opex Opex Opex R -
Outcome 2
Regional IDP & PMS
Shared Services Model
Percentage Development
and Implementation of
IDP& PMS Shared
Services Model
MM Office
Risk
Output
2.1
Embedding of Randwest
IDP & PMS Shared
Services Model
Number of Rand West
IDP & PMS Shared
Services Model
developed and
implemented
MM Office : IDP
and PMS
Output 2.2
Regional IDP & PMS
Shared Services Strategy,
Framework, and Plan
% Completion of IDP &
PMS Shared Services
Strategy, Framework and
Plan MM Office : IDP
and PMS
Output 2.2
Regional IDP & PMS
Policies, Procedures,
Operating Systems
% Completion of IDP &
PMS Shared Services
Policies , Procedures,
Operating SystemsMM Office : IDP
and PMS
Output 2.3
Implementation of
Change Management
and Branding Initiatives
% Development &
Implementation of
Change Mangement and
Branding Initiatives MM Office : IDP
and PMS
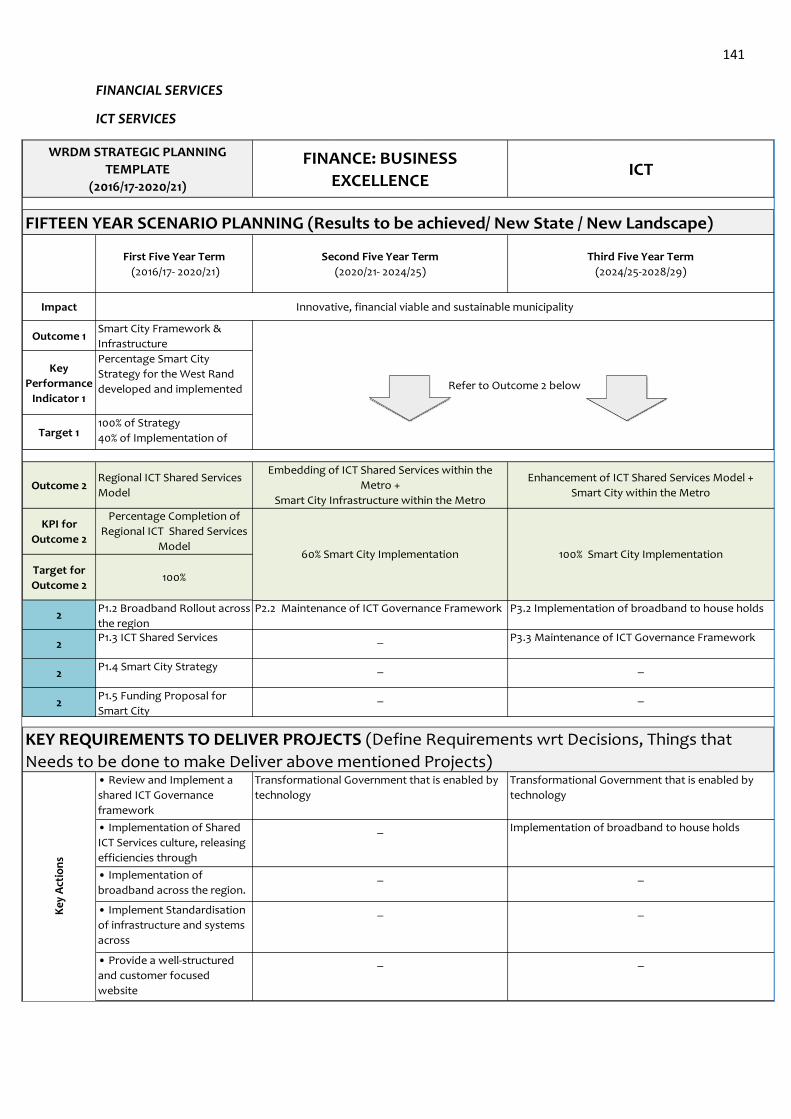
141
FINANCIAL SERVICES
ICT SERVICES
FIFTEEN YEAR SCENARIO PLANNING (Results to be achieved/ New State / New Landscape)
Impact
Outcome 1
Key
Performance
Indicator 1
Target 1
Outcome 2
KPI for
Outcome 2
Target for
Outcome 2
2
2
2
2
Innovative, financial viable and sustainable municipality
Smart City Framework &
Infrastructure
WRDM STRATEGIC PLANNING
TEMPLATE
(2016/17-2020/21)
FINANCE: BUSINESS
EXCELLENCEICT
First Five Year Term
(2016/17- 2020/21)
Second Five Year Term
(2020/21- 2024/25)
Third Five Year Term
(2024/25-2028/29)
Refer to Outcome 2 below
Percentage Completion of
Regional ICT Shared Services
Model
100%
Percentage Smart City
Strategy for the West Rand
developed and implemented
100% of Strategy
40% of Implementation of
Strategy
P1.4 Smart City Strategy _ _
P1.5 Funding Proposal for
Smart City
_ _
P1.2 Broadband Rollout across
the region
P2.2 Maintenance of ICT Governance Framework P3.2 Implementation of broadband to house holds
P1.3 ICT Shared Services _ P3.3 Maintenance of ICT Governance Framework
KEY REQUIREMENTS TO DELIVER PROJECTS (Define Requirements wrt Decisions, Things that
Needs to be done to make Deliver above mentioned Projects)
Key
Act
ion
s
• Review and Implement a
shared ICT Governance
framework
Transformational Government that is enabled by
technology
Transformational Government that is enabled by
technology
• Implementation of Shared
ICT Services culture, releasing
efficiencies through
standardisation and sharing.
• Provide a well-structured
and customer focused
website
_ _
_ Implementation of broadband to house holds
• Implementation of
broadband across the region.
_ _
• Implement Standardisation
of infrastructure and systems
across
_ _
Regional ICT Shared Services
Model
Embedding of ICT Shared Services within the
Metro +
Smart City Infrastructure within the Metro
Enhancement of ICT Shared Services Model +
Smart City within the Metro
60% Smart City Implementation 100% Smart City Implementation
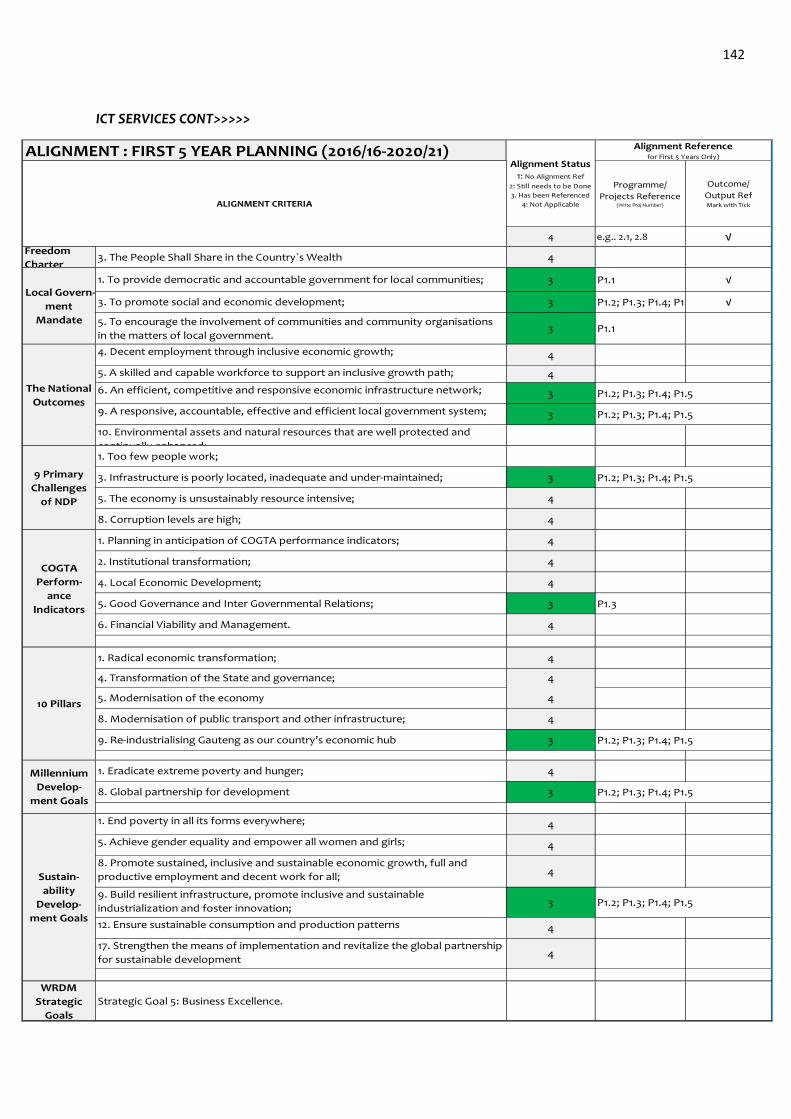
142
ICT SERVICES CONT>>>>>
ALIGNMENT : FIRST 5 YEAR PLANNING (2016/16-2020/21)
Programme/
Projects Reference(Write Proj Number)
Outcome/
Output RefMark with Tick
4 e.g.. 2.1, 2.8 √Freedom
Charter4
3 P1.1 √
3 P1.2; P1.3; P1.4; P1.5 √
3 P1.1
4
4
3 P1.2; P1.3; P1.4; P1.5
3 P1.2; P1.3; P1.4; P1.5
3 P1.2; P1.3; P1.4; P1.5
4
4
4
4
4
3 P1.3
4
4
4
4
4
3 P1.2; P1.3; P1.4; P1.5
4
3 P1.2; P1.3; P1.4; P1.5
4
4
4
3 P1.2; P1.3; P1.4; P1.5
4
4
WRDM
Strategic
Goals
10. Environmental assets and natural resources that are well protected and
continually enhanced;
1. To provide democratic and accountable government for local communities;
3. To promote social and economic development;
5. To encourage the involvement of communities and community organisations
in the matters of local government.
The National
Outcomes
Local Govern-
ment
Mandate
Alignment Status1: No Alignment Ref
2: Still needs to be Done
3. Has been Referenced
4: Not Applicable
Alignment Referencefor First 5 Years Only)
ALIGNMENT CRITERIA
3. The People Shall Share in the Country`s Wealth
4. Decent employment through inclusive economic growth;
5. A skilled and capable workforce to support an inclusive growth path;
6. An efficient, competitive and responsive economic infrastructure network;
9. A responsive, accountable, effective and efficient local government system;
COGTA
Perform-
ance
Indicators
1. Planning in anticipation of COGTA performance indicators;
2. Institutional transformation;
4. Local Economic Development;
5. Good Governance and Inter Governmental Relations;
6. Financial Viability and Management.
1. Too few people work;
3. Infrastructure is poorly located, inadequate and under-maintained;
5. The economy is unsustainably resource intensive;
8. Corruption levels are high;
10 Pillars
1. Radical economic transformation;
4. Transformation of the State and governance;
5. Modernisation of the economy
8. Modernisation of public transport and other infrastructure;
9. Re-industrialising Gauteng as our country’s economic hub
9 Primary
Challenges
of NDP
Strategic Goal 5: Business Excellence.
Sustain-
ability
Develop-
ment Goals
1. End poverty in all its forms everywhere;
5. Achieve gender equality and empower all women and girls;
8. Promote sustained, inclusive and sustainable economic growth, full and
productive employment and decent work for all;
9. Build resilient infrastructure, promote inclusive and sustainable
industrialization and foster innovation;
12. Ensure sustainable consumption and production patterns
17. Strengthen the means of implementation and revitalize the global partnership
for sustainable development
Millennium
Develop-
ment Goals
1. Eradicate extreme poverty and hunger;
8. Global partnership for development
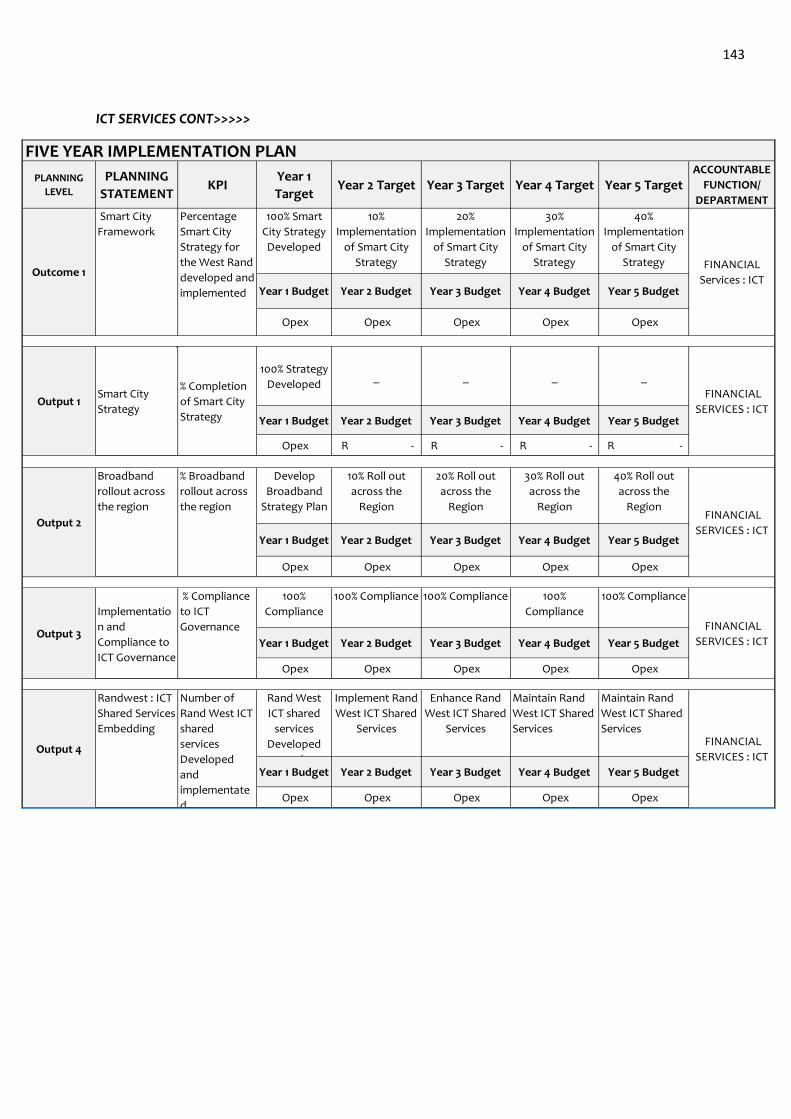
143
ICT SERVICES CONT>>>>>
PLANNING
LEVEL
PLANNING
STATEMENTKPI
Year 1
TargetYear 2 Target Year 3 Target Year 4 Target Year 5 Target
ACCOUNTABLE
FUNCTION/
DEPARTMENT
100% Smart
City Strategy
Developed
10%
Implementation
of Smart City
Strategy
20%
Implementation
of Smart City
Strategy
30%
Implementation
of Smart City
Strategy
40%
Implementation
of Smart City
Strategy
Year 1 Budget Year 2 Budget Year 3 Budget Year 4 Budget Year 5 Budget
Opex Opex Opex Opex Opex
100% Strategy
Developed_ _ _ _
Year 1 Budget Year 2 Budget Year 3 Budget Year 4 Budget Year 5 Budget
Opex R - R - R - R -
Develop
Broadband
Strategy Plan
10% Roll out
across the
Region
20% Roll out
across the
Region
30% Roll out
across the
Region
40% Roll out
across the
Region
Year 1 Budget Year 2 Budget Year 3 Budget Year 4 Budget Year 5 Budget
Opex Opex Opex Opex Opex
100%
Compliance
100% Compliance 100% Compliance 100%
Compliance
100% Compliance
Year 1 Budget Year 2 Budget Year 3 Budget Year 4 Budget Year 5 Budget
Opex Opex Opex Opex Opex
Rand West
ICT shared
services
Developed
and
Implement Rand
West ICT Shared
Services
Enhance Rand
West ICT Shared
Services
Maintain Rand
West ICT Shared
Services
Maintain Rand
West ICT Shared
Services
Year 1 Budget Year 2 Budget Year 3 Budget Year 4 Budget Year 5 Budget
Opex Opex Opex Opex Opex
FIVE YEAR IMPLEMENTATION PLAN
Outcome 1
Smart City
Framework
Percentage
Smart City
Strategy for
the West Rand
developed and
implemented
FINANCIAL
Services : ICT
Output 2
Broadband
rollout across
the region
% Broadband
rollout across
the region FINANCIAL
SERVICES : ICT
Output 1Smart City
Strategy
% Completion
of Smart City
Strategy
FINANCIAL
SERVICES : ICT
Output 4
Randwest : ICT
Shared Services
Embedding
Number of
Rand West ICT
shared
services
Developed
and
implementate
d
FINANCIAL
SERVICES : ICT
Output 3
Implementatio
n and
Compliance to
ICT Governance
% Compliance
to ICT
Governance FINANCIAL
SERVICES : ICT
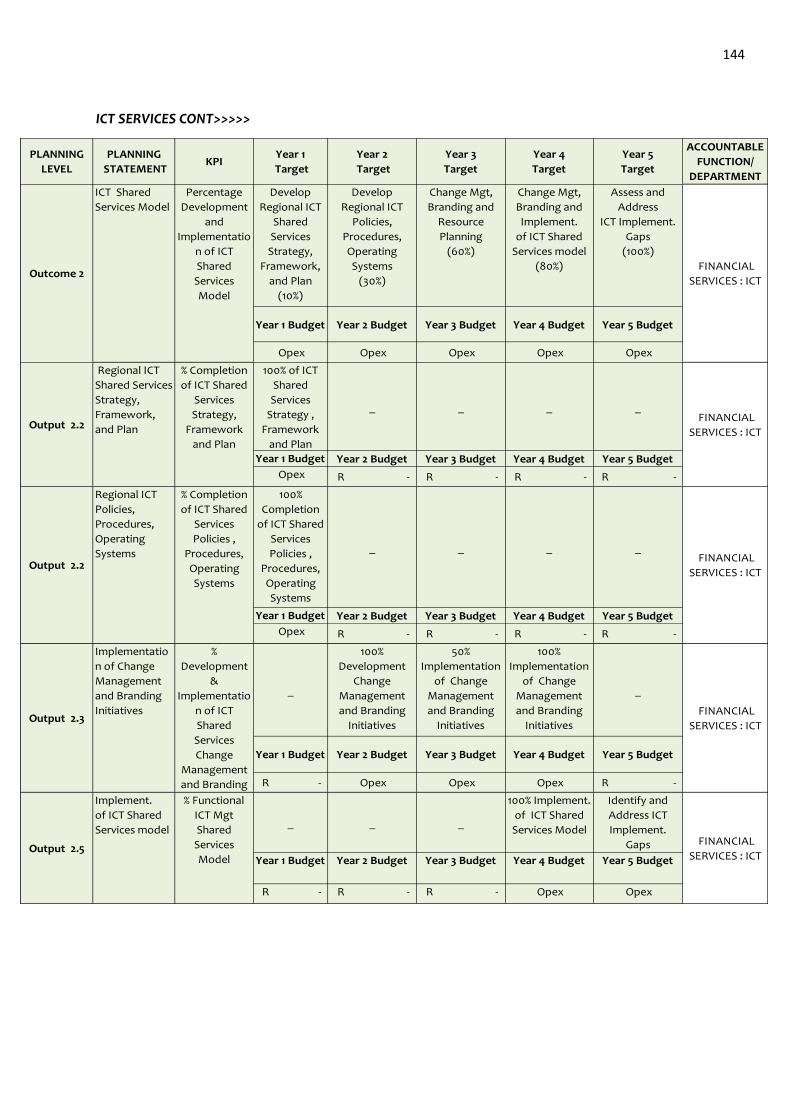
144
ICT SERVICES CONT>>>>>
PLANNING
LEVEL
PLANNING
STATEMENTKPI
Year 1
Target
Year 2
Target
Year 3
Target
Year 4
Target
Year 5
Target
ACCOUNTABLE
FUNCTION/
DEPARTMENT
Develop
Regional ICT
Shared
Services
Strategy,
Framework,
and Plan
(10%)
Develop
Regional ICT
Policies,
Procedures,
Operating
Systems
(30%)
Change Mgt,
Branding and
Resource
Planning
(60%)
Change Mgt,
Branding and
Implement.
of ICT Shared
Services model
(80%)
Assess and
Address
ICT Implement.
Gaps
(100%)
Year 1 Budget Year 2 Budget Year 3 Budget Year 4 Budget Year 5 Budget
Opex Opex Opex Opex Opex
100% of ICT
Shared
Services
Strategy ,
Framework
and Plan
_ _ _ _
Year 1 Budget Year 2 Budget Year 3 Budget Year 4 Budget Year 5 Budget
Opex R - R - R - R -
100%
Completion
of ICT Shared
Services
Policies ,
Procedures,
Operating
Systems
_ _ _ _
Year 1 Budget Year 2 Budget Year 3 Budget Year 4 Budget Year 5 Budget
Opex R - R - R - R -
_
100%
Development
Change
Management
and Branding
Initiatives
50%
Implementation
of Change
Management
and Branding
Initiatives
100%
Implementation
of Change
Management
and Branding
Initiatives
_
Year 1 Budget Year 2 Budget Year 3 Budget Year 4 Budget Year 5 Budget
R - Opex Opex Opex R -
_ _ _
100% Implement.
of ICT Shared
Services Model
Identify and
Address ICT
Implement.
Gaps
Year 1 Budget Year 2 Budget Year 3 Budget Year 4 Budget Year 5 Budget
R - R - R - Opex Opex
FINANCIAL
SERVICES : ICT
Outcome 2
ICT Shared
Services Model
Percentage
Development
and
Implementatio
n of ICT
Shared
Services
Model
FINANCIAL
SERVICES : ICT
Output 2.5
Implement.
of ICT Shared
Services model
% Functional
ICT Mgt
Shared
Services
Model
FINANCIAL
SERVICES : ICT
Output 2.2
Regional ICT
Shared Services
Strategy,
Framework,
and Plan
% Completion
of ICT Shared
Services
Strategy,
Framework
and Plan
FINANCIAL
SERVICES : ICT
Output 2.2
Regional ICT
Policies,
Procedures,
Operating
Systems
% Completion
of ICT Shared
Services
Policies ,
Procedures,
Operating
Systems
FINANCIAL
SERVICES : ICT
Output 2.3
Implementatio
n of Change
Management
and Branding
Initiatives
%
Development
&
Implementatio
n of ICT
Shared
Services
Change
Management
and Branding
Initiatives
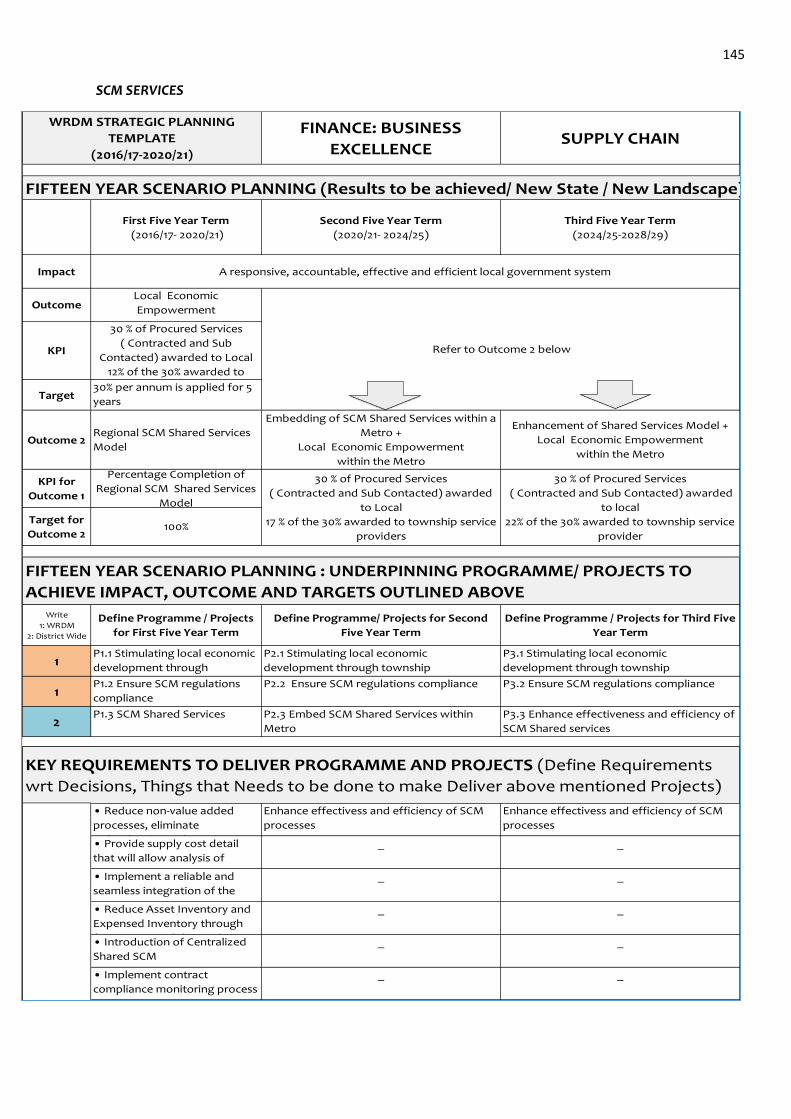
145
SCM SERVICES
FIFTEEN YEAR SCENARIO PLANNING (Results to be achieved/ New State / New Landscape)
Impact
Outcome
KPI
Target
Outcome 2
KPI for
Outcome 1
Target for
Outcome 2
Write
1: WRDM
2: District Wide
1
1
2
_
_
_
_
_
_
_ _
KEY REQUIREMENTS TO DELIVER PROGRAMME AND PROJECTS (Define Requirements
wrt Decisions, Things that Needs to be done to make Deliver above mentioned Projects)
• Reduce non-value added
processes, eliminate
redundancies and
Enhance effectivess and efficiency of SCM
processes
Enhance effectivess and efficiency of SCM
processes
• Implement contract
compliance monitoring process
• Provide supply cost detail
that will allow analysis of
supply expenditures at multiple
_ _
• Implement a reliable and
seamless integration of the
SCM system with MSCOA and • Reduce Asset Inventory and
Expensed Inventory through
forecasting and demand • Introduction of Centralized
Shared SCM
P3.1 Stimulating local economic
development through township
revitalisation P1.2 Ensure SCM regulations
compliance
P2.2 Ensure SCM regulations compliance P3.2 Ensure SCM regulations compliance
P1.3 SCM Shared Services P2.3 Embed SCM Shared Services within
Metro
P3.3 Enhance effectiveness and efficiency of
SCM Shared services
P1.1 Stimulating local economic
development through
township revitalisation
P2.1 Stimulating local economic
development through township
revitalisation
WRDM STRATEGIC PLANNING
TEMPLATE
(2016/17-2020/21)
FINANCE: BUSINESS
EXCELLENCESUPPLY CHAIN
First Five Year Term
(2016/17- 2020/21)
Second Five Year Term
(2020/21- 2024/25)
Third Five Year Term
(2024/25-2028/29)
Define Programme / Projects
for First Five Year Term
Define Programme/ Projects for Second
Five Year Term
Define Programme / Projects for Third Five
Year Term
30 % of Procured Services
( Contracted and Sub
Contacted) awarded to Local
12% of the 30% awarded to
township service providers30% per annum is applied for 5
years
Local Economic
Empowerment
FIFTEEN YEAR SCENARIO PLANNING : UNDERPINNING PROGRAMME/ PROJECTS TO
ACHIEVE IMPACT, OUTCOME AND TARGETS OUTLINED ABOVE
A responsive, accountable, effective and efficient local government system
Refer to Outcome 2 below
Regional SCM Shared Services
Model
Embedding of SCM Shared Services within a
Metro +
Local Economic Empowerment
within the Metro
Enhancement of Shared Services Model +
Local Economic Empowerment
within the Metro
Percentage Completion of
Regional SCM Shared Services
Model
100%
30 % of Procured Services
( Contracted and Sub Contacted) awarded
to Local
17 % of the 30% awarded to township service
providers
30 % of Procured Services
( Contracted and Sub Contacted) awarded
to local
22% of the 30% awarded to township service
provider
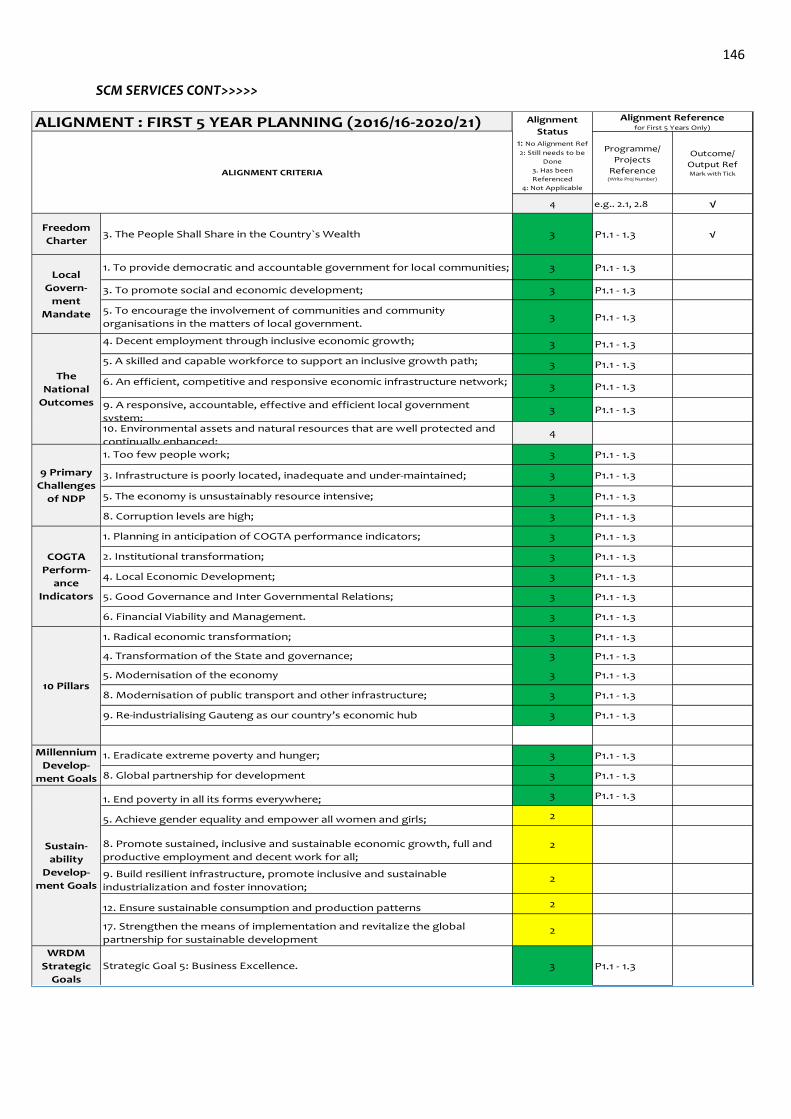
146
SCM SERVICES CONT>>>>>
ALIGNMENT : FIRST 5 YEAR PLANNING (2016/16-2020/21)
Programme/
Projects
Reference(Write Proj Number)
Outcome/
Output RefMark with Tick
4 e.g.. 2.1, 2.8 √
3 P1.1 - 1.3 √
3 P1.1 - 1.3
3 P1.1 - 1.3
3 P1.1 - 1.3
3 P1.1 - 1.3
3 P1.1 - 1.3
3 P1.1 - 1.3
3 P1.1 - 1.3
4
3 P1.1 - 1.3
3 P1.1 - 1.3
3 P1.1 - 1.3
3 P1.1 - 1.3
3 P1.1 - 1.3
3 P1.1 - 1.3
3 P1.1 - 1.3
3 P1.1 - 1.3
3 P1.1 - 1.3
3 P1.1 - 1.3
3 P1.1 - 1.3
3 P1.1 - 1.3
3 P1.1 - 1.3
3 P1.1 - 1.3
3 P1.1 - 1.3
3 P1.1 - 1.3
3 P1.1 - 1.3
2
2
2
2
2
WRDM
Strategic
Goals
3 P1.1 - 1.3Strategic Goal 5: Business Excellence.
1. Eradicate extreme poverty and hunger;
8. Global partnership for development
8. Promote sustained, inclusive and sustainable economic growth, full and
productive employment and decent work for all;
5. Achieve gender equality and empower all women and girls;
1. End poverty in all its forms everywhere;
9. Build resilient infrastructure, promote inclusive and sustainable
industrialization and foster innovation;
12. Ensure sustainable consumption and production patterns
17. Strengthen the means of implementation and revitalize the global
partnership for sustainable development
4. Local Economic Development;
10 Pillars
1. Radical economic transformation;
8. Modernisation of public transport and other infrastructure;
9. Re-industrialising Gauteng as our country’s economic hub
4. Transformation of the State and governance;
5. Modernisation of the economy
1. Planning in anticipation of COGTA performance indicators;
2. Institutional transformation;
5. Good Governance and Inter Governmental Relations;
6. Financial Viability and Management.
1. Too few people work;
3. Infrastructure is poorly located, inadequate and under-maintained;
Local
Govern-
ment
Mandate
1. To provide democratic and accountable government for local communities;
3. To promote social and economic development;
5. To encourage the involvement of communities and community
organisations in the matters of local government.
Alignment
Status1: No Alignment Ref
2: Still needs to be
Done
3. Has been
Referenced
4: Not Applicable
Alignment Referencefor First 5 Years Only)
ALIGNMENT CRITERIA
Freedom
Charter3. The People Shall Share in the Country`s Wealth
COGTA
Perform-
ance
Indicators
The
National
Outcomes
Millennium
Develop-
ment Goals
Sustain-
ability
Develop-
ment Goals
5. The economy is unsustainably resource intensive;
8. Corruption levels are high;
4. Decent employment through inclusive economic growth;
5. A skilled and capable workforce to support an inclusive growth path;
6. An efficient, competitive and responsive economic infrastructure network;
10. Environmental assets and natural resources that are well protected and
continually enhanced;
9. A responsive, accountable, effective and efficient local government
system;
9 Primary
Challenges
of NDP
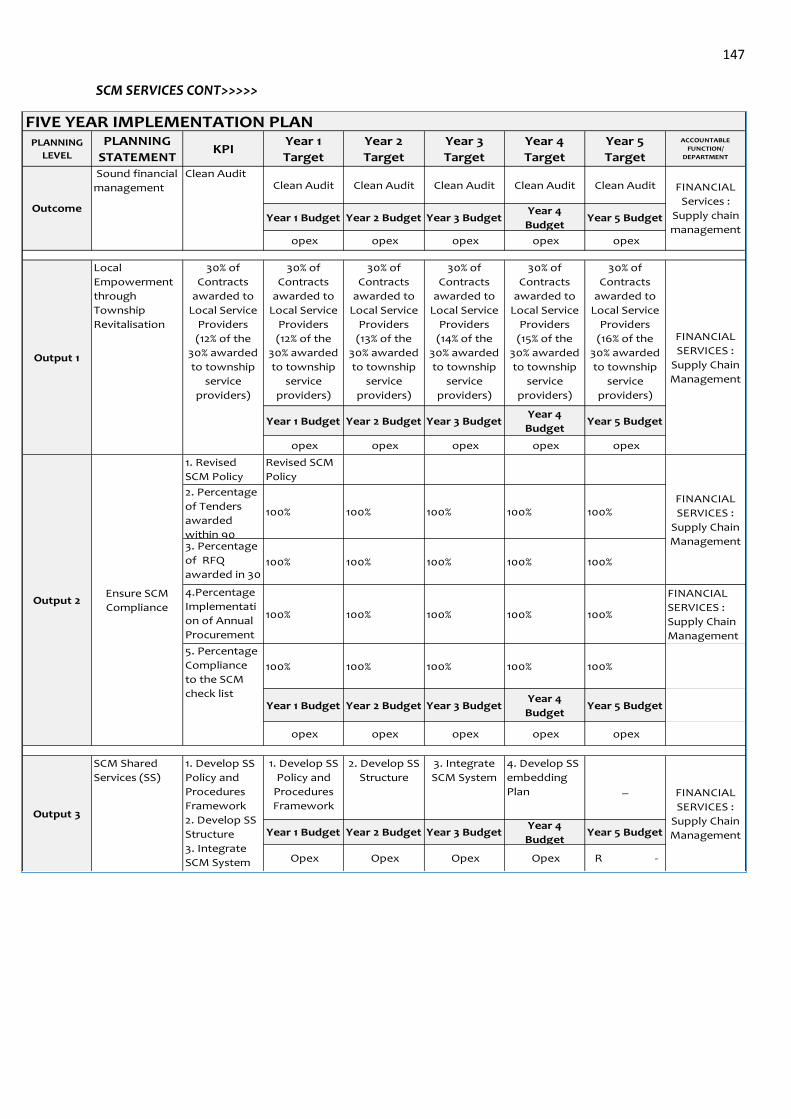
147
SCM SERVICES CONT>>>>>
PLANNING
LEVEL
PLANNING
STATEMENTKPI
Year 1
Target
Year 2
Target
Year 3
Target
Year 4
Target
Year 5
Target
ACCOUNTABLE
FUNCTION/
DEPARTMENT
Clean Audit Clean Audit Clean Audit Clean Audit Clean Audit
Year 1 Budget Year 2 Budget Year 3 BudgetYear 4
BudgetYear 5 Budget
opex opex opex opex opex
30% of
Contracts
awarded to
Local Service
Providers
(12% of the
30% awarded
to township
service
providers)
30% of
Contracts
awarded to
Local Service
Providers
(13% of the
30% awarded
to township
service
providers)
30% of
Contracts
awarded to
Local Service
Providers
(14% of the
30% awarded
to township
service
providers)
30% of
Contracts
awarded to
Local Service
Providers
(15% of the
30% awarded
to township
service
providers)
30% of
Contracts
awarded to
Local Service
Providers
(16% of the
30% awarded
to township
service
providers)
Year 1 Budget Year 2 Budget Year 3 BudgetYear 4
BudgetYear 5 Budget
opex opex opex opex opex
1. Revised
SCM Policy
Revised SCM
Policy
2. Percentage
of Tenders
awarded
within 90
100% 100% 100% 100% 100%
3. Percentage
of RFQ
awarded in 30
working days
100% 100% 100% 100% 100%
4.Percentage
Implementati
on of Annual
Procurement
Plan
100% 100% 100% 100% 100%
FINANCIAL
SERVICES :
Supply Chain
Management
100% 100% 100% 100% 100%
Year 1 Budget Year 2 Budget Year 3 BudgetYear 4
BudgetYear 5 Budget
opex opex opex opex opex
1. Develop SS
Policy and
Procedures
Framework
2. Develop SS
Structure
3. Integrate
SCM System
4. Develop SS
embedding
Plan _
Year 1 Budget Year 2 Budget Year 3 BudgetYear 4
BudgetYear 5 Budget
Opex Opex Opex Opex R -
FINANCIAL
SERVICES :
Supply Chain
Management
FIVE YEAR IMPLEMENTATION PLAN
FINANCIAL
Services :
Supply chain
management
Output 1
Local
Empowerment
through
Township
Revitalisation
30% of
Contracts
awarded to
Local Service
Providers
(12% of the
30% awarded
to township
service
providers)
FINANCIAL
SERVICES :
Supply Chain
Management
Outcome
Sound financial
management
Clean Audit
Ensure SCM
Compliance
FINANCIAL
SERVICES :
Supply Chain
Management
5. Percentage
Compliance
to the SCM
check list
Output 2
Output 3
SCM Shared
Services (SS)
1. Develop SS
Policy and
Procedures
Framework
2. Develop SS
Structure
3. Integrate
SCM System
4. Develop SS
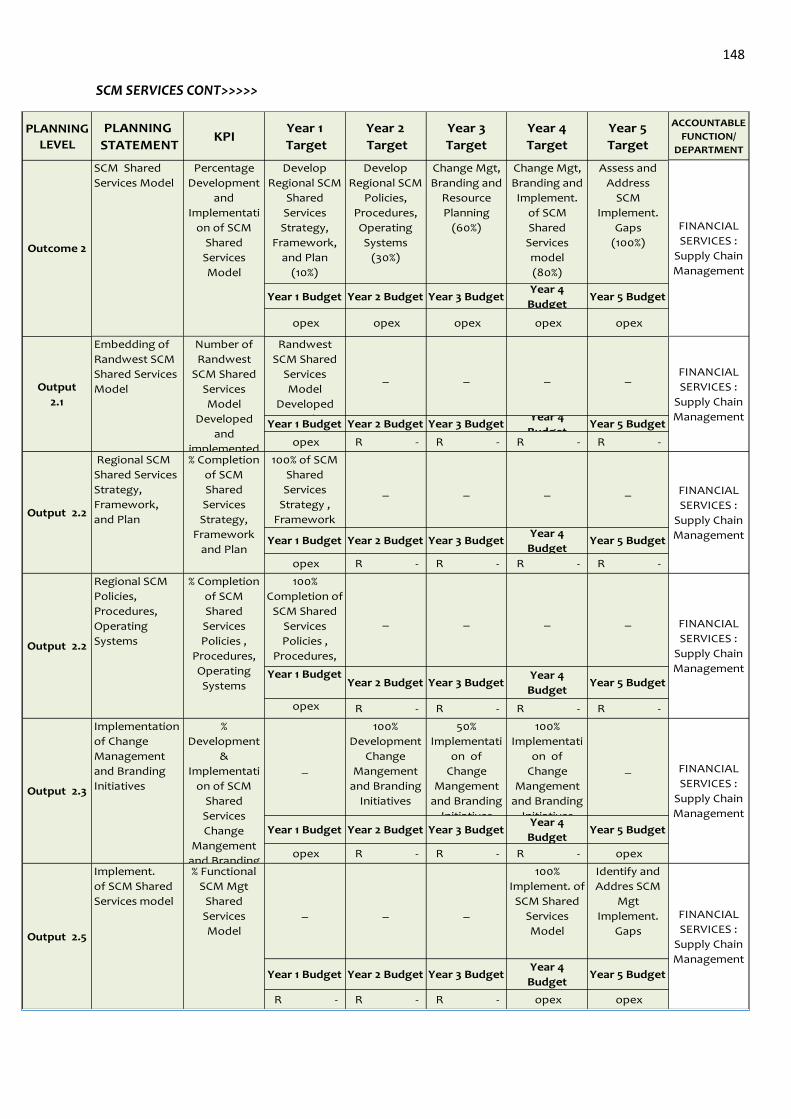
148
SCM SERVICES CONT>>>>>
PLANNING
LEVEL
PLANNING
STATEMENTKPI
Year 1
Target
Year 2
Target
Year 3
Target
Year 4
Target
Year 5
Target
ACCOUNTABLE
FUNCTION/
DEPARTMENT
Develop
Regional SCM
Shared
Services
Strategy,
Framework,
and Plan
(10%)
Develop
Regional SCM
Policies,
Procedures,
Operating
Systems
(30%)
Change Mgt,
Branding and
Resource
Planning
(60%)
Change Mgt,
Branding and
Implement.
of SCM
Shared
Services
model
(80%)
Assess and
Address
SCM
Implement.
Gaps
(100%)
Year 1 Budget Year 2 Budget Year 3 BudgetYear 4
BudgetYear 5 Budget
opex opex opex opex opex
Randwest
SCM Shared
Services
Model
Developed
and
_ _ _ _
Year 1 Budget Year 2 Budget Year 3 BudgetYear 4
BudgetYear 5 Budget
opex R - R - R - R -
100% of SCM
Shared
Services
Strategy ,
Framework
and Plan
_ _ _ _
Year 1 Budget Year 2 Budget Year 3 BudgetYear 4
BudgetYear 5 Budget
opex R - R - R - R -
100%
Completion of
SCM Shared
Services
Policies ,
Procedures,
Operating
_ _ _ _
Year 1 BudgetYear 2 Budget Year 3 Budget
Year 4
BudgetYear 5 Budget
opex R - R - R - R -
_
100%
Development
Change
Mangement
and Branding
Initiatives
50%
Implementati
on of
Change
Mangement
and Branding
Initiatives
100%
Implementati
on of
Change
Mangement
and Branding
Initiatives
_
Year 1 Budget Year 2 Budget Year 3 BudgetYear 4
BudgetYear 5 Budget
opex R - R - R - opex
_ _ _
100%
Implement. of
SCM Shared
Services
Model
Identify and
Addres SCM
Mgt
Implement.
Gaps
Year 1 Budget Year 2 Budget Year 3 BudgetYear 4
BudgetYear 5 Budget
R - R - R - opex opex
FINANCIAL
SERVICES :
Supply Chain
Management
Output
2.1
Embedding of
Randwest SCM
Shared Services
Model
Number of
Randwest
SCM Shared
Services
Model
Developed
and
implemented
FINANCIAL
SERVICES :
Supply Chain
Management
Output 2.2
Regional SCM
Shared Services
Strategy,
Framework,
and Plan
% Completion
of SCM
Shared
Services
Strategy,
Framework
and Plan
FINANCIAL
SERVICES :
Supply Chain
Management
FINANCIAL
SERVICES :
Supply Chain
Management
Output 2.2
Regional SCM
Policies,
Procedures,
Operating
Systems
% Completion
of SCM
Shared
Services
Policies ,
Procedures,
Operating
Systems
FINANCIAL
SERVICES :
Supply Chain
Management
Output 2.3
Implementation
of Change
Management
and Branding
Initiatives
%
Development
&
Implementati
on of SCM
Shared
Services
Change
Mangement
and Branding
FINANCIAL
SERVICES :
Supply Chain
Management
Output 2.5
Implement.
of SCM Shared
Services model
% Functional
SCM Mgt
Shared
Services
Model
Outcome 2
SCM Shared
Services Model
Percentage
Development
and
Implementati
on of SCM
Shared
Services
Model
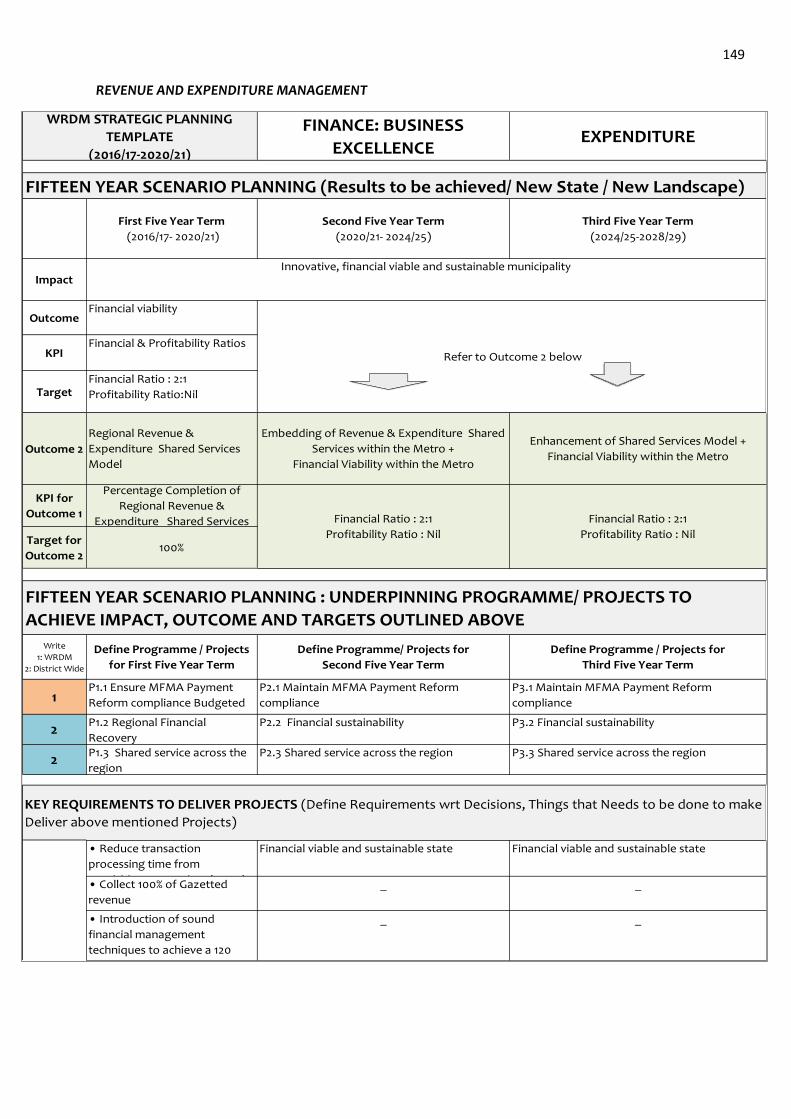
149
REVENUE AND EXPENDITURE MANAGEMENT
FIFTEEN YEAR SCENARIO PLANNING (Results to be achieved/ New State / New Landscape)
Impact
Outcome
KPI
Target
Outcome 2
KPI for
Outcome 1
Target for
Outcome 2
Write
1: WRDM
2: District Wide
1
2
2
Financial & Profitability Ratios
P1.1 Ensure MFMA Payment
Reform compliance Budgeted
expenditure
P2.1 Maintain MFMA Payment Reform
compliance
P3.1 Maintain MFMA Payment Reform
compliance
FIFTEEN YEAR SCENARIO PLANNING : UNDERPINNING PROGRAMME/ PROJECTS TO
ACHIEVE IMPACT, OUTCOME AND TARGETS OUTLINED ABOVE
P1.2 Regional Financial
Recovery
P2.2 Financial sustainability P3.2 Financial sustainability
Financial Ratio : 2:1
Profitability Ratio:Nil
Define Programme / Projects
for First Five Year Term
Define Programme/ Projects for
Second Five Year Term
Define Programme / Projects for
Third Five Year Term
WRDM STRATEGIC PLANNING
TEMPLATE
(2016/17-2020/21)
FINANCE: BUSINESS
EXCELLENCEEXPENDITURE
First Five Year Term
(2016/17- 2020/21)
Second Five Year Term
(2020/21- 2024/25)
Third Five Year Term
(2024/25-2028/29)
Financial viability
Innovative, financial viable and sustainable municipality
_ _
Regional Revenue &
Expenditure Shared Services
Model
Embedding of Revenue & Expenditure Shared
Services within the Metro +
Financial Viability within the Metro
Enhancement of Shared Services Model +
Financial Viability within the Metro
Percentage Completion of
Regional Revenue &
Expenditure Shared Services Financial Ratio : 2:1
Profitability Ratio : Nil
Financial Ratio : 2:1
Profitability Ratio : Nil100%
KEY REQUIREMENTS TO DELIVER PROJECTS (Define Requirements wrt Decisions, Things that Needs to be done to make
Deliver above mentioned Projects)
• Reduce transaction
processing time from
requisition processing through
Financial viable and sustainable state Financial viable and sustainable state
• Collect 100% of Gazetted
revenue
_ _
• Introduction of sound
financial management
techniques to achieve a 120
days solvent state
P1.3 Shared service across the
region
P2.3 Shared service across the region P3.3 Shared service across the region
Refer to Outcome 2 below
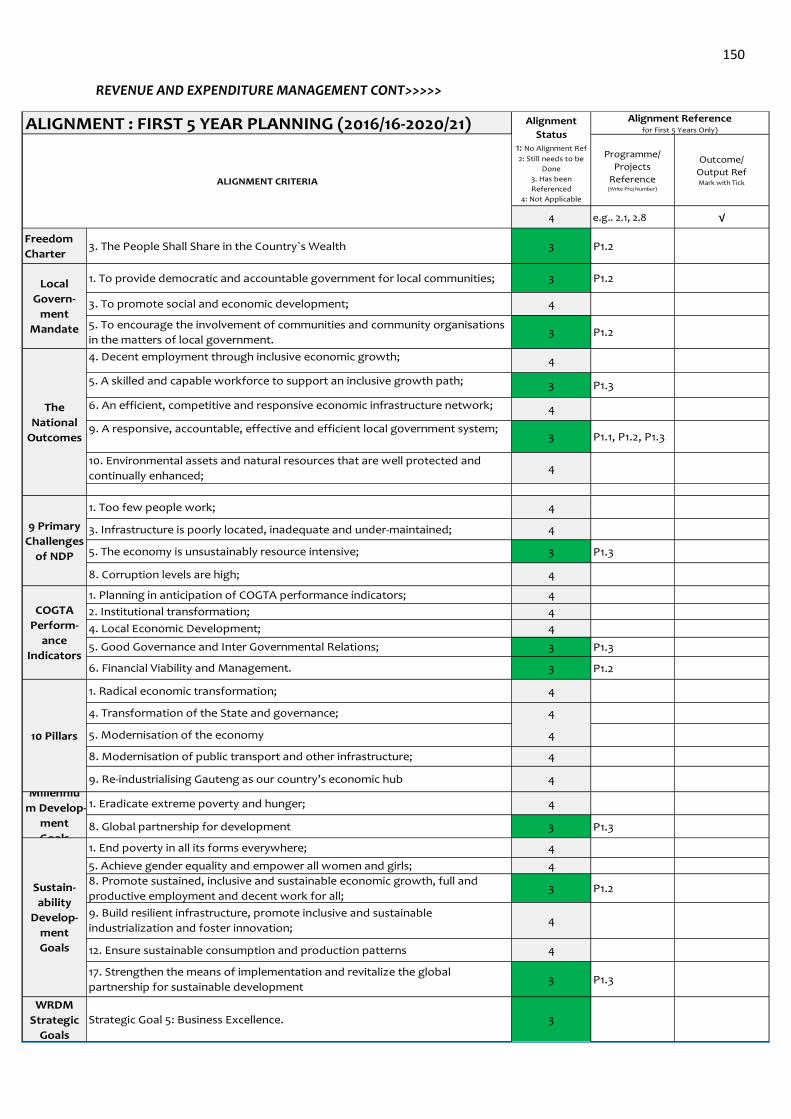
150
REVENUE AND EXPENDITURE MANAGEMENT CONT>>>>>
ALIGNMENT : FIRST 5 YEAR PLANNING (2016/16-2020/21)
Programme/
Projects
Reference(Write Proj Number)
Outcome/
Output RefMark with Tick
4 e.g.. 2.1, 2.8 √
Freedom
Charter3 P1.2
3 P1.2
4
3 P1.2
4
3 P1.3
4
3 P1.1, P1.2, P1.3
4
4
4
3 P1.3
4
4
4
4
3 P1.3
3 P1.2
4
4
4
4
4
4
3 P1.3
4
4
3 P1.2
4
4
3 P1.3
WRDM
Strategic
Goals
3Strategic Goal 5: Business Excellence.
9 Primary
Challenges
of NDP
COGTA
Perform-
ance
Indicators
10 Pillars
1. End poverty in all its forms everywhere;
5. Achieve gender equality and empower all women and girls;
8. Promote sustained, inclusive and sustainable economic growth, full and
productive employment and decent work for all;
9. Build resilient infrastructure, promote inclusive and sustainable
industrialization and foster innovation;
12. Ensure sustainable consumption and production patterns
17. Strengthen the means of implementation and revitalize the global
partnership for sustainable development
Millenniu
m Develop-
ment
Goals
1. Eradicate extreme poverty and hunger;
8. Global partnership for development
Sustain-
ability
Develop-
ment
Goals
10. Environmental assets and natural resources that are well protected and
continually enhanced;
1. Radical economic transformation;
4. Transformation of the State and governance;
5. Modernisation of the economy
8. Modernisation of public transport and other infrastructure;
9. Re-industrialising Gauteng as our country’s economic hub
1. Planning in anticipation of COGTA performance indicators;
2. Institutional transformation;
4. Local Economic Development;
5. Good Governance and Inter Governmental Relations;
6. Financial Viability and Management.
Local
Govern-
ment
Mandate
1. To provide democratic and accountable government for local communities;
Alignment
Status1: No Alignment Ref
2: Still needs to be
Done
3. Has been
Referenced
4: Not Applicable
Alignment Referencefor First 5 Years Only)
ALIGNMENT CRITERIA
3. To promote social and economic development;
5. To encourage the involvement of communities and community organisations
in the matters of local government.
3. The People Shall Share in the Country`s Wealth
1. Too few people work;
3. Infrastructure is poorly located, inadequate and under-maintained;
5. The economy is unsustainably resource intensive;
8. Corruption levels are high;
The
National
Outcomes
4. Decent employment through inclusive economic growth;
5. A skilled and capable workforce to support an inclusive growth path;
6. An efficient, competitive and responsive economic infrastructure network;
9. A responsive, accountable, effective and efficient local government system;
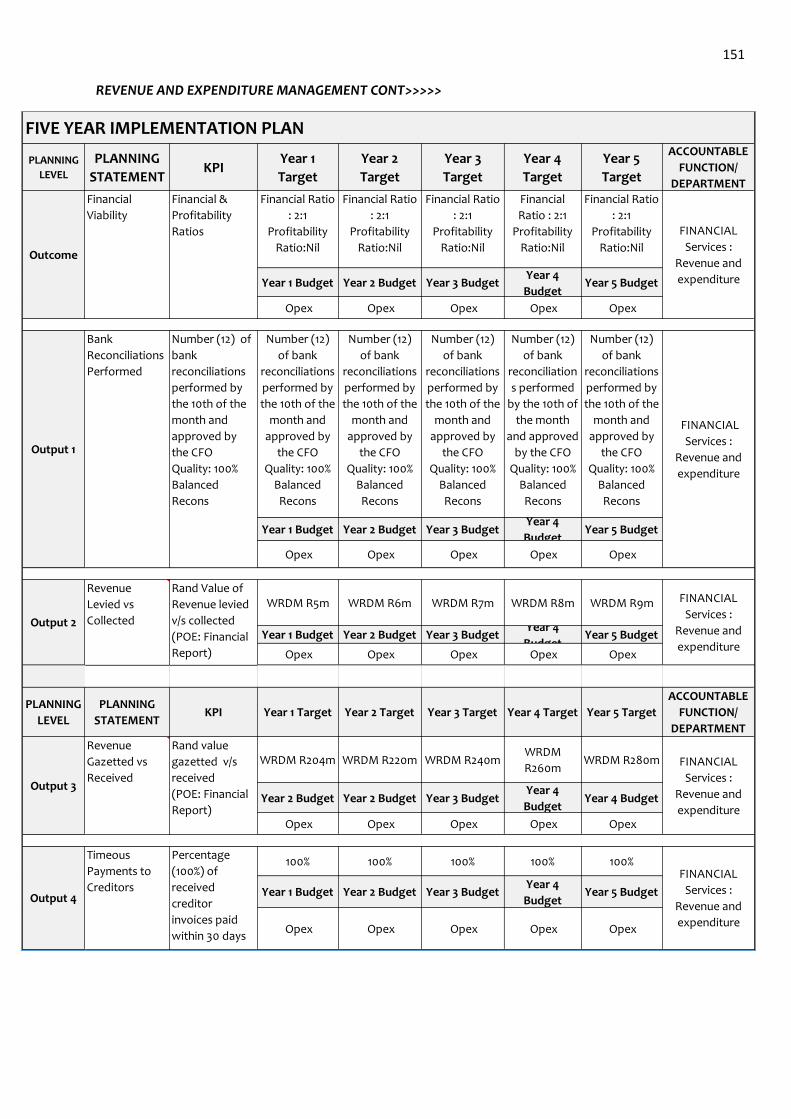
151
REVENUE AND EXPENDITURE MANAGEMENT CONT>>>>>
PLANNING
LEVEL
PLANNING
STATEMENTKPI
Year 1
Target
Year 2
Target
Year 3
Target
Year 4
Target
Year 5
Target
ACCOUNTABLE
FUNCTION/
DEPARTMENTFinancial Ratio
: 2:1
Profitability
Ratio:Nil
Financial Ratio
: 2:1
Profitability
Ratio:Nil
Financial Ratio
: 2:1
Profitability
Ratio:Nil
Financial
Ratio : 2:1
Profitability
Ratio:Nil
Financial Ratio
: 2:1
Profitability
Ratio:Nil
Year 1 Budget Year 2 Budget Year 3 BudgetYear 4
BudgetYear 5 Budget
Opex Opex Opex Opex Opex
Number (12)
of bank
reconciliations
performed by
the 10th of the
month and
approved by
the CFO
Quality: 100%
Balanced
Recons
Number (12)
of bank
reconciliations
performed by
the 10th of the
month and
approved by
the CFO
Quality: 100%
Balanced
Recons
Number (12)
of bank
reconciliations
performed by
the 10th of the
month and
approved by
the CFO
Quality: 100%
Balanced
Recons
Number (12)
of bank
reconciliation
s performed
by the 10th of
the month
and approved
by the CFO
Quality: 100%
Balanced
Recons
Number (12)
of bank
reconciliations
performed by
the 10th of the
month and
approved by
the CFO
Quality: 100%
Balanced
Recons
Year 1 Budget Year 2 Budget Year 3 BudgetYear 4
BudgetYear 5 Budget
Opex Opex Opex Opex Opex
WRDM R5m WRDM R6m WRDM R7m WRDM R8m WRDM R9m
Year 1 Budget Year 2 Budget Year 3 BudgetYear 4
BudgetYear 5 Budget
Opex Opex Opex Opex Opex
PLANNING
LEVEL
PLANNING
STATEMENTKPI Year 1 Target Year 2 Target Year 3 Target Year 4 Target Year 5 Target
ACCOUNTABLE
FUNCTION/
DEPARTMENT
WRDM R204m WRDM R220m WRDM R240mWRDM
R260mWRDM R280m
Year 2 Budget Year 2 Budget Year 3 BudgetYear 4
BudgetYear 4 Budget
Opex Opex Opex Opex Opex
100% 100% 100% 100% 100%
Year 1 Budget Year 2 Budget Year 3 BudgetYear 4
BudgetYear 5 Budget
Opex Opex Opex Opex Opex
Output 4
Timeous
Payments to
Creditors
Percentage
(100%) of
received
creditor
invoices paid
within 30 days
FINANCIAL
Services :
Revenue and
expenditure
Output 2
Revenue
Levied vs
Collected
Rand Value of
Revenue levied
v/s collected
(POE: Financial
Report)
FINANCIAL
Services :
Revenue and
expenditure
Output 3
Revenue
Gazetted vs
Received
Rand value
gazetted v/s
received
(POE: Financial
Report)
FINANCIAL
Services :
Revenue and
expenditure
Output 1
Bank
Reconciliations
Performed
Number (12) of
bank
reconciliations
performed by
the 10th of the
month and
approved by
the CFO
Quality: 100%
Balanced
Recons
FINANCIAL
Services :
Revenue and
expenditure
FIVE YEAR IMPLEMENTATION PLAN
Outcome
Financial
Viability
Financial &
Profitability
Ratios FINANCIAL
Services :
Revenue and
expenditure
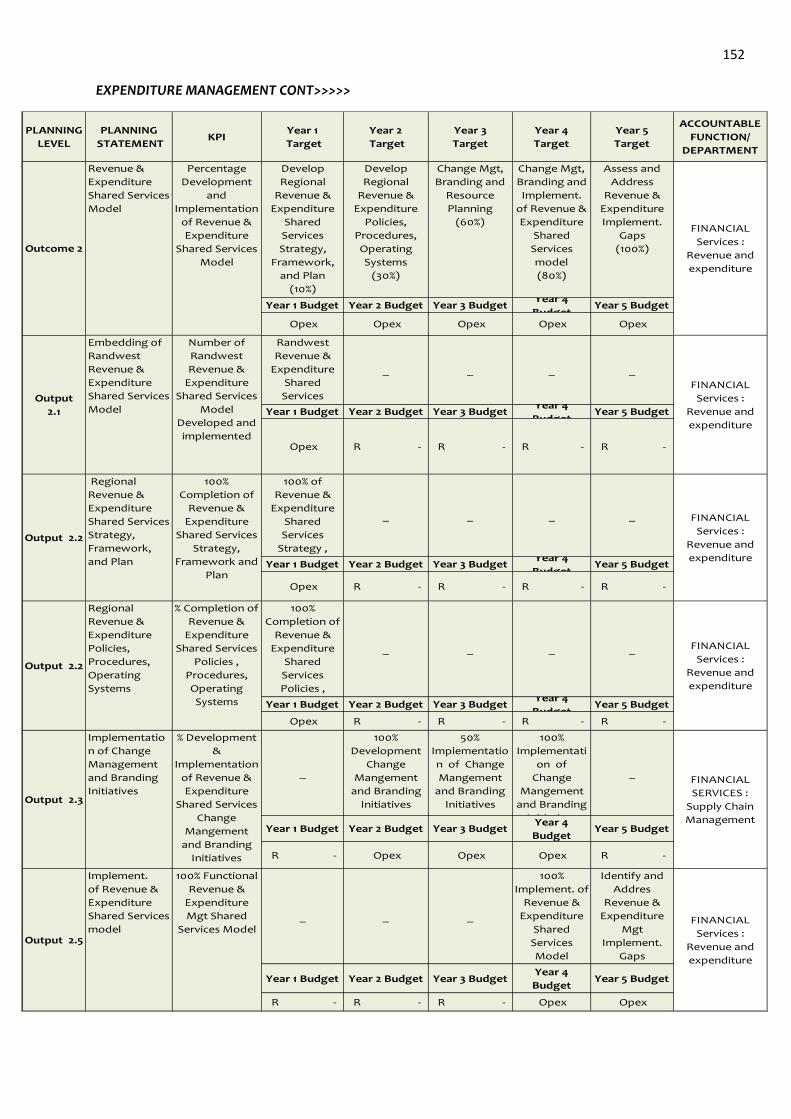
152
EXPENDITURE MANAGEMENT CONT>>>>>
PLANNING
LEVEL
PLANNING
STATEMENTKPI
Year 1
Target
Year 2
Target
Year 3
Target
Year 4
Target
Year 5
Target
ACCOUNTABLE
FUNCTION/
DEPARTMENT
Develop
Regional
Revenue &
Expenditure
Shared
Services
Strategy,
Framework,
and Plan
(10%)
Develop
Regional
Revenue &
Expenditure
Policies,
Procedures,
Operating
Systems
(30%)
Change Mgt,
Branding and
Resource
Planning
(60%)
Change Mgt,
Branding and
Implement.
of Revenue &
Expenditure
Shared
Services
model
(80%)
Assess and
Address
Revenue &
Expenditure
Implement.
Gaps
(100%)
Year 1 Budget Year 2 Budget Year 3 BudgetYear 4
BudgetYear 5 Budget
Opex Opex Opex Opex Opex
Randwest
Revenue &
Expenditure
Shared
Services
Model
_ _ _ _
Year 1 Budget Year 2 Budget Year 3 BudgetYear 4
BudgetYear 5 Budget
Opex R - R - R - R -
100% of
Revenue &
Expenditure
Shared
Services
Strategy ,
Framework
_ _ _ _
Year 1 Budget Year 2 Budget Year 3 BudgetYear 4
BudgetYear 5 Budget
Opex R - R - R - R -
100%
Completion of
Revenue &
Expenditure
Shared
Services
Policies ,
Procedures,
_ _ _ _
Year 1 Budget Year 2 Budget Year 3 BudgetYear 4
BudgetYear 5 Budget
Opex R - R - R - R -
_
100%
Development
Change
Mangement
and Branding
Initiatives
50%
Implementatio
n of Change
Mangement
and Branding
Initiatives
100%
Implementati
on of
Change
Mangement
and Branding
Initiatives
_
Year 1 Budget Year 2 Budget Year 3 BudgetYear 4
BudgetYear 5 Budget
R - Opex Opex Opex R -
_ _ _
100%
Implement. of
Revenue &
Expenditure
Shared
Services
Model
Identify and
Addres
Revenue &
Expenditure
Mgt
Implement.
Gaps
Year 1 Budget Year 2 Budget Year 3 BudgetYear 4
BudgetYear 5 Budget
R - R - R - Opex Opex
FINANCIAL
Services :
Revenue and
expenditure
Output 2.2
Regional
Revenue &
Expenditure
Shared Services
Strategy,
Framework,
and Plan
100%
Completion of
Revenue &
Expenditure
Shared Services
Strategy,
Framework and
Plan
FINANCIAL
Services :
Revenue and
expenditure
Output 2.5
Implement.
of Revenue &
Expenditure
Shared Services
model
100% Functional
Revenue &
Expenditure
Mgt Shared
Services ModelFINANCIAL
Services :
Revenue and
expenditure
Output 2.2
Regional
Revenue &
Expenditure
Policies,
Procedures,
Operating
Systems
% Completion of
Revenue &
Expenditure
Shared Services
Policies ,
Procedures,
Operating
Systems
FINANCIAL
Services :
Revenue and
expenditure
Output 2.3
Implementatio
n of Change
Management
and Branding
Initiatives
% Development
&
Implementation
of Revenue &
Expenditure
Shared Services
Change
Mangement
and Branding
Initiatives
FINANCIAL
SERVICES :
Supply Chain
Management
Outcome 2
Revenue &
Expenditure
Shared Services
Model
Percentage
Development
and
Implementation
of Revenue &
Expenditure
Shared Services
Model
FINANCIAL
Services :
Revenue and
expenditure
Output
2.1
Embedding of
Randwest
Revenue &
Expenditure
Shared Services
Model
Number of
Randwest
Revenue &
Expenditure
Shared Services
Model
Developed and
implemented
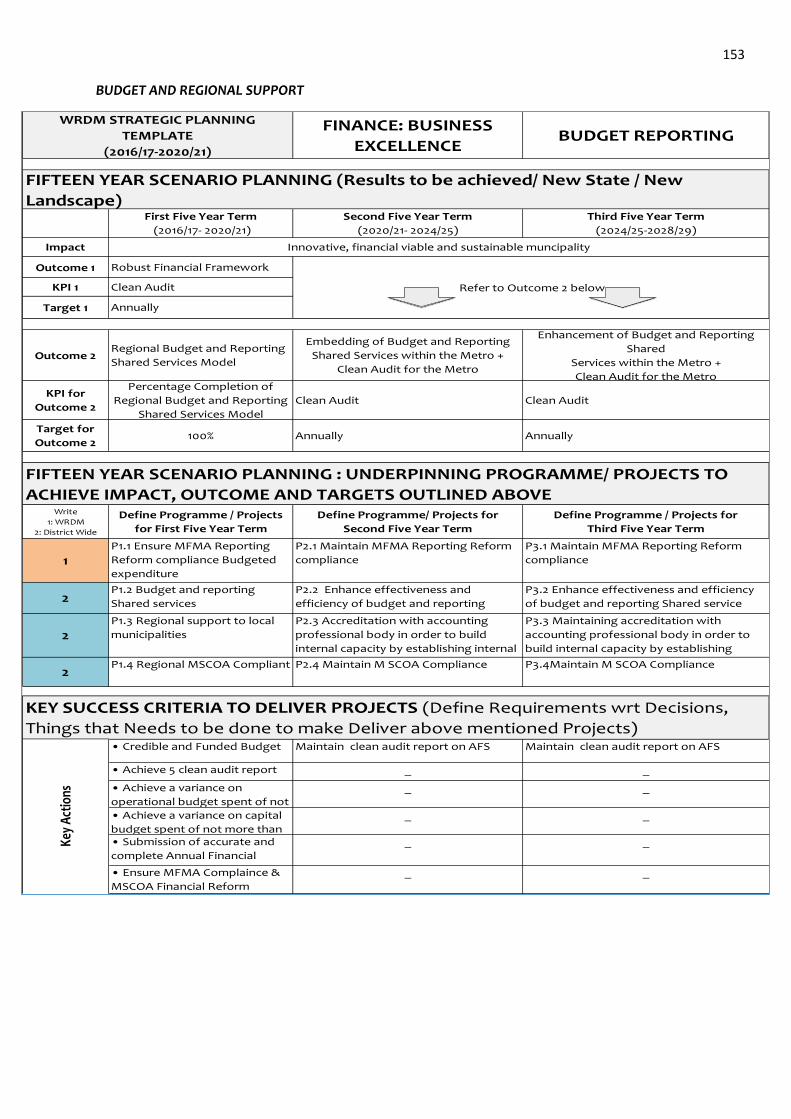
153
BUDGET AND REGIONAL SUPPORT
Impact
Outcome 1
KPI 1
Target 1
Outcome 2
KPI for
Outcome 2
Target for
Outcome 2
Write
1: WRDM
2: District Wide
1
2
2
2
• Ensure MFMA Complaince &
MSCOA Financial Reform
_ _
P1.3 Regional support to local
municipalities
P2.3 Accreditation with accounting
professional body in order to build
internal capacity by establishing internal
training facility.
P3.3 Maintaining accreditation with
accounting professional body in order to
build internal capacity by establishing
internal training facility.
_ _
• Achieve a variance on capital
budget spent of not more than
_ _
• Submission of accurate and
complete Annual Financial
Statements to AGSA on time
_ _
KEY SUCCESS CRITERIA TO DELIVER PROJECTS (Define Requirements wrt Decisions,
Things that Needs to be done to make Deliver above mentioned Projects)
Key
Actio
ns
• Credible and Funded Budget Maintain clean audit report on AFS Maintain clean audit report on AFS
• Achieve 5 clean audit report _ _
• Achieve a variance on
operational budget spent of not
FIFTEEN YEAR SCENARIO PLANNING : UNDERPINNING PROGRAMME/ PROJECTS TO
ACHIEVE IMPACT, OUTCOME AND TARGETS OUTLINED ABOVE
Regional Budget and Reporting
Shared Services Model
Embedding of Budget and Reporting
Shared Services within the Metro +
Clean Audit for the Metro
Enhancement of Budget and Reporting
Shared
Services within the Metro +
Clean Audit for the MetroPercentage Completion of
Regional Budget and Reporting
Shared Services Model
100%
Clean Audit
Annually Annually
Clean Audit
WRDM STRATEGIC PLANNING
TEMPLATE
(2016/17-2020/21)
FINANCE: BUSINESS
EXCELLENCEBUDGET REPORTING
First Five Year Term
(2016/17- 2020/21)
Second Five Year Term
(2020/21- 2024/25)
Third Five Year Term
(2024/25-2028/29)
Robust Financial Framework
Innovative, financial viable and sustainable muncipality
FIFTEEN YEAR SCENARIO PLANNING (Results to be achieved/ New State / New
Landscape)
Refer to Outcome 2 below
P1.4 Regional MSCOA Compliant P2.4 Maintain M SCOA Compliance P3.4Maintain M SCOA Compliance
Clean Audit
P1.1 Ensure MFMA Reporting
Reform compliance Budgeted
expenditure
P2.1 Maintain MFMA Reporting Reform
compliance
P3.1 Maintain MFMA Reporting Reform
compliance
P1.2 Budget and reporting
Shared services
P2.2 Enhance effectiveness and
efficiency of budget and reporting
Shared service
P3.2 Enhance effectiveness and efficiency
of budget and reporting Shared service
Annually
Define Programme / Projects
for First Five Year Term
Define Programme/ Projects for
Second Five Year Term
Define Programme / Projects for
Third Five Year Term
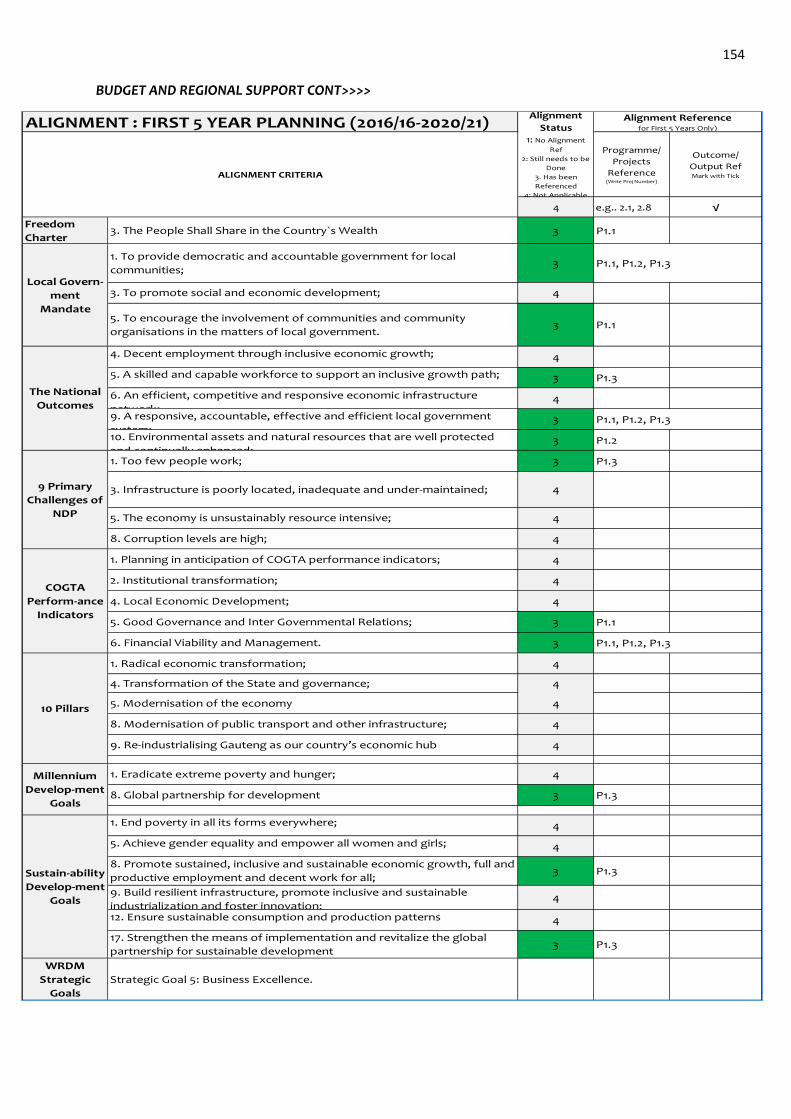
154
BUDGET AND REGIONAL SUPPORT CONT>>>>
ALIGNMENT : FIRST 5 YEAR PLANNING (2016/16-2020/21)
Programme/
Projects
Reference(Write Proj Number)
Outcome/
Output RefMark with Tick
4 e.g.. 2.1, 2.8 √
Freedom
Charter3 P1.1
3 P1.1, P1.2, P1.3
4
3 P1.1
4
3 P1.3
4
3 P1.1, P1.2, P1.3
3 P1.2
3 P1.3
4
4
4
4
4
4
3 P1.1
3 P1.1, P1.2, P1.3
4
4
4
4
4
4
3 P1.3
4
4
3 P1.3
4
4
3 P1.3
WRDM
Strategic
Goals
Strategic Goal 5: Business Excellence.
1. End poverty in all its forms everywhere;
5. Achieve gender equality and empower all women and girls;
8. Promote sustained, inclusive and sustainable economic growth, full and
productive employment and decent work for all;
9. Build resilient infrastructure, promote inclusive and sustainable
industrialization and foster innovation;12. Ensure sustainable consumption and production patterns
17. Strengthen the means of implementation and revitalize the global
partnership for sustainable development
Millennium
Develop-ment
Goals
1. Eradicate extreme poverty and hunger;
8. Global partnership for development
Sustain-ability
Develop-ment
Goals
COGTA
Perform-ance
Indicators
9 Primary
Challenges of
NDP
10 Pillars
1. Radical economic transformation;
4. Transformation of the State and governance;
5. Modernisation of the economy
8. Modernisation of public transport and other infrastructure;
9. Re-industrialising Gauteng as our country’s economic hub
1. Planning in anticipation of COGTA performance indicators;
2. Institutional transformation;
4. Local Economic Development;
5. Good Governance and Inter Governmental Relations;
6. Financial Viability and Management.
1. Too few people work;
3. Infrastructure is poorly located, inadequate and under-maintained;
5. The economy is unsustainably resource intensive;
8. Corruption levels are high;
4. Decent employment through inclusive economic growth;
5. A skilled and capable workforce to support an inclusive growth path;
6. An efficient, competitive and responsive economic infrastructure
network;9. A responsive, accountable, effective and efficient local government
system;10. Environmental assets and natural resources that are well protected
and continually enhanced;
1. To provide democratic and accountable government for local
communities;
3. To promote social and economic development;
5. To encourage the involvement of communities and community
organisations in the matters of local government.
3. The People Shall Share in the Country`s Wealth
The National
Outcomes
Local Govern-
ment
Mandate
Alignment
Status1: No Alignment
Ref
2: Still needs to be
Done
3. Has been
Referenced
4: Not Applicable
Alignment Referencefor First 5 Years Only)
ALIGNMENT CRITERIA
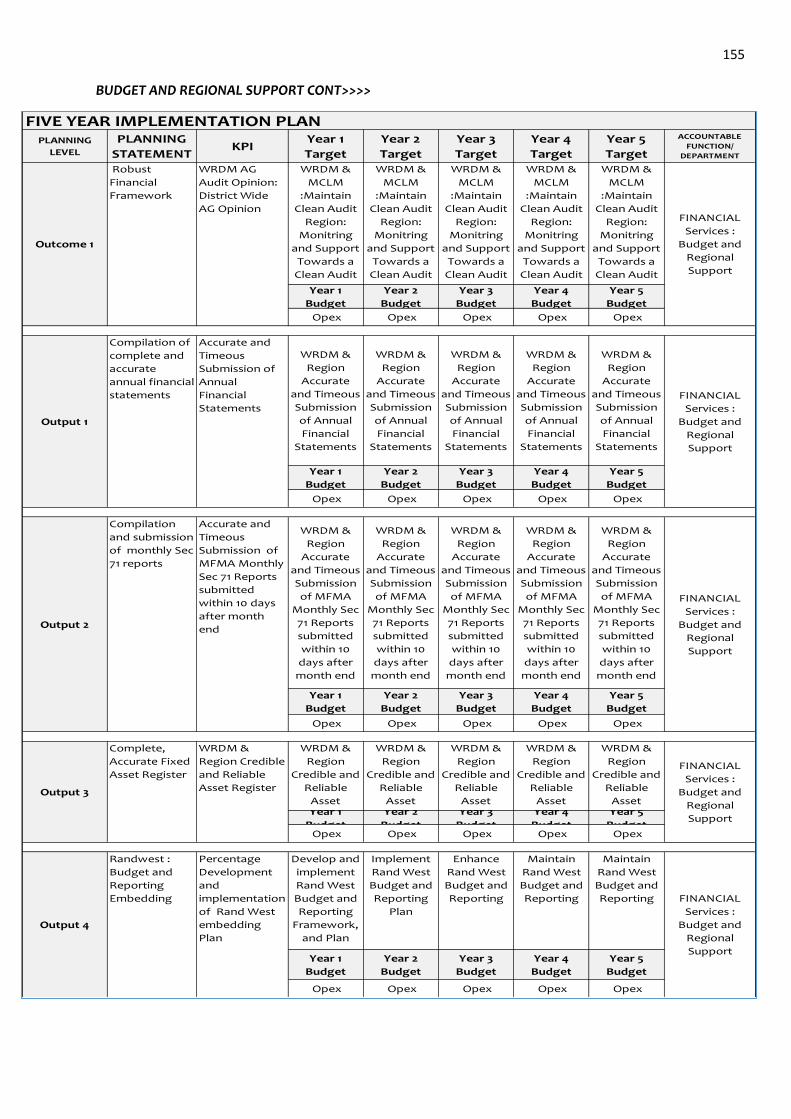
155
BUDGET AND REGIONAL SUPPORT CONT>>>>
PLANNING
LEVEL
PLANNING
STATEMENTKPI
Year 1
Target
Year 2
Target
Year 3
Target
Year 4
Target
Year 5
Target
ACCOUNTABLE
FUNCTION/
DEPARTMENT
WRDM &
MCLM
:Maintain
Clean Audit
Region:
Monitring
and Support
Towards a
Clean Audit
WRDM &
MCLM
:Maintain
Clean Audit
Region:
Monitring
and Support
Towards a
Clean Audit
WRDM &
MCLM
:Maintain
Clean Audit
Region:
Monitring
and Support
Towards a
Clean Audit
WRDM &
MCLM
:Maintain
Clean Audit
Region:
Monitring
and Support
Towards a
Clean Audit
WRDM &
MCLM
:Maintain
Clean Audit
Region:
Monitring
and Support
Towards a
Clean Audit
Year 1
Budget
Year 2
Budget
Year 3
Budget
Year 4
Budget
Year 5
Budget
Opex Opex Opex Opex Opex
WRDM &
Region
Accurate
and Timeous
Submission
of Annual
Financial
Statements
WRDM &
Region
Accurate
and Timeous
Submission
of Annual
Financial
Statements
WRDM &
Region
Accurate
and Timeous
Submission
of Annual
Financial
Statements
WRDM &
Region
Accurate
and Timeous
Submission
of Annual
Financial
Statements
WRDM &
Region
Accurate
and Timeous
Submission
of Annual
Financial
Statements
Year 1
Budget
Year 2
Budget
Year 3
Budget
Year 4
Budget
Year 5
Budget
Opex Opex Opex Opex Opex
WRDM &
Region
Accurate
and Timeous
Submission
of MFMA
Monthly Sec
71 Reports
submitted
within 10
days after
month end
WRDM &
Region
Accurate
and Timeous
Submission
of MFMA
Monthly Sec
71 Reports
submitted
within 10
days after
month end
WRDM &
Region
Accurate
and Timeous
Submission
of MFMA
Monthly Sec
71 Reports
submitted
within 10
days after
month end
WRDM &
Region
Accurate
and Timeous
Submission
of MFMA
Monthly Sec
71 Reports
submitted
within 10
days after
month end
WRDM &
Region
Accurate
and Timeous
Submission
of MFMA
Monthly Sec
71 Reports
submitted
within 10
days after
month end
Year 1
Budget
Year 2
Budget
Year 3
Budget
Year 4
Budget
Year 5
Budget
Opex Opex Opex Opex Opex
WRDM &
Region
Credible and
Reliable
Asset
Register
WRDM &
Region
Credible and
Reliable
Asset
Register
WRDM &
Region
Credible and
Reliable
Asset
Register
WRDM &
Region
Credible and
Reliable
Asset
Register
WRDM &
Region
Credible and
Reliable
Asset
RegisterYear 1
Budget
Year 2
Budget
Year 3
Budget
Year 4
Budget
Year 5
Budget Opex Opex Opex Opex Opex
Develop and
implement
Rand West
Budget and
Reporting
Framework,
and Plan
Implement
Rand West
Budget and
Reporting
Plan
Enhance
Rand West
Budget and
Reporting
Maintain
Rand West
Budget and
Reporting
Maintain
Rand West
Budget and
Reporting
Year 1
Budget
Year 2
Budget
Year 3
Budget
Year 4
Budget
Year 5
Budget
Opex Opex Opex Opex Opex
Output 4
Randwest :
Budget and
Reporting
Embedding
Percentage
Development
and
implementation
of Rand West
embedding
Plan
FINANCIAL
Services :
Budget and
Regional
Support
Output 2
Compilation
and submission
of monthly Sec
71 reports
Accurate and
Timeous
Submission of
MFMA Monthly
Sec 71 Reports
submitted
within 10 days
after month
end
FINANCIAL
Services :
Budget and
Regional
Support
Output 3
Complete,
Accurate Fixed
Asset Register
WRDM &
Region Credible
and Reliable
Asset Register
FINANCIAL
Services :
Budget and
Regional
Support
Output 1
Compilation of
complete and
accurate
annual financial
statements
Accurate and
Timeous
Submission of
Annual
Financial
Statements
FINANCIAL
Services :
Budget and
Regional
Support
FIVE YEAR IMPLEMENTATION PLAN
Outcome 1
Robust
Financial
Framework
WRDM AG
Audit Opinion:
District Wide
AG OpinionFINANCIAL
Services :
Budget and
Regional
Support
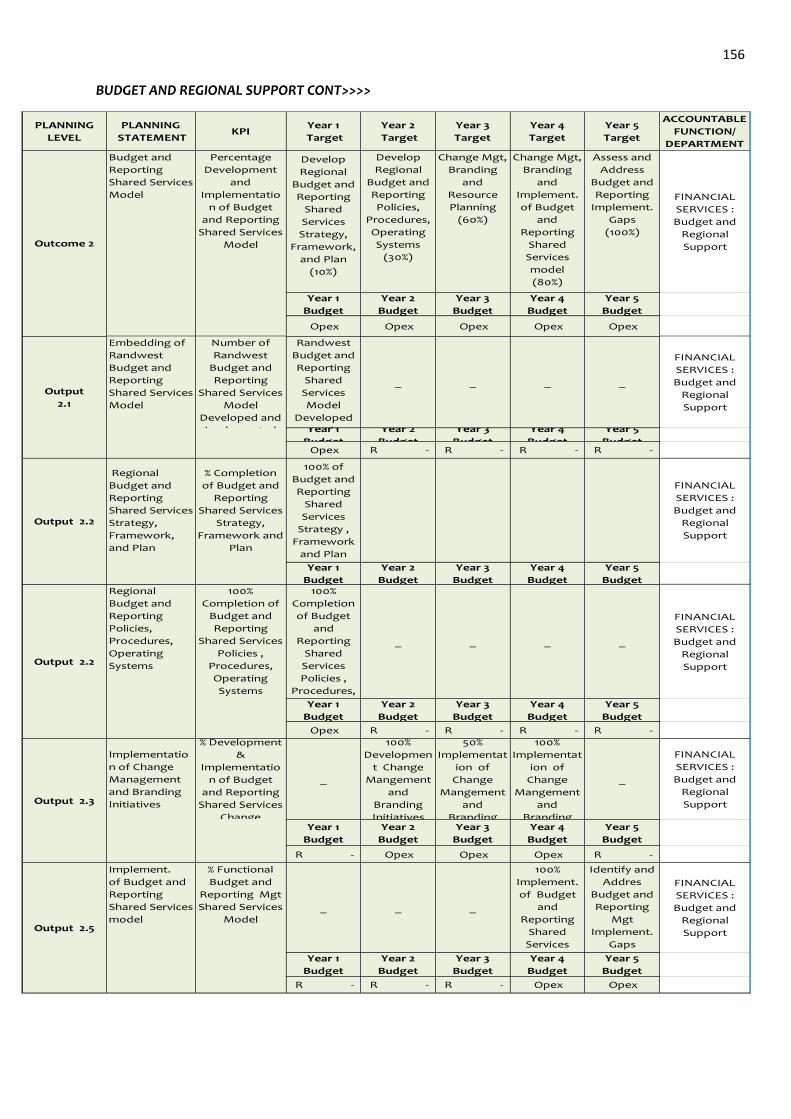
156
BUDGET AND REGIONAL SUPPORT CONT>>>>
PLANNING
LEVEL
PLANNING
STATEMENTKPI
Year 1
Target
Year 2
Target
Year 3
Target
Year 4
Target
Year 5
Target
ACCOUNTABLE
FUNCTION/
DEPARTMENT
Budget and
Reporting
Shared Services
Model
Percentage
Development
and
Implementatio
n of Budget
and Reporting
Shared Services
Model
Develop
Regional
Budget and
Reporting
Shared
Services
Strategy,
Framework,
and Plan
(10%)
Develop
Regional
Budget and
Reporting
Policies,
Procedures,
Operating
Systems
(30%)
Change Mgt,
Branding
and
Resource
Planning
(60%)
Change Mgt,
Branding
and
Implement.
of Budget
and
Reporting
Shared
Services
model
(80%)
Assess and
Address
Budget and
Reporting
Implement.
Gaps
(100%)
FINANCIAL
SERVICES :
Budget and
Regional
Support
Year 1
Budget
Year 2
Budget
Year 3
Budget
Year 4
Budget
Year 5
Budget
Opex Opex Opex Opex Opex
Embedding of
Randwest
Budget and
Reporting
Shared Services
Model
Number of
Randwest
Budget and
Reporting
Shared Services
Model
Developed and
implemented
Randwest
Budget and
Reporting
Shared
Services
Model
Developed
and
_ _ _ _
FINANCIAL
SERVICES :
Budget and
Regional
Support
Year 1
Budget
Year 2
Budget
Year 3
Budget
Year 4
Budget
Year 5
Budget Opex R - R - R - R -
Regional
Budget and
Reporting
Shared Services
Strategy,
Framework,
and Plan
% Completion
of Budget and
Reporting
Shared Services
Strategy,
Framework and
Plan
100% of
Budget and
Reporting
Shared
Services
Strategy ,
Framework
and Plan
FINANCIAL
SERVICES :
Budget and
Regional
Support
Year 1
Budget
Year 2
Budget
Year 3
Budget
Year 4
Budget
Year 5
BudgetRegional
Budget and
Reporting
Policies,
Procedures,
Operating
Systems
100%
Completion of
Budget and
Reporting
Shared Services
Policies ,
Procedures,
Operating
Systems
100%
Completion
of Budget
and
Reporting
Shared
Services
Policies ,
Procedures,
Operating
_ _ _ _
FINANCIAL
SERVICES :
Budget and
Regional
Support
Year 1
Budget
Year 2
Budget
Year 3
Budget
Year 4
Budget
Year 5
Budget
Opex R - R - R - R -
Implementatio
n of Change
Management
and Branding
Initiatives
% Development
&
Implementatio
n of Budget
and Reporting
Shared Services
Change
_
100%
Developmen
t Change
Mangement
and
Branding
Initiatives
50%
Implementat
ion of
Change
Mangement
and
Branding
100%
Implementat
ion of
Change
Mangement
and
Branding
_
FINANCIAL
SERVICES :
Budget and
Regional
Support
Year 1
Budget
Year 2
Budget
Year 3
Budget
Year 4
Budget
Year 5
Budget
R - Opex Opex Opex R -
Implement.
of Budget and
Reporting
Shared Services
model
% Functional
Budget and
Reporting Mgt
Shared Services
Model_ _ _
100%
Implement.
of Budget
and
Reporting
Shared
Services
Model
Identify and
Addres
Budget and
Reporting
Mgt
Implement.
Gaps
FINANCIAL
SERVICES :
Budget and
Regional
Support
Year 1
Budget
Year 2
Budget
Year 3
Budget
Year 4
Budget
Year 5
Budget
R - R - R - Opex Opex
Output 2.5
Output 2.2
Output 2.2
Output 2.3
Outcome 2
Output
2.1
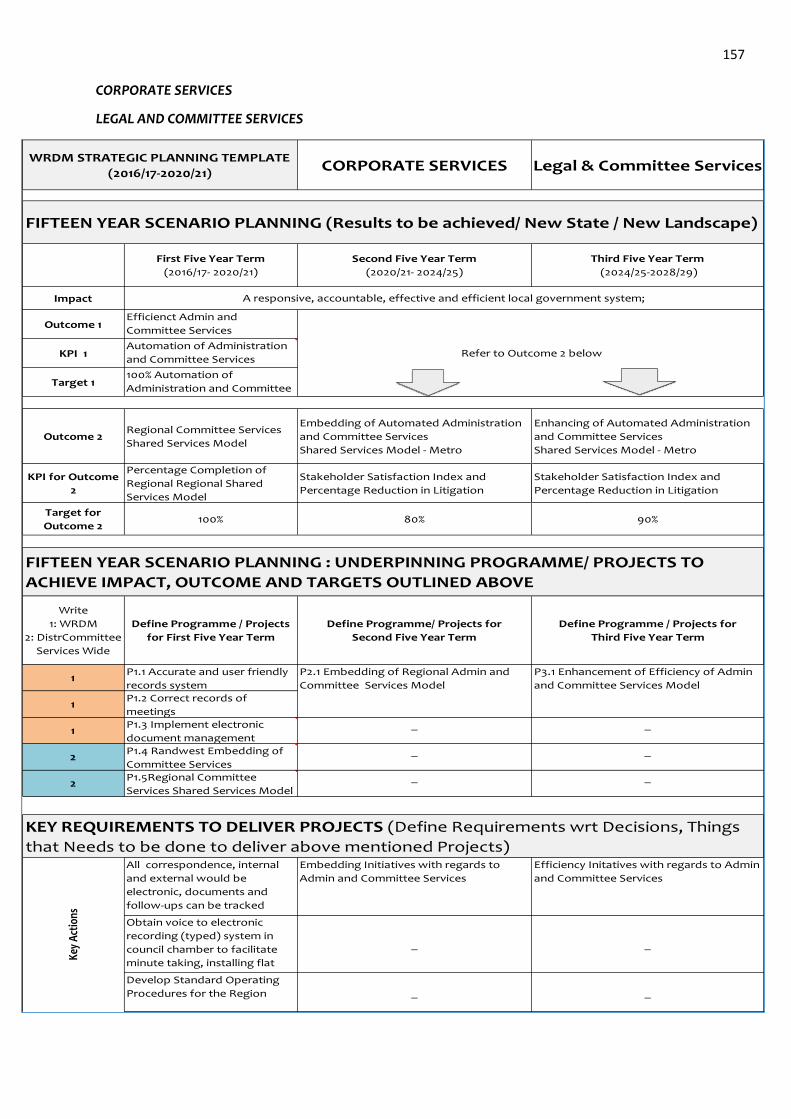
157
CORPORATE SERVICES
LEGAL AND COMMITTEE SERVICES
Impact
Outcome 1
KPI 1
Target 1
Outcome 2
KPI for Outcome
2
Target for
Outcome 2
Write
1: WRDM
2: DistrCommittee
Services Wide
1
1
1
2
2
_ _
Develop Standard Operating
Procedures for the Region _ _
KEY REQUIREMENTS TO DELIVER PROJECTS (Define Requirements wrt Decisions, Things
that Needs to be done to deliver above mentioned Projects)
Key
Act
ions
All correspondence, internal
and external would be
electronic, documents and
follow-ups can be tracked
electronically
Embedding Initiatives with regards to
Admin and Committee Services
Efficiency Initatives with regards to Admin
and Committee Services
Obtain voice to electronic
recording (typed) system in
council chamber to facilitate
minute taking, installing flat
screen TV's and video
P1.5Regional Committee
Services Shared Services Model
_ _
P1.1 Accurate and user friendly
records systemP1.2 Correct records of
meetings_
Define Programme / Projects
for First Five Year Term
Define Programme/ Projects for
Second Five Year Term
Define Programme / Projects for
Third Five Year Term
FIFTEEN YEAR SCENARIO PLANNING : UNDERPINNING PROGRAMME/ PROJECTS TO
ACHIEVE IMPACT, OUTCOME AND TARGETS OUTLINED ABOVE
P2.1 Embedding of Regional Admin and
Committee Services Model
P3.1 Enhancement of Efficiency of Admin
and Committee Services Model
WRDM STRATEGIC PLANNING TEMPLATE
(2016/17-2020/21)CORPORATE SERVICES Legal & Committee Services
First Five Year Term
(2016/17- 2020/21)
Second Five Year Term
(2020/21- 2024/25)
Third Five Year Term
(2024/25-2028/29)
Automation of Administration
and Committee Services
Efficienct Admin and
Committee Services
FIFTEEN YEAR SCENARIO PLANNING (Results to be achieved/ New State / New Landscape)
100% 80% 90%
A responsive, accountable, effective and efficient local government system;
Regional Committee Services
Shared Services Model
Embedding of Automated Administration
and Committee Services
Shared Services Model - Metro
Enhancing of Automated Administration
and Committee Services
Shared Services Model - Metro
Percentage Completion of
Regional Regional Shared
Services Model
Stakeholder Satisfaction Index and
Percentage Reduction in Litigation
Stakeholder Satisfaction Index and
Percentage Reduction in Litigation
100% Automation of
Administration and Committee
Services
Refer to Outcome 2 below
P1.3 Implement electronic
document management P1.4 Randwest Embedding of
Committee Services
_ _
_
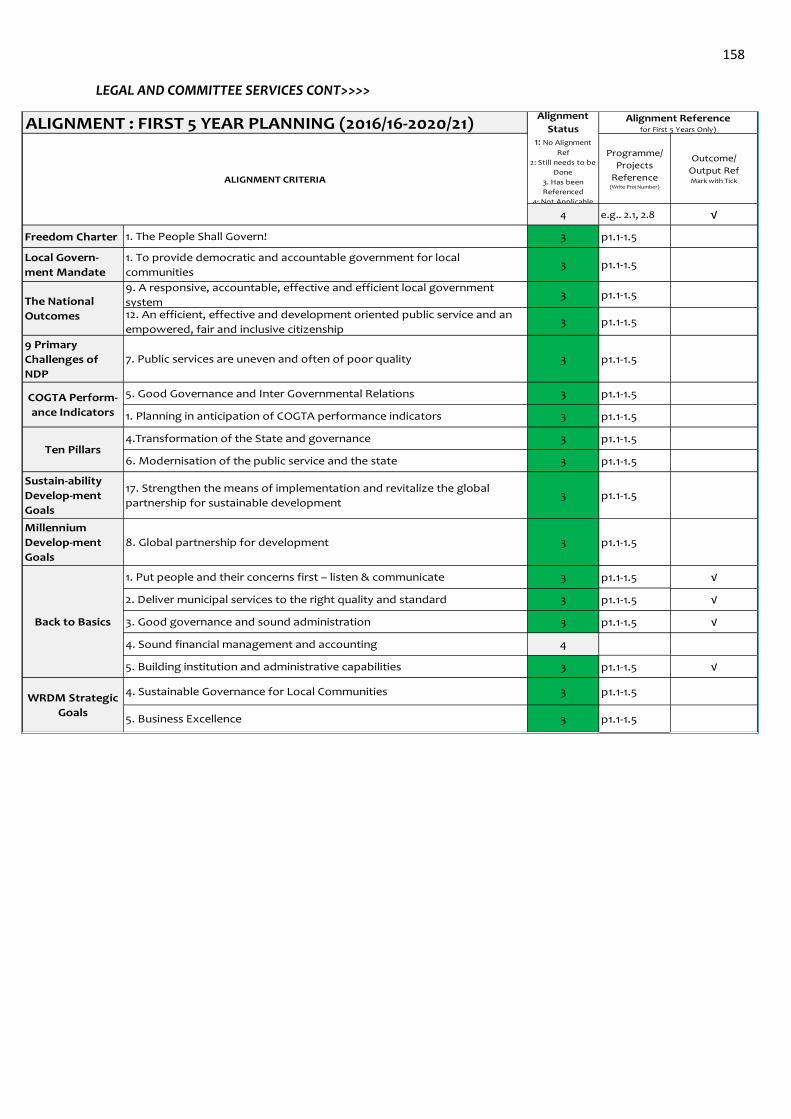
158
LEGAL AND COMMITTEE SERVICES CONT>>>>
ALIGNMENT : FIRST 5 YEAR PLANNING (2016/16-2020/21)
Programme/
Projects
Reference(Write Proj Number)
Outcome/
Output RefMark with Tick
4 e.g.. 2.1, 2.8 √
Freedom Charter 3 p1.1-1.5
Local Govern-
ment Mandate3 p1.1-1.5
3 p1.1-1.5
3 p1.1-1.5
9 Primary
Challenges of
NDP
3 p1.1-1.5
3 p1.1-1.5
3 p1.1-1.5
3 p1.1-1.5
3 p1.1-1.5
Sustain-ability
Develop-ment
Goals
3 p1.1-1.5
Millennium
Develop-ment
Goals
3 p1.1-1.5
3 p1.1-1.5 √
3 p1.1-1.5 √
3 p1.1-1.5 √
4
3 p1.1-1.5 √
3 p1.1-1.5
3 p1.1-1.55. Business Excellence
8. Global partnership for development
4. Sustainable Governance for Local CommunitiesWRDM Strategic
Goals
Back to Basics
1. Put people and their concerns first – listen & communicate
2. Deliver municipal services to the right quality and standard
3. Good governance and sound administration
4. Sound financial management and accounting
5. Building institution and administrative capabilities
7. Public services are uneven and often of poor quality
9. A responsive, accountable, effective and efficient local government
system12. An efficient, effective and development oriented public service and an
empowered, fair and inclusive citizenship
The National
Outcomes
1. To provide democratic and accountable government for local
communities
COGTA Perform-
ance Indicators
17. Strengthen the means of implementation and revitalize the global
partnership for sustainable development
5. Good Governance and Inter Governmental Relations
1. Planning in anticipation of COGTA performance indicators
Ten Pillars4.Transformation of the State and governance
6. Modernisation of the public service and the state
Alignment
Status1: No Alignment
Ref
2: Still needs to be
Done
3. Has been
Referenced
4: Not Applicable
Alignment Referencefor First 5 Years Only)
ALIGNMENT CRITERIA
1. The People Shall Govern!

159
LEGAL AND COMMITTEE SERVICES CONT>>>>
PLANNING LEVELPLANNING
STATEMENTKPI Year 1 Target
Year 2
Target
Year 3
Target
Year 4
Target
Year 5
Target
ACCOUNTABLE
FUNCTION/
DEPARTMENT
Definition of
Specifcations
for System
100%
Implement-
ation
10%
Efficiency
Improveme
nt
20%
Efficiency
Improveme
nt
30%
Efficiency
Improveme
nt
Year 1 BudgetYear 2
Budget
Year 3
Budget
Year 4
Budget
Year 5
Budget
Opex Opex Opex Opex Opex
100%
Completion of
Specification
and
development of
the Automated
Committee
Management
System
100%
Implementa
tion of
Automated
Committee
Managemen
t System
Review and
enhanceme
nt of
Automated
Committee
Managemen
t System
Review and
enhanceme
nt of
Automated
Committee
Managemen
t System
Review and
enhanceme
nt of
Automated
Committee
Managemen
t System
Year 1 BudgetYear 2
Budget
Year 3
Budget
Year 4
Budget
Year 5
Budget
Opex Opex Opex Opex Opex
100%
Completion of
Specification
and
development of
the Automated
Document
Management
100%
Implement-
ation of
Automated
Document
Managemen
t System
Review and
enhanceme
nt of
Automated
Document
Managemen
t System
Review and
enhanceme
nt of
Automated
Document
Managemen
t System
Review and
enhanceme
nt of
Automated
Document
Managemen
t System
Year 1 BudgetYear 2
Budget
Year 3
Budget
Year 4
Budget
Year 5
Budget
Opex Opex Opex Opex Opex
Develop and
implement
Rand West
Committee
Services
Framework,
and Plan
Implement
Rand West
Committee
Services
Plan
Enhance
Rand West
Committee
Services
Maintain
Rand West
Committee
Services
Maintain
Rand West
Committee
Services
Year 1 BudgetYear 2
Budget
Year 3
Budget
Year 4
Budget
Year 5
Budget
Opex Opex Opex Opex Opex
Output
1.1
Automated
Committee
Management
System
%
Implementation
of Automated
Committee
Management
SystemCS: Legal &
Committee
Output
1.3
Embedding
of Randwest
Committee
Services
Percentage
Development
and
implementation
Rand West
Committee
Services
embedding Plan
CS: Legal &
Committee
Output
1.2
Automated
Document
Management
System
%
Implementation
of Automated
Document
Management
System
CS: Legal &
Committee
Outcome 1
Efficienct
Admin and
Committee
Services
Automation of
Administration
and Committee
Services
FIVE YEAR IMPLEMENTATION PLAN
CS: Legal &
Committee
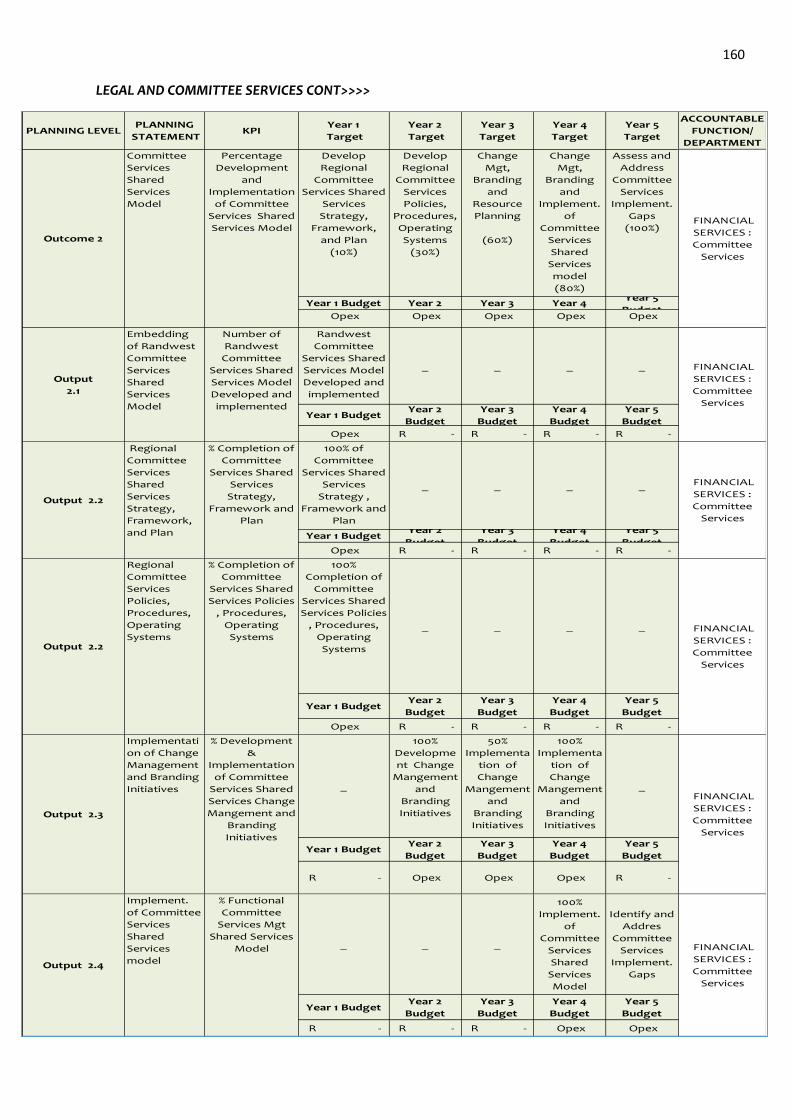
160
LEGAL AND COMMITTEE SERVICES CONT>>>>
PLANNING LEVELPLANNING
STATEMENTKPI
Year 1
Target
Year 2
Target
Year 3
Target
Year 4
Target
Year 5
Target
ACCOUNTABLE
FUNCTION/
DEPARTMENT
Develop
Regional
Committee
Services Shared
Services
Strategy,
Framework,
and Plan
(10%)
Develop
Regional
Committee
Services
Policies,
Procedures,
Operating
Systems
(30%)
Change
Mgt,
Branding
and
Resource
Planning
(60%)
Change
Mgt,
Branding
and
Implement.
of
Committee
Services
Shared
Services
model
(80%)
Assess and
Address
Committee
Services
Implement.
Gaps
(100%)
Year 1 Budget Year 2
Budget
Year 3
Budget
Year 4
Budget
Year 5
Budget Opex Opex Opex Opex Opex
Randwest
Committee
Services Shared
Services Model
Developed and
implemented
_ _ _ _
Year 1 BudgetYear 2
Budget
Year 3
Budget
Year 4
Budget
Year 5
Budget
Opex R - R - R - R -
100% of
Committee
Services Shared
Services
Strategy ,
Framework and
Plan
_ _ _ _
Year 1 BudgetYear 2
Budget
Year 3
Budget
Year 4
Budget
Year 5
Budget Opex R - R - R - R -
100%
Completion of
Committee
Services Shared
Services Policies
, Procedures,
Operating
Systems
_ _ _ _
Year 1 BudgetYear 2
Budget
Year 3
Budget
Year 4
Budget
Year 5
Budget
Opex R - R - R - R -
_
100%
Developme
nt Change
Mangement
and
Branding
Initiatives
50%
Implementa
tion of
Change
Mangement
and
Branding
Initiatives
100%
Implementa
tion of
Change
Mangement
and
Branding
Initiatives
_
Year 1 BudgetYear 2
Budget
Year 3
Budget
Year 4
Budget
Year 5
Budget
R - Opex Opex Opex R -
_ _ _
100%
Implement.
of
Committee
Services
Shared
Services
Model
Identify and
Addres
Committee
Services
Implement.
Gaps
Year 1 BudgetYear 2
Budget
Year 3
Budget
Year 4
Budget
Year 5
Budget
R - R - R - Opex Opex
Output 2.4
Implement.
of Committee
Services
Shared
Services
model
% Functional
Committee
Services Mgt
Shared Services
Model FINANCIAL
SERVICES :
Committee
Services
Outcome 2
Committee
Services
Shared
Services
Model
Percentage
Development
and
Implementation
of Committee
Services Shared
Services Model FINANCIAL
SERVICES :
Committee
Services
Output
2.1
Embedding
of Randwest
Committee
Services
Shared
Services
Model
Number of
Randwest
Committee
Services Shared
Services Model
Developed and
implemented
FINANCIAL
SERVICES :
Committee
Services
Output 2.2
Regional
Committee
Services
Shared
Services
Strategy,
Framework,
and Plan
% Completion of
Committee
Services Shared
Services
Strategy,
Framework and
Plan
FINANCIAL
SERVICES :
Committee
Services
Output 2.2
Regional
Committee
Services
Policies,
Procedures,
Operating
Systems
% Completion of
Committee
Services Shared
Services Policies
, Procedures,
Operating
Systems FINANCIAL
SERVICES :
Committee
Services
Output 2.3
Implementati
on of Change
Management
and Branding
Initiatives
% Development
&
Implementation
of Committee
Services Shared
Services Change
Mangement and
Branding
Initiatives
FINANCIAL
SERVICES :
Committee
Services
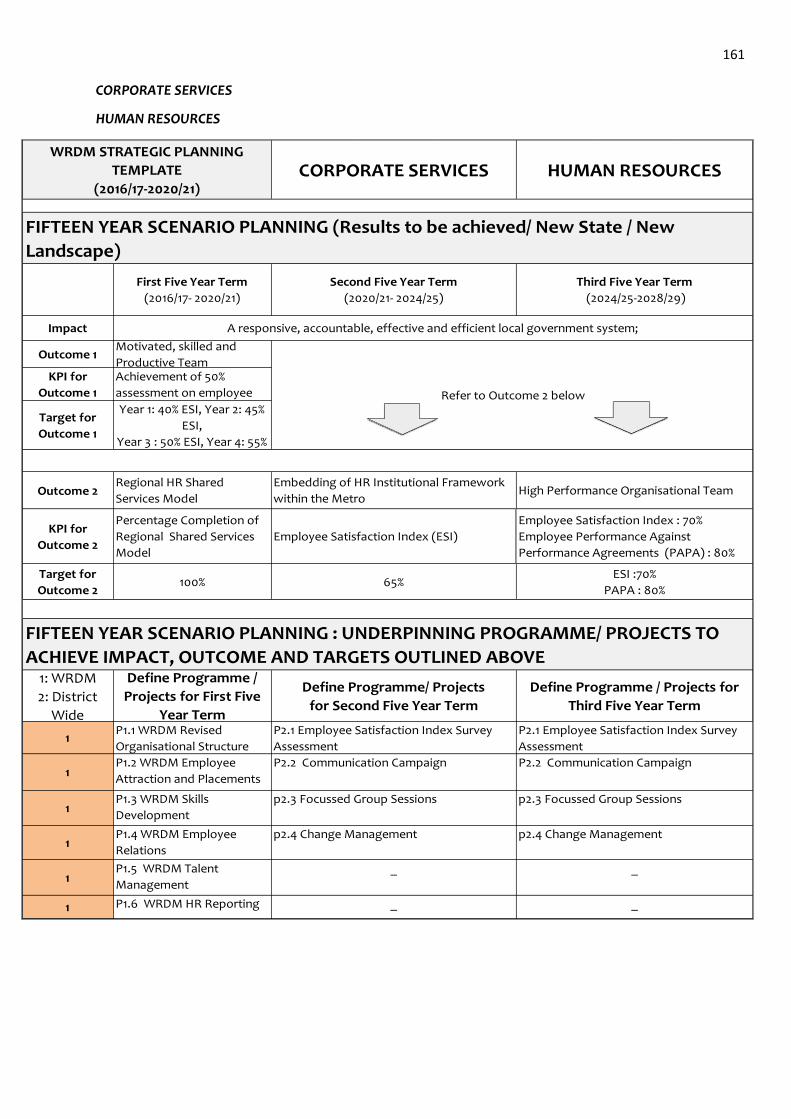
161
CORPORATE SERVICES
HUMAN RESOURCES
Impact
Outcome 1
KPI for
Outcome 1
Target for
Outcome 1
Outcome 2
KPI for
Outcome 2
Target for
Outcome 2
1: WRDM
2: District
Wide
1
1
1
1
1
1
FIFTEEN YEAR SCENARIO PLANNING (Results to be achieved/ New State / New
Landscape)
WRDM STRATEGIC PLANNING
TEMPLATE
(2016/17-2020/21)CORPORATE SERVICES HUMAN RESOURCES
First Five Year Term
(2016/17- 2020/21)
Second Five Year Term
(2020/21- 2024/25)
Third Five Year Term
(2024/25-2028/29)
Define Programme /
Projects for First Five
Year Term
Define Programme/ Projects
for Second Five Year Term
Define Programme / Projects for
Third Five Year Term
Percentage Completion of
Regional Shared Services
Model
Employee Satisfaction Index (ESI)
Employee Satisfaction Index : 70%
Employee Performance Against
Performance Agreements (PAPA) : 80%
100% 65%ESI :70%
PAPA : 80%
A responsive, accountable, effective and efficient local government system;
FIFTEEN YEAR SCENARIO PLANNING : UNDERPINNING PROGRAMME/ PROJECTS TO
ACHIEVE IMPACT, OUTCOME AND TARGETS OUTLINED ABOVE
Achievement of 50%
assessment on employee
Regional HR Shared
Services Model
Embedding of HR Institutional Framework
within the MetroHigh Performance Organisational Team
P1.5 WRDM Talent
Management
_ _
P1.2 WRDM Employee
Attraction and Placements
P1.1 WRDM Revised
Organisational Structure
P2.1 Employee Satisfaction Index Survey
Assessment
P2.1 Employee Satisfaction Index Survey
Assessment
_P1.6 WRDM HR Reporting _
P1.4 WRDM Employee
Relations
p2.4 Change Management p2.4 Change Management
Year 1: 40% ESI, Year 2: 45%
ESI,
Year 3 : 50% ESI, Year 4: 55%
P2.2 Communication Campaign P2.2 Communication Campaign
P1.3 WRDM Skills
Development
p2.3 Focussed Group Sessions p2.3 Focussed Group Sessions
Refer to Outcome 2 below
Motivated, skilled and
Productive Team
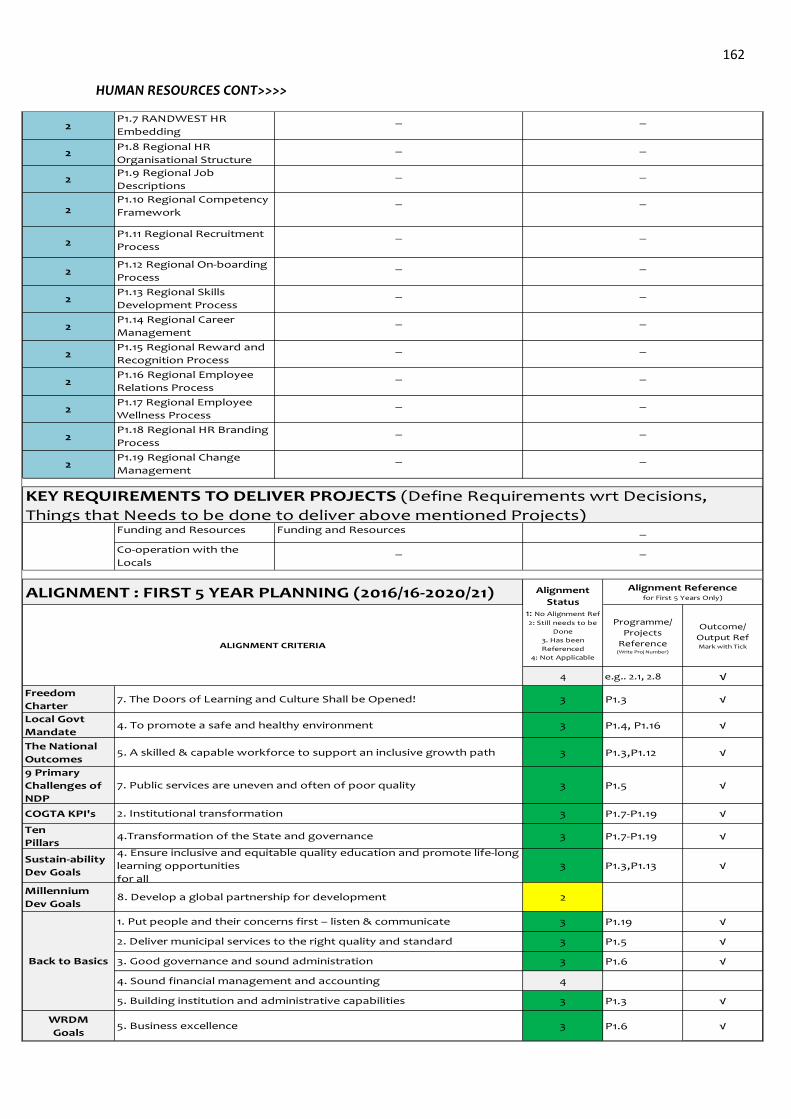
162
HUMAN RESOURCES CONT>>>>
2
2
2
2
2
2
2
2
2
2
2
2
2
ALIGNMENT : FIRST 5 YEAR PLANNING (2016/16-2020/21)
Programme/
Projects
Reference(Write Proj Number)
Outcome/
Output RefMark with Tick
4 e.g.. 2.1, 2.8 √
Freedom
Charter3 P1.3 √
Local Govt
Mandate3 P1.4, P1.16 √
The National
Outcomes3 P1.3,P1.12 √
9 Primary
Challenges of
NDP
3 P1.5 √
COGTA KPI's 3 P1.7-P1.19 √
Ten
Pillars3 P1.7-P1.19 √
Sustain-ability
Dev Goals3 P1.3,P1.13 √
Millennium
Dev Goals2
3 P1.19 √
3 P1.5 √
3 P1.6 √
4
3 P1.3 √
WRDM
Goals3 P1.6 √
P1.9 Regional Job
Descriptions
_ _
P1.7 RANDWEST HR
Embedding
_ _
P1.8 Regional HR
Organisational Structure
_ _
P1.11 Regional Recruitment
Process
_ _
P1.12 Regional On-boarding
Process
_ _
P1.10 Regional Competency
Framework
_ _
_
P1.19 Regional Change
Management
P1.18 Regional HR Branding
Process
_
P1.16 Regional Employee
Relations Process
P1.17 Regional Employee
Wellness Process
P1.13 Regional Skills
Development Process
_ _
P1.14 Regional Career
Management
_ _
4. To promote a safe and healthy environment
Alignment
Status1: No Alignment Ref
2: Still needs to be
Done
3. Has been
Referenced
4: Not Applicable
Alignment Referencefor First 5 Years Only)
ALIGNMENT CRITERIA
7. The Doors of Learning and Culture Shall be Opened!
_ _
P1.15 Regional Reward and
Recognition Process
_ _
_ _
_ _
KEY REQUIREMENTS TO DELIVER PROJECTS (Define Requirements wrt Decisions,
Things that Needs to be done to deliver above mentioned Projects)Funding and Resources Funding and Resources _
Co-operation with the
Locals
__
8. Develop a global partnership for development
1. Put people and their concerns first – listen & communicate
5. A skilled & capable workforce to support an inclusive growth path
4. Ensure inclusive and equitable quality education and promote life-long
learning opportunities
for all
2. Institutional transformation
4.Transformation of the State and governance
7. Public services are uneven and often of poor quality
4. Sound financial management and accounting
5. Building institution and administrative capabilities
Back to Basics
2. Deliver municipal services to the right quality and standard
3. Good governance and sound administration
5. Business excellence
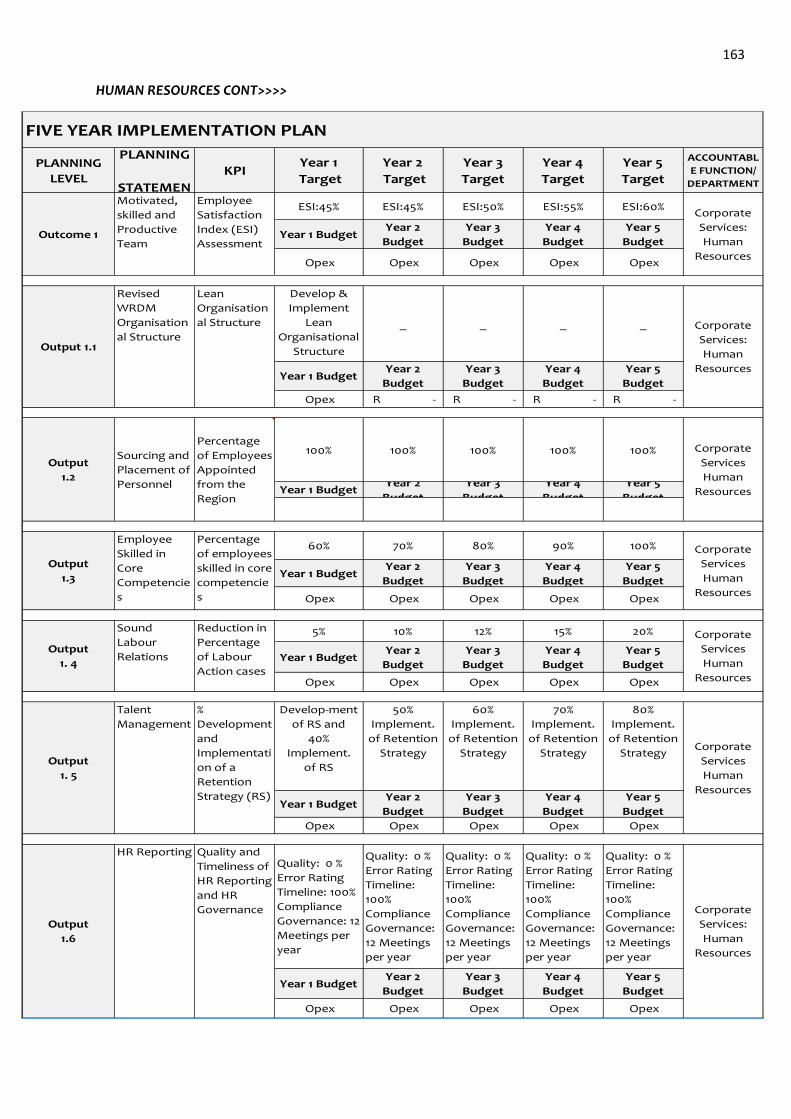
163
HUMAN RESOURCES CONT>>>>
PLANNING
LEVEL
PLANNING
STATEMEN
KPIYear 1
Target
Year 2
Target
Year 3
Target
Year 4
Target
Year 5
Target
ACCOUNTABL
E FUNCTION/
DEPARTMENT
ESI:45% ESI:45% ESI:50% ESI:55% ESI:60%
Year 1 BudgetYear 2
Budget
Year 3
Budget
Year 4
Budget
Year 5
Budget
Opex Opex Opex Opex Opex
Develop &
Implement
Lean
Organisational
Structure
_ _ _ _
Year 1 BudgetYear 2
Budget
Year 3
Budget
Year 4
Budget
Year 5
Budget
Opex R - R - R - R -
100% 100% 100% 100% 100%
Year 1 BudgetYear 2
Budget
Year 3
Budget
Year 4
Budget
Year 5
Budget
60% 70% 80% 90% 100%
Year 1 BudgetYear 2
Budget
Year 3
Budget
Year 4
Budget
Year 5
Budget
Opex Opex Opex Opex Opex
5% 10% 12% 15% 20%
Year 1 BudgetYear 2
Budget
Year 3
Budget
Year 4
Budget
Year 5
Budget
Opex Opex Opex Opex Opex
Develop-ment
of RS and
40%
Implement.
of RS
50%
Implement.
of Retention
Strategy
60%
Implement.
of Retention
Strategy
70%
Implement.
of Retention
Strategy
80%
Implement.
of Retention
Strategy
Year 1 BudgetYear 2
Budget
Year 3
Budget
Year 4
Budget
Year 5
Budget
Opex Opex Opex Opex Opex
Quality: 0 %
Error Rating
Timeline: 100%
Compliance
Governance: 12
Meetings per
year
Quality: 0 %
Error Rating
Timeline:
100%
Compliance
Governance:
12 Meetings
per year
Quality: 0 %
Error Rating
Timeline:
100%
Compliance
Governance:
12 Meetings
per year
Quality: 0 %
Error Rating
Timeline:
100%
Compliance
Governance:
12 Meetings
per year
Quality: 0 %
Error Rating
Timeline:
100%
Compliance
Governance:
12 Meetings
per year
Year 1 BudgetYear 2
Budget
Year 3
Budget
Year 4
Budget
Year 5
Budget
Opex Opex Opex Opex Opex
Outcome 1
Motivated,
skilled and
Productive
Team
Employee
Satisfaction
Index (ESI)
Assessment
Output
1.3
Employee
Skilled in
Core
Competencie
s
Percentage
of employees
skilled in core
competencie
s
Corporate
Services
Human
Resources
FIVE YEAR IMPLEMENTATION PLAN
Corporate
Services:
Human
Resources
Output 1.1
Revised
WRDM
Organisation
al Structure
Lean
Organisation
al Structure Corporate
Services:
Human
Resources
Output
1. 5
Talent
Management
%
Development
and
Implementati
on of a
Retention
Strategy (RS)
Corporate
Services
Human
Resources
Output
1.6
HR Reporting Quality and
Timeliness of
HR Reporting
and HR
Governance Corporate
Services:
Human
Resources
Output
1.2
Sourcing and
Placement of
Personnel
Percentage
of Employees
Appointed
from the
Region
Corporate
Services
Human
Resources
Output
1. 4
Sound
Labour
Relations
Reduction in
Percentage
of Labour
Action cases
Corporate
Services
Human
Resources
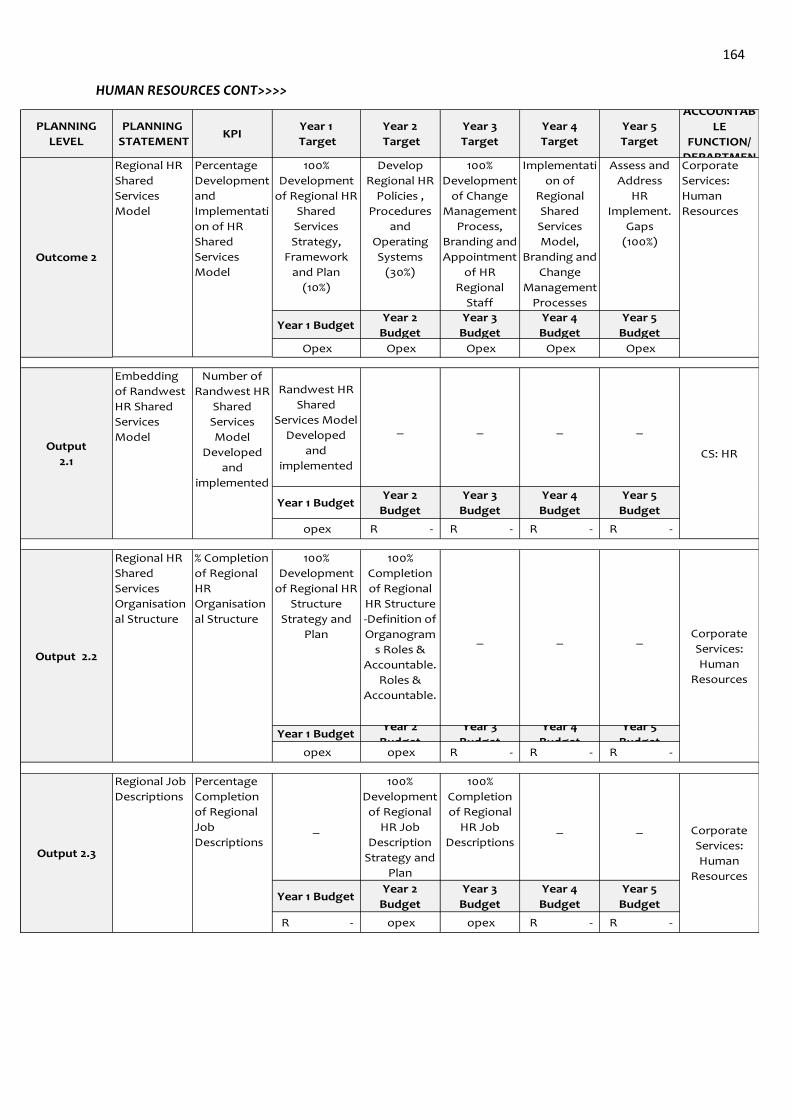
164
HUMAN RESOURCES CONT>>>>
PLANNING
LEVEL
PLANNING
STATEMENTKPI
Year 1
Target
Year 2
Target
Year 3
Target
Year 4
Target
Year 5
Target
ACCOUNTAB
LE
FUNCTION/
DEPARTMEN100%
Development
of Regional HR
Shared
Services
Strategy,
Framework
and Plan
(10%)
Develop
Regional HR
Policies ,
Procedures
and
Operating
Systems
(30%)
100%
Development
of Change
Management
Process,
Branding and
Appointment
of HR
Regional
Staff
(60%)
Implementati
on of
Regional
Shared
Services
Model,
Branding and
Change
Management
Processes
(80%)
Assess and
Address
HR
Implement.
Gaps
(100%)
Year 1 BudgetYear 2
Budget
Year 3
Budget
Year 4
Budget
Year 5
Budget
Opex Opex Opex Opex Opex
Randwest HR
Shared
Services Model
Developed
and
implemented
_ _ _ _
Year 1 BudgetYear 2
Budget
Year 3
Budget
Year 4
Budget
Year 5
Budget
opex R - R - R - R -
100%
Development
of Regional HR
Structure
Strategy and
Plan
100%
Completion
of Regional
HR Structure
-Definition of
Organogram
s Roles &
Accountable.
Roles &
Accountable.
_ _ _
Year 1 BudgetYear 2
Budget
Year 3
Budget
Year 4
Budget
Year 5
Budget opex opex R - R - R -
_
100%
Development
of Regional
HR Job
Description
Strategy and
Plan
100%
Completion
of Regional
HR Job
Descriptions
_ _
Year 1 BudgetYear 2
Budget
Year 3
Budget
Year 4
Budget
Year 5
Budget
R - opex opex R - R -
Percentage
Completion
of Regional
Job
DescriptionsCorporate
Services:
Human
Resources
Outcome 2
Regional HR
Shared
Services
Model
Percentage
Development
and
Implementati
on of HR
Shared
Services
Model
Corporate
Services:
Human
Resources
Output
2.1
Embedding
of Randwest
HR Shared
Services
Model
Number of
Randwest HR
Shared
Services
Model
Developed
and
implemented
CS: HR
Output 2.2
Regional HR
Shared
Services
Organisation
al Structure
% Completion
of Regional
HR
Organisation
al Structure
Corporate
Services:
Human
Resources
Output 2.3
Regional Job
Descriptions
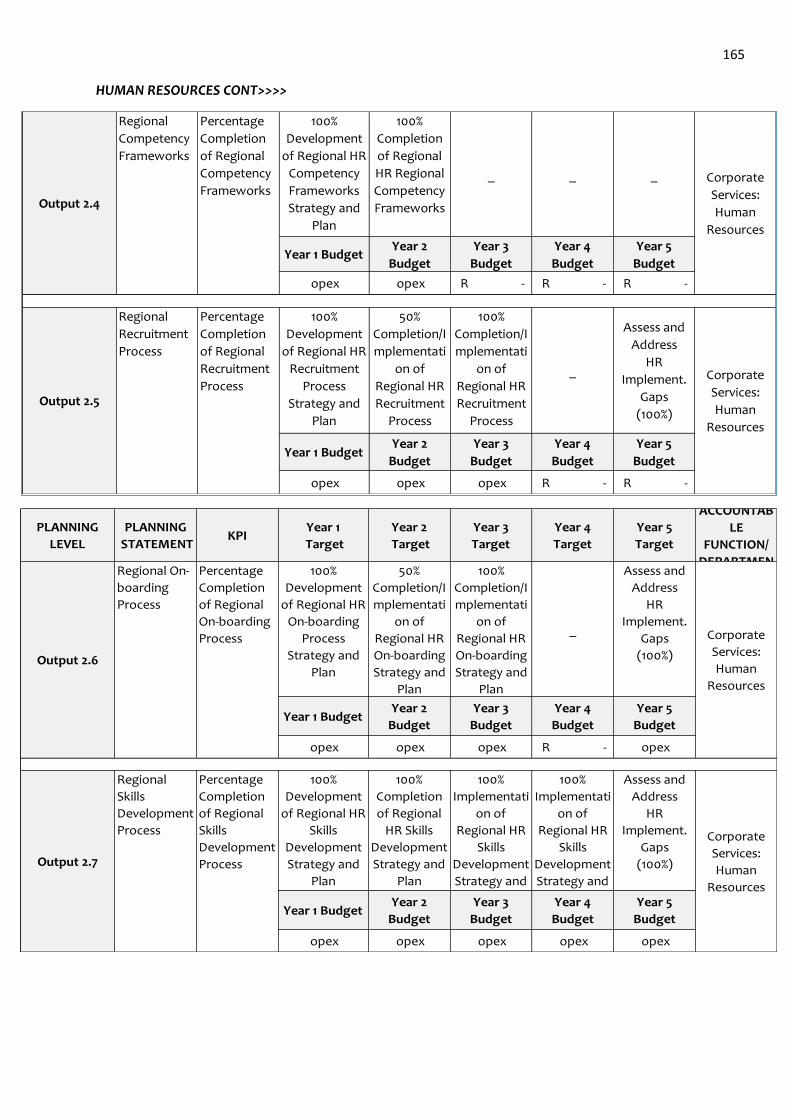
165
HUMAN RESOURCES CONT>>>>
100%
Development
of Regional HR
Competency
Frameworks
Strategy and
Plan
100%
Completion
of Regional
HR Regional
Competency
Frameworks
_ _ _
Year 1 BudgetYear 2
Budget
Year 3
Budget
Year 4
Budget
Year 5
Budget
opex opex R - R - R -
100%
Development
of Regional HR
Recruitment
Process
Strategy and
Plan
50%
Completion/I
mplementati
on of
Regional HR
Recruitment
Process
100%
Completion/I
mplementati
on of
Regional HR
Recruitment
Process
_
Assess and
Address
HR
Implement.
Gaps
(100%)
Year 1 BudgetYear 2
Budget
Year 3
Budget
Year 4
Budget
Year 5
Budget
opex opex opex R - R -
Output 2.4
Regional
Competency
Frameworks
Percentage
Completion
of Regional
Competency
FrameworksCorporate
Services:
Human
Resources
Output 2.5
Regional
Recruitment
Process
Percentage
Completion
of Regional
Recruitment
ProcessCorporate
Services:
Human
Resources
PLANNING
LEVEL
PLANNING
STATEMENTKPI
Year 1
Target
Year 2
Target
Year 3
Target
Year 4
Target
Year 5
Target
ACCOUNTAB
LE
FUNCTION/
DEPARTMEN100%
Development
of Regional HR
On-boarding
Process
Strategy and
Plan
50%
Completion/I
mplementati
on of
Regional HR
On-boarding
Strategy and
Plan
100%
Completion/I
mplementati
on of
Regional HR
On-boarding
Strategy and
Plan
_
Assess and
Address
HR
Implement.
Gaps
(100%)
Year 1 BudgetYear 2
Budget
Year 3
Budget
Year 4
Budget
Year 5
Budget
opex opex opex R - opex
100%
Development
of Regional HR
Skills
Development
Strategy and
Plan
100%
Completion
of Regional
HR Skills
Development
Strategy and
Plan
100%
Implementati
on of
Regional HR
Skills
Development
Strategy and
Plan
100%
Implementati
on of
Regional HR
Skills
Development
Strategy and
Plan
Assess and
Address
HR
Implement.
Gaps
(100%)
Year 1 BudgetYear 2
Budget
Year 3
Budget
Year 4
Budget
Year 5
Budget
opex opex opex opex opex
Output 2.7
Regional
Skills
Development
Process
Percentage
Completion
of Regional
Skills
Development
Process
Corporate
Services:
Human
Resources
Output 2.6
Regional On-
boarding
Process
Percentage
Completion
of Regional
On-boarding
Process Corporate
Services:
Human
Resources
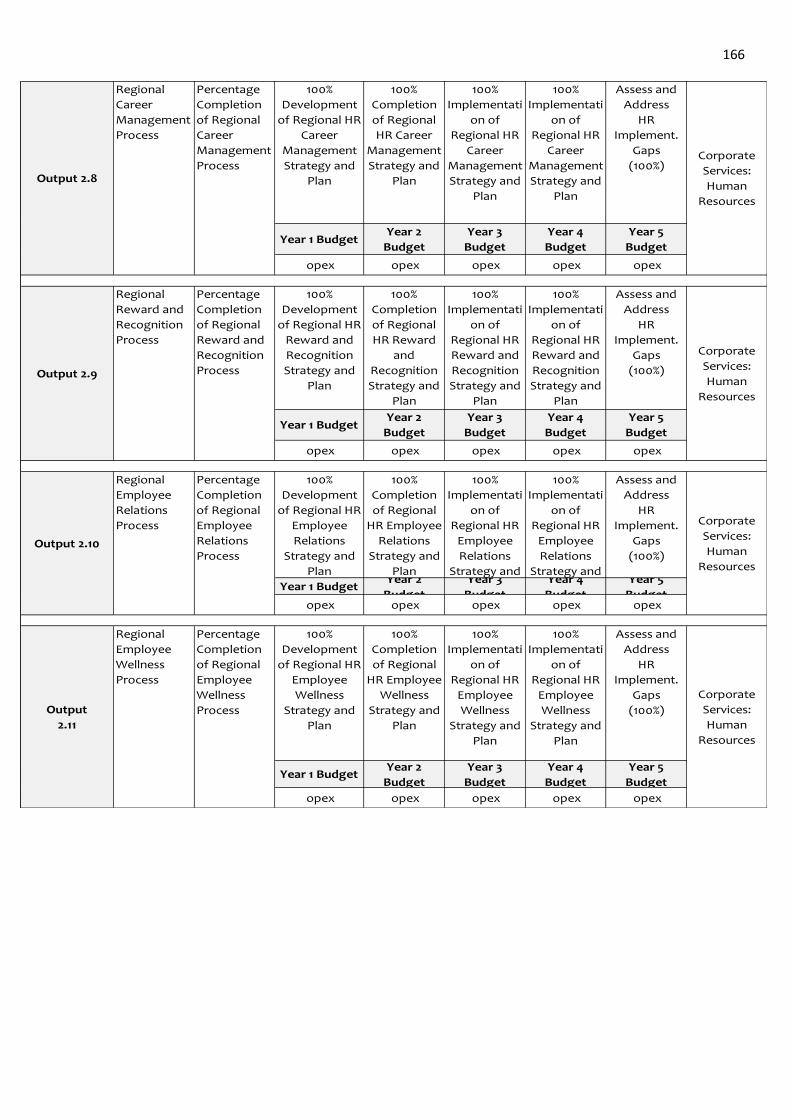
166
100%
Development
of Regional HR
Career
Management
Strategy and
Plan
100%
Completion
of Regional
HR Career
Management
Strategy and
Plan
100%
Implementati
on of
Regional HR
Career
Management
Strategy and
Plan
100%
Implementati
on of
Regional HR
Career
Management
Strategy and
Plan
Assess and
Address
HR
Implement.
Gaps
(100%)
Year 1 BudgetYear 2
Budget
Year 3
Budget
Year 4
Budget
Year 5
Budget
opex opex opex opex opex
100%
Development
of Regional HR
Reward and
Recognition
Strategy and
Plan
100%
Completion
of Regional
HR Reward
and
Recognition
Strategy and
Plan
100%
Implementati
on of
Regional HR
Reward and
Recognition
Strategy and
Plan
100%
Implementati
on of
Regional HR
Reward and
Recognition
Strategy and
Plan
Assess and
Address
HR
Implement.
Gaps
(100%)
Year 1 BudgetYear 2
Budget
Year 3
Budget
Year 4
Budget
Year 5
Budget
opex opex opex opex opex
100%
Development
of Regional HR
Employee
Relations
Strategy and
Plan
100%
Completion
of Regional
HR Employee
Relations
Strategy and
Plan
100%
Implementati
on of
Regional HR
Employee
Relations
Strategy and
100%
Implementati
on of
Regional HR
Employee
Relations
Strategy and
Assess and
Address
HR
Implement.
Gaps
(100%)
Year 1 BudgetYear 2
Budget
Year 3
Budget
Year 4
Budget
Year 5
Budget opex opex opex opex opex
100%
Development
of Regional HR
Employee
Wellness
Strategy and
Plan
100%
Completion
of Regional
HR Employee
Wellness
Strategy and
Plan
100%
Implementati
on of
Regional HR
Employee
Wellness
Strategy and
Plan
100%
Implementati
on of
Regional HR
Employee
Wellness
Strategy and
Plan
Assess and
Address
HR
Implement.
Gaps
(100%)
Year 1 BudgetYear 2
Budget
Year 3
Budget
Year 4
Budget
Year 5
Budget
opex opex opex opex opex
Output
2.11
Regional
Employee
Wellness
Process
Output 2.8
Regional
Career
Management
Process
Percentage
Completion
of Regional
Career
Management
ProcessCorporate
Services:
Human
Resources
Output 2.10
Regional
Employee
Relations
Process
Percentage
Completion
of Regional
Employee
Relations
Process
Corporate
Services:
Human
Resources
Output 2.9
Regional
Reward and
Recognition
Process
Percentage
Completion
of Regional
Reward and
Recognition
Process
Corporate
Services:
Human
Resources
Percentage
Completion
of Regional
Employee
Wellness
Process
Corporate
Services:
Human
Resources
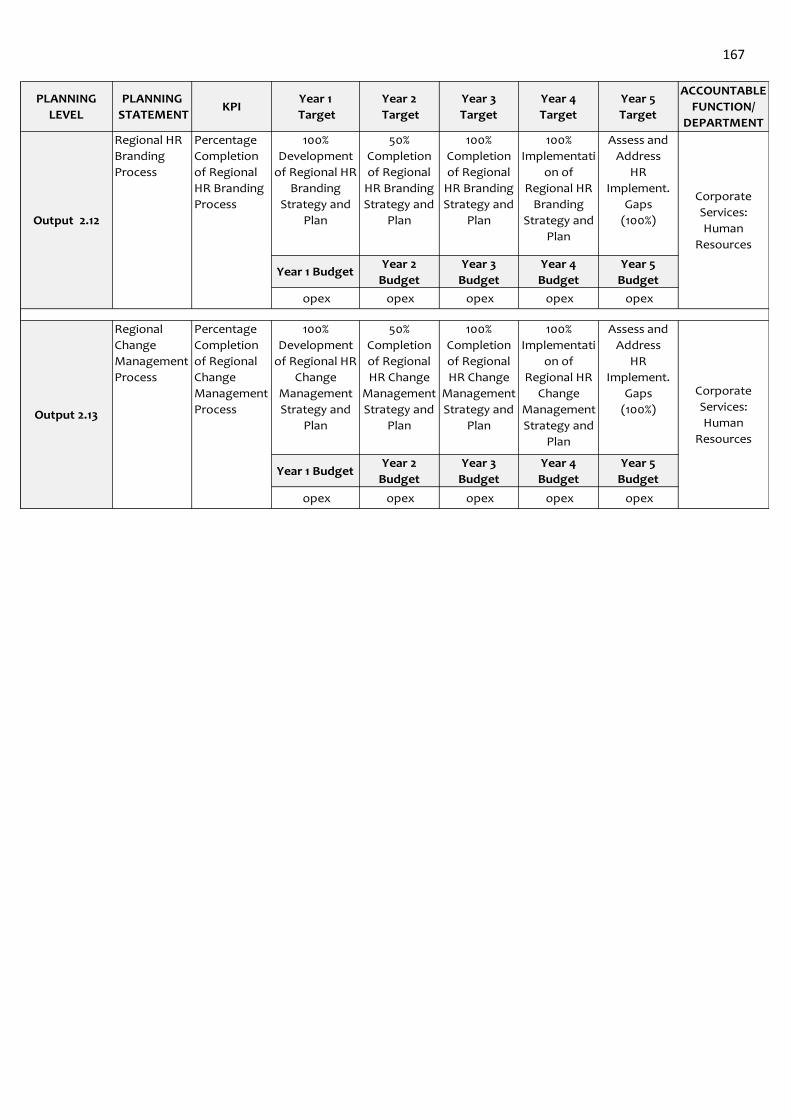
167
PLANNING
LEVEL
PLANNING
STATEMENTKPI
Year 1
Target
Year 2
Target
Year 3
Target
Year 4
Target
Year 5
Target
ACCOUNTABLE
FUNCTION/
DEPARTMENT
100%
Development
of Regional HR
Branding
Strategy and
Plan
50%
Completion
of Regional
HR Branding
Strategy and
Plan
100%
Completion
of Regional
HR Branding
Strategy and
Plan
100%
Implementati
on of
Regional HR
Branding
Strategy and
Plan
Assess and
Address
HR
Implement.
Gaps
(100%)
Year 1 BudgetYear 2
Budget
Year 3
Budget
Year 4
Budget
Year 5
Budget
opex opex opex opex opex
100%
Development
of Regional HR
Change
Management
Strategy and
Plan
50%
Completion
of Regional
HR Change
Management
Strategy and
Plan
100%
Completion
of Regional
HR Change
Management
Strategy and
Plan
100%
Implementati
on of
Regional HR
Change
Management
Strategy and
Plan
Assess and
Address
HR
Implement.
Gaps
(100%)
Year 1 BudgetYear 2
Budget
Year 3
Budget
Year 4
Budget
Year 5
Budget
opex opex opex opex opex
Output 2.12
Regional HR
Branding
Process
Percentage
Completion
of Regional
HR Branding
ProcessCorporate
Services:
Human
Resources
Output 2.13
Regional
Change
Management
Process
Percentage
Completion
of Regional
Change
Management
Process
Corporate
Services:
Human
Resources
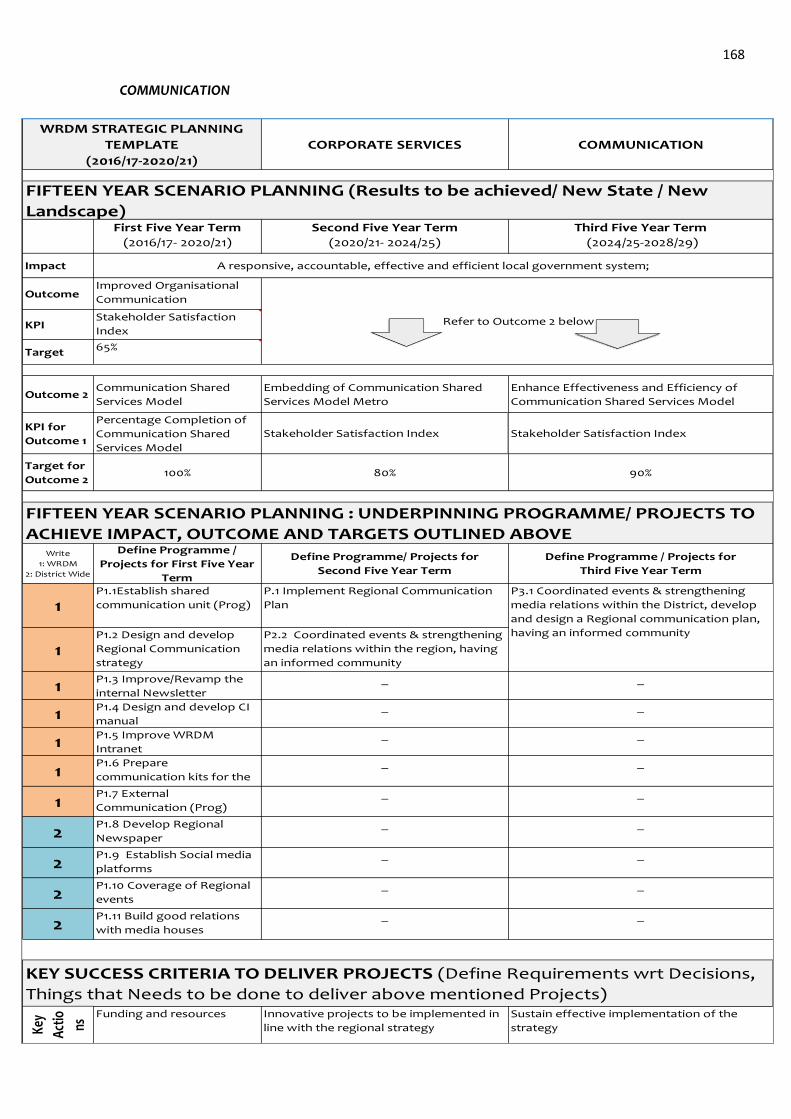
168
COMMUNICATION
Impact
Outcome
KPI
Target
Outcome 2
KPI for
Outcome 1
Target for
Outcome 2
Write
1: WRDM
2: District Wide
1
1
1
1
1
1
1
2
2
2
2
Key
Actio ns
FIFTEEN YEAR SCENARIO PLANNING (Results to be achieved/ New State / New
Landscape)
A responsive, accountable, effective and efficient local government system;
Communication Shared
Services Model
Embedding of Communication Shared
Services Model Metro
Enhance Effectiveness and Efficiency of
Communication Shared Services Model
Percentage Completion of
Communication Shared
Services Model
Stakeholder Satisfaction Index Stakeholder Satisfaction Index
KEY SUCCESS CRITERIA TO DELIVER PROJECTS (Define Requirements wrt Decisions,
Things that Needs to be done to deliver above mentioned Projects)Funding and resources Innovative projects to be implemented in
line with the regional strategy
Sustain effective implementation of the
strategy
P1.11 Build good relations
with media houses
_ _
P1.9 Establish Social media
platforms
_ _
P1.10 Coverage of Regional
events
_ _
P1.7 External
Communication (Prog)
_ _
P1.8 Develop Regional
Newspaper
_ _
P1.5 Improve WRDM
Intranet
_ _
P1.6 Prepare
communication kits for the
staff
_ _
_ _
P1.2 Design and develop
Regional Communication
strategy
P2.2 Coordinated events & strengthening
media relations within the region, having
an informed community
P3.1 Coordinated events & strengthening
media relations within the District, develop
and design a Regional communication plan,
having an informed community
65%
Define Programme /
Projects for First Five Year
Term
Define Programme/ Projects for
Second Five Year Term
Define Programme / Projects for
Third Five Year Term
100% 80% 90%
FIFTEEN YEAR SCENARIO PLANNING : UNDERPINNING PROGRAMME/ PROJECTS TO
ACHIEVE IMPACT, OUTCOME AND TARGETS OUTLINED ABOVE
WRDM STRATEGIC PLANNING
TEMPLATE
(2016/17-2020/21)
CORPORATE SERVICES COMMUNICATION
First Five Year Term
(2016/17- 2020/21)
Second Five Year Term
(2020/21- 2024/25)
Third Five Year Term
(2024/25-2028/29)
Improved Organisational
Communication
Stakeholder Satisfaction
Index
P1.1Establish shared
communication unit (Prog)
P.1 Implement Regional Communication
Plan
P1.3 Improve/Revamp the
internal Newsletter
_ _
P1.4 Design and develop CI
manual
Refer to Outcome 2 below
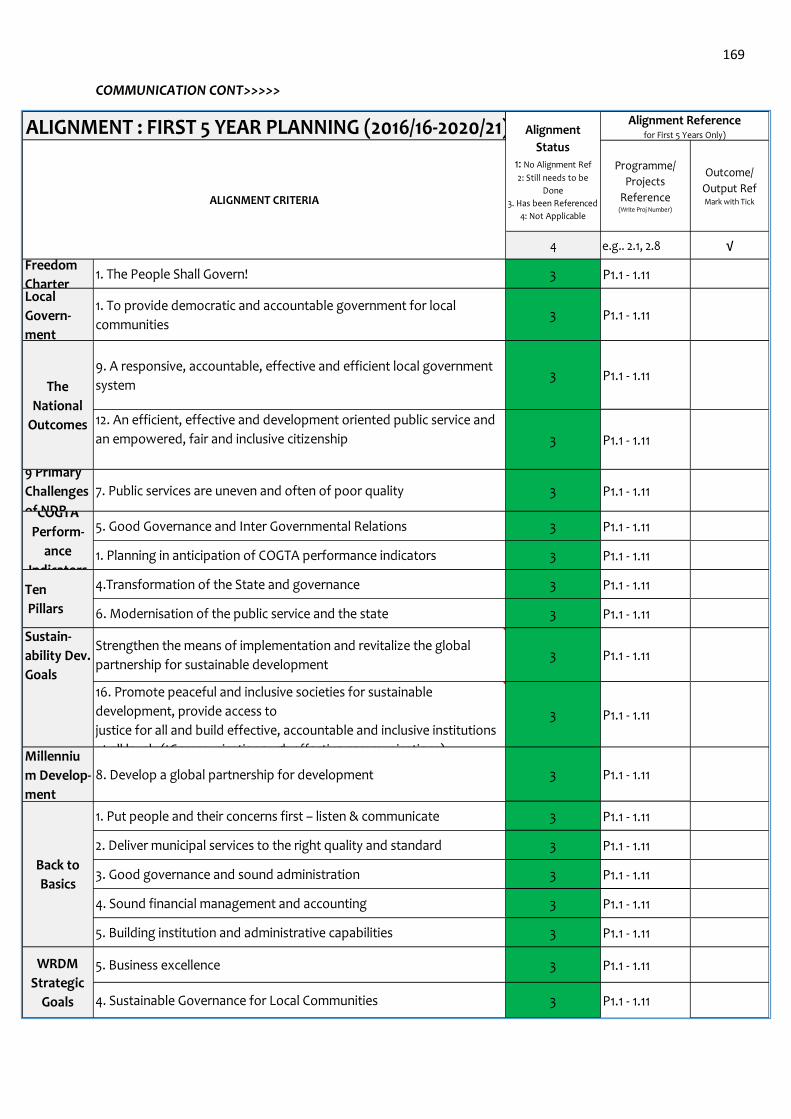
169
COMMUNICATION CONT>>>>>
ALIGNMENT : FIRST 5 YEAR PLANNING (2016/16-2020/21)
Programme/
Projects
Reference(Write Proj Number)
Outcome/
Output RefMark with Tick
4 e.g.. 2.1, 2.8 √Freedom
Charter3 P1.1 - 1.11
Local
Govern-
ment
3 P1.1 - 1.11
3 P1.1 - 1.11
3 P1.1 - 1.11
9 Primary
Challenges
of NDP
3 P1.1 - 1.11
3 P1.1 - 1.11
3 P1.1 - 1.11
3 P1.1 - 1.11
3 P1.1 - 1.11
Sustain-
ability Dev.
Goals
3 P1.1 - 1.11
3 P1.1 - 1.11
Millenniu
m Develop-
ment
3 P1.1 - 1.11
3 P1.1 - 1.11
3 P1.1 - 1.11
3 P1.1 - 1.11
3 P1.1 - 1.11
3 P1.1 - 1.11
3 P1.1 - 1.11
3 P1.1 - 1.114. Sustainable Governance for Local Communities
8. Develop a global partnership for development
COGTA
Perform-
ance
Indicators 4.Transformation of the State and governance
6. Modernisation of the public service and the state
5. Good Governance and Inter Governmental Relations
1. Planning in anticipation of COGTA performance indicators
Ten
Pillars
Strengthen the means of implementation and revitalize the global
partnership for sustainable development
16. Promote peaceful and inclusive societies for sustainable
development, provide access to
justice for all and build effective, accountable and inclusive institutions
at all levels (tCommunicationough effective communications)
Back to
Basics
1. Put people and their concerns first – listen & communicate
2. Deliver municipal services to the right quality and standard
3. Good governance and sound administration
4. Sound financial management and accounting
5. Building institution and administrative capabilities
Alignment
Status1: No Alignment Ref
2: Still needs to be
Done
3. Has been Referenced
4: Not Applicable
Alignment Referencefor First 5 Years Only)
ALIGNMENT CRITERIA
1. The People Shall Govern!
7. Public services are uneven and often of poor quality
The
National
Outcomes
9. A responsive, accountable, effective and efficient local government
system
12. An efficient, effective and development oriented public service and
an empowered, fair and inclusive citizenship
1. To provide democratic and accountable government for local
communities
5. Business excellenceWRDM
Strategic
Goals
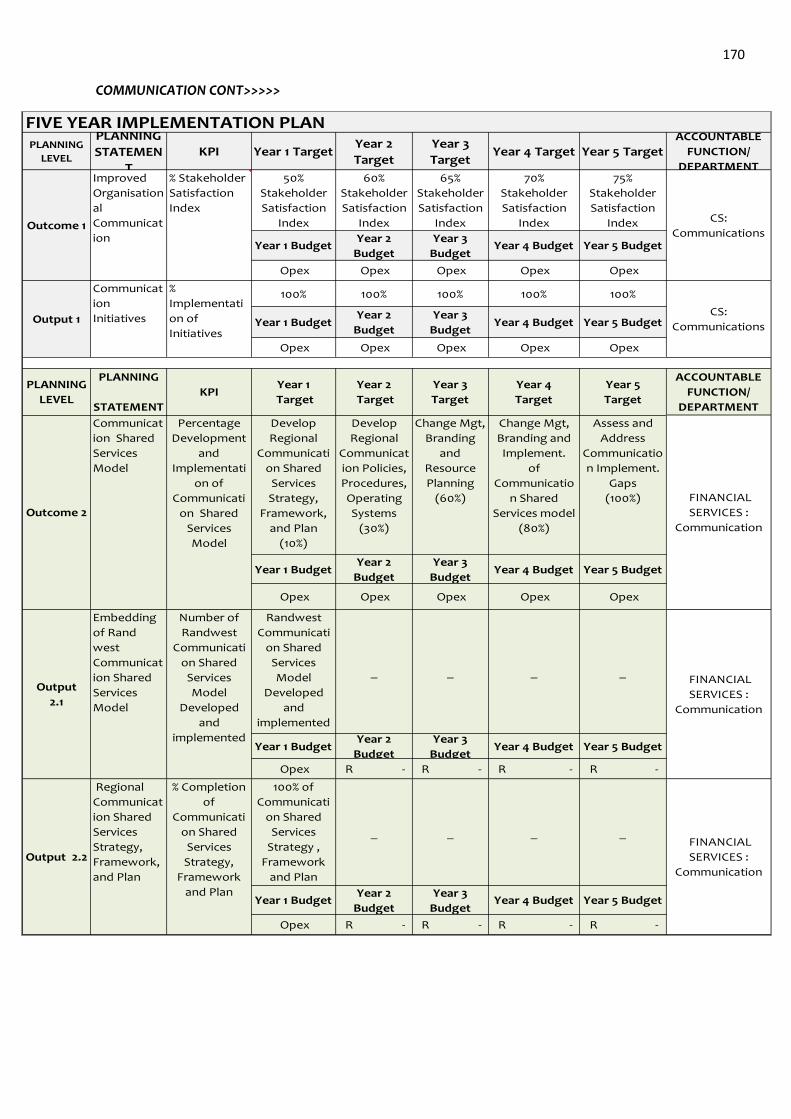
170
COMMUNICATION CONT>>>>>
PLANNING
LEVEL
PLANNING
STATEMEN
T
KPI Year 1 TargetYear 2
Target
Year 3
TargetYear 4 Target Year 5 Target
ACCOUNTABLE
FUNCTION/
DEPARTMENT50%
Stakeholder
Satisfaction
Index
60%
Stakeholder
Satisfaction
Index
65%
Stakeholder
Satisfaction
Index
70%
Stakeholder
Satisfaction
Index
75%
Stakeholder
Satisfaction
Index
Year 1 BudgetYear 2
Budget
Year 3
BudgetYear 4 Budget Year 5 Budget
Opex Opex Opex Opex Opex
100% 100% 100% 100% 100%
Year 1 BudgetYear 2
Budget
Year 3
BudgetYear 4 Budget Year 5 Budget
Opex Opex Opex Opex Opex
PLANNING
LEVEL
PLANNING
STATEMENT
KPIYear 1
Target
Year 2
Target
Year 3
Target
Year 4
Target
Year 5
Target
ACCOUNTABLE
FUNCTION/
DEPARTMENT
Develop
Regional
Communicati
on Shared
Services
Strategy,
Framework,
and Plan
(10%)
Develop
Regional
Communicat
ion Policies,
Procedures,
Operating
Systems
(30%)
Change Mgt,
Branding
and
Resource
Planning
(60%)
Change Mgt,
Branding and
Implement.
of
Communicatio
n Shared
Services model
(80%)
Assess and
Address
Communicatio
n Implement.
Gaps
(100%)
Year 1 BudgetYear 2
Budget
Year 3
BudgetYear 4 Budget Year 5 Budget
Opex Opex Opex Opex Opex
Randwest
Communicati
on Shared
Services
Model
Developed
and
implemented
_ _ _ _
Year 1 BudgetYear 2
Budget
Year 3
BudgetYear 4 Budget Year 5 Budget
Opex R - R - R - R -
100% of
Communicati
on Shared
Services
Strategy ,
Framework
and Plan
_ _ _ _
Year 1 BudgetYear 2
Budget
Year 3
BudgetYear 4 Budget Year 5 Budget
Opex R - R - R - R -
Output 1
Communicat
ion
Initiatives
%
Implementati
on of
Initiatives
CS:
Communications
FIVE YEAR IMPLEMENTATION PLAN
Outcome 1
Improved
Organisation
al
Communicat
ion
% Stakeholder
Satisfaction
IndexCS:
Communications
Embedding
of Rand
west
Communicat
ion Shared
Services
Model
Number of
Randwest
Communicati
on Shared
Services
Model
Developed
and
implemented
FINANCIAL
SERVICES :
Communication
Output 2.2
Regional
Communicat
ion Shared
Services
Strategy,
Framework,
and Plan
% Completion
of
Communicati
on Shared
Services
Strategy,
Framework
and Plan
FINANCIAL
SERVICES :
Communication
Outcome 2
Communicat
ion Shared
Services
Model
Percentage
Development
and
Implementati
on of
Communicati
on Shared
Services
Model
FINANCIAL
SERVICES :
Communication
Output
2.1
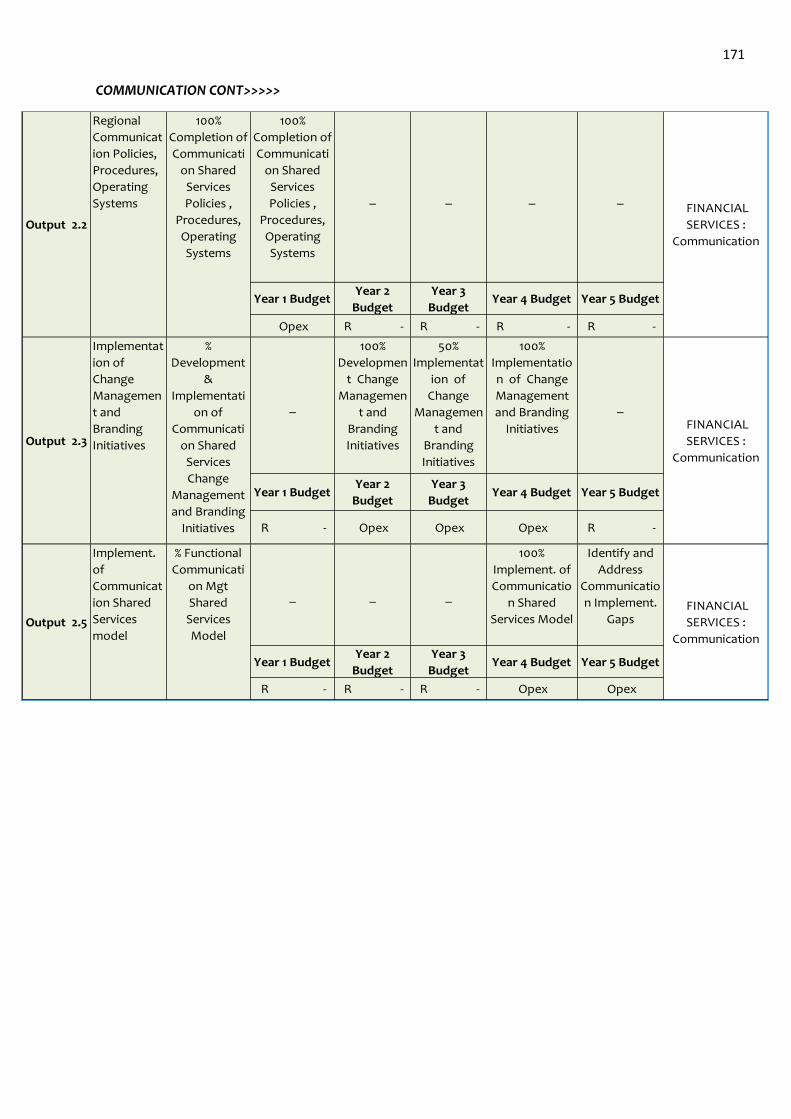
171
COMMUNICATION CONT>>>>>
100%
Completion of
Communicati
on Shared
Services
Policies ,
Procedures,
Operating
Systems
_ _ _ _
Year 1 BudgetYear 2
Budget
Year 3
BudgetYear 4 Budget Year 5 Budget
Opex R - R - R - R -
_
100%
Developmen
t Change
Managemen
t and
Branding
Initiatives
50%
Implementat
ion of
Change
Managemen
t and
Branding
Initiatives
100%
Implementatio
n of Change
Management
and Branding
Initiatives
_
Year 1 BudgetYear 2
Budget
Year 3
BudgetYear 4 Budget Year 5 Budget
R - Opex Opex Opex R -
_ _ _
100%
Implement. of
Communicatio
n Shared
Services Model
Identify and
Address
Communicatio
n Implement.
Gaps
Year 1 BudgetYear 2
Budget
Year 3
BudgetYear 4 Budget Year 5 Budget
R - R - R - Opex Opex
Output 2.5
Implement.
of
Communicat
ion Shared
Services
model
% Functional
Communicati
on Mgt
Shared
Services
Model
FINANCIAL
SERVICES :
Communication
Output 2.2
Regional
Communicat
ion Policies,
Procedures,
Operating
Systems
100%
Completion of
Communicati
on Shared
Services
Policies ,
Procedures,
Operating
Systems
FINANCIAL
SERVICES :
Communication
Output 2.3
Implementat
ion of
Change
Managemen
t and
Branding
Initiatives
%
Development
&
Implementati
on of
Communicati
on Shared
Services
Change
Management
and Branding
Initiatives
FINANCIAL
SERVICES :
Communication
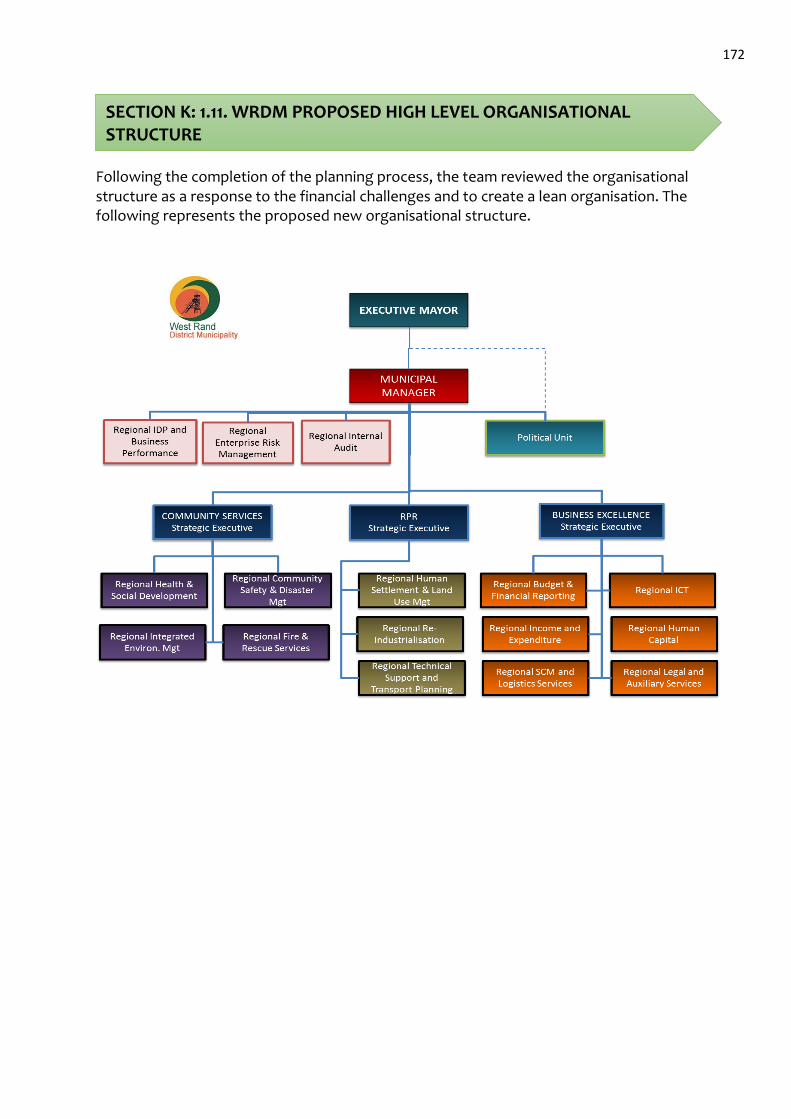
172
Following the completion of the planning process, the team reviewed the organisational structure as a response to the financial challenges and to create a lean organisation. The following represents the proposed new organisational structure.
SECTION K: 1.11. WRDM PROPOSED HIGH LEVEL ORGANISATIONAL STRUCTURE
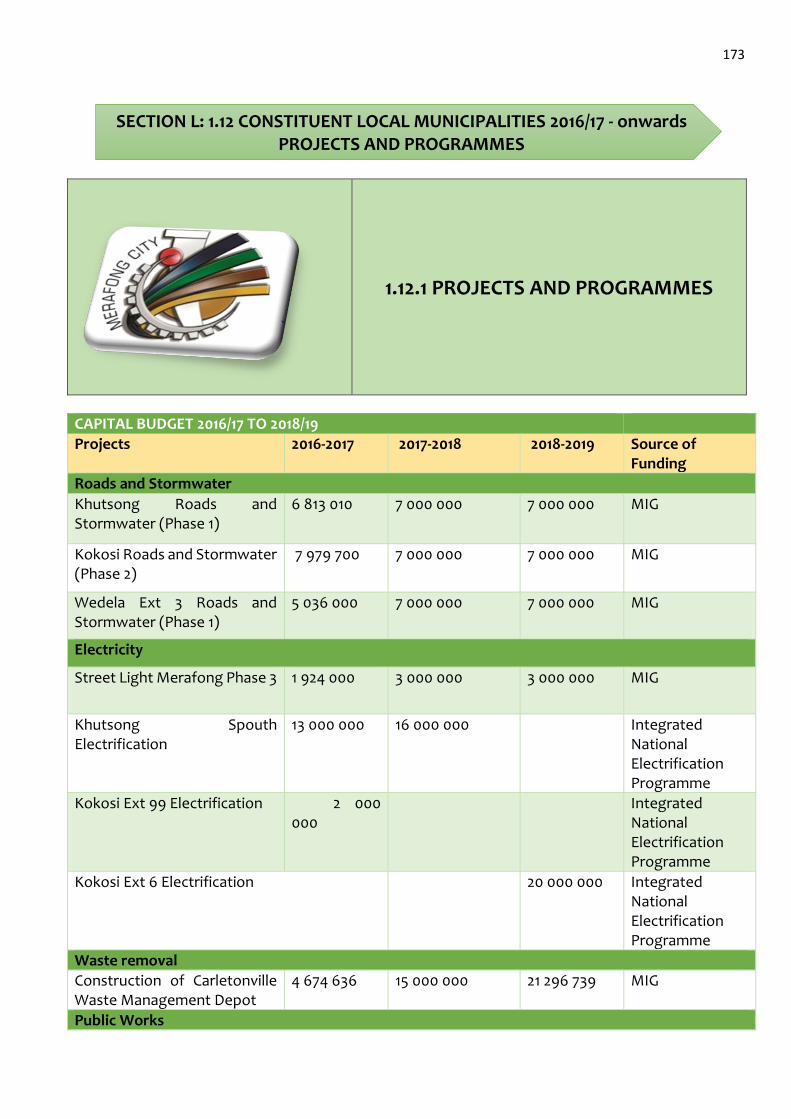
173
1.12.1 PROJECTS AND PROGRAMMES
CAPITAL BUDGET 2016/17 TO 2018/19
Projects 2016-2017 2017-2018 2018-2019 Source of Funding
Roads and Stormwater
Khutsong Roads and Stormwater (Phase 1)
6 813 010 7 000 000 7 000 000 MIG
Kokosi Roads and Stormwater (Phase 2)
7 979 700 7 000 000 7 000 000 MIG
Wedela Ext 3 Roads and Stormwater (Phase 1)
5 036 000 7 000 000 7 000 000 MIG
Electricity
Street Light Merafong Phase 3 1 924 000 3 000 000 3 000 000 MIG
Khutsong Spouth Electrification
13 000 000 16 000 000 Integrated National Electrification Programme
Kokosi Ext 99 Electrification 2 000 000
Integrated National Electrification Programme
Kokosi Ext 6 Electrification 20 000 000 Integrated National Electrification Programme
Waste removal
Construction of Carletonville Waste Management Depot
4 674 636 15 000 000 21 296 739 MIG
Public Works
SECTION L: 1.12 CONSTITUENT LOCAL MUNICIPALITIES 2016/17 - onwards PROJECTS AND PROGRAMMES
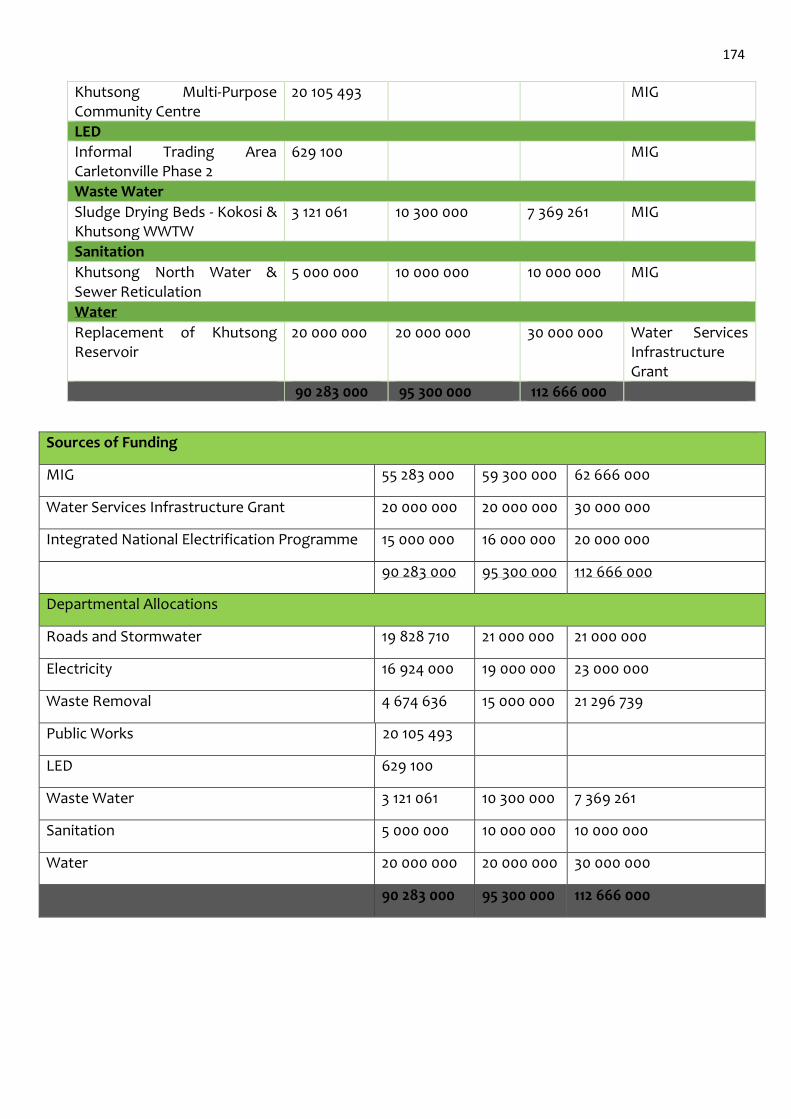
174
Khutsong Multi-Purpose Community Centre
20 105 493 MIG
LED
Informal Trading Area Carletonville Phase 2
629 100 MIG
Waste Water
Sludge Drying Beds - Kokosi & Khutsong WWTW
3 121 061 10 300 000 7 369 261 MIG
Sanitation
Khutsong North Water & Sewer Reticulation
5 000 000 10 000 000 10 000 000 MIG
Water
Replacement of Khutsong Reservoir
20 000 000 20 000 000 30 000 000 Water Services Infrastructure Grant
90 283 000 95 300 000 112 666 000
Sources of Funding
MIG 55 283 000 59 300 000 62 666 000
Water Services Infrastructure Grant 20 000 000 20 000 000 30 000 000
Integrated National Electrification Programme 15 000 000 16 000 000 20 000 000
90 283 000 95 300 000 112 666 000
Departmental Allocations
Roads and Stormwater 19 828 710 21 000 000 21 000 000
Electricity 16 924 000 19 000 000 23 000 000
Waste Removal 4 674 636 15 000 000 21 296 739
Public Works 20 105 493
LED 629 100
Waste Water 3 121 061 10 300 000 7 369 261
Sanitation 5 000 000 10 000 000 10 000 000
Water 20 000 000 20 000 000 30 000 000
90 283 000 95 300 000 112 666 000
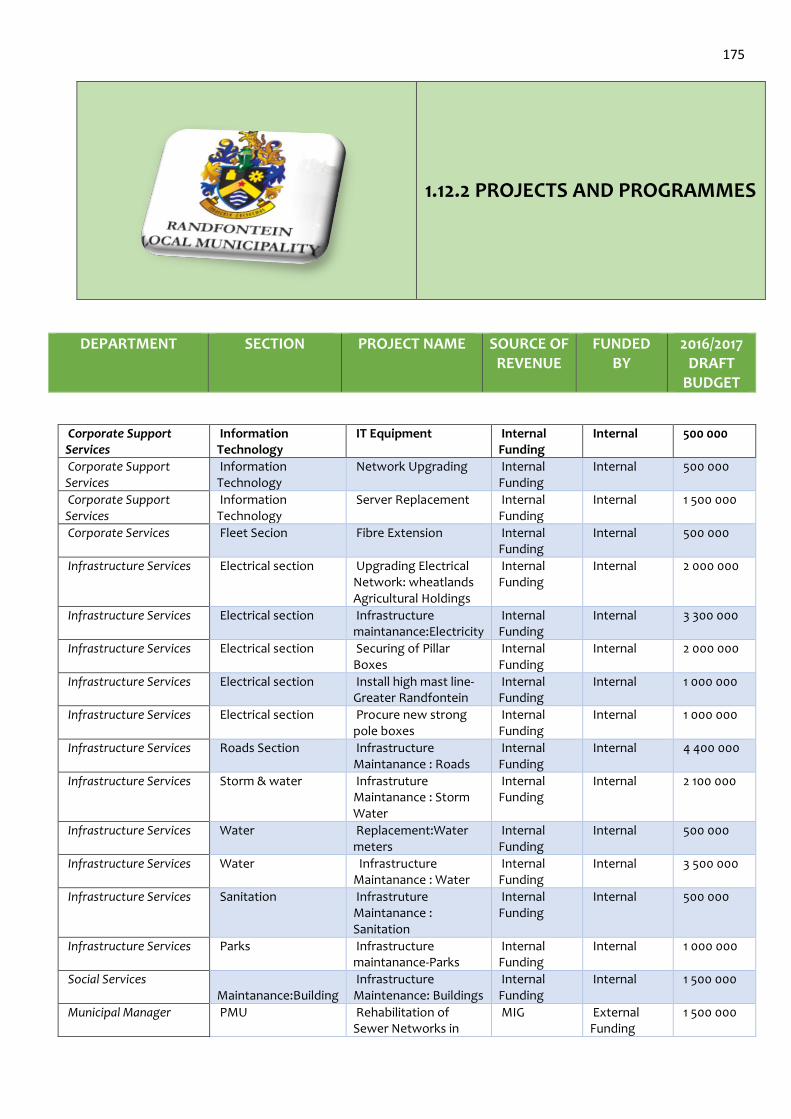
175
1.12.2 PROJECTS AND PROGRAMMES
DEPARTMENT SECTION PROJECT NAME SOURCE OF REVENUE
FUNDED BY
2016/2017 DRAFT
BUDGET
Corporate Support Services
Information Technology
IT Equipment Internal Funding
Internal 500 000
Corporate Support Services
Information Technology
Network Upgrading Internal Funding
Internal 500 000
Corporate Support Services
Information Technology
Server Replacement Internal Funding
Internal 1 500 000
Corporate Services Fleet Secion Fibre Extension Internal Funding
Internal 500 000
Infrastructure Services Electrical section Upgrading Electrical Network: wheatlands Agricultural Holdings
Internal Funding
Internal 2 000 000
Infrastructure Services Electrical section Infrastructure maintanance:Electricity
Internal Funding
Internal 3 300 000
Infrastructure Services Electrical section Securing of Pillar Boxes
Internal Funding
Internal 2 000 000
Infrastructure Services Electrical section Install high mast line- Greater Randfontein
Internal Funding
Internal 1 000 000
Infrastructure Services Electrical section Procure new strong pole boxes
Internal Funding
Internal 1 000 000
Infrastructure Services Roads Section Infrastructure Maintanance : Roads
Internal Funding
Internal 4 400 000
Infrastructure Services Storm & water Infrastruture Maintanance : Storm Water
Internal Funding
Internal 2 100 000
Infrastructure Services Water Replacement:Water meters
Internal Funding
Internal 500 000
Infrastructure Services Water Infrastructure Maintanance : Water
Internal Funding
Internal 3 500 000
Infrastructure Services Sanitation Infrastruture Maintanance : Sanitation
Internal Funding
Internal 500 000
Infrastructure Services Parks Infrastructure maintanance-Parks
Internal Funding
Internal 1 000 000
Social Services Maintanance:Building
Infrastructure Maintenance: Buildings
Internal Funding
Internal 1 500 000
Municipal Manager PMU Rehabilitation of Sewer Networks in
MIG External Funding
1 500 000
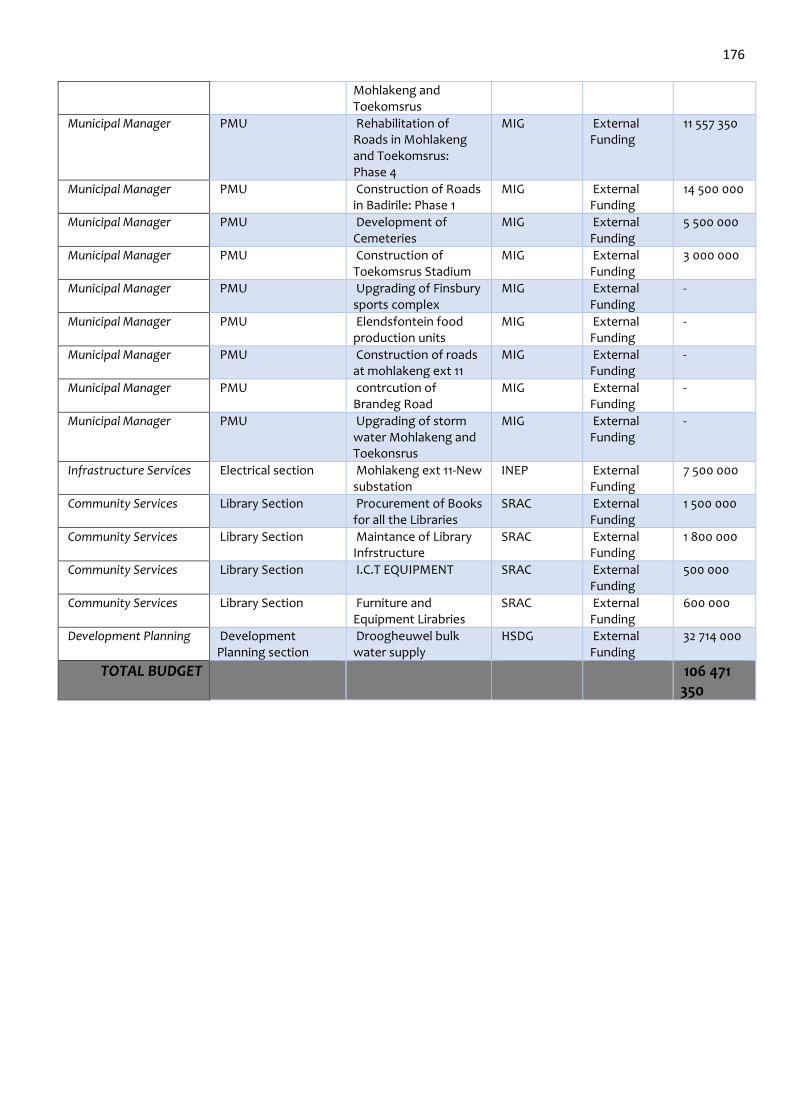
176
Mohlakeng and Toekomsrus
Municipal Manager PMU Rehabilitation of Roads in Mohlakeng and Toekomsrus: Phase 4
MIG External Funding
11 557 350
Municipal Manager PMU Construction of Roads in Badirile: Phase 1
MIG External Funding
14 500 000
Municipal Manager PMU Development of Cemeteries
MIG External Funding
5 500 000
Municipal Manager PMU Construction of Toekomsrus Stadium
MIG External Funding
3 000 000
Municipal Manager PMU Upgrading of Finsbury sports complex
MIG External Funding
-
Municipal Manager PMU Elendsfontein food production units
MIG External Funding
-
Municipal Manager PMU Construction of roads at mohlakeng ext 11
MIG External Funding
-
Municipal Manager PMU contrcution of Brandeg Road
MIG External Funding
-
Municipal Manager PMU Upgrading of storm water Mohlakeng and Toekonsrus
MIG External Funding
-
Infrastructure Services Electrical section Mohlakeng ext 11-New substation
INEP External Funding
7 500 000
Community Services Library Section Procurement of Books for all the Libraries
SRAC External Funding
1 500 000
Community Services Library Section Maintance of Library Infrstructure
SRAC External Funding
1 800 000
Community Services Library Section I.C.T EQUIPMENT SRAC External Funding
500 000
Community Services Library Section Furniture and Equipment Lirabries
SRAC External Funding
600 000
Development Planning Development Planning section
Droogheuwel bulk water supply
HSDG External Funding
32 714 000
TOTAL BUDGET 106 471 350
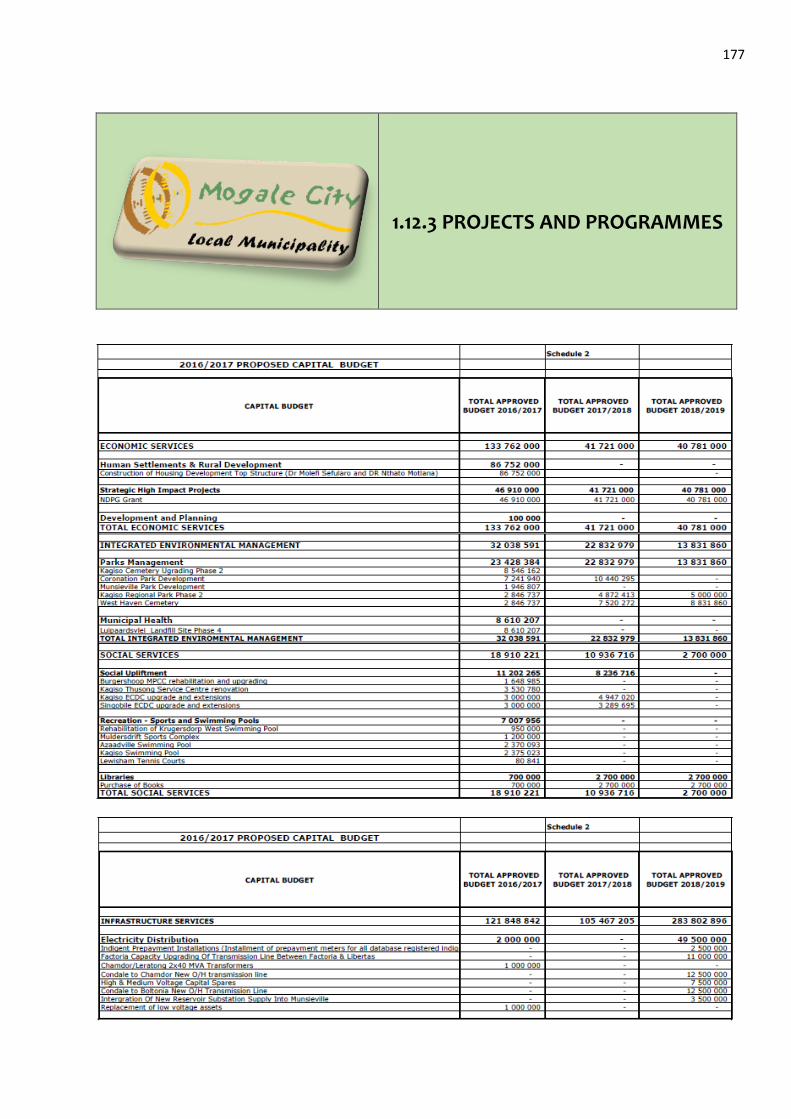
177
1.12.3 PROJECTS AND PROGRAMMES
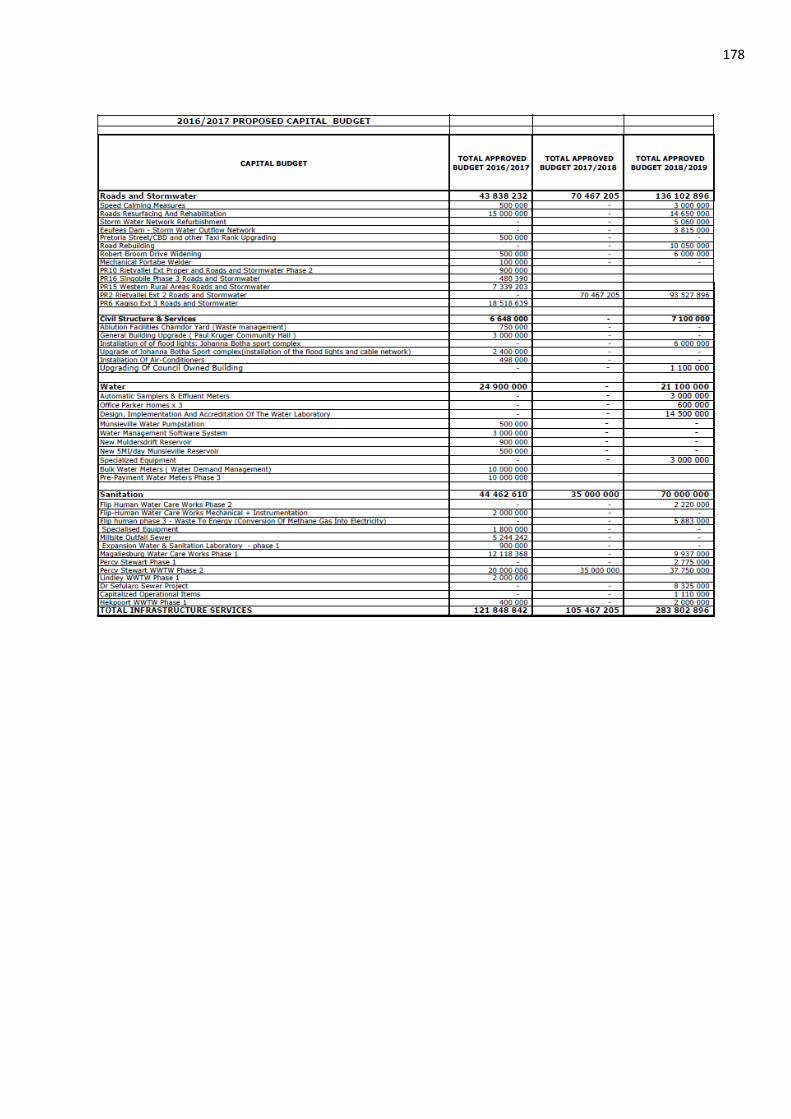
178
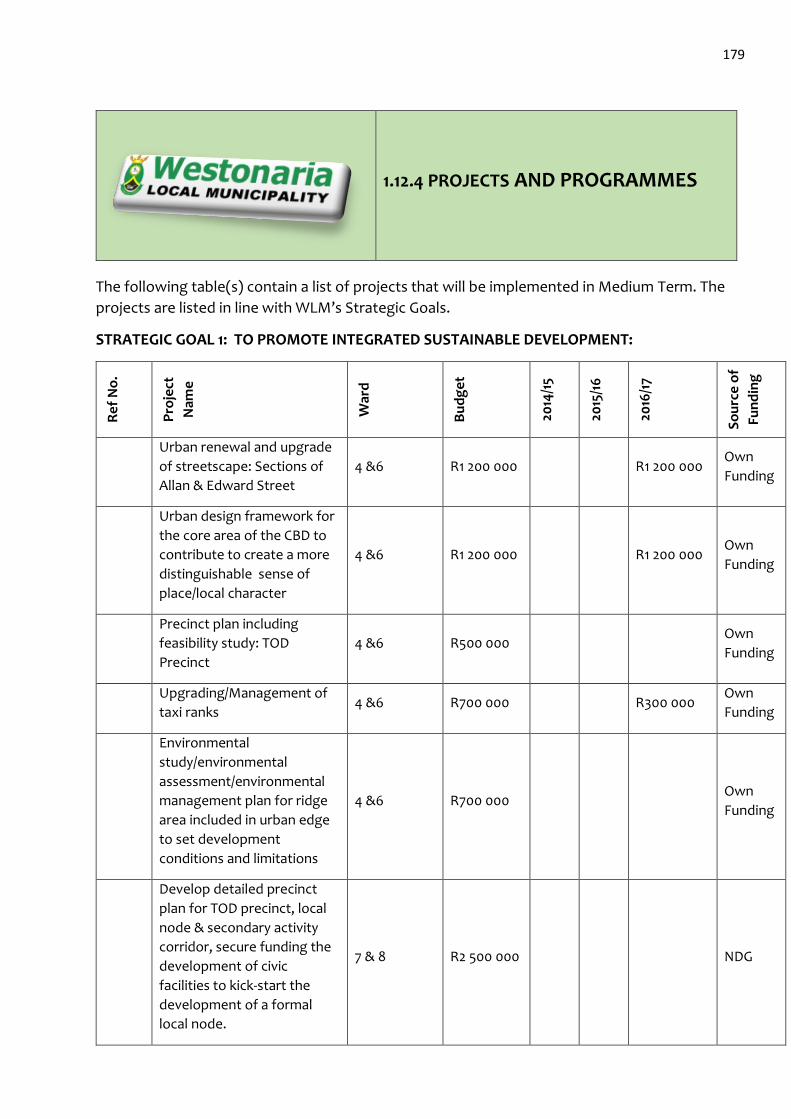
179
1.12.4 PROJECTS AND PROGRAMMES
The following table(s) contain a list of projects that will be implemented in Medium Term. The
projects are listed in line with WLM’s Strategic Goals.
STRATEGIC GOAL 1: TO PROMOTE INTEGRATED SUSTAINABLE DEVELOPMENT:
Re
f N
o.
Pro
ject
Nam
e
War
d
Bu
dg
et
2014
/15
2015
/16
2016
/17
So
urc
e o
f
Fun
din
g
Urban renewal and upgrade
of streetscape: Sections of
Allan & Edward Street
4 &6 R1 200 000 R1 200 000 Own
Funding
Urban design framework for
the core area of the CBD to
contribute to create a more
distinguishable sense of
place/local character
4 &6 R1 200 000 R1 200 000 Own
Funding
Precinct plan including
feasibility study: TOD
Precinct
4 &6 R500 000 Own
Funding
Upgrading/Management of
taxi ranks 4 &6 R700 000 R300 000
Own
Funding
Environmental
study/environmental
assessment/environmental
management plan for ridge
area included in urban edge
to set development
conditions and limitations
4 &6 R700 000 Own
Funding
Develop detailed precinct
plan for TOD precinct, local
node & secondary activity
corridor, secure funding the
development of civic
facilities to kick-start the
development of a formal
local node.
7 & 8 R2 500 000 NDG
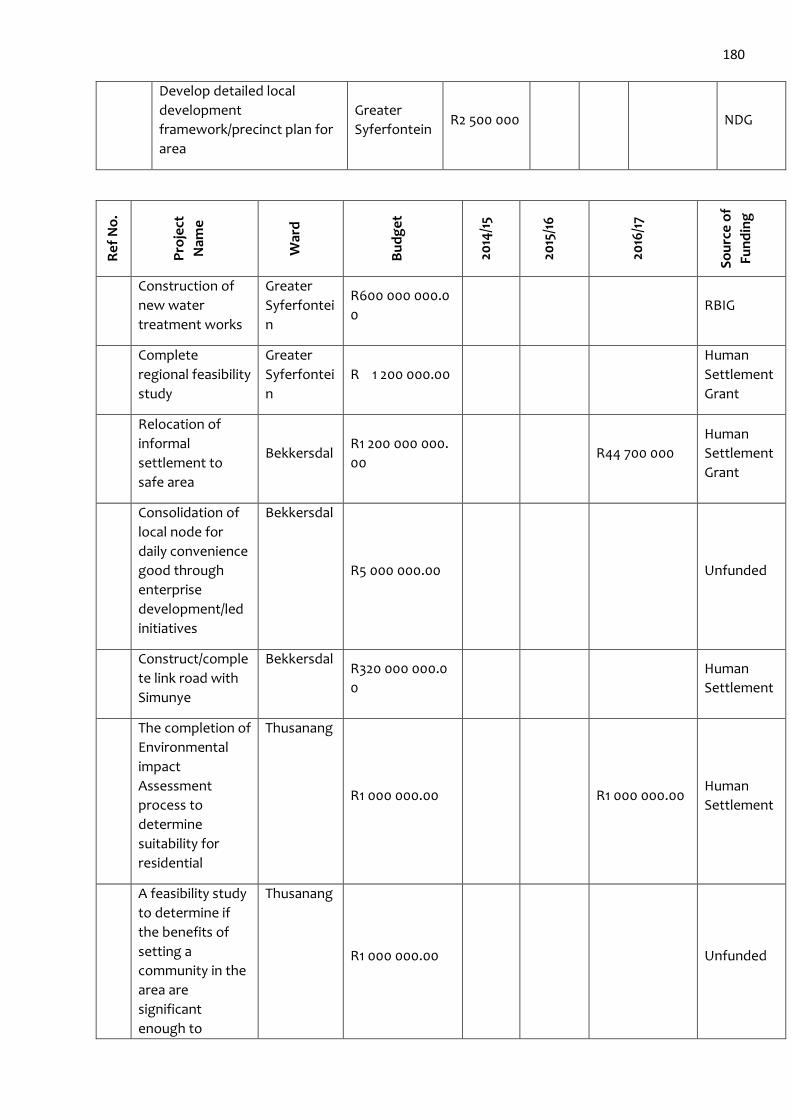
180
Develop detailed local
development
framework/precinct plan for
area
Greater
Syferfontein R2 500 000 NDG
Re
f N
o.
Pro
ject
Nam
e
War
d
Bu
dg
et
2014
/15
2015
/16
2016
/17
So
urc
e o
f
Fun
din
g
Construction of
new water
treatment works
Greater
Syferfontei
n
R600 000 000.0
0 RBIG
Complete
regional feasibility
study
Greater
Syferfontei
n
R 1 200 000.00
Human
Settlement
Grant
Relocation of
informal
settlement to
safe area
Bekkersdal R1 200 000 000.
00 R44 700 000
Human
Settlement
Grant
Consolidation of
local node for
daily convenience
good through
enterprise
development/led
initiatives
Bekkersdal
R5 000 000.00 Unfunded
Construct/comple
te link road with
Simunye
Bekkersdal R320 000 000.0
0
Human
Settlement
The completion of
Environmental
impact
Assessment
process to
determine
suitability for
residential
Thusanang
R1 000 000.00 R1 000 000.00 Human
Settlement
A feasibility study
to determine if
the benefits of
setting a
community in the
area are
significant
enough to
Thusanang
R1 000 000.00 Unfunded
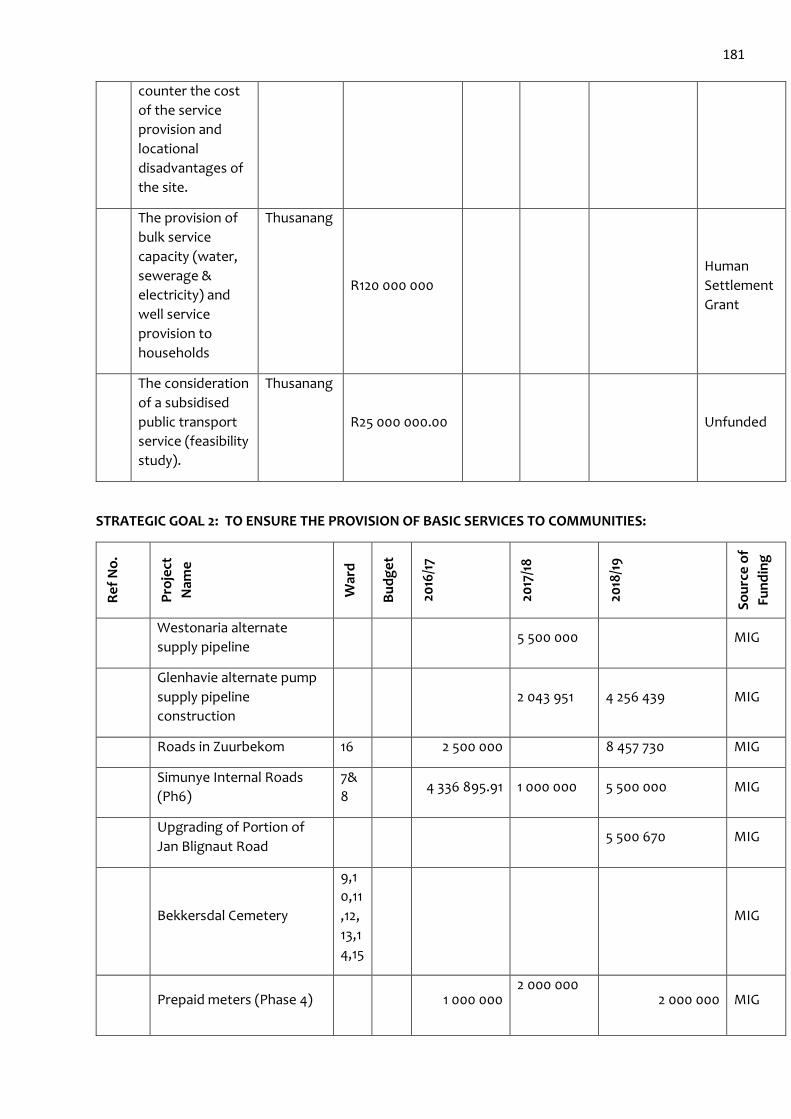
181
counter the cost
of the service
provision and
locational
disadvantages of
the site.
The provision of
bulk service
capacity (water,
sewerage &
electricity) and
well service
provision to
households
Thusanang
R120 000 000
Human
Settlement
Grant
The consideration
of a subsidised
public transport
service (feasibility
study).
Thusanang
R25 000 000.00 Unfunded
STRATEGIC GOAL 2: TO ENSURE THE PROVISION OF BASIC SERVICES TO COMMUNITIES:
Re
f N
o.
Pro
ject
Nam
e
War
d
Bu
dg
et
2016
/17
2017
/18
2018
/19
So
urc
e o
f
Fun
din
g
Westonaria alternate
supply pipeline 5 500 000 MIG
Glenhavie alternate pump
supply pipeline
construction
2 043 951 4 256 439 MIG
Roads in Zuurbekom 16 2 500 000 8 457 730 MIG
Simunye Internal Roads
(Ph6)
7&
8 4 336 895.91 1 000 000 5 500 000 MIG
Upgrading of Portion of
Jan Blignaut Road 5 500 670 MIG
Bekkersdal Cemetery
9,1
0,11
,12,
13,1
4,15
MIG
Prepaid meters (Phase 4) 1 000 000 2 000 000
2 000 000 MIG
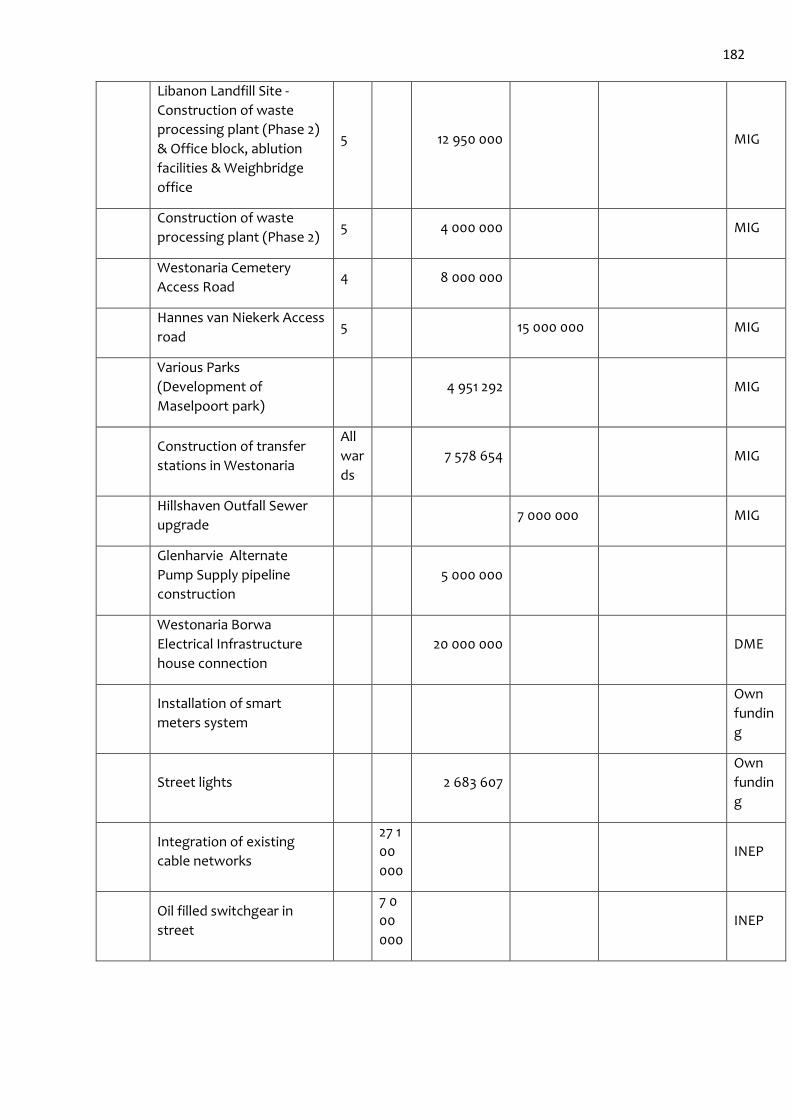
182
Libanon Landfill Site -
Construction of waste
processing plant (Phase 2)
& Office block, ablution
facilities & Weighbridge
office
5 12 950 000 MIG
Construction of waste
processing plant (Phase 2) 5 4 000 000 MIG
Westonaria Cemetery
Access Road 4 8 000 000
Hannes van Niekerk Access
road 5 15 000 000 MIG
Various Parks
(Development of
Maselpoort park)
4 951 292 MIG
Construction of transfer
stations in Westonaria
All
war
ds
7 578 654 MIG
Hillshaven Outfall Sewer
upgrade 7 000 000 MIG
Glenharvie Alternate
Pump Supply pipeline
construction
5 000 000
Westonaria Borwa
Electrical Infrastructure
house connection
20 000 000 DME
Installation of smart
meters system
Own
fundin
g
Street lights 2 683 607
Own
fundin
g
Integration of existing
cable networks
27 1
00
000
INEP
Oil filled switchgear in
street
7 0
00
000
INEP
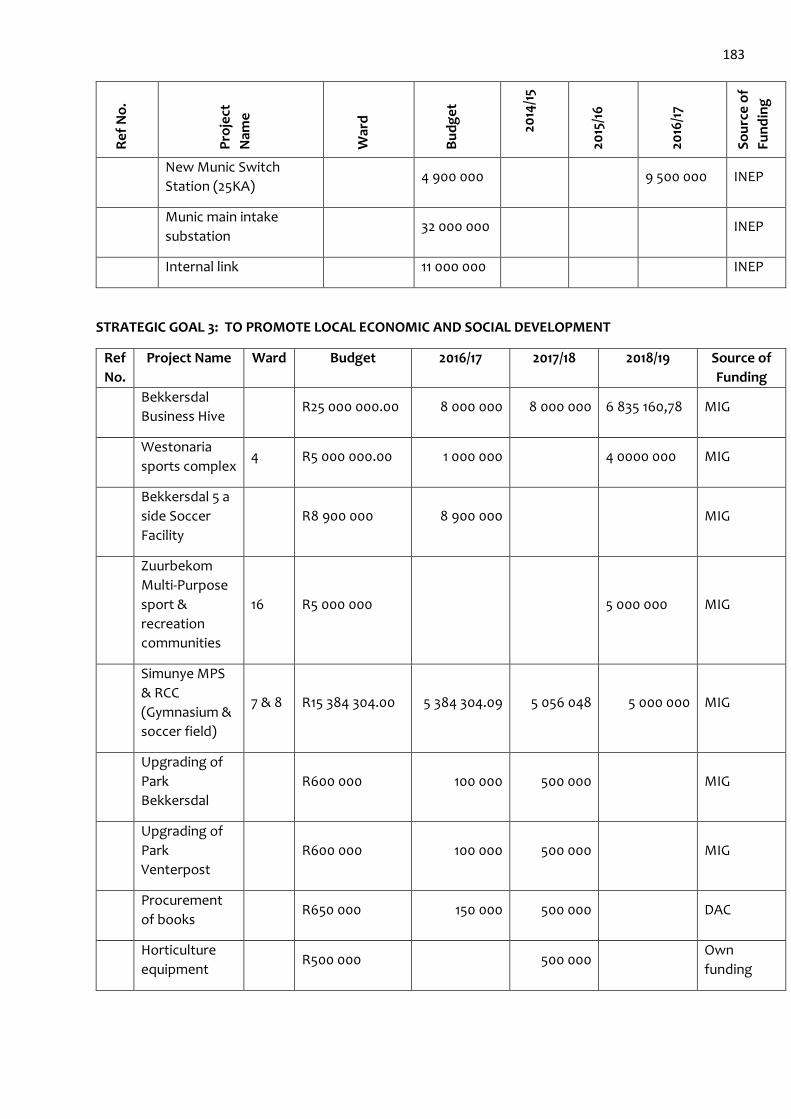
183
Re
f N
o.
Pro
ject
Nam
e
War
d
Bu
dg
et
2014
/15
2015
/16
2016
/17
So
urc
e o
f
Fun
din
g
New Munic Switch
Station (25KA) 4 900 000 9 500 000 INEP
Munic main intake
substation 32 000 000 INEP
Internal link 11 000 000 INEP
STRATEGIC GOAL 3: TO PROMOTE LOCAL ECONOMIC AND SOCIAL DEVELOPMENT
Ref
No.
Project Name Ward Budget 2016/17 2017/18 2018/19 Source of
Funding
Bekkersdal
Business Hive R25 000 000.00 8 000 000 8 000 000 6 835 160,78 MIG
Westonaria
sports complex 4 R5 000 000.00 1 000 000 4 0000 000 MIG
Bekkersdal 5 a
side Soccer
Facility
R8 900 000 8 900 000 MIG
Zuurbekom
Multi-Purpose
sport &
recreation
communities
16 R5 000 000 5 000 000 MIG
Simunye MPS
& RCC
(Gymnasium &
soccer field)
7 & 8 R15 384 304.00 5 384 304.09 5 056 048 5 000 000 MIG
Upgrading of
Park
Bekkersdal
R600 000 100 000 500 000 MIG
Upgrading of
Park
Venterpost
R600 000 100 000 500 000 MIG
Procurement
of books R650 000 150 000 500 000 DAC
Horticulture
equipment R500 000 500 000
Own
funding
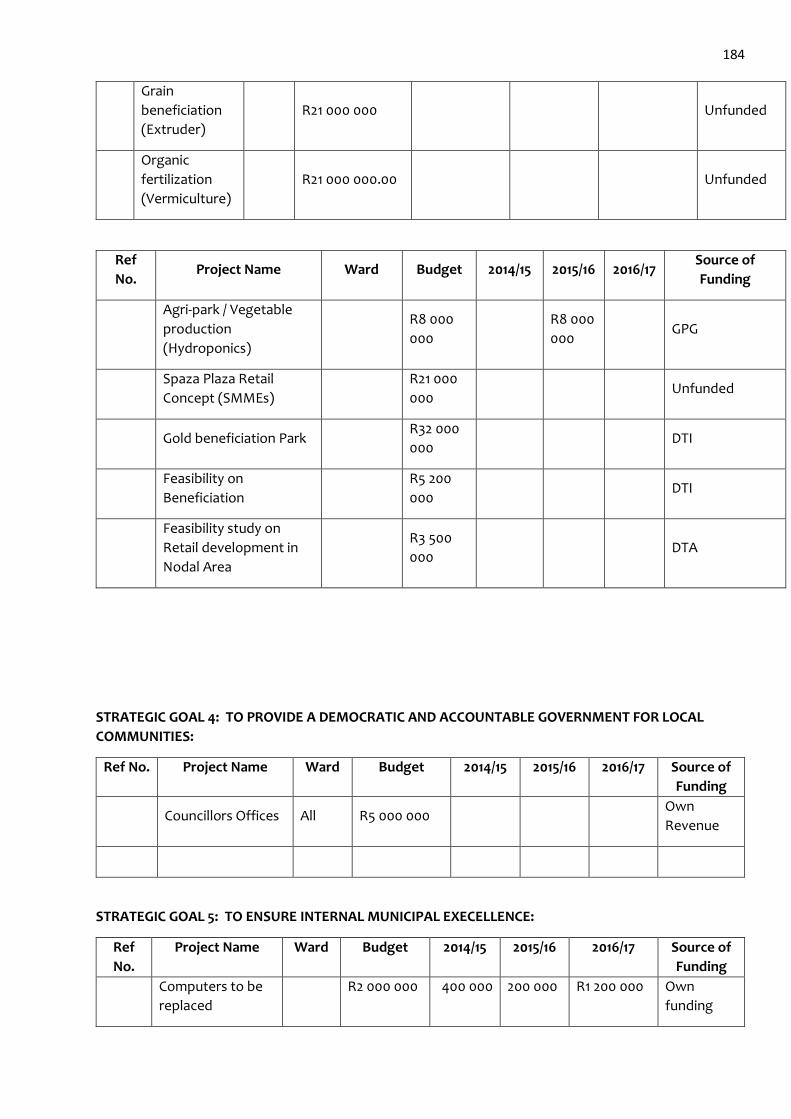
184
Grain
beneficiation
(Extruder)
R21 000 000 Unfunded
Organic
fertilization
(Vermiculture)
R21 000 000.00 Unfunded
Ref
No. Project Name Ward Budget 2014/15 2015/16 2016/17
Source of
Funding
Agri-park / Vegetable
production
(Hydroponics)
R8 000
000
R8 000
000 GPG
Spaza Plaza Retail
Concept (SMMEs)
R21 000
000 Unfunded
Gold beneficiation Park R32 000
000 DTI
Feasibility on
Beneficiation
R5 200
000 DTI
Feasibility study on
Retail development in
Nodal Area
R3 500
000 DTA
STRATEGIC GOAL 4: TO PROVIDE A DEMOCRATIC AND ACCOUNTABLE GOVERNMENT FOR LOCAL
COMMUNITIES:
Ref No. Project Name Ward Budget 2014/15 2015/16 2016/17 Source of
Funding
Councillors Offices All R5 000 000 Own
Revenue
STRATEGIC GOAL 5: TO ENSURE INTERNAL MUNICIPAL EXECELLENCE:
Ref
No.
Project Name Ward Budget 2014/15 2015/16 2016/17 Source of
Funding
Computers to be
replaced
R2 000 000 400 000 200 000 R1 200 000 Own
funding
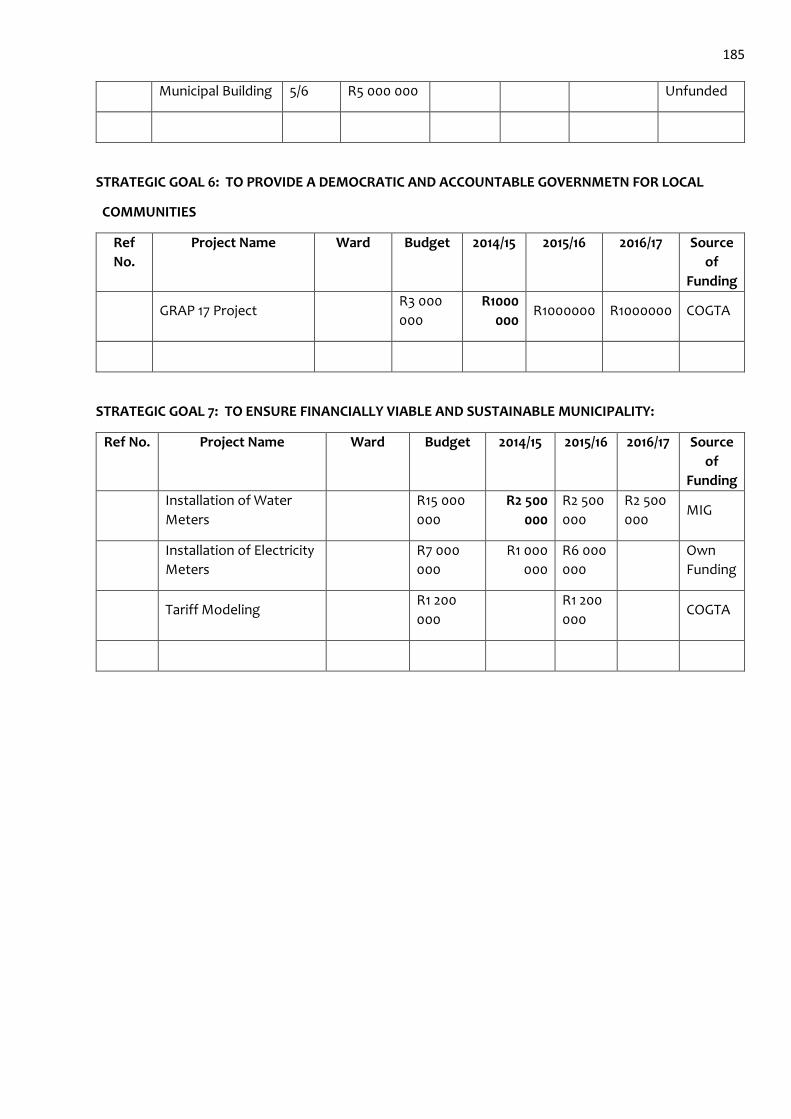
185
Municipal Building 5/6 R5 000 000 Unfunded
STRATEGIC GOAL 6: TO PROVIDE A DEMOCRATIC AND ACCOUNTABLE GOVERNMETN FOR LOCAL
COMMUNITIES
Ref
No.
Project Name Ward Budget 2014/15 2015/16 2016/17 Source
of
Funding
GRAP 17 Project R3 000
000
R1000
000 R1000000 R1000000 COGTA
STRATEGIC GOAL 7: TO ENSURE FINANCIALLY VIABLE AND SUSTAINABLE MUNICIPALITY:
Ref No. Project Name Ward Budget 2014/15 2015/16 2016/17 Source
of
Funding
Installation of Water
Meters
R15 000
000
R2 500
000
R2 500
000
R2 500
000 MIG
Installation of Electricity
Meters
R7 000
000
R1 000
000
R6 000
000
Own
Funding
Tariff Modeling R1 200
000
R1 200
000 COGTA
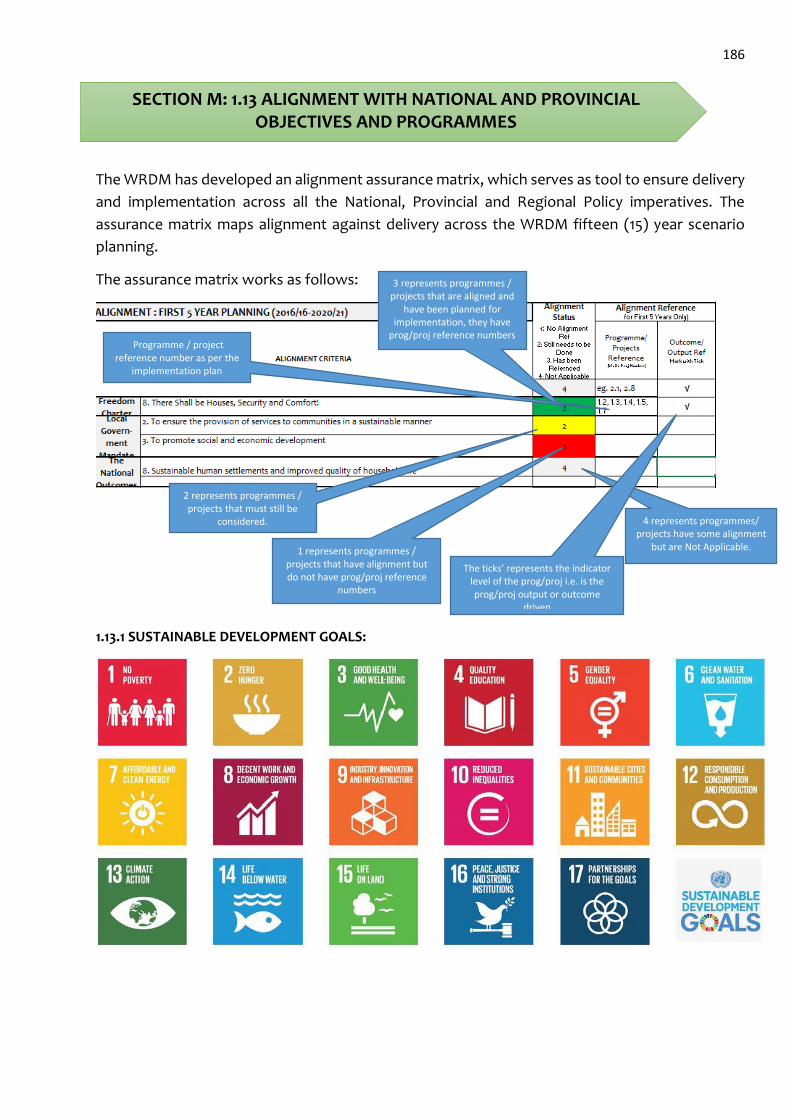
186
The WRDM has developed an alignment assurance matrix, which serves as tool to ensure delivery
and implementation across all the National, Provincial and Regional Policy imperatives. The
assurance matrix maps alignment against delivery across the WRDM fifteen (15) year scenario
planning.
The assurance matrix works as follows:
1.13.1 SUSTAINABLE DEVELOPMENT GOALS:
SECTION M: 1.13 ALIGNMENT WITH NATIONAL AND PROVINCIAL OBJECTIVES AND PROGRAMMES
3 represents programmes / projects that are aligned and
have been planned for implementation, they have
prog/proj reference numbers
2 represents programmes / projects that must still be
considered.
1 represents programmes / projects that have alignment but do not have prog/proj reference
numbers
4 represents programmes/ projects have some alignment
but are Not Applicable.
The ticks’ represents the indicator level of the prog/proj i.e. is the prog/proj output or outcome
driven
Programme / project reference number as per the
implementation plan
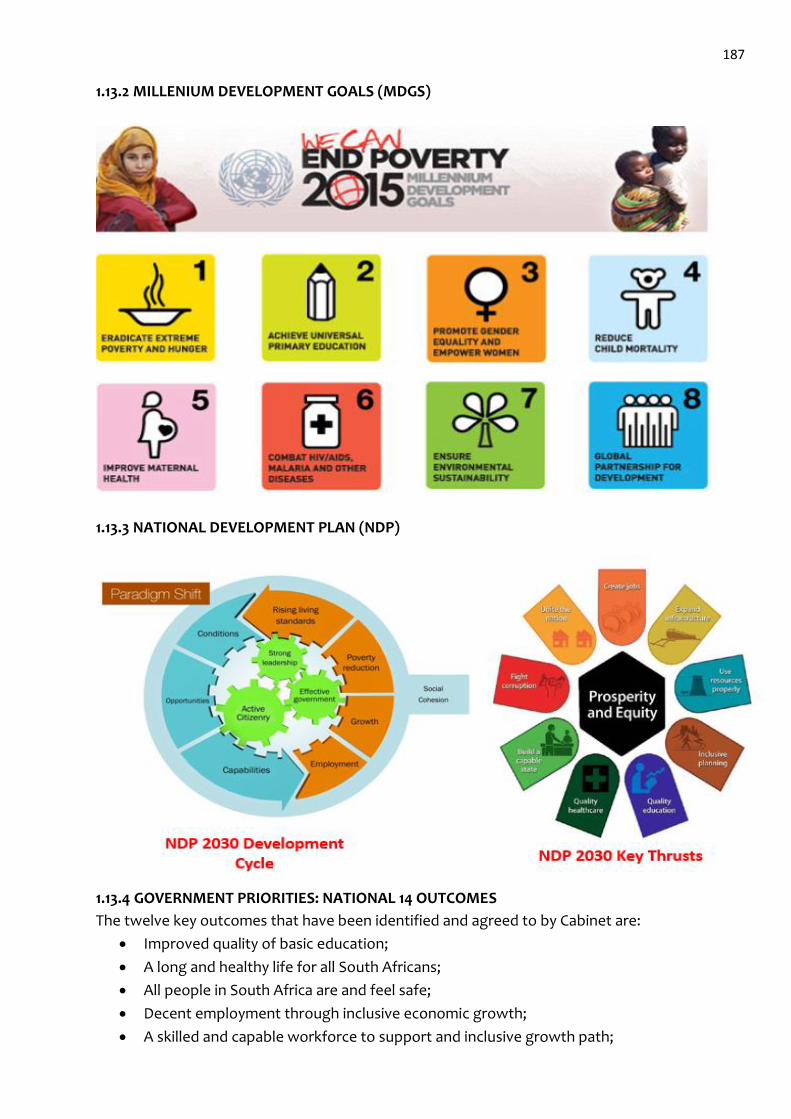
187
1.13.2 MILLENIUM DEVELOPMENT GOALS (MDGS)
1.13.3 NATIONAL DEVELOPMENT PLAN (NDP)
1.13.4 GOVERNMENT PRIORITIES: NATIONAL 14 OUTCOMES
The twelve key outcomes that have been identified and agreed to by Cabinet are:
Improved quality of basic education;
A long and healthy life for all South Africans;
All people in South Africa are and feel safe;
Decent employment through inclusive economic growth;
A skilled and capable workforce to support and inclusive growth path;

188
An efficient, competitive and responsive economic infrastructure network;
Vibrant, equitable and sustainable rural communities with food security for all;
Sustainable human settlements and improved quality of household life;
A responsive, accountable, effective and efficient local government system;
Environmental assets and natural resources that are well protected and continually
enhanced;
Create a better South Africa and contribute to a better and safer Africa and World;
An efficient, effective and development oriented public service and an empowered, fair
and inclusive citizenship;
Social protection; and
Nation building and social cohesion
1.13.5 BACK TO BASICS
1.13.6 GAUTENG GLOBAL CITY REGION STRATEGY
The primary objective of the Global City Region (as highlighted in the Gauteng Growth and
Development Strategy) is to build Gauteng into an integrated and globally competitive region
where the economic activities of different parts of the Province complement each other in
consolidating Gauteng as an economic hub of Africa and an internationally recognised global city
region. The main aim of this is to encourage great internal coherence and cooperation within the
Province, for greater external competitiveness.
The strategy seeks to align the various planning instruments, structures and sectors in Gauteng in
order to realize the “Global City Region”. Gauteng’s rapid economic growth and expanded social
service delivery has accelerated in-migration and placed increasing pressure on the environment.
The growing social and environmental challenges are an increasing burden on Gauteng’s stability
and sustainability. Unless these challenges are addressed they will pose a significant complication
for the future prosperity and development of the Province. Thus issues of Environmental
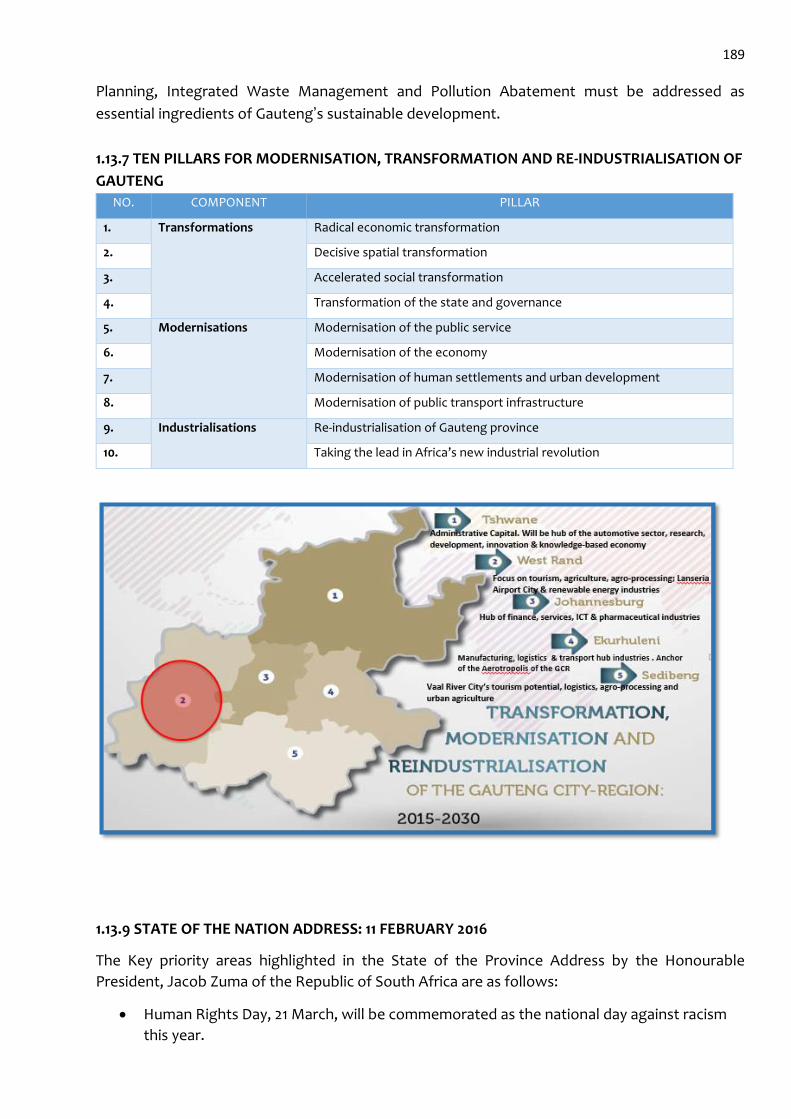
189
Planning, Integrated Waste Management and Pollution Abatement must be addressed as
essential ingredients of Gauteng’s sustainable development.
1.13.7 TEN PILLARS FOR MODERNISATION, TRANSFORMATION AND RE-INDUSTRIALISATION OF
GAUTENG
NO. COMPONENT PILLAR
1. Transformations Radical economic transformation
2. Decisive spatial transformation
3. Accelerated social transformation
4. Transformation of the state and governance
5. Modernisations Modernisation of the public service
6. Modernisation of the economy
7. Modernisation of human settlements and urban development
8. Modernisation of public transport infrastructure
9. Industrialisations Re-industrialisation of Gauteng province
10. Taking the lead in Africa’s new industrial revolution
1.13.9 STATE OF THE NATION ADDRESS: 11 FEBRUARY 2016
The Key priority areas highlighted in the State of the Province Address by the Honourable
President, Jacob Zuma of the Republic of South Africa are as follows:
Human Rights Day, 21 March, will be commemorated as the national day against racism
this year.
190
A resilient and fast growing economy is at the heart of our radical economic
transformation agenda and our National Development Plan (NDP).
The South African continent remains an attractive investment destination. It may face
challenges, but its positive attributes far outweigh those challenges.
The Trans Caledon Tunnel Authority has constructed dams of varied capacities, thus
making it possible for our people to have access to safe drinking water.
SA Tourism will invest R100 million a year to promote domestic tourism, encouraging
South Africans to tour their country.
The Department of Small Business Development was established to provide such
targeted support to small business.
Economic transformation and black empowerment remain a key part of all economic
programmes of government. One of our new interventions is the Black Industrialists
Scheme, which has been launched to promote the participation of black entrepreneurs in
manufacturing.
Progress has been made to stabilise the electricity supply. There has been no load
shedding since August last year, which has brought relief to both households and
industry alike.
Government has invested R83 billion in Eskom, which has enabled the utility to continue
investing in Medupi and Kusile, while continuing with a diligent maintenance programme.
Additional units from Ingula power station will be connected in 2017, even though some
of them will begin synchronisation this year.
Agri-Parks Programme, was introduced to aim at increasing the participation of small
holder farmers in agricultural activities.
The agricultural programmes must empower women farmers as well.
Land reform remains an important factor as we pursue transformation.
Regulation of Land Holdings Bill, which would place a ceiling on land ownership at a
maximum of 12 000 hectares and would prohibit foreign nationals from owning land.
On improving labour relations, we welcome the agreement reached by social partners at
National Economic Development and Labour Council (NEDLAC) on the principle of a
national minimum wage.
We continue to promote innovation within the Nine-Point Plan programme.
The Department of Science and Technology will finalise the Sovereign Innovation fund, a
Public-Private funding partnership aimed at commercialising innovations that are from
ideas from the public and the private sectors.
Government will fast-track the implementation of the first phase of broadband roll-out to
connect more than 5 000 government facilities in eight district municipalities over a
three-year period.
191
Government has responded to the financial shortfall arising from the zero per cent
university fee increase, as agreed in meeting with students and vice-chancellors last year.
The HIV policy turnaround in 2009 led to a massive roll-out of HIV testing and treatment
for 3, 2 million people living with the virus.
This has contributed immensely to healthier and longer lives for those infected;
The White Paper on National Health Insurance was released in December and is aimed at
improving healthcare for everyone in South Africa.
Our Back to Basics local government revitalisation plan was launched in September 2014
and 2015 has been the year of intensive implementation.
In this second phase of implementation, national government will engage in more active
monitoring and accountability measures.
A 10-point plan of Back to Basics priority actions has been developed to guide this next
phase.
The plan includes the promotion of community engagement, which is absolutely critical
to enable communities to provide feedback on their experience of local government.
The South African Police Service is undergoing a turnaround and has adopted the Back to
Basics approach to management to rebuild the organization and to improve performance
at all under-performing police stations.
Our call to unite and have formed the Creative Industries Federation of South Africa. The
Presidency has established the Presidential Creative Industries Task Team to support our
artists.
To achieve our objectives of creating jobs, reducing inequality and pushing back the
frontiers of poverty, we need faster growth.
1.13.9 STATE OF THE PROVINCE ADDRESS: 22 FEBRUARY 2016
The Key priority areas highlighted in the State of the Province Address by the Gauteng Premier
Honourable David Makhura are as follows:
Racism: Unite against racism and xenophobia
As the most Cosmopolitan and Afropolitan Province, Gauteng must start to led building a
society that reaffirms our common humanity and common national identity.
We will restore hope and build unity among the people of Gauteng
It is within the people’s power to change their conditions and build a common South
African identity based on equality, liberty and fraternity in their lifetime.
192
Through Ntirhisano we can change the way government works.
As the pioneers of the township economy revitalisation, we are making significant
progress in empowering township-based enterprises, cooperatives and SMMEs.
We are governing with a greater sense of urgency, integrity and transparency.
Gauteng City Region are already working together to transform, modernise, and re-
industrialise our provincial economy for the common good of all our people.
To cope with rapid urbanisation, persistent unemployment, poverty and inequality, we
have to work doubly hard and do things differently in Gauteng with regard to the economy,
infrastructure development and service delivery. Consequently, our economic
interventions should seek to achieve the following:
Change ownership patterns to bring black people into the economic mainstream and
create black industrialists;
Change the current industrial structure of our economy to privilege manufacturing
through the processing of rich mineral resources and other raw materials locally;
Invest hugely in skills development to change the skills profile of the citizenry in line with
the new strategic sectors identified;
Change income distribution to enhance equity and raise the living standards of all our
people;
Transform the apartheid spatial economy and human settlement patterns to integrate
economic opportunities, transport corridors and human settlements;
Grow the SMME sector as a key driver of growth and revitalise and mainstream the
township economy;
Strengthen the capacity of the state to direct economic development and enhance the
competitiveness of strategic economic sectors through active industrial policy;
Ensure significant investment in infrastructure as the key stimulator for inclusive growth
and economic development;
Build transformative partnerships between the private and public sector in addressing the
developmental challenges outlined in the National Development Plan Vision 2030. The
TMR programme is our comprehensive policy response to the unique conditions and
structural challenges facing our economy.
Discovery of Homo Naledi not only points to the unique and significant role that Africa
plays in the origins and development of human kind but it is also a game changer.
Homo Naledi has massive positive implications for tourism in the City Region and in
particular the Cradle of Mankind, Maropeng.
To exploit the tourism potential of Maropeng to promote tourism in the Western corridor.
In December 2014, we launched a bold initiative to give hope to young people through a
partnership programme called Tshepo 500 000.
193
The objective of this game changing initiative is to provide skills training, entrepreneurship
development, mentorship and job placements for youth and unemployed graduates.
Young people are one of the focal priorities of this ANC-led fifth administration.
In the past thirteen months, we have recruited more than 158 000 young people to
participate in the various programmes of Tshepo 500 000.
We are on track with the modernisation of our public health services.
The impact of our “welfare to work” initiative.
Ekurhuleni, Sedibeng District, Mogale City and Midvaal have made us proud for achieving
clean audits.
1.13.8 STATE OF THE DISTRICT ADDRES: 01 APRIL 2016
Refer to Annexure A
194
ALIGNMENT MATRIX OVERVIEW:
195
Refer below
SECTION N: 1.14 PROGRAMMES AND PROJECTS FROM OTHER SPHERES
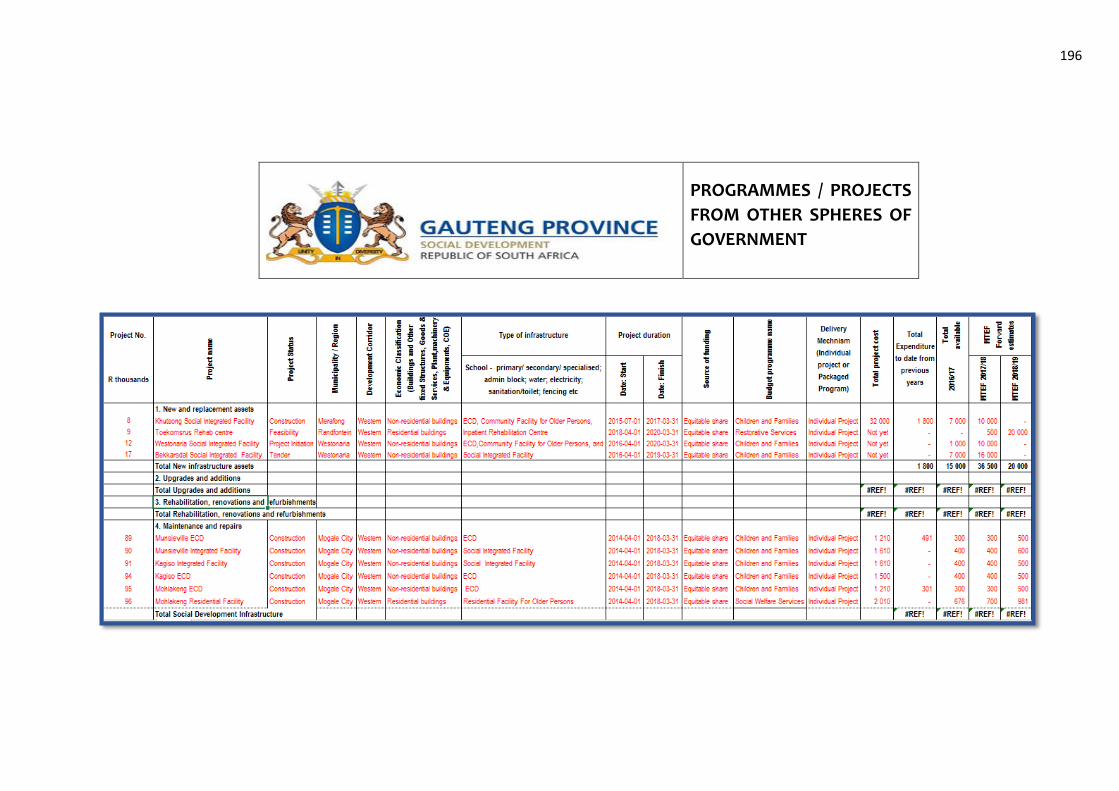
196
PROGRAMMES / PROJECTS
FROM OTHER SPHERES OF
GOVERNMENT
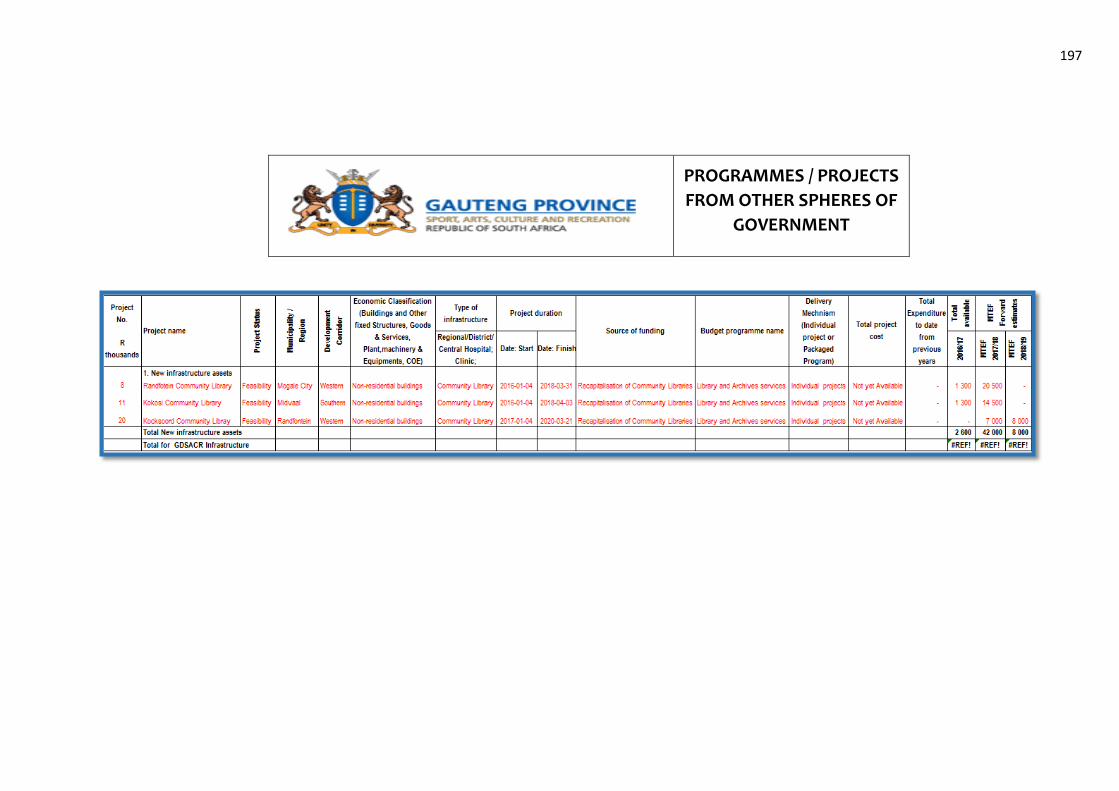
197
PROGRAMMES / PROJECTS
FROM OTHER SPHERES OF
GOVERNMENT
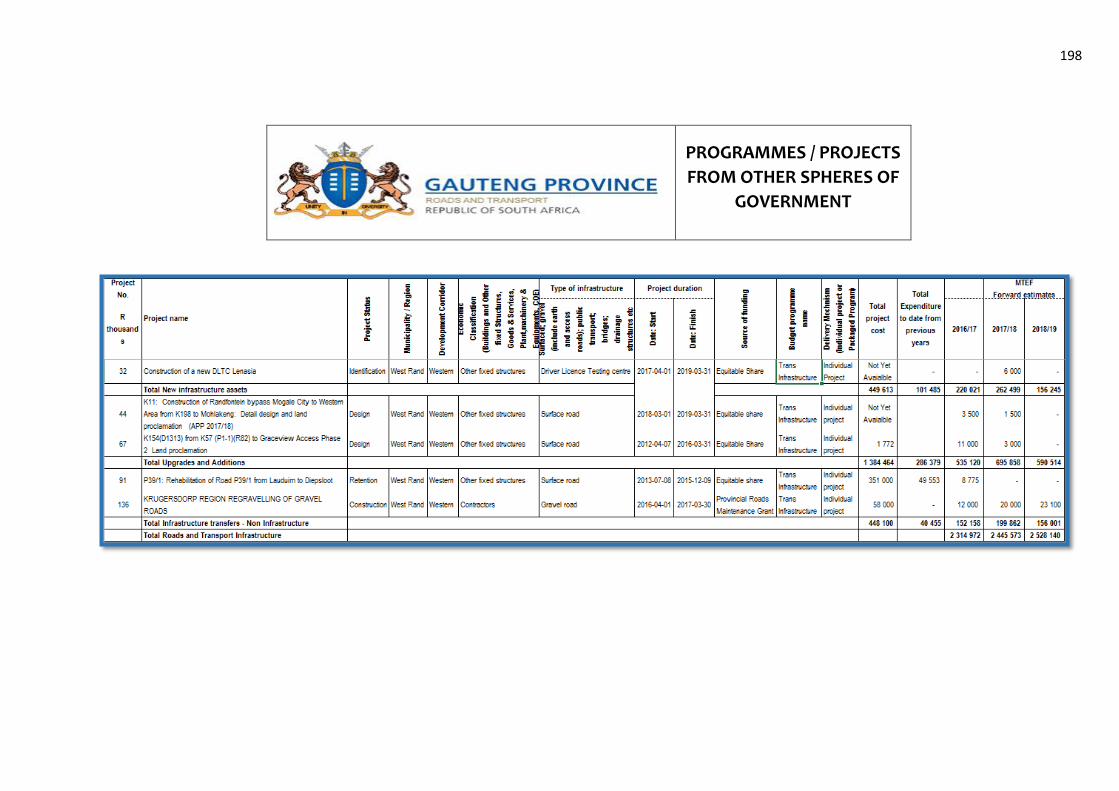
198
PROGRAMMES / PROJECTS
FROM OTHER SPHERES OF
GOVERNMENT
199
31 MAY 2016
SECTION O: 1.15 2016/17 BUDGET REPORT (SUMMARY)
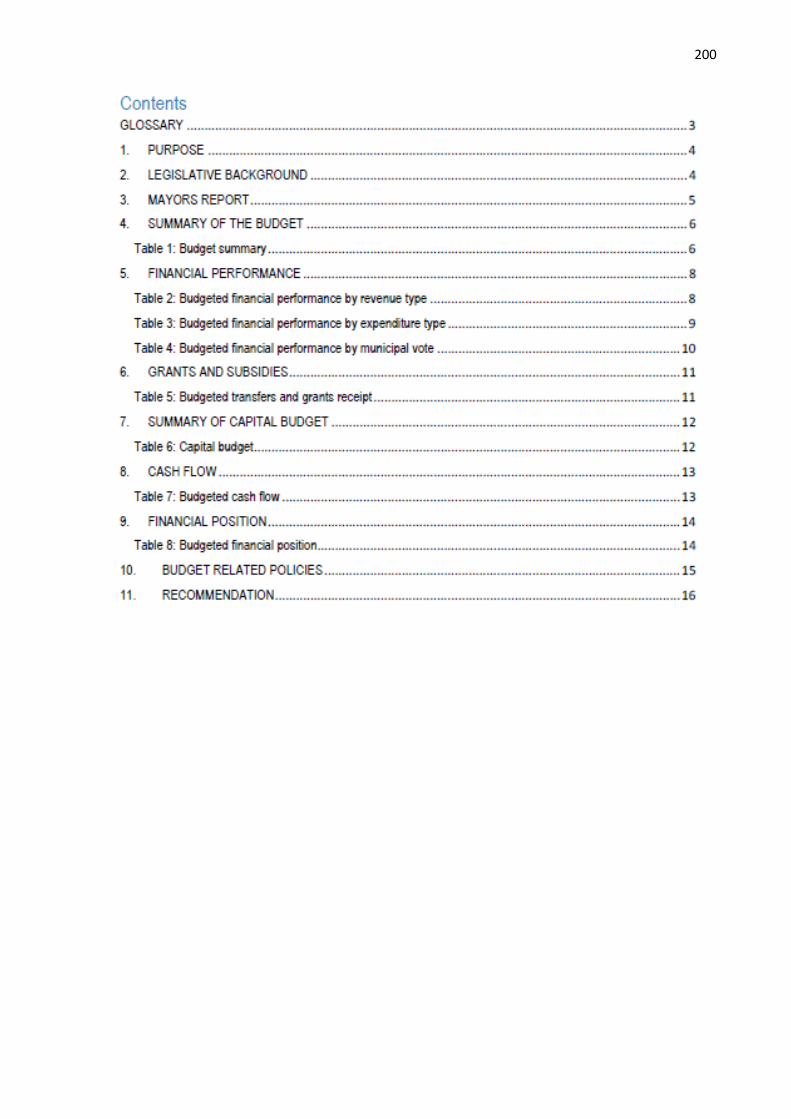
200
201
202
203
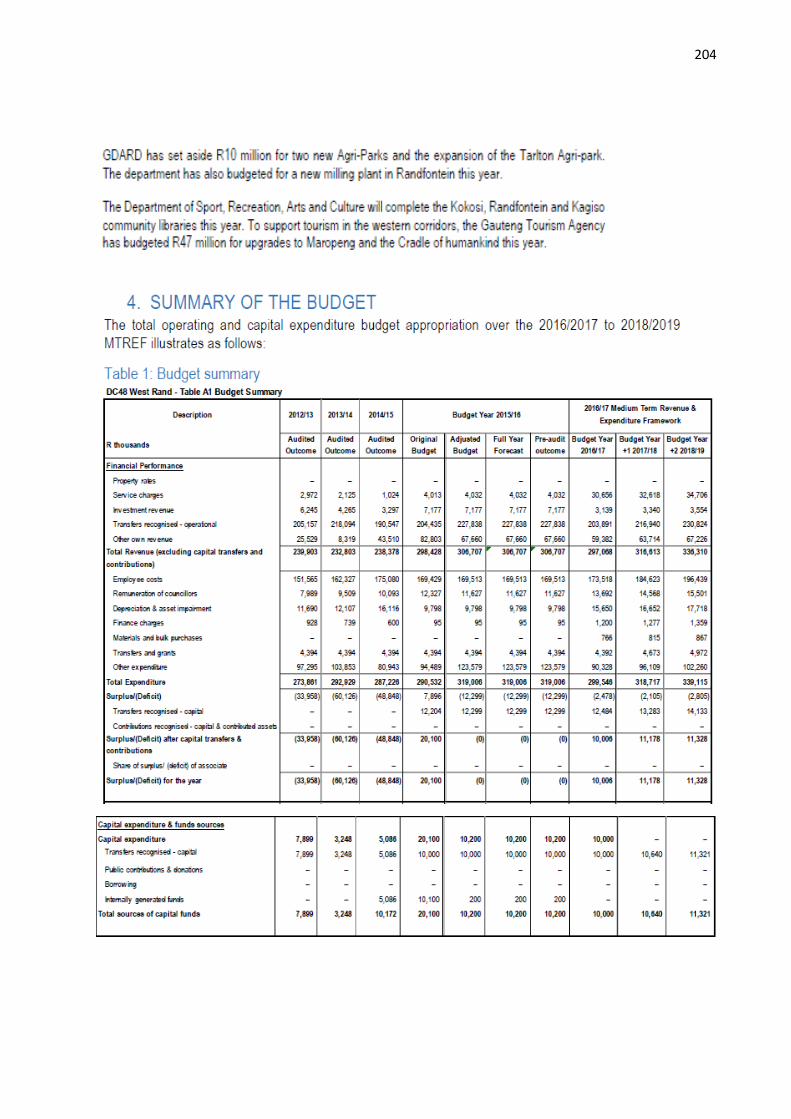
204
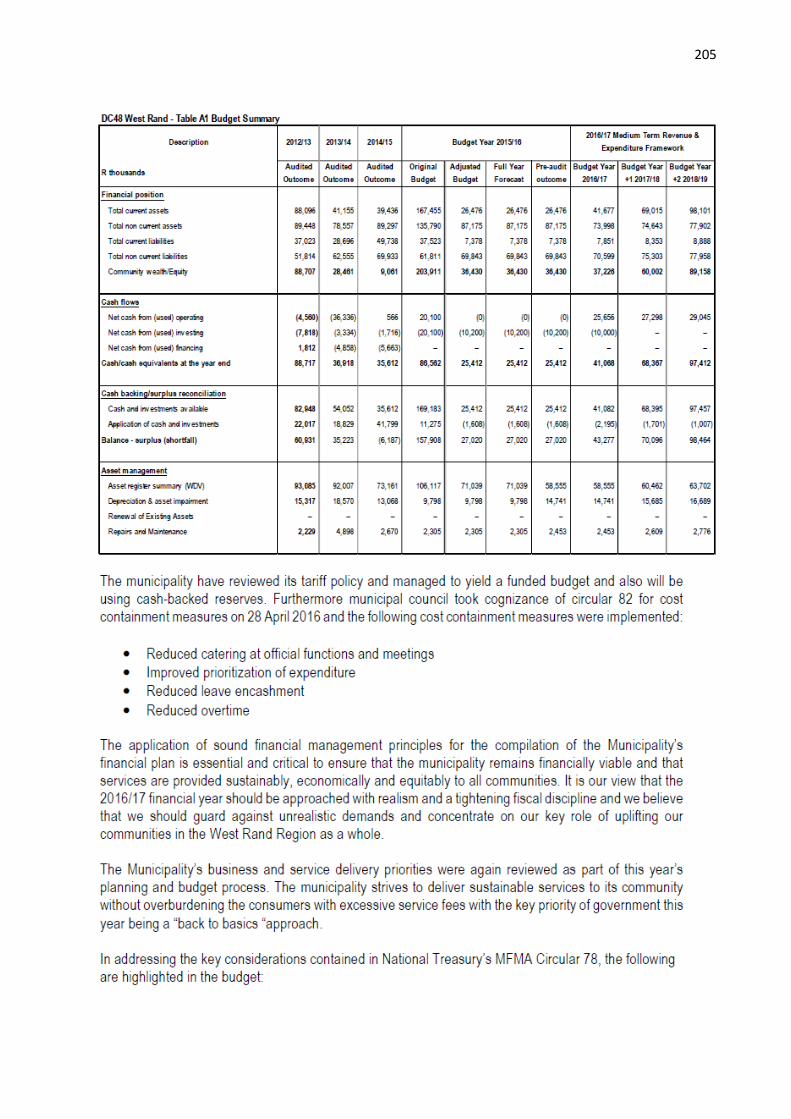
205
206

207