Embed Size (px)
Citation preview
Integrated Data System Structure for Active Traffic Management - Planning and Operationg g p
NATMEC 2010
Dr. Xiao-Yun Lu, Research EngineerCalifornia PATH, U. C. Berkeley
J. Palen, Caltrans DRI
1
Outlines
• Active Traffic Management (ATM)
• Towards Integrated Traffic Data Systems
2
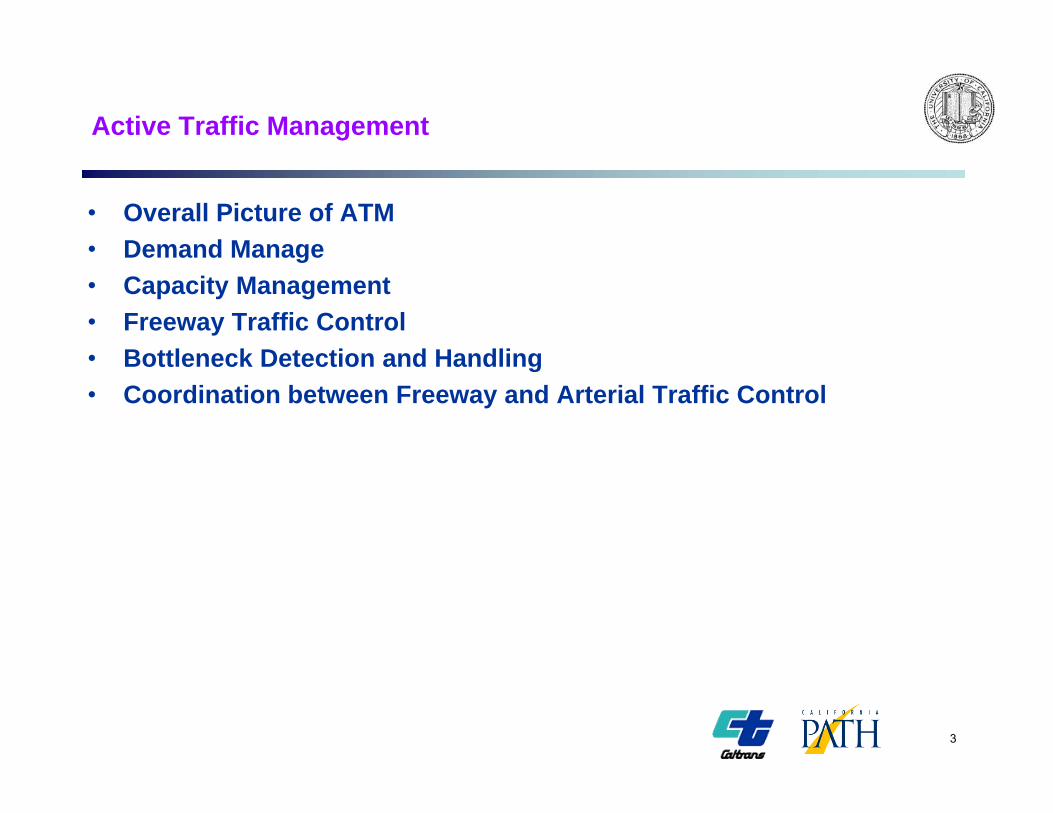
Active Traffic Management
• Overall Picture of ATM• Demand ManageDemand Manage• Capacity Management• Freeway Traffic Control• Bottleneck Detection and Handling• Bottleneck Detection and Handling• Coordination between Freeway and Arterial Traffic Control
3
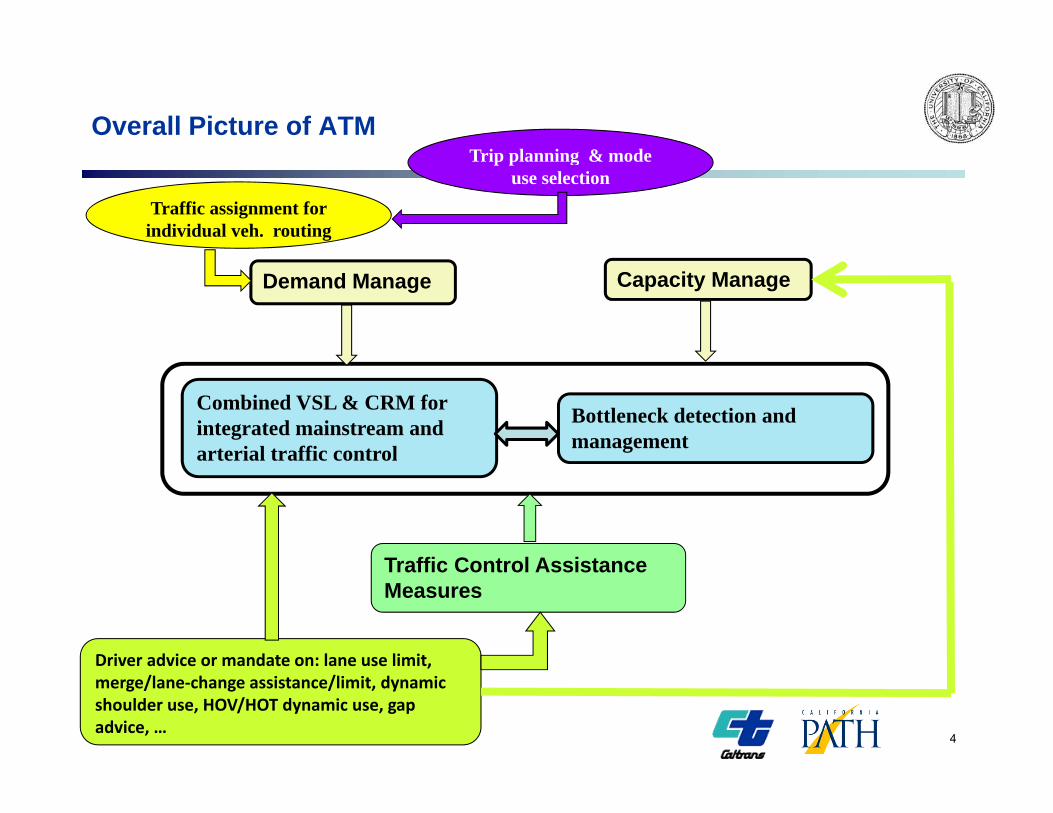
Overall Picture of ATMT i l i & d
Traffic assignment for individual veh. routing
Trip planning & mode use selection
Demand Manage Capacity Manage
Combined VSL & CRM for integrated mainstream and arterial traffic control
Bottleneck detection and managementarterial traffic control
T ffi C t l A i tTraffic Control Assistance Measures
Driver advice or mandate on: lane use limit
4
Driver advice or mandate on: lane use limit, merge/lane‐change assistance/limit, dynamic shoulder use, HOV/HOT dynamic use, gap advice, …
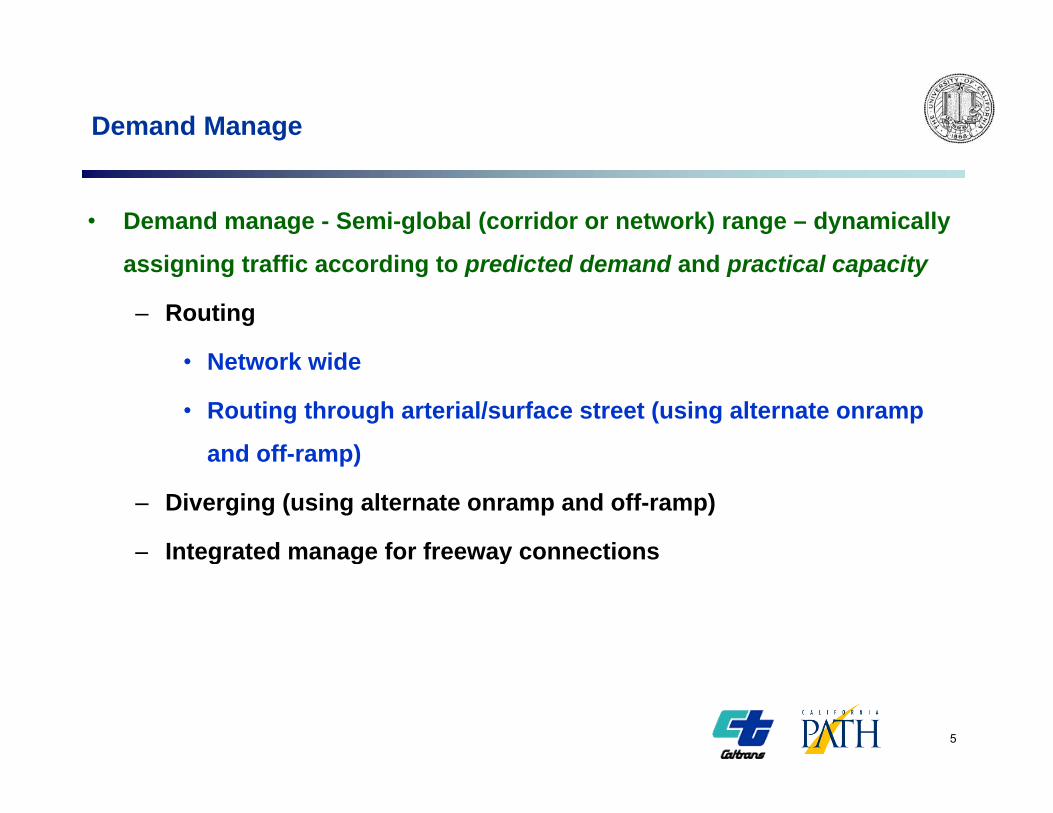
Demand Manage
• Demand manage - Semi-global (corridor or network) range – dynamically
assigning traffic according to predicted demand and practical capacity
– Routing
N t k id• Network wide
• Routing through arterial/surface street (using alternate onramp
and off-ramp)and off ramp)
– Diverging (using alternate onramp and off-ramp)
– Integrated manage for freeway connectionsg g y
5
Capacity Manage
• Real-time operation (practical) capacity estimation
• Mainline capacity flow is determined by bottleneck capacity flow
• Capacity of a corridor with multiple bottlenecks is determined by the
b ttl k ith th i i it l di i d i il blbottleneck with the minimum capacity unless diverging road is available
• Planning: revise recurrent bottleneck to improve physical capacity
• Operation: maximally use capacity for highest mobility• Operation: maximally use capacity for highest mobility
– Active (dynamic or temporary) shoulder use if necessary
– Active (dynamic or temporary) HOV/HOT lane manageActive (dynamic or temporary) HOV/HOT lane manage
6
Freeway Traffic Control - Coordinated VSL and RM
• RM: – Local traffic responsive RM directly control average density for theLocal traffic responsive RM directly control average density for the
immediate downstream– Corridor wide Coordinated RM control balances the main lane flow
and demands from onramps– Only indirectly affecting speed passively
• VSL:– To control driver behavior in mainline– To reduce speed variance in the same lane and between lanes– To smooth traffic and delay/avoid shock wave including Stop&Go– To control mainline traffic flow when RM switched off due to onramp
length limit and/or equity issues
7
Freeway Traffic Control - Coordinated VSL and RM
• Combined VSL & CRM– To control traffic in different aspects and complementaryTo control traffic in different aspects and complementary– To control main line traffic to a large extent for given demand,
capacity and current traffic situation– To homogenize/stabilize traffic flowg– To control density distribution– To achieve higher density (thus flow) for the same speed– To delay congestion start timey g– To achieve maximum possible flow (not necessarily free-flow) under
congested condition– Two legs of a person
8
Freeway Traffic Control – Other Measures
• Local Active Traffic Management to smooth traffic– Merging manage – assisting onramp mergingMerging manage assisting onramp merging– Weaving manage– Maximizing off-ramp flow – Dynamic Lane Use ManageDynamic Lane Use Manage
9
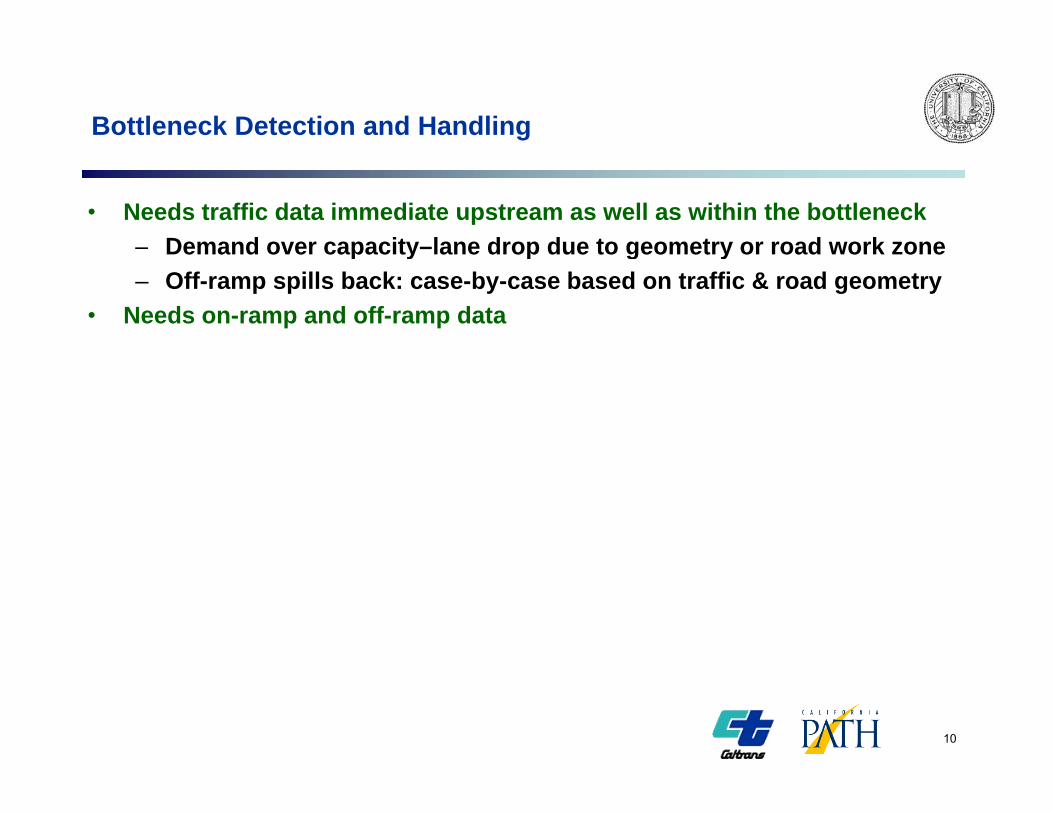
Bottleneck Detection and Handling
• Needs traffic data immediate upstream as well as within the bottleneck– Demand over capacity–lane drop due to geometry or road work zoneDemand over capacity lane drop due to geometry or road work zone– Off-ramp spills back: case-by-case based on traffic & road geometry
• Needs on-ramp and off-ramp data
10
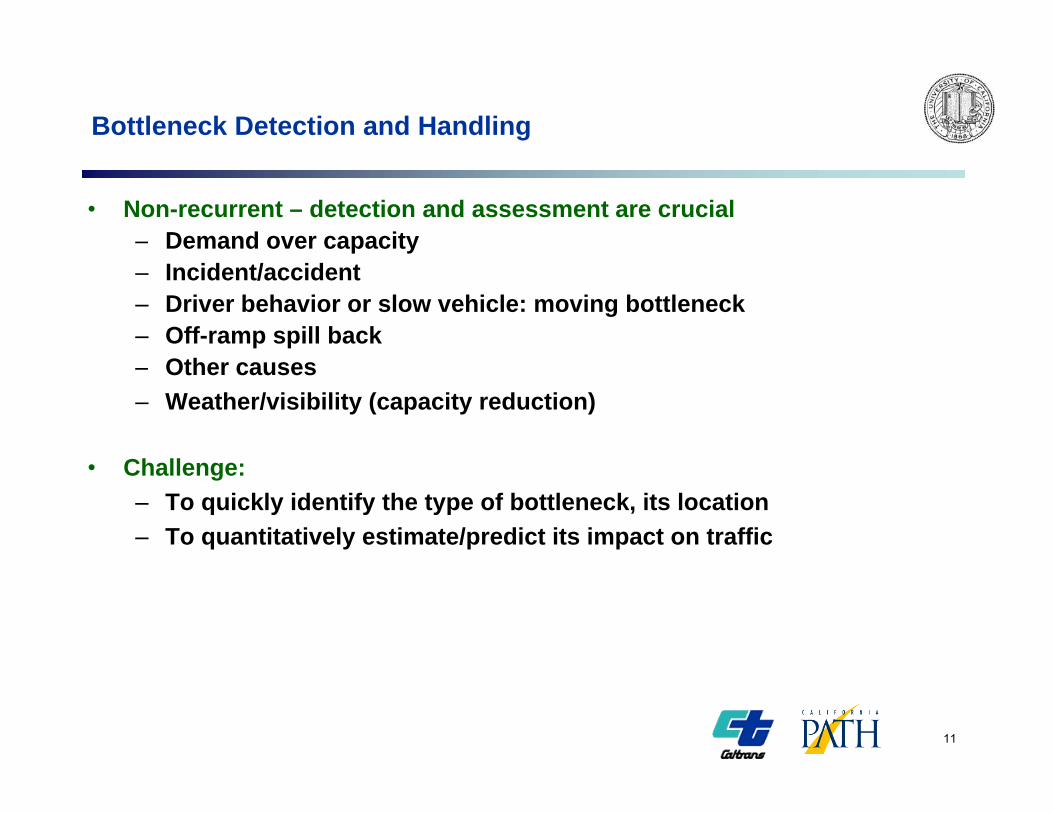
Bottleneck Detection and Handling
• Non-recurrent – detection and assessment are crucial– Demand over capacityp y– Incident/accident– Driver behavior or slow vehicle: moving bottleneck– Off-ramp spill back– Other causes– Weather/visibility (capacity reduction)
• Challenge: – To quickly identify the type of bottleneck, its location– To quantitatively estimate/predict its impact on traffic
11
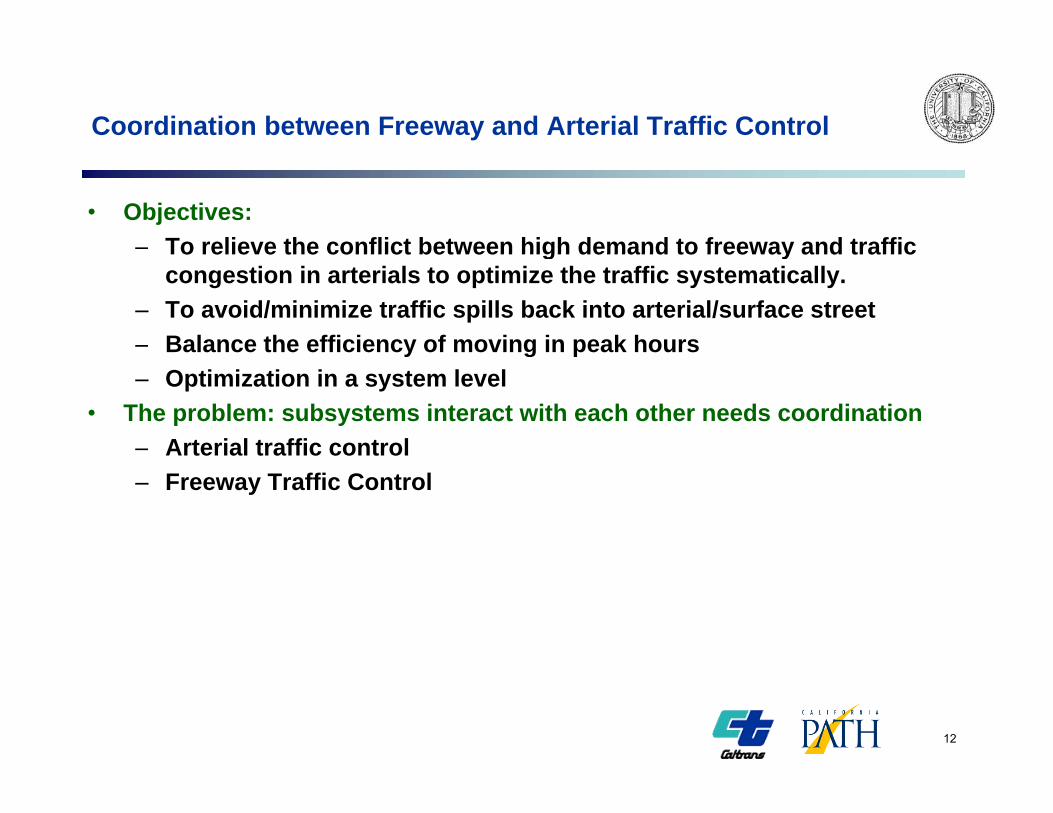
Coordination between Freeway and Arterial Traffic Control
• Objectives:– To relieve the conflict between high demand to freeway and trafficTo relieve the conflict between high demand to freeway and traffic
congestion in arterials to optimize the traffic systematically. – To avoid/minimize traffic spills back into arterial/surface street– Balance the efficiency of moving in peak hoursy g p– Optimization in a system level
• The problem: subsystems interact with each other needs coordination– Arterial traffic control– Freeway Traffic Control
12
Coordination between Freeway and Arterial Traffic Control
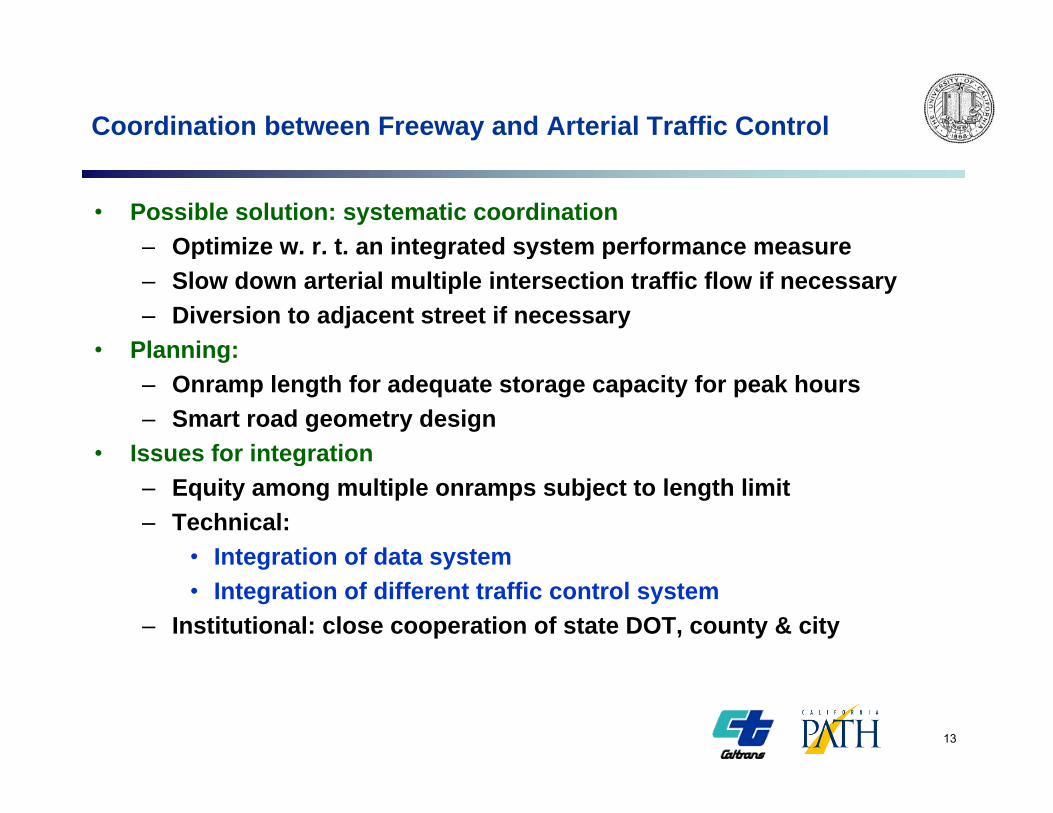
• Possible solution: systematic coordination– Optimize w. r. t. an integrated system performance measureOptimize w. r. t. an integrated system performance measure– Slow down arterial multiple intersection traffic flow if necessary– Diversion to adjacent street if necessary
• Planning:Planning:– Onramp length for adequate storage capacity for peak hours– Smart road geometry design
• Issues for integrationIssues for integration– Equity among multiple onramps subject to length limit– Technical:
• Integration of data systemIntegration of data system• Integration of different traffic control system
– Institutional: close cooperation of state DOT, county & city
13
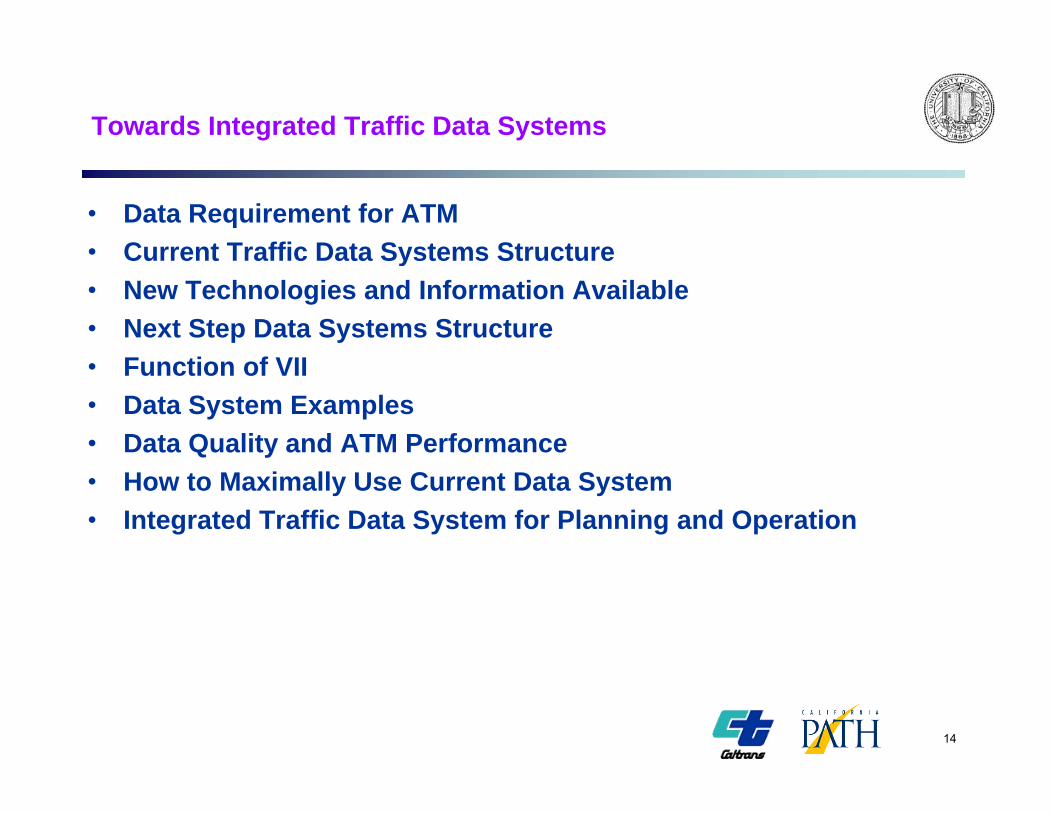
Towards Integrated Traffic Data Systems
• Data Requirement for ATM• Current Traffic Data Systems Structure• Current Traffic Data Systems Structure• New Technologies and Information Available• Next Step Data Systems Structure• Function of VII• Data System Examples• Data Quality and ATM Performance• How to Maximally Use Current Data System • Integrated Traffic Data System for Planning and Operation
14
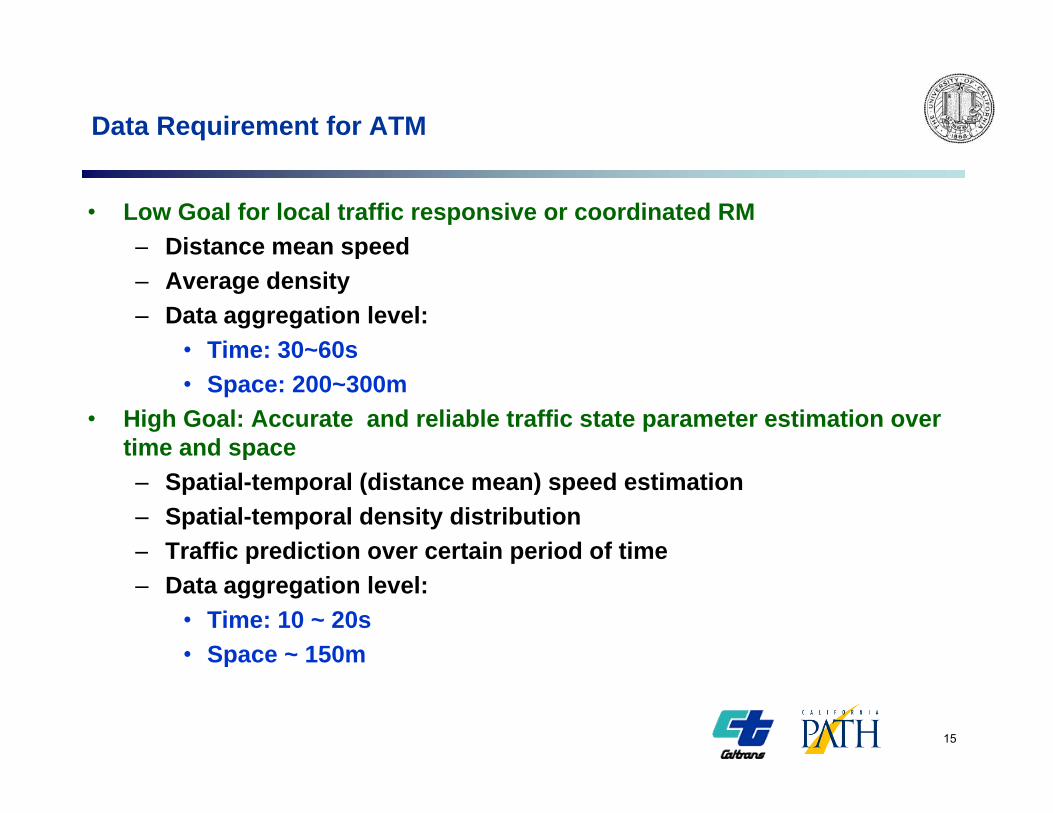
Data Requirement for ATM
• Low Goal for local traffic responsive or coordinated RM– Distance mean speedDistance mean speed– Average density– Data aggregation level:
• Time: 30~60sTime: 30 60s• Space: 200~300m
• High Goal: Accurate and reliable traffic state parameter estimation over time and spacep– Spatial-temporal (distance mean) speed estimation– Spatial-temporal density distribution – Traffic prediction over certain period of timep p– Data aggregation level:
• Time: 10 ~ 20s• Space ~ 150mp
15
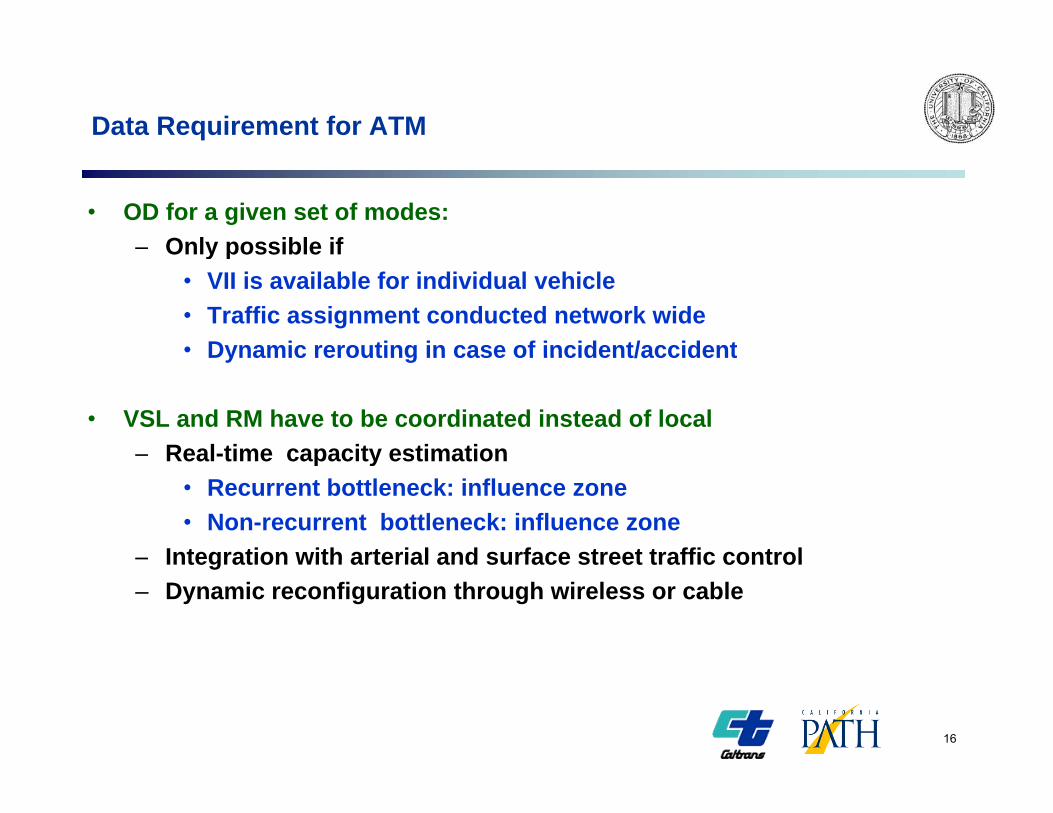
Data Requirement for ATM
• OD for a given set of modes:– Only possible ifOnly possible if
• VII is available for individual vehicle• Traffic assignment conducted network wide• Dynamic rerouting in case of incident/accidentDynamic rerouting in case of incident/accident
• VSL and RM have to be coordinated instead of local– Real-time capacity estimationReal time capacity estimation
• Recurrent bottleneck: influence zone• Non-recurrent bottleneck: influence zone
– Integration with arterial and surface street traffic controlIntegration with arterial and surface street traffic control – Dynamic reconfiguration through wireless or cable
16
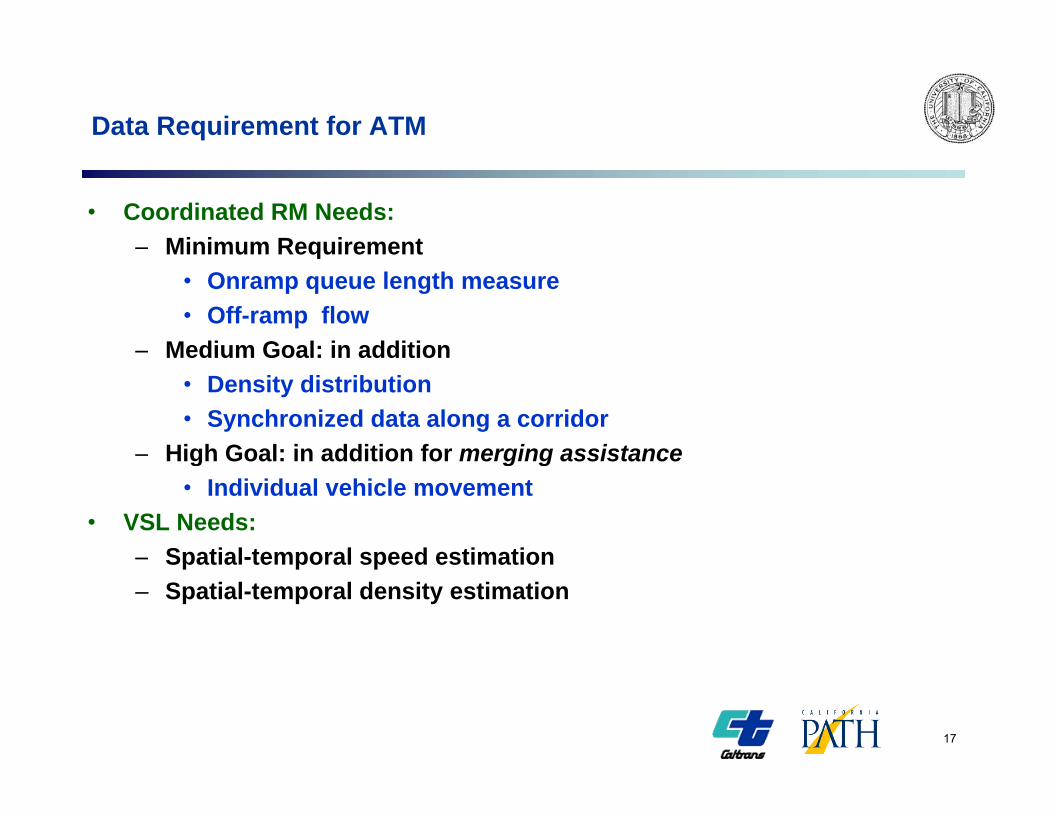
Data Requirement for ATM
• Coordinated RM Needs: – Minimum RequirementMinimum Requirement
• Onramp queue length measure• Off-ramp flow
– Medium Goal: in additionMedium Goal: in addition• Density distribution• Synchronized data along a corridor
– High Goal: in addition for merging assistanceHigh Goal: in addition for merging assistance • Individual vehicle movement
• VSL Needs:– Spatial-temporal speed estimationSpatial temporal speed estimation– Spatial-temporal density estimation
17
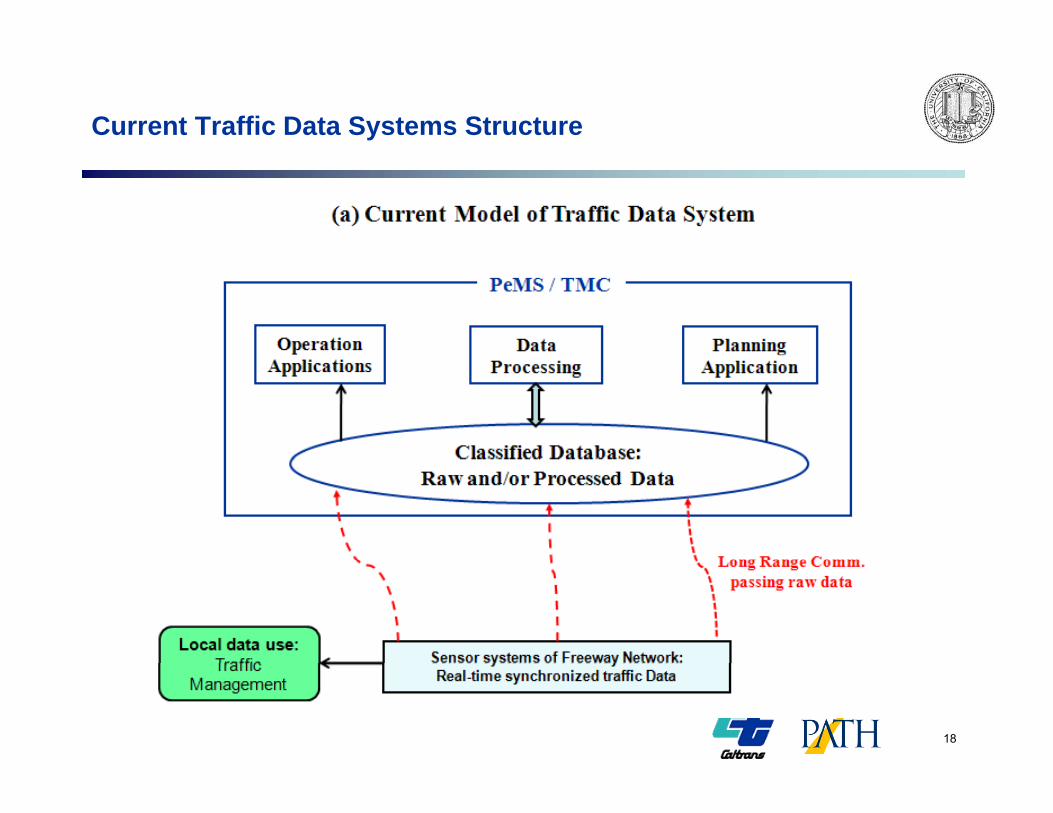
Current Traffic Data Systems Structure
18
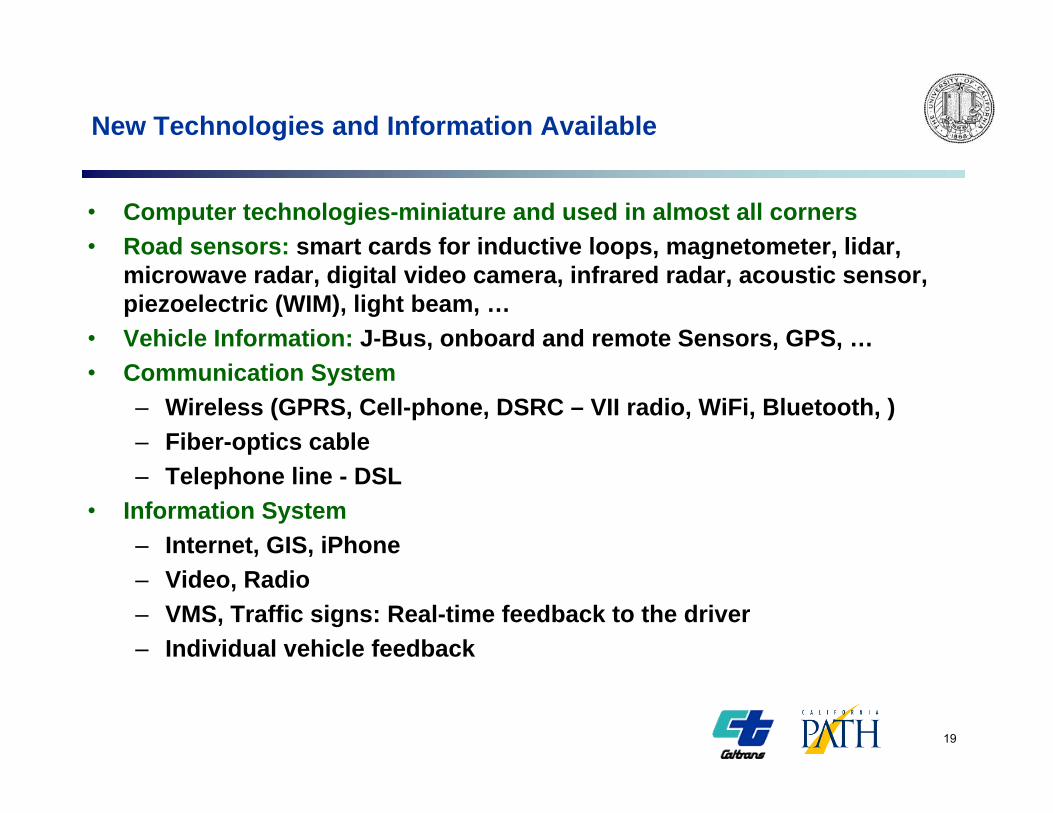
New Technologies and Information Available
• Computer technologies-miniature and used in almost all corners• Road sensors: smart cards for inductive loops, magnetometer, lidar,Road sensors: smart cards for inductive loops, magnetometer, lidar,
microwave radar, digital video camera, infrared radar, acoustic sensor, piezoelectric (WIM), light beam, …
• Vehicle Information: J-Bus, onboard and remote Sensors, GPS, …• Communication System
– Wireless (GPRS, Cell-phone, DSRC – VII radio, WiFi, Bluetooth, )– Fiber-optics cable– Telephone line - DSL
• Information System– Internet, GIS, iPhone– Video, Radio– VMS, Traffic signs: Real-time feedback to the driver– Individual vehicle feedback
19
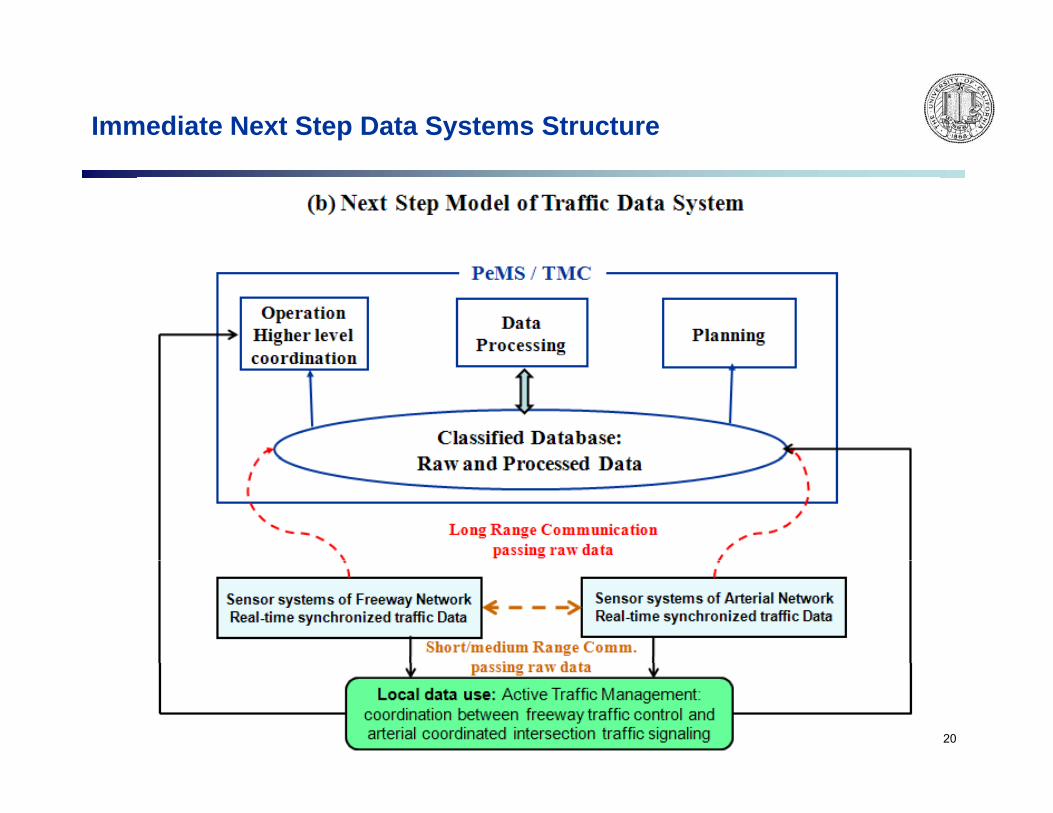
Immediate Next Step Data Systems Structure
20
Function of VII in Active Traffic Management
• VII Vehicle include: probe vehicles; vehicle equipped with VII DSRC; vehicle equipped with combined cell-phone and GPSq pp p
• VII Vehicle Info:– Continuous measure over time– High market penetration of VII provides data continuous in both time
and space– Single VII vehicle providing narrow moving distance-window
measure– Certain percent of market penetration VII vehicles provide traffic
measurement continuous over time and distance
• Road sensor only provide point/short range measure: heavily depends on sensor type, location, density, measurement accuracy, reliability, …
21
Function of VII in Active Traffic Management
• Application: – Traffic state estimation/prediction;Traffic state estimation/prediction;
• OD estimation• Spatial and temporal speed and density estimation• Retrieving microscopic traffic dataRetrieving microscopic traffic data• Refined RM, merging assistance,…
– Congestion onset detection and management;– Active safetyActive safety
• Collision warning and avoidance• Intelligent intersection
• Future Trend:Future Trend: – VII data directly routed to control cabinet– Gradual merging/fusing point sensor data with VII data
22
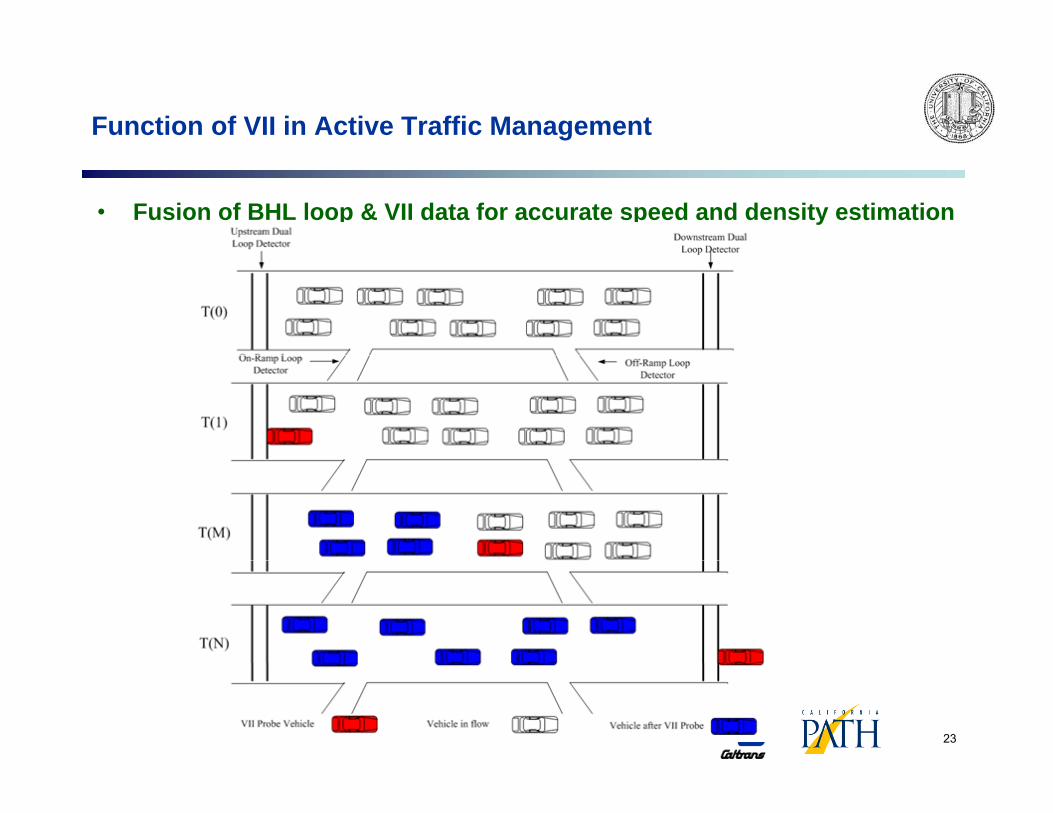
Function of VII in Active Traffic Management
• Fusion of BHL loop & VII data for accurate speed and density estimation
23
Data System Examples:
• PeMS• Netherlands NDW (National Data Workhouse)Netherlands NDW (National Data Workhouse)• POTAL• Berkeley Highway Lab (BHL)
Data Quality and ATM Performance
• Data quality determines traffic control performance• Most RM methods very simple; mostly determined by data qualityMost RM methods very simple; mostly determined by data quality• Quantitatively sensitivity analysis of the control system
• Data quality Measurement noise and error (discrepancy)Measurement noise and error (discrepancy) Reliability Time delay
• from sensorfrom sensor• from communication for data passing• from data processing (such as aggregation)• from data aggregationfrom data aggregation
• Improving data quality in different level• Microscopic (sensor reading) - essential• Mesoscopic – a section of freeway & arterialMesoscopic a section of freeway & arterial• Macroscopic – corridor level (PeMS/TMC)
25
Data Quality and ATM Performance
• Systematic Sensor Fault Detection and Management
• Systematic data correction in different level, but critical in even data
level
D l i R li bl C i ti S t f d t i• Developing Reliable Communication Systems for data passing
26
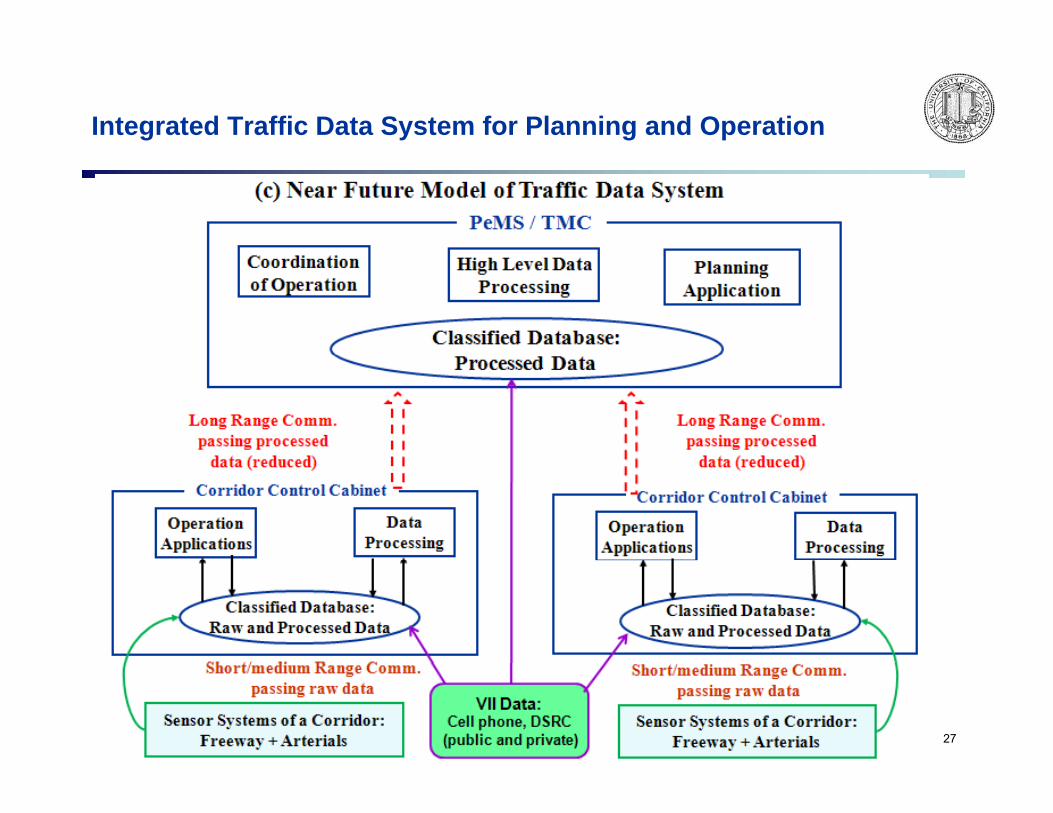
Integrated Traffic Data System for Planning and Operation
27
Integrated Traffic Data System for Planning and Operation
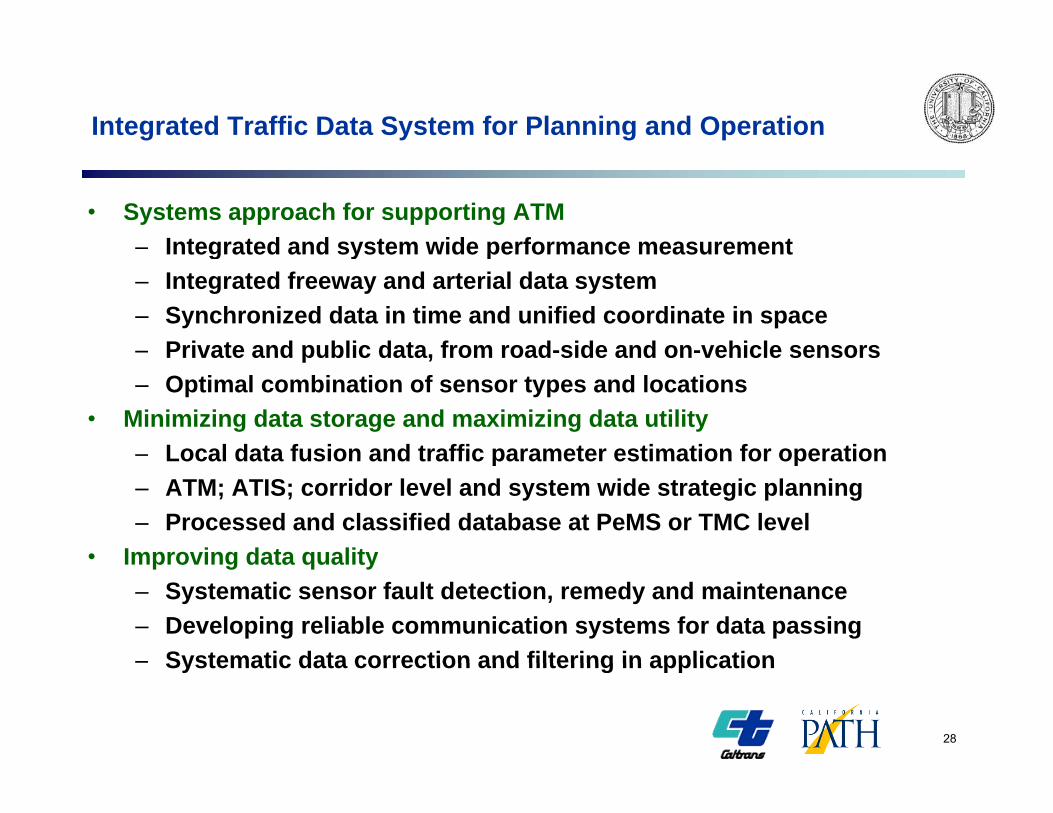
• Systems approach for supporting ATM– Integrated and system wide performance measurementIntegrated and system wide performance measurement– Integrated freeway and arterial data system– Synchronized data in time and unified coordinate in space– Private and public data, from road-side and on-vehicle sensorsPrivate and public data, from road side and on vehicle sensors– Optimal combination of sensor types and locations
• Minimizing data storage and maximizing data utility– Local data fusion and traffic parameter estimation for operationLocal data fusion and traffic parameter estimation for operation– ATM; ATIS; corridor level and system wide strategic planning– Processed and classified database at PeMS or TMC level
• Improving data qualityImproving data quality– Systematic sensor fault detection, remedy and maintenance– Developing reliable communication systems for data passing – Systematic data correction and filtering in applicationSystematic data correction and filtering in application
28