Embed Size (px)
Citation preview
Integrated cistromic and expressionanalysis of amplified NKX2-1 in lungadenocarcinoma identifies LMO3as a functional transcriptional target
Hideo Watanabe,1,2,3 Joshua M. Francis,1,2,3 Michele S. Woo,1,2 Banafsheh Etemad,1 Wenchu Lin,1,2
Daniel F. Fries,1,3 Shouyong Peng,1,3 Eric L. Snyder,4 Purushothama Rao Tata,5 Francesca Izzo,1,6
Anna C. Schinzel,1,6 Jeonghee Cho,1,2 Peter S. Hammerman,1,2,3 Roel G. Verhaak,1,2,3
William C. Hahn,1,2,3,6 Jayaraj Rajagopal,5 Tyler Jacks,4,7 and Matthew Meyerson1,2,3,8,9
1Department of Medical Oncology, Dana-Farber Cancer Institute, Boston, Massachusetts 02215, USA; 2Center for CancerGenome Discovery, Dana-Farber Cancer Institute, Boston, Massachusetts 02215, USA; 3Cancer Program, Broad Instituteof Harvard and Massachusetts Institute of Technology, Cambridge, Massachusetts 02142, USA; 4David H. Koch Institutefor Integrative Cancer Research, Massachusetts Institute of Technology, Cambridge, Massachusetts 02139, USA; 5Centerfor Regenerative Medicine, Massachusetts General Hospital, Harvard Stem Cell Institute, Boston, Massachusetts 02114,USA; 6RNAi Facility, Dana-Farber Cancer Institute, Boston, Massachusetts 02215, USA; 7Howard Hughes MedicalInstitute, Massachusetts Institute of Technology, Cambridge, Massachusetts 02139, USA; 8Department of Pathology,Harvard Medical School, Boston, Massachusetts 02115, USA
The NKX2-1 transcription factor, a regulator of normal lung development, is the most significantly amplified genein human lung adenocarcinoma. To study the transcriptional impact of NKX2-1 amplification, we generated anexpression signature associated with NKX2-1 amplification in human lung adenocarcinoma and analyzed DNA-binding sites of NKX2-1 by genome-wide chromatin immunoprecipitation. Integration of these expression andcistromic analyses identified LMO3, itself encoding a transcription regulator, as a candidate direct transcriptionaltarget of NKX2-1. Further cistromic and overexpression analyses indicated that NKX2-1 can cooperate with theforkhead box transcription factor FOXA1 to regulate LMO3 gene expression. RNAi analysis of NKX2-1-amplifiedcells compared with nonamplified cells demonstrated that LMO3 mediates cell survival downstream fromNKX2-1. Our findings provide new insight into the transcriptional regulatory network of NKX2-1 and suggest thatLMO3 is a transcriptional signal transducer in NKX2-1-amplified lung adenocarcinomas.
[Keywords: lung cancer; lineage-specific oncogene; transcription factor; cistromic analysis; carcinogenesis]
Supplemental material is available for this article.
Received August 20, 2012; revised version accepted December 20, 2012.
Genomic alterations of transcription factors are knownto play key roles in the development of many humancancers. For example, TP53 (the gene encoding p53) is themost frequently mutated gene in all cancers (Levine andOren 2009), MYC is frequently amplified in many types ofcancers (including breast carcinomas and small-cell lungcarcinomas) and is translocated in Burkitt’s lymphomas(Dalla-Favera et al. 1982; Taub et al. 1982), and ETS familymembers are frequently translocated in prostate cancer(Tomlins et al. 2005), Ewing’s sarcoma (Delattre et al.1992), and leukemias (Peeters et al. 1997). For some tran-
scription factors, genomic alterations are only associatedwith particular types of cancers: For example, AR ampli-fication is linked to mechanisms of resistance in recurrentprostate cancers (Visakorpi et al. 1995), PAX5 deletion islinked to acute lymphocytic leukemia (Mullighan et al.2007), and RUNX1 translocation is linked to acute mye-logenous leukemia (Miyoshi et al. 1991). In addition, therehas been emerging evidence that a lineage-restrictedgenomic amplification of developmental transcriptionfactors occurs frequently in solid tumors, as exemplifiedby MITF in melanomas and SOX2 in lung and esophagealsquamous cell carcinomas (Garraway et al. 2005; Basset al. 2009).
NKX2-1 is the most significantly focally amplified genein lung adenocarcinomas, with amplification detected in;12% of cases (Kendall et al. 2007; Tanaka et al. 2007;Weir et al. 2007; Kwei et al. 2008). NKX2-1, also referred
9Corresponding authorE-mail [email protected] published online ahead of print. Article and publication date areonline at http://www.genesdev.org/cgi/doi/10.1101/gad.203208.112. Freelyavailable online through the Genes & Development Open Access option.
GENES & DEVELOPMENT 27:000–000 � 2013 by Cold Spring Harbor Laboratory Press ISSN 0890-9369/13; www.genesdev.org 1
Cold Spring Harbor Laboratory Press on June 27, 2018 - Published by genesdev.cshlp.orgDownloaded from

to as TTF-1 (for thyroid transcription factor 1), is wellknown as a molecular marker for lung adenocarcinomaand is particularly useful in clinical diagnosis of meta-static carcinomas, where its identification supports thetumor originating in the lung (Bejarano et al. 1996;Holzinger et al. 1996). Nkx2-1 is required for the de-velopment of the trachea, brain, and thyroid in earlymurine embryonic development and for peripheral lung-branching morphogenesis later in development (Costaet al. 2001; Maeda et al. 2007). Mice lacking Nkx2-1 dieat birth of respiratory failure with hypoplastic lungsthat stem from an undivided foregut (Yuan et al. 2000).NKX2-1 may belong to the class of lineage survivaloncogenes, which are ordinarily required for the differen-tiation and survival of particular cell lineages and laterbecome subject to focal amplification in cancers withintheir own lineage (Garraway and Sellers 2006). While thespecific cell of origin that gives rise to lung adenocarci-nomas has yet to be precisely characterized, NKX2-1 isrequired for the survival of lung adenocarcinoma cellswith amplification of NKX2-1 (Kendall et al. 2007; Tanakaet al. 2007; Weir et al. 2007; Kwei et al. 2008).
The role of NKX2-1 in cancer pathogenesis is complexand remains poorly understood. Activating translocationsof NKX2-1 have been reported in ;3% of acute pre-T-celllymphoblastic leukemias (T-ALL) (Homminga et al. 2011),suggesting that the oncogenic function of NKX2-1 maynot be restricted to the lung. In addition, like NOTCH1(Stransky et al. 2011) and MEN1 (Yokoyama et al. 2005),it appears that NKX2-1 can play both an oncogenic anda tumor-suppressive role in different settings. WhileNKX2-1 amplification is found in human lung adenocar-cinoma, loss of mouse Nkx2-1 promotes metastasis ina Kras-driven mouse model of lung adenocarcinoma, andhuman tumors with low NKX2-1 expression have gener-ally worse prognoses (Winslow et al. 2011). More recently,a study showed evidence that Nkx2-1 haploinsufficiencyincreased Kras-induced tumor initiation and progression(Maeda et al. 2012), consistent with previous results(Winslow et al. 2011), but decreased EGFR-induced lungadenocarcinomas, indicating context-dependent rolesof Nkx2-1 in lung carcinogenesis (Maeda et al. 2012).These results are consistent with the remarkable genomicheterogeneity of human lung adenocarcinoma (Weir et al.2007; Ding et al. 2008; Govindan et al. 2012; Imielinskiet al. 2012). While the NKX2-1 locus is the most com-monly amplified region in lung adenocarcinoma and RNAiexperiments confirm NKX2-1 as the functional target ofthis amplification (Kendall et al. 2007; Tanaka et al. 2007;Weir et al. 2007; Kwei et al. 2008), lung adenocarcinomaswithout NKX2-1 amplification and/or expression plausiblyharbor other genomic alterations that play complementaryroles to NKX2-1. The observation that tumors with lowNKX2-1 expression (Barletta et al. 2009; Winslow et al.2011) and with NKX2-1 amplification (Barletta et al.2009) are both associated with poor prognosis may notimply any mechanistic relationship to NKX2-1 itself, asthese likely represent the result of different heteroge-neous features of the tumors. NKX2-1 has recently beenreported to activate expression of the ROR1 gene in lung
adenocarcinoma (Yamaguchi et al. 2012); however, thetranscriptional consequences of NKX2-1 amplificationin lung adenocarcinoma and the mechanism underlyingits oncogenic activity in this disease have not beenestablished.
In the normal lung, NKX2-1 induces a subset of geneexpression changes involved in the differentiation ofalveolar type II cells. Among the directly induced genesreported are LAMP3, CEACAM6, and CIT (Kolla et al.2007), and an NKX2-1 overexpression signature in BEAS-2Bbronchoepithelial cells includes focal adhesion and oxi-dative phosphorylation pathways (Hsu et al. 2009). Pro-moter regions directly bound by Nkx2-1 in developinglungs have been also reported, which include the pro-moters of E2f3, Ccnb1, and Ccnb2 genes (Tagne et al.2012). Mechanistically, transcriptional activity of Nkx2-1has been shown to be facilitated by interaction withseveral cellular proteins, including nuclear hormone re-ceptors such as the retinoic acid receptor (RAR), zincfinger transcription factors such as Gata-6, and coactiva-tors such as Src (Maeda et al. 2007).
Here, using integrated cistromic and gene expressionanalysis, we show that NKX2-1 amplification is associ-ated with overexpression of the LMO3 gene, a memberof the LMO family of oncogenes that are translocated inT-ALL (Boehm et al. 1988b; McGuire et al. 1989), thesame disorder in which NKX2-1 translocation has beenobserved (Homminga et al. 2011). Furthermore, we showthat NKX2-1 interacts physically with the LMO3 locusand activates its expression, which preferentially drivessurvival of cells with NKX2-1 amplification.
Results
Expression signature of NKX2-1-amplified lungadenocarcinomas
To identify the genes regulated by NKX2-1 and provideadditional insight into the cellular origin of NKX2-1-amplified lung adenocarcinomas, we derived an NKX2-1expression signature in lung adenocarcinomas that har-bor amplification of NKX2-1. We performed an unpairedtwo-class statistical comparison using SAM (significanceanalysis of microarray) (Tusher et al. 2001) on array-basedexpression profiling data from 470 primary lung adeno-carcinoma tumors (Director’s Challenge Consortium forthe Molecular Classification of Lung Adenocarcinomaet al. 2008) and 42 non-small-cell lung carcinoma celllines with matched copy number data (Sos et al. 2009) toidentify genes whose expression is most significantlycorrelated with NKX2-1 expression in primary tumorsand with NKX2-1 amplification in cell lines (Fig. 1A,B;Supplemental Table S1).
To discern individual genes whose expression is signif-icantly correlated with NKX2-1 overexpression, we inter-sected the most significantly differentially expressed genesby SAM analysis in data sets generated from primarytumors and cell lines. Since the statistical power for de-tection is very different in the two data sets (Fig. 1A,B), weanalyzed the 1000 most differentially expressed genes
Watanabe et al.
2 GENES & DEVELOPMENT
Cold Spring Harbor Laboratory Press on June 27, 2018 - Published by genesdev.cshlp.orgDownloaded from

with (observed SAM score � expected score) > 3.9 forprimary tumors and > 0.26 for cell lines. As expected,there were significant overlaps; 147 overexpressed genes(P < 1 3 10�12) and 38 underexpressed genes (P = 1.4 3
10�9) were shared between the data sets (Fig. 1C; Supple-mental Fig. S1A,B; Supplemental Table S1). The geneswhose expression was positively correlated with NKX2-1amplification included three categories: genes that resideon chromosome 14q13 and are often coamplified withNKX2-1, which include MBIP and NFKBIA; genes thatare known to be positively regulated by NKX2-1, in-cluding SFTPA2, HOP (Yin et al. 2006), and CEACAM6(Kolla et al. 2007); and newly identified coexpressedgenes, including LMO3, GPR116, and SLC34A2. TheseNKX2-1 targets are overrepresented in a gene expressionsignature (cluster 4) of lung adenocarcinomas previouslyidentified with the same primary tumor data set (P < 1 3
10�16) (Fig. 1D; Supplemental Fig. S1C; Director’s Chal-lenge Consortium for the Molecular Classification ofLung Adenocarcinoma et al. 2008). This finding is alsoconsistent with an analysis of data from expression pro-filing arrays of 49 lung adenocarcinomas and 40 lungsquamous cell carcinomas that identified LMO3 (alsoknown as DAT1) as the second most differentially expressed
gene after NKX2-1 in lung adenocarcinomas as comparedwith squamous cell lung carcinomas (Hofmann et al.2006).
Genome-wide analysis of the association of NKX2-1with chromatin in human lung adenocarcinoma cells
To investigate the DNA-binding sites of NKX2-1 acrossthe genome, we performed chromatin immunoprecipita-tion (ChIP) from lysates of the NCI-H3122 cell line, thelung cancer cell line with the highest degree of amplifi-cation and the highest expression of NKX2-1 (Supplemen-tal Fig. S2A,B), followed by massively parallel sequencing(ChIP-seq). We obtained 7,173,491, and 6,118,041 align-able reads for the nonimmunoprecipitated input and theanti-NKX2-1 immunoprecipitated sample, respectively.To avoid overrepresentation artifacts of amplified regionscaused by aneuploidy and copy number alterations, wenormalized the number of mappable reads within genomewindows of 100 kb.
After the correction, significantly enriched NKX2-1-occupied peaks were analyzed by the MACS (model-basedanalysis of ChIP-seq) algorithm (Zhang et al. 2008). Overall,we identified 7469 significantly enriched regions (P < 1 3
Figure 1. Genes associated with NKX2-1 ampli-fication and overexpression in human lung ade-nocarcinoma. (A) Genes (12,328) are rank-orderedby differential expression score (SAM score) andplotted against the expected SAM score in 11lung adenocarcinoma cell lines with high-levelfocal NKX2-1 amplification compared with 17lung adenocarcinoma cell lines with the lowestNKX2-1 expression in a panel of 42 lung adeno-carcinoma cell lines with matched copy numberdata from a 250K SNP array. The red circle in-dicates positively correlated genes with a SAMscore that deviates from the expected distribu-tion of the SAM score at a Delta slope of 0.26.The green circle indicates negatively correlatedgenes with score deviates from the expecteddistribution of the SAM score at a Delta slopeof 0.26. (B) Genes (13,291) are rank-ordered bya differential expression SAM score and plottedagainst the expected SAM score in 47 (top 10thpercentile) primary human lung adenocarci-nomas with the highest expression of NKX2-1
compared with 47 (bottom 10th percentile) tu-mors with the lowest NKX2-1 expression from expression profiles of 470 primary lung adenocarcinomas. Genes are plotted against theexpected distribution of the SAM score. The red circle indicates positively correlated genes with a SAM score that deviates from theexpected distribution of the SAM score at a Delta slope of 3.9. The green circle indicates negatively correlated genes with a score thatdeviates from the expected distribution of the SAM score at a Delta slope of 3.9. There were more genes whose expression is positivelycorrelated with NKX2-1 overexpression than negatively correlated. The signature tails, or overall departure from no gene effects (from0 to 1) in the data set, for positive is 0.77 and for negative is 0.20. (C) Venn diagram depicting the overlap between positively correlatedgenes of the 1000 most differentially expressed genes associated with NKX2-1 amplification in lung adenocarcinoma cell lines andpositively correlated genes of the 1000 most differentially expressed genes associated with the top 10th percentile highest NKX2-1
expression in primary lung adenocarcinomas (hypergeometric P-value of significant overlap <1 3 10�12). (D, left) Of the 147 overlappedgenes, the expression level of the most differentially expressed 25 genes in 11 NKX2-1-amplified cell lines and 17 cell lines with thelowest NKX2-1 expression is shown in a heat map. Cell lines are ordered from left to right by copy number at the NKX2-1 locus. (Right)Of the 147 overlapped genes, the expression level of the most differentially expressed 25 genes in primary lung adenocarcinomas withthe top and bottom 10th percentile NKX2-1 expression is shown in a heat map. Samples are ordered from left to right by NKX2-1expression level. The complete list of the genes is available in Supplemental Table 1.
NKX2-1 targets LMO3 in lung cancer
GENES & DEVELOPMENT 3
Cold Spring Harbor Laboratory Press on June 27, 2018 - Published by genesdev.cshlp.orgDownloaded from
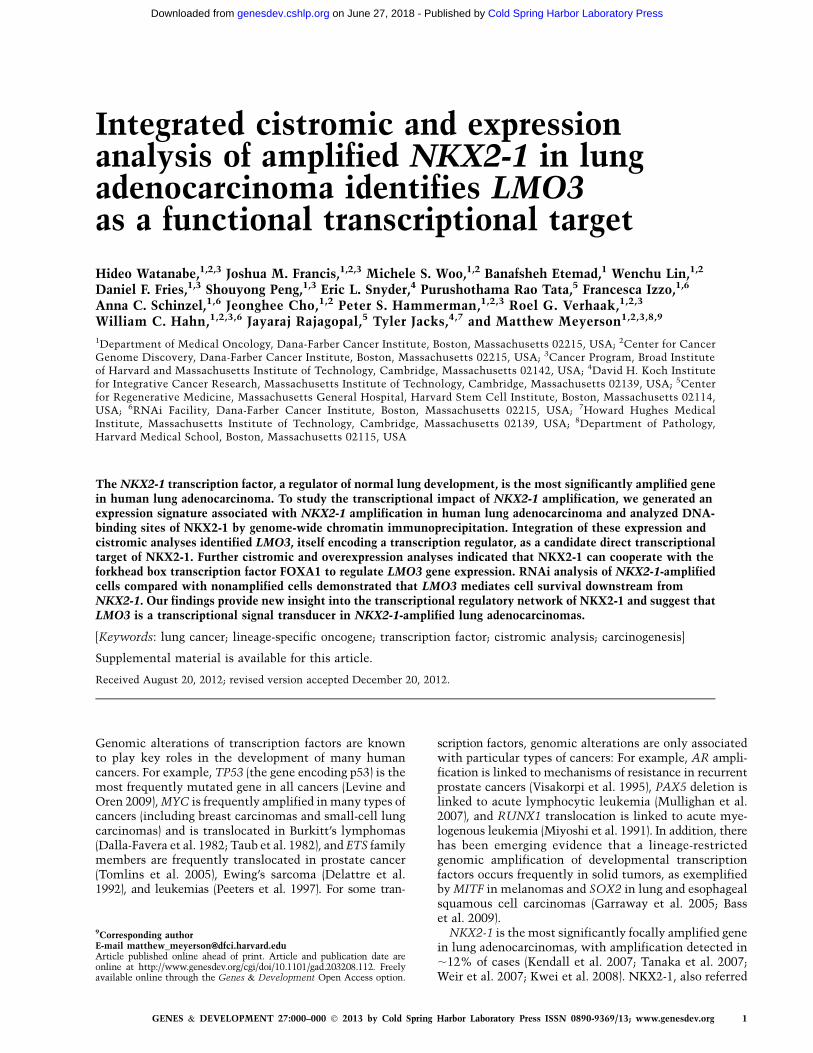
10�5) across the genome (Supplemental Table S2). Analysisof aggregated NKX2-1-binding regions showed sequenceconservation across multiple vertebrate species, with thehighest average conservation score at the center of thebinding sites, representing likely functional occupanciesof NKX2-1 (Supplemental Fig. S3A). NKX2-1-binding sitesare more enriched in the proximity of transcription startsites (TSSs) and promoter regions (within 1 kb from theTSS) (9.2%; P = 2.5 3 10�286) than expected by chance(Fig. 2A,B). We identified NKX2-1-binding sites in thepromoter regions of known transcriptional target genesof NKX2-1, such as SFTPB, CCNB1, and ROR1 (Supple-mental Fig. S3B; Bohinski et al. 1994; Tagne et al. 2012;Yamaguchi et al. 2012). Independent immunoprecipi-tation confirmed enrichment by quantitative PCR(qPCR) at all 15 arbitrarily selected enrichment sites(Supplemental Fig. S3C). We further confirmed thespecific enrichment of NKX2-1 at five loci by performingChIP using two additional antibodies against NKX2-1as well as controls using blocking peptides (Supplemen-tal Fig. S3D).
To investigate whether genome-wide cis elements ofNKX2-1 are shared across lung adenocarcinoma cell lineswith NKX2-1 amplification, we performed ChIP-seq anal-yses on two additional lung adenocarcinoma cell lines,NCI-H1819 and NCI-H2087, both of which harbor NKX2-1amplification (Supplemental Fig. S2A,B). We identifiedNKX2-1-bound regions in NCI-H1819 and NCI-H2087from >16 million aligned reads and compared the enrichedsites between these cell lines and NCI-H3122. Afternormalizing the identified significant (P < 1 3 10�6) peaknumbers to the cell line with the fewest peaks (7469in NCI-H3122), we directly intersected the identifiedNKX2-1-binding regions of these cell lines (SupplementalTable S2). While there was a significant overlap amongthese cell lines as expected, only 559 (;7.5% of each
sample) loci were common in all three cell lines and 3171(;17% of all sites) in any two samples, and there weremany unique binding loci in each cell line (Fig. 2C).
Significant overrepresentation of the genes with adjacentNKX2-1-binding sites whose expression is correlatedwith NKX2-1 amplification and/or overexpression
To determine the functional consequences of NKX2-1activity and DNA binding in lung adenocarcinomas, wesought to integrate NKX2-1-binding regions with ourgene expression data set. For this analysis, we identified1158 highly significant common NKX2-1-binding sitepeaks (P < 1 3 10�60) by combining enriched peaks inthe three cell lines described above, which also displayedenrichment signals in individual cell lines (Fig. 3A;Supplemental Table S2). To generate the gene set fromNKX2-1-binding sites, we then annotated the common1158 peaks to the adjacent gene and generated a list ofgenes that have NKX2-1-binding sites within 30 kb ofthe TSS (Supplemental Table S3). Gene set enrichmentanalysis (GSEA) (Subramanian et al. 2005) revealed sig-nificant overrepresentation of those adjacent genes inprimary tumors with high NKX2-1 expression and in celllines with a high NKX2-1 copy number, suggesting thataberrant overexpression of NKX2-1 primarily activatesthe expression of transcriptional target genes whoseexpression is not trans-activated by NKX2-1 at phys-iological expression levels (Fig. 3B). In addition, whilethe ChIP signal was most enriched upstream of TSSs ofthe genes positively correlated with NKX2-1 amplifi-cation, there was also signal enrichment upstream ofTSSs of the genes negatively correlated with NKX2-1amplification, indicating that NKX2-1 might directlyrepress expression of a set of anti-correlated genes(Fig. 2A).
Figure 2. NKX2-1 binds preferentially to pro-moter regions of the genes whose expression iscorrelated with NKX2-1 amplification. (A) Theaverage NKX2-1 ChIP enrichment signal on thegene structure of all genes (gene bodies were nor-malized to 3 kb) was plotted in black. The signalis highest upstream of the TSS. The NKX2-1ChIP signal is also plotted for genes whoseexpression is positively correlated with NKX2-1
amplification (red) and negatively correlated(cyan) and not correlated and low in NCI-H3122cells (purple). NKX2-1 occupancy at TSSs is high-est in genes whose expression is positively corre-lated. (B) NKX2-1 occupancy within 1 kb upstreamof TSSs is significantly higher than expected byrandom chance. Of all enriched peaks, 9.2% arewithin 1 kb upstream of TSSs of any RefSeqgenes that comprise 1.0% of the effective ge-nome size. (C) The Venn diagram depicts over-laps of 7469 each of the most significantlyenriched genomic intervals by NKX2-1 ChIP forthree lung adenocarcinoma cell lines that harborNKX2-1 amplification (NCI-H1819, NCI-H2087,and NCI-H3122).
Watanabe et al.
4 GENES & DEVELOPMENT
Cold Spring Harbor Laboratory Press on June 27, 2018 - Published by genesdev.cshlp.orgDownloaded from

Motif-based analysis of sequences from the NKX2-1-binding regions revealed AP-1, Forkhead, and nuclearhormone receptor-binding motifs
Next, we sought to identify consensus NKX2-1-bindingregion motifs within the central 100 base pairs (bp) ofNKX2-1-binding regions with the highest statisticalvalue for enrichment using the MEME-ChIP algorithm(Machanick and Bailey 2011). We used sequences from1158 common binding regions (combined P < 1 3 10�60)and identified the motif sequence c/gTg/tGAGa/tGg/c asthe most significant (Fig. 4A). Analysis of sequences fromeach individual cell line identified the almost identical
motif sequence (data not shown). The identified motif ishighly similar to the Nkx3-2 consensus motif (Kim et al.2003) and zeste consensus motifs in Drosophila (Bensonand Pirrotta 1988) and has similarity to the in vitro motiffor NKX2-1 (Berger et al. 2008) and vnd, the homologousgene to NKX2-1 in Drosophila (Wang et al. 2002).
Many transcription factors function in heterodimericcomplexes with other transcription factors or coactiva-tors to synergistically regulate gene expression. To pre-dict potential co-occupancies of NKX2-1 with otherDNA-binding proteins, we searched for sequences fromthe databases of known consensus motifs overrepresentedin the proximity of NKX2-1-binding sites. We identified
Figure 3. NKX2-1-occupied genes are significantlyoverrepresented in the NKX2-1-amplified lung ade-nocarcinomas. (A) ChIP signal within 0.5 kb up-stream of and downstream from the center of theNKX2-1-bound peaks of 3358 common peaks thatare highly significant (P < 1 3 10�30) and 1158 peaksbelow the P-value of 1 3 10�60 in a combinedanalysis for each cell line. Peaks are rank-orderedby combined P-value. The scale is shown on theright bar from 0 to 10 tag counts per 10-bp resolu-tion. (B, left) The gene set with the genes that havethe common NKX2-1 occupancy (1158 peaks withP < 10�60) within 30 kb upstream of or downstreamfrom their TSSs is significantly enriched in cell lineswith high-level NKX2-1 amplification comparedwith the ones with the lowest NKX2-1 expression.(Right) The same gene set is also significantly en-riched in primary lung adenocarcinomas with thehighest NKX2-1 expression compared with thelowest.
Figure 4. Motif analysis of NKX2-1-bound sequencesidentified AP-1, Forkhead, and nuclear hormone recep-tor-binding motifs. (A) De novo primary motif found inthe most significant NKX2-1-bound sequences of thecombined data shows similarity to the known bindingmotif of Nkx3-2 and zeste. (B) Other enriched motifsfound in common NKX2-1-occupied regions in threeNKX2-1-amplified cell lines (NCI-H1819, NCI-H2087,and NCI-H3122). The motifs were identified to besimilar to known consensus binding motifs of AP-1and the FOX family, respectively. (C) The known motifmost significantly enriched at the fixed distance fromthe identified primary NKX2-1-binding motif was iden-tified as the ERb motif (P = 4.4 3 10�92). Of 7538 regionsthat contain sequences of both the identified NKX2-1-binding motif and the ERb consensus binding motif fromNKX2-1-binding regions in any of three NKX2-1-amplifiedcell lines, 148 regions were found to have both motifsat a 15-bp distance. (D) Cell growth curve of an NKX2-1-amplified cell line, NCI-H3122, after suppression ofFOXA1, ESR1, RARA, or LacZ control by shRNAs.Suppression of FOXA1 led to reduced cell viability,whereas that of ESR1 or RARA did not.
NKX2-1 targets LMO3 in lung cancer
GENES & DEVELOPMENT 5
Cold Spring Harbor Laboratory Press on June 27, 2018 - Published by genesdev.cshlp.orgDownloaded from

significant enrichment of sequences corresponding toAP-1 and Forkhead box (FOX) consensus binding motifs(Fig. 4B). In addition, to more specifically identify DNAmotifs immediately adjacent to the primary NKX2-1-binding motifs at fixed spacing intervals, which wouldsuggest a likely hetero-oligomeric interaction betweentwo transcription factors and the DNA, we searched forenrichment of known DNA motifs at a given distancefrom the primary NKX2-1 motif. The most significantlyenriched motif was identified to be the ESR2 (estrogenreceptor b [ERb]) found in both common (P = 1.1 3 10�22;23 of 371 sites with both motifs) and all (P = 4.4 3 10�92;148 of 7538 sites with both motifs) NKX2-1-bindingsequences in the three cell lines at a 15-bp distance fromthe primary NKX2-1 motif (Fig. 4C). The ERb motifshared commonality between other hormone receptorssuch as ERa and RARs. Indeed, 425 sites were found tooverlap between NKX2-1-occupied regions (3358 sites,combined P-value < 1 3 10�30) (Fig. 3A) and publishedERa-occupied regions in the MCF-7 breast cancer cellline (14,505 sites) (Supplemental Fig. S4A; Ross-Inneset al. 2010). Similarly, we attempted to compare theoccupancies by NKX2-1 and RAR using RARa ChIP-seqdata (Hua et al. 2009) from the MCF-7 breast adenocar-cinoma cell line and found 392 (;8%) regions commonlyoccupied by RARa in MCF-7 cells (4870 sites) and byNKX2-1 in lung adenocarcinoma cell lines (SupplementalFig. S4A) as compared with 98 sites common in 3648GATA3-bound sites in the MCF7 cell line from the samestudy (Hua et al. 2009). Analysis with a statistical metricto calculate significant overlap of peaks over genomebackground (Chikina and Troyanskaya 2012) showed ahigher number of peaks that significantly overlappedwith RARa- and ERa-binding peaks as compared withGATA3-binding peaks (Supplemental Fig. S4A).
Further inspection of the expression data set revealedthat among 14 AP-1 complex-associated genes, 31 FOXgenes, and eight RA/estrogen-related receptor genes, thegenes whose expression is most significantly correlatedwith NKX2-1 overexpression include FOSB, FOS, JUN,FOXA2, FOXA1, and FOXJ1 (Supplemental Fig. S4B). Todetermine the requirement of these potential cooperatingDNA-binding proteins with NKX2-1, we examined cellviability after suppressing either of three candidate genes—FOXA1, ESR1, or RARA—in an NKX2-1-amplified cellline, NCI-H3122. FOXA1 was found to be required for cellsurvival in this cell line, whereas ESR1 and RARA weredispensable for cell survival (Fig. 4D).
The LMO3 oncogene is a transcriptional targetof NKX2-1 in lung adenocarcinomas
To identify the most likely individual target genes ofNKX2-1 that transduce its function in lung adenocarci-noma, we analyzed significantly correlated genes in twoexpression data sets (Ding et al. 2008; Sos et al. 2009) inthe context of genes with nearby NKX2-1-binding sites(�3 kb to�1 kb of the TSS) in NCI-H3122 cells and found14 genes at the intersection of all three lists (Supplemen-tal Fig. S5A). The genes include SFTPB, a well-known
target gene of NKX2-1; MBIP, the nearest gene to NKX2-1that is frequently coamplified; and LMO3, a paralog of theLMO1 and LMO2 genes, which are well known as trans-located oncogenes in T-ALL (Boehm et al. 1988a,b). TheLMO3 gene has also recently been reported to be trans-located in T-ALL (Simonis et al. 2009) and implicatedin promoting tumorigenesis of neuroblastoma (Aoyamaet al. 2005). Moreover, a Drosophila homolog of NKX2-1,vnd, most preferentially binds to the Beadex or dLMOgene, the homolog of the LMO family in Drosophila(Wang et al. 2005). Indeed, expression of LMO3 was themost significantly correlated of any gene with expressionof NKX2-1 in the analyzed lung adenocarcinoma tumordata set (Fig. 1B; Supplemental Table S1).
Given that multiple potential NKX2-1 target genesexhibited both NKX2-1 occupancy in NCI-H3122 cellsand coexpression with NKX2-1, we wished to determinewhether any of these novel NKX2-1 target genes are es-sential in cells with amplification of the NKX2-1 locus.To this end, we used a small-scale arrayed shRNA screen-ing approach to determine relative essentiality of 15genes—14 putative NKX2-1 target genes and NKX2-1itself—in four lung adenocarcinoma cell lines (NCI-H3122,NCI-H1819, NCI-H2087, and HCC1833) with amplifica-tion of NKX2-1 and four lung adenocarcinoma cell lineswithout amplification (NCI-H23, NCI-H1437, HCC461,and Calu3) (Weir et al. 2007). We performed statisticalanalysis of the shRNA data set using the RIGER (RNAigene enrichment ranking) algorithm, designed to evalu-ate the differential impact of multiple shRNA gene setson different cell lines (Luo et al. 2008). Among the 15genes tested, weighted sum analysis showed that sup-pression of the NKX2-1 gene had the largest differentialanti-proliferative effects on NKX2-1-amplified lung ade-nocarcinoma cell lines compared with control lungadenocarcinoma cell lines without such amplification,followed by LMO3 with the second largest effect (Fig. 5A).These observations indicate that LMO3 is an essentialmediator downstream from NKX2-1 in driving prolifera-tion and survival of NKX2-1-amplified cell lines.
As previous studies have shown that suppression ofNKX2-1 in lung adenocarcinoma cells with amplificationof NKX2-1 results in increased apoptosis (Tanaka et al.2007; Kwei et al. 2008), we assessed the effect by LMO3suppression in NCI-H3122 cells. Suppression of LMO3via shRNA similarly increased apoptosis, whereas it didnot affect cell proliferation in cell cycle analysis (Supple-mental Fig. S5B). However, ectopic expression of LMO3in NKX2-1-suppressed NCI-H3122 cells failed to over-come decreased cell viability (data not shown). Thus, it islikely that LMO3 is not the only downstream effector ofamplified NKX2-1 and there may be multiple direct andindirect effectors, as indicated by our expression andcistromic analyses.
To determine whether LMO3 is more abundantlyexpressed in lung adenocarcinomas compared with othertypes of tumor, we analyzed a publicly available ex-pression data set from multiple tumor types (Interna-tional Genomics Consortium, https://expo.intgen.org/geo/listPublicGeoTransactions.do). The LMO3 gene is
Watanabe et al.
6 GENES & DEVELOPMENT
Cold Spring Harbor Laboratory Press on June 27, 2018 - Published by genesdev.cshlp.orgDownloaded from

most highly expressed in lung cancer and in thyroidcancer, where NKX2-1 is also highly expressed (Supple-mental Fig. S6A; Fabbro et al. 1994; Zhang et al. 2006). Weconfirmed that LMO3 expression is much higher in lungadenocarcinomas compared with lung squamous cell car-cinomas (Hofmann et al. 2006) with analysis of additionalmicroarray data (Supplemental Fig. S6B; Bhattacharjeeet al. 2001). This result is consistent with our previousfinding that NKX2-1 is primarily amplified in lung adeno-carcinoma but not in squamous cell lung carcinomas (Basset al. 2009). In situ hybridization of a probe against theLmo3 gene in normal adult mouse lungs showed thatit is highly expressed in bronchiolar epithelium, whereNkx2-1 is known to be highly expressed (SupplementalFig. S6C), but is not expressed in the proximal airway,where Nkx2-1 levels are normally low. However, Lmo3was not found to be expressed in alveolar type II cells(Supplemental Fig. S6C), whereas NKX2-1 is known to beexpressed in both bronchiolar epithelium and alveolartype II cells (Yatabe et al. 2002). These results potentiallyreflect a similarity in cell lineage between lung adeno-carcinomas with NKX2-1 amplification and the bronchi-olar epithelium, although both Clara cell (SCGB1A1 andCYP2B6) and alveolar type II cell (SFTPC) markers arehighly expressed in lung adenocarcinomas that overex-press NKX2-1 (Supplemental Table S1).
To evaluate the requirement of NKX2-1 for LMO3expression in the cell lines that express both genes, wesuppressed the expression of NKX2-1 using two previ-ously validated shRNAs (Weir et al. 2007). LMO3 expres-sion was significantly reduced after NKX2-1 suppressionon both the mRNA and protein levels (Fig. 5B,C). Toexclude the possibility that reduced expression is a gen-eral consequence of decreased transcription by reducedviability of cells with NKX2-1 suppression, we investi-gated the degree of decrease of LMO3 expression byNKX2-1 compared with the effects on other transcripts
by performing expression profiling of NCI-H2009 celllines stably expressing two shRNAs against NKX2-1 orshRNA against GFP. LMO3 was among the 50 mostdifferentially expressed genes between NCI-H2009 cellswith shGFP and shNKX2-1, confirming that LMO3 isa transcriptional target of NKX2-1 in a cell line withamplification of NKX2-1 (Supplemental Fig. S6D).
Expression of LMO3 is directly regulated by NKX2-1in lung adenocarcinomas
To verify the enrichment of NKX2-1 binding and charac-terize its precise binding location on the LMO3 genelocus, we designed several primer sets surrounding theLMO3 TSS, performed NKX2-1 ChIP, and analyzed ChIPenrichment by qPCR using the NCI-H3122 cell line.Corresponding to the peak center of enrichment withChIP-seq data, the highest enrichment of NKX2-1 wasobserved with a primer set spanning 693–845 bp down-stream from the TSS of the LMO3 gene, where the se-quence is conserved across several species (SupplementalFig. S7A,B).
Next, we generated reporter constructs to assess theability of NKX2-1 binding to the LMO3 locus to activateexpression of the LMO3 gene. The DNA sequence down-stream (103–1149 bp) from the TSS of the LMO3 gene wascloned upstream of the luciferase gene, and luciferaseactivity was measured after transfection of 293T cells. Weobserved induction of luciferase activity when the re-porter plasmid was cotransfected with the NKX2-1 ex-pression vector, although it was modest possibly due tothe lack of expression of cofactors in the cellular contextof the renal embryonic cell line (Supplemental Fig. S7C).
ChIP after formaldehyde cross-linking enriches DNAloci occupied by the immunoprecipitated protein eitherdirectly or indirectly as a multiprotein complex. To de-termine whether the interaction between NKX2-1 and
Figure 5. NKX2-1 and LMO3 are the most differen-tially essential for cell survival in NKX2-1-amplifiedcell lines as compared with cell lines without amplifi-cation, and NKX2-1 is required for expression of LMO3.(A) Anti-proliferative effects were tested for five to 10shRNAs per gene on four cell lines with NKX2-1 am-plification (H1819, H2087, H3122, and HCC1833) andfour cell lines without amplification or expression ofNKX2-1 (H23, H1437, HCC461, and Calu-3). Individualdifferential essentiality scores for each shRNA (Z-scoreof differential effects for four cell lines vs. four cell lines)scaled on the right Y-axis are shown in red bars. Thecomposite differential essentiality scores (weighted sum)for each gene tested scaled on the left Y-axis are shownas black bars. (B) mRNA expression of NKX2-1 andLMO3 measured by RT-qPCR in NCI-H2009 cells afterintroduction of two shRNA against NKX2-1 and oneshRNA against GFP as control. LMO3 expression isreduced relative to the suppression of NKX2-1 expres-sion. (*) P < 0.05; (**) P < 0.01. (C) Western blot forH2009 cell lysates with anti-NKX2-1, anti-LMO3, andanti-vinculin (loading control) antibodies after introduc-tion of two shRNAs against NKX2-1 and one shRNAagainst GFP as control.
NKX2-1 targets LMO3 in lung cancer
GENES & DEVELOPMENT 7
Cold Spring Harbor Laboratory Press on June 27, 2018 - Published by genesdev.cshlp.orgDownloaded from

the LMO3 locus is direct, we tested the binding of in vitrotranslated NKX2-1 protein with two independent DNAsequences (+773–898 and +823–962) from the LMO3 locususing an electrophoretic mobility shift assay (EMSA)(Fig. 6A; Supplemental Fig. S7B). Electrophoretic mobilityof both LMO3 sequences was shifted when NKX2-1protein was added and further shifted (supershift) byaddition of anti-NKX2-1 antibody, suggesting direct bind-ing of NKX2-1 to the LMO3 gene locus (Fig. 6A).
Regulation of LMO3 expression by NKX2-1 is cellularcontext-dependent and may require cooperativebinding with FOXA1
We further evaluated the ability of NKX2-1 to induceexpression of the LMO3 gene in six different cell lineswith and without endogenous expression of NKX2-1.Ectopic expression of NKX2-1 was able to augment theexpression of the LMO3 gene in the three cell lines thatharbor genomic amplification and expression of NKX2-1.We did not observe a similar induction in three othercell lines—A549, AALE tracheobronchial epithelial cells,and 293T cells, all of which do not express endogenousNKX2-1—whereas SFTPB expression was induced in allcell lines except for a nonlung epithelial cell line,293T (Fig. 6B). In addition, in two lung adenocarcinomacell lines—HCC78 and H2347—that express NKX2-1 athigh levels without NKX2-1 amplification (Supplemen-tal Fig. S2A), ectopic expression of NKX2-1 failed toinduce LMO3 expression (Supplemental Fig. S8A). Thissuggests that NKX2-1 requires a specific cellular contextsuch as expression of cofactors or a permissive chromatinstructure to enable NKX2-1 transactivation of the LMO3gene.
While we were able to validate enrichment of theLMO3 locus as well as the SFTPB promoter locus fromChIP-seq data in two additional cell lines—NCI-H1819and NCI-H2087—that harbor amplification of NKX2-1(Fig. 6C), the enrichment of these loci was not observedin the A549 lung adenocarcinoma cell line that lacksendogenous NKX2-1 expression, confirming the specific-ity of antibody enriching this region (Fig. 6C; Supplemen-tal Fig. S2B). When we ectopically overexpressed NKX2-1in the A549 cell line, we observed slower cellular growthcompared with the control GFP-expressing A549 cell line,consistent with a tumor-suppressive role of NKX2-1 inA549, a mucinous lung adenocarcinoma cell line (Sup-plemental Fig S8B; Lieber et al. 1976; Maeda et al. 2012).In A549 cells with ectopic NKX2-1 expression, NKX2-1localized to the SFTPB promoter region, whereas wecould not detect NKX2-1 occupancy at the LMO3 locus,again suggesting that in this cellular context, additionalcofactors are required for NKX2-1 to localize to thisLMO3 site (Fig. 6C).
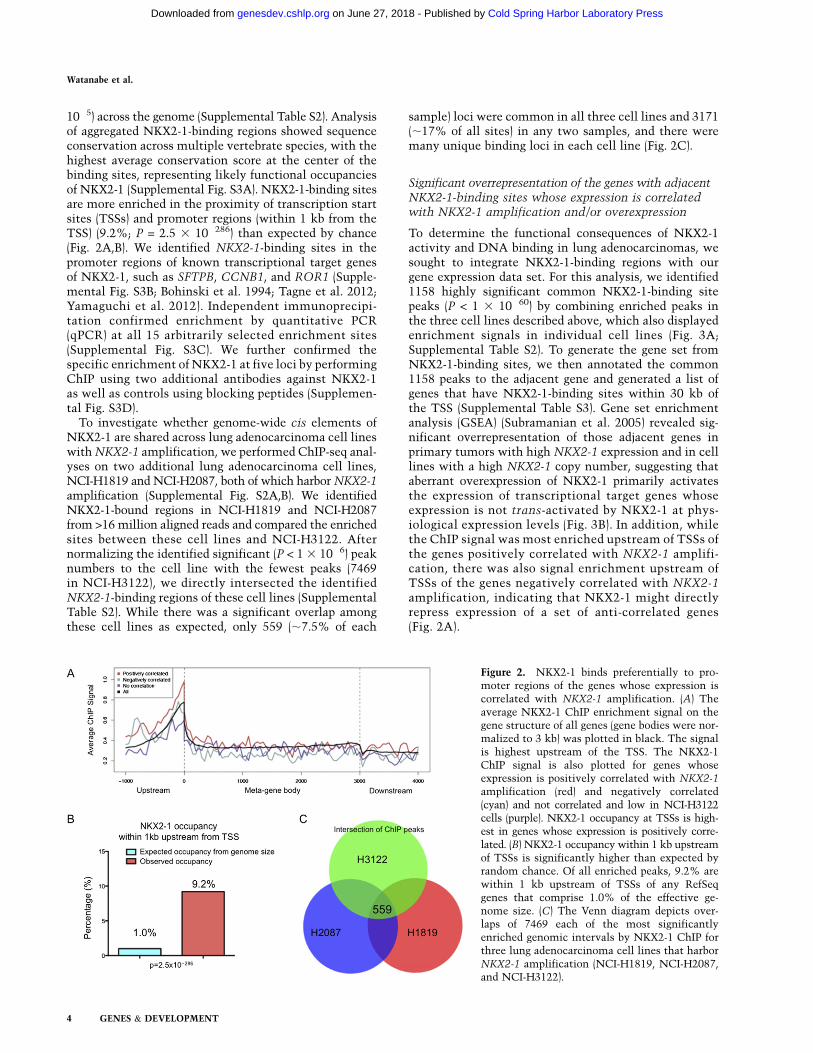
Since the FOX motif was one of the enriched motifsequences adjacent to NKX2-1-binding regions and theFOXA1 gene is coamplified with NKX2-1 at chromosomalsegment 14q13 in 80%–90% of NKX2-1-amplified cases(Supplemental Fig. S8C) and is known to play an essentialrole in lung development (Wan et al. 2005), we testedwhether FOXA1 can co-occupy the LMO3 locus by ChIPanalysis using an antibody against FOXA1. We foundthat FOXA1 bound to the LMO3 locus upstream of theNKX2-1-binding site (Fig. 7A). By independent ChIP-qPCR,we observed that the highest enrichment of FOXA1 bind-ing was with a primer set spanning 385–510 bp down-stream from the TSS of the LMO3 gene (SupplementalFig. S7A). We also found that four of the NKX2-1-
Figure 6. NKX2-1 binds to ;0.8 kb downstreamfrom the TSS of the LMO3 gene and trans-activatesLMO3 expression in cells with NKX2-1 amplifica-tion but not in cells without NKX2-1 amplifica-tion. (A) EMSA with in vitro translated NKX2-1protein for two 32P-labeled probes designed fromthe LMO3 gene locus. Electrophoretic mobility wasshifted when incubated with NKX2-1 protein (lanes2,6) and further shifted (supershift) by addition ofanti-NKX2-1 antibody (lanes 4,8). (Lanes 3,7) Mobilityshift was diminished with incubation of nonradioac-tive self-competitor probes. (B) Ectopic expression ofNKX2-1 induced ;10-fold expression of LMO3 inthree cell lines (H3122, H2009, and H1819) thatharbor NKX2-1 amplification. LMO3 expression wasnot induced to a similar level or reduced after ectopicNKX2-1 expression in three cell lines without NKX2-1
amplification (A549, AALE, and 293T cells). (C)ChIP enrichment (percent recovery of input) by anti-NKX2-1 antibody measured by qPCR at 0.7 kbdownstream from LMO3 TSS and the SFTPB pro-moter for three cell lines (H1819, H2087, and H3122)with NKX2-1 amplification, A549 without NKX2-1amplification, and A549 expressing ectopic NKX2-1.
HBG1 serves as a negative control. NKX2-1 localizes to both LMO3 and SFTPB loci in NKX2-1-amplified cell lines but was not able tolocalize to the LMO3 locus in A549, whereas NKX2-1 was still able to occupy the SFTPB promoter region.
Watanabe et al.
8 GENES & DEVELOPMENT
Cold Spring Harbor Laboratory Press on June 27, 2018 - Published by genesdev.cshlp.orgDownloaded from
amplified cell lines that we examined have much higherendogenous expression of FOXA1 protein comparedwith A549 or 293T cells (Supplemental Fig. S2B). Fur-thermore, ectopic expression of FOXA1 in A549 cellspotentiated the ability of forced expression of NKX2-1to induce LMO3 expression (Supplemental Fig. S8D).Suppression of FOXA1 in NCI-H3122, which resulted indecreased cell survival, led to reduced LMO3 expression(Supplemental Fig. S8E). Finally, genome-wide analysis ofFOXA1 occupancy by ChIP-seq in the NCI-H3122 cellline revealed highly significant overlap with NKX2-1occupancy (47% of NKX2-1-bound sites) (SupplementalFig. S8F), suggesting that multiple NKX2-1 target genescould be coregulated by FOXA1 in the NKX2-1-ampli-fied cells and that coregulation of not only LMO3 butother target genes by NKX2-1 and FOXA1 might be acritical mechanism for cell survival of NKX2-1-amplifiedlung adenocarcinomas.
Discussion
NKX2-1 is the most commonly amplified gene in lungadenocarcinoma but plays a complex role in the regula-tion of lung adenocarcinomagenesis. On the one hand,NKX2-1 is required for the growth of lung adenocarci-noma cells bearing its amplification (Kendall et al. 2007;Tanaka et al. 2007; Weir et al. 2007; Kwei et al. 2008),suggesting that it is a dominant oncogene; this concept iscorroborated by the activating translocations of NKX2-1seen in acute T-cell lymphoblastic leukemias (Hommingaet al. 2011). On the other hand, loss of NKX2-1 expressionpromotes metastasis in mouse models, is associated withtumor suppression of Kras-driven murine mucinous lungadenocarcinomas, and is associated with an inferior out-come in human lung adenocarcinomas (Winslow et al.2011; Maeda et al. 2012).
Understanding the downstream signaling from NKX2-1can help to identify targets of its transcriptional activityand shed light on its complex roles in lung adenocarci-noma. Here, we used an integrated analysis of data fromChIP, gene expression correlative analysis, and RNAi tonominate the LMO3 transcriptional regulatory gene asa functional target of NKX2-1.
LMO3 is a paralog of LMO1/2 oncogenes that are re-currently translocated and, as a consequence, overexpressedin T-ALL (Boehm et al. 1988a,b). The LMO3 gene itself istranslocated in at least one T-ALL case (Simonis et al.2009). Although the mechanism of leukemogenesis byLMO gene rearrangements is still unknown, various linesof evidence suggest that the LMO genes play a role indifferentiation, such as a recent study suggesting thatLmo2 might reactivate the self-renewing capacity ofT-cells in preleukemic thymocytes (McCormack et al.2010). A developmental/differentiation role for LMOgenes is consistent with the role of NKX2-1 as a masterregulator of lung alveolar cell lineage commitment(Boggaram 2009). Mice lacking Nkx2-1 fail to developnormal branching morphogenesis of the lung (Yuanet al. 2000). It is conceivable that the developmentalroles of NKX2-1 and the LMO genes are linked and thatthese links may extend to their respective roles intumorigenesis.
The activity of NKX2-1 to bind to the LMO3 locus wasrestricted to a subset of lung adenocarcinoma cell lines; inthe limited set of tested cells, only the lines that wereNKX2-1-amplified showed LMO3 induction by NKX2-1.This result suggested that an essential cofactor mightalso be required for NKX2-1 to trans-activate LMO3. Ourdata suggest that FOXA1 may be such a cofactor. FOXA1coexpression with NKX2-1 induces LMO3 expression,and FOXA1 binds to the LMO3 locus.
FOX proteins are a family of transcription factors thatplay roles in regulating genes involved in cell growth,proliferation, and differentiation. While there are as manyas 46 genes encoding FOX proteins that have been de-scribed in humans, a few have been well characterized andknown for consensus binding motifs. Of those, FOXA1/2,FOXJ1, and FOXP1/2 have been implicated in lung mor-phogenesis. FOXA1/2 are essential in early lung develop-ment (Costa et al. 2001), FOXJ1 is essential for differenti-ation of ciliated epithelial cells in the lung (Costa et al.2001), and FOXP1/2 has been shown to be important forlung alveolization (Shu et al. 2007). While multiple fork-head proteins may cooperate with NKX2-1 independently,FOXA1 is of particular interest because it is located atchromosomal segment 14q13.3, where NKX2-1 resides,
Figure 7. NKX2-1 and FOXA1 colocalize at thegenomic regions, including LMO3. (A) A view ofthe LMO3 gene locus of shifted read counts fromChIP-seq by either the anti-NKX2-1 or anti-FOXA1antibody as well as read counts from the no-ChIPinput control. The location of sequences taken fortwo probes designed for gel shift assay is shownas red bars. (B) The model depicting cooperativeoccupancy of NKX2-1 and FOXA1 on the locusdownstream from the TSS of the LMO3 gene totrans-activate expression of LMO3.
NKX2-1 targets LMO3 in lung cancer
GENES & DEVELOPMENT 9
Cold Spring Harbor Laboratory Press on June 27, 2018 - Published by genesdev.cshlp.orgDownloaded from

and is often coamplified in lung adenocarcinoma. FoxA1has been shown to interact with Nkx2-1 to regulate theexpression of lung-specific genes such as Sftpb andScgb1a1 (Minoo et al. 2007). We showed that NKX2-1and FOXA1 bind to many common genomic loci in NCI-H3122 cells, including the LMO3 gene locus (Fig. 7A;Supplemental Fig. S8F).
Our data provide a new insight into the transcriptionalregulatory network of NKX2-1 in NKX2-1-amplified lungadenocarcinoma and have nominated LMO3 as a keytransducer of NKX2-1, with FOXA1 as a major coopera-tive factor with NKX2-1. While aberrant activation oftranscriptional regulation for lineage commitment hasproven to be important in hematopoietic malignancy, wehave just begun to understand dysregulated transcrip-tional networks in lung adenocarcinomas. Further stud-ies of the NKX2-1 transcriptional network and cooperationbetween NKX2-1, FOXA1, and LMO3 as transcriptionalregulators in lung adenocarcinoma may elucidate impor-tant tumor vulnerabilities.
Materials and methods
Cell culture
NCI-H2347, NCI-H1819, NCI-H2087, NCI-H3122, NCI-H2009,HCC78, HCC1833, and A549 cells were provided by Dr. JohnMinna (University of Texas Southwestern Medical Center). Cellswere maintained in RPMI 1640 growth medium (Mediatech)supplemented with 10% FBS and 1 mM penicillin/streptomycin(Mediatech). Immortalized tracheobronchial epithelial cells (AALEcells) were prepared as described previously (Lundberg et al. 2002)and maintained in SAGM growth medium (Lonza). Stable NKX2-1
ORF or GFP-expressing NCI-H2347, NCI-H3122, NCI-H2009,HCC78, HCC1833, A549, 293T, and AALE cells were establishedwith use of a lentiviral vector (pLEX-Blast) with a standard viraltransfer protocol. Stable FOXA1 ORF or GFP-expressing A549 withectopic NKX2-1 expression were established with use of a lenti-viral vector (pLEX-puro) with a standard viral transfer protocol.
ChIP
About 20 million cells per cell line were cross-linked with 1%formaldehyde for 10 min at 37°C, washed in 5 mg/mL BSA in PBSand then in just cold PBS, resuspended in lysis buffer (50 mMTris-HCl at pH 8.1, 10 mM EDTA, 1% SDS, 13 completeprotease inhibitors [Roche]), and sonicated with the CovarisE210 sonicator to obtain chromatin fragment lengths of 200–1500 bp judged by the Bioanalyzer DNA High-Sensitivity kit(Agilent). Fragmented chromatin was diluted in immunoprecip-itation buffer (20 mM Tris-HCl at pH 8.1, 150 mM NaCl, 2 mMEDTA, 1% Triton X-100) and incubated overnight at 4°C withprotein G magnetic beads (Dynabeads, Invitrogen) that had beenpre-incubated with anti-NKX2-1 (Bethyl Laboratories, BL4000and BL3998; or Santa Cruz Biotechnology, H-190), anti-FOXA1(Abcam, ab23738), or control rabbit IgG (Bethyl Laboratories)antibodies. Immunoprecipitates were washed six times withwash buffer (50 mM HEPES at pH 7.6, 0.5 M LiCl, 1 mM EDTA,0.7% Na deoxycholate, 1% NP-40) and twice with TE buffer.DNA was recovered in 1% SDS plus 0.1 M NaHCO3 over a periodof 6 h at 65°C, column-purified with QiaQuick columns (Qiagen),and quantified with use of a PicoGreen assay (Invitrogen). DNAwas used as the template for qPCR or for library construction ofIllumina sequencing.
All qPCRs were performed in duplicate with Power PCR SYBRGreen Master mix (Applied Biosystems) on a 7300 Real-Time PCRsystem (Applied Biosystems). For quantification of DNA recovery,values for input were adjusted to 100%, and percentages werecalculated with use of a fraction of the values from immunopre-cipitated DNAs against values for the corresponding 100% inputDNAs. The primers used are listed in Supplemental Table S4.
For ChIP-seq, DNA that had been immunoprecipitated withthe appropriate antibody and input DNA without immunopre-cipitation were treated with RNase A and Proteinase K, followedby sonication to enrich DNA fragment lengths between 100 and300 bp. Ten nanograms to 50 ng of DNA was used for the libraryconstruction. DNA libraries for Illumina cluster generation wereprepared according to the manufacturer’s protocol. Sequencingwas done with Illumina GAIIx or HiSeq 2000.
ChIP-seq peak finding analysis and motif analysis
Sequenced reads were mapped to reference genome build 37,human (hg18), using the Bowtie aligner (Langmead et al. 2009).Alignable reads were subsequently normalized for copy numbervariation to average DNA copies on each cell line used. Specif-ically, we counted a number of reads aligned to the genomic loci ineach bin size of 100,000 bases. Then, we calculated the averagenumber of the alignable reads per bin and randomly omittedreads in order to adjust to the average copy for each cell line.
Binding sites for NKX2-1 or FOXA1 were detected with theuse of MACS as previously described (Zhang et al. 2008), witha P-value cutoff of 10�5 or 10�6 and with default values for otherparameters. Data are publicly available at Gene ExpressionOmnibus (GEO; accession no. GSE39998).
Identified NKX2-1-binding peaks were then used for analysisfor average profiling of genomic features with use of a module ofthe CEAS (cis-regulatory element annotation system) algorithm(Shin et al. 2009). Metagene average profiling was calculated bydefault setting (3-kb range of normalized gene structures) foreither all genes, 260 genes that were positively correlated withNKX2-1 overexpression, 144 genes that were negatively corre-lated, or 202 genes that were not correlated and expressed ata low level in NCI-H3122 cells.
An equal number (7469) of peaks with the highest statisticalsignificance for enrichment was used to determine the intersec-tion of binding regions from different cell lines. Then, numbersof genomic intervals shared by two or more samples werecounted and represented in a Venn diagram. For comparison ofNKX2-1 and FOXA1 binding, additional NKX2-1 ChIP-seq wasperformed on NCI-H3122 cell lysates, and immunoprecipitationand sequencing were done simultaneously under the same con-dition with FOXA1 ChIP-seq on Illumina HiSeq 2000. These datawere used for all visualizations of ChIP-seq data on the genomeviewer (Fig. 6C; Supplemental Figs. S4B, S8B).
Significantly enriched peaks in the combined data of three celllines were also analyzed by first detecting all potential enrichedsites with a very low threshold level (nominal P < 10�2) by MACSfor the data from each cell line and intersected common genomicintervals in three data and calculating each combined statisticalvalue using a modified Stouffer’s method. Enriched sequencemotifs in 1158 binding peaks with the highest statistical signif-icance (P < 10�60) were further determined with the use of theMEME ChIP module in the MEME suite (Machanick and Bailey2011). Known motifs at the fixed distance from the primaryNKX2-1 motif identified from the MEME algorithm weresearched using the SpaMo (Whitington et al. 2011) module inthe MEME suite as described. For spacing analysis, 1049 inter-sected NKX2-1-binding peaks of three cell lines or 35,791 NKX2-1-binding peaks in any of three cell lines were used.
Watanabe et al.
10 GENES & DEVELOPMENT
Cold Spring Harbor Laboratory Press on June 27, 2018 - Published by genesdev.cshlp.orgDownloaded from

Expression data analyses and GSEA
For identification of those genes whose expression is correlatedwith NKX2-1, we used a gene-centric CDF file to generateexpression data from existing raw expression files of 470 primarylung adenocarcinomas samples (Director’s Challenge Consor-tium for the Molecular Classification of Lung Adenocarcinomaet al. 2008) and 42 lung adenocarcinoma cell lines with matchedcopy number data from Affymetrix 250K SNP arrays (Sos et al.2009). We applied RMA (robust multichip average) and quantilenormalization as well as the matchprobes package in the Bio-conductor framework to create one single data set. To identifygenes linked to NKX2-1 from the primary lung adenocarcinomadata set, we used the 47 (top 10th percentile) samples that had thehighest NKX2-1 expression and the 47 (bottom 10th percentile)samples with the lowest NKX2-1 expression, and from the cellline data set, the 11 cell lines with highest NKX2-1-amplificationand the 17 cell lines without NKX2-1 amplification or expressionwere used. To identify correlated genes, we calculated differen-tial expression with use of the samr (SAM in R) package inBioconductor.
To determine the enrichment of NKX2-1-binding sites at theloci of correlated genes, we first annotated all binding sites withregard to their relative distance from neighboring RefSeq genes.Genes that had NKX2-1-binding sites within 30 kb upstreamof or downstream from their TSSs were used as sets for GSEA(Subramanian et al. 2005) on the same expression data describedabove.
RNAi
shRNA sequences that target NKX2-1, LMO3, FOXA1, ESR1,RARA, GFP, and LacZ were cloned into either the pLKO.1lentiviral vector or the doxycycline-inducible Tet-On-pLKO.1vector, obtained from the RNAi Consortium (TRC) at the Dana-Farber Cancer Institute. The virus was produced according toTRC’s protocol (http://www.broadinstitute.org/rnai/trc). Briefly,the pLKO.1-shRNA plasmid was transfected into 293T cells,along with the packaging vectors pCMV-dR8.91 and VSV-G, andviral particles were collected in RPMI-1640 medium at 24 and/or48 h. Virus titers were assayed in NIH-3T3 mouse fibroblasts todetermine the minimum amount of virus needed to produce;100% infection. Target cells were seeded on 10-cm plates onthe day prior to the infection and were subsequently incubatedfor 4–6 h with diluted virus in 8 mg/mL polybrene. Twenty-fourhours post-infection, fresh medium containing 1–2 mg/mL puro-mycin was added, and cells were selected in puromycin for 72–96 h until controls of noninfected cells were no longer visiblyviable. All target sequences for shRNA are listed in Supplemen-tal Table S5.
Arrayed RNAi screen
Lentiviral vectors containing shRNA sequences were obtainedfrom TRC. For two genes that we sought to evaluate (NKX2-1and LMO3), the 10 top-scoring constructs were used for theRNAi screen. For the remaining 13 genes to be tested in the RNAiscreen (AK2, ALCAM, ANKS1A, DUSP6, GPR116, KIAA0467,KRT15, LRBA, MBIP, SCEL, SFTPB, TOX4, and UBAP1), fiveshRNAs per gene in the TRC collection were used and analyzed.For the controls, two shRNAs each against GFP, RFP, and LacZ
and one shRNA against Luciferase as well as one empty controlfrom pLKO.1 and two from pLKO.3-pgw were included. Thescreens were performed at the DFCI RNAi Screening Facility.For screening cell lines with this lentivirus, cells were plated in384-well microtiter plates and, on the following day, infected
with 1–2 mL of shRNA lentivirus in the presence of 8 mg/mLpolybrene. All screens were performed in quadruplicate, withtwo replicates in the presence and two replicates in the absenceof puromycin, which was added 24 h post-infection. Six dayspost-infection, wells were assayed using CellTiter-Glo (Promega)according to the manufacturer’s instructions. Raw luminescencescores for the replicate wells with puromycin for a given shRNAconstruct in each cell line were normalized against readings inthat cell line for controls. The results of the RNAi screen wereanalyzed with the RIGER method. RIGER compares the effectsof each shRNA construct on the four NKX2-1-amplified lungadenocarcinoma lines with the construct’s effects in the fourcontrol cell lines to determine an enrichment score for eachconstruct. Lower enrichment scores signify a greater decrease inproliferation in the NKX2-1-amplified cell lines with the shRNAconstructs for a given gene. The enrichment scores were normal-ized against an enrichment score that would be generated byrandom permutation of an shRNA set of the same size to generatea normalized enrichment score for each gene based on thecomposite scores for the constructs targeting that gene comparedwith other genes in the screen. In the generation of thenormalized score for each gene, the algorithm assumes thatnot all constructs will be effective at reducing target expression.Comparison of the actual data to this permutation allows calcu-lation of nominal P-values and the false discovery rate (FDR).
EMSA
The DNA fragment that lies upstream of the LMO3 gene wasPCR-amplified from human genomic DNA; a total of 250 ng ofPCR products was end-labeled with 32P-dATP by T4 polynucle-otide kinase and purified with G-50 columns (GE Healthcare).For DNA-binding reactions, NKX2-1 ORF was cloned into thepcDNA3 vector. The cloned vector and a control empty pcDNA3vector were transcribed with T7 polymerase and translated in vitrowith use of the TNT Quick-Coupled Transcription/Translationsystem (Promega) as per the manufacturer’s instructions. Prior toDNA-binding reactions, 2 mL of the in vitro translated proteinswas incubated in binding buffer (150 mM KCl, 10 mM Tris-HClat pH 8.0, 0.5 mM EDTA, 0.2 mM DTT, 0.1% Triton X-100,12.5% glycerol) for 10 min at room temperature with 1 mg ofpoly(dI-dC) and, when indicated, 1 mg of anti-NKX2-1 antibody(BL4000; Bethyl Laboratories) for supershift assay or 200 ng ofnonradiolabeled self-DNAs for competition. The reaction wasincubated for an additional 20 min at room temperature afteradding the labeled DNA probes (1000 cpm) and electrophoresedon a 6% nondenaturing polyacrylamide gel.
Cell viability assay
Cells are selected for 72 h with puromycin or blasticidin S 24 hafter infection and seeded in 96-well assay plates in replicates.Each plate at the indicated time was incubated with CellTiter-Glo reagents (Promega), and luminescence intensity was mea-sured with use of a SpectraMax plate reader (Molecular Device).Luminescence values were normalized to the measurement atday 1.
RT-qPCR
RNA was extracted from cells using the RNeasy minikit(Qiagen) according to the manufacturer’s instructions. Reversetranscription was performed with use of the QuantiTECT cDNAsynthesis kit (Qiagen). All qPCRs were performed in duplicatewith Power PCR SYBR Green Master Mix (Applied Biosystems)on a 7300 Real-Time PCR system (Applied Biosystems). For
NKX2-1 targets LMO3 in lung cancer
GENES & DEVELOPMENT 11
Cold Spring Harbor Laboratory Press on June 27, 2018 - Published by genesdev.cshlp.orgDownloaded from

quantification of mRNA expression in each sample, values werenormalized to expression values for GAPDH. The primers usedare listed in Supplemental Table S4.
Western blots
Cell lysates were prepared by incubating cells in lysis buffer(150 mM NaCl, 50 mM Tris-HCl at pH 8.0, 1 mM EDTA, 1%Triton X-100, 0.25% NP-40, protease inhibitors) for 20 min at4°C. After centrifugation to remove insoluble debris, lysateswere immunoblotted with use of an anti-NKX2-1 antibody(Bethyl Laboratories, BL-4000), anti-LMO3 antibody (a gift fromDr. Nakagawara, Chiba Cancer Center, Chiba, Japan), anti-FOXA1 antibody (Abcam, ab23738), or an anti-vinculin antibody(Sigma).
Statistical analyses
Statistical analyses were performed with the use of Prismsoftware. Statistical significance was determined using a Stu-dent’s t-test comparison for unpaired data and was indicated asfollows: P < 0.05 (*) and P < 0.01 (**).
Acknowledgments
We thank C.Z. Zhang, Q. Ma, B. Weir, A. Kostic, T. Westerling,H. He, J.K. Lee, N. Hendrick, W. Song, A. Bass, S. Kobayashi, andD. Tenen for technical advice and discussions. H.W. was sup-ported by the NIH/NCI T32 Institutional Training Programfellowship (5T32CA009361-28). This work was supported byNational Cancer Institute grants 5R01CA109038 and 5P20CA90578(to M.M.). M.M. is a paid consultant for and equity holder inFoundation Medicine, a genomics-based oncology diagnosticscompany. M.M. and W.C.H. are paid consultants for NovartisPharmaceuticals. Both companies have no connection or rightsto the work described in this study.
References
Aoyama M, Ozaki T, Inuzuka H, Tomotsune D, Hirato J,Okamoto Y, Tokita H, Ohira M, Nakagawara A. 2005.LMO3 interacts with neuronal transcription factor, HEN2,and acts as an oncogene in neuroblastoma. Cancer Res 65:4587–4597.
Barletta JA, Perner S, Iafrate AJ, Yeap BY, Weir BA, Johnson LA,Johnson BE, Watanabe H, Rubin MA, Travis WD, et al. 2009.Clinical significance of TTF-1 protein expression and TTF-1gene amplification in lung adenocarcinoma. J Cell Mol Med
13: 1977–1986.Bass A, Watanabe H, Mermel C, Yu S, Perner S, Verhaak R, Kim
S, Wardwell L, Tamayo P, Gat-Viks I, et al. 2009. SOX2 is anamplified lineage-survival oncogene in lung and esophagealsquamous cell carcinomas. Nat Genet 41: 1238–1280.
Bejarano PA, Baughman RP, Biddinger PW, Miller MA, Fenoglio-Preiser C, al-Kafaji B, Di Lauro R, Whitsett JA. 1996.Surfactant proteins and thyroid transcription factor-1 inpulmonary and breast carcinomas. Mod Pathol 9: 445–452.
Benson M, Pirrotta V. 1988. The Drosophila zeste protein bindscooperatively to sites in many gene regulatory regions: Im-plications for transvection and gene regulation. EMBO J 7:3907–3915.
Berger MF, Badis G, Gehrke AR, Talukder S, Philippakis AA,Pena-Castillo L, Alleyne TM, Mnaimneh S, Botvinnik OB,Chan ET, et al. 2008. Variation in homeodomain DNAbinding revealed by high-resolution analysis of sequencepreferences. Cell 133: 1266–1276.
Bhattacharjee A, Richards WG, Staunton J, Li C, Monti S, VasaP, Ladd C, Beheshti J, Bueno R, Gillette M, et al. 2001.Classification of human lung carcinomas by mRNA expres-sion profiling reveals distinct adenocarcinoma subclasses.Proc Natl Acad Sci 98: 13790–13795.
Boehm T, Baer R, Lavenir I, Forster A, Waters JJ, Nacheva E,Rabbitts TH. 1988a. The mechanism of chromosomal trans-location t(11;14) involving the T-cell receptor Cd locus onhuman chromosome 14q11 and a transcribed region ofchromosome 11p15. EMBO J 7: 385–394.
Boehm T, Buluwela L, Williams D, White L, Rabbitts TH. 1988b.A cluster of chromosome 11p13 translocations found viadistinct D-D and D-D-J rearrangements of the human T cellreceptor d chain gene. EMBO J 7: 2011–2017.
Boggaram V. 2009. Thyroid transcription factor-1 (TTF-1/Nkx2.1/TITF1) gene regulation in the lung. Clin Sci (Lond) 116: 27–35.
Bohinski RJ, Di Lauro R, Whitsett JA. 1994. The lung-specificsurfactant protein B gene promoter is a target for thyroidtranscription factor 1 and hepatocyte nuclear factor 3, in-dicating common factors for organ-specific gene expressionalong the foregut axis. Mol Cell Biol 14: 5671–5681.
Chikina MD, Troyanskaya OG. 2012. An effective statisticalevaluation of ChIPseq dataset similarity. Bioinformatics 28:607–613.
Costa RH, Kalinichenko VV, Lim L. 2001. Transcription factorsin mouse lung development and function. Am J Physiol Lung
Cell Mol Physiol 280: L823–L838.Dalla-Favera R, Bregni M, Erikson J, Patterson D, Gallo RC,
Croce CM. 1982. Human c-myc onc gene is located on theregion of chromosome 8 that is translocated in Burkittlymphoma cells. Proc Natl Acad Sci 79: 7824–7827.
Delattre O, Zucman J, Plougastel B, Desmaze C, Melot T, PeterM, Kovar H, Joubert I, de Jong P, Rouleau G. 1992. Genefusion with an ETS DNA-binding domain caused by chro-mosome translocation in human tumours. Nature 359: 162–165.
Ding L, Getz G, Wheeler D, Mardis E, McLellan M, Cibulskis K,Sougnez C, Greulich H, Muzny D, Morgan M, et al. 2008.Somatic mutations affect key pathways in lung adenocarci-noma. Nature 455: 1069–1144.
Director’s Challenge Consortium for the Molecular Classifica-tion of Lung Adenocarcinoma, Shedden K, Taylor JMG,Enkemann SA, Tsao M-S, Yeatman TJ, Gerald WL, EschrichS, Jurisica I, Giordano TJ, et al. 2008. Gene expression-basedsurvival prediction in lung adenocarcinoma: A multi-site,blinded validation study. Nat Med 14: 822–827.
Fabbro D, Di Loreto C, Beltrami CA, Belfiore A, Di Lauro R,Damante G. 1994. Expression of thyroid-specific transcrip-tion factors TTF-1 and PAX-8 in human thyroid neoplasms.Cancer Res 54: 4744–4749.
Garraway LA, Sellers WR. 2006. Lineage dependency andlineage-survival oncogenes in human cancer. Nat Rev Can-cer 6: 593–602.
Garraway LA, Widlund HR, Rubin MA, Getz G, Berger AJ,Ramaswamy S, Beroukhim R, Milner DA, Granter SR, Du J,et al. 2005. Integrative genomic analyses identify MITF asa lineage survival oncogene amplified in malignant mela-noma. Nature 436: 117–122.
Govindan R, Ding L, Griffith M, Subramanian J, Dees ND,Kanchi KL, Maher CA, Fulton R, Fulton L, Wallis J, et al.2012. Genomic landscape of non-small cell lung cancer insmokers and never-smokers. Cell 150: 1121–1134.
Hofmann H-S, Bartling B, Simm A, Murray R, Aziz N, HansenG, Silber R-E, Burdach S. 2006. Identification and classifica-tion of differentially expressed genes in non-small cell lung
Watanabe et al.
12 GENES & DEVELOPMENT
Cold Spring Harbor Laboratory Press on June 27, 2018 - Published by genesdev.cshlp.orgDownloaded from

cancer by expression profiling on a global human 59.620-element oligonucleotide array. Oncol Rep 16: 587–595.
Holzinger A, Dingle S, Bejarano PA, Miller MA, Weaver TE,DiLauro R, Whitsett JA. 1996. Monoclonal antibody tothyroid transcription factor-1: Production, characterization,and usefulness in tumor diagnosis. Hybridoma 15: 49–53.
Homminga I, Pieters R, Langerak A, de Rooi J, Stubbs A,Verstegen M, Vuerhard M, Buijs-Gladdines J, Kooi C, KlousP, et al. 2011. Integrated transcript and genome analysesreveal NKX2-1 and MEF2C as potential oncogenes in T cellacute lymphoblastic leukemia. Cancer Cell 19: 484–581.
Hsu DS, Acharya CR, Balakumaran BS, Riedel RF, Kim MK,Stevenson M, Tuchman S, Mukherjee S, Barry W, DressmanHK, et al. 2009. Characterizing the developmental pathwaysTTF-1, NKX2-8, and PAX9 in lung cancer. Proc Natl Acad
Sci 106: 5312–5317.Hua S, Kittler R, White KP. 2009. Genomic antagonism between
retinoic acid and estrogen signaling in breast cancer. Cell
137: 1259–1271.Imielinski M, Berger AH, Hammerman PS, Hernandez B, Pugh
TJ, Hodis E, Cho J, Suh J, Capelletti M, Sivachenko A, et al.2012. Mapping the hallmarks of lung adenocarcinoma withmassively parallel sequencing. Cell 150: 1107–1120.
Kendall J, Liu Q, Bakleh A, Krasnitz A, Nguyen K, Lakshmi B,Gerald W, Powers S, Mu D. 2007. Oncogenic cooperation andcoamplification of developmental transcription factor genesin lung cancer. Proc Natl Acad Sci 104: 16663–16671.
Kim D-W, Kempf H, Chen RE, Lassar AB. 2003. Characteriza-tion of Nkx3.2 DNA binding specificity and its requirementfor somitic chondrogenesis. J Biol Chem 278: 27532–27539.
Kolla V, Gonzales LW, Gonzales J, Wang P, Angampalli S,Feinstein SI, Ballard PL. 2007. Thyroid transcription factorin differentiating type II cells: Regulation, isoforms, andtarget genes. Am J Respir Cell Mol Biol 36: 213–225.
Kwei KA, Kim YH, Girard L, Kao J, Pacyna-Gengelbach M,Salari K, Lee J, Choi Y-L, Sato M, Wang P, et al. 2008.Genomic profiling identifies TITF1 as a lineage-specificoncogene amplified in lung cancer. Oncogene 27: 3635–3640.
Langmead B, Trapnell C, Pop M, Salzberg SL. 2009. Ultrafast andmemory-efficient alignment of short DNA sequences to thehuman genome. Genome Biol 10: R25.
Levine AJ, Oren M. 2009. The first 30 years of p53: Growing evermore complex. Nat Rev Cancer 9: 749–758.
Lieber M, Smith B, Szakal A, Nelson-Rees W, Todaro G. 1976. Acontinuous tumor-cell line from a human lung carcinomawith properties of type II alveolar epithelial cells. Int JCancer 17: 62–70.
Lundberg AS, Randell SH, Stewart SA, Elenbaas B, Hartwell KA,Brooks MW, Fleming MD, Olsen JC, Miller SW, WeinbergRA, et al. 2002. Immortalization and transformation ofprimary human airway epithelial cells by gene transfer.Oncogene 21: 4577–4586.
Luo B, Cheung HW, Subramanian A, Sharifnia T, Okamoto M,Yang X, Hinkle G, Boehm JS, Beroukhim R, Weir BA, et al.2008. Highly parallel identification of essential genes incancer cells. Proc Natl Acad Sci 105: 20380–20385.
Machanick P, Bailey TL. 2011. MEME-ChIP: Motif analysis oflarge DNA datasets. Bioinformatics 27: 1696–1697.
Maeda Y, Dave V, Whitsett JA. 2007. Transcriptional control oflung morphogenesis. Physiol Rev 87: 219–244.
Maeda Y, Tsuchiya T, Hao H, Tompkins DH, Xu Y, MucenskiML, Du L, Keiser AR, Fukazawa T, Naomoto Y, et al. 2012.KrasG12D and Nkx2-1 haploinsufficiency induce mucinousadenocarcinoma of the lung. J Clin Invest 122: 4388–4400.
McCormack MP, Young LF, Vasudevan S, de Graaf CA, CodringtonR, Rabbitts TH, Jane SM, Curtis DJ. 2010. The Lmo2 oncogene
initiates leukemia in mice by inducing thymocyte self-renewal.Science 327: 879–883.
McGuire EA, Hockett RD, Pollock KM, Bartholdi MF, O’BrienSJ, Korsmeyer SJ. 1989. The t(11;14)(p15;q11) in a T-cell acutelymphoblastic leukemia cell line activates multiple tran-scripts, including Ttg-1, a gene encoding a potential zincfinger protein. Mol Cell Biol 9: 2124–2132.
Minoo P, Hu L, Xing Y, Zhu NL, Chen H, Li M, Borok Z, Li C.2007. Physical and functional interactions between homeo-domain NKX2.1 and winged helix/forkhead FOXA1 in lungepithelial cells. Mol Cell Biol 27: 2155–2165.
Miyoshi H, Shimizu K, Kozu T, Maseki N, Kaneko Y, Ohki M.1991. t(8;21) breakpoints on chromosome 21 in acute mye-loid leukemia are clustered within a limited region of a singlegene, AML1. Proc Natl Acad Sci 88: 10431–10434.
Mullighan CG, Goorha S, Radtke I, Miller CB, Coustan-Smith E,Dalton JD, Girtman K, Mathew S, Ma J, Pounds SB, et al.2007. Genome-wide analysis of genetic alterations in acutelymphoblastic leukaemia. Nature 446: 758–764.
Peeters P, Raynaud SD, Cools J, Wlodarska I, Grosgeorge J, PhilipP, Monpoux F, Van Rompaey L, Baens M, Van den Berghe H,et al. 1997. Fusion of TEL, the ETS-variant gene 6 (ETV6), tothe receptor-associated kinase JAK2 as a result of t(9;12) ina lymphoid and t(9;15;12) in a myeloid leukemia. Blood 90:2535–2540.
Ross-Innes CS, Stark R, Holmes KA, Schmidt D, Spyrou C, RussellR, Massie CE, Vowler SL, Eldridge M, Carroll JS. 2010. Coop-erative interaction between retinoic acid receptor-a and estro-gen receptor in breast cancer. Genes Dev 24: 171–182.
Shin H, Liu T, Manrai AK, Liu XS. 2009. CEAS: Cis-regulatoryelement annotation system. Bioinformatics 25: 2605–2606.
Shu W, Lu MM, Zhang Y, Tucker PW, Zhou D, Morrisey EE.2007. Foxp2 and Foxp1 cooperatively regulate lung andesophagus development. Development 134: 1991–2000.
Simonis M, Klous P, Homminga I, Galjaard R-J, Rijkers E-J,Grosveld F, Meijerink JPP, de Laat W. 2009. High-resolutionidentification of balanced and complex chromosomal rear-rangements by 4C technology. Nat Methods 6: 837–842.
Sos ML, Michel K, Zander T, Weiss J, Frommolt P, Peifer M, LiD, Ullrich R, Koker M, Fischer F, et al. 2009. Predicting drugsusceptibility of non-small cell lung cancers based on geneticlesions. J Clin Invest 119: 1727–1740.
Stransky N, Egloff AM, Tward AD, Kostic AD, Cibulskis K,Sivachenko A, Kryukov GV, Lawrence MS, Sougnez C,McKenna A, et al. 2011. The mutational landscape of headand neck squamous cell carcinoma. Science 333: 1157–1160.
Subramanian A, Tamayo P, Mootha VK, Mukherjee S, Ebert BL,Gillette MA, Paulovich A, Pomeroy SL, Golub TR, LanderES, et al. 2005. Gene set enrichment analysis: A knowledge-based approach for interpreting genome-wide expressionprofiles. Proc Natl Acad Sci 102: 15545–15550.
Tagne J-B, Gupta S, Gower AC, Shen SS, Varma S, LakshminarayananM, Cao Y, Spira A, Volkert TL, Ramirez MI. 2012. Genome-wide analyses of Nkx2-1 binding to transcriptional targetgenes uncover novel regulatory patterns conserved in lungdevelopment and tumors. PLoS ONE 7: e29907.
Tanaka H, Yanagisawa K, Shinjo K, Taguchi A, Maeno K,Tomida S, Shimada Y, Osada H, Kosaka T, Matsubara H,et al. 2007. Lineage-specific dependency of lung adenocarci-nomas on the lung development regulator TTF-1. Cancer
Res 67: 6007–6011.Taub R, Kirsch I, Morton C, Lenoir G, Swan D, Tronick S,
Aaronson S, Leder P. 1982. Translocation of the c-myc geneinto the immunoglobulin heavy chain locus in humanBurkitt lymphoma and murine plasmacytoma cells. ProcNatl Acad Sci 79: 7837–7841.
NKX2-1 targets LMO3 in lung cancer
GENES & DEVELOPMENT 13
Cold Spring Harbor Laboratory Press on June 27, 2018 - Published by genesdev.cshlp.orgDownloaded from

Tomlins SA, Rhodes DR, Perner S, Dhanasekaran SM, Mehra R,Sun X-W, Varambally S, Cao X, Tchinda J, Kuefer R, et al.2005. Recurrent fusion of TMPRSS2 and ETS transcriptionfactor genes in prostate cancer. Science 310: 644–648.
Tusher VG, Tibshirani R, Chu G. 2001. Significance analysis ofmicroarrays applied to the ionizing radiation response. Proc
Natl Acad Sci 98: 5116–5121.Visakorpi T, Hyytinen E, Koivisto P, Tanner M, Keinanen R,
Palmberg C, Palotie A, Tammela T, Isola J, Kallioniemi OP.1995. In vivo amplification of the androgen receptor gene andprogression of human prostate cancer. Nat Genet 9: 401–406.
Wan H, Dingle S, Xu Y, Besnard V, Kaestner KH, Ang S-L, WertS, Stahlman MT, Whitsett JA. 2005. Compensatory roles ofFoxa1 and Foxa2 during lung morphogenesis. J Biol Chem
280: 13809–13816.Wang L-H, Chmelik R, Nirenberg M. 2002. Sequence-specific
DNA binding by the vnd/NK-2 homeodomain of Drosophila.Proc Natl Acad Sci 99: 12721–12726.
Wang L-H, Chmelik R, Tang D, Nirenberg M. 2005. Identifica-tion and analysis of vnd/NK-2 homeodomain binding sites ingenomic DNA. Proc Natl Acad Sci 102: 7097–7102.
Weir BA, Woo MS, Getz G, Perner S, Ding L, Beroukhim R,Lin WM, Province MA, Kraja A, Johnson LA, et al. 2007.Characterizing the cancer genome in lung adenocarcinoma.Nature 450: 893–898.
Whitington T, Frith MC, Johnson J, Bailey TL. 2011. Inferringtranscription factor complexes from ChIP-seq data. Nucleic
Acids Res 39: e98.Winslow MM, Dayton TL, Verhaak RGW, Kim-Kiselak C,
Snyder EL, Feldser DM, Hubbard DD, DuPage MJ, WhittakerCA, Hoersch S, et al. 2011. Suppression of lung adenocarci-noma progression by Nkx2-1. Nature 473: 101–104.
Yamaguchi T, Yanagisawa K, Sugiyama R, Hosono Y, ShimadaY, Arima C, Kato S, Tomida S, Suzuki M, Osada H, et al.2012. NKX2-1/TITF1/TTF-1-induced ROR1 is required tosustain EGFR survival signaling in lung adenocarcinoma.Cancer Cell 21: 348–361.
Yatabe Y, Mitsudomi T, Takahashi T. 2002. TTF-1 expression inpulmonary adenocarcinomas. Am J Surg Pathol 26: 767–773.
Yin Z, Gonzales L, Kolla V, Rath N, Zhang Y, Lu MM, Kimura S,Ballard PL, Beers MF, Epstein JA, et al. 2006. Hop functionsdownstream of Nkx2.1 and GATA6 to mediate HDAC-dependent negative regulation of pulmonary gene expres-sion. Am J Physiol Lung Cell Mol Physiol 291: L191–L199.
Yokoyama A, Somervaille TCP, Smith KS, Rozenblatt-Rosen O,Watanabe H, Cleary ML. 2005. The menin tumor suppressorprotein is an essential oncogenic cofactor for MLL-associatedleukemogenesis. Cell 123: 207–218.
Yuan B, Li C, Kimura S, Engelhardt RT, Smith BR, Minoo P.2000. Inhibition of distal lung morphogenesis in Nkx2.1�/�
embryos. Dev Dyn 217: 180–190.Zhang P, Zuo H, Nakamura Y, Nakamura M, Wakasa T, Kakudo
K. 2006. Immunohistochemical analysis of thyroid-specifictranscription factors in thyroid tumors. Pathol Int 56: 240–245.
Zhang Y, Liu T, Meyer C, Eeckhoute J. 2008. Model-basedanalysis of ChIP-seq (MACS). Genome Biol 9: R137.
Watanabe et al.
14 GENES & DEVELOPMENT
Cold Spring Harbor Laboratory Press on June 27, 2018 - Published by genesdev.cshlp.orgDownloaded from

10.1101/gad.203208.112Access the most recent version at doi: published online January 15, 2013Genes Dev.
Hideo Watanabe, Joshua M. Francis, Michele S. Woo, et al. target
as a functional transcriptionalLMO3lung adenocarcinoma identifies inNKX2-1Integrated cistromic and expression analysis of amplified
Material
Supplemental
http://genesdev.cshlp.org/content/suppl/2013/01/09/gad.203208.112.DC1
Published online January 15, 2013 in advance of the full issue.
License Freely available online through the Genes & Development Open Access option.
ServiceEmail Alerting
click here.right corner of the article or
Receive free email alerts when new articles cite this article - sign up in the box at the top
Published by Copyright © 2013 by Cold Spring Harbor Laboratory Press
Cold Spring Harbor Laboratory Press on June 27, 2018 - Published by genesdev.cshlp.orgDownloaded from