Embed Size (px)
Citation preview
INTEGRATED ANNUAL REPORTFOR LUX ISLAND RESORTS LTD
AND ITS SUBSIDIARIES
2017
INTEGRATED ANNUAL REPORT
FOR LUX ISLAND RESORTS LTD AND ITS SUBSIDIARIES
2017
MAURITUS REUNION MALD IVES CH INA U .A . E V I ETNAM TURKEY
LUXRESORTS.COM
DEAR STAKEHOLDERS,The Board of Directors is pleased to present the Integrated Annual Report of Lux Island Resorts Ltd and its subsidiaries for the year ended 30th June 2017. This report was approved by the Board of Directors on 26th September 2017.
Arnaud LagesseChairman
4
LUX ISLAND RESORTS LTD AND ITS SUBSIDIARIES
5
ANNUAL REPORT 2017
CONTENTS
GROUP STRUCTURE
8-9DIRECTORS’ PROFILES
10-14ALTERNATE DIRECTORS’ PROFILES
15BOARD AND COMMITTEES
16MANAGEMENT AND ADMINISTRATION
17LUX HOSPITALITY LTD - DIRECTORS’ PROFILES
18-21DIRECTORSHIP
22-23BUSINESS MODEL OF LUX* RESORTS & HOTELS
24-25FINANCIAL HIGHLIGHTS AND RATIOS
26FINANCIAL STATUS AT A GLANCE
27VALUE ADDED STATEMENTS
28-29HIGHLIGHTS
30-33MATERIAL MATTERS AND CONNECTIVITY TO ACHIEVE STRATEGIC PLANS & OBJECTIVES
34-35CHAIRMAN’SREPORT
36-41
CHIEF EXECUTIVE'S REPORT
42-47AWARDS
48-49NEW REASONS TO GO LUX*
54-55LUX* NEW CAMPAIGN
56-57SPREADING THE LIGHT NEW OPENINGS
60-89CORPORATE GOVERNANCE REPORT
90-118OTHER STATUTORY DISCLOSURES
119-121SUSTAINABILITY INITIATIVES
123-135FINANCIAL STATEMENTS 2017
136STATEMENT OF COMPLIANCE
138SECRETARY’S CERTIFICATE
139INDEPENDENT AUDITORS’ REPORT
140-143
STATEMENT OF FINANCIAL POSITION
144STATEMENT OF PROFIT OR LOSS
145STATEMENT OF OTHER COMPREHENSIVE INCOME
146STATEMENT OF CHANGES IN EQUITY
147-148STATEMENT OF CASH FLOWS
149NOTES TO THE FINANCIAL STATEMENTS
150-204NOTICE TO SHAREHOLDERS
205PROXY FORM
207ANNEX 1: GRI STANDARDS CONTENT INDEX
209-212ANNEX 2 INDEPENDENT ASSURANCE PROVIDER’S LIMITED ASSURANCE REPORT ON SELECTED KEY PERFORMANCE INDICATORS
213-216

6
LUX ISLAND RESORTS LTD AND ITS SUBSIDIARIES
Smile all the stay. LUX* Resorts & Hotels - Campaign 2017
At LUX*, we enjoy making guests happy, helping them celebrate life
7
ANNUAL REPORT 2017
LUX ISLAND RESORTS LTD
HOLDING
LUX* RESORTS & HOTELS HELPS PEOPLE
CELEBRATE L IFE BY DEL IVERING CONSISTENTLY
ON THE PROMISE OF A DIFFERENT KIND OF LUXURY;
HOSPITAL ITY THAT IS L IGHTER. BRIGHTER.
GROUP STRUCTURE
AS AT 30TH JUNE 2017
8
LUX ISLAND RESORTS LTD AND ITS SUBSIDIARIES
Merville BeachHotel LtdInvestment Company
Merville LtdProperty Owner - Merville Beach Hotel
Lux Island Resorts FoundationCSR
LUX Hospitality LtdManagement & Secretarial Company
Holiday & Leisure Resorts LimitedOperator Merville Beach Hotel & LUX* Grand Gaube
Café LUX Ltd (formerly known as Poséidon Limitée)
Investment Company & Operator Café Lux*
Lux Island Resorts (UK) LimitedLondon Office
Naïade Holidays (Pty) LtdDormant
Blue Bay Tokey Island LimitedProperty owner of Ile des Deux Cocos
Beau RivageCo LtdOperator LUX* Belle Mare
Les Pavillons Resorts LtdOperator LUX* Le Morne
SAS Hôtel Prestige RéunionInvestment Company
Lux Island ResortsMaldives LtdInvestment Company
LUX Resorts LtdDormant
LTK LtdInvestment Company
FMM LtéeInvestment Company
Océanide LimitedInvestment Company
Néréide LimitedOperator Tamassa
SNC Saint PaulProperty owner LUX* Saint Gilles
MSF Leisure Company LtdNautical Centre Le Morne
SA Les Villas du LagonOperator - LUX* Saint Gilles
SA Société Villages-Hôtel de l'Océan IndienDormant
White Sands Resort& Spa Pvt LtdOperator - LUX* South Ari Atoll
100%
100%
100%
100%
100%
100%
100%
100%
100%
100%
Lux Island Resorts (Seychelles) LtdManagement Company
100%
LIRTA LtdTraining Academy
100%
Ari Atoll Investments LtdDormant
100%
Island Light Vacations LtdOnline Tour Operator
100%
Lux Hotel Management (Shanghai) Co LtdManagement Company
100%
100%
100%
100%
100%
100%
100%
100%
66.43%
33.26%
47%
53%
100%
100%
91.7%
GRI 102-4,102-5,102-45
9
ANNUAL REPORT 2017
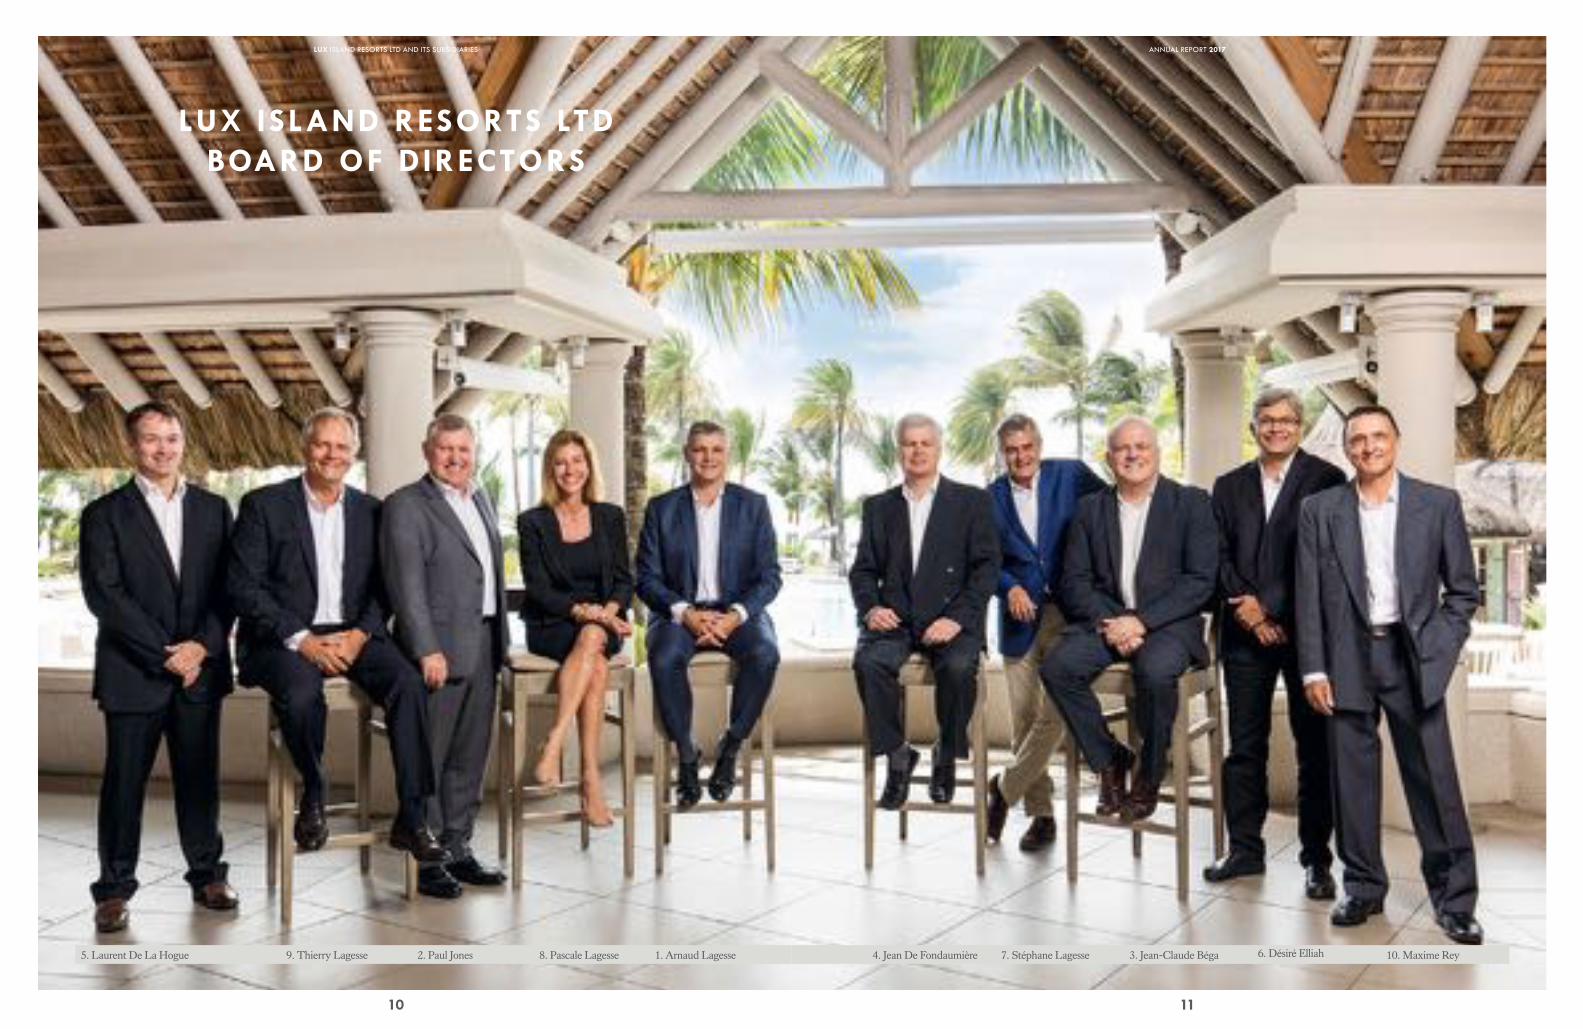
LUX ISLAND RESORTS LTD BOARD OF DIRECTORS
5. Laurent De La Hogue 9. Thierry Lagesse 2. Paul Jones 8. Pascale Lagesse 1. Arnaud Lagesse 4. Jean De Fondaumière 7. Stéphane Lagesse 3. Jean-Claude Béga 6. Désiré Elliah 10. Maxime Rey
10
LUX ISLAND RESORTS LTD AND ITS SUBSIDIARIES
5. Laurent De La Hogue 9. Thierry Lagesse 2. Paul Jones 8. Pascale Lagesse 1. Arnaud Lagesse 4. Jean De Fondaumière 7. Stéphane Lagesse 3. Jean-Claude Béga 6. Désiré Elliah 10. Maxime Rey
11
ANNUAL REPORT 2017
1. ARNAUD LAGESSE
Arnaud Lagesse was appointed as Non-Executive Chairman of the Company on 29th October 2003.
Arnaud Lagesse started his career at IBL Ltd (formerly known as GML) in 1993 as Finance and Administrative Director, before being appointed Chief Executive Officer in August 2005. Ten years later, following the amalgamation of GML Investissement Ltée and Ireland Blyth Limited on 01st July 2016, he was then appointed as Group CEO of the newly formed entity, IBL Ltd.
He holds a Master’s in Management from the Université d’Aix-Marseille and graduated from the Institut Supérieur de Gestion de Paris. He attended a Professional Development Program at INSEAD, Fontainebleau (France), an Advanced Management Program (AMP180) from Harvard Business School, United States, and a Breakthrough Executive Program with Egon Zender/Mobius in Portugal.
Arnaud Lagesse is a member of the Board of Directors of several of the country’s major companies listed on the Stock Exchange of Mauritius and is the Chairman of Phoenix Beverages Ltd, BlueLife Limited, Lux Island Resorts Ltd and City Brokers Ltd inter alia. He was President of the National Committee on Corporate Governance in Mauritius, of the Chamber of Agriculture, of the Mauritius Sugar Producers’ Association and of the Sugar Industry Pension Fund. Mr Lagesse is the Chairman of Fondation Joseph Lagesse since July 2012.
Mr Arnaud Lagesse is a member of the Remuneration Committee and the Chairman of the Corporate Governance Committee of the Company.
Directorships in other listed companies :Alteo Limited, BlueLife Limited, IBL Ltd, Phoenix
Beverages Limited, The United Basalt Products Ltd,
Phoenix Investment Company Ltd
DIRECTORS’ PROFILES
2. PAUL JONES
With more than 4 decades of international hotel management experience, Paul Jones joined LUX* in 2010, where he quickly established his mark as charismatic leader with a unique and passionate approach to hospitality management, centered around People, Culture and Service.
Paul Jones’ rich career covers various key leadership positions, having served for almost 20 years as Managing Director of the Sun Resorts Group, and later, as President of One&Only, where he was instrumental in successfully launching and growing the brand on a global basis.
Recognized as a leading figure in the establishment and development of the hotel and tourism industry in Mauritius, Paul Jones was conferred the Dignity of Companion of the Order of Saint Michael and Saint George by her Majesty Queen Elizabeth II. He was also awarded one of the highest honours by the President of the Comores, the Chevalier de L’Etoile d’Anjouan, for his significant contribution to the growth and development of the hotel and tourism sector in the Comores.
Paul Jones directly overseas the Company’s overall strategic direction, spearheading the Group’s global development plans. He is personally involved in every aspect of the business ensuring that the concept development of each new property not only respects the ethos of the LUX* Brand but also is innovative drawing a distinctive differentiated approach to hospitality.
He holds an MBA with distinction from the University of Surrey & followed the Program for Management Development at The Harvard Business School. He is a Fellow of the Institute of Hospitality in the UK.
He was appointed as Chief Executive Officer of the Company on 1st October 2010 and as Director of the Board on 29th September 2011.
Directorships in other listed companies : None
3. JEAN-CLAUDE BÉGA
Born in 1963, Jean-Claude Béga is a Fellow of the Association of Chartered Certified Accountants.
Jean-Claude Béga joined IBL Ltd – formerly known as GML - in 1997 and has been nominated as Group Head of Financial Services and Business Development of IBL Ltd on 1st July 2016. He is the Non-Executive Chairman of Mauritian Eagle Insurance Co. Ltd, DTOS Ltd, The Bee Equity Partners Ltd, Anahita Estates Limited and Anglo African Investments Ltd and serves as Director of a number of companies including Alteo Limited, Phoenix Beverages Limited, AfrAsia Bank Limited and Anahita Residences & Villas Limited.
He was appointed as Director and member of the Audit Committee of the Company in June 2004.
Directorship in other listed companies : Alteo Limited, Mauritian Eagle Insurance Co Ltd,
Phoenix Beverage Limited, Phoenix Investment
Company Limited, The Bee Equity Partners Ltd
12
LUX ISLAND RESORTS LTD AND ITS SUBSIDIARIES
4. JEAN DE FONDAUMIÈRE
Born in 1953, Jean de Fondaumière is a Chartered Accountant of Scotland. He worked in Australia for eleven years and subsequently in Mauritius for fifteen year until he retired as the CEO of the Swan Group at the end of 2006.He is a past Chairman of The Stock Exchange of Mauritius and his former directorships include companies operating in the African, Indian Ocean and Asia Pacific regions. Jean holds a portfolio of directorships in Mauritius for companies operating in commerce, finance, power generation, sugar and tourism.
He was first appointed director of the company in November 2003, resigned in December 2006 and appointed director in March 2008 at which time he became a member of the Remuneration Committee of the Company. He was also appointed as member of the Audit Committee in September 2012 and as Chairman of the said Committee in November 2015.
Directorship in other listed companies : Alteo Limited, Constance La Gaieté Company Ltd,
Hotelest Limited, Constance Hotel Services Limited,
United Investments Limited
5. LAURENT DE LA HOGUE
Born in 1975, Laurent de la Hogue holds a Master degree in Management and Finance from the “Ecole Supérieure de Gestion et Finance” in Paris, France. He joined IBL Ltd – formerly known as GML – in 2001 as Treasurer for the setting up of the group central treasury management unit and then occupied the position of Finance Executive - Corporate & Treasury in 2011 where he was involved in the development of projects. He was appointed Head of Financial Services of IBL Ltd on 1st of July 2016. Laurent de la Hogue is currently the Chairman of IBL Treasury Ltd, AfrAsia Capital Management Ltd, LCF Securities Ltd and The Concreate Agency Ltd. He also serves as Director of a number of organisations operating in the industrial, commercial, financial and investment sectors.
He was appointed as Alternate Director in August 2009 and as Director on 15th February 2011.
Directorship in other listed companies: The United Basalt Products Ltd and Mauritian Eagle
Insurance Ltd
6. DÉSIRÉ ELLIAH
1984 to 2002: Désiré worked at De Chazal Du Mee, where in 1997, he became a partner of the Audit and Business Advisory Department. He was in charge of a portfolio of prestigious clients operating in most sectors of the Mauritian economy and acted as financial adviser on a number of World Bank financed projects in mainland Africa. Désiré was the Deputy Head of the Corporate Finance division of the department and has extensive experience in feasibility studies, financial restructuration, share/business valuation, due diligence reviews.
He joined LUX* in 2003 as Chief Financial Officer. During his career with LUX*, Désiré has gained significant executive experience in numerous aspects of the tourist industry. He has also been closely involved with the Group’s corporate development including equity and debt financings, and a wide range of other corporate transactions, including acquisitions, developments and disposals.
He has served for seven years as non-executive Director of Golden Agri Resources Ltd, a company engaged in palm oil production and listed on the Stock Exchange of Singapore. He also sits on the Board of the Association des Hotels et Restaurateurs de l’Ile Maurice and is a member of its finance commission.
He was appointed as Director of the Company in October 2004.
Directorship in other listed companies: None
13
ANNUAL REPORT 2017
DIRECTORS’ PROFILES
7. STÉPHANE LAGESSE
Born in 1959, Stéphane Lagesse holds a degree in Gestion des Entreprises Parix IX Dauphine and joined the Palmar Group in 1983 where he currently holds the position Chief Executive Officer and Director. He participated in the setting up two garment manufacturing companies in Mauritius. He was appointed as Director of the Company in March 1999 and as a member of the Audit Committee in October 2003.
Directorship in other listed companies : The United Basalt Products Ltd, IBL Ltd
(Alternate Director)
8. PASCALE LAGESSE
Pascale Lagesse is an experienced lawyer who handles domestic and international matters for large corporations. She has been a Partner with the Paris law firm Bredin Prat since 2008 where she advises international corporate clients on a wide range of legal issues with a particular focus on the employment aspects of mergers and acquisitions and corporate restructurings.
Pascale graduated from the University of Paris II Panthéon-Assas with a “Maîtrise en Carrières Judiciaires.” She also holds a “DEA en Droit Privé” from the University Paris I Panthéon-Sorbonne.
A member of the Paris Bar since 1989, she has had an illustrious legal career having worked at some of the city’s most prestigious law firms, including the Paris office of a Magic Circle firm.
A frequent speaker and author of legal publications, she is recognized as one of the leading labor and employment lawyers on the French market. In 2013, she was the recipient of the “Outstanding Contribution to the Legal Profession Award” by Chambers Europe.
She is involved in a variety of international legal organizations and associations. She holds numerous officer-level positions with the International Bar Association and is presently Co-Chair of the Global Employment Institute, a Council Member of the Legal Practice Division and a Member of the Section on Public and Professional Interest Advisory Board. She was the Chair of the Employment and Industrial Relations Law Committee from 2010-2011.
She plays an active role in the development of the legal profession in France, and is presently the “Responsable Pédagogique du Parcours de Droit Social” at the Paris Bar School and a Member of the “Conseil Académique et Commission de Recherche du Conseil Académique” of the University of Paris II Panthéon Assas. She was elected to the National Bar Council of France in 2005.
She was appointed as Director of the Company in April 2017.
Directorships in other listed companies: None
9. THIERRY LAGESSE
Non-Executive Director - first appointed to the Board on 1st July 2016, Thierry Lagesse was born in 1953. He holds a ‘Maîtrise des Sciences de Gestion’ from the University of Paris Dauphine. He was the Non-Executive Chairman of IBL Ltd (previously known as GML Investissement Ltée), Alteo Limited, Phoenix Beverages Limited and The United Basalt Products Ltd up to 13th August 2013 and a Director of several other companies quoted on the Stock Exchange of Mauritius Ltd. He is also the Executive Chairman and founder of Palmar Group of Companies and Executive Chairman of Parabole Réunion SA.
Directorship in other listed companies : Alteo Limited, IBL Ltd, Phoenix Beverage Limited,
The United Basalt Products Ltd
10. MAXIME REY
Born in 1952, Maxime Rey qualified as an accountant and started his career in 1973 as an Auditor before joining the Sugar Industry. He moved to South Africa in 1981 where he worked for Kuehne and Nagel (Pty) Ltd, the South African arm of a leading global provider of innovative and fully integrated supply chain solutions. He was appointed Group Financial Controller in 1989 and Director in 1992. Back in Mauritius in 1993 he joined Swan Group, one of the market leaders in the local Insurance sector, becoming Senior Manager - Group Finance, Loans & Legal until he retired in 2016. Maxime is a Director of a number of Companies listed on the Stock Exchange of Mauritius and operating in the commercial, investment, sugar and tourism sectors.
He was appointed as Director of the Company in September 2012, and is a member of the Audit Committee.
Directorship in other listed companies: Belle Mare Holding Ltd, Constance La Gaieté Company
Ltd, IBL Ltd, MFD Group Ltd, Tropical Paradise
Company Ltd
14
LUX ISLAND RESORTS LTD AND ITS SUBSIDIARIES
1. AMAURY LAGESSE
Born in 1961, Amaury Lagesse has studied Management in South Africa and started working in a clothing company in Durban for one year. He then specialized in textile management in England and Scotland before joining in 1987 the Palmar Group, where he currently holds the position of Production Manager.
He was appointed as Alternate Director to Stéphane Lagesse in December 2003.
Directorship in other listed companies : None
2. DEODASS POOLOVADOO
Born in 1962, Deodass Poolovadoo was one of the first person to join the company in 1990. He graduated in Accounting and Finance from the UK and is the Group Financial Controller responsible for the financial management of the Company and of its subsidiaries.
He was appointed as Alternate Director to Désiré Elliah in August 2009.
Directorship in other listed companies : None
ALTERNATE DIRECTORS’ PROFILES
15
ANNUAL REPORT 2017
BOARD AND COMMITTEES
BOARD OF DIRECTORS
DIRECTORSArnaud Lagesse (Chairman)Paul Jones (Chief Executive Officer)Jean-Claude Béga Laurent de la Hogue Jean de FondaumièreDésiré ElliahPascale Lagesse (appointed on 20.04.17)Stéphane LagesseThierry LagesseMaxime Rey
AUDIT & RISK COMMITTEEJean de Fondaumière (Chairman)Jean-Claude BégaStéphane LagesseMaxime Rey
ALTERNATE DIRECTOR
Dev Poolovadoo
Amaury Lagesse
CORPORATE GOVERNANCE & NOMINATION COMMITTEEArnaud Lagesse (Chairman)Alexis Harel Christof Zuber
REMUNERATION COMMITTEEChristof Zuber (Chairman)Jean de FondaumièreArnaud Lagesse Alexis Harel
COMPANY SECRETARYDésiré ElliahPer LUX Hospitality Ltd
16
LUX ISLAND RESORTS LTD AND ITS SUBSIDIARIES
MANAGEMENT AND ADMINISTRATION
EXECUTIVE COMMITTEEPaul Jones – Chief Executive OfficerDésiré Elliah – Chief Financial OfficerJulian Hagger – Chief Sales and Marketing OfficerMarie-Laure Ah-You – Chief Strategy OfficerNicolas Autrey – Chief Human Resources OfficerDominik Ruhl – Chief Operating OfficerGuillaume Valet – Group Head of Legal, Secretarial and Corporate Affairs
CHIEF INTERNAL AUDITORPritila Joynathsing-Gayan
SENIOR MANAGERSJonas Amstad – General Manager – LUX* South Ari AtollStéphane Baras – Directeur Général – LUX* Saint Gilles & Hôtel Le RécifJérémie de Fombelle – General Manager – LUX* Le MorneJoséphine de Ravel – Retail Manager – LUX* BoutiquesTony Duval – General Manager – Merville BeachCaroline Gaud-Perrier – Group Marketing ManagerMarkus Iseli – General Manager – LUX* North Male AtollTobi Kuhlang – Head of Global Revenue ManagementWalter Lanfranchi – Corporate ChefBrice Lunot – General Manager – LUX* Grand GaubeGemma Marsh – Brand Guardianship ManagerAxelle Mazery – Group Press & Public Relations ManagerAshish Modak – General Manager – LUX* Belle MareSmita Modak – Group Training ManagerHakan Oral – General Manager – LUX* BodrumVishnee Payen – Group Sustainability & CSR ManagerNitesh Pandey – General Manager – Tamassa, Café LUX* and Ile des Deux CocosSydney Pierre – Head of Worldwide SalesDev Poolovadoo – Group Financial ControllerDarnen Ramassami – Group IT ManagerHurrydeo Ramlagun – Financial Reporting ManagerRuben Thumiah – Regional Financial ControllerJoe Wu – Managing Director – Greater China
LEGAL ADVISORSClarel BenoitAndré RobertHervé Duval
COMMUNICATION ADVISORBlast Communications Ltd
AUDITORSErnst & YoungChartered Accountants
REGISTERED OFFICEPierre Simonet StreetFloréalMauritius
NOTARYJean Pierre Montocchio
REGISTRY AND TRANSFER OFFICELUX Hospitality LtdPierre Simonet StreetFloréalMauritius
BANKERSThe Mauritius Commercial Bank LtdState Bank of Mauritius LtdBank One LimitedBarclays Bank PlcStandard Bank (Mauritius) LtdState Bank of India (Mauritius) LtdAfrAsia Bank LtdHSBC Limited (Mauritius, UK, Germany,Maldives)Bank of CeylanStandard Bank of South Africa LimitedBanque Française Commerciale Océan IndienBanque de la RéunionMCB Seychelles
GRI 102-3, 102-13
17
ANNUAL REPORT 2017
LUX HOSPITALITY LTD BOARD OF DIRECTORS
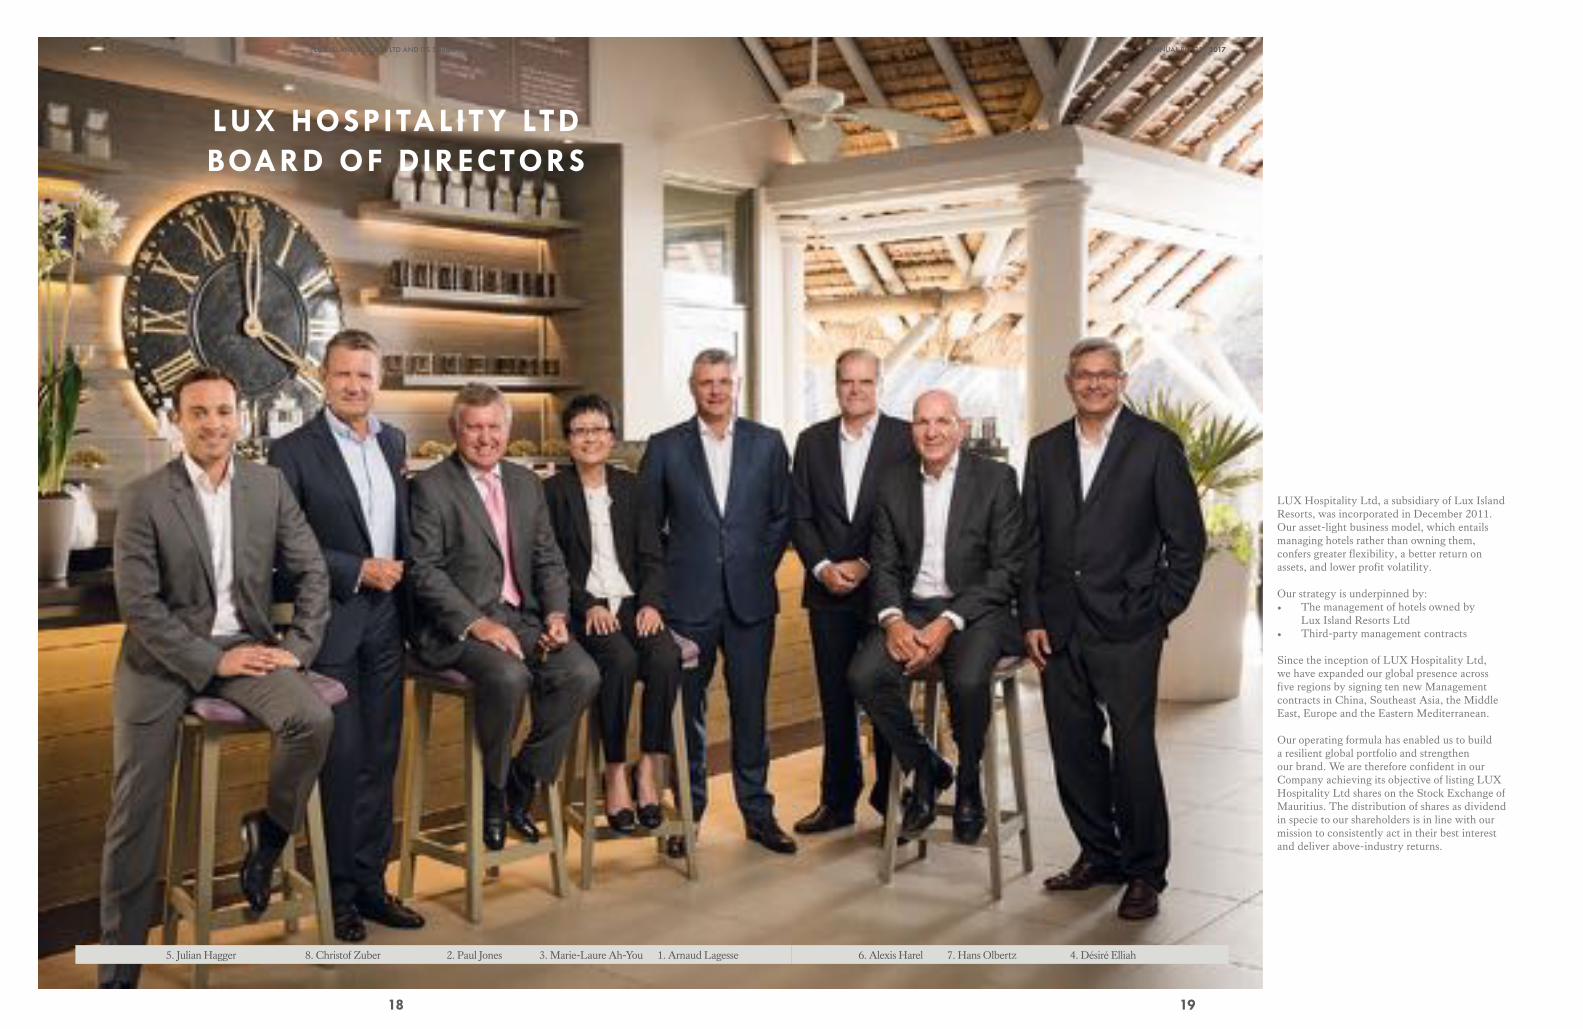
5. Julian Hagger 8. Christof Zuber 2. Paul Jones 3. Marie-Laure Ah-You 1. Arnaud Lagesse 6. Alexis Harel 7. Hans Olbertz 4. Désiré Elliah
18
LUX ISLAND RESORTS LTD AND ITS SUBSIDIARIES
LUX Hospitality Ltd, a subsidiary of Lux Island Resorts, was incorporated in December 2011. Our asset-light business model, which entails managing hotels rather than owning them, confers greater flexibility, a better return on assets, and lower profit volatility.
Our strategy is underpinned by: • The management of hotels owned by
Lux Island Resorts Ltd • Third-party management contracts
Since the inception of LUX Hospitality Ltd, we have expanded our global presence across five regions by signing ten new Management contracts in China, Southeast Asia, the Middle East, Europe and the Eastern Mediterranean.
Our operating formula has enabled us to build a resilient global portfolio and strengthen our brand. We are therefore confident in our Company achieving its objective of listing LUX Hospitality Ltd shares on the Stock Exchange of Mauritius. The distribution of shares as dividend in specie to our shareholders is in line with our mission to consistently act in their best interest and deliver above-industry returns.
5. Julian Hagger 8. Christof Zuber 2. Paul Jones 3. Marie-Laure Ah-You 1. Arnaud Lagesse 6. Alexis Harel 7. Hans Olbertz 4. Désiré Elliah
19
ANNUAL REPORT 2017
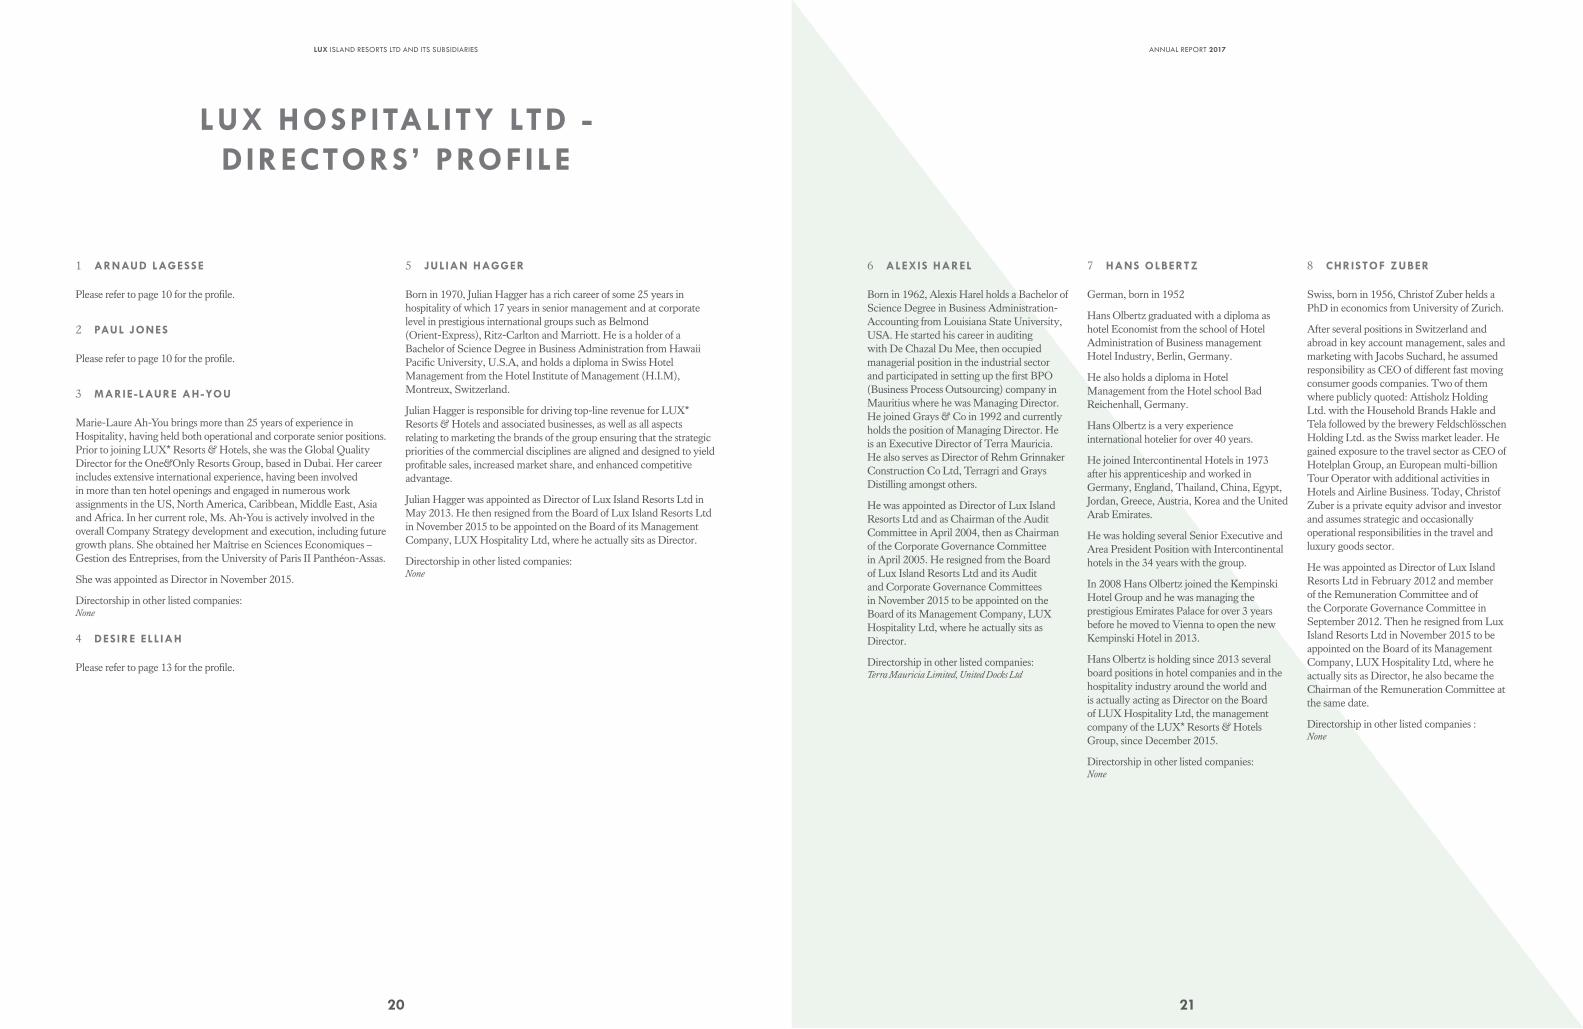
LUX HOSPITALITY LTD - DIRECTORS’ PROFILE
1 ARNAUD LAGESSE
Please refer to page 10 for the profile.
2 PAUL JONES
Please refer to page 10 for the profile.
3 MARIE-LAURE AH-YOU
Marie-Laure Ah-You brings more than 25 years of experience in Hospitality, having held both operational and corporate senior positions. Prior to joining LUX* Resorts & Hotels, she was the Global Quality Director for the One&Only Resorts Group, based in Dubai. Her career includes extensive international experience, having been involved in more than ten hotel openings and engaged in numerous work assignments in the US, North America, Caribbean, Middle East, Asia and Africa. In her current role, Ms. Ah-You is actively involved in the overall Company Strategy development and execution, including future growth plans. She obtained her Maîtrise en Sciences Economiques – Gestion des Entreprises, from the University of Paris II Panthéon-Assas.
She was appointed as Director in November 2015.
Directorship in other listed companies: None
4 DESIRE ELLIAH
Please refer to page 13 for the profile.
5 JULIAN HAGGER
Born in 1970, Julian Hagger has a rich career of some 25 years in hospitality of which 17 years in senior management and at corporate level in prestigious international groups such as Belmond (Orient-Express), Ritz-Carlton and Marriott. He is a holder of a Bachelor of Science Degree in Business Administration from Hawaii Pacific University, U.S.A, and holds a diploma in Swiss Hotel Management from the Hotel Institute of Management (H.I.M), Montreux, Switzerland.
Julian Hagger is responsible for driving top-line revenue for LUX* Resorts & Hotels and associated businesses, as well as all aspects relating to marketing the brands of the group ensuring that the strategic priorities of the commercial disciplines are aligned and designed to yield profitable sales, increased market share, and enhanced competitive advantage.
Julian Hagger was appointed as Director of Lux Island Resorts Ltd in May 2013. He then resigned from the Board of Lux Island Resorts Ltd in November 2015 to be appointed on the Board of its Management Company, LUX Hospitality Ltd, where he actually sits as Director.
Directorship in other listed companies: None
20
LUX ISLAND RESORTS LTD AND ITS SUBSIDIARIES
6 ALEXIS HAREL
Born in 1962, Alexis Harel holds a Bachelor of Science Degree in Business Administration-Accounting from Louisiana State University, USA. He started his career in auditing with De Chazal Du Mee, then occupied managerial position in the industrial sector and participated in setting up the first BPO (Business Process Outsourcing) company in Mauritius where he was Managing Director. He joined Grays & Co in 1992 and currently holds the position of Managing Director. He is an Executive Director of Terra Mauricia. He also serves as Director of Rehm Grinnaker Construction Co Ltd, Terragri and Grays Distilling amongst others.
He was appointed as Director of Lux Island Resorts Ltd and as Chairman of the Audit Committee in April 2004, then as Chairman of the Corporate Governance Committee in April 2005. He resigned from the Board of Lux Island Resorts Ltd and its Audit and Corporate Governance Committees in November 2015 to be appointed on the Board of its Management Company, LUX Hospitality Ltd, where he actually sits as Director.
Directorship in other listed companies: Terra Mauricia Limited, United Docks Ltd
7 HANS OLBERTZ
German, born in 1952
Hans Olbertz graduated with a diploma as hotel Economist from the school of Hotel Administration of Business management Hotel Industry, Berlin, Germany.
He also holds a diploma in Hotel Management from the Hotel school Bad Reichenhall, Germany.
Hans Olbertz is a very experience international hotelier for over 40 years.
He joined Intercontinental Hotels in 1973 after his apprenticeship and worked in Germany, England, Thailand, China, Egypt, Jordan, Greece, Austria, Korea and the United Arab Emirates.
He was holding several Senior Executive and Area President Position with Intercontinental hotels in the 34 years with the group.
In 2008 Hans Olbertz joined the Kempinski Hotel Group and he was managing the prestigious Emirates Palace for over 3 years before he moved to Vienna to open the new Kempinski Hotel in 2013.
Hans Olbertz is holding since 2013 several board positions in hotel companies and in the hospitality industry around the world and is actually acting as Director on the Board of LUX Hospitality Ltd, the management company of the LUX* Resorts & Hotels Group, since December 2015.
Directorship in other listed companies: None
8 CHRISTOF ZUBER
Swiss, born in 1956, Christof Zuber helds a PhD in economics from University of Zurich.
After several positions in Switzerland and abroad in key account management, sales and marketing with Jacobs Suchard, he assumed responsibility as CEO of different fast moving consumer goods companies. Two of them where publicly quoted: Attisholz Holding Ltd. with the Household Brands Hakle and Tela followed by the brewery Feldschlösschen Holding Ltd. as the Swiss market leader. He gained exposure to the travel sector as CEO of Hotelplan Group, an European multi-billion Tour Operator with additional activities in Hotels and Airline Business. Today, Christof Zuber is a private equity advisor and investor and assumes strategic and occasionally operational responsibilities in the travel and luxury goods sector.
He was appointed as Director of Lux Island Resorts Ltd in February 2012 and member of the Remuneration Committee and of the Corporate Governance Committee in September 2012. Then he resigned from Lux Island Resorts Ltd in November 2015 to be appointed on the Board of its Management Company, LUX Hospitality Ltd, where he actually sits as Director, he also became the Chairman of the Remuneration Committee at the same date.
Directorship in other listed companies : None
21
ANNUAL REPORT 2017
Beau
Riv
age
Co
Ltd
Blue
Bay
Tok
ey Is
land
Lim
ited
FMM
Lté
e
Hol
iday
& L
eisu
re R
esor
ts L
imte
d
Hot
el P
rest
ige
Réu
nion
SA
S
Isla
nd L
ight
Vac
atio
ns L
td
LUX
Res
orts
Ltd
Les
Pavi
llons
Res
orts
Ltd
LTK
Ltd
Lux
Isla
nd R
esor
ts F
ound
atio
n
Lux
Isla
nd R
esor
ts L
td
Lux
Isla
nd R
esor
ts M
aldi
ves
Ltd
Lux
Isla
nd R
esor
ts S
eych
elle
s Lt
d
Lux
Isla
nd R
esor
ts U
K L
imite
d
LIRT
A L
td
LUX
Hos
pita
lity
Ltd
Lux
Hot
el M
anag
emen
t (Sh
angh
ai)
Co
Ltd
Les
Vill
as d
u La
gon
SA
Mer
ville
Bea
ch H
otel
Ltd
Mer
ville
Lim
ited
MSF
Lei
sure
Com
pany
Ltd
Nai
ade
Hol
iday
s (P
ropr
ieta
ry)
Lim
ited
Nér
éide
Lim
ited
Océ
anid
e Li
mite
d
Caf
é LU
X L
td(f
orm
erly
kno
wn
as P
oséi
don
Lim
itée)
Soci
été
Vill
ages
-Hot
els
de L
’Océ
an
Indi
en S
A
Whi
te S
ands
Res
ort &
Spa
Pvt
Ltd
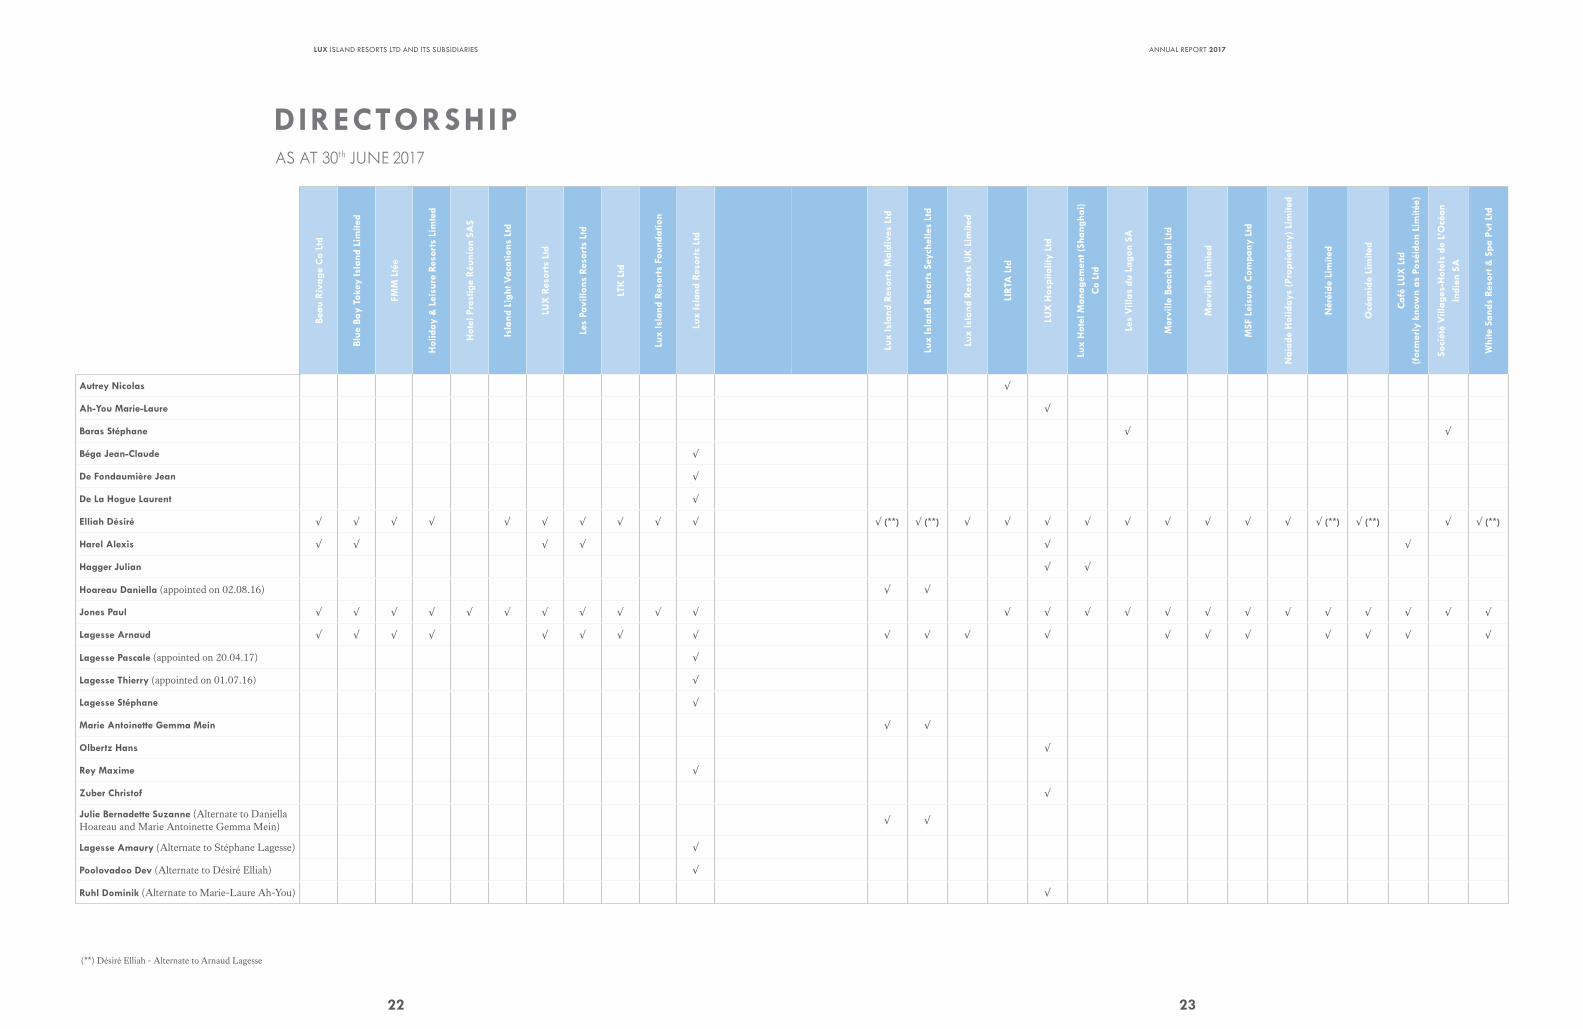
Autrey Nicolas √
Ah-You Marie-Laure √
Baras Stéphane √ √
Béga Jean-Claude √
De Fondaumière Jean √
De La Hogue Laurent √
Elliah Désiré √ √ √ √ √ √ √ √ √ √ √ (**) √ (**) √ √ √ √ √ √ √ √ √ √ (**) √ (**) √ √ (**)
Harel Alexis √ √ √ √ √ √
Hagger Julian √ √
Hoareau Daniella (appointed on 02.08.16) √ √
Jones Paul √ √ √ √ √ √ √ √ √ √ √ √ √ √ √ √ √ √ √ √ √ √ √ √
Lagesse Arnaud √ √ √ √ √ √ √ √ √ √ √ √ √ √ √ √ √ √ √
Lagesse Pascale (appointed on 20.04.17) √
Lagesse Thierry (appointed on 01.07.16) √
Lagesse Stéphane √
Marie Antoinette Gemma Mein √ √
Olbertz Hans √
Rey Maxime √
Zuber Christof √
Julie Bernadette Suzanne (Alternate to Daniella Hoareau and Marie Antoinette Gemma Mein) √ √
Lagesse Amaury (Alternate to Stéphane Lagesse) √
Poolovadoo Dev (Alternate to Désiré Elliah) √
Ruhl Dominik (Alternate to Marie-Laure Ah-You) √
(**) Désiré Elliah - Alternate to Arnaud Lagesse
DIRECTORSHIPAS AT 30th JUNE 2017
22
LUX ISLAND RESORTS LTD AND ITS SUBSIDIARIES
Beau
Riv
age
Co
Ltd
Blue
Bay
Tok
ey Is
land
Lim
ited
FMM
Lté
e
Hol
iday
& L
eisu
re R
esor
ts L
imte
d
Hot
el P
rest
ige
Réu
nion
SA
S
Isla
nd L
ight
Vac
atio
ns L
td
LUX
Res
orts
Ltd
Les
Pavi
llons
Res
orts
Ltd
LTK
Ltd
Lux
Isla
nd R
esor
ts F
ound
atio
n
Lux
Isla
nd R
esor
ts L
td
Lux
Isla
nd R
esor
ts M
aldi
ves
Ltd
Lux
Isla
nd R
esor
ts S
eych
elle
s Lt
d
Lux
Isla
nd R
esor
ts U
K L
imite
d
LIRT
A L
td
LUX
Hos
pita
lity
Ltd
Lux
Hot
el M
anag
emen
t (Sh
angh
ai)
Co
Ltd
Les
Vill
as d
u La
gon
SA
Mer
ville
Bea
ch H
otel
Ltd
Mer
ville
Lim
ited
MSF
Lei
sure
Com
pany
Ltd
Nai
ade
Hol
iday
s (P
ropr
ieta
ry)
Lim
ited
Nér
éide
Lim
ited
Océ
anid
e Li
mite
d
Caf
é LU
X L
td(f
orm
erly
kno
wn
as P
oséi
don
Lim
itée)
Soci
été
Vill
ages
-Hot
els
de L
’Océ
an
Indi
en S
A
Whi
te S
ands
Res
ort &
Spa
Pvt
Ltd
Autrey Nicolas √
Ah-You Marie-Laure √
Baras Stéphane √ √
Béga Jean-Claude √
De Fondaumière Jean √
De La Hogue Laurent √
Elliah Désiré √ √ √ √ √ √ √ √ √ √ √ (**) √ (**) √ √ √ √ √ √ √ √ √ √ (**) √ (**) √ √ (**)
Harel Alexis √ √ √ √ √ √
Hagger Julian √ √
Hoareau Daniella (appointed on 02.08.16) √ √
Jones Paul √ √ √ √ √ √ √ √ √ √ √ √ √ √ √ √ √ √ √ √ √ √ √ √
Lagesse Arnaud √ √ √ √ √ √ √ √ √ √ √ √ √ √ √ √ √ √ √
Lagesse Pascale (appointed on 20.04.17) √
Lagesse Thierry (appointed on 01.07.16) √
Lagesse Stéphane √
Marie Antoinette Gemma Mein √ √
Olbertz Hans √
Rey Maxime √
Zuber Christof √
Julie Bernadette Suzanne (Alternate to Daniella Hoareau and Marie Antoinette Gemma Mein) √ √
Lagesse Amaury (Alternate to Stéphane Lagesse) √
Poolovadoo Dev (Alternate to Désiré Elliah) √
Ruhl Dominik (Alternate to Marie-Laure Ah-You) √
(**) Désiré Elliah - Alternate to Arnaud Lagesse
23
ANNUAL REPORT 2017
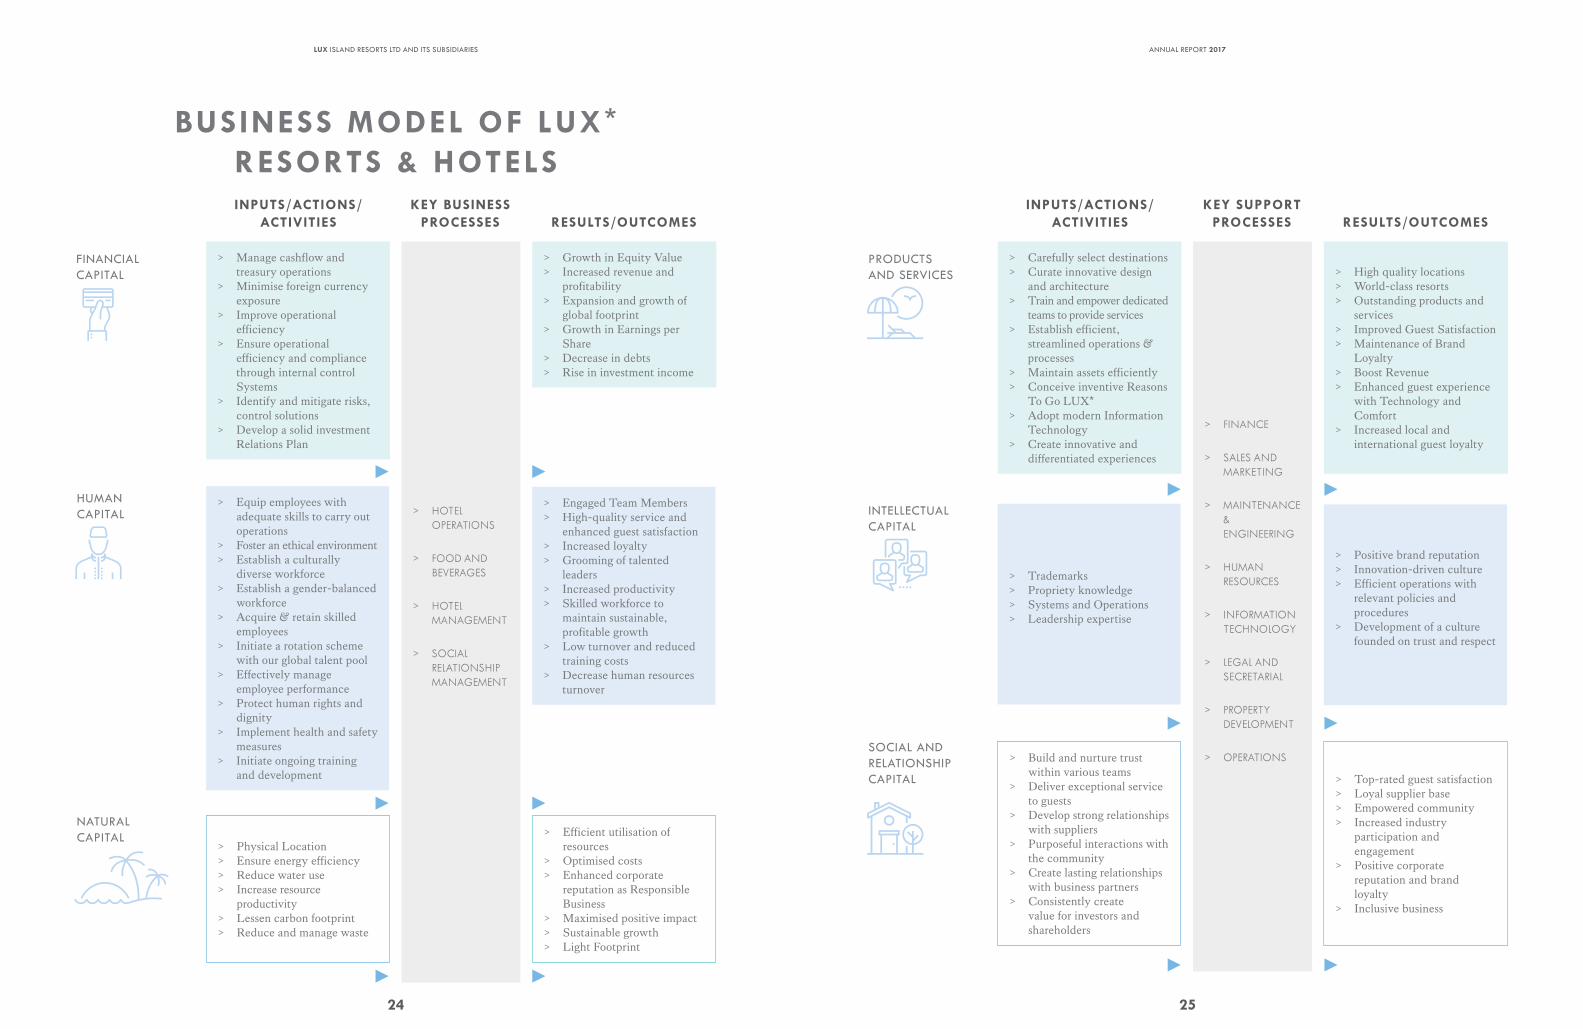
BUSINESS MODEL OF LUX* RESORTS & HOTELS
> HOTEL OPERATIONS
> FOOD AND BEVERAGES
> HOTEL MANAGEMENT
> SOCIAL RELATIONSHIP MANAGEMENT
> Manage cashflow and treasury operations
> Minimise foreign currency exposure
> Improve operational efficiency
> Ensure operational efficiency and compliance through internal control Systems
> Identify and mitigate risks, control solutions
> Develop a solid investment Relations Plan
> Growth in Equity Value > Increased revenue and
profitability > Expansion and growth of
global footprint > Growth in Earnings per
Share > Decrease in debts > Rise in investment income
> Equip employees with adequate skills to carry out operations
> Foster an ethical environment > Establish a culturally
diverse workforce > Establish a gender-balanced
workforce > Acquire & retain skilled
employees > Initiate a rotation scheme
with our global talent pool > Effectively manage
employee performance > Protect human rights and
dignity > Implement health and safety
measures > Initiate ongoing training
and development
> Engaged Team Members > High-quality service and
enhanced guest satisfaction > Increased loyalty > Grooming of talented
leaders > Increased productivity > Skilled workforce to
maintain sustainable, profitable growth
> Low turnover and reduced training costs
> Decrease human resources turnover
> Physical Location > Ensure energy efficiency > Reduce water use > Increase resource
productivity > Lessen carbon footprint > Reduce and manage waste
> Efficient utilisation of resources
> Optimised costs > Enhanced corporate
reputation as Responsible Business
> Maximised positive impact > Sustainable growth > Light Footprint
INPUTS/ACTIONS/ ACTIVITIES RESULTS/OUTCOMES
KEY BUSINESS PROCESSES
FINANCIAL CAPITAL
HUMAN CAPITAL
NATURAL CAPITAL
24
LUX ISLAND RESORTS LTD AND ITS SUBSIDIARIES
> FINANCE
> SALES AND MARKETING
> MAINTENANCE & ENGINEERING
> HUMAN RESOURCES
> INFORMATION TECHNOLOGY
> LEGAL AND SECRETARIAL
> PROPERTY DEVELOPMENT
> OPERATIONS
> Carefully select destinations > Curate innovative design
and architecture > Train and empower dedicated
teams to provide services > Establish efficient,
streamlined operations & processes
> Maintain assets efficiently > Conceive inventive Reasons
To Go LUX* > Adopt modern Information
Technology > Create innovative and
differentiated experiences
> High quality locations > World-class resorts > Outstanding products and
services > Improved Guest Satisfaction > Maintenance of Brand
Loyalty > Boost Revenue > Enhanced guest experience
with Technology and Comfort
> Increased local and international guest loyalty
> Trademarks > Propriety knowledge > Systems and Operations > Leadership expertise
> Positive brand reputation > Innovation-driven culture > Efficient operations with
relevant policies and procedures
> Development of a culture founded on trust and respect
> Build and nurture trust within various teams
> Deliver exceptional service to guests
> Develop strong relationships with suppliers
> Purposeful interactions with the community
> Create lasting relationships with business partners
> Consistently create value for investors and shareholders
> Top-rated guest satisfaction > Loyal supplier base > Empowered community > Increased industry
participation and engagement
> Positive corporate reputation and brand loyalty
> Inclusive business
INPUTS/ACTIONS/ ACTIVITIES RESULTS/OUTCOMES
KEY SUPPORT PROCESSES
INTELLECTUAL CAPITAL
PRODUCTS AND SERVICES
SOCIAL AND RELATIONSHIP CAPITAL
25
ANNUAL REPORT 2017
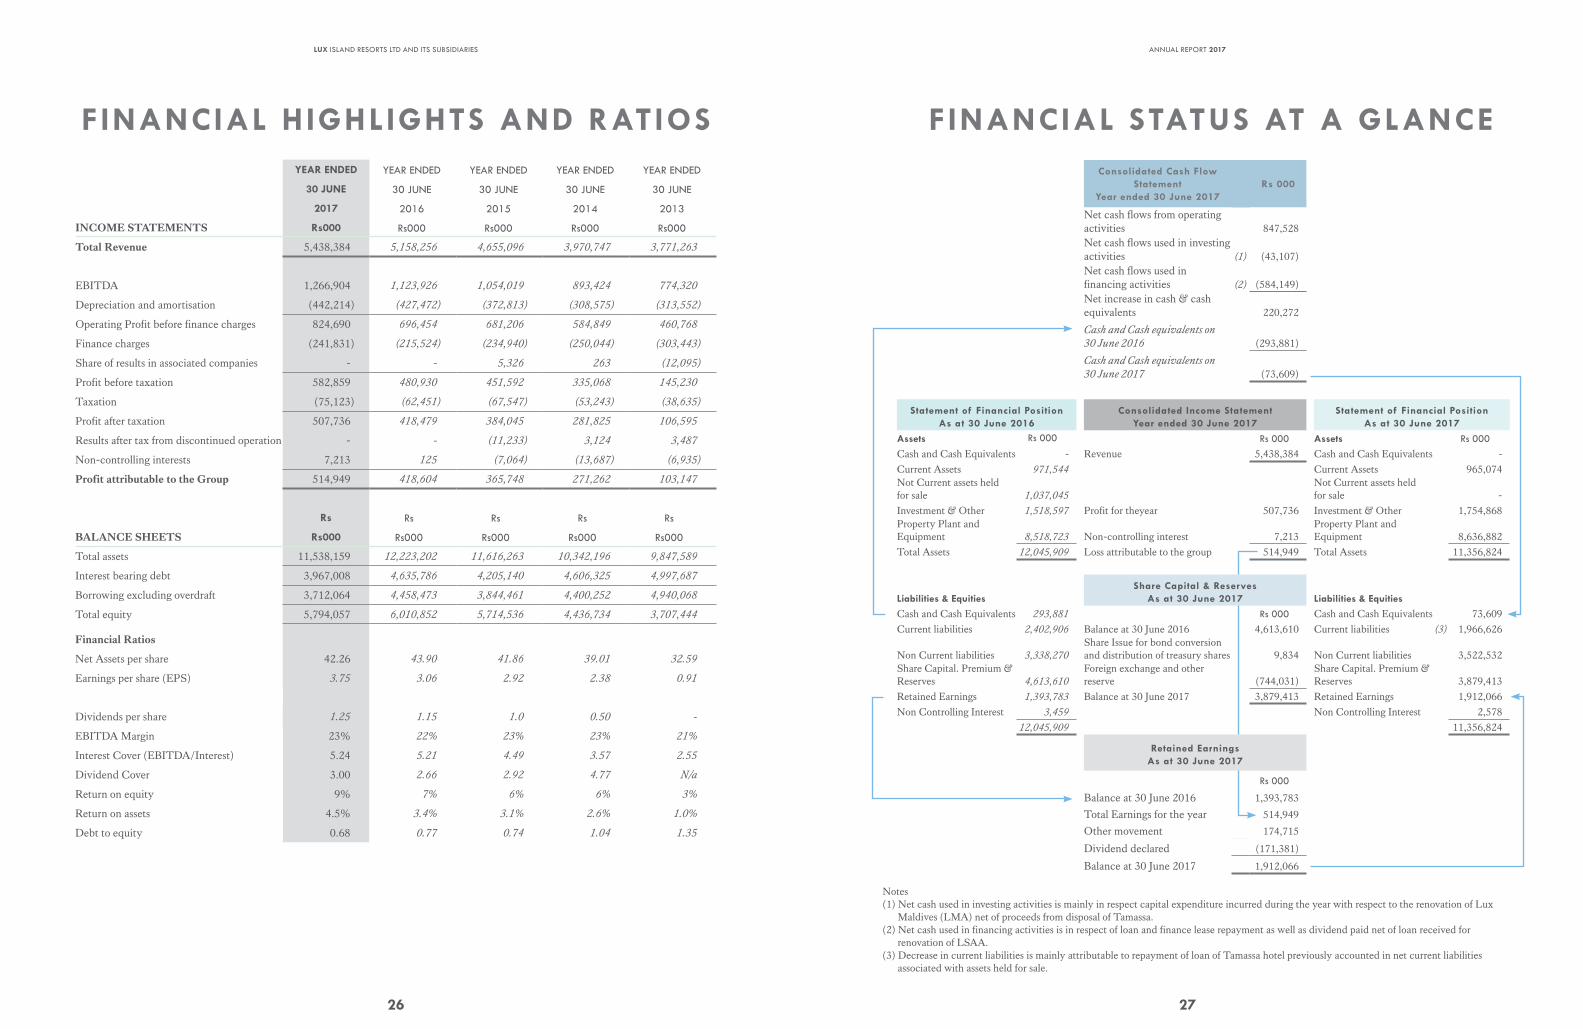
FINANCIAL HIGHLIGHTS AND RATIOSYEAR ENDED YEAR ENDED YEAR ENDED YEAR ENDED YEAR ENDED
30 JUNE 30 JUNE 30 JUNE 30 JUNE 30 JUNE
2017 2016 2015 2014 2013
INCOME STATEMENTS Rs000 Rs000 Rs000 Rs000 Rs000
Total Revenue 5,438,384 5,158,256 4,655,096 3,970,747 3,771,263
EBITDA 1,266,904 1,123,926 1,054,019 893,424 774,320
Depreciation and amortisation (442,214) (427,472) (372,813) (308,575) (313,552)
Operating Profit before finance charges 824,690 696,454 681,206 584,849 460,768
Finance charges (241,831) (215,524) (234,940) (250,044) (303,443)
Share of results in associated companies - - 5,326 263 (12,095)
Profit before taxation 582,859 480,930 451,592 335,068 145,230
Taxation (75,123) (62,451) (67,547) (53,243) (38,635)
Profit after taxation 507,736 418,479 384,045 281,825 106,595
Results after tax from discontinued operation - - (11,233) 3,124 3,487
Non-controlling interests 7,213 125 (7,064) (13,687) (6,935)
Profit attributable to the Group 514,949 418,604 365,748 271,262 103,147
Rs Rs Rs Rs Rs
BALANCE SHEETS Rs000 Rs000 Rs000 Rs000 Rs000
Total assets 11,538,159 12,223,202 11,616,263 10,342,196 9,847,589
Interest bearing debt 3,967,008 4,635,786 4,205,140 4,606,325 4,997,687
Borrowing excluding overdraft 3,712,064 4,458,473 3,844,461 4,400,252 4,940,068
Total equity 5,794,057 6,010,852 5,714,536 4,436,734 3,707,444
Financial Ratios
Net Assets per share 42.26 43.90 41.86 39.01 32.59
Earnings per share (EPS) 3.75 3.06 2.92 2.38 0.91
Dividends per share 1.25 1.15 1.0 0.50 -
EBITDA Margin 23% 22% 23% 23% 21%
Interest Cover (EBITDA/Interest) 5.24 5.21 4.49 3.57 2.55
Dividend Cover 3.00 2.66 2.92 4.77 N/a
Return on equity 9% 7% 6% 6% 3%
Return on assets 4.5% 3.4% 3.1% 2.6% 1.0%
Debt to equity 0.68 0.77 0.74 1.04 1.35
26
LUX ISLAND RESORTS LTD AND ITS SUBSIDIARIES
FINANCIAL STATUS AT A GLANCEConsolidated Cash Flow
Statement Year ended 30 June 2017
Rs 000
Net cash flows from operating activities 847,528 Net cash flows used in investing activities (1) (43,107)Net cash flows used in financing activities (2) (584,149)Net increase in cash & cash equivalents 220,272
Cash and Cash equivalents on
30 June 2016 (293,881)
Cash and Cash equivalents on
30 June 2017 (73,609)
Statement of Financial Position As at 30 June 2016
Consolidated Income Statement Year ended 30 June 2017
Statement of Financial Position As at 30 June 2017
Assets Rs 000 Rs 000 Assets Rs 000
Cash and Cash Equivalents - Revenue 5,438,384 Cash and Cash Equivalents -
Current Assets 971,544 Current Assets 965,074 Not Current assets held for sale 1,037,045
Not Current assets held for sale -
Investment & Other 1,518,597 Profit for theyear 507,736 Investment & Other 1,754,868 Property Plant and Equipment 8,518,723 Non-controlling interest 7,213
Property Plant and Equipment 8,636,882
Total Assets 12,045,909 Loss attributable to the group 514,949 Total Assets 11,356,824
Liabilities & EquitiesShare Capital & Reserves
As at 30 June 2017 Liabilities & Equities
Cash and Cash Equivalents 293,881 Rs 000 Cash and Cash Equivalents 73,609 Current liabilities 2,402,906 Balance at 30 June 2016 4,613,610 Current liabilities (3) 1,966,626
Non Current liabilities 3,338,270
Share Issue for bond conversion and distribution of treasury shares 9,834 Non Current liabilities 3,522,532
Share Capital. Premium & Reserves 4,613,610
Foreign exchange and other reserve (744,031)
Share Capital. Premium & Reserves 3,879,413
Retained Earnings 1,393,783 Balance at 30 June 2017 3,879,413 Retained Earnings 1,912,066 Non Controlling Interest 3,459 Non Controlling Interest 2,578
12,045,909 11,356,824
Retained Earnings As at 30 June 2017
Rs 000
Balance at 30 June 2016 1,393,783
Total Earnings for the year 514,949
Other movement 174,715
Dividend declared (171,381)
Balance at 30 June 2017 1,912,066
Notes(1) Net cash used in investing activities is mainly in respect capital expenditure incurred during the year with respect to the renovation of Lux
Maldives (LMA) net of proceeds from disposal of Tamassa.(2) Net cash used in financing activities is in respect of loan and finance lease repayment as well as dividend paid net of loan received for
renovation of LSAA.(3) Decrease in current liabilities is mainly attributable to repayment of loan of Tamassa hotel previously accounted in net current liabilities
associated with assets held for sale.
27
ANNUAL REPORT 2017
YEAR ENDED 30 JUNE 2017
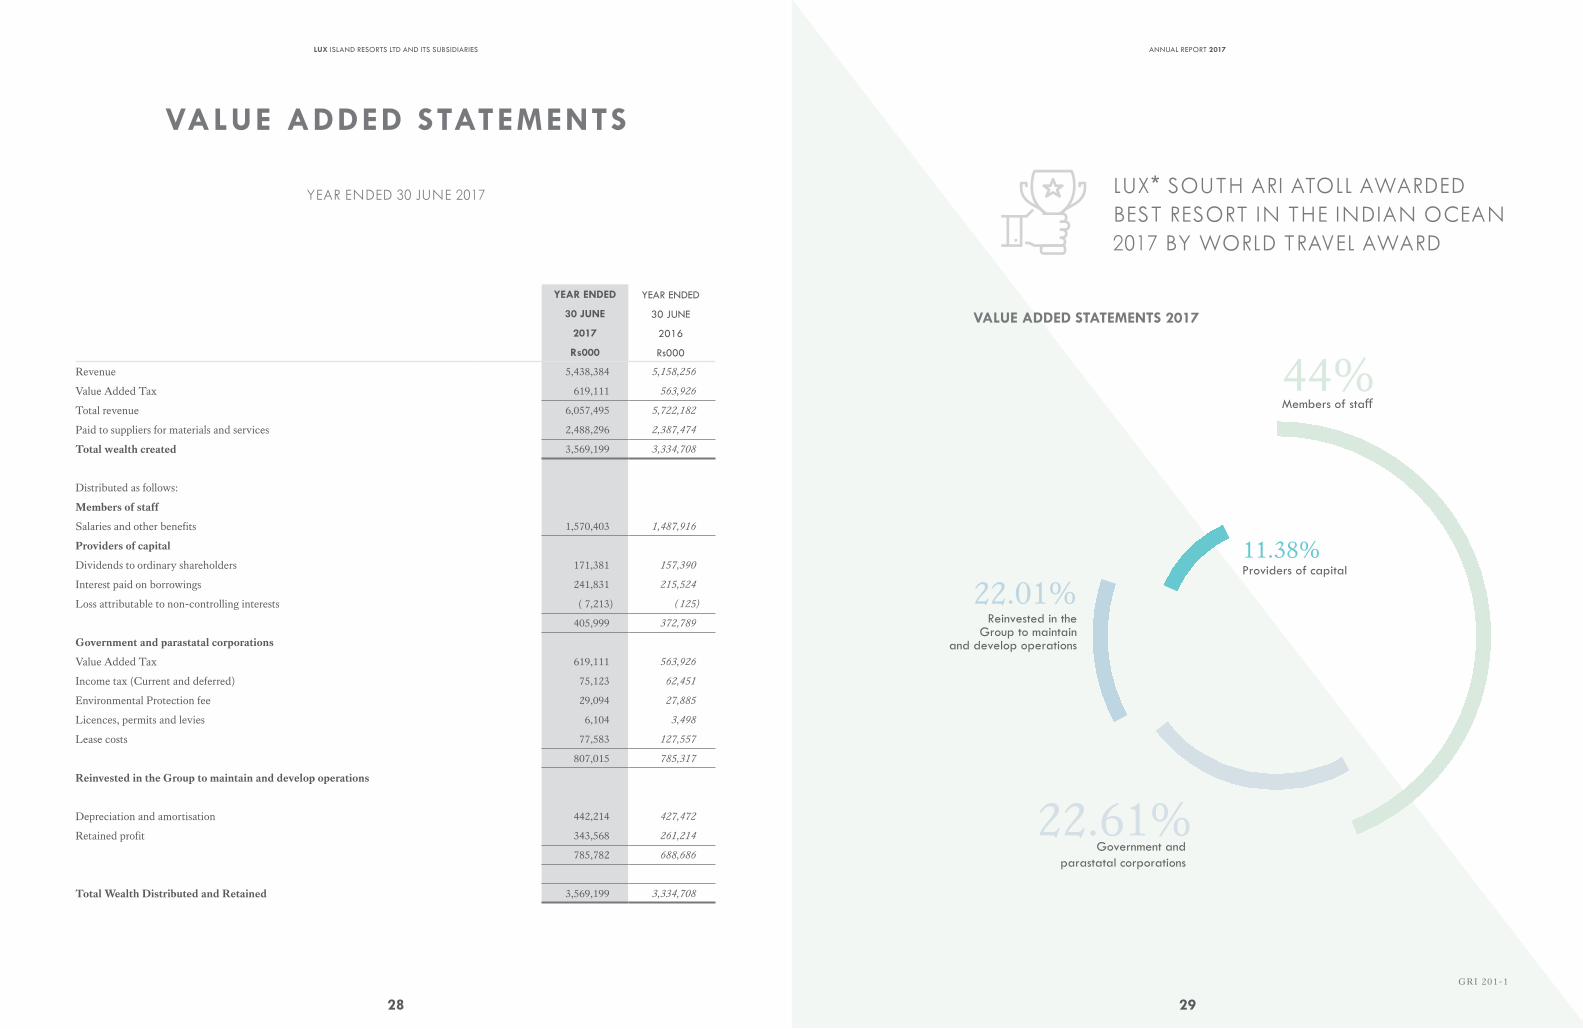
VALUE ADDED STATEMENTS
YEAR ENDED YEAR ENDED
30 JUNE 30 JUNE
2017 2016
Rs000 Rs000
Revenue 5,438,384 5,158,256
Value Added Tax 619,111 563,926
Total revenue 6,057,495 5,722,182
Paid to suppliers for materials and services 2,488,296 2,387,474
Total wealth created 3,569,199 3,334,708
Distributed as follows:
Members of staff
Salaries and other benefits 1,570,403 1,487,916
Providers of capital
Dividends to ordinary shareholders 171,381 157,390
Interest paid on borrowings 241,831 215,524
Loss attributable to non-controlling interests ( 7,213) ( 125)
405,999 372,789
Government and parastatal corporations
Value Added Tax 619,111 563,926
Income tax (Current and deferred) 75,123 62,451
Environmental Protection fee 29,094 27,885
Licences, permits and levies 6,104 3,498
Lease costs 77,583 127,557
807,015 785,317
Reinvested in the Group to maintain and develop operations
Depreciation and amortisation 442,214 427,472
Retained profit 343,568 261,214
785,782 688,686
Total Wealth Distributed and Retained 3,569,199 3,334,708
28
LUX ISLAND RESORTS LTD AND ITS SUBSIDIARIES
VALUE ADDED STATEMENTS 2017
GRI 201-1
Members of staff
Providers of capital
Government andparastatal corporations
44%
22.61%
22.01%11.38%
Reinvested in theGroup to maintain
and develop operations
LUX* SOUTH ARI ATOLL AWARDED BEST RESORT IN THE INDIAN OCEAN 2017 BY WORLD TRAVEL AWARD
29
ANNUAL REPORT 2017
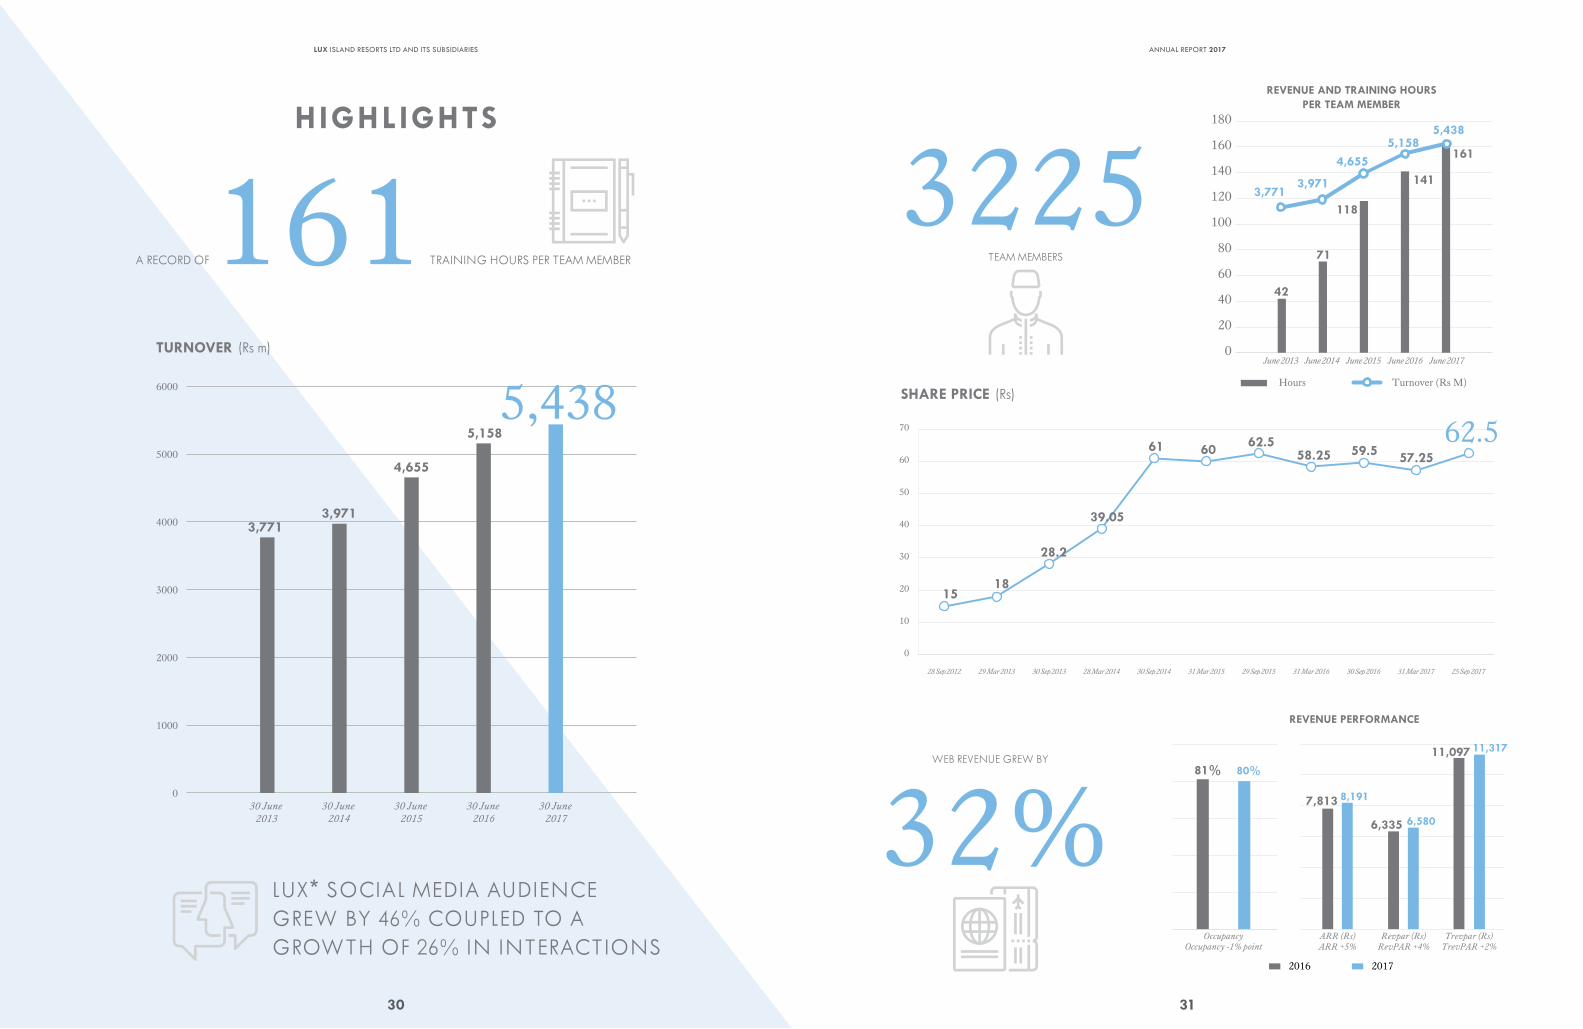
HIGHLIGHTS
TURNOVER (Rs m)
3,771
4,655
5,158
3,971
30 June 2014
30 June 2015
30 June 2017
30 June 2016
30 June 2013
0
1000
2000
3000
4000
5000
6000 5,438
LUX* SOCIAL MEDIA AUDIENCE GREW BY 46% COUPLED TO A GROWTH OF 26% IN INTERACTIONS
A RECORD OF 161 TRAINING HOURS PER TEAM MEMBER
30
LUX ISLAND RESORTS LTD AND ITS SUBSIDIARIES
SHARE PRICE (Rs)
REVENUE AND TRAINING HOURS PER TEAM MEMBER
0
10
20
30
40
50
60
70
25 Sep 201731 Mar 201730 Sep 201631 Mar 201629 Sep 201531 Mar 201530 Sep 201428 Mar 201430 Sep 201329 Mar 201328 Sep 2012
1518
28.2
39.05
61 60 62.558.25 59.5 57.25
62.5
Occupancy ARR (Rs)
ARR +5%
Revpar (Rs)
RevPAR +4%
Trevpar (Rs)
TrevPAR +2%Occupancy -1% point
80%
8,191
6,580
11,317
81%
7,813
6,335
11,097
2016 2017
0
20
40
60
80
100
120
140
160
180
June 2016 June 2017June 2015June 2013 June 2014
118
141
161
71
Turnover (Rs M)
42
3,7713,971
4,6555,158
5,438
Hours
REVENUE PERFORMANCE
32%
3225TEAM MEMBERS
WEB REVENUE GREW BY
31
ANNUAL REPORT 2017
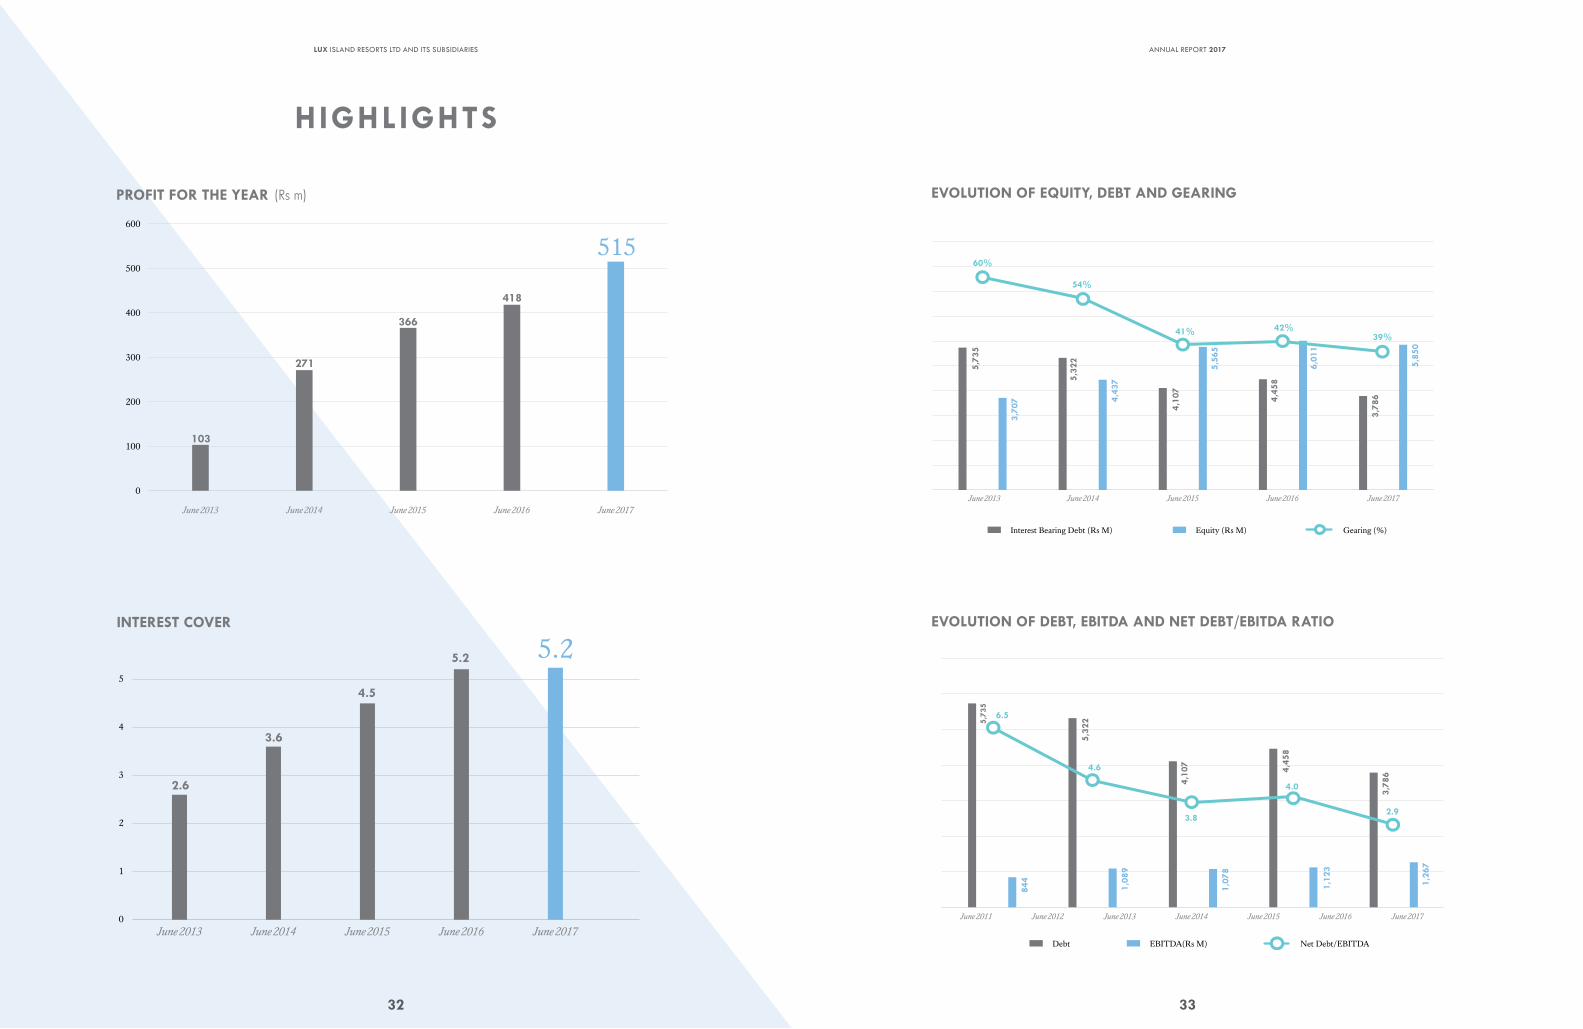
HIGHLIGHTS
0
1
2
3
4
5
6
June 2017June 2016June 2015June 2014June 2013
5.2
2.6
3.6
4.5
5.2
0
100
200
300
400
500
600
June 2017June 2016June 2015June 2014June 2013
418
366
271
103
515
PROFIT FOR THE YEAR
PROFIT FOR THE YEAR (Rs m)
INTEREST COVER
32
LUX ISLAND RESORTS LTD AND ITS SUBSIDIARIES
June 2017June 2016June 2015June 2013 June 2014
60%
54%
41%39%
42%
5,32
2
4,10
7
4,45
8
3,78
6
3,70
7 4,43
7
5,56
5
6,01
1
5,85
0
5,73
5
Interest Bearing Debt (Rs M) Equity (Rs M) Gearing (%)
EVOLUTION OF EQUITY, DEBT AND GEARING
June 2016 June 2017June 2015June 2011 June 2012 June 2013 June 2014
6.5
4.6
3.8
4.0
2.9
EVOLUTION OF DEBT, EBITDA AND NET DEBT/EBITDA RATIO
5,32
2
4,10
7
4,45
8
3,78
6
844
1,08
9
1,07
8
1,12
3
1,26
7
5,73
5
Debt EBITDA(Rs M) Net Debt/EBITDA
EVOLUTION OF DEBT, EBITDA AND NET DEBT/EBITDA RATIO
EVOLUTION OF EQUITY, DEBT AND GEARING
33
ANNUAL REPORT 2017
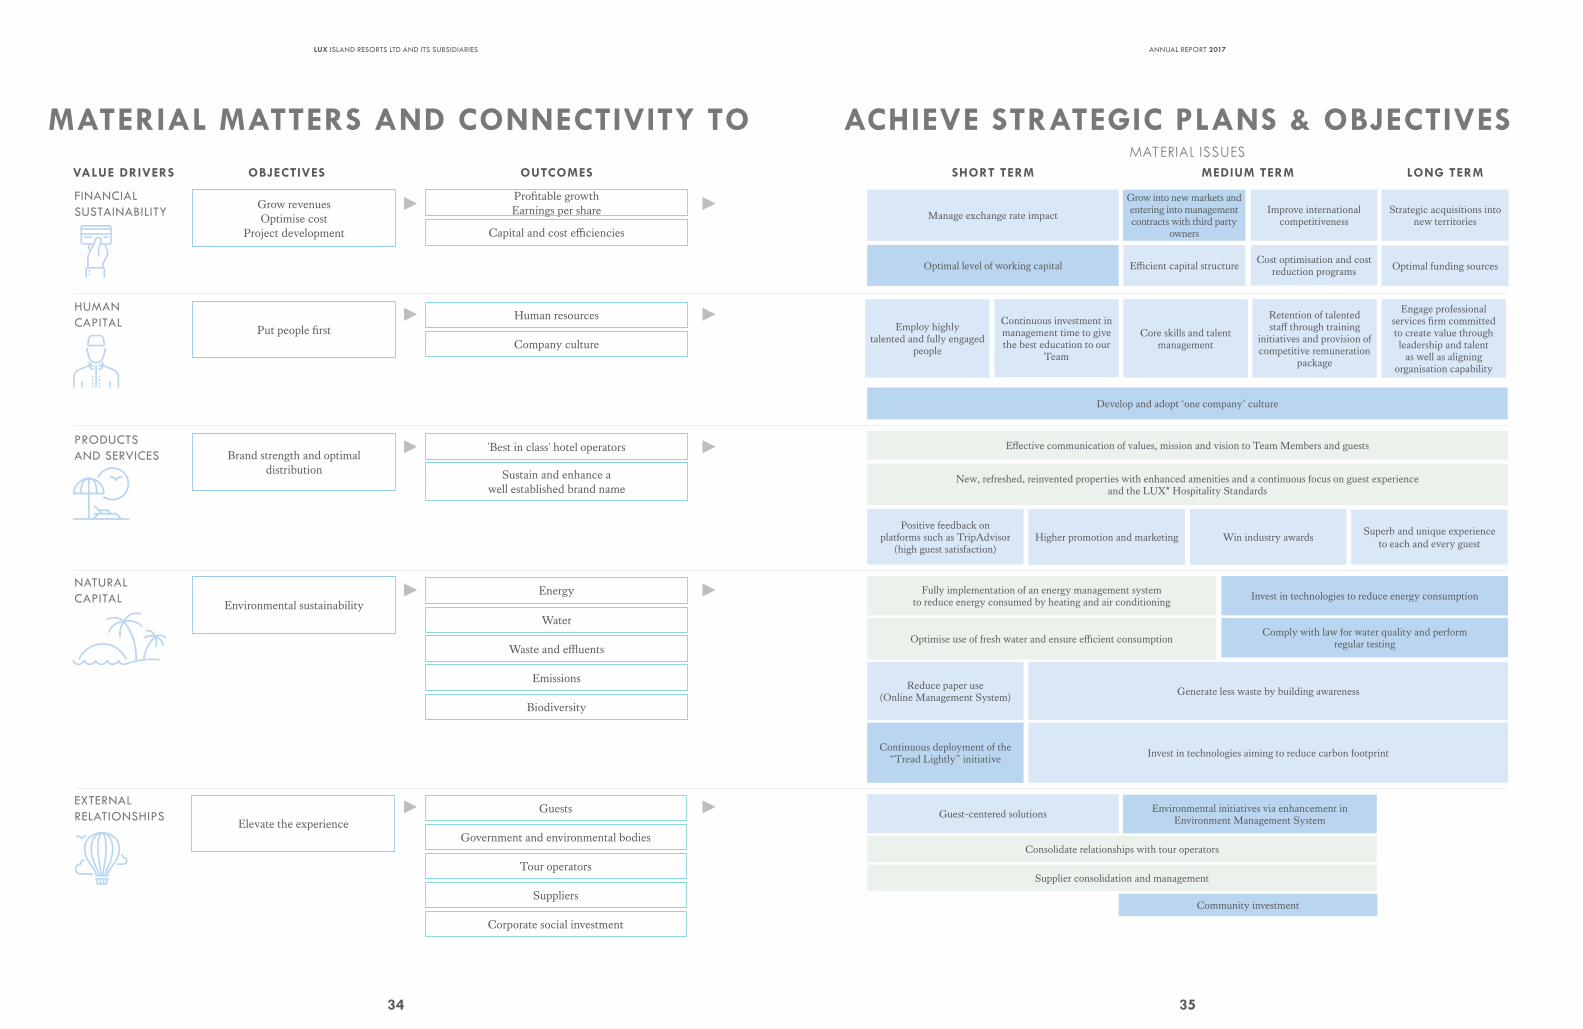
MATERIAL MATTERS AND CONNECTIVITY TO ACHIEVE STRATEGIC PLANS & OBJECTIVES
FINANCIAL SUSTAINABILITY
HUMAN CAPITAL
PRODUCTS AND SERVICES
NATURAL CAPITAL
EXTERNAL RELATIONSHIPS
Grow revenuesOptimise cost
Project development
Put people first
Brand strength and optimaldistribution
Environmental sustainability
Elevate the experience
Profitable growthEarnings per share
Human resources
Energy
Guests
Capital and cost efficiencies
Company culture
'Best in class' hotel operators
Sustain and enhance a well established brand name
Government and environmental bodies
Tour operators
Suppliers
Corporate social investment
VALUE DRIVERS OBJECTIVES OUTCOMES
Water
Waste and effluents
Emissions
Biodiversity
34
LUX ISLAND RESORTS LTD AND ITS SUBSIDIARIES
MATERIAL MATTERS AND CONNECTIVITY TO ACHIEVE STRATEGIC PLANS & OBJECTIVES
Manage exchange rate impact
Employ highly talented and fully engaged
people
Core skills and talent management
Retention of talented staff through training
initiatives and provision of competitive remuneration
package
Engage professional services firm committed to create value through leadership and talent
as well as aligning organisation capability
Grow into new markets and entering into management contracts with third party
owners
Improve international competitiveness
Effective communication of values, mission and vision to Team Members and guests
Develop and adopt ‘one company’ culture
Consolidate relationships with tour operators
Supplier consolidation and management
Fully implementation of an energy management system to reduce energy consumed by heating and air conditioning Invest in technologies to reduce energy consumption
Comply with law for water quality and perform regular testing
Environmental initiatives via enhancement in Environment Management System
Community investment
New, refreshed, reinvented properties with enhanced amenities and a continuous focus on guest experience and the LUX* Hospitality Standards
Optimise use of fresh water and ensure efficient consumption
Generate less waste by building awareness
Invest in technologies aiming to reduce carbon footprint
Optimal level of working capital
Continuous investment in management time to give the best education to our
Team
Efficient capital structure
Higher promotion and marketingPositive feedback on
platforms such as TripAdvisor (high guest satisfaction)
Guest-centered solutions
Reduce paper use(Online Management System)
Continuous deployment of the “Tread Lightly” initiative
Cost optimisation and cost reduction programs
Win industry awards
Strategic acquisitions into new territories
Optimal funding sources
Superb and unique experience to each and every guest
MATERIAL ISSUESSHORT TERM MEDIUM TERM LONG TERM
35
ANNUAL REPORT 2017
Arnaud Lagesse - Chairman
36
LUX ISLAND RESORTS LTD AND ITS SUBSIDIARIES
CHAIRMAN’S REPORT
Dear Stakeholders,
For the fourth consecutive year, we have conceived an Integrated Annual Report that communicates a holistic view of how we derive and create value. The financial and non-financial performances reported have undergone thorough appraisal by independent auditors. This report adheres to the GRI (Global Reporting Initiative) and IIRC (International Integrated Reporting Council) guidelines. Our commitment to the UN SDGs (Sustainable Development Goals), the UN Global Compact, the Montreal Protocol, the Defra (the UK Department for Environment, Food & Rural Affairs) and the HCMI (Hotel Carbon Measurement Initiative) ensure we meet Sustainability and Good Governance standards. Responsible Business is the basis of our decision-making and contributes to advancing the communities and economies in which we are present.
I am though delighted to present the Integrated Annual Report of Lux Island Resorts Ltd for the financial year ended 30th June 2017.
OVERVIEW
The Group results for the financial year ended 30th June 2017 were influenced by the following:
i. the sale and lease back of Tamassa hotel to Grit (previously Mara Delta), resulting in a gain of Rs 195m on disposal of property, plant and equipment
ii. the unfavorable exchange rates, notably the GBP following the Brexit voteiii. the closure for renovation of LUX* South Ari Atoll in Maldives during the months
of July and August 2016 and the closure of LUX* Grand Gaube for refurbishment as from May 2017. The total closure cost incurred on both renovations and accounted in the financial year under review amounted to Rs 165m.
Against the above background, the Group delivered commendable results for the year ended 30th June 2017 with Earnings per Share (“EPS”) growing by 23% from Rs 3.06 to Rs 3.75. This performance is the result of the dedication, passion and energy of all our team members, the strength of our brand as well as our relentless focus on delivering on our strategy. The Board would like to express its heartfelt gratitude to those 3,225 team members for their dedication in ensuring the continued growth and success of LUX* Group.
GROUP RESULTS
Total revenue for the year under review reached Rs 5.4 billion, up by 5% on 2016 and EBITDA (Earnings before Interest, Tax, Depreciation and Amortization) amounted to Rs 1.3 billion, an improvement of 13% on last year. Depreciation and Amortization increased by Rs 15m or 3.4% on the prior year mainly due to the renovation of LUX* South Ari Atoll, whilst finance costs increased by Rs 27m due to interest on the loan contracted to finance the renovation works. The interest cover for the year is still very healthy at 5.2 times. Attributable profit for the year improved by 23% to Rs 515m. In line with its policy to revalue its properties every three years, the Group revalued all its properties at 30th June 2017. The valuation exercise was carried out by an independent Professional Valuer who used as basis the Open Market Value by reference to recent market transactions at arm’s length as well as the cash flow generated by each property. The revaluation exercise resulted in a net decrease in the value of the properties of Rs 476m mainly due to the renovation of LUX* South Ari Atoll and LUX* Grand Gaube whereby part of the properties were demolished. Since the decrease in value represents the reversal of revaluation surplus of the same assets recognised in prior years, the decrease has been accounted as a movement in Other Comprehensive Income (“OCI”). Other movements in OCI are explained by the translation of foreign subsidiaries and foreign currency loans.
GRI 102-10,102-14,102-19,102-49,102-50,102-52,201-2
ATTRIBUTABLE PROFITS GREW
BY 23% TO REACH RS 515 MILLION
37
ANNUAL REPORT 2017
CHAIRMAN’S REPORT
Total net interest bearing debt as at 30th June 2017 amounted to Rs 3.8 billion compared to Rs 4.5 billion last year, a net decrease of Rs 700 million. The gearing of the Group at 30th June 2017 stood at 40% compared to 43% a year ago and continues to be well below the industry average.
The Net Asset Value per share as at 30th June 2017 decreased by Rs 1.64 to Rs 42.24 following the revaluation carried out at end of year. This value increases to Rs 53.97 if the market value of leasehold land of the Group is taken into consideration.
We remain committed to delivering long–term shareholder value and at the same time providing a sustainable return to our shareholders in terms of dividends. For the financial year ended 30th June 2017, the Company paid a dividend of Rs 1.25 per share amounting to Rs 171m, representing a growth of 9% on previous year. I am confident that, subject to
cash flow, providing there is no deterioration in the environment and the positive trend continues, the Company should be able to maintain and even increase the dividend payout in the coming years.
LUX* STRATEGY - VISION 2020
Since we launched the LUX* brand in December 2011, the brand has grown consistently both in strength and attractiveness, offering distinctive and imaginative hospitality experiences that have become over the years the very hallmark of LUX*. We aim to continue to inspire, surprise and delight both our guests and owners, whilst ensuring alignment of our key hospitality metrics with best international benchmarks.
Over the last few years, we have built our Strategy around 2 poles:
1. The reinforcement of the Indian Ocean (the Core); consolidating the foundation for success in our legacy base, through uplifting our owned assets, whilst continuing to strengthen our competitive advantage, and securing third-party hotel management contracts
2. The growth around and beyond the Core, by planting the seeds for global expansion
As we embark on our VISION 2020 Strategic Plan, we will continue to invest in the uplift of our properties, whilst pursuing our geographical expansion, extending our brand presence across the Indian Ocean, China, South East Asia, Europe, Middle East and Africa. Our ambition within the next 3 years is to increase substantially both the number of hotels managed, as well as the key regions where LUX* will be present.
PLANTING THE SEEDS FOR
GLOBAL EXPANSION
EBITDA GREW BY 13% TO REACH
Rs1.3 billion
38
LUX ISLAND RESORTS LTD AND ITS SUBSIDIARIES
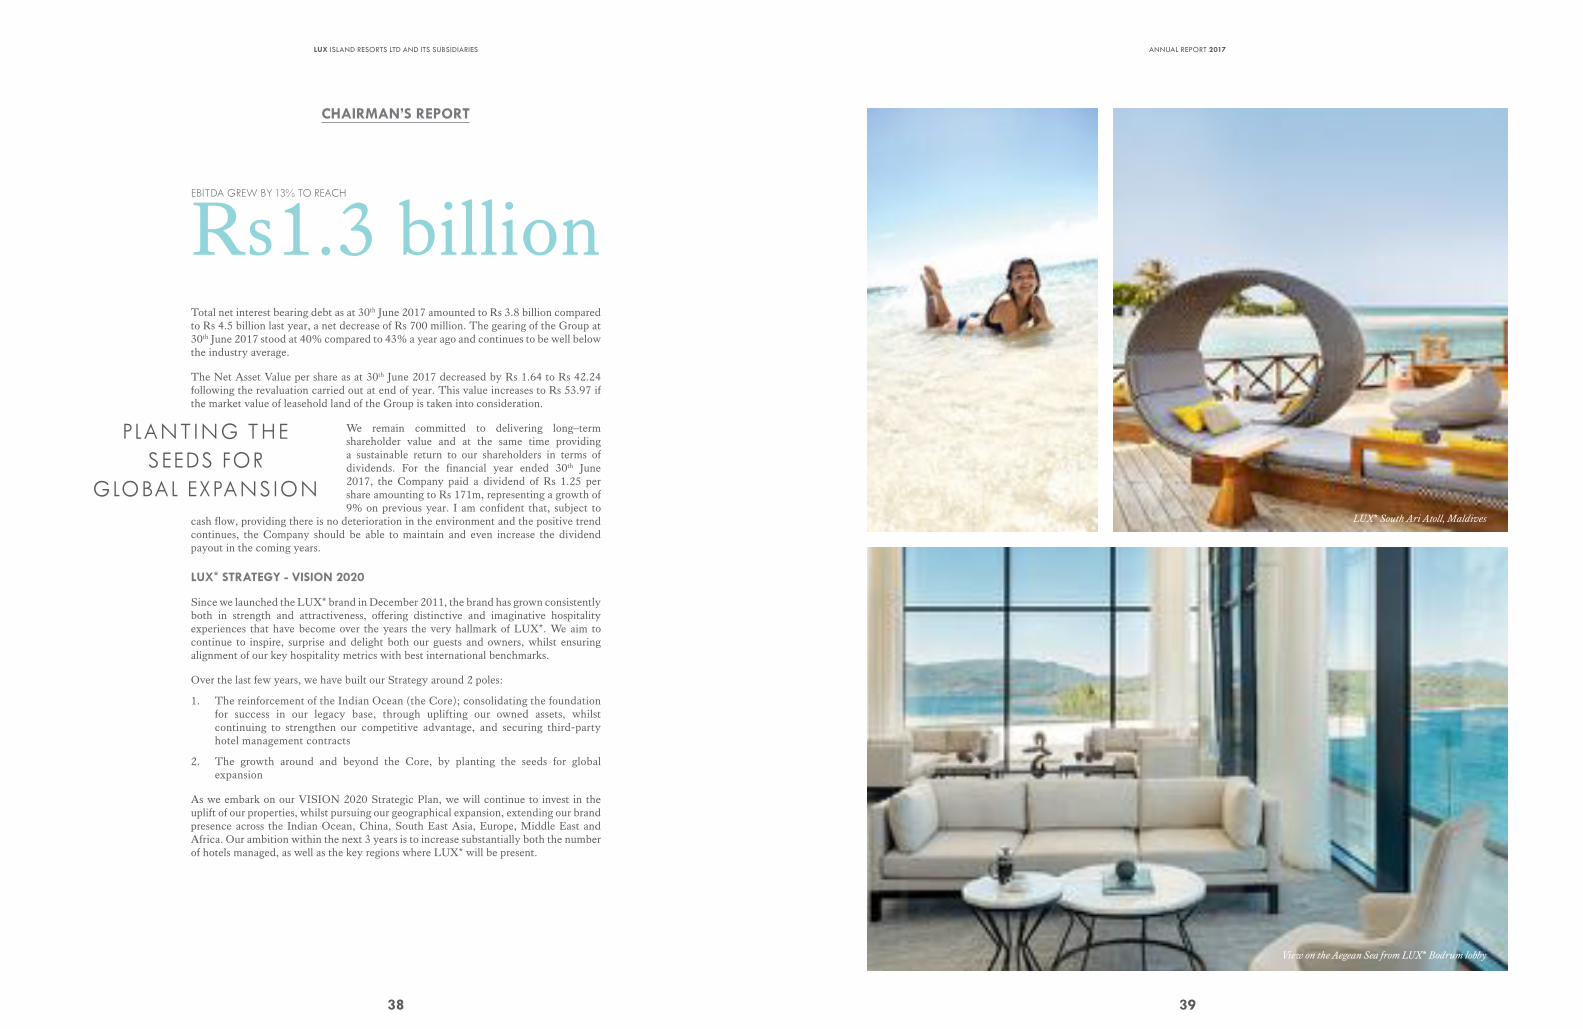
View on the Aegean Sea from LUX* Bodrum lobby
LUX* South Ari Atoll, Maldives
39
ANNUAL REPORT 2017
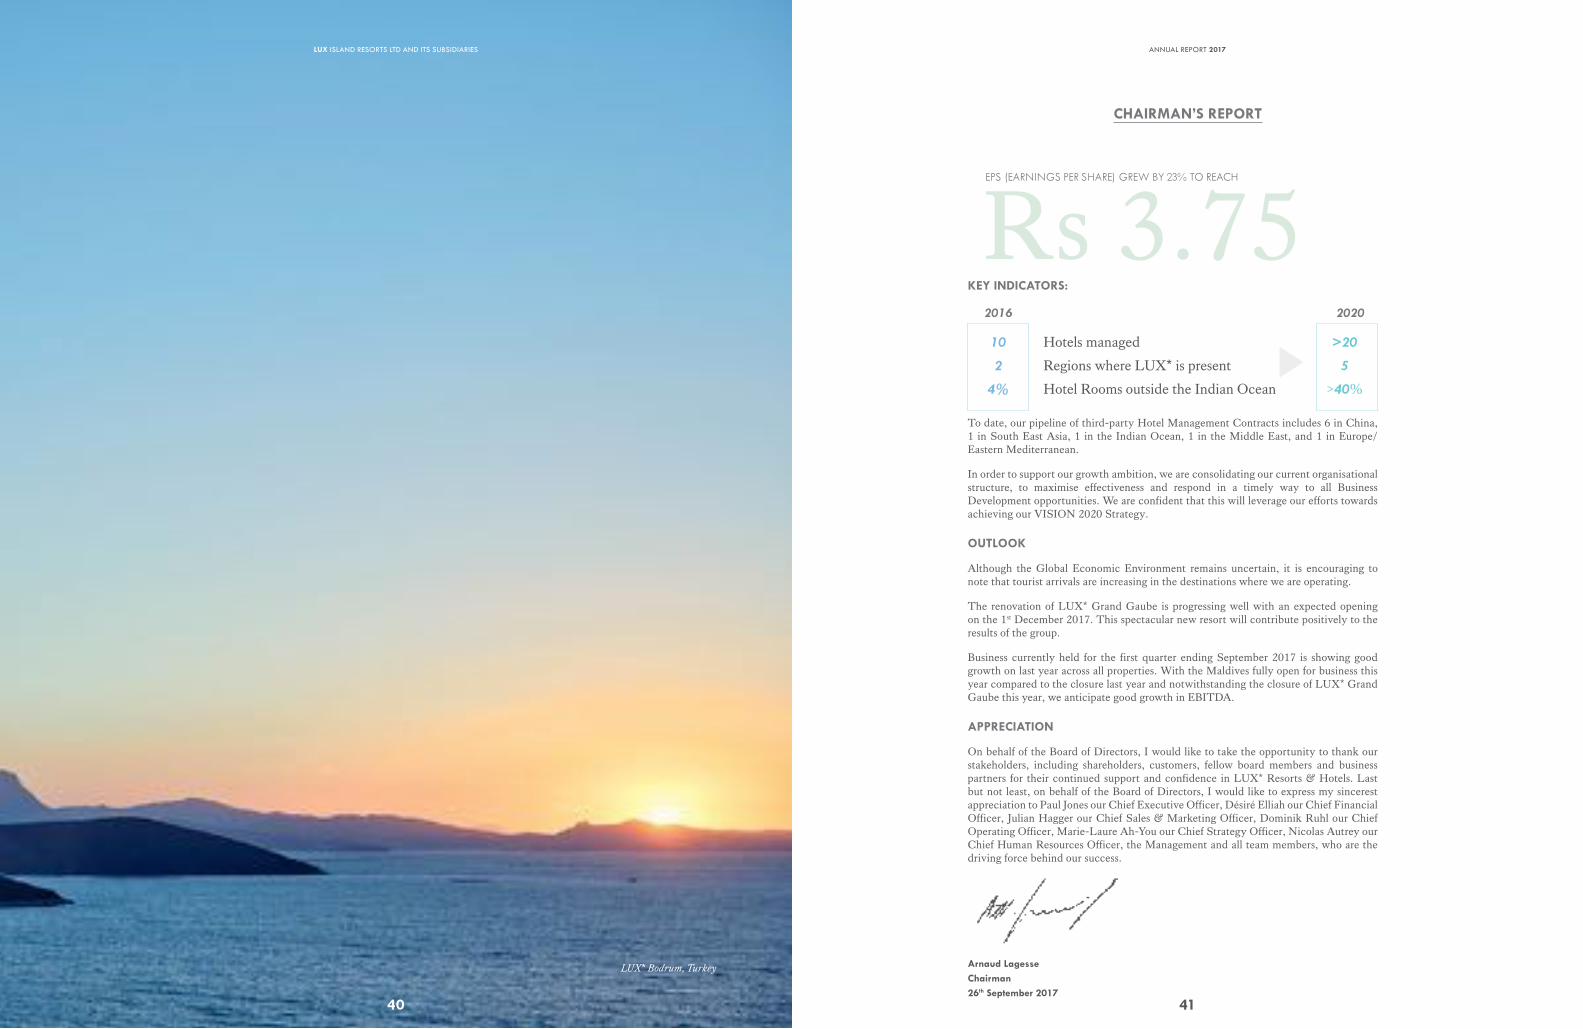
LUX* Bodrum, Turkey
40
LUX ISLAND RESORTS LTD AND ITS SUBSIDIARIES
KEY INDICATORS:
2016 2020
10 Hotels managed >20
2 Regions where LUX* is present 5
4% Hotel Rooms outside the Indian Ocean >40%
To date, our pipeline of third-party Hotel Management Contracts includes 6 in China, 1 in South East Asia, 1 in the Indian Ocean, 1 in the Middle East, and 1 in Europe/ Eastern Mediterranean.
In order to support our growth ambition, we are consolidating our current organisational structure, to maximise effectiveness and respond in a timely way to all Business Development opportunities. We are confident that this will leverage our efforts towards achieving our VISION 2020 Strategy.
OUTLOOK
Although the Global Economic Environment remains uncertain, it is encouraging to note that tourist arrivals are increasing in the destinations where we are operating.
The renovation of LUX* Grand Gaube is progressing well with an expected opening on the 1st December 2017. This spectacular new resort will contribute positively to the results of the group.
Business currently held for the first quarter ending September 2017 is showing good growth on last year across all properties. With the Maldives fully open for business this year compared to the closure last year and notwithstanding the closure of LUX* Grand Gaube this year, we anticipate good growth in EBITDA.
APPRECIATION
On behalf of the Board of Directors, I would like to take the opportunity to thank our stakeholders, including shareholders, customers, fellow board members and business partners for their continued support and confidence in LUX* Resorts & Hotels. Last but not least, on behalf of the Board of Directors, I would like to express my sincerest appreciation to Paul Jones our Chief Executive Officer, Désiré Elliah our Chief Financial Officer, Julian Hagger our Chief Sales & Marketing Officer, Dominik Ruhl our Chief Operating Officer, Marie-Laure Ah-You our Chief Strategy Officer, Nicolas Autrey our Chief Human Resources Officer, the Management and all team members, who are the driving force behind our success.
Arnaud LagesseChairman 26th September 2017
CHAIRMAN’S REPORT
EPS (EARNINGS PER SHARE) GREW BY 23% TO REACH
Rs 3.75
41
ANNUAL REPORT 2017
42
LUX ISLAND RESORTS LTD AND ITS SUBSIDIARIES
CHIEF EXECUTIVE’S REPORT
Throughout 2017, LUX* Resorts & Hotels consistently pursued its strategic plan, strengthening the foundation for growth in sustainable earnings, while at the same time contributing to the economy, society and environment within Mauritius as well as all the countries where LUX* operates. Amidst yearlong challenges in many of our key markets, we have delivered yet another year of strong financial performance. Despite the closure of LUX* South Ari Atoll and LUX* Grand Gaube for two months due to renovation, reported revenue and EBITDA were Rs 5.4bn and Rs 1.27bn respectively, a growth of 5% and 13% on last year’s turnover and EBITDA. The success story of LUX* Resorts & Hotels continues to be indubitably linked to the initiatives of incredibly innovative people, undoubtedly the bedrock of our success to date. I would like to seize this opportunity to thank each and every one of our team members for their unfailing commitment to continuously live up to the LUX* Vision and Purpose: Making Each Moment Matter & Helping People Celebrate Life.
Tourist arrivals to Mauritius for the financial year ended 30th June 2017 increased by 9% to reach 1,314,622. Arrivals from Europe, our main market, increased by 12% on last year to reach 714,483. Our three main markets in Europe, namely France, UK and Germany, improved by 3%, 10% and 25% respectively. Arrivals from Asia increased by 7% on last year to 211,620 mainly due to the increase in arrivals from India which grew by 14%. Arrivals from China went down by 9% on last year to 78,862. The number of tourist arrivals in Maldives for the financial year ended 30th June 2017 amounted to 1,324,754, a growth of 6% on the corresponding period last year. The Chinese market, which remains the number one source market for the Maldives with 23% of the total number of arrivals, has however decreased by 9% to a total of 308,057.
With regard to Reunion Island, tourist arrivals to the destination increased by 16% on last year to 486,453.
I am pleased to report that three out of four metrics that we use to track performance; namely Occupancy, ADR (Average Daily Rate) Rev PAR (Room Revenue per Available Room) and TrevPar (Total Revenue per Available room) have improved during the year. The only metric that was slightly down on last year, due to the closure of the two properties mentioned above, was Occupancy. In fact, the Group occupancy for the year ended 30th June 2017 went down by 1% point to 80% which is still very high. The ADR (Average Daily Rate) improved by 5% from Rs 7,813 to Rs 8,191 whilst the Group Rev PAR (Room Revenue per Available Room) increased by 4% from Rs 6,335 to Rs 6,580.
Despite the challenges in some markets and unfavourable exchange rates (notably of sterling following the Brexit vote) and the closure of LUX* Grand Gaube for the months of May and June 2017, our hotels in Mauritius delivered good results, posting a record occupancy rate of 85%, up by one percentage point on the previous year, and ADR improved by 6% to Rs 7,316. The increase in occupancy and ADR resulted in an increase of 7% in RevPAR. The turnover of our Mauritius hotels improved by 6% to Rs 3.6 billion whilst operating profit excluding the profit on sale of Tamassa hotel reached Rs 678 million, representing a growth of 4%. The operating margin has been maintained at 19%.
The results of LUX* South Ari Atoll in Maldives were impacted by the closure for two months due to renovation. In addition, the destination experienced increased competition as a result of new hotel openings. Occupancy during the period the hotel was fully operational was 59%, down by eleven percentage points on the previous year and ADR improved by 9% resulting in a drop in RevPAR by 8%. Inevitably, turnover and operating profit both declined, the latter further impacted by a closure cost of Rs 132m.
Our hotel in Reunion Island, LUX* Saint Gilles performed well with an occupancy rate of 78%, up by five percentage points on the previous financial year. ADR increased by 1% resulting in an increase in RevPAR of 10%. Turnover increased by 13% to Rs 655million and the operating profit for the year was Rs 14m compared to a loss of Rs 4m last year.
During the year, an amount of Rs 1.1 bn was capitalised representing the renovation cost of the second phase of LUX* South Ari Atoll and Construction in progress for LUX* Grand Gaube. However, the carrying value of Property, Plant and Equipment was written down by an amount of Rs 476m following the revaluation exercise carried out at end of year as mentioned in the Chairman report. The depreciation charge for the year has inceased by 15m to Rs 442m . The Group also disposed during the year of Tamassa hotel which was classified as ‘assets held for sale’ last year.
TOTAL REVENUE INCREASED BY 5%
GRI 102-6,102-7,102-9
43
ANNUAL REPORT 2017
During the year, the Group generated cash flow from operations for an amount of Rs 1.2bn in excess of 12% on last year. Interest paid by the Group for the year under review amounted to Rs 241m, an increase of Rs 26m compared to last year due to the loans contracted for the renovation of LUX* South Ari Atoll. Loan repayment during the year amounted to Rs 999m which includes the repayment of the loan of Tamassa following the sale of the property. The net increase in cash and cash equivalents amounted to Rs 220m compared to a decrease of Rs 31m last year.
The ratio of net debt to EBITDA which was 7, five years ago, is today at 3. This ratio is very healthy and is among the lowest in the industry.
The strength of our sales, distribution and cutting-edge marketing continues to yield strong results in driving demand and enhancing our brand reputation as an international luxury resort operator of choice.
In order to capture visitor interest and convert it into stays, significant investment has been made in enhancing website content, which now includes 360-degree videos, images and drone videos. To complement this, throughout this year, our guests were invited to try something new. A unique calendar of expert-led workshops has been curated to inspire curious minds – creative artists and leading specialists will be sharing their secrets, all designed to inspire fresh ideas and approaches to life.
We have strengthened our central reservation call services and introduced a dynamic personal online chat service on our website.
Our online booking engine now allows our guests the choice to book their flights, hotel room and other services at the touch of a button from anywhere in the world.
Smile, and the world smiles at you – this is our new feel-good advertising campaign launched this year, which rethinks and defines luxury around the themes of joy, happiness and time devoted to cherished holidays.
The theme of the campaign ‘Smile All The Stay’, reinforces our goal for guests to enjoy genuine joie de vivre through the simple acts of generosity and interaction. It all starts with reconnecting to the moments that mean the most to our guests.
The six advertisements represent the fun, dynamic and unexpected atmosphere and lifestyle of LUX* Resorts & Hotels. The bold, stylish, global campaign running in publications such as Condé Nast Traveller, Tatler, Harper’s Bazaar, Monocle, FT How to Spend It, GQ and Vanity Fair, includes images that convey the simple, fun, light-hearted holiday moments that characterise a LUX* holiday. Complemented by social media initiatives on Facebook, Twitter, WeChat, Weibo and Instagram, the campaign reinforces the brand’s global positioning and mission of ‘helping people celebrate life’ and ‘making each moment matter’.
Innovation and banishing thoughtless patterns are at the heart of LUX* Resorts & Hotels’ initiatives to create a different kind of holiday experience. Our ideology - a Lighter, Brighter way of celebrating life - is reflected in our new and exciting Reasons to Go LUX*, which will be launched with the reopening of the new LUX* Grand Gaube, and strengthens our reputation as a fresh and inspiring hospitality brand (see page 54).
We are launching our LUX* Experience App on the occasion of the launch of LUX* Grand Gaube. This App will enable our guests to customize their stay prior to arrival as well as enroll into our innovative loyalty program. This will facilitate an ongoing relationship with our guests encouraging future booking.
The LUX* brand comes to life each day due to the genuine passion and commitment of our Team Members across all our destinations. Our foundational elements of Vision, Purpose and Values (VPV) are our constant source of inspiration, coupled with the LUX* Shining Personality Standards which make every LUX* Team Member truly unique.
SUSTAINABLE DEVELOPMENT
We also take pride in being a socially and environmentally responsible brand. LUX* now has an established reputation as a business with a firm commitment to sustainability. We strongly believe in sensible resource utilisation and act to the best of our abilities to fully respect and protect the environment.
CHIEF EXECUTIVE’S REPORT
GROWTH IN EBITDA
13%
44
LUX ISLAND RESORTS LTD AND ITS SUBSIDIARIES
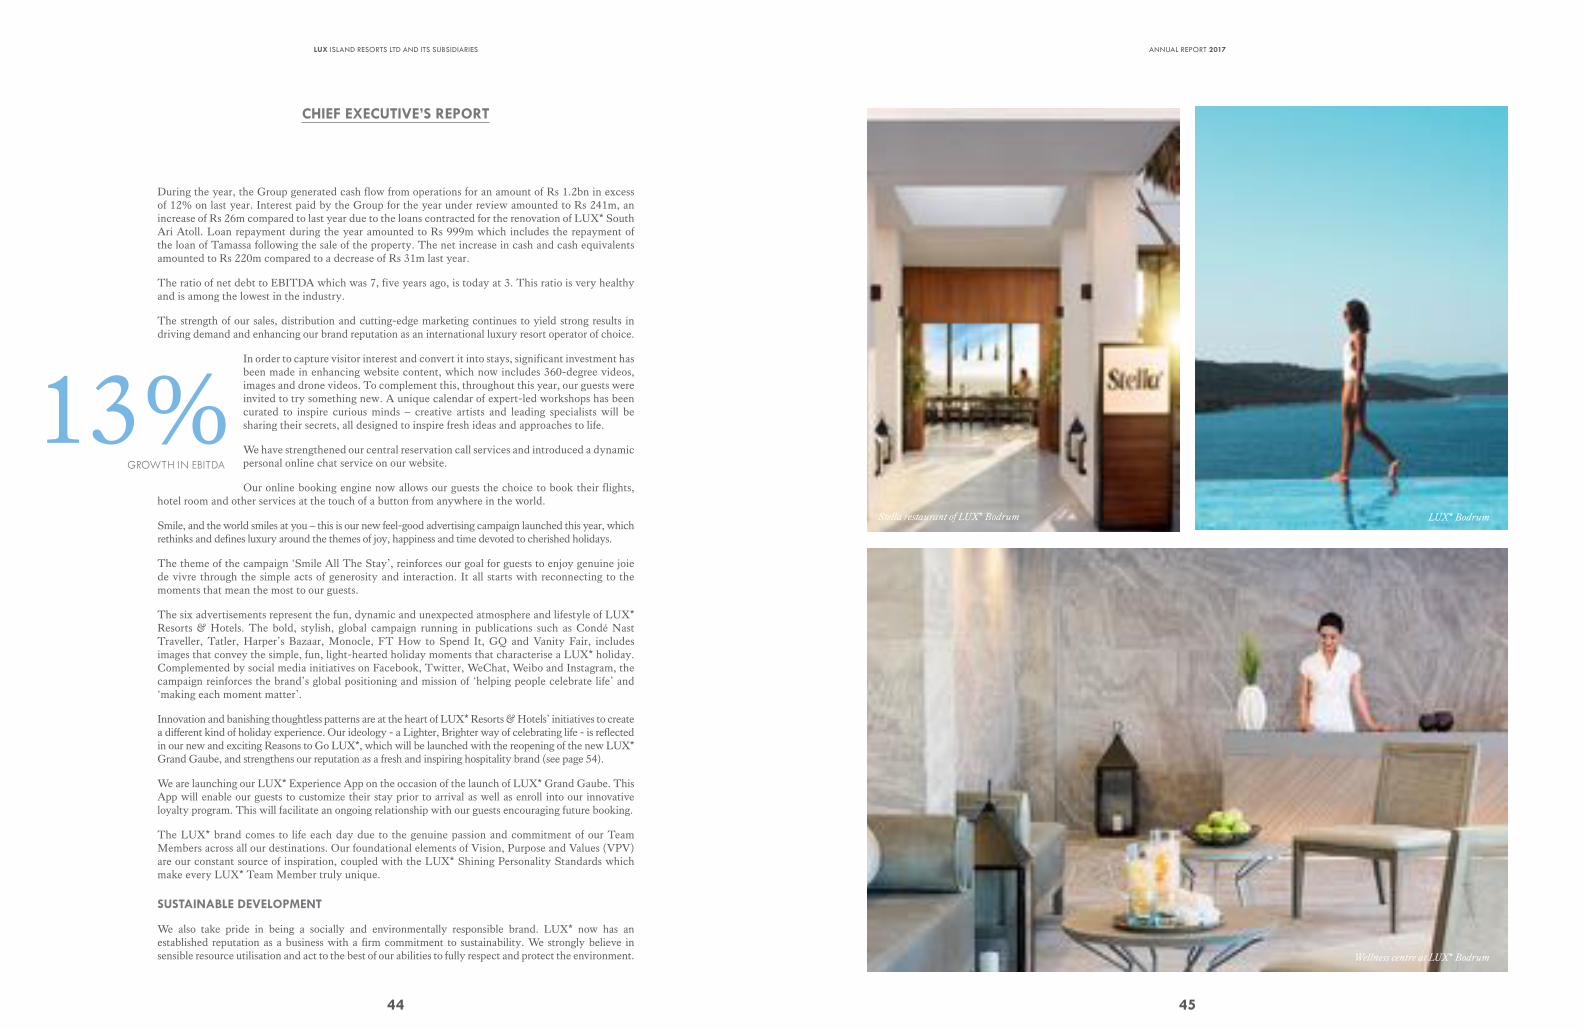
Stella restaurant of LUX* Bodrum
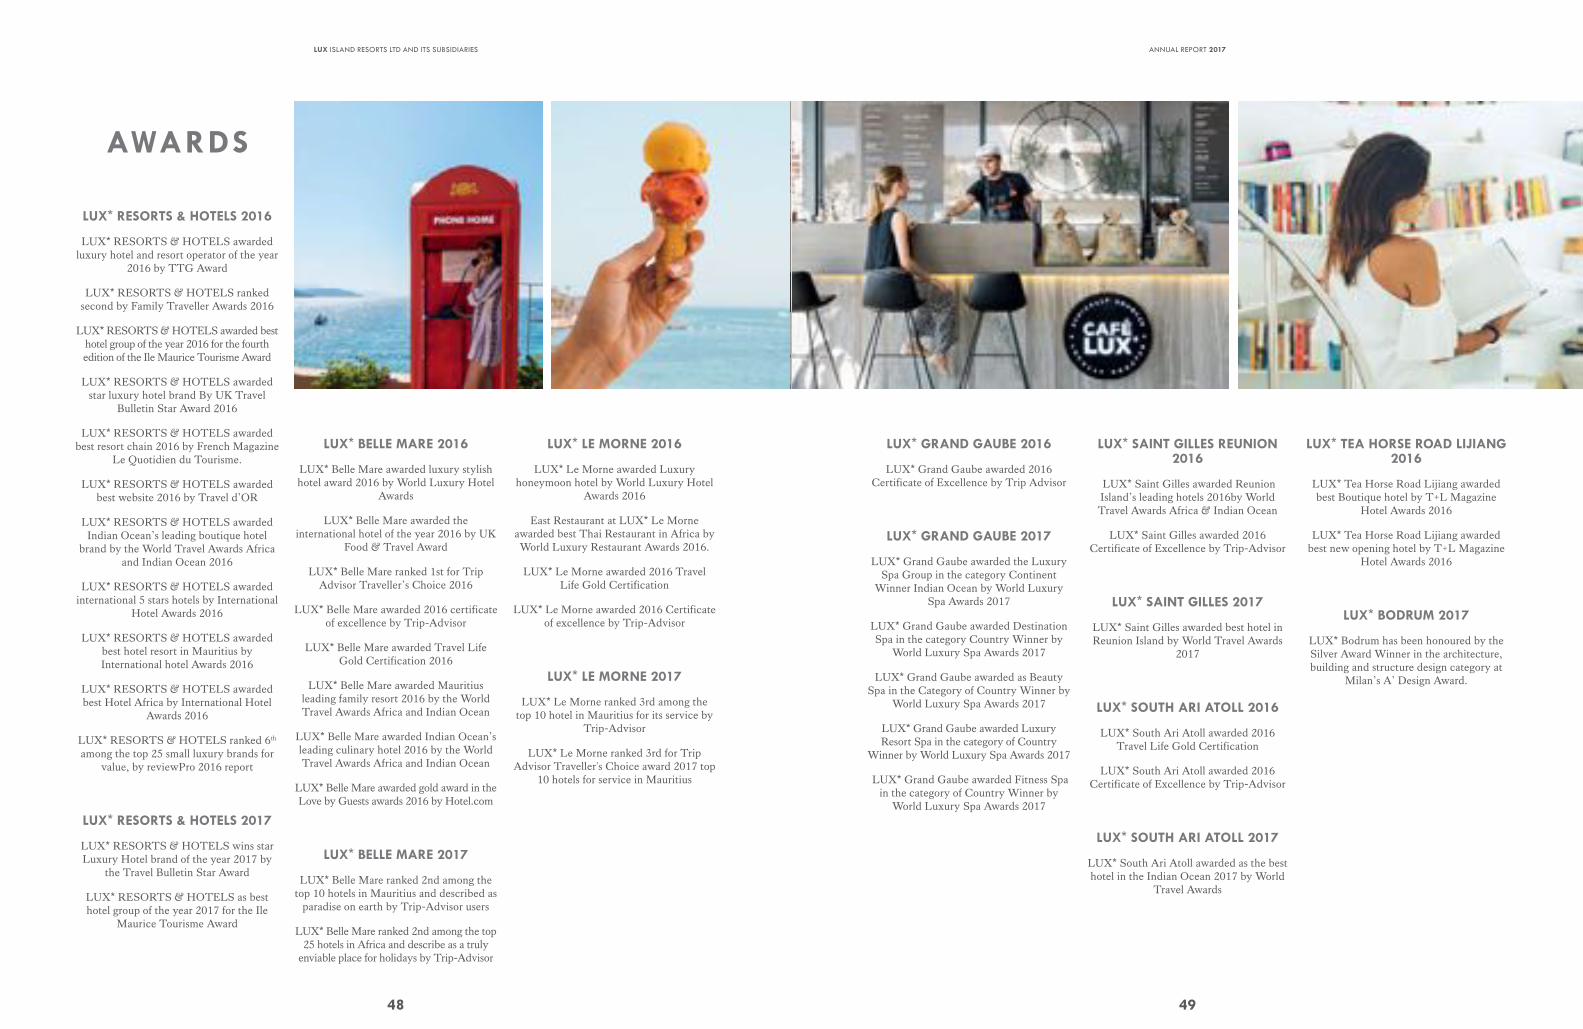
Wellness centre at LUX* Bodrum
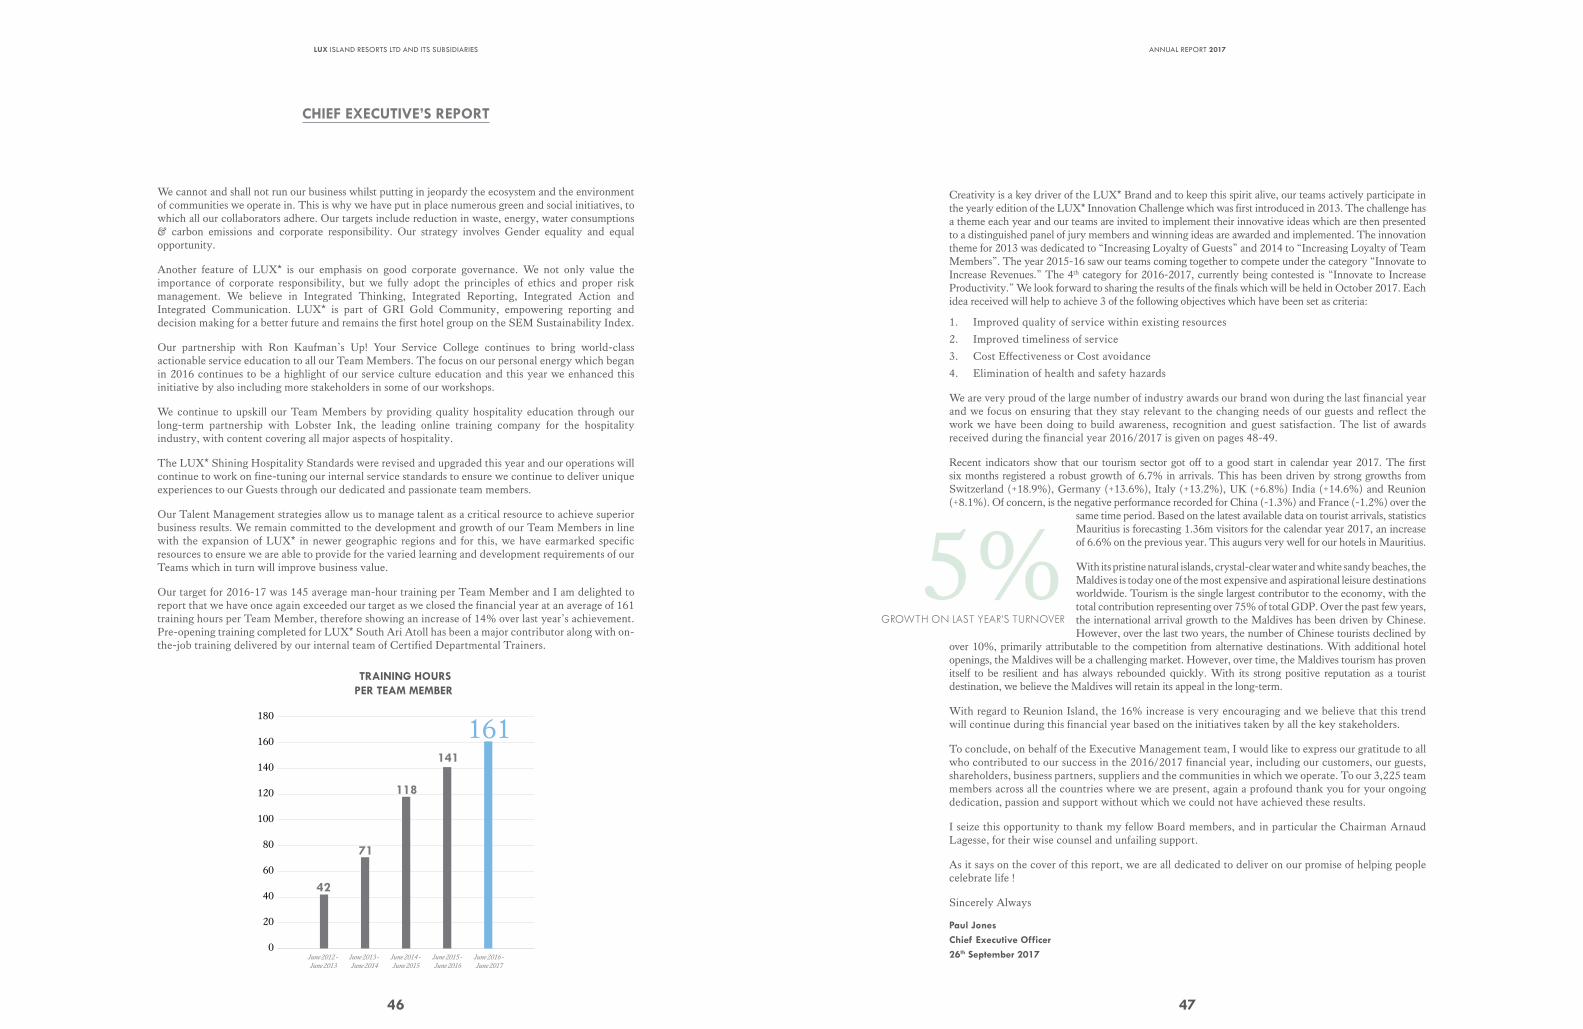
LUX* Bodrum
45
ANNUAL REPORT 2017
We cannot and shall not run our business whilst putting in jeopardy the ecosystem and the environment of communities we operate in. This is why we have put in place numerous green and social initiatives, to which all our collaborators adhere. Our targets include reduction in waste, energy, water consumptions & carbon emissions and corporate responsibility. Our strategy involves Gender equality and equal opportunity.
Another feature of LUX* is our emphasis on good corporate governance. We not only value the importance of corporate responsibility, but we fully adopt the principles of ethics and proper risk management. We believe in Integrated Thinking, Integrated Reporting, Integrated Action and Integrated Communication. LUX* is part of GRI Gold Community, empowering reporting and decision making for a better future and remains the first hotel group on the SEM Sustainability Index.
Our partnership with Ron Kaufman’s Up! Your Service College continues to bring world-class actionable service education to all our Team Members. The focus on our personal energy which began in 2016 continues to be a highlight of our service culture education and this year we enhanced this initiative by also including more stakeholders in some of our workshops.
We continue to upskill our Team Members by providing quality hospitality education through our long-term partnership with Lobster Ink, the leading online training company for the hospitality industry, with content covering all major aspects of hospitality.
The LUX* Shining Hospitality Standards were revised and upgraded this year and our operations will continue to work on fine-tuning our internal service standards to ensure we continue to deliver unique experiences to our Guests through our dedicated and passionate team members.
Our Talent Management strategies allow us to manage talent as a critical resource to achieve superior business results. We remain committed to the development and growth of our Team Members in line with the expansion of LUX* in newer geographic regions and for this, we have earmarked specific resources to ensure we are able to provide for the varied learning and development requirements of our Teams which in turn will improve business value.
Our target for 2016-17 was 145 average man-hour training per Team Member and I am delighted to report that we have once again exceeded our target as we closed the financial year at an average of 161 training hours per Team Member, therefore showing an increase of 14% over last year’s achievement. Pre-opening training completed for LUX* South Ari Atoll has been a major contributor along with on-the-job training delivered by our internal team of Certified Departmental Trainers.
0
20
40
60
80
100
120
140
160
180
June 2015 -
June 2016
June 2016 -
June 2017
June 2014 -
June 2015
June 2012 -
June 2013
June 2013 -
June 2014
118
141
161
71
42
TRAINING HOURS PER TEAM MEMBER
CHIEF EXECUTIVE’S REPORT
46
LUX ISLAND RESORTS LTD AND ITS SUBSIDIARIES
Creativity is a key driver of the LUX* Brand and to keep this spirit alive, our teams actively participate in the yearly edition of the LUX* Innovation Challenge which was first introduced in 2013. The challenge has a theme each year and our teams are invited to implement their innovative ideas which are then presented to a distinguished panel of jury members and winning ideas are awarded and implemented. The innovation theme for 2013 was dedicated to “Increasing Loyalty of Guests” and 2014 to “Increasing Loyalty of Team Members”. The year 2015-16 saw our teams coming together to compete under the category “Innovate to Increase Revenues.” The 4th category for 2016-2017, currently being contested is “Innovate to Increase Productivity.” We look forward to sharing the results of the finals which will be held in October 2017. Each idea received will help to achieve 3 of the following objectives which have been set as criteria:
1. Improved quality of service within existing resources
2. Improved timeliness of service
3. Cost Effectiveness or Cost avoidance
4. Elimination of health and safety hazards
We are very proud of the large number of industry awards our brand won during the last financial year and we focus on ensuring that they stay relevant to the changing needs of our guests and reflect the work we have been doing to build awareness, recognition and guest satisfaction. The list of awards received during the financial year 2016/2017 is given on pages 48-49.
Recent indicators show that our tourism sector got off to a good start in calendar year 2017. The first six months registered a robust growth of 6.7% in arrivals. This has been driven by strong growths from Switzerland (+18.9%), Germany (+13.6%), Italy (+13.2%), UK (+6.8%) India (+14.6%) and Reunion (+8.1%). Of concern, is the negative performance recorded for China (-1.3%) and France (-1.2%) over the
same time period. Based on the latest available data on tourist arrivals, statistics Mauritius is forecasting 1.36m visitors for the calendar year 2017, an increase of 6.6% on the previous year. This augurs very well for our hotels in Mauritius.
With its pristine natural islands, crystal-clear water and white sandy beaches, the Maldives is today one of the most expensive and aspirational leisure destinations worldwide. Tourism is the single largest contributor to the economy, with the total contribution representing over 75% of total GDP. Over the past few years, the international arrival growth to the Maldives has been driven by Chinese. However, over the last two years, the number of Chinese tourists declined by
over 10%, primarily attributable to the competition from alternative destinations. With additional hotel openings, the Maldives will be a challenging market. However, over time, the Maldives tourism has proven itself to be resilient and has always rebounded quickly. With its strong positive reputation as a tourist destination, we believe the Maldives will retain its appeal in the long-term.
With regard to Reunion Island, the 16% increase is very encouraging and we believe that this trend will continue during this financial year based on the initiatives taken by all the key stakeholders.
To conclude, on behalf of the Executive Management team, I would like to express our gratitude to all who contributed to our success in the 2016/2017 financial year, including our customers, our guests, shareholders, business partners, suppliers and the communities in which we operate. To our 3,225 team members across all the countries where we are present, again a profound thank you for your ongoing dedication, passion and support without which we could not have achieved these results.
I seize this opportunity to thank my fellow Board members, and in particular the Chairman Arnaud Lagesse, for their wise counsel and unfailing support.
As it says on the cover of this report, we are all dedicated to deliver on our promise of helping people celebrate life !
Sincerely Always
Paul JonesChief Executive Officer26th September 2017
GROWTH ON LAST YEAR’S TURNOVER
5%
47
ANNUAL REPORT 2017
LUX* RESORTS & HOTELS 2016
LUX* RESORTS & HOTELS awarded luxury hotel and resort operator of the year
2016 by TTG Award
LUX* RESORTS & HOTELS ranked second by Family Traveller Awards 2016
LUX* RESORTS & HOTELS awarded best hotel group of the year 2016 for the fourth edition of the Ile Maurice Tourisme Award
LUX* RESORTS & HOTELS awarded star luxury hotel brand By UK Travel
Bulletin Star Award 2016
LUX* RESORTS & HOTELS awarded best resort chain 2016 by French Magazine
Le Quotidien du Tourisme.
LUX* RESORTS & HOTELS awarded best website 2016 by Travel d’OR
LUX* RESORTS & HOTELS awarded Indian Ocean’s leading boutique hotel
brand by the World Travel Awards Africa and Indian Ocean 2016
LUX* RESORTS & HOTELS awarded international 5 stars hotels by International
Hotel Awards 2016
LUX* RESORTS & HOTELS awarded best hotel resort in Mauritius by International hotel Awards 2016
LUX* RESORTS & HOTELS awarded best Hotel Africa by International Hotel
Awards 2016
LUX* RESORTS & HOTELS ranked 6th among the top 25 small luxury brands for
value, by reviewPro 2016 report
LUX* RESORTS & HOTELS 2017
LUX* RESORTS & HOTELS wins star Luxury Hotel brand of the year 2017 by
the Travel Bulletin Star Award
LUX* RESORTS & HOTELS as best hotel group of the year 2017 for the Ile
Maurice Tourisme Award
AWARDS
LUX* BELLE MARE 2016
LUX* Belle Mare awarded luxury stylish hotel award 2016 by World Luxury Hotel
Awards
LUX* Belle Mare awarded the international hotel of the year 2016 by UK
Food & Travel Award
LUX* Belle Mare ranked 1st for Trip Advisor Traveller’s Choice 2016
LUX* Belle Mare awarded 2016 certificate of excellence by Trip-Advisor
LUX* Belle Mare awarded Travel Life Gold Certification 2016
LUX* Belle Mare awarded Mauritius leading family resort 2016 by the World Travel Awards Africa and Indian Ocean
LUX* Belle Mare awarded Indian Ocean’s leading culinary hotel 2016 by the World Travel Awards Africa and Indian Ocean
LUX* Belle Mare awarded gold award in the Love by Guests awards 2016 by Hotel.com
LUX* BELLE MARE 2017
LUX* Belle Mare ranked 2nd among the top 10 hotels in Mauritius and described as
paradise on earth by Trip-Advisor users
LUX* Belle Mare ranked 2nd among the top 25 hotels in Africa and describe as a truly
enviable place for holidays by Trip-Advisor
LUX* LE MORNE 2016
LUX* Le Morne awarded Luxury honeymoon hotel by World Luxury Hotel
Awards 2016
East Restaurant at LUX* Le Morne awarded best Thai Restaurant in Africa by World Luxury Restaurant Awards 2016.
LUX* Le Morne awarded 2016 Travel Life Gold Certification
LUX* Le Morne awarded 2016 Certificate of excellence by Trip-Advisor
LUX* LE MORNE 2017
LUX* Le Morne ranked 3rd among the top 10 hotel in Mauritius for its service by
Trip-Advisor
LUX* Le Morne ranked 3rd for Trip Advisor Traveller's Choice award 2017 top
10 hotels for service in Mauritius
48
LUX ISLAND RESORTS LTD AND ITS SUBSIDIARIES
LUX* GRAND GAUBE 2016
LUX* Grand Gaube awarded 2016 Certificate of Excellence by Trip Advisor
LUX* GRAND GAUBE 2017
LUX* Grand Gaube awarded the Luxury Spa Group in the category Continent
Winner Indian Ocean by World Luxury Spa Awards 2017
LUX* Grand Gaube awarded Destination Spa in the category Country Winner by
World Luxury Spa Awards 2017
LUX* Grand Gaube awarded as Beauty Spa in the Category of Country Winner by
World Luxury Spa Awards 2017
LUX* Grand Gaube awarded Luxury Resort Spa in the category of Country
Winner by World Luxury Spa Awards 2017
LUX* Grand Gaube awarded Fitness Spa in the category of Country Winner by
World Luxury Spa Awards 2017
LUX* SAINT GILLES REUNION 2016
LUX* Saint Gilles awarded Reunion Island’s leading hotels 2016by World Travel Awards Africa & Indian Ocean
LUX* Saint Gilles awarded 2016 Certificate of Excellence by Trip-Advisor
LUX* SAINT GILLES 2017
LUX* Saint Gilles awarded best hotel in Reunion Island by World Travel Awards
2017
LUX* SOUTH ARI ATOLL 2016
LUX* South Ari Atoll awarded 2016 Travel Life Gold Certification
LUX* South Ari Atoll awarded 2016 Certificate of Excellence by Trip-Advisor
LUX* SOUTH ARI ATOLL 2017
LUX* South Ari Atoll awarded as the best hotel in the Indian Ocean 2017 by World
Travel Awards
LUX* TEA HORSE ROAD LIJIANG 2016
LUX* Tea Horse Road Lijiang awarded best Boutique hotel by T+L Magazine
Hotel Awards 2016
LUX* Tea Horse Road Lijiang awarded best new opening hotel by T+L Magazine
Hotel Awards 2016
LUX* BODRUM 2017
LUX* Bodrum has been honoured by the Silver Award Winner in the architecture, building and structure design category at
Milan’s A’ Design Award.
49
ANNUAL REPORT 2017

At LUX*, we take pride in striving to make each moment matter for our guests
50
LUX ISLAND RESORTS LTD AND ITS SUBSIDIARIES
51
ANNUAL REPORT 2017

What's new AT LUX*
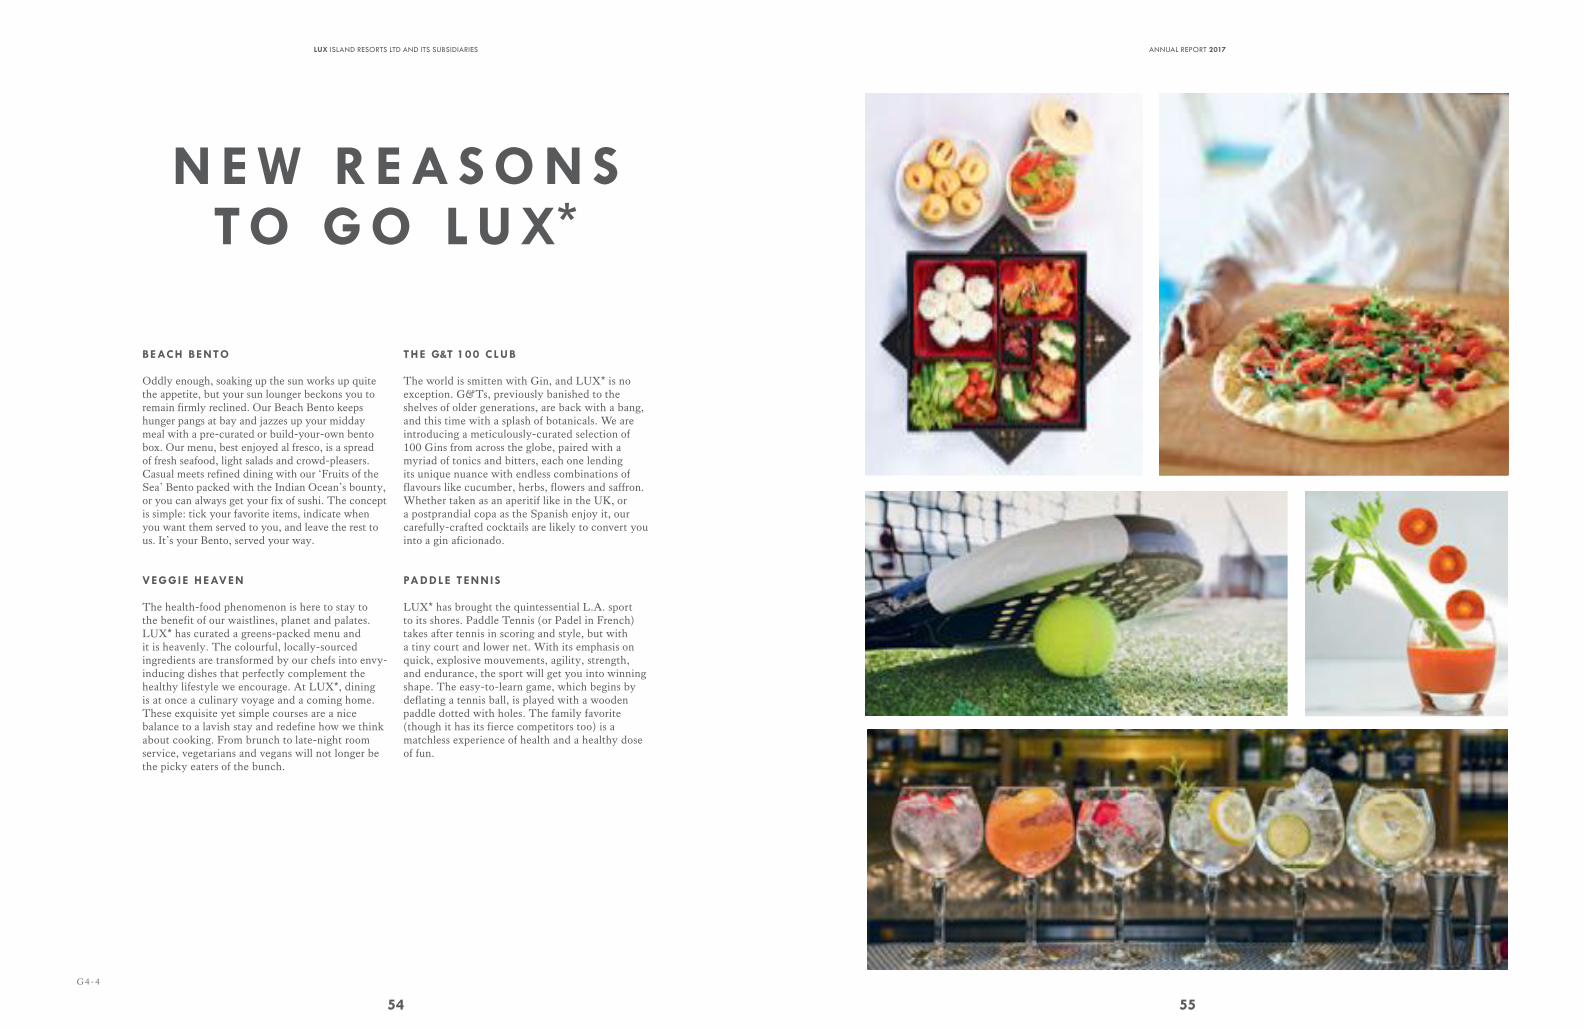
N E W R E A S O N S TO G O LU X*
G4-4
BEACH BENTO
Oddly enough, soaking up the sun works up quite the appetite, but your sun lounger beckons you to remain firmly reclined. Our Beach Bento keeps hunger pangs at bay and jazzes up your midday meal with a pre-curated or build-your-own bento box. Our menu, best enjoyed al fresco, is a spread of fresh seafood, light salads and crowd-pleasers. Casual meets refined dining with our ‘Fruits of the Sea’ Bento packed with the Indian Ocean’s bounty, or you can always get your fix of sushi. The concept is simple: tick your favorite items, indicate when you want them served to you, and leave the rest to us. It’s your Bento, served your way.
VEGGIE HEAVEN
The health-food phenomenon is here to stay to the benefit of our waistlines, planet and palates. LUX* has curated a greens-packed menu and it is heavenly. The colourful, locally-sourced ingredients are transformed by our chefs into envy-inducing dishes that perfectly complement the healthy lifestyle we encourage. At LUX*, dining is at once a culinary voyage and a coming home. These exquisite yet simple courses are a nice balance to a lavish stay and redefine how we think about cooking. From brunch to late-night room service, vegetarians and vegans will not longer be the picky eaters of the bunch.
THE G&T 100 CLUB
The world is smitten with Gin, and LUX* is no exception. G&Ts, previously banished to the shelves of older generations, are back with a bang, and this time with a splash of botanicals. We are introducing a meticulously-curated selection of 100 Gins from across the globe, paired with a myriad of tonics and bitters, each one lending its unique nuance with endless combinations of flavours like cucumber, herbs, flowers and saffron. Whether taken as an aperitif like in the UK, or a postprandial copa as the Spanish enjoy it, our carefully-crafted cocktails are likely to convert you into a gin aficionado.
PADDLE TENNIS
LUX* has brought the quintessential L.A. sport to its shores. Paddle Tennis (or Padel in French) takes after tennis in scoring and style, but with a tiny court and lower net. With its emphasis on quick, explosive mouvements, agility, strength, and endurance, the sport will get you into winning shape. The easy-to-learn game, which begins by deflating a tennis ball, is played with a wooden paddle dotted with holes. The family favorite (though it has its fierce competitors too) is a matchless experience of health and a healthy dose of fun.
54
LUX ISLAND RESORTS LTD AND ITS SUBSIDIARIES
55
ANNUAL REPORT 2017
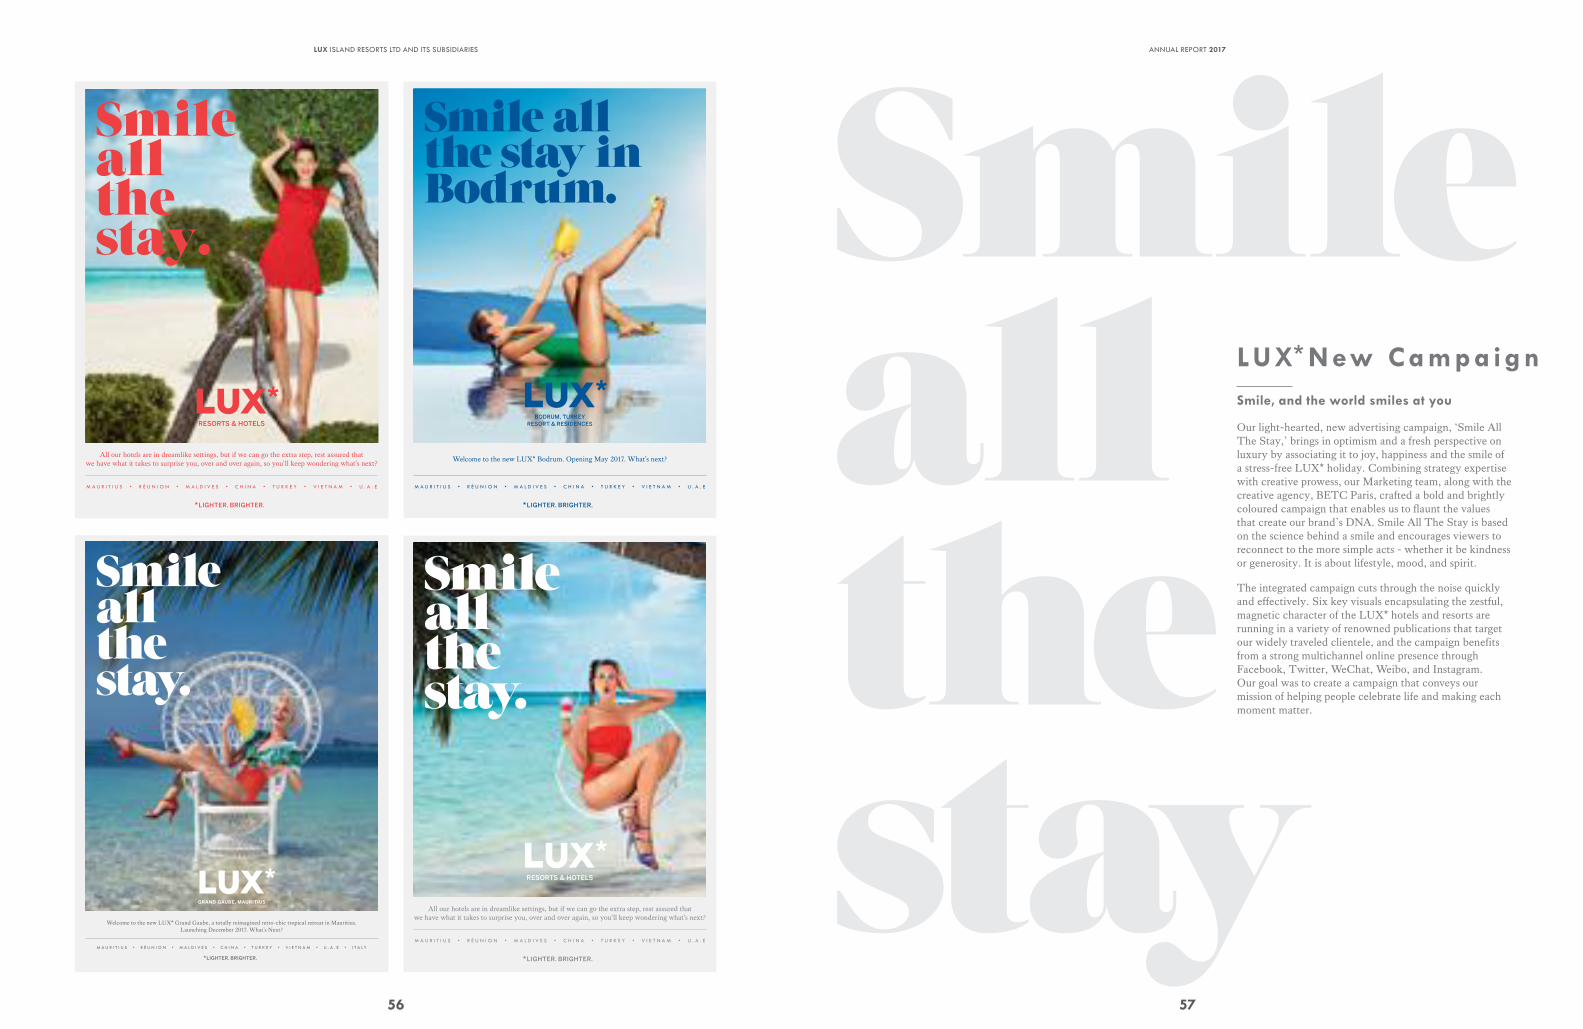
Smileallthe stay.
M A U R I T I U S • R É U N I O N • M A L D I V E S • C H I N A • T U R K E Y • V I E T N A M • U . A . E
All our hotels are in dreamlike settings, but if we can go the extra step, rest assured that
we have what it takes to surprise you, over and over again, so you’ll keep wondering what’s next?
LUX_EASELS_CAMPAIGN2017_UPD_02022017_0933.indd 4 02/02/2017 10:49
Smile all the stay in Bodrum.
M A U R I T I U S • R É U N I O N • M A L D I V E S • C H I N A • T U R K E Y • V I E T N A M • U . A . E
Welcome to the new LUX* Bodrum. Opening May 2017. What’s next?
LUX_EASELS_CAMPAIGN2017_UPD_02022017_0933.indd 1 02/02/2017 10:49
Smileallthe stay.
M A U R I T I U S • R É U N I O N • M A L D I V E S • C H I N A • T U R K E Y • V I E T N A M • U . A . E
All our hotels are in dreamlike settings, but if we can go the extra step, rest assured that
we have what it takes to surprise you, over and over again, so you’ll keep wondering what’s next?
LUX_EASELS_CAMPAIGN2017_UPD_02022017_0933.indd 3 02/02/2017 10:49
M A U R I T I U S • R É U N I O N • M A L D I V E S • C H I N A • T U R K E Y • V I E T N A M • U . A . E • I T A L Y
Smileallthe stay.
Welcome to the new LUX* Grand Gaube, a totally reimagined retro-chic tropical retreat in Mauritius. Launching December 2017. What’s Next?
56
LUX ISLAND RESORTS LTD AND ITS SUBSIDIARIES
Smileall thestay
LUX*N ew C amp a ignSmile, and the world smiles at you
Our light-hearted, new advertising campaign, ‘Smile All The Stay,’ brings in optimism and a fresh perspective on luxury by associating it to joy, happiness and the smile of a stress-free LUX* holiday. Combining strategy expertise with creative prowess, our Marketing team, along with the creative agency, BETC Paris, crafted a bold and brightly coloured campaign that enables us to flaunt the values that create our brand’s DNA. Smile All The Stay is based on the science behind a smile and encourages viewers to reconnect to the more simple acts - whether it be kindness or generosity. It is about lifestyle, mood, and spirit.
The integrated campaign cuts through the noise quickly and effectively. Six key visuals encapsulating the zestful, magnetic character of the LUX* hotels and resorts are running in a variety of renowned publications that target our widely traveled clientele, and the campaign benefits from a strong multichannel online presence through Facebook, Twitter, WeChat, Weibo, and Instagram. Our goal was to create a campaign that conveys our mission of helping people celebrate life and making each moment matter.
57
ANNUAL REPORT 2017

NEW OPENINGS
Spreading the light
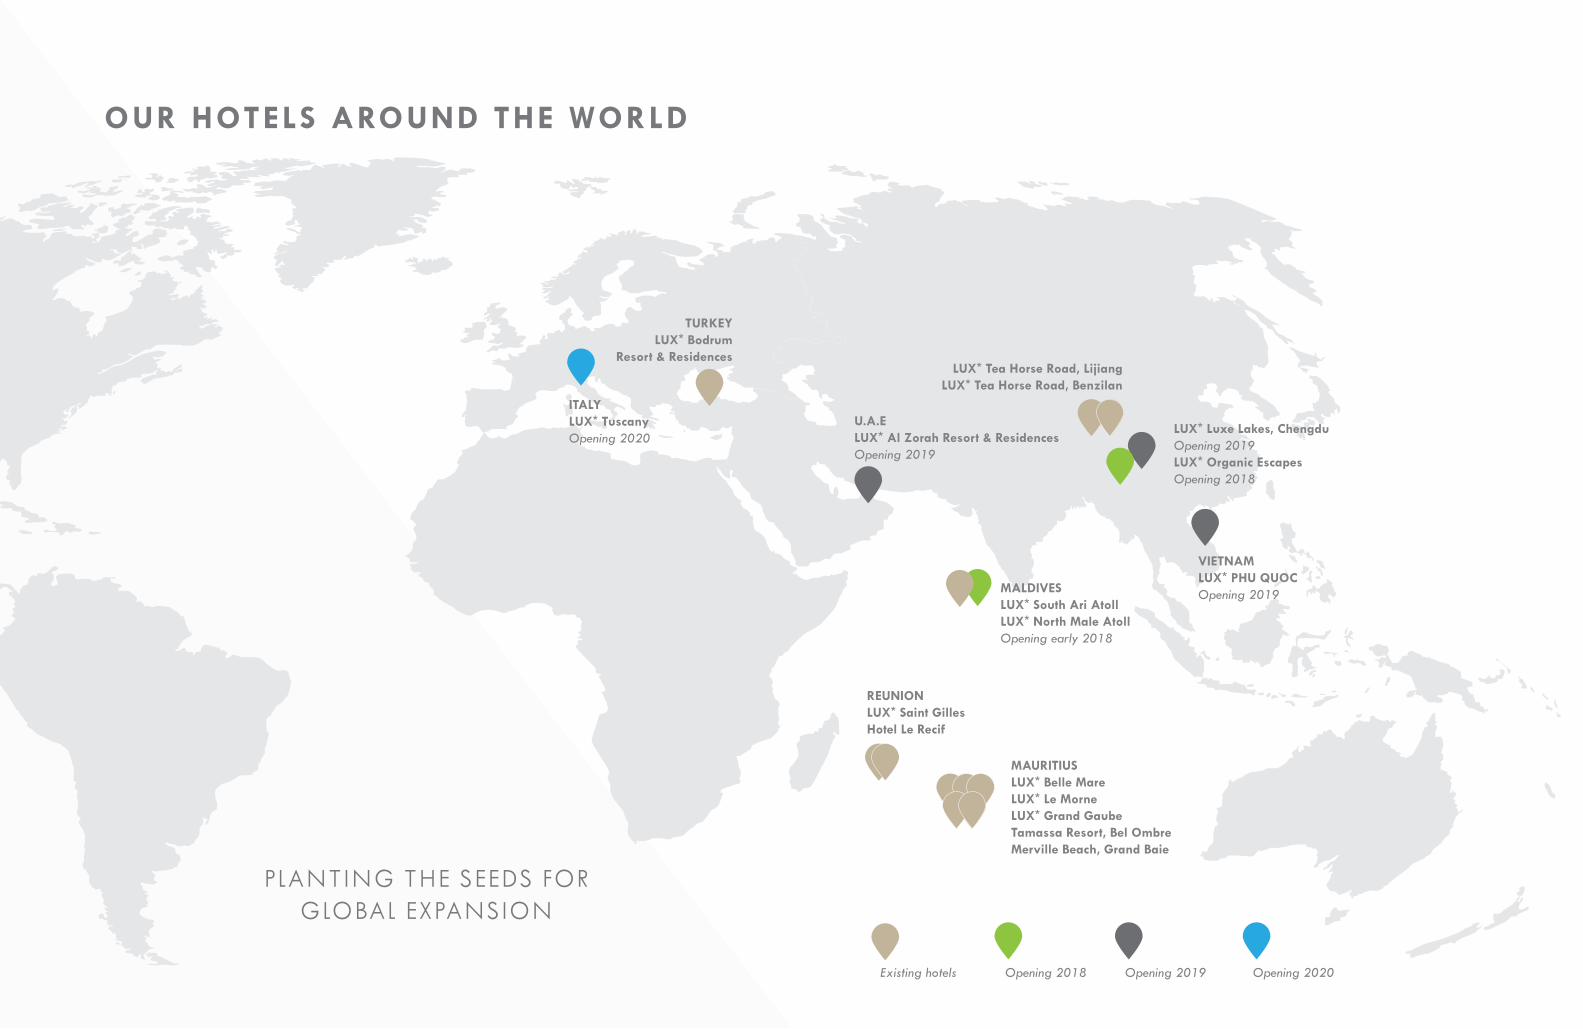
OUR HOTELS AROUND THE WORLD
MAURITIUSLUX* Belle MareLUX* Le MorneLUX* Grand GaubeTamassa Resort, Bel OmbreMerville Beach, Grand Baie
LUX* Tea Horse Road, LijiangLUX* Tea Horse Road, Benzilan
REUNIONLUX* Saint GillesHotel Le Recif
MALDIVESLUX* South Ari Atoll LUX* North Male AtollOpening early 2018
VIETNAMLUX* PHU QUOCOpening 2019
ITALYLUX* TuscanyOpening 2020
U.A.ELUX* Al Zorah Resort & ResidencesOpening 2019
TURKEYLUX* Bodrum
Resort & Residences
Opening 2018 Existing hotels Opening 2019 Opening 2020
LUX* Luxe Lakes, ChengduOpening 2019
LUX* Organic EscapesOpening 2018
PLANTING THE SEEDS FOR GLOBAL EXPANSION
MAURITIUSLUX* Belle MareLUX* Le MorneLUX* Grand GaubeTamassa Resort, Bel OmbreMerville Beach, Grand Baie
LUX* Tea Horse Road, LijiangLUX* Tea Horse Road, Benzilan
REUNIONLUX* Saint GillesHotel Le Recif
MALDIVESLUX* South Ari Atoll LUX* North Male AtollOpening early 2018
VIETNAMLUX* PHU QUOCOpening 2019
ITALYLUX* TuscanyOpening 2020
U.A.ELUX* Al Zorah Resort & ResidencesOpening 2019
TURKEYLUX* Bodrum
Resort & Residences
Opening 2018 Existing hotels Opening 2019 Opening 2020
LUX* Luxe Lakes, ChengduOpening 2019
LUX* Organic EscapesOpening 2018

GRI 102-2
62
LUX ISLAND RESORTS LTD AND ITS SUBSIDIARIES
C H I NA
Where old-meets-new
LUX* Tea Horse Road Lijiang, Yunnan Province, China
LUX* Tea Horse Road Benzilan, Yunnan Province, China
NEW OPENINGS
LUX* Organic Escapes Chengdu, China (2018)
LUX* Luxe Lakes, Chengdu, China (2019)
A storied past. Ancient customs. Rivers. Temples and palaces. Great city walls. A bold new architectural aesthetic. Bargains. Hutong. Where the traditional continues to influence the new. Sprawling metropolis. Watertowns. Pine-shaded hills. Forested mountains. Rolling hills. Tempting dishes. Unexpected charms. Grandeur
and opulence. Peaceful riverbanks. Welcome to China, where the remnants of great civilizations blend in with the new.
63
ANNUAL REPORT 2017
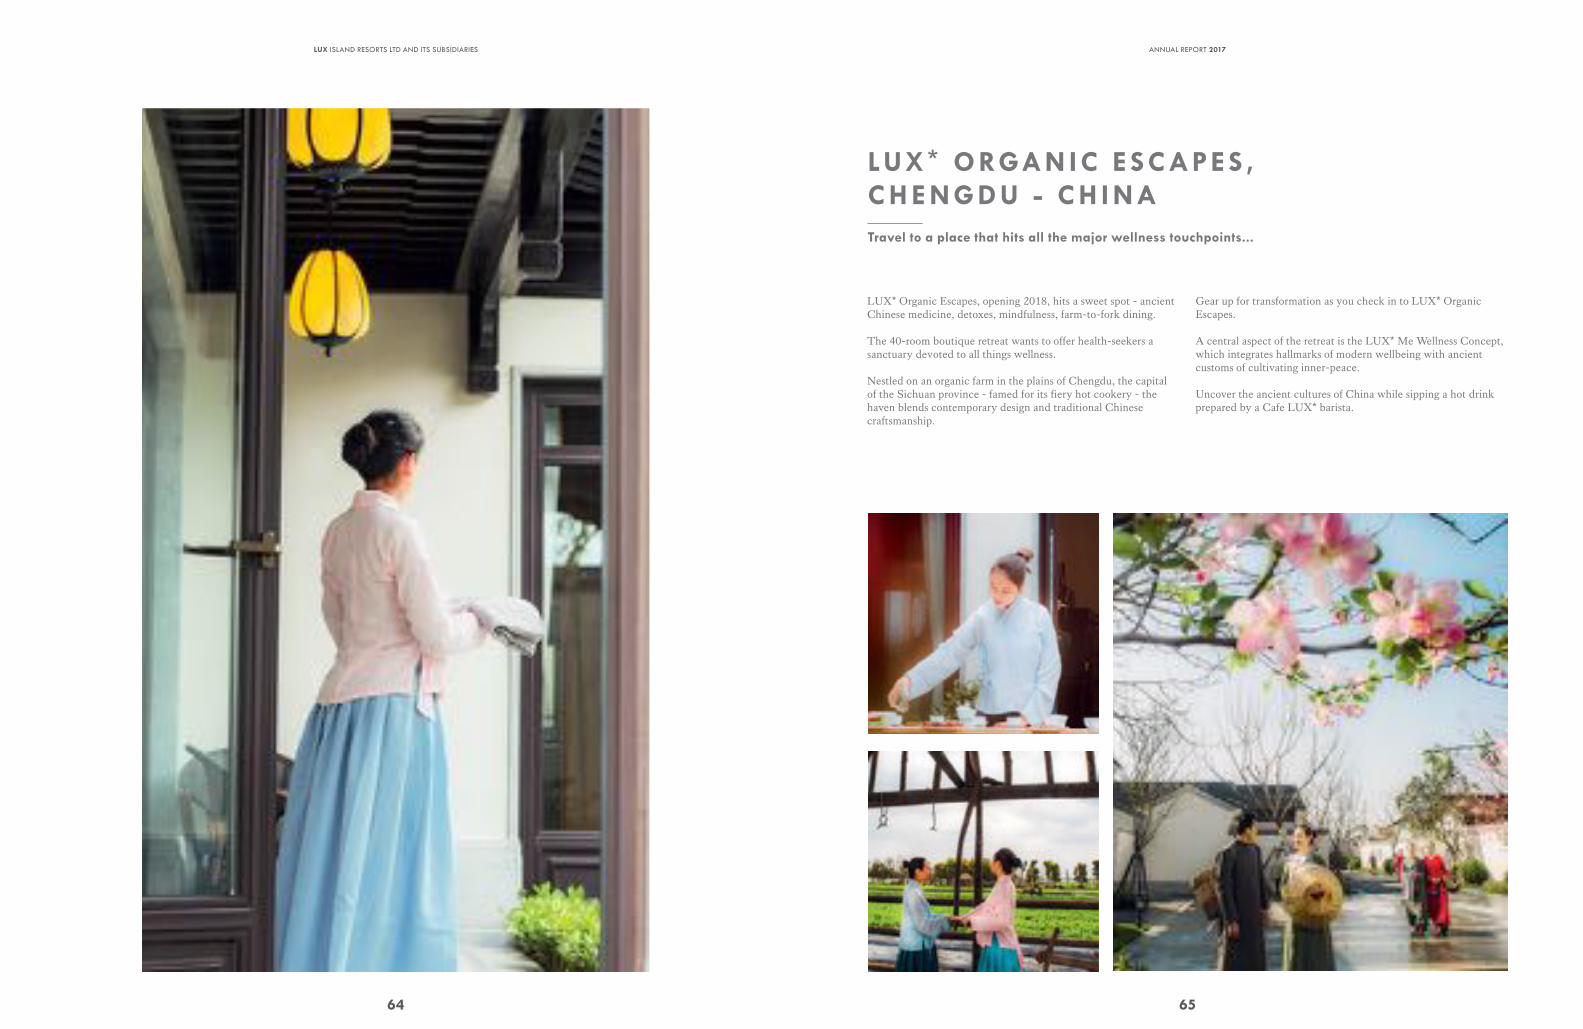
64
LUX ISLAND RESORTS LTD AND ITS SUBSIDIARIES
LUX * ORGAN IC E SCAPE S ,C H E N GDU - C H I NATravel to a place that hits all the major wellness touchpoints...
LUX* Organic Escapes, opening 2018, hits a sweet spot - ancient Chinese medicine, detoxes, mindfulness, farm-to-fork dining.
The 40-room boutique retreat wants to offer health-seekers a sanctuary devoted to all things wellness.
Nestled on an organic farm in the plains of Chengdu, the capital of the Sichuan province - famed for its fiery hot cookery - the haven blends contemporary design and traditional Chinese craftsmanship.
Gear up for transformation as you check in to LUX* Organic Escapes.
A central aspect of the retreat is the LUX* Me Wellness Concept, which integrates hallmarks of modern wellbeing with ancient customs of cultivating inner-peace.
Uncover the ancient cultures of China while sipping a hot drink prepared by a Cafe LUX* barista.
65
ANNUAL REPORT 2017
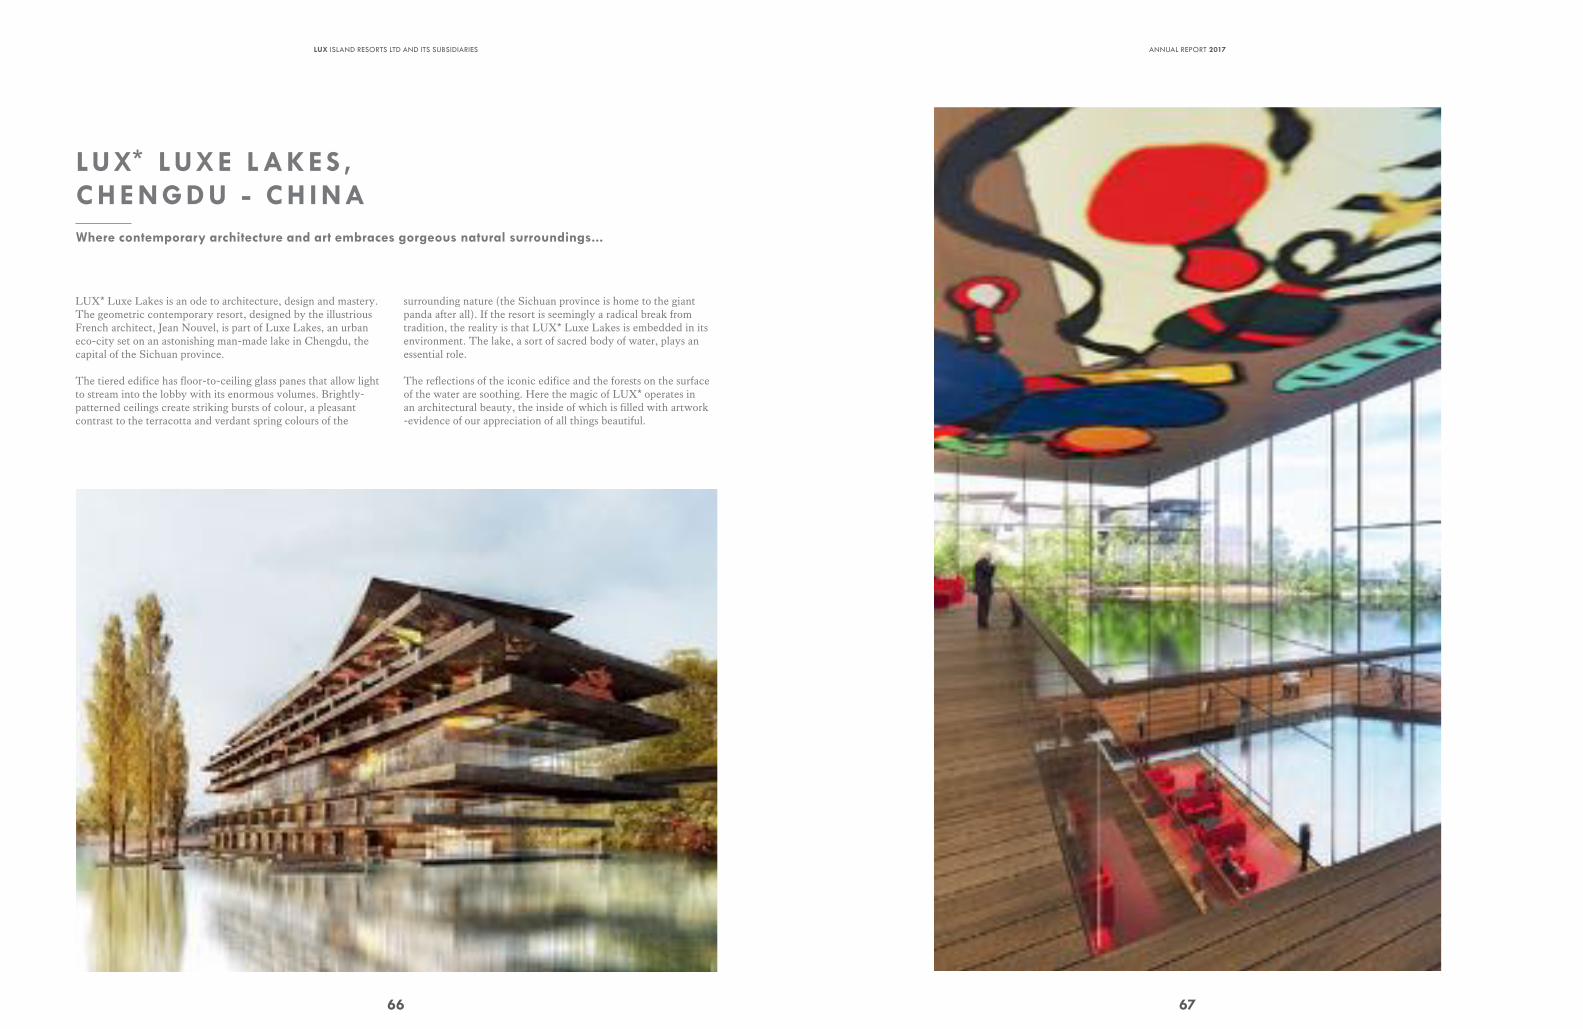
LUX* LUXE LAKES , C H E N GDU - C H I NAWhere contemporary architecture and art embraces gorgeous natural surroundings...
LUX* Luxe Lakes is an ode to architecture, design and mastery. The geometric contemporary resort, designed by the illustrious French architect, Jean Nouvel, is part of Luxe Lakes, an urban eco-city set on an astonishing man-made lake in Chengdu, the capital of the Sichuan province.
The tiered edifice has floor-to-ceiling glass panes that allow light to stream into the lobby with its enormous volumes. Brightly-patterned ceilings create striking bursts of colour, a pleasant contrast to the terracotta and verdant spring colours of the
surrounding nature (the Sichuan province is home to the giant panda after all). If the resort is seemingly a radical break from tradition, the reality is that LUX* Luxe Lakes is embedded in its environment. The lake, a sort of sacred body of water, plays an essential role.
The reflections of the iconic edifice and the forests on the surface of the water are soothing. Here the magic of LUX* operates in an architectural beauty, the inside of which is filled with artwork -evidence of our appreciation of all things beautiful.
66
LUX ISLAND RESORTS LTD AND ITS SUBSIDIARIES
67
ANNUAL REPORT 2017
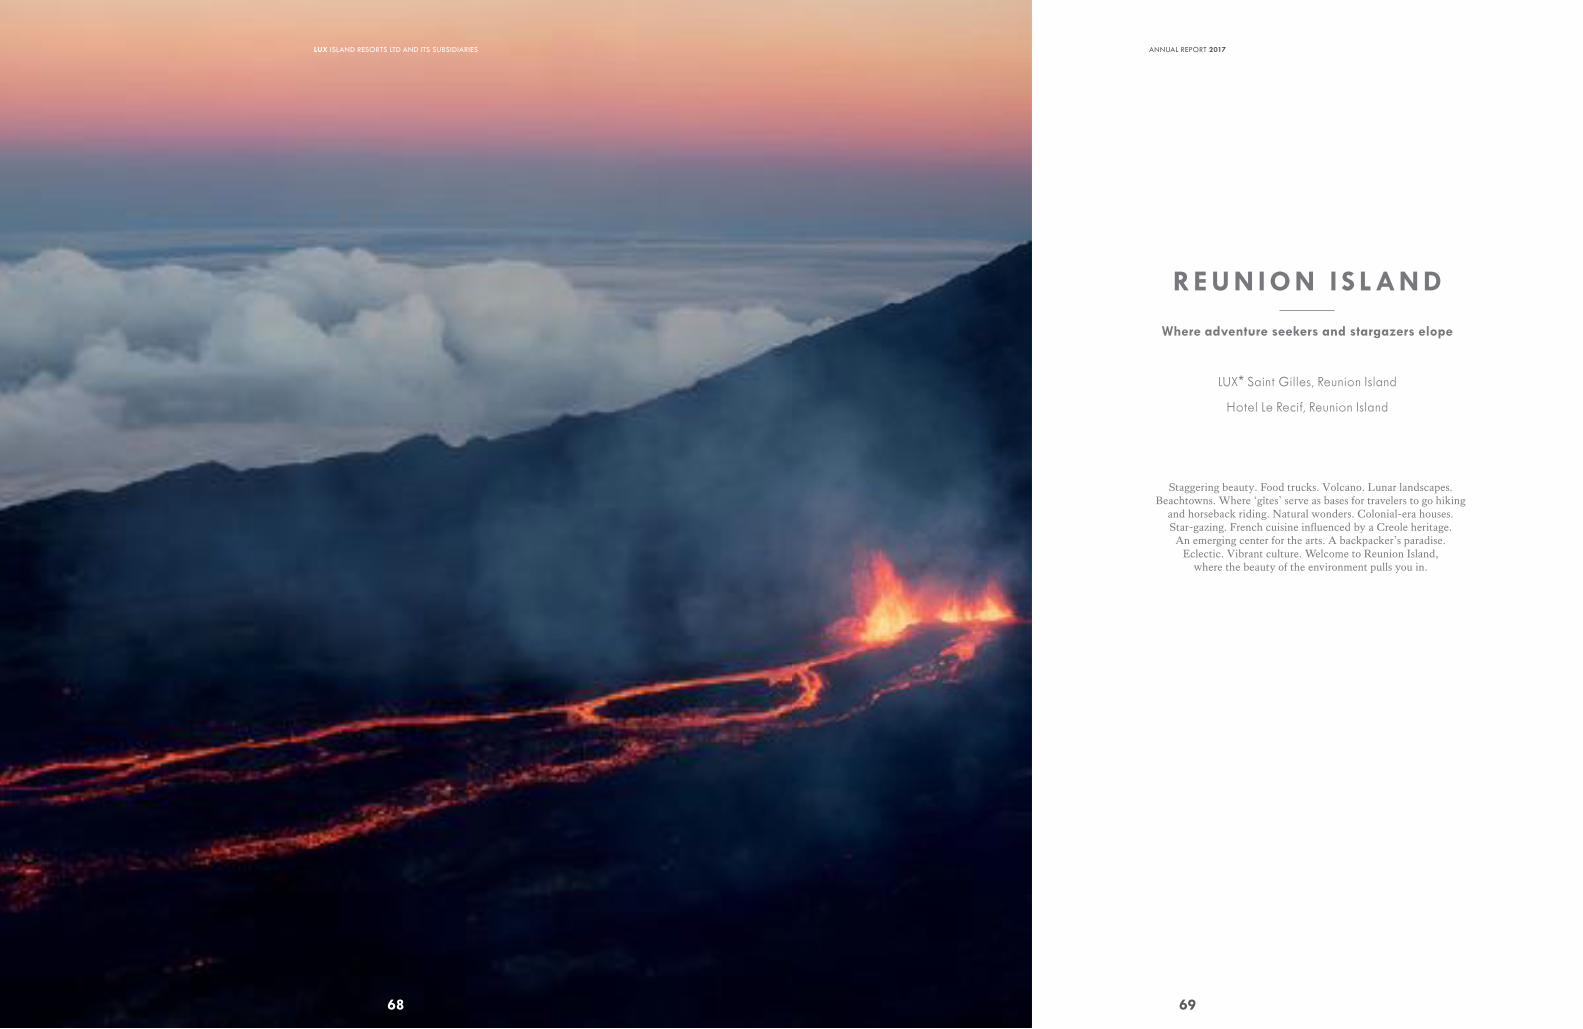
68
LUX ISLAND RESORTS LTD AND ITS SUBSIDIARIES
Staggering beauty. Food trucks. Volcano. Lunar landscapes. Beachtowns. Where ‘gîtes’ serve as bases for travelers to go hiking
and horseback riding. Natural wonders. Colonial-era houses. Star-gazing. French cuisine influenced by a Creole heritage.
An emerging center for the arts. A backpacker’s paradise. Eclectic. Vibrant culture. Welcome to Reunion Island,
where the beauty of the environment pulls you in.
RE U N ION I S LAN D
Where adventure seekers and stargazers elope
LUX* Saint Gilles, Reunion Island
Hotel Le Recif, Reunion Island
69
ANNUAL REPORT 2017
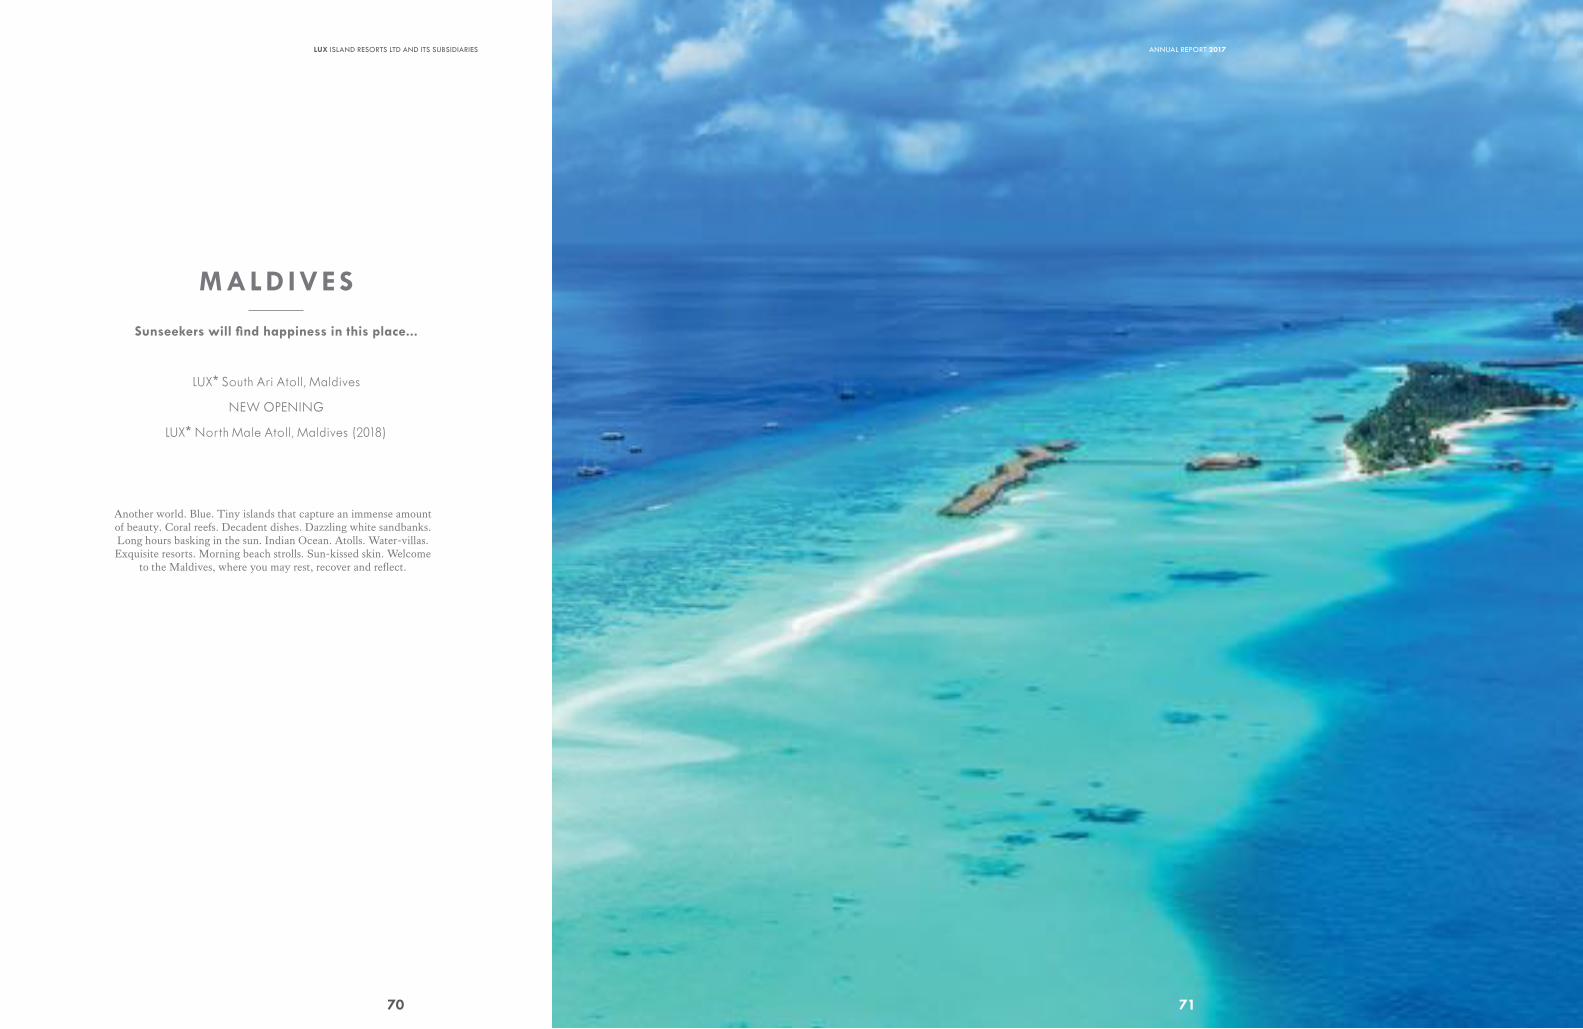
MALD IVE S
Sunseekers will find happiness in this place...
LUX* South Ari Atoll, Maldives
NEW OPENING
LUX* North Male Atoll, Maldives (2018)
Another world. Blue. Tiny islands that capture an immense amount of beauty. Coral reefs. Decadent dishes. Dazzling white sandbanks. Long hours basking in the sun. Indian Ocean. Atolls. Water-villas. Exquisite resorts. Morning beach strolls. Sun-kissed skin. Welcome
to the Maldives, where you may rest, recover and reflect.
70
LUX ISLAND RESORTS LTD AND ITS SUBSIDIARIES
71
ANNUAL REPORT 2017
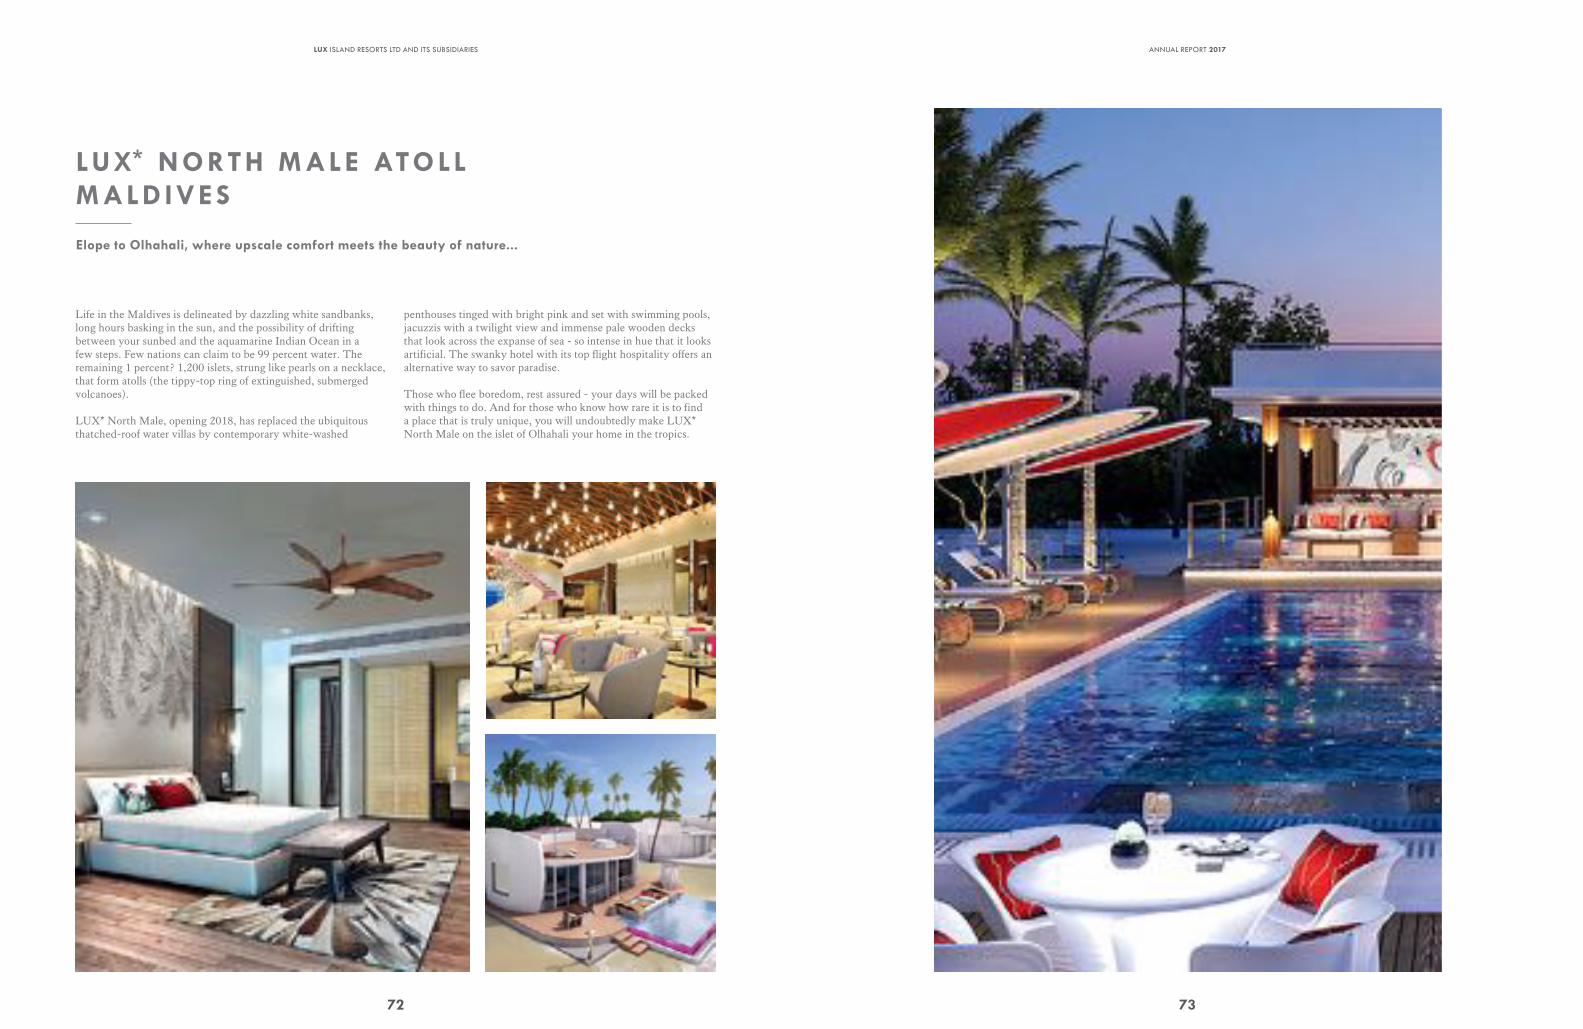
LUX* NORTH MALE ATOLLMALD IVE S
Elope to Olhahali, where upscale comfort meets the beauty of nature...
Life in the Maldives is delineated by dazzling white sandbanks, long hours basking in the sun, and the possibility of drifting between your sunbed and the aquamarine Indian Ocean in a few steps. Few nations can claim to be 99 percent water. The remaining 1 percent? 1,200 islets, strung like pearls on a necklace, that form atolls (the tippy-top ring of extinguished, submerged volcanoes).
LUX* North Male, opening 2018, has replaced the ubiquitous thatched-roof water villas by contemporary white-washed
penthouses tinged with bright pink and set with swimming pools, jacuzzis with a twilight view and immense pale wooden decks that look across the expanse of sea - so intense in hue that it looks artificial. The swanky hotel with its top flight hospitality offers an alternative way to savor paradise.
Those who flee boredom, rest assured - your days will be packed with things to do. And for those who know how rare it is to find a place that is truly unique, you will undoubtedly make LUX* North Male on the islet of Olhahali your home in the tropics.
72
LUX ISLAND RESORTS LTD AND ITS SUBSIDIARIES
73
ANNUAL REPORT 2017
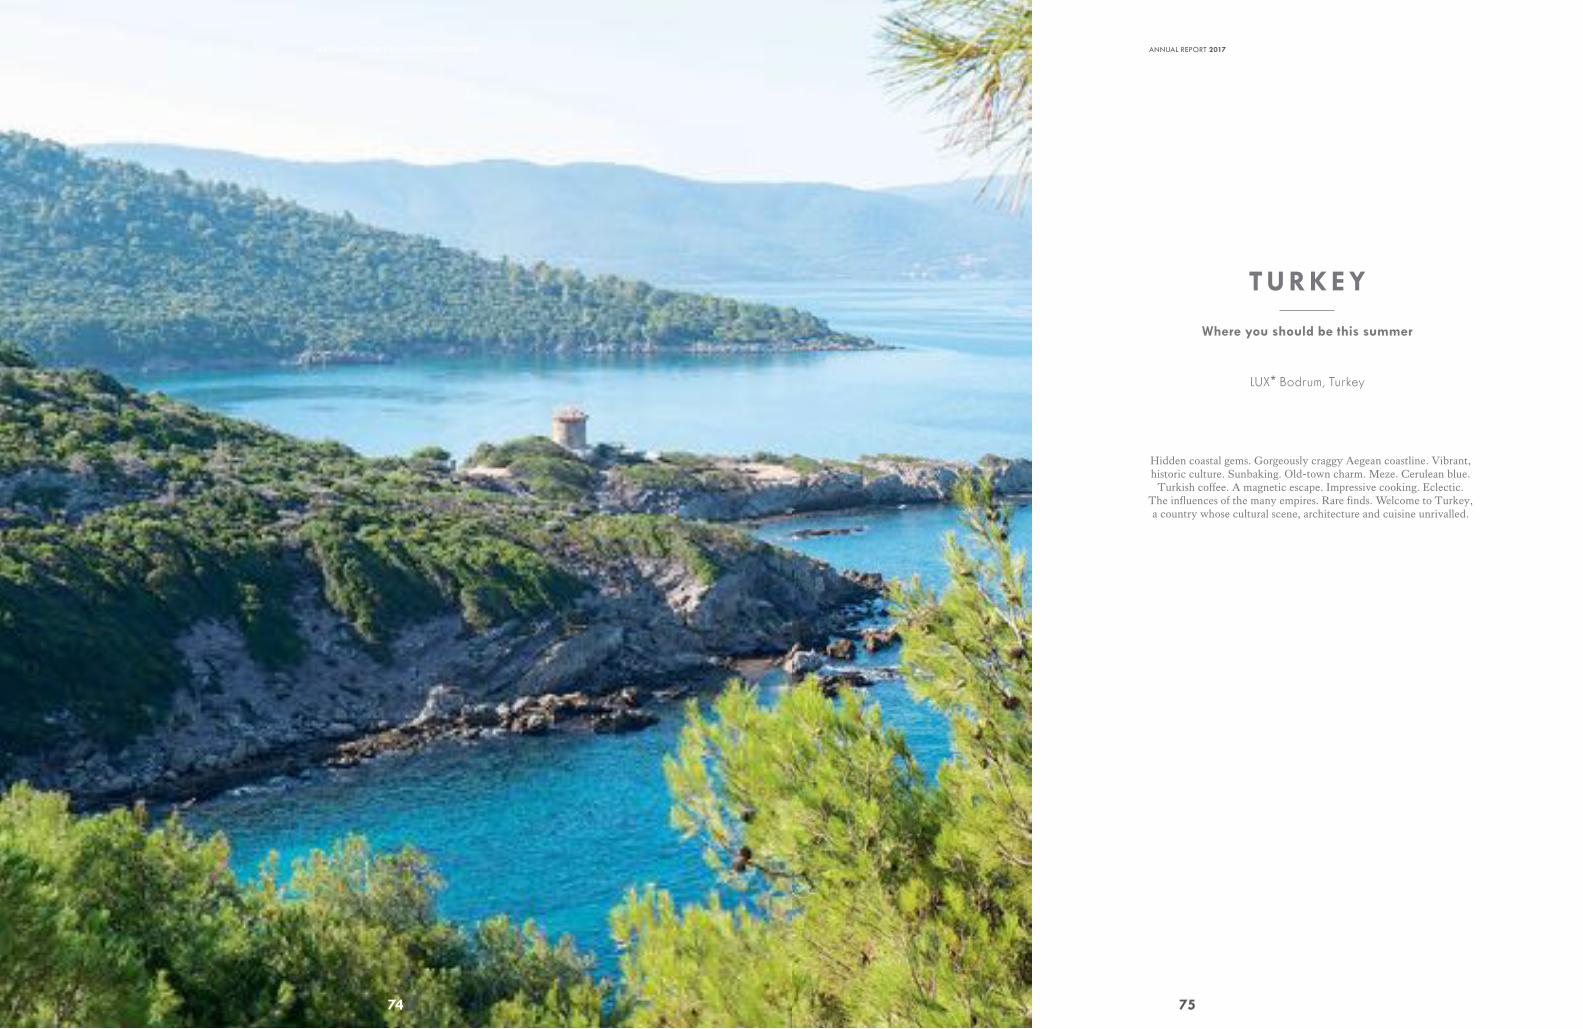
74
LUX ISLAND RESORTS LTD AND ITS SUBSIDIARIES
Hidden coastal gems. Gorgeously craggy Aegean coastline. Vibrant, historic culture. Sunbaking. Old-town charm. Meze. Cerulean blue.
Turkish coffee. A magnetic escape. Impressive cooking. Eclectic. The influences of the many empires. Rare finds. Welcome to Turkey, a country whose cultural scene, architecture and cuisine unrivalled.
TURKEY
Where you should be this summer
LUX* Bodrum, Turkey
75
ANNUAL REPORT 2017
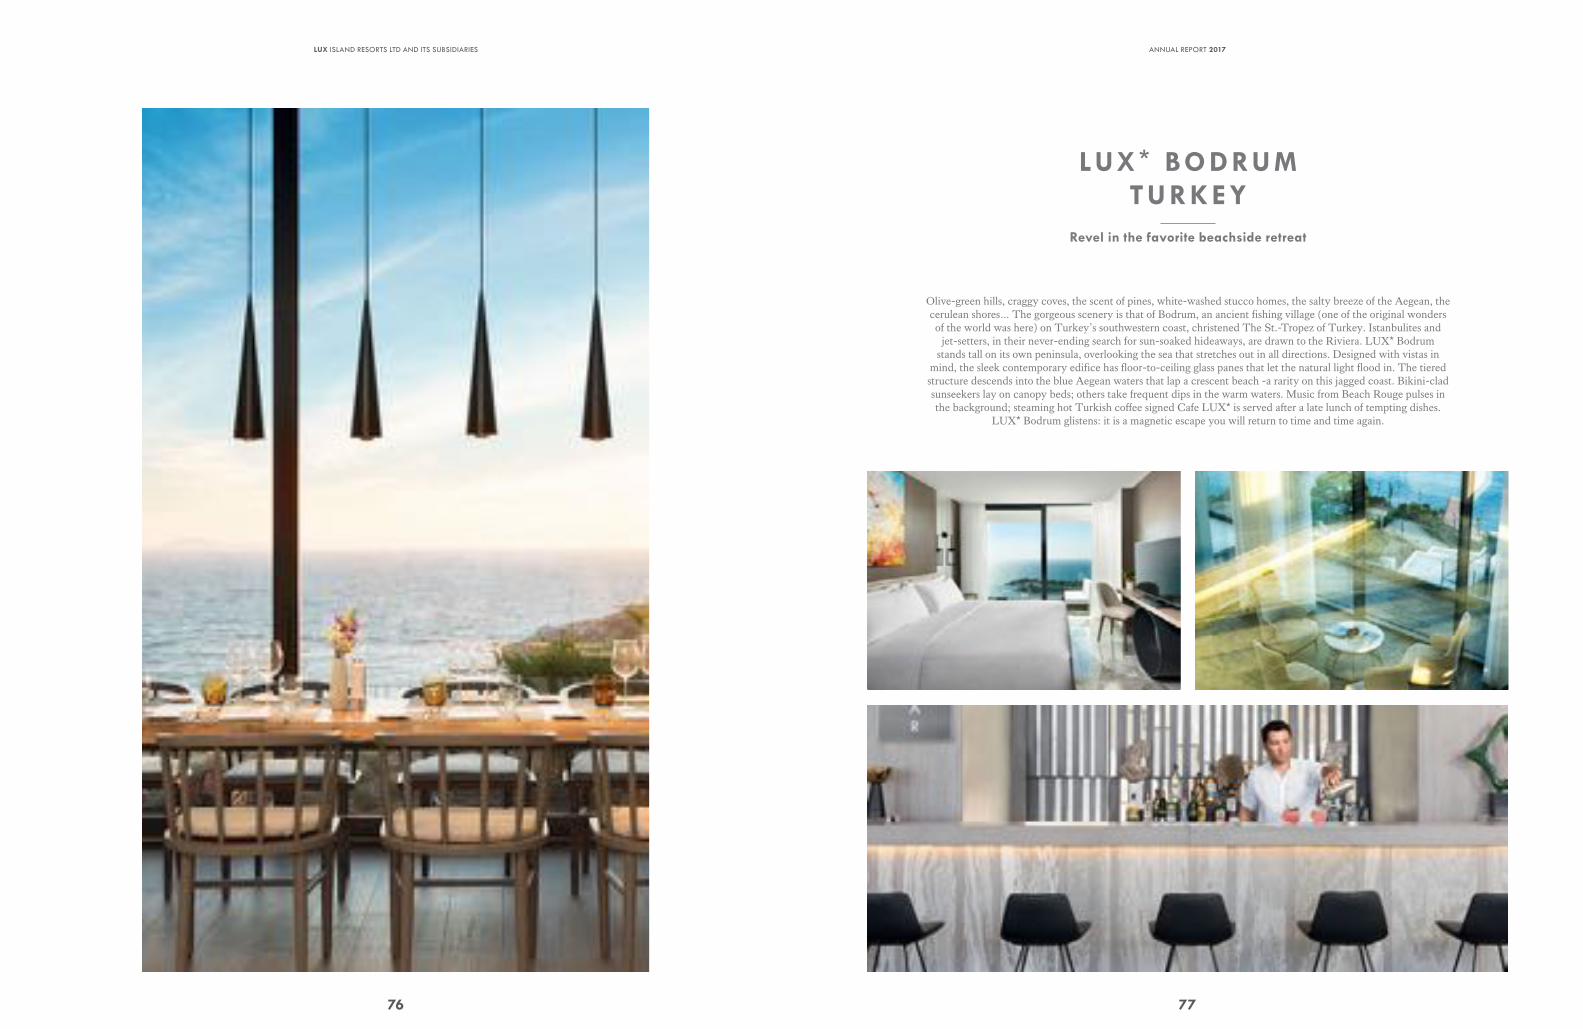
76
LUX ISLAND RESORTS LTD AND ITS SUBSIDIARIES
LUX * BODRUMTURKEY
Revel in the favorite beachside retreat
Olive-green hills, craggy coves, the scent of pines, white-washed stucco homes, the salty breeze of the Aegean, the cerulean shores… The gorgeous scenery is that of Bodrum, an ancient fishing village (one of the original wonders of the world was here) on Turkey’s southwestern coast, christened The St.-Tropez of Turkey. Istanbulites and
jet-setters, in their never-ending search for sun-soaked hideaways, are drawn to the Riviera. LUX* Bodrum stands tall on its own peninsula, overlooking the sea that stretches out in all directions. Designed with vistas in
mind, the sleek contemporary edifice has floor-to-ceiling glass panes that let the natural light flood in. The tiered structure descends into the blue Aegean waters that lap a crescent beach -a rarity on this jagged coast. Bikini-clad sunseekers lay on canopy beds; others take frequent dips in the warm waters. Music from Beach Rouge pulses in the background; steaming hot Turkish coffee signed Cafe LUX* is served after a late lunch of tempting dishes.
LUX* Bodrum glistens: it is a magnetic escape you will return to time and time again.
77
ANNUAL REPORT 2017
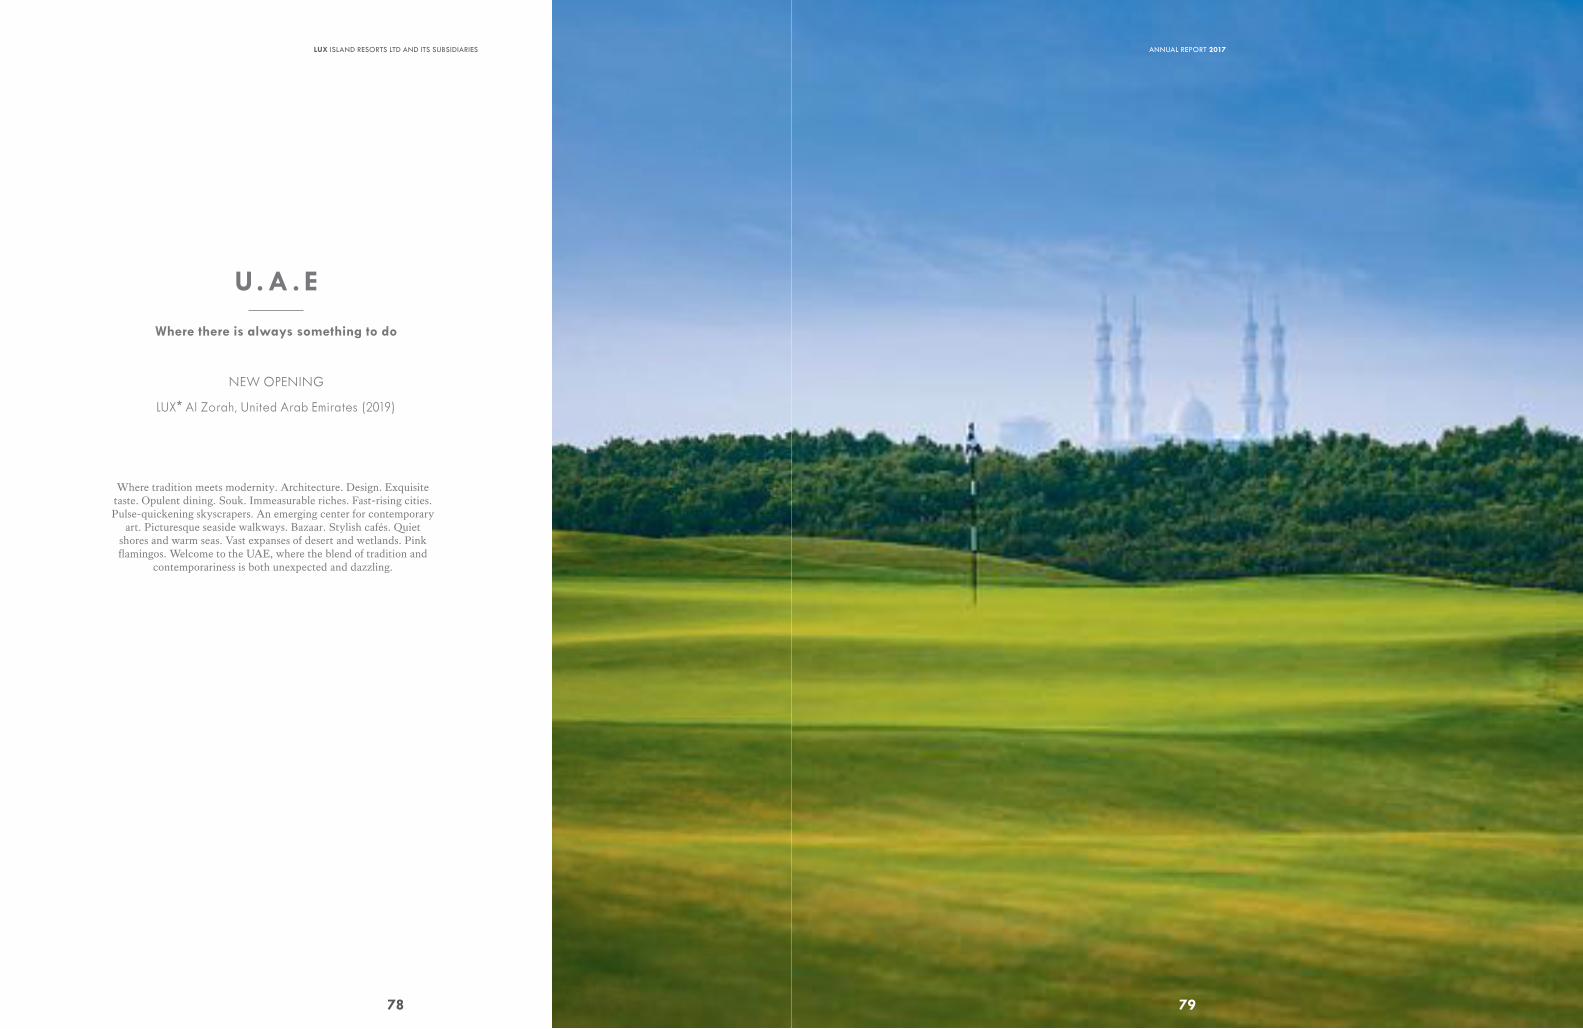
U. A . E
Where there is always something to do
NEW OPENING
LUX* Al Zorah, United Arab Emirates (2019)
Where tradition meets modernity. Architecture. Design. Exquisite taste. Opulent dining. Souk. Immeasurable riches. Fast-rising cities. Pulse-quickening skyscrapers. An emerging center for contemporary
art. Picturesque seaside walkways. Bazaar. Stylish cafés. Quiet shores and warm seas. Vast expanses of desert and wetlands. Pink flamingos. Welcome to the UAE, where the blend of tradition and
contemporariness is both unexpected and dazzling.
78
LUX ISLAND RESORTS LTD AND ITS SUBSIDIARIES
79
ANNUAL REPORT 2017
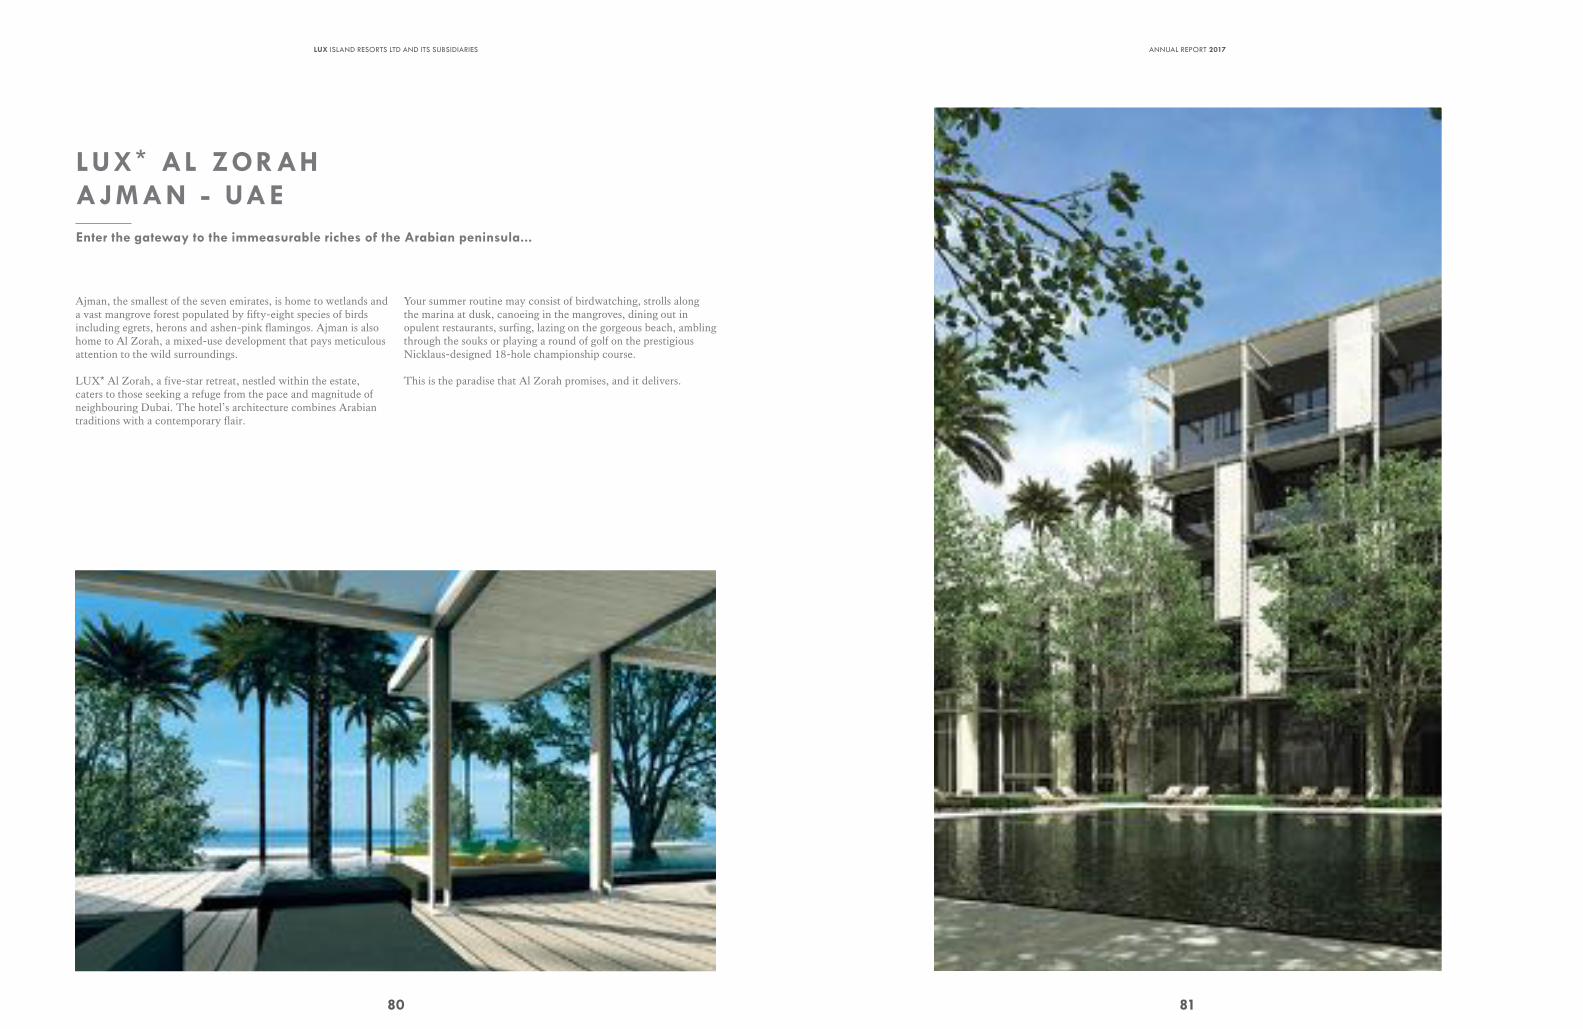
LUX* AL ZORAHAJMAN - UAEEnter the gateway to the immeasurable riches of the Arabian peninsula...
Ajman, the smallest of the seven emirates, is home to wetlands and a vast mangrove forest populated by fifty-eight species of birds including egrets, herons and ashen-pink flamingos. Ajman is also home to Al Zorah, a mixed-use development that pays meticulous attention to the wild surroundings.
LUX* Al Zorah, a five-star retreat, nestled within the estate, caters to those seeking a refuge from the pace and magnitude of neighbouring Dubai. The hotel’s architecture combines Arabian traditions with a contemporary flair.
Your summer routine may consist of birdwatching, strolls along the marina at dusk, canoeing in the mangroves, dining out in opulent restaurants, surfing, lazing on the gorgeous beach, ambling through the souks or playing a round of golf on the prestigious Nicklaus-designed 18-hole championship course.
This is the paradise that Al Zorah promises, and it delivers.
80
LUX ISLAND RESORTS LTD AND ITS SUBSIDIARIES
81
ANNUAL REPORT 2017
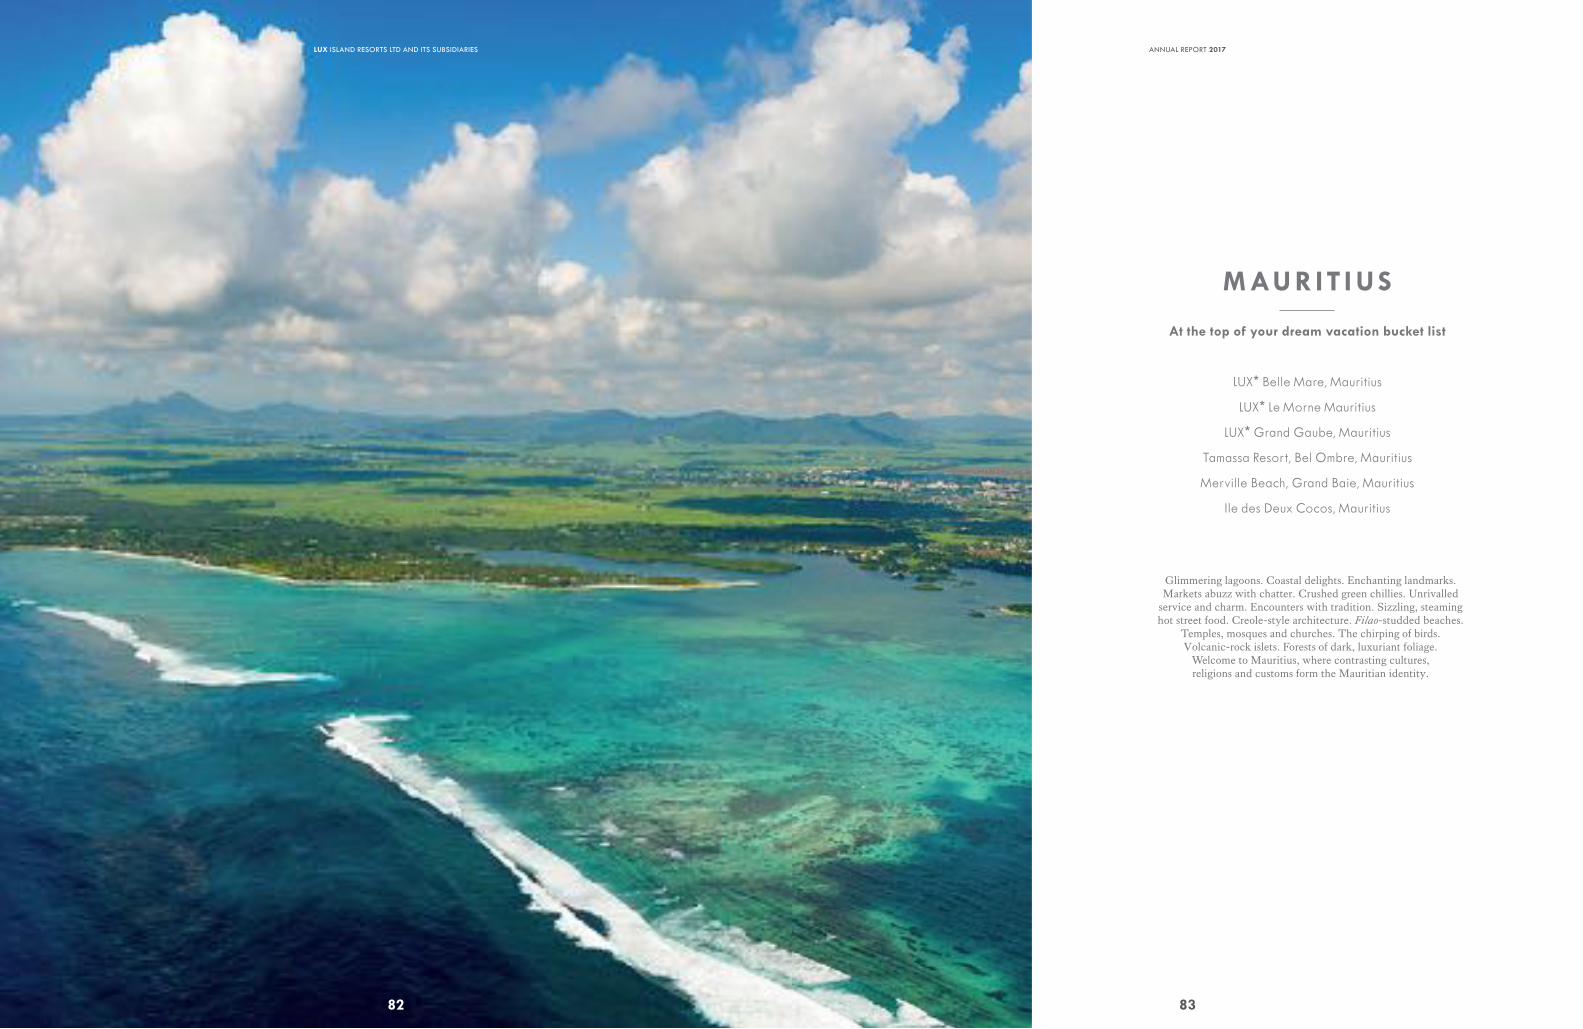
82
LUX ISLAND RESORTS LTD AND ITS SUBSIDIARIES
Glimmering lagoons. Coastal delights. Enchanting landmarks. Markets abuzz with chatter. Crushed green chillies. Unrivalled
service and charm. Encounters with tradition. Sizzling, steaming hot street food. Creole-style architecture. Filao-studded beaches.
Temples, mosques and churches. The chirping of birds. Volcanic-rock islets. Forests of dark, luxuriant foliage.
Welcome to Mauritius, where contrasting cultures, religions and customs form the Mauritian identity.
MAURIT I US
At the top of your dream vacation bucket list
LUX* Belle Mare, Mauritius
LUX* Le Morne Mauritius
LUX* Grand Gaube, Mauritius
Tamassa Resort, Bel Ombre, Mauritius
Merville Beach, Grand Baie, Mauritius
Ile des Deux Cocos, Mauritius
83
ANNUAL REPORT 2017
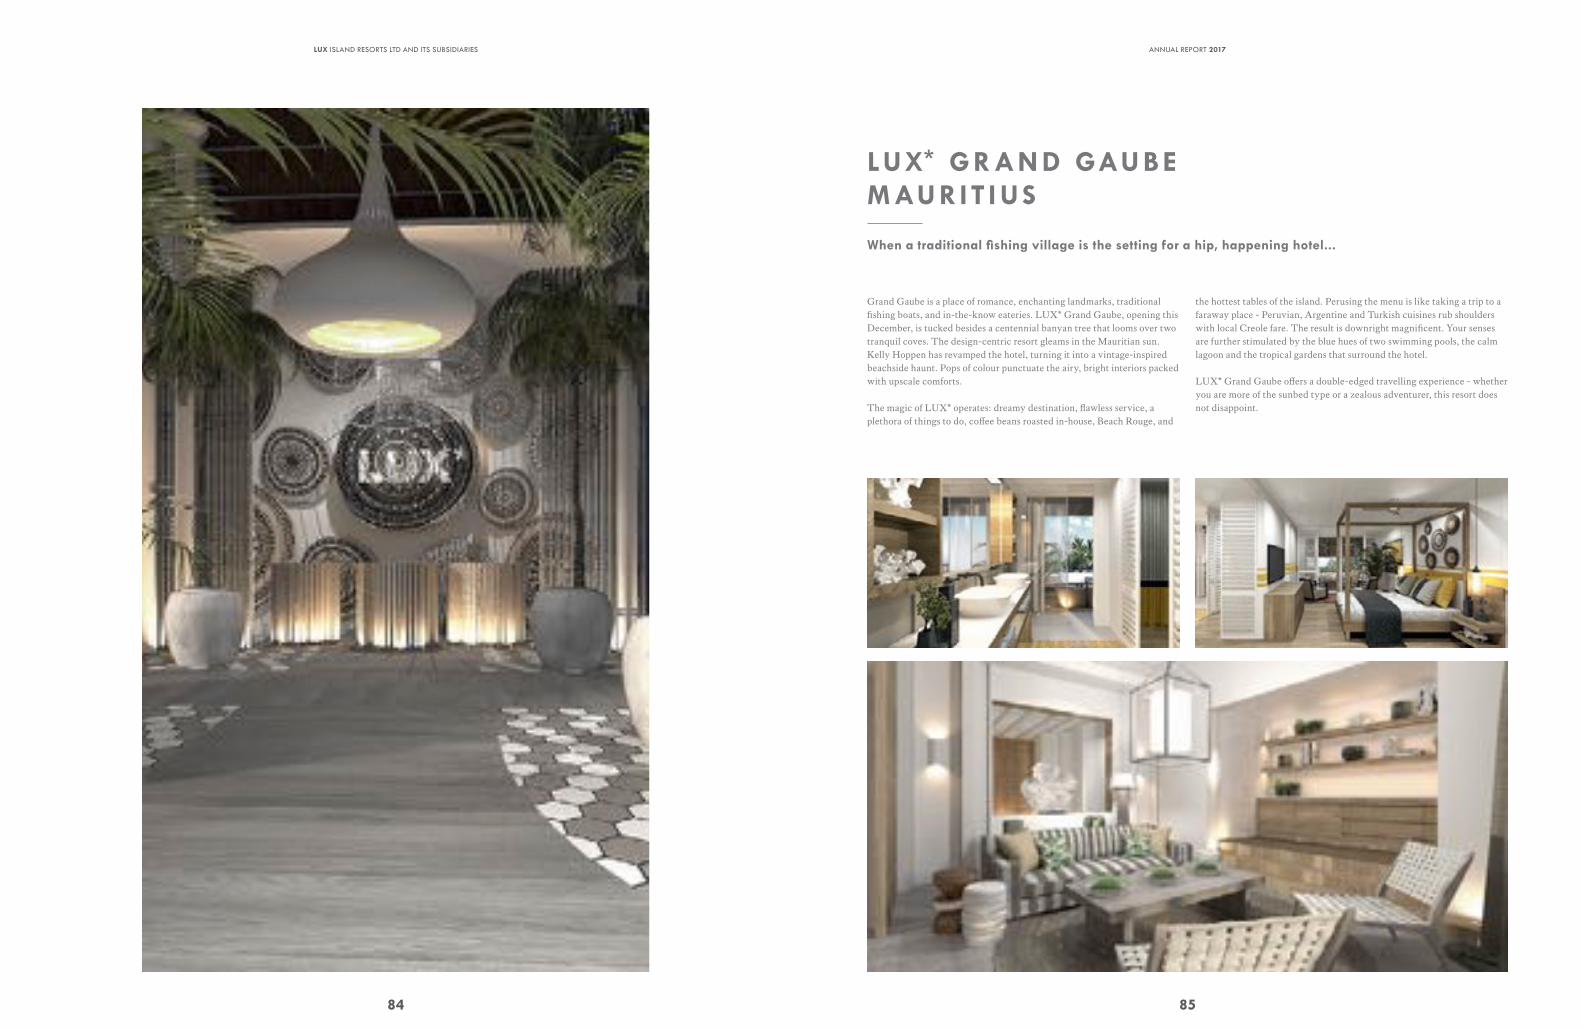
84
LUX ISLAND RESORTS LTD AND ITS SUBSIDIARIES
LUX* GRAN D GAUB E MAURIT I US
When a traditional fishing village is the setting for a hip, happening hotel...
Grand Gaube is a place of romance, enchanting landmarks, traditional fishing boats, and in-the-know eateries. LUX* Grand Gaube, opening this December, is tucked besides a centennial banyan tree that looms over two tranquil coves. The design-centric resort gleams in the Mauritian sun. Kelly Hoppen has revamped the hotel, turning it into a vintage-inspired beachside haunt. Pops of colour punctuate the airy, bright interiors packed with upscale comforts.
The magic of LUX* operates: dreamy destination, flawless service, a plethora of things to do, coffee beans roasted in-house, Beach Rouge, and
the hottest tables of the island. Perusing the menu is like taking a trip to a faraway place - Peruvian, Argentine and Turkish cuisines rub shoulders with local Creole fare. The result is downright magnificent. Your senses are further stimulated by the blue hues of two swimming pools, the calm lagoon and the tropical gardens that surround the hotel.
LUX* Grand Gaube offers a double-edged travelling experience - whether you are more of the sunbed type or a zealous adventurer, this resort does not disappoint.
85
ANNUAL REPORT 2017

86
LUX ISLAND RESORTS LTD AND ITS SUBSIDIARIES
VI ETNAM
Where the ocean is myriad shades of green
NEW OPENING
LUX* Phu Quoc, Vietnam (2019)
Limestone islands scattered around emerald green waters. Floating villages. Cities that retain an old-world charm. Tuk-tuk. Steaming
bowls of pho. A nation with a voracious appetite. Great coffee. Night markets. A stunning example of old-meets-new. Quiet rows
of rice paddies. Places of worship. A mythically beautiful hideaway. Welcome to Vietnam where otherworldly landscapes retain an aura
of mystery.
87
ANNUAL REPORT 2017
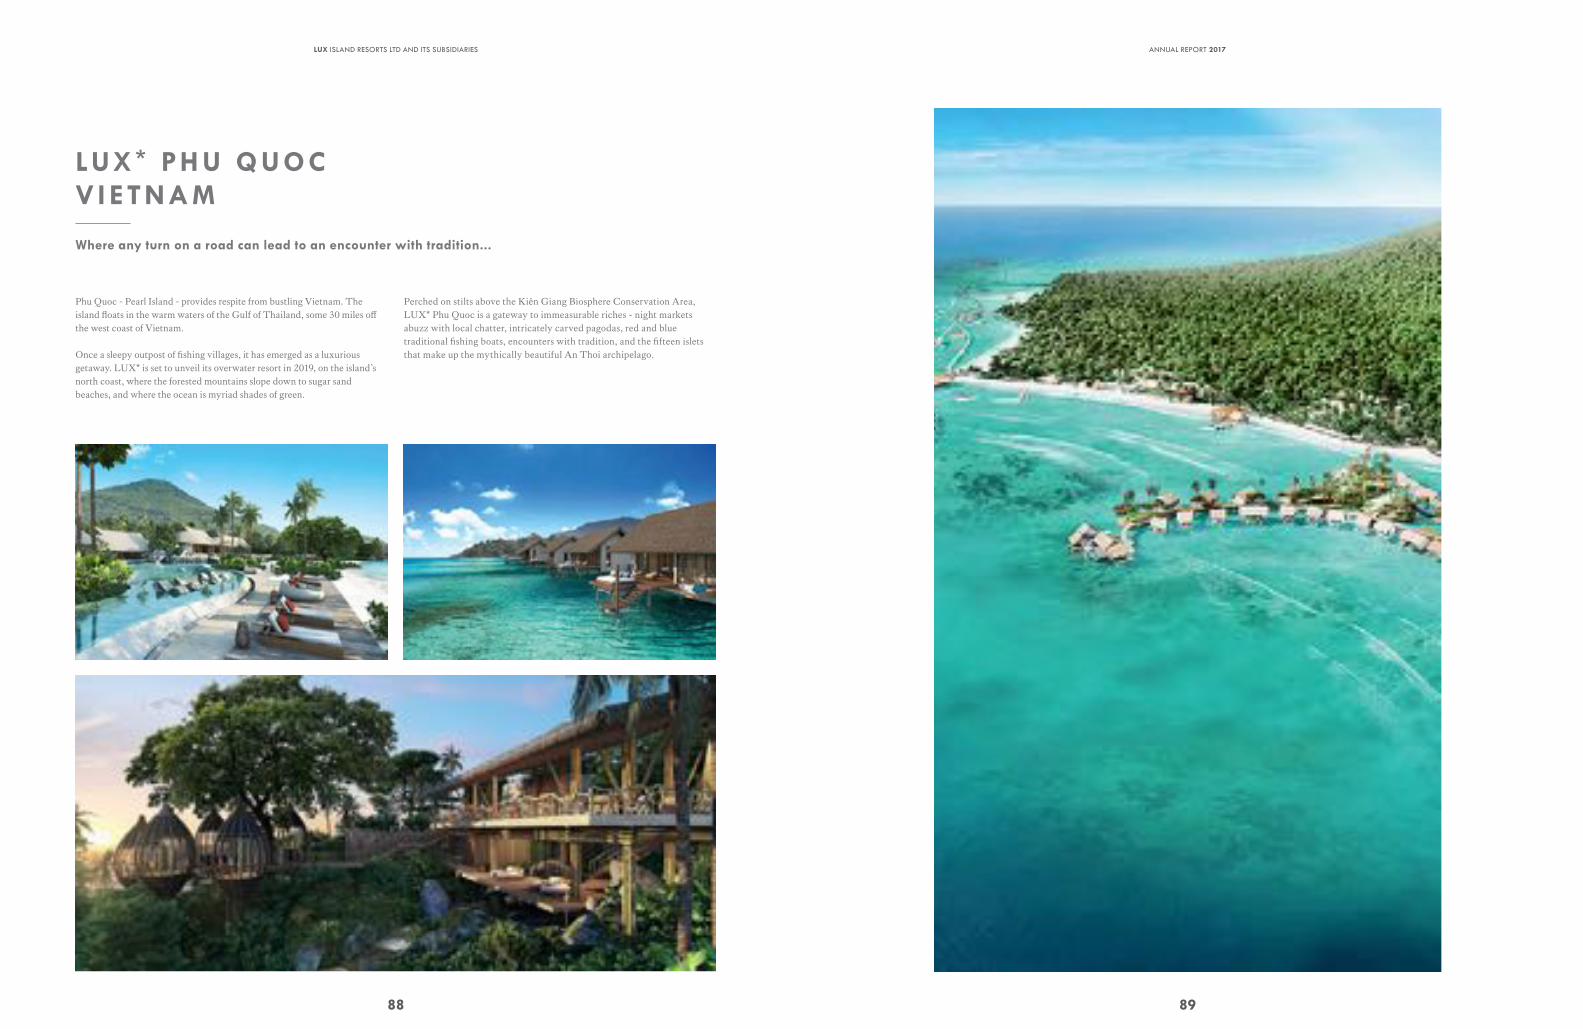
LUX * PHU QUOCVI ETNAM
Where any turn on a road can lead to an encounter with tradition...
Phu Quoc - Pearl Island - provides respite from bustling Vietnam. The island floats in the warm waters of the Gulf of Thailand, some 30 miles off the west coast of Vietnam.
Once a sleepy outpost of fishing villages, it has emerged as a luxurious getaway. LUX* is set to unveil its overwater resort in 2019, on the island’s north coast, where the forested mountains slope down to sugar sand beaches, and where the ocean is myriad shades of green.
Perched on stilts above the Kiên Giang Biosphere Conservation Area, LUX* Phu Quoc is a gateway to immeasurable riches - night markets abuzz with local chatter, intricately carved pagodas, red and blue traditional fishing boats, encounters with tradition, and the fifteen islets that make up the mythically beautiful An Thoi archipelago.
88
LUX ISLAND RESORTS LTD AND ITS SUBSIDIARIES
89
ANNUAL REPORT 2017
90
LUX ISLAND RESORTS LTD AND ITS SUBSIDIARIES
CORPORATE GOVERNANCE REPORT
Lux Island Resorts Ltd (‘the Company’ or ‘LIR’) and its subsidiaries (‘the Group’) have always been committed to observing high standards of Corporate Governance, promoting corporate transparency and enhancing shareholder value.
The company’s objective is to comply by June 2018 with all the principles and guidelines set out in the new National Code of Corporate Governance in Mauritius, which marks an important step in the country’s Corporate Governance regime.
This report outlines the Company’s corporate governance processes, and provides a thorough explanations for any deviation from the recommendations under this new Code.
This report, along with the Annual Report, is published in its entirety on the Company’s website.
1. STATEMENT OF COMPLIANCE BY THE BOARD
The introduction of the new National Code of Corporate Governance for Mauritius will bring considerable changes, from a corporate governance reporting perspective, for the period ending 30th June 2018.
We are pleased to confirm that we shall comply with all of the requirements and provisions of the new code for the period ending 30th June 2018. Earlier compliance being encouraged, we have started to implement some of the principles contained in this new code, as well as some of the required disclosures.
Throughout the year ended 30th June 2017, to the best of the Board’s knowledge, the Company has been devoted to the adherence to the new Code of Corporate Governance. The Board is fully committed to attaining and sustaining the highest standards of Corporate Governance with the aim of creating long-term value for the shareholders and stakeholders at large. We achieved this by raising awareness, across the Group, of business ethics and by ensuring that the Board of Directors and various Committees of the Board duly supervise the Management of the Group.
The Board has discussed the application of the requirement relating to the disclosure of remuneration for each individual executive director. However, it being a sensitive issue in a very competitive sector, the Board has decided not to disclose individually the remuneration of the executive Directors.
2. COMPANY CONSTITUTION
A copy of the Constitution is available at the registered office of the Company and on its website: www.luxresorts.com
There are no clauses of the Constitution deemed material enough for special disclosure.
GRI 102-16, 102-18
91
ANNUAL REPORT 2017
3. BOARD MATTERS
3.1 Board’s conduct of affairs
Every company should be headed by an effective Board. The Board is collectively responsible for the long-term success of the Company, its reputation and governance. The Board also assumes the responsibility of leading and controlling the organization and meeting all legal and regulatory requirements.
The Company is a public interest entity, as defined by law.
The Board Charter is available for consultation on the Company’s website.
3.2 The Role of the Board
The primary function of the Board of Directors of the Company (“Board”) is to provide effective leadership and direction to enhance the long-term value of the Group to its shareholders and other stakeholders. The Board has the responsibility to fulfil its role, which entails the following:
> Ensure that the long-term interests of the shareholders are being served, and safeguard the Company’s assets
> Assess major risk factors relating to the Company and review measures, including internal controls, to address and mitigate such risks
> Review and approve Management’s strategic and business plans, including understanding the business and questioning the assumptions upon which plans are based, in order to reach an independent judgment and determine the probability of the plans and/or forecasts being realized
> Monitor the performance of Management regarding budgets and forecasts
> Review and approve significant corporate actions and major transactions
> Assess the effectiveness of the Board
> Ensure ethical behaviour and compliance with laws and regulations, auditing and accounting principles and the Company’s own governing documents
> Identify key stakeholder groups and acknowledge that their perceptions affect the Company’s reputation
> Consider sustainability issues, e.g environmental and social factors, as part of its strategic formulation
> Perform such other functions as prescribed by law, or assigned to the Board in the Company’s governing documents.
92
LUX ISLAND RESORTS LTD AND ITS SUBSIDIARIES
3.3 Independent judgement of Directors
All directors are expected to objectively discharge their duties and responsibilities in the interest of the Company. All directors should do their best to avoid conflicts of interests or situations where others might reasonably perceive it as conflict. The personal interest of a director, or persons closely associated with the Director, must not take precedence over those of the Company or its shareholders. Thus, any director who is directly or indirectly interested in a transaction or proposed transaction is required to disclose the nature of their interest, and the director concerned should not be present at any part of a meeting in which the conflict or potential conflict is discussed, and should not participate in the debate, vote or indicate how they would have voted on the matter.
The Board is a unitary board that currently consists of 10 directors, as shown below, along with their membership on the Board Committees of the Company:
NAME GENDERCOUNTRY OF RESIDENCE
BOARD APPOINTMENT
BOARD COMMITTEE APPOINTMENT
Arnaud Lagesse M MauritiusNon-independent Chairperson of the Board
Chairman of the Corporate Governance & Nomination Committee and Member of the Remuneration Committee
Paul Jones (Chief Executive Officer of the Company)
M Mauritius Executive Director
Jean-Claude Béga M MauritiusNon-Executive Director
Member of the Audit & Risk Committee
Laurent de la Hogue M MauritiusNon-Executive Director
Jean de Fondaumière M MauritiusIndependent Non-Executive Director
Chairman of the Audit & Risk Committee and Member of the Remuneration Committee
Désiré Elliah (Chief Financial Officer of the Company)
M Mauritius Executive Director
Pascale Lagesse F FranceIndependent Non-Executive Director
Stéphane Lagesse M MauritiusNon-Executive Director
Member of the Audit & Risk Committee
Thierry Lagesse M MauritiusNon-Executive Director
Maxime Rey M MauritiusNon-Executive Director
Member of the Audit & Risk Committee
Having 2 Non-Executive Independent Directors plays a crucial role in ensuring that we have a strong, impartial element on the Board. The objective is to facilitate the exercise of independent and objective judgement on corporate affairs, and to ensure that discussion and review of key issues takes place in a critical yet constructive manner.
CORPORATE GOVERNANCE REPORT
93
ANNUAL REPORT 2017
3.4 Delegation by the Board
To assist the Board, the Board has delegated certain functions to 3 Committees, namely the Audit & Risk Committee (ARC), the Remuneration Committee (RC) and the Corporate Governance & Nomination Committee (CGNC). Each committee has its own written terms of reference, which are available on the Company’s website. Please refer to pages 100-102 of this report for further information on these Committees.
3.5 Key features of Board processes
To assist the Directors in planning their attendance at meetings, the dates of Board Meetings, Board Committee meetings, Annual Meetings are scheduled up to one year in advance, with Board Meetings occurring at least each quarter. In addition to the regular scheduled meetings, ad-hoc Committees are convened as and when circumstances warrant. Besides physical meetings, the Board may also make decisions by way of written resolutions under the Company’s Constitution and their respective Terms of Reference.
Board meetings are chaired in Mauritius, but the Company’s Constitution permits Board Members to also participate by teleconference or other similar means of communication.
From 1st July 2016 to 30th June 2017, the Board met 6 times for the purpose of considering and approving, amongst others, the following items:
> The audited financial statements for the year ended 30th June 2016 and relevant publications
> Updates on various renovation projects and new management contracts
> Approval of Q1 results
> Approval of Q2 results
> Approval of Q3 results
> Declaration of Dividend
> Budget for the financial year ending 30th June 2018
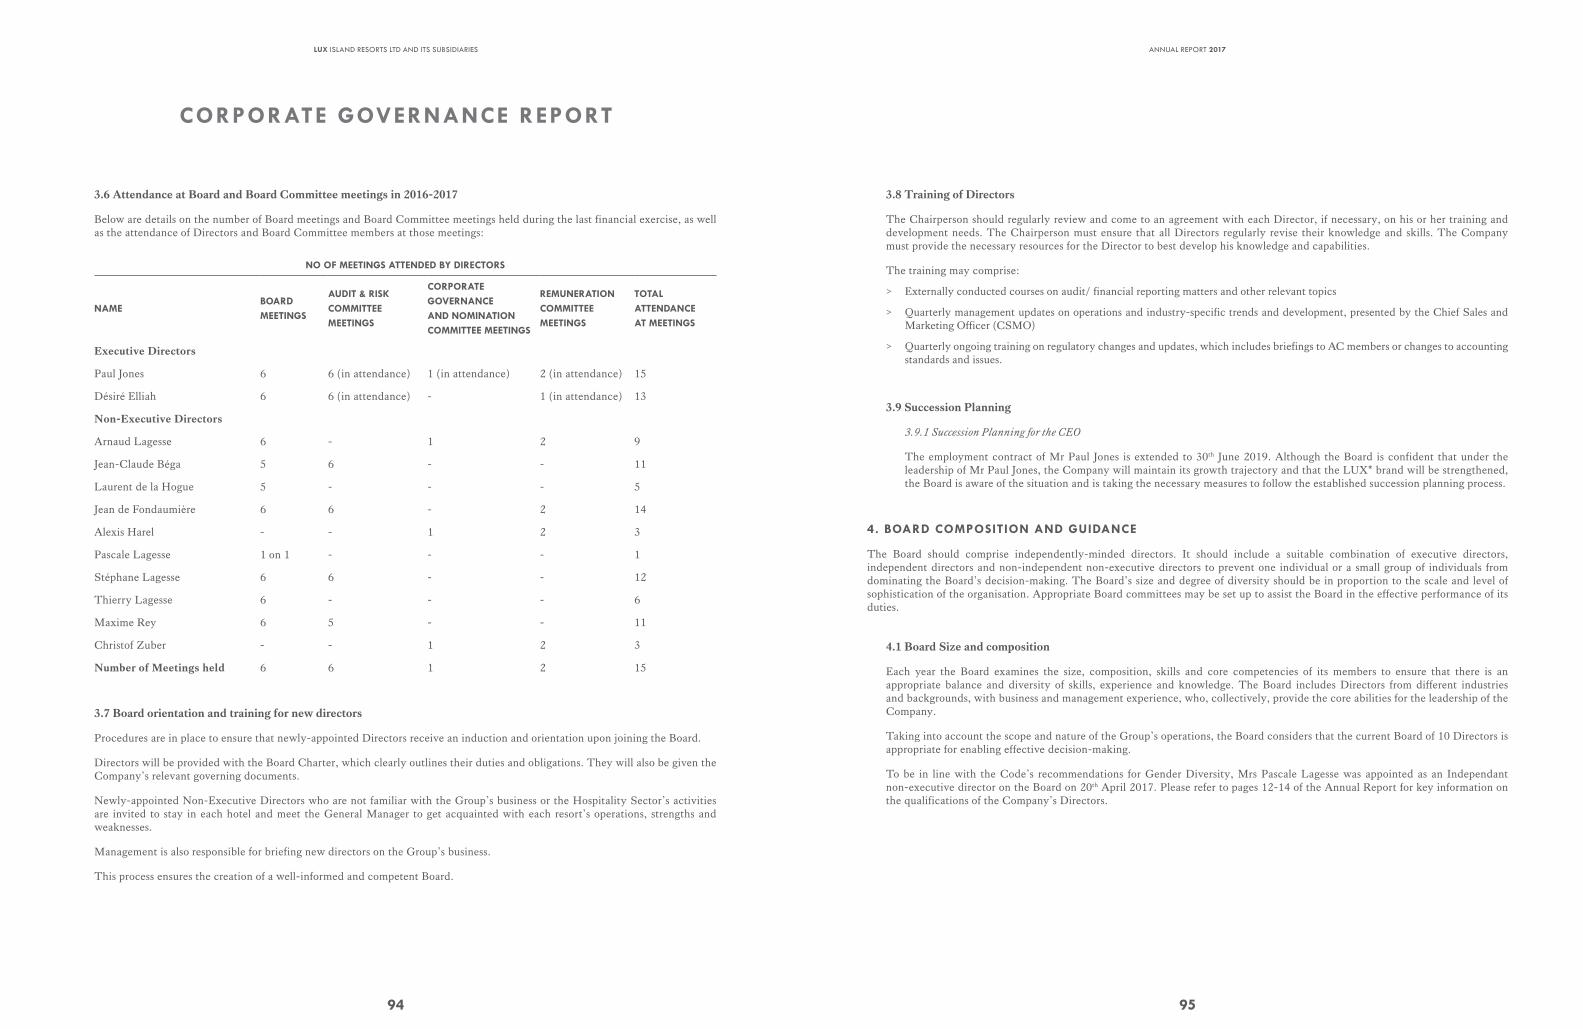
94
LUX ISLAND RESORTS LTD AND ITS SUBSIDIARIES
3.6 Attendance at Board and Board Committee meetings in 2016-2017
Below are details on the number of Board meetings and Board Committee meetings held during the last financial exercise, as well as the attendance of Directors and Board Committee members at those meetings:
NO OF MEETINGS ATTENDED BY DIRECTORS
NAMEBOARD MEETINGS
AUDIT & RISK COMMITTEE MEETINGS
CORPORATE GOVERNANCE AND NOMINATION COMMITTEE MEETINGS
REMUNERATION COMMITTEE MEETINGS
TOTAL ATTENDANCE AT MEETINGS
Executive Directors
Paul Jones 6 6 (in attendance) 1 (in attendance) 2 (in attendance) 15
Désiré Elliah 6 6 (in attendance) - 1 (in attendance) 13
Non-Executive Directors
Arnaud Lagesse 6 - 1 2 9
Jean-Claude Béga 5 6 - - 11
Laurent de la Hogue 5 - - - 5
Jean de Fondaumière 6 6 - 2 14
Alexis Harel - - 1 2 3
Pascale Lagesse 1 on 1 - - - 1
Stéphane Lagesse 6 6 - - 12
Thierry Lagesse 6 - - - 6
Maxime Rey 6 5 - - 11
Christof Zuber - - 1 2 3
Number of Meetings held 6 6 1 2 15
3.7 Board orientation and training for new directors
Procedures are in place to ensure that newly-appointed Directors receive an induction and orientation upon joining the Board.
Directors will be provided with the Board Charter, which clearly outlines their duties and obligations. They will also be given the Company’s relevant governing documents.
Newly-appointed Non-Executive Directors who are not familiar with the Group’s business or the Hospitality Sector’s activities are invited to stay in each hotel and meet the General Manager to get acquainted with each resort’s operations, strengths and weaknesses.
Management is also responsible for briefing new directors on the Group’s business.
This process ensures the creation of a well-informed and competent Board.
CORPORATE GOVERNANCE REPORT
95
ANNUAL REPORT 2017
3.8 Training of Directors
The Chairperson should regularly review and come to an agreement with each Director, if necessary, on his or her training and development needs. The Chairperson must ensure that all Directors regularly revise their knowledge and skills. The Company must provide the necessary resources for the Director to best develop his knowledge and capabilities.
The training may comprise:
> Externally conducted courses on audit/ financial reporting matters and other relevant topics
> Quarterly management updates on operations and industry-specific trends and development, presented by the Chief Sales and Marketing Officer (CSMO)
> Quarterly ongoing training on regulatory changes and updates, which includes briefings to AC members or changes to accounting standards and issues.
3.9 Succession Planning
3.9.1 Succession Planning for the CEO
The employment contract of Mr Paul Jones is extended to 30th June 2019. Although the Board is confident that under the leadership of Mr Paul Jones, the Company will maintain its growth trajectory and that the LUX* brand will be strengthened, the Board is aware of the situation and is taking the necessary measures to follow the established succession planning process.
4. BOARD COMPOSITION AND GUIDANCE
The Board should comprise independently-minded directors. It should include a suitable combination of executive directors, independent directors and non-independent non-executive directors to prevent one individual or a small group of individuals from dominating the Board’s decision-making. The Board’s size and degree of diversity should be in proportion to the scale and level of sophistication of the organisation. Appropriate Board committees may be set up to assist the Board in the effective performance of its duties.
4.1 Board Size and composition
Each year the Board examines the size, composition, skills and core competencies of its members to ensure that there is an appropriate balance and diversity of skills, experience and knowledge. The Board includes Directors from different industries and backgrounds, with business and management experience, who, collectively, provide the core abilities for the leadership of the Company.
Taking into account the scope and nature of the Group’s operations, the Board considers that the current Board of 10 Directors is appropriate for enabling effective decision-making.
To be in line with the Code’s recommendations for Gender Diversity, Mrs Pascale Lagesse was appointed as an Independant non-executive director on the Board on 20th April 2017. Please refer to pages 12-14 of the Annual Report for key information on the qualifications of the Company’s Directors.
96
LUX ISLAND RESORTS LTD AND ITS SUBSIDIARIES
4.2 Director’s independence review
The 2016 National Code of Corporate Governance for Mauritius has issued several guidelines to deem whether a Director is independent or not. The Board intends to adopt these guidelines to determine whether a Director is independent in character and judgement, and if there are relationships or circumstances likely to affect, or appear to affect, the Director’s judgement on an annual basis.
The Board is determined to ensure, on an annual basis, and as and when the circumstances require, whether or not a director is independent, bearing in mind the provisions of the Code, and any other salient factors.
Additionally, rigorous review are conducted, and particular consideration is given to Directors that have served on the Board for more than nine consecutive years, from the date of their first election.
Having conducted the relevant reviews, the Board has considered that the following Directors are regarded as Independent Directors of the Company:
> Jean de Fondaumière
> Pascale Lagesse
The Board recognises that independent Directors may, over time, develop significant insights into the Group’s business and operations and can continue to objectively provide significant and valuable contribution to the Board as a whole. In circumstances where a Director has served as an Independent Director for over 9 years, the Board will do a rigorous review of their continuing contribution and independence.
Mr Jean de Fondaumière has served on the Board as a Non-Executive Independent Director for more than 9 years.
The Board considers that a Director’s independence cannot be determined solely and arbitrarily on the basis of the length of time. A Director’s contribution in terms of experience, expertise, professionalism, integrity, objectivity and independent judgement in engaging and challenging Management in the interests of the Group, as well as the performance of their duties in good faith, are more critical measures in ascertaining a director’s independence than the number of years on the Board.
During its review, the Board, which can have, according to the NCCG, “its own definition of independence,” considered and noted that although Mr Jean de Fondaumière has served the Board for more than nine years, his independence as a Director has not been affected, as he continues to exercise independent judgement and demonstrate objectivity in his conduct and deliberations at Board and Board Committee meetings. By diligently discharging his duties and exercising sound independent business judgement and objectivity in an exemplary manner in the interest of the Company, he has exhibited a strong spirit of professionalism that has not diminished over time.
After taking into account these factors, the Board has considered and determined that Mr Jean de Fondaumière continues to be regarded as an Independent Director of the Company despite having served the Board for more than nine years.
Mr Jean De Fondaumière duly abstained from the Board’s determination of independence.
Mrs Pascale Lagesse was appointed an Independent Director on 20th April 2017. Mrs Pascale Lagesse complies with the definition of an ‘independent director’ as stipulated by the Code.
We believe that our Independent Directors have demonstrated a high commitment to their roles as Directors and have ensured that there is a good balance of power and authority within the Company.
CORPORATE GOVERNANCE REPORT
97
ANNUAL REPORT 2017
4.3 Non- Executive Directors
Non-Executive Directors are encouraged, as stated by Corporate Governance practices, to constructively challenge and help develop proposals on strategy; to review the performance of management in attaining goals and objectives; to monitor the reporting of performance; and to meet regularly without the presence of Management.
Our Non-Executive independent Directors meet and/or hold discussions at least annually without the presence of other executive directors, non-independent Directors and Management.
4.4 Chairman and Chief Executive Officer
There should be a clear separation of responsibilities between the leadership of the Board and the Executives responsible for managing the Company’s business.
The Chairman of the Board is Mr Arnaud Lagesse and the Chief Executive Officer (CEO) is Mr Paul Jones.
The Chairman is responsible for:
> Leading the Board to ensure its effectiveness in all aspects of its role
> Setting the agenda and ensuring that adequate time is granted to discuss all agenda items particularly strategic issues
> Ensuring that the Directors receive complete, adequate information in a timely manner
> Ensuring effective communication with shareholders
> Encouraging constructive relations within the Board and between the Board and Management
> Facilitating the effective contribution of non-executive directors in particular
> Promoting high standards of Corporate Governance
The Board notes that the Chairman plays an instrumental role in developing the business of the Group and that he provides the Group with strong leadership and vision.
4.5 Board membership
4.5.1 Role of the Corporate Governance & Nomination Committee in the Director’s appointment
The Corporate Governance & Nomination Committee (CGNC) is responsible for selecting and appointing new Directors.
All new Board members are first considered, reviewed, and recommended by the CGNC, before being brought up to the Board for approval. Potential candidates for casual vacancies are sourced with recommendations from Directors, or the Shareholders as provided in article 13.1.5 of the Constitution of the Company. The CGNC then evaluates the suitability of potential candidates for the position, taking into account, inter alia, the candidate’s age, gender, skills, knowledge, experience and ability to contribute to the Board’s effectiveness.
98
LUX ISLAND RESORTS LTD AND ITS SUBSIDIARIES
Upon the CGNC recommendation, the Board approves the new Director.
In accordance with the provisions of CGNC governing the election and reelection of Directors, all Directors are to present themselves for re-election every year at the Annual Meeting of Shareholders. Newly-appointed Directors, during the year under review, must present themselves for election at the forthcoming Annual Meeting of Shareholders.
Under Section 138 of the Companies Act 2001 of Mauritius, the office of a Director shall become vacant at the conclusion of the Annual Meeting of Shareholders commencing next after the Director attains the age of 70 years, and shall then be subject to yearly re-appointment. The Board is satisfied with the current practice.
This year, to comply with the provisions of the Code, Messrs Arnaud Lagesse, Paul Jones, Jean-Claude Béga, Jean de Fondaumière, Laurent de la Hogue, Désiré Elliah, Thierry Lagesse, Stéphane Lagesse and Maxime Rey will submit their re-election as Board Members at the forthcoming Meeting of Shareholders. Mrs Pascale Lagesse, who was appointed by the Board on 20th April 2017, will submit, for approval, her election at the Annual Meeting of Shareholders.
The CGNC has recommended the re-election and election of the Board members listed above, after taking into consideration each one’s attendance, participation, contribution and performance during the past year.
4.5.2 Directors’ time, commitment, and multiple directorships
The 2016 NCGC recommends that Directors collectively come to a consensus on the maximum number of listed-company Boards that each Director may serve on, in order to properly address time commitment issues that may arise due to one individual serving on multiple Boards.
The Board believes that each Director who already serves on several Boards, when accepting yet another appointment, has the individual responsibility to personally determine the demands of his competing directorships and obligations, and ensure that he can allocate sufficient time and attention to the affairs of each Company.
The Board considers that setting a limit on the number of listed-company directorships a Director may hold is arbitrary, given that time requirements for each person vary. Therefore, the Board prefers not to be prescriptive. As a safeguard, the CGNC reviews each Director’s ability to devote sufficient time and attention to the affairs of the Company during the CGNC’s annual assessment process. The CGNC is currently satisfied with the time committed by each Director to meeting attendance.
4.5.3 Board performance
The new code requires that a formal annual assessment of the effectiveness of the Board as a whole and its Board committees, as well as each Director’s contribution to the effectiveness of the Board.
4.5.4 Board Evaluation Process
The CGNC is tasked with carrying out the processes implemented by the Board, assessing the effectiveness of the Board as a whole and the contribution by each individual Director to the effectiveness of the Board on an annual basis.
The company has established a system of Board Appraisal to assess the effectiveness/ performance of the Board and acts upon, when deemed appropriate, feedbacks from Board members on improvement.
CORPORATE GOVERNANCE REPORT
99
ANNUAL REPORT 2017
The Board Appraisal is conducted annually by means of a questionnaire filled by each Director. The questions are categorized as follows:
> Company’s relationship and communication with its shareholders
> Board’s responsibilities and relationship with Executive Management
> Size, composition and independence of the Board
> Board Meetings and Chairman’s appraisal
> Board’s committees
> Director’s self-assessment
The results are analysed and discussed in the CGNC and improvement actions are considered for implementation. For the year under review, the evaluation process confirmed that a majority of directors consider the Board to be effective and well-balanced.
During the annual evaluation process, each Director is required to complete the respective forms for self-assessment of the performance of the Board, based on predetermined and approved performance criteria.
When deliberating on the performance of a particular Director who is also a member of the CGNC, that member abstains from the discussion in order to avoid any conflict of interests.
The Board considers that the current assessment of the Board and Individual Directors is sufficient for the Company.
4.6. Access to information
In order to fulfil their responsibilities, the Directors should be continuously provided with complete, adequate and timely information prior to Board meetings so as to enable them to make informed decisions to discharge their duties and responsibilities.
4.6.1 Complete, adequate, and timely information
To ensure that the Board is able to fulfil its responsibilities, Management provides the Board with complete and adequate information in a timely manner. Such information extends to documents on matters to be brought up at Board and Board Committee meetings which, as a standard procedure, are circulated to Board and Board Committees members, and in some cases, in advance for their review and consideration.
Senior Management, the Company’s auditors and other professionals who can provide additional insights into matters to be discussed at Board and/or Board committee meetings are also invited to be present at these meetings, when necessary. As Directors may have further queries on the information provided, they have separate and independent access to the Company’s Senior Management, which addresses individual Directors’ requests for additional information/documents accordingly.
Management provides the Board with the Group’s Financial Statements and Management Reports on a quarterly basis and upon request, as and when required. Explanations are given by Management for material variance (if any) between any projections in the budget and actual results.
100
LUX ISLAND RESORTS LTD AND ITS SUBSIDIARIES
4.6.2 Company secretary
Directors may separately and independently contact the Company Secretary or its nominee who attends and prepares minutes for all Board meetings. The Company Secretary’s role is defined, and includes the responsibility for ensuring that Board procedures are followed and that applicable rules and regulations are abided by.
The appointment and dismissal of the Company Secretary are matters requiring the Board’s approval.
The role of the Company Secretary is established by LUX Hospitality Ltd, represented by Mr Désiré Elliah. Please refer to page 13 for Mr Désiré Elliah’s qualifications and experience.
4.6.3 Independent professional Advice
The Directors, either individually or as a group, in the furtherance of their duties, can require professional advice. The Company Secretary can assist them in obtaining independent professional advice at the Company’s expenses.
5. COMMITTEES OF THE BOARD
5.1. Audit & Risk Committee
The Audit & Risk Committee is governed by a Charter in line with the provisions of the Code of Corporate Governance for Mauritius (“the Code”). The Charter of the Audit & Risk Committee is available on the website of the Company and has been approved by the Audit & Risk Committee.
The Board considers that the members of the Audit & Risk Committee are appropriately qualified to discharge their responsibilities of the Audit & Risk Committee. None of the members of the Audit & Risk Committee were previous partners or directors of the external auditing firms, namely Ernst and Young (“EY”), and none of the members of the Audit & Risk Committee hold any financial interest with regards to EY.
The Audit & Risk Committee has the explicit authority to investigate any matter within its terms of reference. In addition, the Audit & Risk Committee has full access to, and co-operation of, the Management as well as full discretion to invite any Director or executive officer to attend its meetings. Reasonable resources are made available to enable the Audit & Risk Committee to discharge its functions properly.
In addition to its statutory functions, the Audit & Risk Committee considers and reviews any other matters as may be agreed to by the Audit & Risk Committee and the Board. The duties of the Audit & Risk Committee includes amongst others:
a. Reviewing significant financial reporting issues and judgements so as to ensure the integrity of the financial statements of the Group and any formal announcement relating to the Group’s financial performance.
b. Reviewing and reporting to the Board, at least annually, the adequacy and effectiveness of the Group’s internal controls, including financial, operational, compliance and information technology controls.
c. Reviewing the effectiveness of the Group’s internal audit function.
d. Reviewing the scope and results of the external audit, and the independence and objectivity of the external auditors.
e. Making recommendations to the Board on the proposals to the shareholders on appointment, re-appointment and dismissal of external auditors, and approving the remuneration and terms of engagement of the external auditors.
CORPORATE GOVERNANCE REPORT
101
ANNUAL REPORT 2017
The Audit & Risk Committee reviews with Management, and where relevant, the auditors, the results announcements, annual report and financial statements, interested person transactions and corporate governance, before submission to the Board for approval and adoption.
In performing its functions, the Audit & Risk Committee meets with the internal and external auditors, and reviews the audit plans and overall scope of both internal and external audits, and the co-operation and assistance given by Management to the respective auditors. Where necessary, the Audit & Risk Committee also meets separately with the internal and external auditors whereby any issues may be raised directly to the Audit & Risk Committee, without the presence of Management. The internal and external auditors have unrestricted access to the Audit & Risk Committee.
The Audit & Risk Committee has discussed with external auditors and Management on matters of significance which are included under “Key Audit Matters” in the Independent Auditor’s Report. The Audit & Risk Committee is satisfied that these matters have been appropriately addressed. The Audit & Risk Committee recommended to the Board to approve the audited financial statements of the Group for the financial year ended 30th June 2017 (“FY 2017 Financial Statements”). The Board has approved the FY 2017 Financial Statements on 26th September 2017.
The Audit & Risk Committee met 6 times during the year and has considered the following:
> Approval of the financial statements as at 30th June 2016
> Approval of the results for Q1, Q2 and Q3
> Review of the budget for 2017/18
> Audit Plan for 2017/2018
> Taken cognizance of the internal and external audit reports issued
The members of the Audit & Risk Committee are as follows:
Jean de Fondaumière (Chairman) Independent non-executive DirectorJean-Claude Béga Non-executive DirectorStéphane Lagesse Non-executive DirectorMaxime Rey Non-executive Director
Profiles and qualifications of the members of the Audit Committee are disclosed on pages 12-14.
5.2 Corporate Governance and Nomination Committee
The Corporate Governance and Nomination Committee is governed by a charter that determines the objects and functions of the Committee.
The Charter of the Corporate Governance and Nomination Committee is available on the website of the Company and has been approved by the Corporate Governance and Nomination Committee.
102
LUX ISLAND RESORTS LTD AND ITS SUBSIDIARIES
The main role of the Corporate Governance and Nomination Committee is to advise and make recommendations to the Board on all aspects of corporate governance which should be followed by the Company, so that the Board remains effective while complying with sound and recommended corporate practices and principles.
The members of the Committee are :
Arnaud Lagesse - ChairmanAlexis Harel Christof Zuber
Messrs Christof Zuber and Alexis Harel are Independent Non-Executive Directors on the Board of Lux Hospitality Ltd. Please refer to page 20 and 21 for details about Lux Hospitality Ltd.
Profiles and qualifications of the members of the Corporate Governance and Nomination Committee are disclosed on pages 12-14 and 20-21.
5.3 Remuneration Committee
The Remuneration Committee is governed by a charter that determines the role and responsibilities of the Committee. The Charter of the Remuneration Committee is available on the website of the Company and has been approved by the Remuneration Committee.
The duties of the Remuneration Committee include, amongst others, the recommendation to the Board for approval of the following:
> The organisational chart of the Company
> A general framework of remuneration for the Board and key management personnel;
> Specific remuneration packages for each director and key management personnel; and
> The company’s obligations in the event of the termination of an executive director or key management personnel’s contract of service, to ensure that such contracts of service contain fair and reasonable termination clauses that are not overly generous.
The Remuneration Committee may, during its annual review of remuneration of Directors and key management personnel, seek advice from external remuneration consultants as and when deemed necessary.
None of the members of the Remuneration Committee are involved in deliberations regarding remuneration, fees, compensation, incentives or any other form of benefits granted.
The Remuneration Committee includes the following directors:
Christof Zuber – Chairman Arnaud Lagesse Jean de FondaumièreAlexis Harel
Messrs Christof Zuber and Alexis Harel are Independant Non-Executive Directors on the Board of Lux Hospitality Ltd. Please refer to pages 20 and 21 for Director's profile.
The Board views that the current composition is adequate, with a Chairman qualified as independent director.
Profiles and qualifications of the members of the Remuneration Committee are disclosed on pages 12-14 and 20-21.
CORPORATE GOVERNANCE REPORT
103
ANNUAL REPORT 2017
6. CALENDAR OF IMPORTANT EVENTS
Publication of 1st quarter results October 2017
Annual Meeting of Shareholders December 2017
Declaration/payment of interim dividend (if applicable) November/December 2017
Publication of half-yearly results January 2018
Publication of 3rd-quarter results April 2018
Declaration/payment of final dividend (if applicable) June 2018
Financial year-end June 2018
Publication of abridged end-of-year results August 2018
7. SHAREHOLDING
7.1 Shareholding
As at 30th June 2017, the Company’s share capital was Rs 1,371,159,430 (137,115,943 shares) with 5,177 shareholders (30.06.16: 5,288) present on the registry.
The directors regard IBL Ltd (formerly known as GML Investissement Ltée - GMLIL) as the ultimate holding company and as at 30th June 2017, two directors were common to the Company and IBL Ltd, namely Messrs Arnaud Lagesse and Thierry Lagesse.
Shareholding of more than 5% of the Company at 30th June 2017:
IBL Ltd 39.27%
MCB Group 10.00%
Swan Life Ltd 6.36%
National Pension Fund 5.56%
Other shareholders 38.81%
Total 100.00%
104
LUX ISLAND RESORTS LTD AND ITS SUBSIDIARIES
7.2 Shareholding profile
The Company’s shareholding profile as at 30th June 2017 was as follows:
DEFINED BRACKETSNUMBER OF SHAREHOLDERS
NUMBER OF SHARES OWNED
PERCENTAGE %
1-500 2,507 337,412 0.246
501-1,000 521 403,320 0.294
1,001-5,000 1,082 2,681,735 1.956
5,001-10,000 375 2,764,496 2.016
10,001-50,000 488 10,121,264 7.382
50,001-100,000 86 6,354,454 4.634
100,001-250,000 72 11,109,591 8.102
250,001-1,000,000 38 16,924,106 12.343
1,000,001-1,500,000 2 2,504,161 1.826
Over 1,500,000 6 83,915,404 61.2
7.3 Summary of Shareholder Category
CATEGORY OF SHAREHOLDERSNUMBER OF SHAREHOLDERS
NUMBER OF SHARES OWNED
% OF TOTAL ISSUED SHARES
Individuals 4,706 30,781,305 22.45
Insurance and assurance companies 15 9,447,033 6.89
Pension and provident funds 125 21,005,698 15.32
Investment and trust companies 36 1,598,637 1.17
Other corporate bodies 295 74,283,270 54.17
7.4 Share Price Information
At the time of reporting, the share price of the company was around Rs 62.50/- compared to Rs 59.25- at the same period for the previous financial statements.
CORPORATE GOVERNANCE REPORT
105
ANNUAL REPORT 2017
7.5 Shareholder rights and responsibilities
7.5.1 Shareholder Rights
The Company recognizes the importance of maintaining transparency and accountability to its shareholders. The Board ensures that the Company’s shareholders are treated fairly and equitably, and that their rights are protected.
The Company is committed to providing shareholders with adequate, timely, and sufficient information pertaining to the Group’s business which could have a material impact on the Company’s share price.
All shareholders of the Company are entitled to attend and vote at general meetings, in person or by proxy. Shareholders also receive the annual reports of the Company and the notice of Annual General Meetings, which notice is also advertised in the newspapers.
7.5.2 Communication with shareholders
The Company actively engages with its shareholders to promote regular, effective, and fair communication with shareholders and investors at large.
Transparency and disclosure define the Company’s communication with shareholders. The Company is committed to delivering thorough and updated information to the global investing community, in order to support informed investment decisions. The Company does not practice selective disclosure of material information. The Company conveys material information and its quarterly results through published announcements, and is required to comply with the provisions of the Listing Rules on the continuous disclosure obligations. Results and annual reports are announced and issued within the specified period. All announcements are posted immediately on the Company’s website.
The Company conducts regular analysts and media meetings. For the results announcements, the Company provides materials, including financial statements and Management discussions and analysis in the form of presentation slides and press releases. During these meetings, the Chairman and the Chief Executive Officer review the most recent performance, analysis, business key-value drivers and metrics, and share the Company’s insights and business strategy. On this occasion, analysts, fund managers and reporters have the opportunity to ask questions to the Chairman and the Chief Executive Officer. Any figures or information presented during these panels are simultaneously posted on the Company’s website.
7.6 Dividend Policy
The declaration amount and payment of future dividends depend on many factors, including the results of operations, cash flow and financial conditions, expansion, working capital requirements, future projects, and other factors deemed relevant by the Board and the Shareholders.
However, subject to internal cash-flow requirements and the need for future capital investments, it is the Company's policy to declare 50% dividends out of profits available for distribution, in accordance with the Companies Act 2001.
The Audit & Risk Committee and the Board ensure that the Company satisfies the solvency test at each dividend declaration.
The Board declared a final dividend of Rs 1.25 with respect to the year ended 30th June 2017 (2016: Rs 1.15 per share), subject to the shareholders’ ratification at the forthcoming Annual Meeting of Shareholders.
106
LUX ISLAND RESORTS LTD AND ITS SUBSIDIARIES
Summary of dividend per share paid over the past five years in Rs:
PERIOD INTERIM FINAL TOTAL
Year ended 30th June 2013 nil nil nil
Year ended 30th June 2014 nil 0.50 0.50
Year ended 30th June 2015 nil 1.00 1.00
Year ended 30th June 2016 nil 1.15 1.15
Year ended 30th June 2017 nil 1.25 1.25
7.7 Conduct of Shareholder Meetings
During the Annual Meeting, which is held in Mauritius, Shareholders are given the opportunity to communicate their views and to engage with the Board and Management with regard to the Group’s business activities and financial performance.
Directors are encouraged to attend Shareholders’ meetings. The members of the Audit & Risk Committee and Remuneration Committee and external auditors are asked to be present at such meetings.
The Constitution also allows a shareholder of the Company to appoint a proxy (in the case of an individual shareholder) or a representative (in the case of a shareholder company, by way of a written resolution), whether a shareholder or not, to attend and vote on their behalf.
At a Shareholders’ meeting, each issue is proposed in a separate resolution:
> The approval of the audited financial statements
> The Annual Report
> The ratification of dividend (if applicable)
> The election or re-election of Directors of the Board
> The appointment or re-appointment of Auditors under section 200 of the Companies Act 2001
> The ratification of the remuneration paid to the Auditors
> Any other matter which may require the Shareholder’s approval
CORPORATE GOVERNANCE REPORT
107
ANNUAL REPORT 2017
7.8 Shareholding as regards directors
7.8.1 Interests of Directors
The table below outlines each Director’s respective direct and indirect interests and number of other directorships in listed companies as at 30th June 2017.
DIRECT INTERESTSHARES %
INDIRECT INTEREST%
NUMBER OFOTHERDIRECTORSHIPS IN LISTED COMPANIES
DIRECTORS
Jean-Claude Béga 239,253 0.17 - 5
Jean de Fondaumière 37,932 0.02 - 5
Laurent de la Hogue 25,000 0.01 - 2
Désiré Elliah 749,977 0.54 - -
Paul Jones 287,000 0.20 - -
Arnaud Lagesse 23,877 0.01 0.49 6
Pascale Lagesse - - - -
Thierry Lagesse 1,378 0.00 - 4
Stéphane Lagesse 118,276 0.08 - 2
Maxime Rey 4,000 0.00 - 5
Alternate Directors
Amaury Lagesse (Alternate to Stéphane Lagesse) 20,933 0.01 - -
Deodass Poolovadoo (Alternate to Désiré Elliah) 389,071 0.28 - -
Other than having shares in the Holding company, except for the below, none of the directors have any interest in the subsidiaries of the Company.
Following the implementation of the share scheme, the following executive directors have direct holding in the subsidiary, LUX Hospitality Ltd. Please refer to pages 18-21 for further information on LUX Hospitality Ltd.
% HOLDING IN LUX HOSPITALITY LTD
Paul Jones 3.65
Désiré Elliah 1.19
108
LUX ISLAND RESORTS LTD AND ITS SUBSIDIARIES
During the period under review, share dealings by directors (including Alternate directors) were as follows:
NUMBER OF SHARESPURCHASED/(SOLD)DIRECTLY
NUMBER OF SHARESPURCHASED/(SOLD)INDIRECTLY
Arnaud Lagesse (14,548) -
Deodass Poolovadoo (40,000) -
The Company complies with Appendix 6 (Model Code for Securities transactions by Directors of Listed Companies) of the Listing Rules established by the Stock Exchange of Mauritius Ltd and ensures that all dealings in which a Director is or is deemed to be interested is conducted in accordance with the model code.
The Company keeps an Interests Register in accordance with the Companies Act 2001 and an Insider Register pursuant to the Securities Act 2005. The registers are regularly updated with the information submitted by the directors and/or other insiders as applicable.
8. SHAREHOLDERS AGREEMENT
There is no agreement among the shareholders of the Company.
9. MANAGEMENT AGREEMENTS
LUX Hospitality Ltd, a subsidiary of Lux Island Resorts Ltd, was incorporated for the purpose of securing management contracts from third-party owners. As from 1st February 2013, all existing management contracts between Poseidon Limitee and the hotels within the Group have been transferred to LUX Hospitality Ltd.
10. REMUNERATION MATTERS
10.1 Procedures for developing remuneration policies
There should be a formal and transparent procedure for developing policies on executive remuneration and for fixing the remuneration packages of individual directors. No director should be involved in deciding his own remuneration.
10.2 Level and mix of remuneration
The level and structure of remuneration should be aligned with the long-term interest and risk policies of the Company, and should be suitable to attract, retain and motivate (a) the directors to provide good stewardship of the company, and (b) key management personnel to successfully manage the Company. However, the Company should avoid paying more than is deemed necessary for this purpose.
CORPORATE GOVERNANCE REPORT
109
ANNUAL REPORT 2017
10.3 Executive Share Scheme
The Group has implemented an Employee Share Scheme for the executives and senior employees of the Company and its subsidiaries.
Executives and senior employees are granted shares in the subsidiary Company, LUX Hospitality Ltd.
Executives and senior management are granted a certain number of shares upon achievement of a number of quantitative and qualitative criteria.
The Executive Share Scheme was put into place to enhance the Company’s competitiveness in attracting and retaining talented key senior management and executives.
10.4 Remuneration of Executives Directors and key management personnel
In designing the compensation structure, the Company seeks to ensure that the level and mix of remuneration is competitive, relevant and suitable.
The remuneration structure for executive directors and key management personnel consists of (a) fixed remuneration (b) variable bonus and/ or (c) other benefits. Executive Directors do not receive directors’ fees.
The level of remuneration is determined by various factors including group performance, industry practices and the individual’s performance and contributions towards meeting conditions for the year under review.
10.5 Statement of Remuneration Philosophy
Every company should provide clear disclosure of its remuneration policies, level and mix of remuneration, and the procedure for setting remuneration, in the Company’s Annual Report. It should provide disclosure regarding its remuneration policies to enable investors to comprehend the link between remuneration paid to Directors and key management personnel, and performance.
All directors receive a fixed fee and an additional fee for each board meeting attended. In addition, members of the Audit & Risk Committee and Corporate Governance and Nomination Committee receive an extra fee for each committee meeting attended. No additional fees are paid to the members of the Remuneration Committee.
The level of Directors’ Fees is reviewed annually by the Remuneration Committee and/or the Board, during which, factors such as contributions, regulatory changes and responsibilities and market benchmarks are accounted for.
110
LUX ISLAND RESORTS LTD AND ITS SUBSIDIARIES
For the year ended 30th June 2017, there was no change to the fee structure, which was as follows:
BOARD
Annual director’s fees Rs100,000
Attendance fee Rs10,000
Audit & Risk Committee
Chairman’s Attendance fee Rs75,000
Member’s Attendance fee Rs50,000
Corporate Governance and Nomination Committee
Attendance fee Rs25,000
10.6 Remuneration of Executive Directors and Top Key Management personnel (KMP)
Executive Directors and KMP’s remuneration are not disclosed individually for the following reasons:
After having taken into account the size of the Company, its scope of business, the relevant personal comments and having determined that their remuneration is aligned to the relevant market range, The Company believes that it is not in its best interests to disclose the above remuneration to the full extent recommended, due to continuing sensitivity and confidentiality surrounding the issue of remuneration. Moreover, varying responsibilities for similar positions may encourage inappropriate peer comparisons or discontent and may, in certain cases, impede the Group’s ability to retain its talent pool in a competitive environment.
The top key Management personnel, listed in alphabetical order, who are not directors of the Company (“KMP”) for the year ended 30th June 2017 are as follows:
List of KMP
Marie-Laure Ah-You – Chief Strategy Officer
Nicolas Autrey – Chief Human Resources Officer
Pritila Joynathsing-Gayan – Chief Internal Auditor
Julian Hagger – Chief Sales and Marketing Officer
Dominik Ruhl – Chief Operating Officer
Guillaume Valet – Group Head of Legal, Secretarial and Corporate Affairs
10.7 Remuneration of the Non-Executive Directors
The Non-Executive Directors are not permitted to participate in any of the Company’s incentives arrangements in line with the National Code of Corporate Governance of Mauritius that stipulates that “they should not normally receive remuneration in the form of share options or bonuses associated with organizational performance”.
The aim of a Non-Executive Director basic fee is to provide a fair basic fee, at a rate that attracts and retains high-caliber Non-Executive Directors, and that acknowledges the scope of their role and required time commitment.
CORPORATE GOVERNANCE REPORT
111
ANNUAL REPORT 2017
11. RELATED PARTY TRANSACTIONS
Please refer to page 195, Note 36 of the Financial Statements section.
12. DONATIONS
The Company has a policy of channeling all requests for donations (excluding political donations, which are dealt with directly by the Board) and other forms of social assistance through its Corporate Social Responsibility function, duly incorporated under Lux Island Resorts Foundation since December 2009. Please refer to page 120, in Other Statutory Disclosures, for information regarding political and other donations.
13. ACCOUNTABILITY AND AUDIT
The Board should present a balanced and comprehensible assessment of the Company’s performance, position and prospects.
Accountability
The Board reviews and approves the results announcements, before the release of each announcement. In presenting the annual and quarterly financial statements to the shareholders, the Board aims to provide shareholders with a balanced and clear Assessment of the Company’s performance, position and prospects.
For the financial year under review, the Chief Executive Officer and the Chief Financial Officer have provided assurance to the Board on the integrity of the financial statements of the Company and its subsidiaries. For the interim financial statements, the Board gives its approval for the publication of the said accounts.
14. INTERNAL AUDIT
14.1 Internal audit
The Company has an in-house internal audit function. The primary role of the internal auditors is to assist the Audit Committee to ensure that the Company maintains a sound system of internal controls.
The Chief Internal Auditor (“CIA”) is independent of Executive Management and reports to the Audit Committee. On administrative matters, the CIA reports to the Chief Executive Officer. The Audit & Risk Committee approves the hiring and dismissal of the CIA and ensures that the internal audit function is adequately staffed and has appropriate standing within the Company. The internal audit function works in accordance with the Standards for the Professional Practice of Internal Audit set by the Institute of Internal Auditors.
The annual internal audit plan is established in consultation with, but independently of, Management, and is reviewed and approved by the Audit Committee. The CIA presents audit reports regularly to the Audit Committee and discusses key issues contained therein.
There was no limitation of scope placed on the internal auditors in conducting these audits.
112
LUX ISLAND RESORTS LTD AND ITS SUBSIDIARIES
14.2 Auditor Independence
The Audit & Risk Committee reviews the independence of the external auditors. During this process, the Audit & Risk Committee also reviews all non-audit services provided by the external auditors to ensure the nature and extent of such non-audit services do not affect their independence. The Audit & Risk Committee confirms that after reviewing all non-audit services, if any, by the external auditors during the financial year, they do not, in the Audit & Risk Committee’s opinion, affect the external auditor’s independence.
The Audit & Risk Committee has recommended to the Board that the external auditors be nominated for reappointment at the forthcoming Annual General Meeting.
In appointing the audit firms for the Group, the Audit & Risk Committee is satisfied by the Company’s compliance with the provisions of the Listing rules of the Stock Exchange of Mauritius Ltd.
14.3 Ethics and Whistleblowing
The Company’s Code of Ethics, which includes a section on conflict of interest, is applicable to all employees, senior officers and directors of the Company. The Whistleblowing Policy, which is an extension of the Code of Ethics, provides employees and other stakeholders a reporting channel on suspected misconduct or malpractice within the Company without fear of reprisal or victimisation. It also outlines the complaint handling and reporting processes to improve transparency.
All new employees and directors of the Company receive training on the Code of Ethics and the Whistleblowing policy.
The policies are available for viewing on the Company’s website.
15. RISK MANAGEMENT AND INTERNAL CONTROLS
The Board is responsible for the governance of risk. The Board should ensure that Management maintains a sound system of risk management and internal controls to safeguard shareholders’ interests and the Company’s assets, and should determine the nature and extent of the significant risks that the Board is willing to take to achieve its strategic objectives.
15.1 Responsibilities for Risk Management and Internal Controls
The Board, assisted by the Audit & Risk Committee and the internal auditors, is responsible for risk governance by ensuring that Management maintains a sound system of risk management and internal controls to safeguard shareholders’ interests and the Group’s assets, and determines the nature and extent of the significant risks that the Board is willing to take to achieve its strategic objectives.
15.2 The role and duties of the Audit & Risk Committee regarding management of risks
The Audit & Risk Committee has the duty to assist Management in its role of managing risks, as part of the Group’s efforts to strengthen its risks management processes and foster accountability for its adequacy and effectiveness.
CORPORATE GOVERNANCE REPORT
113
ANNUAL REPORT 2017
15.3 Audit & Risk Committee processes regarding management of risks
The Board has the ultimate responsibility for the governance and oversight of the risk management process. The Audit & Risk Committee assists the Board in their oversight of the process, financial reporting risk and the effectiveness of the Company’s internal control and compliance systems. The Management is responsible for assuring the Board as to the adequacy and effectiveness of the risk management lifecycle and ensuring the quality and timeliness of information.
The company’s risk management process comprises a disciplined and repeatable interaction structure that facilitates active involvement by the Board in evaluating the risk in strategic alternatives and operational decisions. These structures serve as a forum for Management to highlight both favorable and adverse factors affecting the business and its performance and associated risks, and in turn creates visibility for the Board and relevant stakeholders. The Board members and Management collectively determine the materiality of the risks and appropriate strategies to address them following which, pertinent risk governance structures are constituted. Governance policies are reviewed and approved by the Audit & Risk Committee.
15.4 Assurance for the Chief Executive Officer and the Chief Financial Officer.
The Board has received assurance from the Chief Executive Officer and the Chief Financial Officer that:
a. The financial records of the Group for the financial year ended 30th June 2017 have been properly maintained, and the financial statements give a true and fair view of the group’s operations and finances in accordance with the applicable financial reporting framework that are free from material misstatement; and
b. The system of risk management and internal controls in place within the Group is adequate and effective in addressing the material risks in the Group in its current business environment including material financial, operational, compliance and information technology risks.
The Chief Executive Officer and the Chief Financial Officer have in turn obtained relevant assurance from Auditors of the Group.
15.5 Opinion on adequacy and effectiveness of internal controls and risk management systems
The Audit & Risk Committee is responsible for making the necessary recommendations to the Board such that the Board can form an opinion concerning the adequacy and effectiveness of the risk management and internal control systems of the group.
The Board is satisfied by the Audit & Risk Committee’s adequate review of the Company’s internal controls, including operational, compliance and information technology controls, and risk management policies and systems established by Management. In its review, the Audit & Risk Committee was assisted by both the external and internal auditors. This review is conducted at least once a year.
Over the course of the audit, the external auditors carried out a review of the adequacy and effectiveness of the Group’s material internal controls, including financial, operational, compliance and information technology controls to the extent of their scope as laid out in their audit plan. Material non-compliance and internal control weaknesses noted during the audit are reported to the Audit & Risk Committee along with the recommendations of the external auditors.
114
LUX ISLAND RESORTS LTD AND ITS SUBSIDIARIES
Based on the framework established and maintained, the work performed by the Audit & Risk Committee, and the internal audit function as well as the assurance received from the Chief Executive Officer and the Chief Financial Officer, the Board with the concurrence of the Audit & Risk Committee, is of the opinion that the Group’s internal controls including financial, operational, compliance and information technology controls, and risk management systems, were adequate and effective in meeting the needs of the group in its current business environment.
The Board notes that the Company’s systems of internal controls and risk management provide reasonable, but not absolute, assurance that the Group will not be adversely affected by an event that can be reasonably foreseen. Furthermore, the Board also acknowledges that no system of internal controls and risk management can provide absolute assurance in this regard, or absolute assurance against the occurrence of material errors, poor judgment in decision-making, human error, losses, fraud or other irregularities.
15.6 Internal Control and Risk Management
The directors are responsible for ensuring that the system of controls that is in place is sufficient and appropriate in order to enable the Company to mitigate any risks that may impact its objectives. Such systems are designed to manage rather than eliminate the risk of failure to achieve business objectives and can provide only reasonable and not absolute assurance against misstatement or loss.
15.7 Risk Governance
Effective risk management is an integral part of the overall achievement of the Company’s strategic objectives. Our focus is on managing risks to ensure the long-term sustainability of our business.
The Board is ultimately responsible for establishing, maintaining and overseeing appropriate and effective risk management and internal control systems for the Company. It has given the Audit Committee the responsibility of overseeing these systems on an ongoing basis and assessing their adequacy and effectiveness.
16. RISK FACTORS
The Group’s corporate risk management policy is designed to effectively protect the interests of its customers, its environment and its shareholders. The mapping of key operational risks is updated on a regular basis with risks being prioritized according to their frequency and their economic impact on the Group.
This section presents the significant risks to which the Group considers itself exposed – strategic, operational, legal and financial – as well as the insurance coverage in place to deal with them.
CORPORATE GOVERNANCE REPORT
115
ANNUAL REPORT 2017
16.1 Strategic and operational risks
16.1.1 Risks related to the Group’s international exposure
> Sensitivity to economic conditions and geographical location
The Group is actually present in more than 5 countries and plans to increase its international exposure. Economic slowdowns in the regions where the Group trades adversely affect demand for leisure activities, particularly vacation travel. This means that the Group is exposed to the consequences of economic crisis and declines in consumer spending, which means fewer visitors.The impact of the resulting fluctuations in business volume is mitigated by the Group’s diverse geographical operating presence, its international customer base and the increasing flexibility of its business model.
> Natural disaster and weather
The Group is subject to major natural disaster and weather risks, such as natural disasters in its operating regions or in its customers’ home regions. These could be exceptional disasters such as tsunamis in Indonesia or Japan or extreme, but nevertheless more frequent, events such as cyclones in the Indian Ocean. Operating losses that may result are covered by the Group’s insurance policies where they cause localized damage.More generally, however, the diversity of geographical locations and a flexible commercial policy help to spread the risks related to natural disasters and adverse weather conditions.
> Act or threats or terrorism, risk of war or other adverse political events
The Group’s presence in several countries increases its exposure to geopolitical risks and the threat of terrorism.The Group’s strategy to limit its exposure to these risks is based on :
> The interchangeable nature of its customer flows, which is a natural consequence of the Group’s international presence and of the location of its operations in different geographical regions;
> More flexible operating models, such as management contracts, in areas particularly exposed to these risks
16.1.2 Risks related to the Group’s activities
> Competition
The Group operates in highly competitive markets, where the differentiating factors are brand recognition, company image, and the price and quality of services offered. Although the Group aims to raise its brand recognition continuously through advertising and promotional activities and by improving the excellence of its services, it faces increasing competition in its various operating regions.
> Brand image and reputation
The Group’s reputation rests on the quality and exclusivity of its services, as well as targeted communication policies. Inappropriate behavior on the part of employees or suppliers, or the circulation in the media of damaging information could harm the Group’s reputation, cause an adverse impact on sales and, beyond the direct damage, impact relations with the Group’s partners. To protect the Group from the risk of negative publicity, dedicated teams continually monitor the media and social networks on a permanent basis in order to activate a crisis management plan as needed. The Group may also see its reputation affected if it fails to take heed of the environmental issues surrounding its activities (climate change, strain on resources etc). Its entire environmental policy is aimed at guarding against such issues.
> Seasonality
The Group generates a significant share of its revenues during the school vacation periods and it follows that the negative impact of any event occurring over these periods is amplified.The internationalization of its customer base means that its hotels can be filled to optimum capacity by leveraging differences in school vacation calendars.
116
LUX ISLAND RESORTS LTD AND ITS SUBSIDIARIES
> Service quality
LUX is deeply concerned with customer satisfaction and providing high quality products and services. The Quality department and its contacts in the Business units are responsible for drafting quality standards to ensure consistency and uniformity of service delivery, as well as measuring customer satisfaction.
> Cost of air travel
The Group is not an air carrier, and consequently it is not directly exposed to fluctuations in oil prices. However, higher air charges could impact the purchasing power of its guests.
16.1.3 Other operational risks
> Suppliers and supply
The Group’s purchasing policy, implemented in the Country offices, focuses on the notion of responsible procurement, including compliance by suppliers with local regulations (customs, combating clandestine work, respect for labor laws etc) and environmental protection. In defining procurement strategies, the Purchasing department also takes into account the Group’s risk of dependency on a few strategic suppliers and may, if necessary, conduct an assessment of the financial health of certain suppliers.
> Information systems
The daily management of Group operations relies on reliable IT solutions and the good running order of technical systems and IT applications. To limit the risk of system malfunctions or failures or cyber crime threats exposing the Group to the loss or corruption of sensitive information (such as the personal data of its customers or employees) and to minimize the risk of downtime, the Group has implemented a technical and operational system that aims to mitigate such risk.
> Fraud and safeguarding of assets
The Group has developed rules and codes of conduct that are broadly communicated to its employees through the Ethics Charter as well as procedures aiming to limit the risk of fraud. In addition to the various checks performed by the Group Finance Department, the Internal Audit department also plays a crucial role in combating fraud.During internal audit assignments, identified risks of potential fraud (related to managing access to information systems) are systematically audited and the relevant teams are made aware of the preventive actions being implemented.
> Increase in the number of sites operated by subsidiaries
Compliance with Group rules is guaranteed by the consolidation of subsidiaries by geographical location (as business units). Business units are responsible for ensuring subsidiaries comply with local regulations.
16.2 Risks related to the environment, hygiene and safety
> Health, Safety and Security
Health and hygieneThe outbreak of an epidemic or the fear of one occurring could have an adverse effect on the number of visitors to the Group’s hotels. A business continuity plan has been defined by the Group to minimize the risk of disruption to services in the event of an epidemic.
> Safety of customers and employees abroad
Over the years, the Group has developed acute expertise in preventing risks related to the health, safety and security of its customers and employees, as well as in crisis management. Hotel audits are conducted regularly to identify risks to the safety of people and assets and to develop appropriate solutions to manage these risks. The properties where we operate are subject to local laws and regulations governing the health and safety requirements to which we have to abide to. We are currently working with two of the world’s leading inspection, verification, testing and certification companies:
a. SGS which is recognized as the global benchmark for quality and integrity, and operates over 2,000 offices and laboratories around the world, with more than 90,000 employees, and;
CORPORATE GOVERNANCE REPORT
117
ANNUAL REPORT 2017
b. Quantilab which is a Mauritian company, ISO 17025- accredited, multi-disciplinary laboratory and inspection service provider. Quantilab is partnered with Merieux NutrisSciences, with a presence in 21 countries through a vast network of over 80 accredited laboratories and 6 innovation centers.
Environmental Risks
Further information regarding the Group’s sustainable development practices are presented in the Corporate Social Responsibility section.
Risks related to changes in environmental regulations
Increasingly demanding energy efficiency and regulation, water management, waste sorting and recycling, infrastructure and equipment regulations are leading the Group to continually improve its environmental performance. Preventive processes, regular inspections as well as sustainable certification, which are in the process of being rolled out across all of the Group’s hotels allow for better management of environment-related risks.
Risks linked to the availability of resources
Aware of the impact of the depletion of natural resources, the Group does its utmost to limit its consumption of resources and, in particular, to improve its control over operating costs and anticipate developments in sustainable development-related regulations.Current and future pressure on energy resources may impact energy prices and the quality and reliability of supplies.
16.3 Legal Risks
16.3.1 Regulatory risk
Due to the nature of its business and its international presence, the Group is subject to varied, changing and sometimes contradictory laws and regulations in numerous areas (safety, health and environment, tourism, transportation, taxation, human resources and so on). The application of these laws and regulations can be a source of operating difficulty and can lead to disputes with suppliers, owners, staff and even local authorities.
Changes in laws and regulations applicable to the Group’s entities could in some cases limit the Group’s business activities as well as its ability to grow. These may also involve significant compliance costs, which could negatively impact the Group’s results and outlook.
16.3.2 Litigation risk
Litigation management
The Group is associated with a certain number of disputes and could in the future be involved in litigation. It could be forced to pay damages in relation to such litigation. In addition to the reputational harm resulting from an adverse court judgment, these payments could negatively affect the Group’s results and financial position.
As soon as the identified and proven risks are evaluated in a sufficient and reliable manner, and after discussions with its lawyers, provisions are made. The estimation of these risks has been analysed by Management, who considered that as of the reporting date, the various disputes did not call for provision expenses other than those already identified and mentioned in the consolidated financial statement in this Annual Report.
118
LUX ISLAND RESORTS LTD AND ITS SUBSIDIARIES
16.4 Insurance
Overview of the Group’s insurance policy
The Group’s risk management policy is part of a dynamic process: the systematic and centralized identification of risks, the implementation and coordination of insurance as part of worldwide activities, the organization of preventive and protective measures of property and persons and the deployment of a crisis management structure, internationally. The Group has not identified any significant risks which are not covered by insurance policies.
16.5 Financial Risks
The Group’s activities expose it to a variety of financial risks. A description of the significant risk factors is given below.
16.5.1 Credit risk
The Group’s credit risk is primarily attributable to its trade receivables. The amounts presented in the statement of financial position are net of allowances for doubtful receivables, estimated by the Group’s management based on prior experience and the current economic environment.
The Group has no significant concentration of credit risk, with exposure spread over a large number of counterparties and customers. The Group has policies in place to ensure that sales of products and services are made to clients with an appropriate credit history. Adequate insurance cover has also been taken against this form of risk.
16.5.2 Interest rate risk
The Group is exposed to interest rate risk as it borrows at variable rates (PLR, LIBOR, EURIBOR and OAT) + a margin. Any increase in these rates may negatively affect its results.
16.5.3 Foreign Exchange risk
It is a common practice in the hospitality industry to fix tariffs a year in advance. In order to achieve stability of tariffs in overseas markets, contracts with tour operators are denominated in the major international currency of the markets in which the foreign tour operator belongs.
A significant number of contracts are therefore denominated in Euros, Pounds sterling and US Dollars, with invoices raised in these currencies. While protecting the tour operators against any fall in the parity of the Mauritian Rupee, it exposes the Group to a fall in revenue should the Rupee appreciate against one or more of the international currencies.
16.5.4 Liquidity risk
Prudent liquidity risk management implies maintaining sufficient cash and making funds available through an adequate amount of committed credit facilities. The Group aims to maintain flexibility in funding by keeping reliable credit lines available.
CORPORATE GOVERNANCE REPORT
119
ANNUAL REPORT 2017
OTHER STATUTORY DISCLOSURES
DIVIDENDS
A dividend of Rs 1.25 per share, totalling Rs 171million, has been declared in respect of the financial year ended 30th June 2017 (2016: Rs 1.15 per share, totalling Rs 157 million).
DIRECTORS SERVICE CONTRACT
The Chief Executive Officer and the Chief Sales and Marketing Officer have service contracts which expire on 30th June 2019. The Executive Director of White Sand Resorts & Spa Pvt Ltd has a service contract which expires on 30th July 2019. The other Executive Directors of the Group have no service contract. Their employment is only subject to the Employment Rights Act and has no expiry date.
INDEMNITY INSURANCE
During the current year, the Directors of Lux Island Resorts Ltd and its subsidiaries have renewed the indemnity insurance cover for Directors’/Officers’ liability.
CONTRACT OF SIGNIFICANCE
During the year under review, there was no contract of significance.
DIRECTORS’ EMOLUMENTS
Remuneration and benefits (including bonuses and commissions) paid and payable by the Company and its subsidiaries were as follows:
Year ended 30 June 2017 Year ended 30 June 2016
Executive Non- Executive Executive Non- Executive
Rs Rs Rs Rs
The Company - 1,451,000 - 1,525,000
Subsidiary (note a) 104,167,000 - 94,621,000 -
(a) includes alternate directors.
Remuneration paid to each individual Executive Director has not been disclosed as the Directors consider this information as very sensitive in this very competitive environment.
120
LUX ISLAND RESORTS LTD AND ITS SUBSIDIARIES
DONATIONS
Donations made by the Group were as follows:
JUNE 2017 JUNE 2016
Political Others Political Others
Rs Rs Rs RsThe Company - - - -
The SubsidiariesHoliday & Leisure Resorts Limited - 29,000 - 162,000
Beau Rivage Co Ltd - 87,000 - 181,000
Les Pavillons Resorts Ltd - 325,000 - 83,000
Lux Hospitality Ltd - 495,000 - 118,000
White Sand Resorts & Spa Pvt Ltd - 274,500 - -
Nereide Ltd - 1,500 - 12,000
AUDITORS
The fees paid to the auditors, for audit and other services were as follows:
THE GROUP THE COMPANY
June 2017 June 2016 June 2017 June 2016
Rs Rs Rs Rs(a) Ernst & Young
Audit services 3,055,125 2,887,500 643,750 605,000
Other services - Taxation 185,000 185,000 25,000 25,000
Other services – Review of GRI report 400,000 - - -
3,559,000 3,072,500 668,750 630,000
(b) Other AuditorsAudit services 1,869,000 1,945,000 - -
Other services – EY Male – Taxation 77,000 - - -
Other services – BDO (Note 1) 230,000 - - -
2,176,000 1,945,000 - -
TOTAL 5,735,000 4,767,500 668,750 630,000
Note 1. - Fee paid to BDO for other services is in respect of conversion of SBRL financial statements & advisory services for disclosable transactions to shareholders with respect to sales of Tamassa hotel.
OTHER STATUTORY DISCLOSURES
121
ANNUAL REPORT 2017
STATEMENT OF DIRECTORS’ RESPONSIBILITIES IN RESPECT OF THE PREPARATION OF FINANCIAL STATEMENTS, INTERNAL CONTROL AND RISK MANAGEMENT
For the year under review, the directors report that:
> the financial statements fairly present the state of affairs of the Group and the Company as at the end of the financial year and the result of operations and cash flows for that period;
> adequate accounting records and an effective system of internal controls and risk management have been maintained;
> appropriate accounting policies supported by reasonable and prudent judgements and estimates have been used consistently;
> the financial statements have been prepared in accordance with International Financial Reporting Standards and comply with the Companies Act 2001 and the Financial Reporting Act 2004;
> the financial statements have been prepared on the going concern basis;
> they are responsible for safeguarding the assets of the Group and of the Company;
> they have taken reasonable steps for the prevention and detection of fraud and other irregularities; and
The external auditors are responsible for reporting on whether the financial statements are fairly presented.
Approved by the Board of Directors on 26th September 2017
and signed on its behalf by:
Arnaud Lagesse Jean de FondaumièreChairman Chairman of the Audit Committee
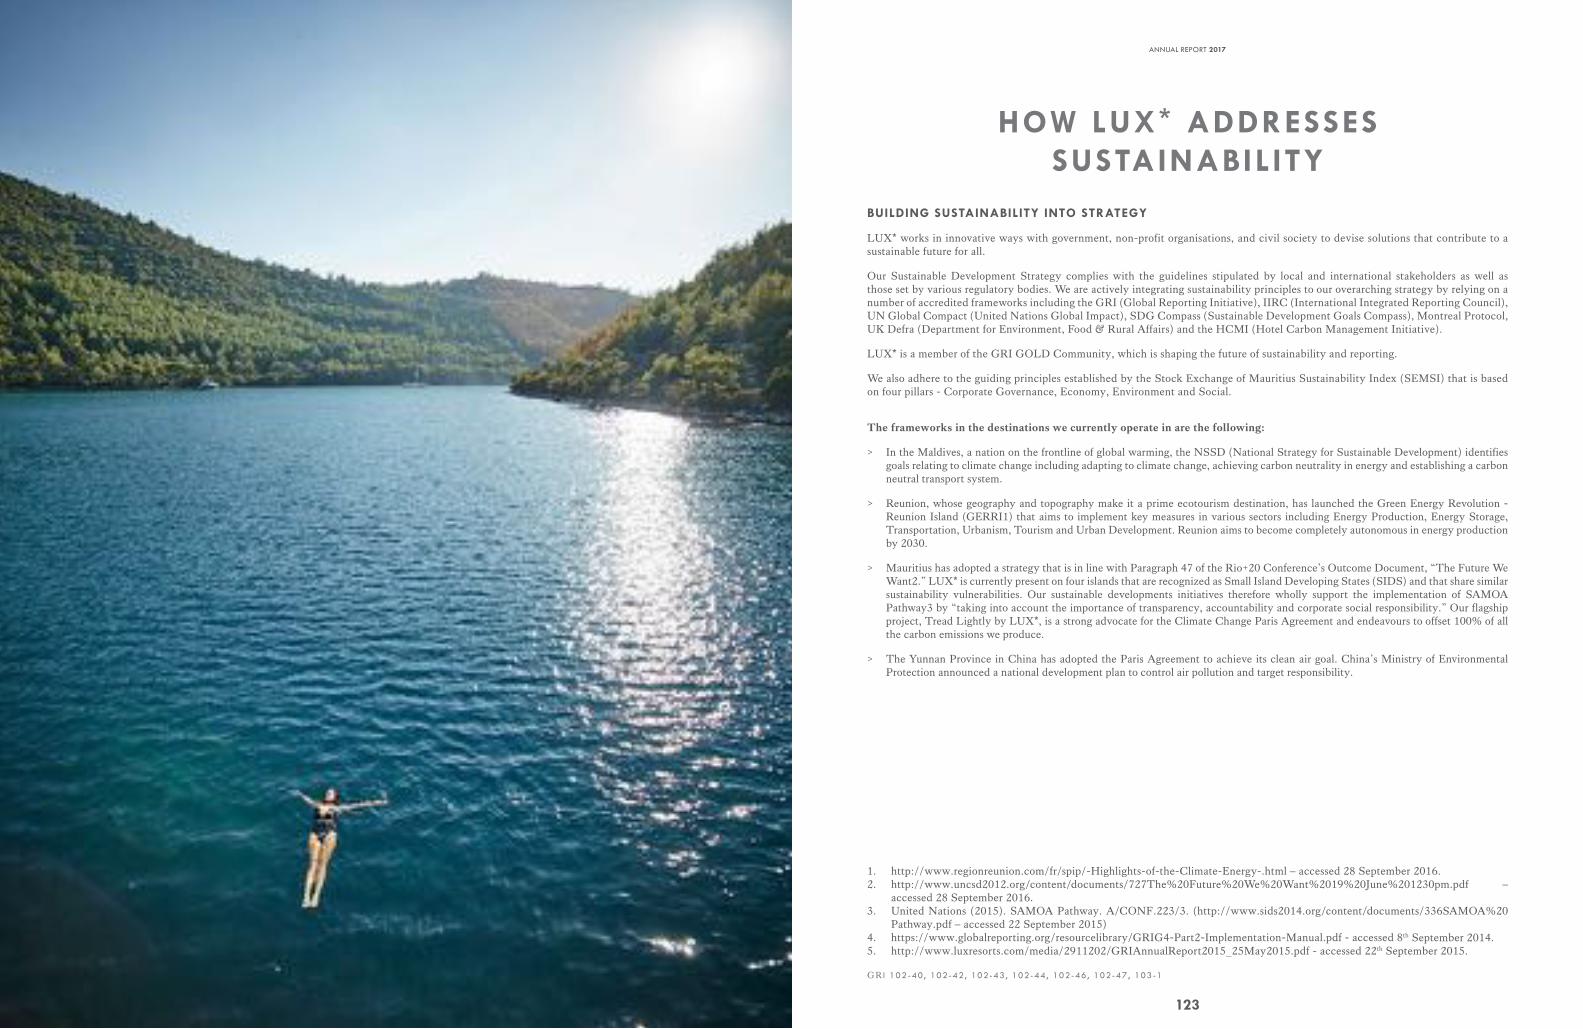
122
LUX ISLAND RESORTS LTD AND ITS SUBSIDIARIES
123
ANNUAL REPORT 2017
HOW LUX* ADDRESSES SUSTAINABILITY
BUILDING SUSTAINABILITY INTO STRATEGY
LUX* works in innovative ways with government, non-profit organisations, and civil society to devise solutions that contribute to a sustainable future for all.
Our Sustainable Development Strategy complies with the guidelines stipulated by local and international stakeholders as well as those set by various regulatory bodies. We are actively integrating sustainability principles to our overarching strategy by relying on a number of accredited frameworks including the GRI (Global Reporting Initiative), IIRC (International Integrated Reporting Council), UN Global Compact (United Nations Global Impact), SDG Compass (Sustainable Development Goals Compass), Montreal Protocol, UK Defra (Department for Environment, Food & Rural Affairs) and the HCMI (Hotel Carbon Management Initiative).
LUX* is a member of the GRI GOLD Community, which is shaping the future of sustainability and reporting.
We also adhere to the guiding principles established by the Stock Exchange of Mauritius Sustainability Index (SEMSI) that is based on four pillars - Corporate Governance, Economy, Environment and Social.
The frameworks in the destinations we currently operate in are the following:
> In the Maldives, a nation on the frontline of global warming, the NSSD (National Strategy for Sustainable Development) identifies goals relating to climate change including adapting to climate change, achieving carbon neutrality in energy and establishing a carbon neutral transport system.
> Reunion, whose geography and topography make it a prime ecotourism destination, has launched the Green Energy Revolution - Reunion Island (GERRI1) that aims to implement key measures in various sectors including Energy Production, Energy Storage, Transportation, Urbanism, Tourism and Urban Development. Reunion aims to become completely autonomous in energy production by 2030.
> Mauritius has adopted a strategy that is in line with Paragraph 47 of the Rio+20 Conference’s Outcome Document, “The Future We Want2.” LUX* is currently present on four islands that are recognized as Small Island Developing States (SIDS) and that share similar sustainability vulnerabilities. Our sustainable developments initiatives therefore wholly support the implementation of SAMOA Pathway3 by “taking into account the importance of transparency, accountability and corporate social responsibility.” Our flagship project, Tread Lightly by LUX*, is a strong advocate for the Climate Change Paris Agreement and endeavours to offset 100% of all the carbon emissions we produce.
> The Yunnan Province in China has adopted the Paris Agreement to achieve its clean air goal. China’s Ministry of Environmental Protection announced a national development plan to control air pollution and target responsibility.
1. http://www.regionreunion.com/fr/spip/-Highlights-of-the-Climate-Energy-.html – accessed 28 September 2016.2. http://www.uncsd2012.org/content/documents/727The%20Future%20We%20Want%2019%20June%201230pm.pdf –
accessed 28 September 2016.3. United Nations (2015). SAMOA Pathway. A/CONF.223/3. (http://www.sids2014.org/content/documents/336SAMOA%20
Pathway.pdf – accessed 22 September 2015)4. https://www.globalreporting.org/resourcelibrary/GRIG4-Part2-Implementation-Manual.pdf - accessed 8th September 2014.5. http://www.luxresorts.com/media/2911202/GRIAnnualReport2015_25May2015.pdf - accessed 22th September 2015.
GR I 102-40, 102-42, 102-43, 102-44, 102-46, 102-47, 103-1
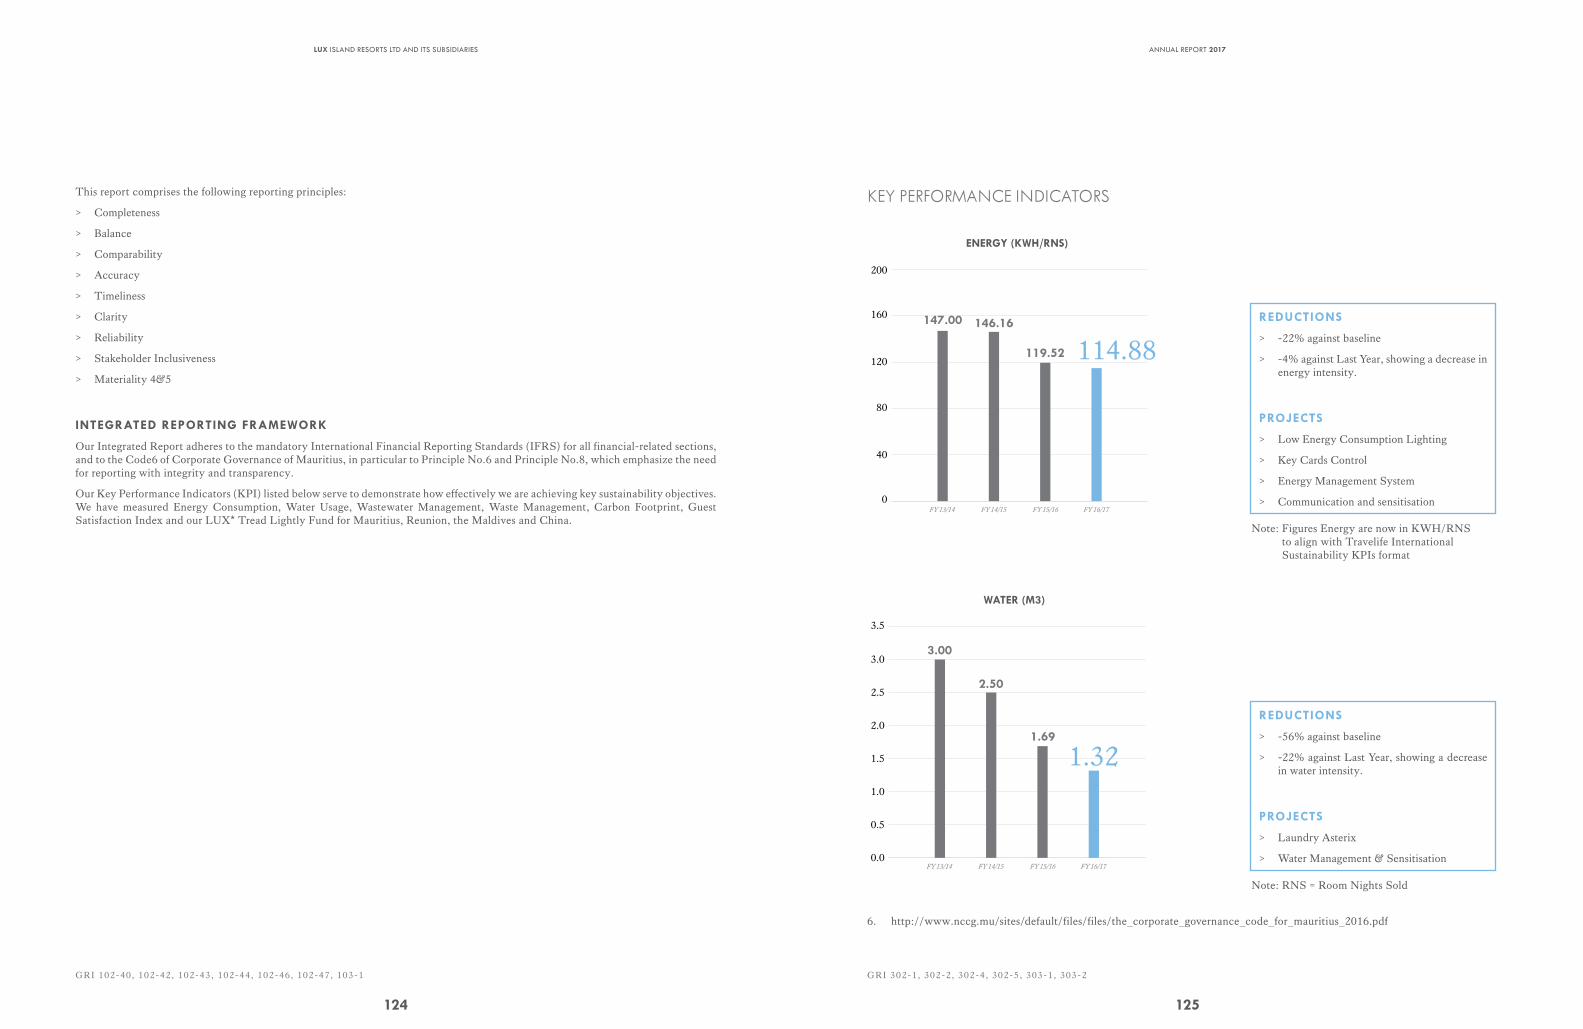
124
LUX ISLAND RESORTS LTD AND ITS SUBSIDIARIES
This report comprises the following reporting principles:
> Completeness
> Balance
> Comparability
> Accuracy
> Timeliness
> Clarity
> Reliability
> Stakeholder Inclusiveness
> Materiality 4&5
INTEGRATED REPORTING FRAMEWORK
Our Integrated Report adheres to the mandatory International Financial Reporting Standards (IFRS) for all financial-related sections, and to the Code6 of Corporate Governance of Mauritius, in particular to Principle No.6 and Principle No.8, which emphasize the need for reporting with integrity and transparency.
Our Key Performance Indicators (KPI) listed below serve to demonstrate how effectively we are achieving key sustainability objectives. We have measured Energy Consumption, Water Usage, Wastewater Management, Waste Management, Carbon Footprint, Guest Satisfaction Index and our LUX* Tread Lightly Fund for Mauritius, Reunion, the Maldives and China.
GRI 102-40, 102-42, 102-43, 102-44, 102-46, 102-47, 103-1
125
ANNUAL REPORT 2017
KEY PERFORMANCE INDICATORS
0
40
80
120
160
200
FY 16/17FY 15/16FY 13/14 FY 14/15
119.52
146.16147.00
114.88
ENERGY (KWH/RNS)
REDUCTIONS
> -22% against baseline
> -4% against Last Year, showing a decrease in energy intensity.
PROJECTS
> Low Energy Consumption Lighting
> Key Cards Control
> Energy Management System
> Communication and sensitisation
Note: Figures Energy are now in KWH/RNS to align with Travelife International Sustainability KPIs format
0.0
0.5
1.0
1.5
2.0
2.5
3.0
3.5
FY 16/17FY 15/16FY 13/14 FY 14/15
1.69
2.50
3.00
1.32
WATER (M3)
REDUCTIONS
> -56% against baseline
> -22% against Last Year, showing a decrease in water intensity.
PROJECTS
> Laundry Asterix
> Water Management & Sensitisation
Note: RNS = Room Nights Sold
6. http://www.nccg.mu/sites/default/files/files/the_corporate_governance_code_for_mauritius_2016.pdf
GRI 302-1, 302-2, 302-4, 302-5, 303-1, 303-2
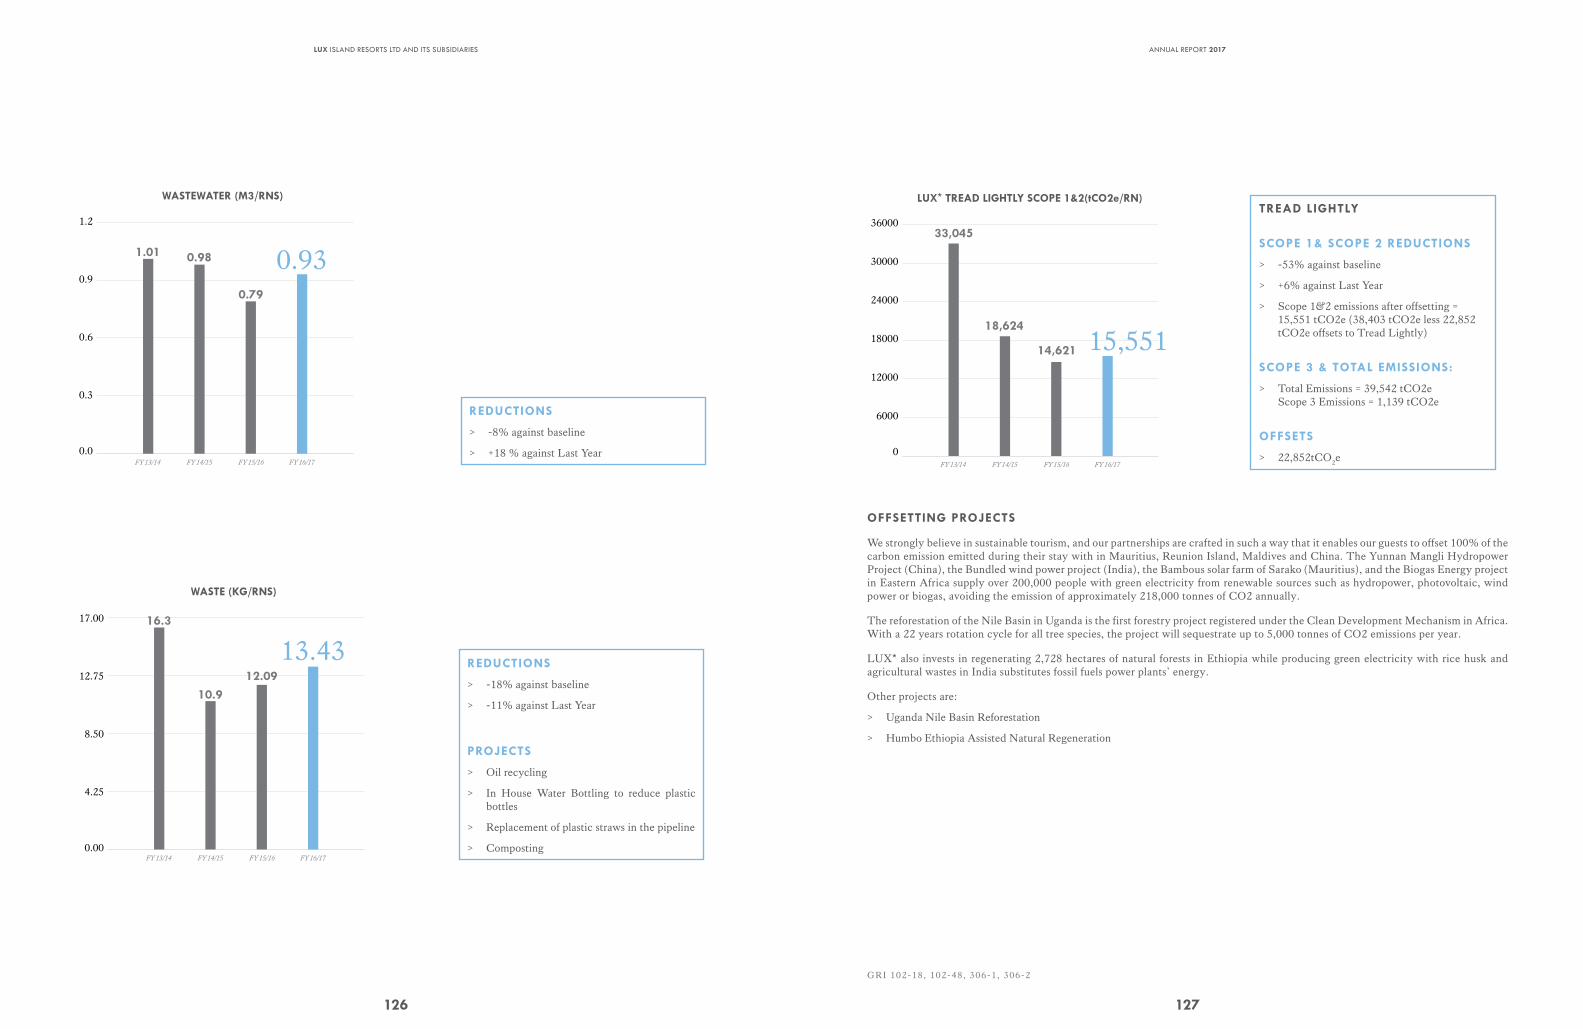
126
LUX ISLAND RESORTS LTD AND ITS SUBSIDIARIES
0.0
0.3
0.6
0.9
1.2
FY 16/17FY 15/16FY 13/14 FY 14/15
0.79
0.981.01 0.93
WASTEWATER (M3/RNS)
0.00
4.25
8.50
12.75
17.00
FY 16/17FY 15/16FY 13/14 FY 14/15
12.0910.9
16.3
13.43
WASTE (KG/RNS)
REDUCTIONS
> -18% against baseline
> -11% against Last Year
PROJECTS
> Oil recycling
> In House Water Bottling to reduce plastic bottles
> Replacement of plastic straws in the pipeline
> Composting
REDUCTIONS
> -8% against baseline
> +18 % against Last Year
127
ANNUAL REPORT 2017
0
6000
12000
18000
24000
30000
36000
FY 16/17FY 15/16FY 13/14 FY 14/15
14,621
18,624
33,045
15,551
LUX* TREAD LIGHTLY SCOPE 1&2(tCO2e/RN)
TREAD LIGHTLY
SCOPE 1& SCOPE 2 REDUCTIONS
> -53% against baseline
> +6% against Last Year
> Scope 1&2 emissions after offsetting = 15,551 tCO2e (38,403 tCO2e less 22,852 tCO2e offsets to Tread Lightly)
SCOPE 3 & TOTAL EMISSIONS:
> Total Emissions = 39,542 tCO2e Scope 3 Emissions = 1,139 tCO2e
OFFSETS
> 22,852tCO2e
OFFSETTING PROJECTS
We strongly believe in sustainable tourism, and our partnerships are crafted in such a way that it enables our guests to offset 100% of the carbon emission emitted during their stay with in Mauritius, Reunion Island, Maldives and China. The Yunnan Mangli Hydropower Project (China), the Bundled wind power project (India), the Bambous solar farm of Sarako (Mauritius), and the Biogas Energy project in Eastern Africa supply over 200,000 people with green electricity from renewable sources such as hydropower, photovoltaic, wind power or biogas, avoiding the emission of approximately 218,000 tonnes of CO2 annually.
The reforestation of the Nile Basin in Uganda is the first forestry project registered under the Clean Development Mechanism in Africa. With a 22 years rotation cycle for all tree species, the project will sequestrate up to 5,000 tonnes of CO2 emissions per year.
LUX* also invests in regenerating 2,728 hectares of natural forests in Ethiopia while producing green electricity with rice husk and agricultural wastes in India substitutes fossil fuels power plants’ energy.
Other projects are:
> Uganda Nile Basin Reforestation
> Humbo Ethiopia Assisted Natural Regeneration
GRI 102-18, 102-48, 306-1, 306-2
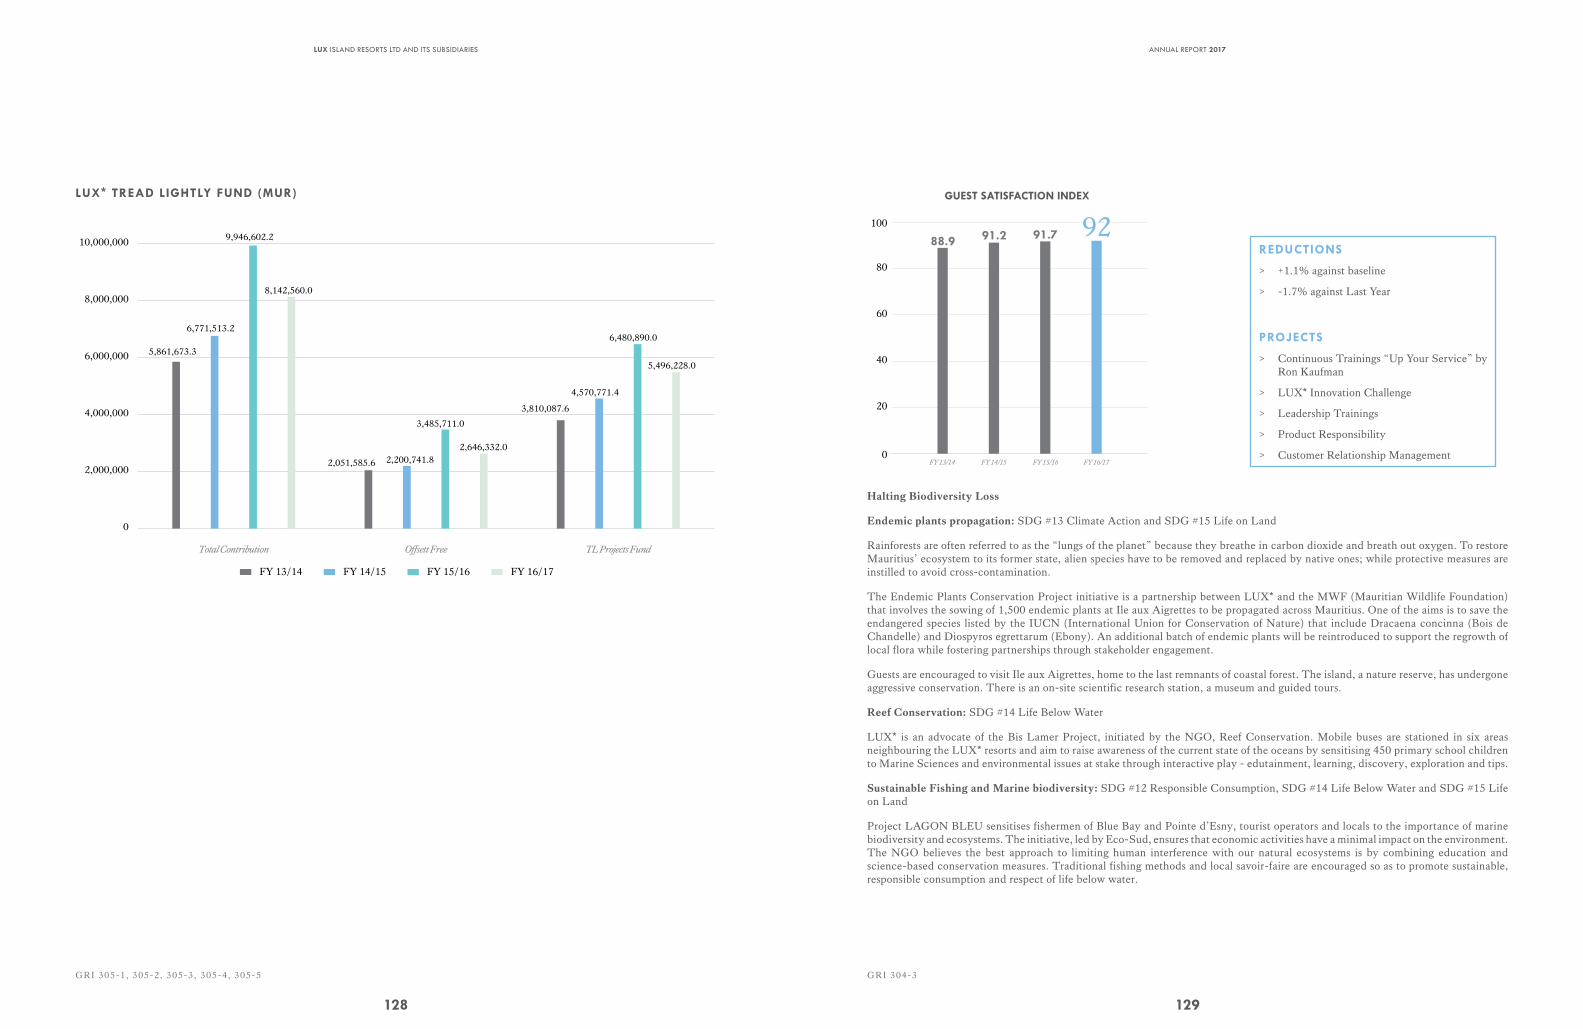
128
LUX ISLAND RESORTS LTD AND ITS SUBSIDIARIES
LUX* TREAD LIGHTLY FUND (MUR)
0
2,000,000
4,000,000
6,000,000
8,000,000
10,000,000
TL Projects FundOffsett FreeTotal Contribution
5,861,673.3
6,771,513.2
9,946,602.2
8,142,560.0
2,051,585.6 2,200,741.8
3,485,711.0
2,646,332.0
3,810,087.6
4,570,771.4
6,480,890.0
5,496,228.0
FY 13/14 FY 14/15 FY 15/16 FY 16/17
GRI 305-1, 305-2, 305-3, 305-4, 305-5
129
ANNUAL REPORT 2017
0
20
40
60
80
100
FY 16/17FY 15/16FY 13/14 FY 14/15
91.791.288.992
GUEST SATISFACTION INDEX
REDUCTIONS
> +1.1% against baseline
> -1.7% against Last Year
PROJECTS
> Continuous Trainings “Up Your Service” by Ron Kaufman
> LUX* Innovation Challenge
> Leadership Trainings
> Product Responsibility
> Customer Relationship Management
Halting Biodiversity Loss
Endemic plants propagation: SDG #13 Climate Action and SDG #15 Life on Land
Rainforests are often referred to as the “lungs of the planet” because they breathe in carbon dioxide and breath out oxygen. To restore Mauritius’ ecosystem to its former state, alien species have to be removed and replaced by native ones; while protective measures are instilled to avoid cross-contamination.
The Endemic Plants Conservation Project initiative is a partnership between LUX* and the MWF (Mauritian Wildlife Foundation) that involves the sowing of 1,500 endemic plants at Ile aux Aigrettes to be propagated across Mauritius. One of the aims is to save the endangered species listed by the IUCN (International Union for Conservation of Nature) that include Dracaena concinna (Bois de Chandelle) and Diospyros egrettarum (Ebony). An additional batch of endemic plants will be reintroduced to support the regrowth of local flora while fostering partnerships through stakeholder engagement.
Guests are encouraged to visit Ile aux Aigrettes, home to the last remnants of coastal forest. The island, a nature reserve, has undergone aggressive conservation. There is an on-site scientific research station, a museum and guided tours.
Reef Conservation: SDG #14 Life Below Water
LUX* is an advocate of the Bis Lamer Project, initiated by the NGO, Reef Conservation. Mobile buses are stationed in six areas neighbouring the LUX* resorts and aim to raise awareness of the current state of the oceans by sensitising 450 primary school children to Marine Sciences and environmental issues at stake through interactive play - edutainment, learning, discovery, exploration and tips.
Sustainable Fishing and Marine biodiversity: SDG #12 Responsible Consumption, SDG #14 Life Below Water and SDG #15 Life on Land
Project LAGON BLEU sensitises fishermen of Blue Bay and Pointe d’Esny, tourist operators and locals to the importance of marine biodiversity and ecosystems. The initiative, led by Eco-Sud, ensures that economic activities have a minimal impact on the environment. The NGO believes the best approach to limiting human interference with our natural ecosystems is by combining education and science-based conservation measures. Traditional fishing methods and local savoir-faire are encouraged so as to promote sustainable, responsible consumption and respect of life below water.
GRI 304-3
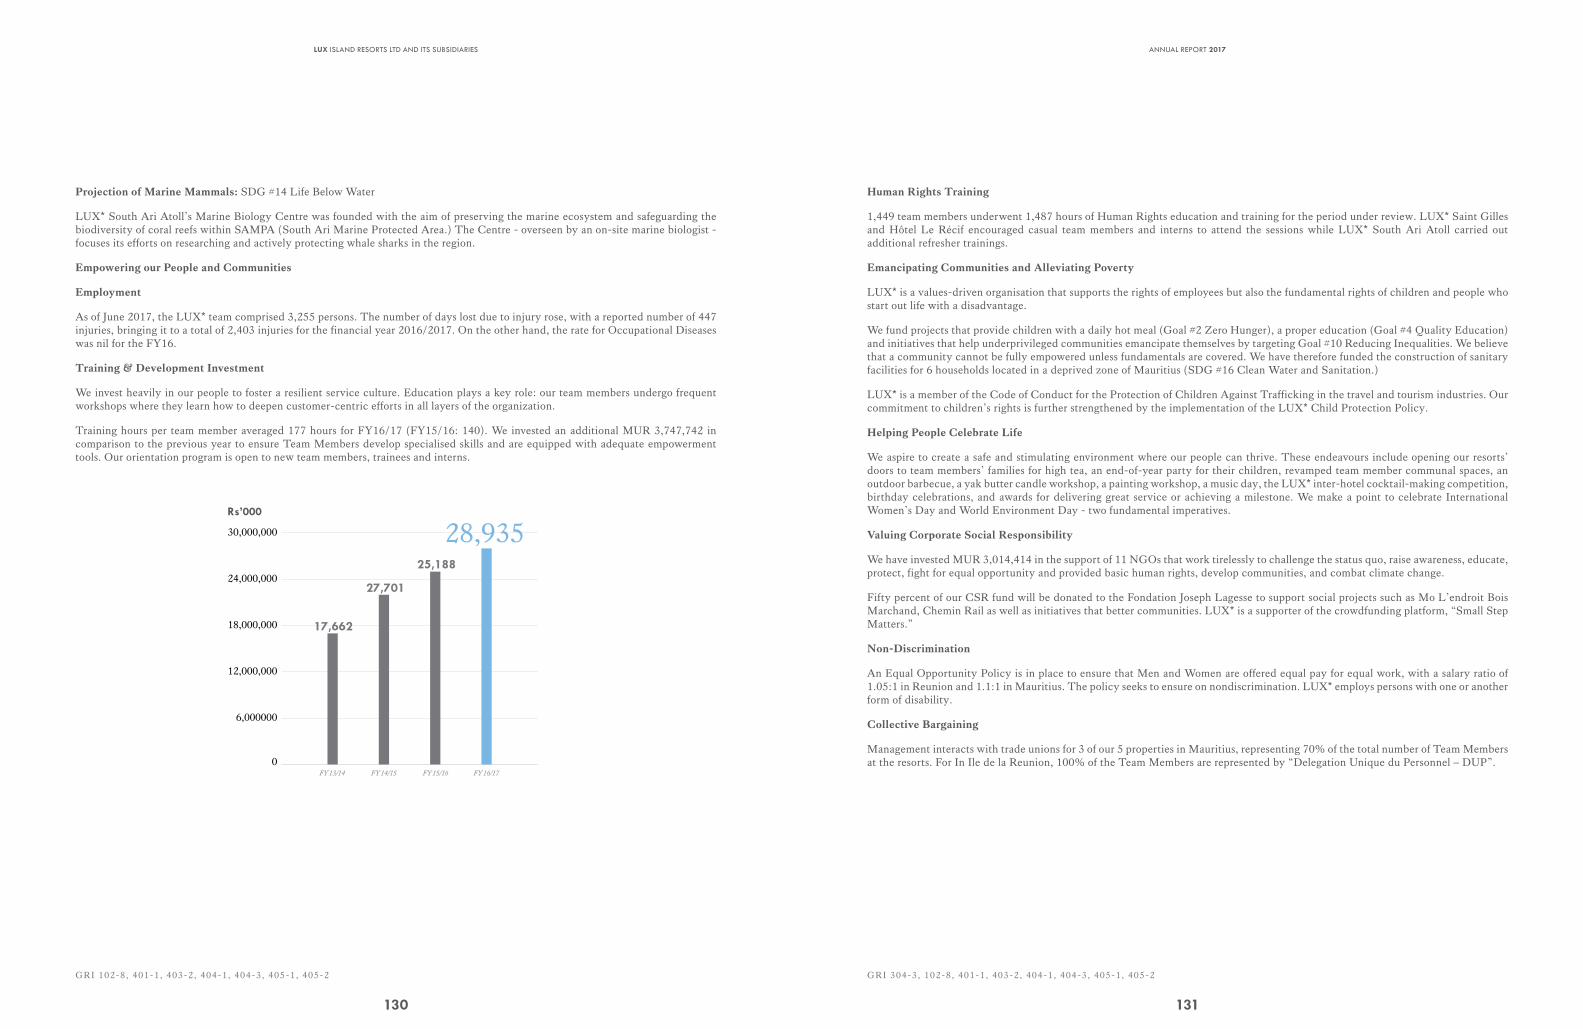
130
LUX ISLAND RESORTS LTD AND ITS SUBSIDIARIES
Projection of Marine Mammals: SDG #14 Life Below Water
LUX* South Ari Atoll’s Marine Biology Centre was founded with the aim of preserving the marine ecosystem and safeguarding the biodiversity of coral reefs within SAMPA (South Ari Marine Protected Area.) The Centre - overseen by an on-site marine biologist - focuses its efforts on researching and actively protecting whale sharks in the region.
Empowering our People and Communities
Employment
As of June 2017, the LUX* team comprised 3,255 persons. The number of days lost due to injury rose, with a reported number of 447 injuries, bringing it to a total of 2,403 injuries for the financial year 2016/2017. On the other hand, the rate for Occupational Diseases was nil for the FY16.
Training & Development Investment
We invest heavily in our people to foster a resilient service culture. Education plays a key role: our team members undergo frequent workshops where they learn how to deepen customer-centric efforts in all layers of the organization.
Training hours per team member averaged 177 hours for FY16/17 (FY15/16: 140). We invested an additional MUR 3,747,742 in comparison to the previous year to ensure Team Members develop specialised skills and are equipped with adequate empowerment tools. Our orientation program is open to new team members, trainees and interns.
0
6,000000
12,000,000
18,000,000
24,000,000
30,000,000
FY 16/17FY 15/16FY 13/14 FY 14/15
25,188
27,701
17,662
28,935Rs’000
GRI 102-8, 401-1, 403-2, 404-1, 404-3, 405-1, 405-2
131
ANNUAL REPORT 2017
Human Rights Training
1,449 team members underwent 1,487 hours of Human Rights education and training for the period under review. LUX* Saint Gilles and Hôtel Le Récif encouraged casual team members and interns to attend the sessions while LUX* South Ari Atoll carried out additional refresher trainings.
Emancipating Communities and Alleviating Poverty
LUX* is a values-driven organisation that supports the rights of employees but also the fundamental rights of children and people who start out life with a disadvantage.
We fund projects that provide children with a daily hot meal (Goal #2 Zero Hunger), a proper education (Goal #4 Quality Education) and initiatives that help underprivileged communities emancipate themselves by targeting Goal #10 Reducing Inequalities. We believe that a community cannot be fully empowered unless fundamentals are covered. We have therefore funded the construction of sanitary facilities for 6 households located in a deprived zone of Mauritius (SDG #16 Clean Water and Sanitation.)
LUX* is a member of the Code of Conduct for the Protection of Children Against Trafficking in the travel and tourism industries. Our commitment to children’s rights is further strengthened by the implementation of the LUX* Child Protection Policy.
Helping People Celebrate Life
We aspire to create a safe and stimulating environment where our people can thrive. These endeavours include opening our resorts’ doors to team members’ families for high tea, an end-of-year party for their children, revamped team member communal spaces, an outdoor barbecue, a yak butter candle workshop, a painting workshop, a music day, the LUX* inter-hotel cocktail-making competition, birthday celebrations, and awards for delivering great service or achieving a milestone. We make a point to celebrate International Women’s Day and World Environment Day - two fundamental imperatives.
Valuing Corporate Social Responsibility
We have invested MUR 3,014,414 in the support of 11 NGOs that work tirelessly to challenge the status quo, raise awareness, educate, protect, fight for equal opportunity and provided basic human rights, develop communities, and combat climate change.
Fifty percent of our CSR fund will be donated to the Fondation Joseph Lagesse to support social projects such as Mo L’endroit Bois Marchand, Chemin Rail as well as initiatives that better communities. LUX* is a supporter of the crowdfunding platform, “Small Step Matters.”
Non-Discrimination
An Equal Opportunity Policy is in place to ensure that Men and Women are offered equal pay for equal work, with a salary ratio of 1.05:1 in Reunion and 1.1:1 in Mauritius. The policy seeks to ensure on nondiscrimination. LUX* employs persons with one or another form of disability.
Collective Bargaining
Management interacts with trade unions for 3 of our 5 properties in Mauritius, representing 70% of the total number of Team Members at the resorts. For In Ile de la Reunion, 100% of the Team Members are represented by “Delegation Unique du Personnel – DUP”.
GRI 304-3, 102-8, 401-1, 403-2, 404-1, 404-3, 405-1, 405-2
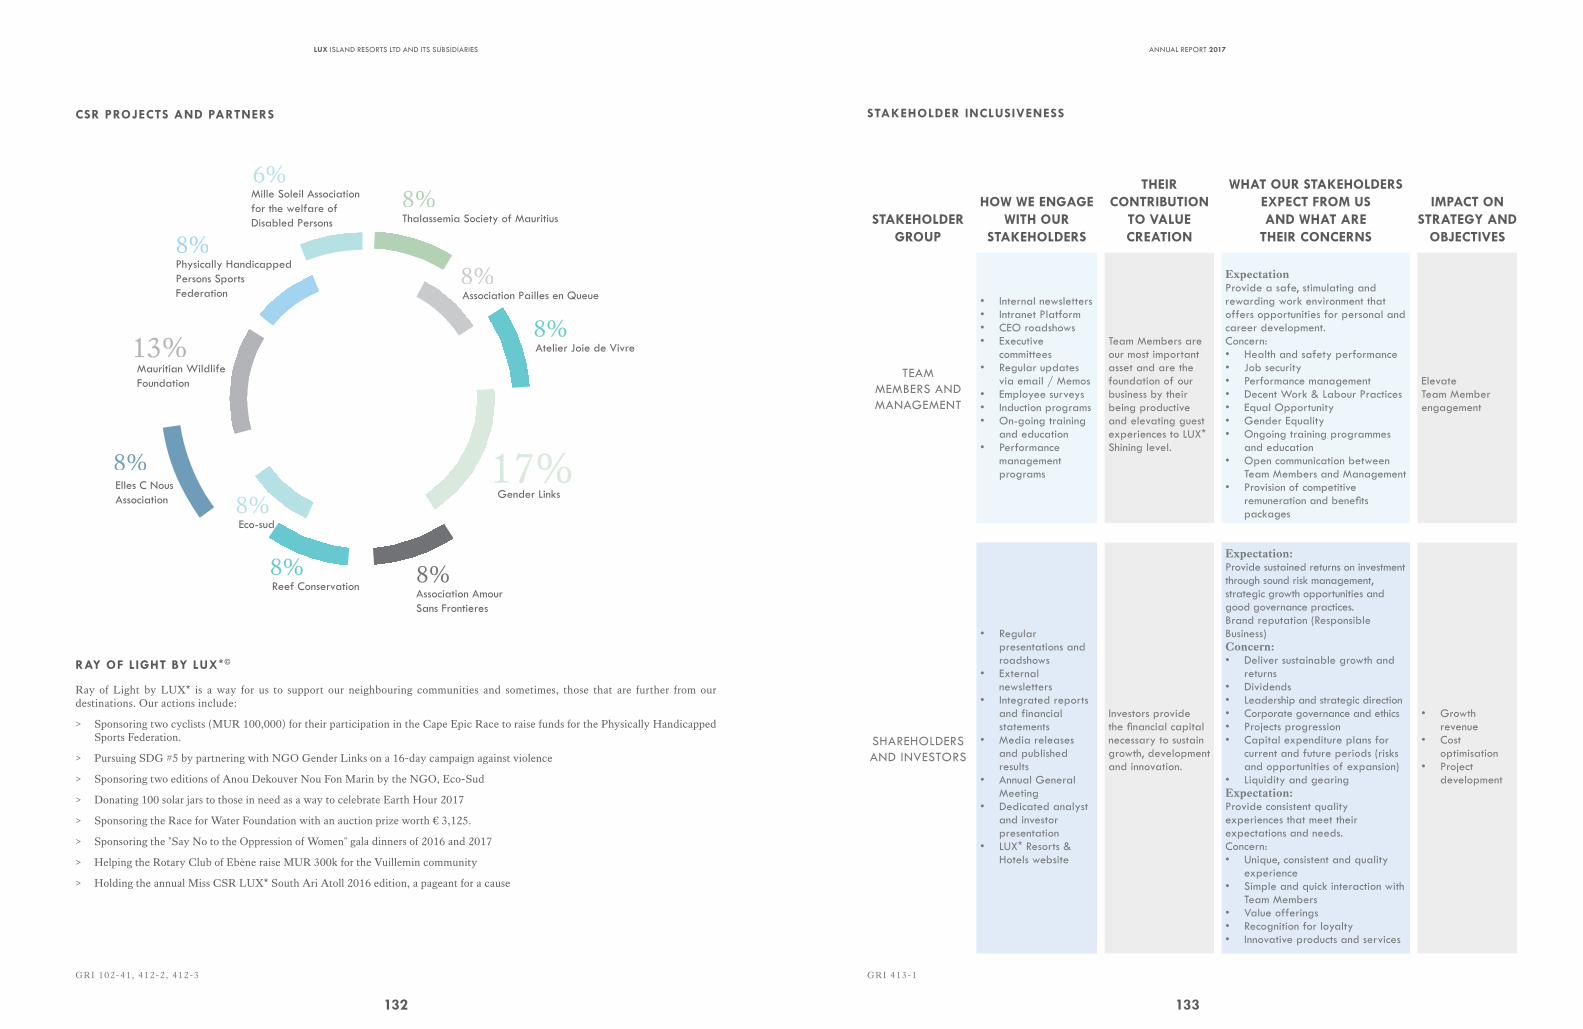
132
LUX ISLAND RESORTS LTD AND ITS SUBSIDIARIES
CSR PROJECTS AND PARTNERS
Atelier Joie de Vivre8%
Association Pailles en Queue8%
Thalassemia Society of Mauritius8%
Physically Handicapped Persons Sports Federation
8%
Mauritian Wildlife Foundation
13%
Gender Links17%
Mille Soleil Association for the welfare of Disabled Persons
6%
Elles C NousAssociation
8%
Eco-sud8%
Reef Conservation8%
Association AmourSans Frontieres
8%
RAY OF LIGHT BY LUX*©
Ray of Light by LUX* is a way for us to support our neighbouring communities and sometimes, those that are further from our destinations. Our actions include:
> Sponsoring two cyclists (MUR 100,000) for their participation in the Cape Epic Race to raise funds for the Physically Handicapped Sports Federation.
> Pursuing SDG #5 by partnering with NGO Gender Links on a 16-day campaign against violence
> Sponsoring two editions of Anou Dekouver Nou Fon Marin by the NGO, Eco-Sud
> Donating 100 solar jars to those in need as a way to celebrate Earth Hour 2017
> Sponsoring the Race for Water Foundation with an auction prize worth € 3,125.
> Sponsoring the "Say No to the Oppression of Women" gala dinners of 2016 and 2017
> Helping the Rotary Club of Ebène raise MUR 300k for the Vuillemin community
> Holding the annual Miss CSR LUX* South Ari Atoll 2016 edition, a pageant for a cause
GRI 102-41, 412-2, 412-3
133
ANNUAL REPORT 2017
STAKEHOLDER INCLUSIVENESS
STAKEHOLDER GROUP
HOW WE ENGAGE WITH OUR
STAKEHOLDERS
THEIR CONTRIBUTION
TO VALUE CREATION
WHAT OUR STAKEHOLDERS EXPECT FROM US AND WHAT ARE
THEIR CONCERNS
IMPACT ON STRATEGY AND
OBJECTIVES
TEAM MEMBERS AND MANAGEMENT
• Internal newsletters• Intranet Platform• CEO roadshows• Executive
committees• Regular updates
via email / Memos• Employee surveys• Induction programs• On-going training
and education• Performance
management programs
Team Members are our most important asset and are the foundation of our business by their being productive and elevating guest experiences to LUX* Shining level.
ExpectationProvide a safe, stimulating and rewarding work environment that offers opportunities for personal and career development.Concern:• Health and safety performance• Job security• Performance management• Decent Work & Labour Practices• Equal Opportunity• Gender Equality• Ongoing training programmes
and education• Open communication between
Team Members and Management• Provision of competitive
remuneration and benefits packages
ElevateTeam Member engagement
SHAREHOLDERS AND INVESTORS
• Regular presentations and roadshows
• External newsletters
• Integrated reports and financial statements
• Media releases and published results
• Annual General Meeting
• Dedicated analyst and investor presentation
• LUX* Resorts & Hotels website
Investors provide the financial capital necessary to sustain growth, development and innovation.
Expectation:Provide sustained returns on investment through sound risk management, strategic growth opportunities and good governance practices.Brand reputation (Responsible Business)Concern:• Deliver sustainable growth and
returns• Dividends• Leadership and strategic direction• Corporate governance and ethics• Projects progression• Capital expenditure plans for
current and future periods (risks and opportunities of expansion)
• Liquidity and gearingExpectation:Provide consistent quality experiences that meet their expectations and needs.Concern:• Unique, consistent and quality
experience• Simple and quick interaction with
Team Members• Value offerings• Recognition for loyalty• Innovative products and services
• Growth revenue
• Cost optimisation
• Project development
GRI 413-1
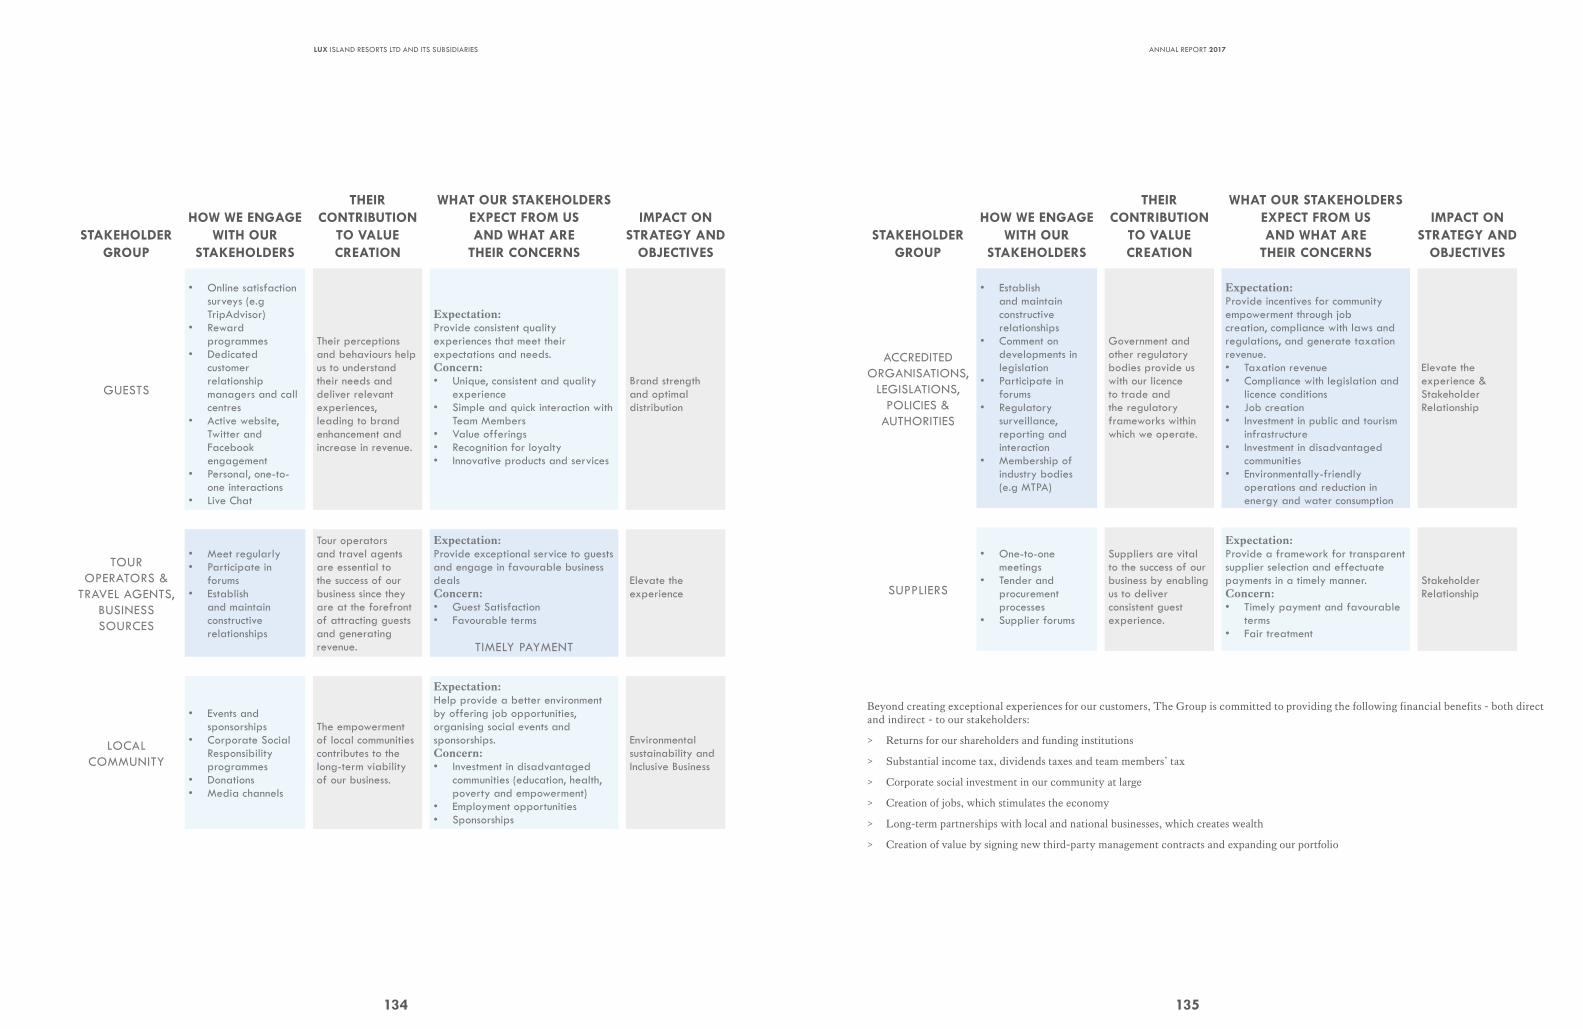
134
LUX ISLAND RESORTS LTD AND ITS SUBSIDIARIES
STAKEHOLDER GROUP
HOW WE ENGAGE WITH OUR
STAKEHOLDERS
THEIR CONTRIBUTION
TO VALUE CREATION
WHAT OUR STAKEHOLDERS EXPECT FROM US AND WHAT ARE
THEIR CONCERNS
IMPACT ON STRATEGY AND
OBJECTIVES
GUESTS
• Online satisfaction surveys (e.g TripAdvisor)
• Reward programmes
• Dedicated customer relationship managers and call centres
• Active website, Twitter and Facebook engagement
• Personal, one-to-one interactions
• Live Chat
Their perceptions and behaviours help us to understand their needs and deliver relevant experiences, leading to brand enhancement and increase in revenue.
Expectation:Provide consistent quality experiences that meet their expectations and needs.Concern:• Unique, consistent and quality
experience• Simple and quick interaction with
Team Members• Value offerings• Recognition for loyalty• Innovative products and services
Brand strength and optimal distribution
TOUR OPERATORS &
TRAVEL AGENTS, BUSINESS SOURCES
• Meet regularly• Participate in
forums• Establish
and maintain constructive relationships
Tour operators and travel agents are essential to the success of our business since they are at the forefront of attracting guests and generating revenue.
Expectation:Provide exceptional service to guests and engage in favourable business dealsConcern:• Guest Satisfaction • Favourable terms
TIMELY PAYMENT
Elevate the experience
LOCAL COMMUNITY
• Events and sponsorships
• Corporate Social Responsibility programmes
• Donations• Media channels
The empowerment of local communities contributes to the long-term viability of our business.
Expectation:Help provide a better environment by offering job opportunities, organising social events and sponsorships.Concern:• Investment in disadvantaged
communities (education, health, poverty and empowerment)
• Employment opportunities• Sponsorships
Environmental sustainability and Inclusive Business
135
ANNUAL REPORT 2017
STAKEHOLDER GROUP
HOW WE ENGAGE WITH OUR
STAKEHOLDERS
THEIR CONTRIBUTION
TO VALUE CREATION
WHAT OUR STAKEHOLDERS EXPECT FROM US AND WHAT ARE
THEIR CONCERNS
IMPACT ON STRATEGY AND
OBJECTIVES
ACCREDITED ORGANISATIONS,
LEGISLATIONS, POLICIES &
AUTHORITIES
• Establish and maintain constructive relationships
• Comment on developments in legislation
• Participate in forums
• Regulatory surveillance, reporting and interaction
• Membership of industry bodies (e.g MTPA)
Government and other regulatory bodies provide us with our licence to trade and the regulatory frameworks within which we operate.
Expectation:Provide incentives for community empowerment through job creation, compliance with laws and regulations, and generate taxation revenue.• Taxation revenue• Compliance with legislation and
licence conditions• Job creation• Investment in public and tourism
infrastructure• Investment in disadvantaged
communities• Environmentally-friendly
operations and reduction in energy and water consumption
Elevate the experience & Stakeholder Relationship
SUPPLIERS
• One-to-one meetings
• Tender and procurement processes
• Supplier forums
Suppliers are vital to the success of our business by enabling us to deliver consistent guest experience.
Expectation:Provide a framework for transparent supplier selection and effectuate payments in a timely manner.Concern:• Timely payment and favourable
terms• Fair treatment
Stakeholder Relationship
Beyond creating exceptional experiences for our customers, The Group is committed to providing the following financial benefits - both direct and indirect - to our stakeholders:
> Returns for our shareholders and funding institutions
> Substantial income tax, dividends taxes and team members’ tax
> Corporate social investment in our community at large
> Creation of jobs, which stimulates the economy
> Long-term partnerships with local and national businesses, which creates wealth
> Creation of value by signing new third-party management contracts and expanding our portfolio
FINANCIAL STATEMENTS 2017
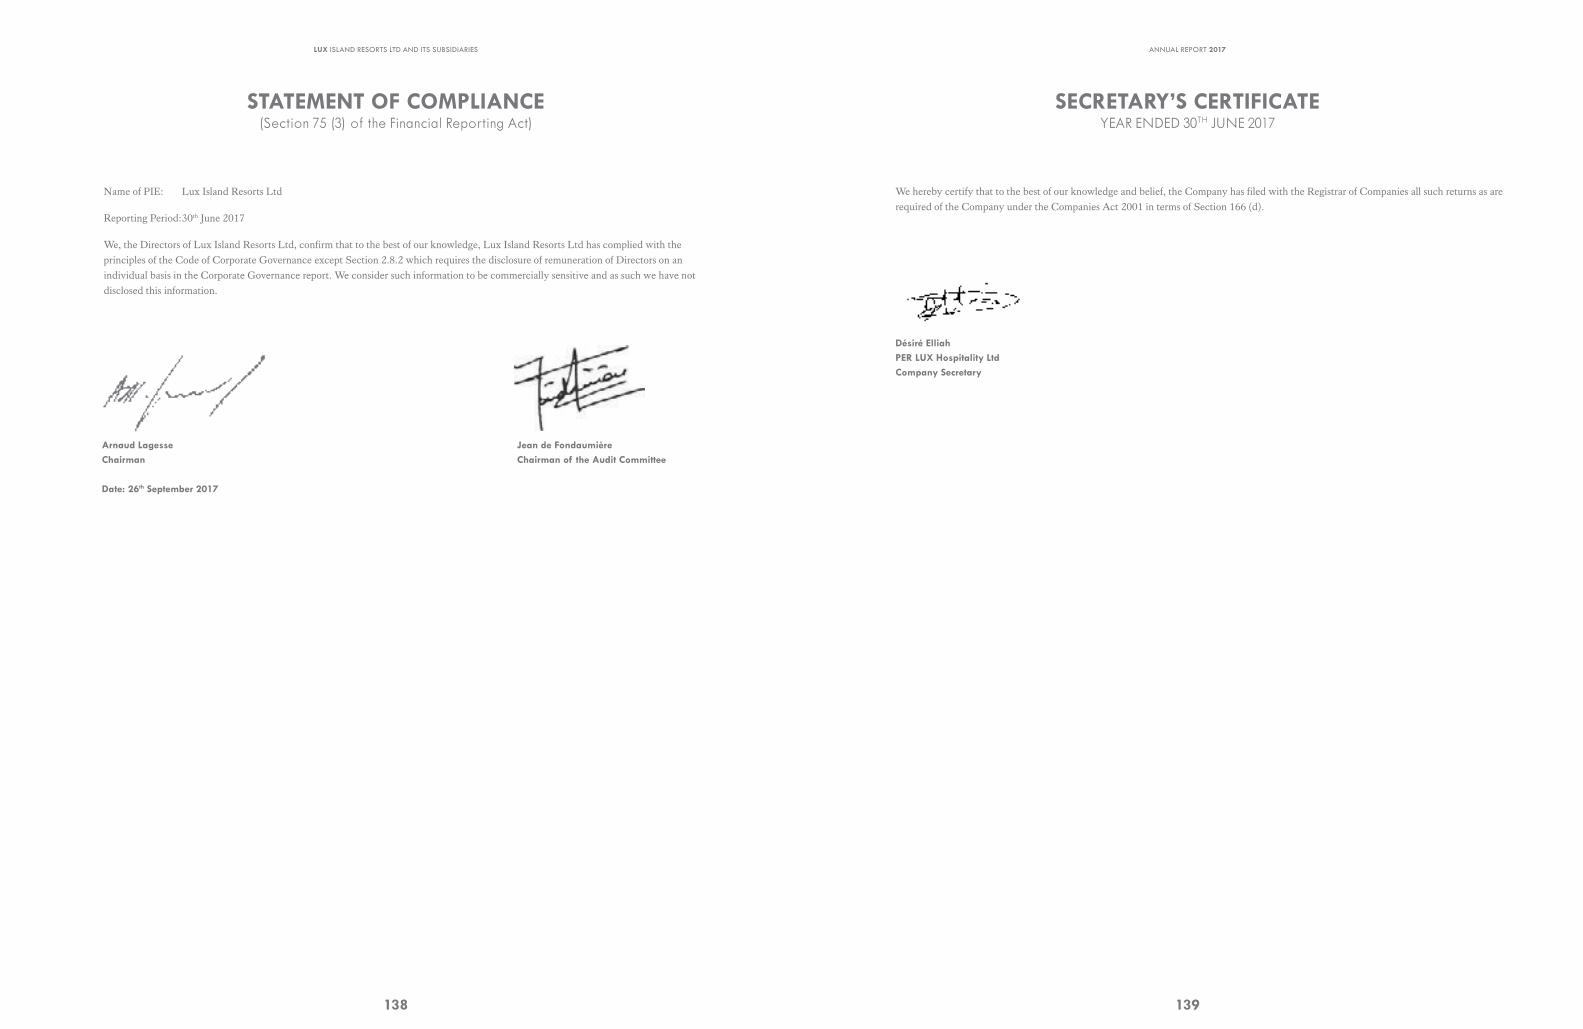
STATEMENT OF COMPLIANCE(Section 75 (3) of the Financial Reporting Act)
Name of PIE: Lux Island Resorts Ltd
Reporting Period: 30th June 2017
We, the Directors of Lux Island Resorts Ltd, confirm that to the best of our knowledge, Lux Island Resorts Ltd has complied with the principles of the Code of Corporate Governance except Section 2.8.2 which requires the disclosure of remuneration of Directors on an individual basis in the Corporate Governance report. We consider such information to be commercially sensitive and as such we have not disclosed this information.
Arnaud Lagesse Jean de FondaumièreChairman Chairman of the Audit Committee
Date: 26th September 2017
LUX ISLAND RESORTS LTD AND ITS SUBSIDIARIES
138
SECRETARY’S CERTIFICATEYEAR ENDED 30TH JUNE 2017
We hereby certify that to the best of our knowledge and belief, the Company has filed with the Registrar of Companies all such returns as are required of the Company under the Companies Act 2001 in terms of Section 166 (d).
Désiré ElliahPER LUX Hospitality LtdCompany Secretary
ANNUAL REPORT 2017
139
INDEPENDENT AUDITORS’ REPORTTO THE MEMBERS OF LUX ISLAND RESORTS LTD
LUX ISLAND RESORTS LTD AND ITS SUBSIDIARIES
140
Report on the Audit of the Financial Statements
Opinion
We have audited the financial statements of Lux Island Resorts Ltd (the “Company”) and its subsidiaries (the “Group”) set out on pages 141 to 204 which comprise the
statement of financial position as at 30 June 2017 and the statement of profit or loss and other comprehensive income, statement of changes in equity and statement of
cash flows for the year then ended, and notes to the financial statements, including significant accounting policies.
In our opinion, the financial statements give a true and fair view of, the financial position of Group and Company as at 30th June 2017, and of their financial performance and their cash flows for the year then ended in accordance with International Financial Reporting Standards and comply with the Companies Act 2001 and the Financial Reporting Act 2004 .
Basis for Opinion
We conducted our audit in accordance with International Standards on Auditing (ISAs). Our responsibilities under those standards are further described in the Auditor’s Responsibilities for the Audit of the Consolidated Financial Statements section of our report. We are independent of the Group and the Company in accordance with the International Ethics Standards Board for Accountants’ Code of Ethics for Professional Accountants (IESBA Code), and we have fulfilled our other ethical responsibilities in accordance with the IESBA Code. We believe that the audit evidence we have obtained is sufficient and appropriate to provide a basis for our opinion.
Key Audit Matters
Key audit matters are those matters that, in our professional judgement, were of most significance in our audit of the financial statements of the current period. These matters were addressed in the context of our audit of the financial statements as a whole, and in forming our opinion thereon, and we do not provide a separate opinion on these matters.
We have fulfilled the responsibilities described in the Auditor’s responsibilities for the audit of the financial statements section of our report, including in relation to these matters. Accordingly, our audit included the performance of procedures designed to respond to our assessment of the risks of material misstatement of the financial statements. The results of our audit procedures, including the procedures performed to address the matters below, provide the basis for our audit opinion on the accompanying financial statements.
ANNUAL REPORT 2017
141
Key Audit Matter How the matter was addressed in the audit
Recoverability of goodwill and investment in subsidiaries
As detailed in Note 5 of the financial statements, the Group’s goodwill is allocated to cash generating units (CGUs). The valuation and recoverability of goodwill involves complex judgments and estimates, including projections of future income, terminal growth rate and discount rate assumptions. These assumptions and estimates can have a material impact on the valuation and impairment decisions reflected in the consolidated financial statements of the Group.
In the Company’s separate financial statements, investment in subsidiaries are carried at cost less impairment. Included in the carrying amount of Rs 3,524m set out in note 6 of the financial statements, the Group has an investment of Rs 1,984m in its local subsidiaries and Rs 1,540 m in its foreign subsidiaries. Goodwill recognised in the Group accounts for the local and foreign subsidiaries at 30th June 2017 amounted to Rs 508m and Rs 559m respectively.
Management makes an impairment assessment on the investment in subsidiaries and goodwill when an indication of impairment is noted and at the end of each reporting date. The same discounted cash flow (DCF) models as used for testing of impairment of goodwill are used to assess impairment on the investment in subsidiaries and involve the same complex judgments and estimates.
We assessed and tested the design and operating effectiveness of selected key controls over management’s process for modelling recoverability of goodwill and investment in subsidiaries.
In relation to the particular matters set out above, our substantive testing procedures included the following:
- Corroborated the justification of the CGUs defined by management for goodwill allocation.
- Tested the design and integrity of the Group’s discounted cash flow model that supports the value-in-use calculations in order to assess the appropriateness of the methodology applied in the Group’s annual impairment assessment.
- Tested the reasonableness of the methodology and assumptions used including projections on future income (including a comparison of forecast to actual results), terminal growth rate assumptions, discount rates and sensitivity analyses to determine the impact of those assumptions.
- Engaged our internal valuation experts to assist in the testing of the discount factor and corroborate the results of the valuations based on comparable information.
Other Information
Management is responsible for the other information. The other information comprises the annual report, corporate governance report and the secretary’s certificate. These reports are expected to be made available to us after the date of this auditor’ s report.
Our opinion on the financial statement s does not cover the other information and we do not express any form of assurance conclusion thereon.
In connection with our audit of the financial statements, our responsibility is to read the other information and, in doing so, consider whether the other information is materially inconsistent with the financial statements or our knowledge obtained in the audit, or otherwise appears to be materially misstated. If, based on the work we have performed on the other information obtained prior to the date of this auditor’s report, we conclude that there is a material misstatement of this other information, we are required to report that fact. We have nothing to report in this regard.
Responsibilities of the Directors for the Financial Statements
The directors are responsible for the preparation and fair presentation of the financial statements in accordance with International Financial Reporting Standards and the requirements of the Companies Act 2001 and the Financial Reporting Act 2004, and for such internal control as the directors determine is necessary to enable the preparation of financial statements that are free from material misstatement, whether due to fraud or error.
INDEPENDENT AUDITORS’ REPORTTO THE MEMBERS OF LUX ISLAND RESORTS LTD (CONT'D)
LUX ISLAND RESORTS LTD AND ITS SUBSIDIARIES
142
Report on the Audit of the Financial Statements (Cont’d)
In preparing the financial statements, the directors are responsible for assessing the Group and Company’s ability to continue as a going concern, disclosing, as applicable, matters related to going concern and using the going concern basis of accounting unless the directors either intends to liquidate the Group and or the Company or to cease operations, or have no realistic alternative but to do so.
Auditor’s Responsibilities for the Audit of the Financial Statements
Our objectives are to obtain reasonable assurance about whether the financial statements as a whole are free from material misstatement, whether due to fraud or error, and to issue an auditor’s report that includes our opinion. Reasonable assurance is a high level of assurance, but is not a guarantee that an audit conducted in accordance with ISAs will always detect a material misstatement when it exists. Misstatements can arise from fraud or error and are considered material if, individually or in the aggregate, they could reasonably be expected to influence the economic decisions of users taken on the basis of these financial statements.
As part of an audit in accordance with ISAs, we exercise professional judgement and maintain professional scepticism throughout the audit. We also:
• Identify and assess the risks of material misstatement of the financial statements, whether due to fraud or error, design and perform audit procedures responsive to those risks, and obtain audit evidence that is sufficient and appropriate to provide a basis for our opinion. The risk of not detecting a material misstatement resulting from fraud is higher than for one resulting from error, as fraud may involve collusion, forgery, intentional omissions, misrepresentations, or the override of internal control.
• Obtain an understanding of internal control relevant to the audit in order to design audit procedures that are appropriate in the circumstances, but not for the purpose of expressing an opinion on the effectiveness of the Group’s internal control.
• Evaluate the appropriateness of accounting policies used and the reasonableness of accounting estimates and related disclosures made by the directors.
• Conclude on the appropriateness of the director’s use of the going concern basis of accounting and based on the audit evidence obtained, whether a material uncertainty exists related to events or conditions that may cast significant doubt on the Group’s and Company’s ability to continue as a going concern. If we conclude that a material uncertainty exists, we are required to draw attention in our auditor’s report to the related disclosures in the financial statements or, if such disclosures are inadequate, to modify our opinion. Our conclusions are based on the audit evidence obtained up to the date of our auditor’s report . However, future events or conditions may cause the Company to cease to continue as a going concern.
• Evaluate the overall presentation, structure and content of the financial statements, including the disclosures, and whether the financial statements represent the underlying transactions and events in a manner that achieves fair presentation.
• Obtain sufficient appropriate audit evidence regarding the financial information of the entities or business activities within the Group and the Company to express an opinion on the Group and Company financial statements. We are responsible for the direction, supervision and performance of the group audit. We remain solely responsible for our audit opinion.
ANNUAL REPORT 2017
143
Auditor’s Responsibilities for the Audit of the Financial Statements (Continued)
We communicate with the directors regarding, among other matters, the planned scope and timing of the audit and significant audit findings, including any significant deficiencies in internal control that we identify during our audit.
We also provide the directors with a statement that we have complied with relevant ethical requirements regarding independence, and to communicate with them all relationships and other matters that may reasonably be thought to bear on our independence, and where applicable, related safeguards.
From the matters communicated with the directors, we determine those matters that were of most significance in the audit of the consolidated financial statements of the current period and are therefore the key audit matters. We describe these matters in our auditor’s report unless law or regulation precludes public disclosure about the matter or when, in extremely rare circumstances, we determine that a matter should not be communicated in our report because the adverse consequences of doing so would reasonably be expected to outweigh the public interest benefits of such communication.
Other matter
This report is made solely for the Company’s members, as a body, in accordance with Section 205 of the Companies Act 2001. Our audit work has been undertaken so that we might state to the Company’s members those matters we are required to state to them in an auditor’s report and for no other purpose. To the fullest extent permitted by law, we do not accept or assume responsibility to anyone other than the Company and the Company’s members, as a body, for our audit work, for this report, or for the opinions we have formed.
Report on Other Legal and Regulatory Requirements
Companies Act 2001
We have no relationship with or interests in the Company other than in our capacity as auditors, tax advisors and dealings in the ordinary course of business.
We have obtained all the information and explanations we have required.
In our opinion, proper accounting records have been kept by the Company as far as it appears from our examination of those records.
Financial Reporting Act 2004
The directors are responsible for preparing the Corporate Governance Report. Our responsibility is to report on the extent of compliance with the Code of Corporate Governance as disclosed in the annual report and whether the disclosure is consistent with the principles of the Code.
In our opinion, the disclosures in the Corporate Governance Report are consistent with the principles of the Code.
ERNST & YOUNG THIERRY LEUNG HING WAH, F.C.C.A
Ebène, Mauritius Licensed by FRC
Date: 26th September 2017
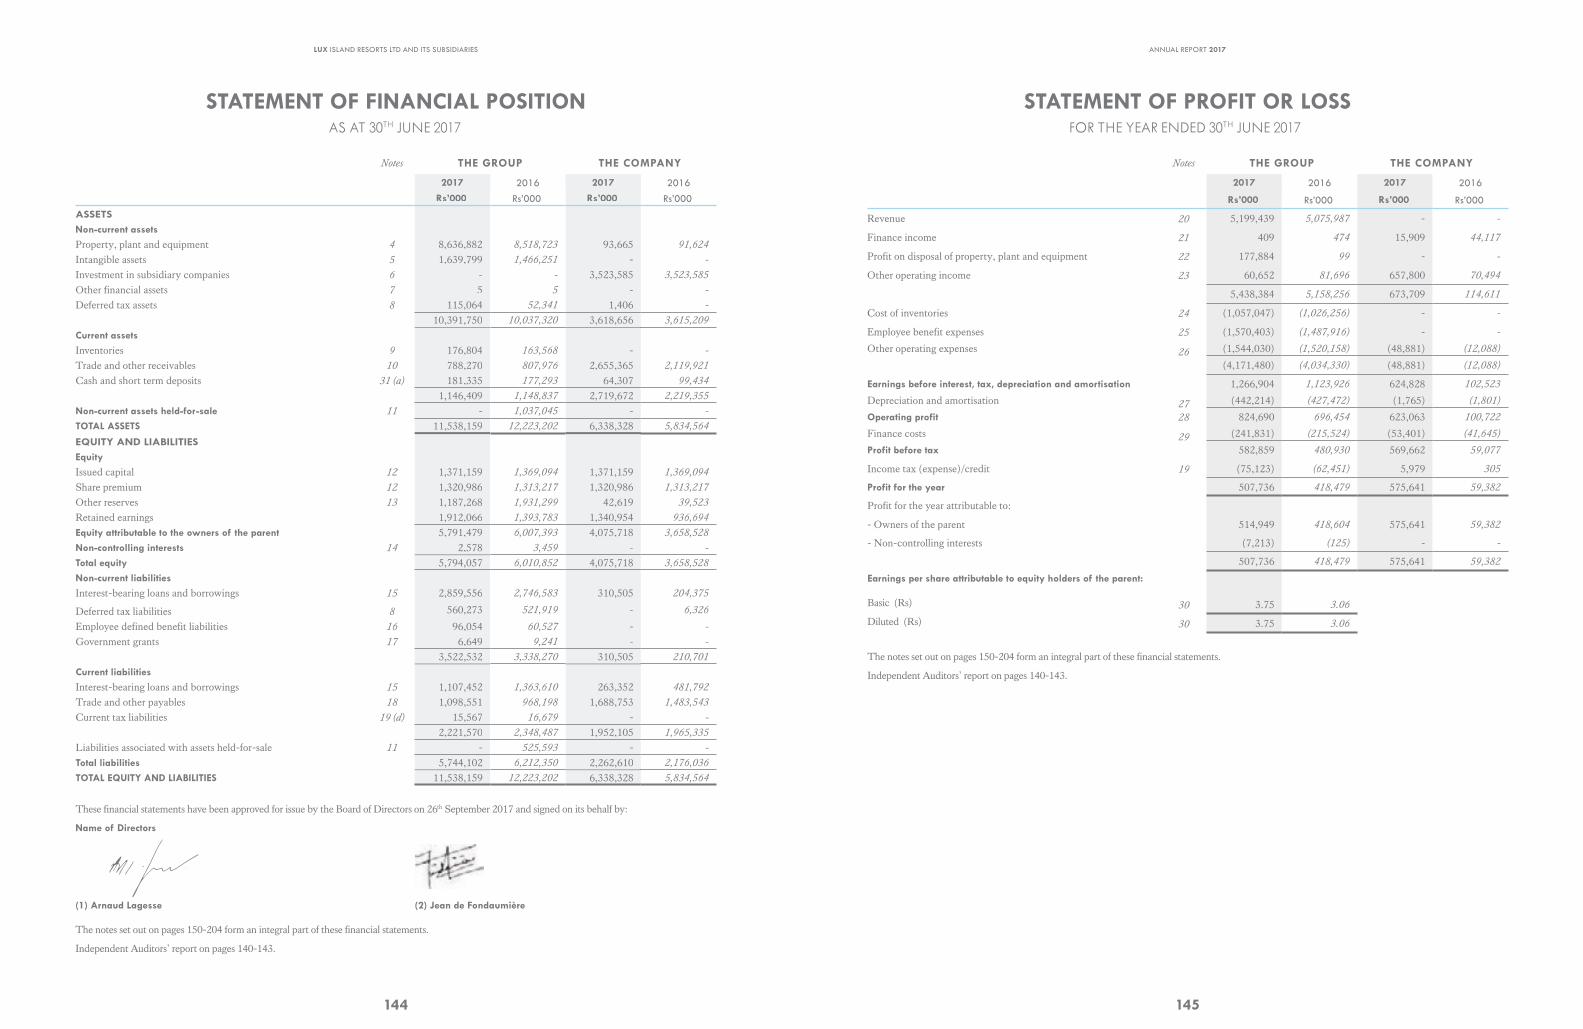
LUX ISLAND RESORTS LTD AND ITS SUBSIDIARIES
144
STATEMENT OF FINANCIAL POSITION AS AT 30TH JUNE 2017
Notes THE GROUP THE COMPANY
2017 2016 2017 2016
Rs’000 Rs’000 Rs’000 Rs’000
ASSETSNon-current assetsProperty, plant and equipment 4 8,636,882 8,518,723 93,665 91,624
Intangible assets 5 1,639,799 1,466,251 - -
Investment in subsidiary companies 6 - - 3,523,585 3,523,585
Other financial assets 7 5 5 - -
Deferred tax assets 8 115,064 52,341 1,406 -
10,391,750 10,037,320 3,618,656 3,615,209
Current assetsInventories 9 176,804 163,568 - -
Trade and other receivables 10 788,270 807,976 2,655,365 2,119,921
Cash and short term deposits 31 (a) 181,335 177,293 64,307 99,434
1,146,409 1,148,837 2,719,672 2,219,355
Non-current assets held-for-sale 11 - 1,037,045 - -
TOTAL ASSETS 11,538,159 12,223,202 6,338,328 5,834,564
EQUITY AND LIABILITIESEquityIssued capital 12 1,371,159 1,369,094 1,371,159 1,369,094
Share premium 12 1,320,986 1,313,217 1,320,986 1,313,217
Other reserves 13 1,187,268 1,931,299 42,619 39,523
Retained earnings 1,912,066 1,393,783 1,340,954 936,694
Equity attributable to the owners of the parent 5,791,479 6,007,393 4,075,718 3,658,528
Non-controlling interests 14 2,578 3,459 - -
Total equity 5,794,057 6,010,852 4,075,718 3,658,528
Non-current liabilitiesInterest-bearing loans and borrowings 15 2,859,556 2,746,583 310,505 204,375
Deferred tax liabilities 8 560,273 521,919 - 6,326
Employee defined benefit liabilities 16 96,054 60,527 - -
Government grants 17 6,649 9,241 - -
3,522,532 3,338,270 310,505 210,701
Current liabilitiesInterest-bearing loans and borrowings 15 1,107,452 1,363,610 263,352 481,792
Trade and other payables 18 1,098,551 968,198 1,688,753 1,483,543
Current tax liabilities 19 (d) 15,567 16,679 - -
2,221,570 2,348,487 1,952,105 1,965,335
Liabilities associated with assets held-for-sale 11 - 525,593 - -
Total liabilities 5,744,102 6,212,350 2,262,610 2,176,036
TOTAL EQUITY AND LIABILITIES 11,538,159 12,223,202 6,338,328 5,834,564
These financial statements have been approved for issue by the Board of Directors on 26th September 2017 and signed on its behalf by:
Name of Directors
(1) Arnaud Lagesse (2) Jean de Fondaumière
The notes set out on pages 150-204 form an integral part of these financial statements.
Independent Auditors’ report on pages 140-143.
ANNUAL REPORT 2017
145
STATEMENT OF PROFIT OR LOSS FOR THE YEAR ENDED 30TH JUNE 2017
Notes THE GROUP THE COMPANY
2017 2016 2017 2016
Rs’000 Rs’000 Rs’000 Rs’000
Revenue 20 5,199,439 5,075,987 - -
Finance income 21 409 474 15,909 44,117
Profit on disposal of property, plant and equipment 22 177,884 99 - -
Other operating income 23 60,652 81,696 657,800 70,494
5,438,384 5,158,256 673,709 114,611
Cost of inventories 24 (1,057,047) (1,026,256) - -
Employee benefit expenses 25 (1,570,403) (1,487,916) - -
Other operating expenses 26 (1,544,030) (1,520,158) (48,881) (12,088)
(4,171,480) (4,034,330) (48,881) (12,088)
Earnings before interest, tax, depreciation and amortisation 1,266,904 1,123,926 624,828 102,523
Depreciation and amortisation 27 (442,214) (427,472) (1,765) (1,801)
Operating profit 28 824,690 696,454 623,063 100,722
Finance costs 29 (241,831) (215,524) (53,401) (41,645)
Profit before tax 582,859 480,930 569,662 59,077
Income tax (expense)/credit 19 (75,123) (62,451) 5,979 305
Profit for the year 507,736 418,479 575,641 59,382
Profit for the year attributable to:
- Owners of the parent 514,949 418,604 575,641 59,382
- Non-controlling interests (7,213) (125) - -
507,736 418,479 575,641 59,382
Earnings per share attributable to equity holders of the parent:
Basic (Rs) 30 3.75 3.06
Diluted (Rs) 30 3.75 3.06
The notes set out on pages 150-204 form an integral part of these financial statements.
Independent Auditors’ report on pages 140-143.
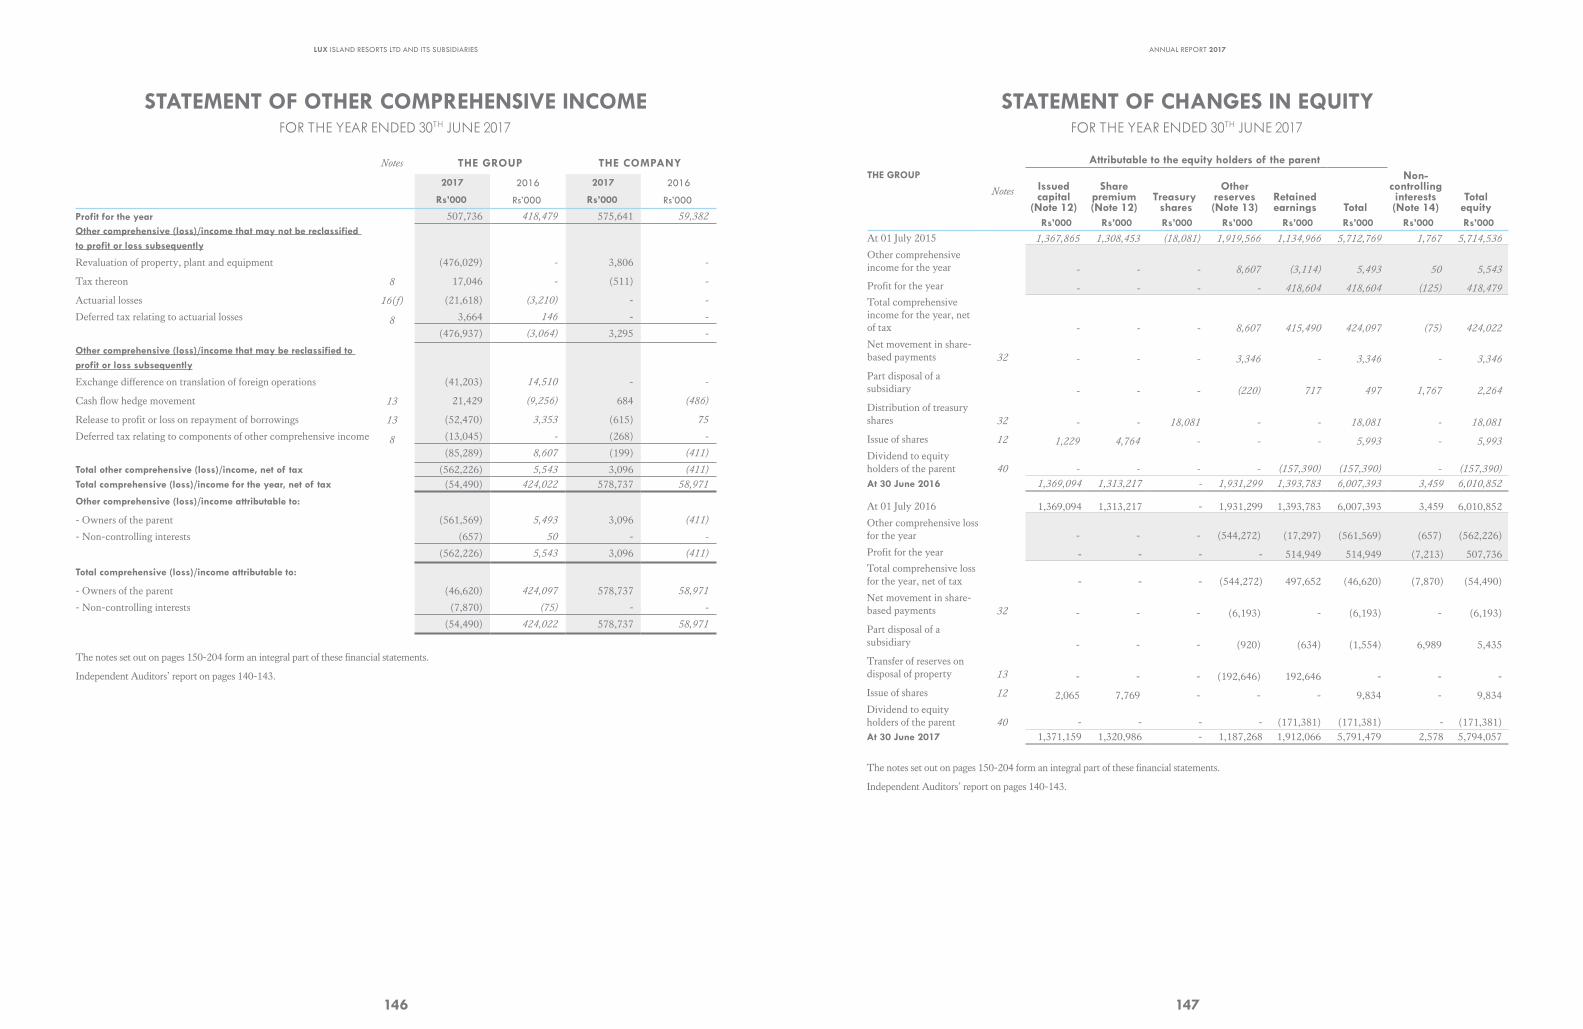
LUX ISLAND RESORTS LTD AND ITS SUBSIDIARIES
146
STATEMENT OF OTHER COMPREHENSIVE INCOME FOR THE YEAR ENDED 30TH JUNE 2017
Notes THE GROUP THE COMPANY
2017 2016 2017 2016
Rs’000 Rs’000 Rs’000 Rs’000
Profit for the year 507,736 418,479 575,641 59,382
Other comprehensive (loss)/income that may not be reclassified to profit or loss subsequently
Revaluation of property, plant and equipment (476,029) - 3,806 -
Tax thereon 8 17,046 - (511) -
Actuarial losses 16( f) (21,618) (3,210) - -
Deferred tax relating to actuarial losses 8 3,664 146 - -
(476,937) (3,064) 3,295 -
Other comprehensive (loss)/income that may be reclassified to profit or loss subsequently
Exchange difference on translation of foreign operations (41,203) 14,510 - -
Cash flow hedge movement 13 21,429 (9,256) 684 (486)
Release to profit or loss on repayment of borrowings 13 (52,470) 3,353 (615) 75
Deferred tax relating to components of other comprehensive income 8 (13,045) - (268) -
(85,289) 8,607 (199) (411)
Total other comprehensive (loss)/income, net of tax (562,226) 5,543 3,096 (411)
Total comprehensive (loss)/income for the year, net of tax (54,490) 424,022 578,737 58,971
Other comprehensive (loss)/income attributable to:
- Owners of the parent (561,569) 5,493 3,096 (411)
- Non-controlling interests (657) 50 - -
(562,226) 5,543 3,096 (411)
Total comprehensive (loss)/income attributable to:
- Owners of the parent (46,620) 424,097 578,737 58,971
- Non-controlling interests (7,870) (75) - -
(54,490) 424,022 578,737 58,971
The notes set out on pages 150-204 form an integral part of these financial statements.
Independent Auditors’ report on pages 140-143.
ANNUAL REPORT 2017
147
STATEMENT OF CHANGES IN EQUITY FOR THE YEAR ENDED 30TH JUNE 2017
Attributable to the equity holders of the parentTHE GROUP
NotesIssued capital
(Note 12)
Share premium (Note 12)
Treasury shares
Other reserves (Note 13)
Retained earnings Total
Non-controlling interests (Note 14)
Total equity
Rs’000 Rs’000 Rs’000 Rs’000 Rs’000 Rs’000 Rs’000 Rs’000
At 01 July 2015 1,367,865 1,308,453 (18,081) 1,919,566 1,134,966 5,712,769 1,767 5,714,536
Other comprehensive income for the year - - - 8,607 (3,114) 5,493 50 5,543
Profit for the year - - - - 418,604 418,604 (125) 418,479
Total comprehensive income for the year, net of tax - - - 8,607 415,490 424,097 (75) 424,022
Net movement in share-based payments 32 - - - 3,346 - 3,346 - 3,346
Part disposal of a subsidiary - - - (220) 717 497 1,767 2,264
Distribution of treasury shares 32 - - 18,081 - - 18,081 - 18,081
Issue of shares 12 1,229 4,764 - - - 5,993 - 5,993
Dividend to equity holders of the parent 40 - - - - (157,390) (157,390) - (157,390)
At 30 June 2016 1,369,094 1,313,217 - 1,931,299 1,393,783 6,007,393 3,459 6,010,852
At 01 July 2016 1,369,094 1,313,217 - 1,931,299 1,393,783 6,007,393 3,459 6,010,852
Other comprehensive loss for the year - - - (544,272) (17,297) (561,569) (657) (562,226)
Profit for the year - - - - 514,949 514,949 (7,213) 507,736 Total comprehensive loss for the year, net of tax - - - (544,272) 497,652 (46,620) (7,870) (54,490)
Net movement in share-based payments 32 - - - (6,193) - (6,193) - (6,193)
Part disposal of a subsidiary - - - (920) (634) (1,554) 6,989 5,435
Transfer of reserves on disposal of property 13 - - - (192,646) 192,646 - - -
Issue of shares 12 2,065 7,769 - - - 9,834 - 9,834 Dividend to equity holders of the parent 40 - - - - (171,381) (171,381) - (171,381)At 30 June 2017 1,371,159 1,320,986 - 1,187,268 1,912,066 5,791,479 2,578 5,794,057
The notes set out on pages 150-204 form an integral part of these financial statements.
Independent Auditors’ report on pages 140-143.
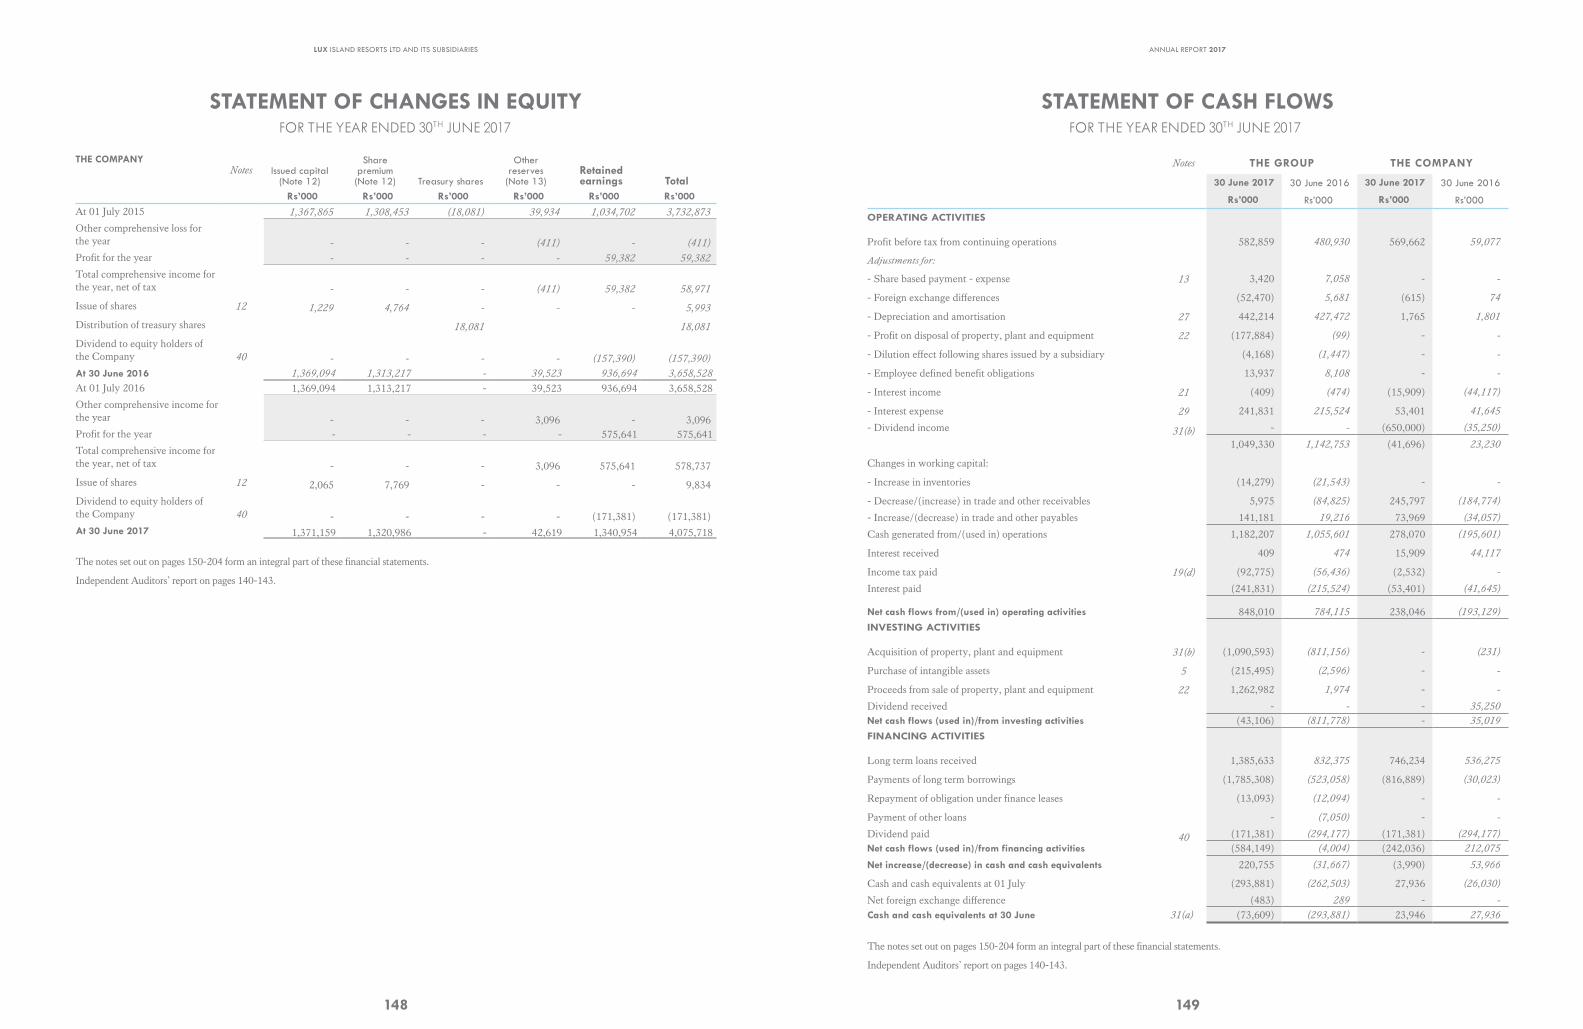
LUX ISLAND RESORTS LTD AND ITS SUBSIDIARIES
148
STATEMENT OF CHANGES IN EQUITY FOR THE YEAR ENDED 30TH JUNE 2017
THE COMPANYNotes Issued capital
(Note 12)
Share premium (Note 12) Treasury shares
Other reserves
(Note 13)Retained earnings Total
Rs’000 Rs’000 Rs’000 Rs’000 Rs’000 Rs’000
At 01 July 2015 1,367,865 1,308,453 (18,081) 39,934 1,034,702 3,732,873
Other comprehensive loss for the year - - - (411) - (411)
Profit for the year - - - - 59,382 59,382
Total comprehensive income for the year, net of tax - - - (411) 59,382 58,971
Issue of shares 12 1,229 4,764 - - - 5,993
Distribution of treasury shares 18,081 18,081
Dividend to equity holders of the Company 40 - - - - (157,390) (157,390)
At 30 June 2016 1,369,094 1,313,217 - 39,523 936,694 3,658,528
At 01 July 2016 1,369,094 1,313,217 - 39,523 936,694 3,658,528
Other comprehensive income for the year - - - 3,096 - 3,096 Profit for the year - - - - 575,641 575,641
Total comprehensive income for the year, net of tax - - - 3,096 575,641 578,737
Issue of shares 12 2,065 7,769 - - - 9,834
Dividend to equity holders of the Company 40 - - - - (171,381) (171,381)At 30 June 2017 1,371,159 1,320,986 - 42,619 1,340,954 4,075,718
The notes set out on pages 150-204 form an integral part of these financial statements.
Independent Auditors’ report on pages 140-143.
ANNUAL REPORT 2017
149
STATEMENT OF CASH FLOWS FOR THE YEAR ENDED 30TH JUNE 2017
Notes THE GROUP THE COMPANY
30 June 2017 30 June 2016 30 June 2017 30 June 2016
Rs’000 Rs’000 Rs’000 Rs’000
OPERATING ACTIVITIES
Profit before tax from continuing operations 582,859 480,930 569,662 59,077
Adjustments for:
- Share based payment - expense 13 3,420 7,058 - -
- Foreign exchange differences (52,470) 5,681 (615) 74
- Depreciation and amortisation 27 442,214 427,472 1,765 1,801
- Profit on disposal of property, plant and equipment 22 (177,884) (99) - -
- Dilution effect following shares issued by a subsidiary (4,168) (1,447) - -
- Employee defined benefit obligations 13,937 8,108 - -
- Interest income 21 (409) (474) (15,909) (44,117)
- Interest expense 29 241,831 215,524 53,401 41,645
- Dividend income 31(b) - - (650,000) (35,250)
1,049,330 1,142,753 (41,696) 23,230
Changes in working capital:
- Increase in inventories (14,279) (21,543) - -
- Decrease/(increase) in trade and other receivables 5,975 (84,825) 245,797 (184,774)
- Increase/(decrease) in trade and other payables 141,181 19,216 73,969 (34,057)
Cash generated from/(used in) operations 1,182,207 1,055,601 278,070 (195,601)
Interest received 409 474 15,909 44,117
Income tax paid 19(d) (92,775) (56,436) (2,532) -
Interest paid (241,831) (215,524) (53,401) (41,645)
Net cash flows from/(used in) operating activities 848,010 784,115 238,046 (193,129)
INVESTING ACTIVITIES
Acquisition of property, plant and equipment 31(b) (1,090,593) (811,156) - (231)
Purchase of intangible assets 5 (215,495) (2,596) - -
Proceeds from sale of property, plant and equipment 22 1,262,982 1,974 - -
Dividend received - - - 35,250
Net cash flows (used in)/from investing activities (43,106) (811,778) - 35,019
FINANCING ACTIVITIES
Long term loans received 1,385,633 832,375 746,234 536,275
Payments of long term borrowings (1,785,308) (523,058) (816,889) (30,023)
Repayment of obligation under finance leases (13,093) (12,094) - -
Payment of other loans - (7,050) - -
Dividend paid 40 (171,381) (294,177) (171,381) (294,177)
Net cash flows (used in)/from financing activities (584,149) (4,004) (242,036) 212,075
Net increase/(decrease) in cash and cash equivalents 220,755 (31,667) (3,990) 53,966
Cash and cash equivalents at 01 July (293,881) (262,503) 27,936 (26,030)
Net foreign exchange difference (483) 289 - -
Cash and cash equivalents at 30 June 31(a) (73,609) (293,881) 23,946 27,936
The notes set out on pages 150-204 form an integral part of these financial statements.
Independent Auditors’ report on pages 140-143.
LUX ISLAND RESORTS LTD AND ITS SUBSIDIARIES
150
NOTES TO THE FINANCIAL STATEMENTSFOR THE YEAR ENDED 30TH JUNE 2017
1. CORPORATE INFORMATION
Lux Island Resorts Ltd is a public company incorporated in Mauritius and its shares are listed on the Stock Exchange of Mauritius. Its registered office is situated at 58, Pierre Simonet Street, Floréal. The main activity of the Group is the operation and management of hotels.
2. ACCOUNTING POLICIES
2.1 BASIS OF PREPARATION
The consolidated and separate financial statements have been prepared on a historical cost basis as modified by the revaluation of land and buildings and available-for-sale investments which are stated at their fair values as disclosed in the accounting policies hereafter. The consolidated and separate financial statements are presented in Mauritian rupees and all values are rounded to the nearest thousand (Rs’000) except when otherwise indicated.
Statement of Compliance
The consolidated and separate financial statements of Lux Island Resorts Ltd and its subsidiaries have been prepared in accordance with International Financial Reporting Standards (IFRSs).
2.2 BASIS OF CONSOLIDATION
The consolidated financial statements comprise the financial statements of Lux Island Resorts Ltd and its subsidiaries as at 30th June 2017.
Control is achieved when the Group is exposed, or has rights, to variable returns from its involvement with the investee and has the ability to affect those returns through its power over the investee. Specifically, the Group controls an investee if and only if the Group has:
• Power over the investee (i.e. existing rights that give it the current ability to direct the relevant activities of the investee);
• Exposure, or rights, to variable returns from its involvement with the investee, and
• The ability to use its power over the investee to affect its returns.
When the Group has less than a majority of the voting or similar rights of an investee, the Group considers all relevant facts and circumstances in assessing whether it has power over an investee, including:
• The contractual arrangement with the other vote holders of the investee;
• Rights arising from other contractual arrangements; and
• The Group’s voting rights and potential voting rights.
The Group re-assesses whether or not it controls an investee if facts and circumstances indicate that there are changes to one or more of the three elements of control. Consolidation of a subsidiary begins when the Group obtains control over the subsidiary and ceases when the Group loses control of the subsidiary. Assets, liabilities, income and expenses of a subsidiary acquired or disposed of during the year are included in the consolidated financial statements from the date the Group gains control until the date the Group ceases to control the subsidiary.
Profit or loss and each component of other comprehensive income (OCI) are attributed to the equity holders of the parent of the Group and to the non-controlling interests, even if this results in the non-controlling interests having a deficit balance. All intra-group assets and liabilities, equity, income, expenses and cash flows relating to transactions between members of the Group are eliminated in full on consolidation.
A change in the ownership interest of a subsidiary, without a loss of control, is accounted for as an equity transaction. If the Group loses control over a subsidiary, it:
• Derecognises the assets (including goodwill) and liabilities of the subsidiary
• Derecognises the carrying amount of any non-controlling interests
• Derecognises the cumulative translation differences, recorded in equity
• Recognises the fair value of the consideration received
• Recognises the fair value of any investment retained
• Recognises any surplus or deficit in statement of profit or loss
• Reclassifies the parent’s share of components previously recognised in other comprehensive income to statement of profit or loss or retained earnings, as appropriate, as would be required if the Group had directly disposed of the related assets or liabilities.
ANNUAL REPORT 2017
151
NOTES TO THE FINANCIAL STATEMENTSFOR THE YEAR ENDED 30TH JUNE 2017
2. ACCOUNTING POLICIES (CONT’D)
2.3 CHANGES IN ACCOUNTING POLICIES AND DISCLOSURES
New and amended standards and interpretations
The Group applied for the first time certain standards and amendments, which are effective for annual periods beginning on or after 1st January 2016. The Group has not early adopted any other standard, interpretation or amendment that has been issued but is not yet effective.
The nature and the effect of these changes for accounting standards and interpretations relevant to the Group’s operations are disclosed below. Although these new standards and amendments applied for the first time in 2016, they did not have a material impact on the financial statements of the Group. The nature and the impact of each new standard or amendment is described below:
Annual Improvements 2012-2014 Cycle
These improvements include:
IFRS 5 Non-current Assets Held for Sale and Discontinued Operations
Assets (or disposal groups) are generally disposed of either through sale or distribution to the owners. The amendment clarifies that changing from one of these disposal methods to the other would not be considered a new plan of disposal, rather it is a continuation of the original plan. There is, therefore, no interruption of the application of the requirements in IFRS 5. This amendment is applied prospectively.
IFRS 7 Financial Instruments: Disclosures
(i) Servicing contracts
The amendment clarifies that a servicing contract that includes a fee can constitute continuing involvement in a financial asset. An entity must assess the nature of the fee and the arrangement against the guidance for continuing involvement in IFRS 7 in order to assess whether the disclosures are required. The assessment of which servicing contracts constitute continuing involvement must be done retrospectively. However, the required disclosures need not be provided for any period beginning before the annual period in which the entity first applies the amendments.
(ii) Applicability of the amendments to IFRS 7 to condensed interim financial statements
The amendment clarifies that the offsetting disclosure requirements do not apply to condensed interim financial statements, unless such disclosures provide a significant update to the information reported in the most recent annual report. This amendment is applied retrospectively.
IAS 19 Employee Benefits
The amendment clarifies that market depth of high quality corporate bonds is assessed based on the currency in which the obligation is denominated, rather than the country where the obligation is located. When there is no deep market for high quality corporate bonds in that currency, government bond rates must be used. This amendment is applied prospectively.
IAS 34 Interim Financial Reporting
The amendment clarifies that the required interim disclosures must either be in the interim financial statements or incorporated by cross-reference between the interim financial statements and wherever they are included within the interim financial report (e.g., in the management commentary or risk report). The other information within the interim financial report must be available to users on the same terms as the interim financial statements and at the same time. This amendment is applied retrospectively.
These amendments do not have any impact on the Group.
Amendments to IAS 1 Disclosure Initiatives
The amendments to IAS 1 clarify, rather than significantly change, existing IAS 1 requirements. The amendments clarify:
• The materiality requirements in IAS 1
• That specific line items in the statement(s) of profit or loss and OCI and the statement of financial position may be disaggregated
• That entities have flexibility as to the order in which they present the notes to financial statements
• That the share of OCI of associates and joint ventures accounted for using the equity method must be presented in aggregate as a single line item, and classified between those items that will or will not be subsequently reclassified to profit or loss.
NOTES TO THE FINANCIAL STATEMENTSFOR THE YEAR ENDED 30TH JUNE 2017
LUX ISLAND RESORTS LTD AND ITS SUBSIDIARIES
152
2. ACCOUNTING POLICIES (CONT’D)
2.3 CHANGES IN ACCOUNTING POLICIES AND DISCLOSURES (CONT’D)
Amendments to IAS (1) Disclosure Initiatives (cont’d)
Furthermore, the amendments clarify the requirements that apply when additional subtotals are presented in the statement of financial position and the statement of profit or loss and OCI. These amendments do not have any impact on the Group.
Amendments to IFRS 10, IFRS 12 and IAS 28 Investment Entities: Applying the Consolidation Exception
The amendments address issues that have arisen in applying the investment entities exception under IFRS 10 Consolidated Financial Statements. The amendments to IFRS 10 clarify that the exemption from presenting consolidated financial statements applies to a parent entity that is a subsidiary of an investment entity, when the investment entity measures all of its subsidiaries at fair value.
Furthermore, the amendments to IFRS 10 clarify that only a subsidiary of an investment entity that is not an investment entity itself and that provides support services to the investment entity is consolidated. All other subsidiaries of an investment entity are measured at fair value. The amendments to IAS 28 Investments in Associates and Joint Ventures allow the investor, when applying the equity method, to retain the fair value measurement applied by the investment entity associate or joint venture to its interests in subsidiaries.
These amendments are applied retrospectively and do not have any impact on the Group.
New and amended standards and interpretations (cont’d)
The following standards are effective for annual periods beginning on or after 1 January 2016 but are not relevant to the Company’s operations:
• IFRS 14 Regulatory Deferral Accounts
• Amendments to IFRS 11 Joint Arrangements: Accounting for Acquisitions of Interests
• Amendments to IAS 16 and IAS 38: Clarification of Acceptable Methods of Depreciation and Amortisation
• Amendments to IAS 16 and IAS 41 Agriculture: Bearer Plants
• Amendments to IAS 27: Equity Method in Separate Financial Statements
2.4 ACCOUNTING STANDARDS AND INTERPRETATIONS ISSUED BUT NOT YET EFFECTIVE
Standards and interpretations issued but not yet effective up to the date of issuance of the Group’s financial statements are listed below. This listing is of standards and interpretations issued, which the Group reasonably expects to be applicable at a future date. The Group intends to adopt those standards when they become effective.
Effective for accounting period
beginning on or after
- IFRS 9 Financial Instruments – Classification and measurement of financial assets, Accounting for financial liabilities and derecognition
1 January 2018
- Sale or contribution of assets between an investor and its associate or joint venture (Amendments to IFRS 10 and IAS 28)
Effective date deferred indefinitely
- IFRS 15 Revenue from Contracts with Customers 1 January 2018
- IFRS 16 Leases 1 January 2019
- IFRS 17 Insurance contracts 1January 2021
- Recognition of Deferred Tax Assets for Unrealised Losses (Amendments to IAS 12) 1 January 2017
- Disclosure initiative (Amendments to IAS 7) 1 January 2017
- Annual Improvements 2014 – 2016 Cycle 1 January 2017
- Clarification to IFRS 15 ‘Revenue from contracts with customers’ 1 January 2018
- IFRIC 22 Foreign Currency Transactions and Advance Consideration 1 January 2018
- Transfers of Investment Property (Amendments to IAS 40) 1 January 2018
- Applying IFRS 9 ‘Financial Instruments’ with IFRS 4 ‘Insurance Contracts’ (Amendments to IFRS 4) 1 January 2018
- Classification and Measurement of Share-based Payment Transactions (Amendments to IFRS 2) 1 January 2018
NOTES TO THE FINANCIAL STATEMENTSFOR THE YEAR ENDED 30TH JUNE 2017
ANNUAL REPORT 2017
153
2. ACCOUNTING POLICIES (CONT’D)
2.4 ACCOUNTING STANDARDS AND INTERPRETATIONS ISSUED BUT NOT YET EFFECTIVE (CONT’D)
Where the standards and interpretations may have an impact at a future date, they have been discussed below:
IFRS 9 Financial Instruments - Classification and measurement of financial assets, Accounting for financial liabilities and derecognition - 1st January 2018
IFRS 9 introduces new requirements for classifying and measuring financial assets, as follows:
Classification and measurement of financial assets
All financial assets are measured at fair value on initial recognition, adjusted for transaction costs if the instrument is not accounted for at fair value through profit or loss (FVTPL). Debt instruments are subsequently measured at FVTPL, amortised cost or fair value through other comprehensive income (FVOCI), on the basis of their contractual cash flows and the business model under which the debt instruments are held. There is a fair value option (FVO) that allows financial assets on initial recognition to be designated as FVTPL if that eliminates or significantly reduces an accounting mismatch. Equity instruments are generally measured at FVTPL. However, entities have an irrevocable option on an instrument-by-instrument basis to present changes in the fair value of non-trading instruments in other comprehensive income (OCI) (without subsequent reclassification to profit or loss).
For financial liabilities designated as FVTPL using the FVO, the amount of change in the fair value of such financial liabilities that is attributable to changes in credit risk must be presented in OCI. The remainder of the change in fair value is presented in profit or loss, unless presentation of the fair value change in respect of the liability’s credit risk in OCI would create or enlarge an accounting mismatch in profit or loss. All other IAS 39 Financial Instruments: Recognition and Measurement classification and measurement requirements for financial liabilities have been carried forward into IFRS 9, including the embedded derivative separation rules and the criteria for using the FVO.
Impairment
The impairment requirements are based on an expected credit loss (ECL) model that replaces the IAS 39 incurred loss model. The ECL model applies to: debt instruments accounted for at amortised cost or at FVOCI; most loan commitments; financial guarantee contracts; contract assets under IFRS 15; and lease
receivables under IAS 17 Leases. Entities are generally required to recognise either 12-months’ or lifetime ECL, depending on whether there has been a significant increase in credit risk since initial recognition (or when the commitment or guarantee was entered into). For some trade receivables, the simplified approach may be applied whereby the lifetime expected credit losses are always recognised.
Hedge accounting
Hedge effectiveness testing is prospective, without the 80% to 125% bright line test in IAS 39, and, depending on the hedge complexity, can be qualitative. A risk component of a financial or non-financial instrument may be designated as the hedged item if the risk component is separately identifiable and reliably measureable. The time value of an option, any forward element of a forward contract and any foreign currency basis spread, can be excluded from the designation as the hedging instrument and accounted for as costs of hedging. More designations of groups of items as the hedged item are possible, including layer designations and some net positions.
The application of IFRS 9 may change the measurement and presentation of many financial instruments, depending on their contractual cash flows and business model under which they are held. The impairment requirements will generally result in earlier recognition of credit losses. The new hedging model may lead to more economic hedging strategies meeting the requirements for hedge accounting.
The Group is still assessing the impact of this new standard, but it is not expected to have a significant effect on its financial performance. There may be an impact on the level of disclosure provided.
Sale or contribution of assets between an investor and its associate or joint venture (Amendments to IFRS 10 and IAS 28) - effective date deferred indefinitely
This amendment to IFRS 10 Consolidated Financial Statements and IAS 28 Investments in Associates and Joint Ventures (2011) was made to clarify the treatment of the sale or contribution of assets from an investor to its associate or joint venture, as follows:
• it requires full recognition in the investor’s financial statements of gains and losses arising on the sale or contribution of assets that constitute a business (as defined in IFRS 3 Business Combinations); and
• it requires the partial recognition of gains and losses where the assets do not constitute a business, i.e. a gain or loss is recognised only to the extent of the unrelated investors’ interests in that associate or joint venture.
NOTES TO THE FINANCIAL STATEMENTSFOR THE YEAR ENDED 30TH JUNE 2017
LUX ISLAND RESORTS LTD AND ITS SUBSIDIARIES
154
2. ACCOUNTING POLICIES (CONT’D)
2.4 ACCOUNTING STANDARDS AND INTERPRETATIONS ISSUED BUT NOT YET EFFECTIVE (CONT’D)
Sale or contribution of assets between an investor and its associate or joint venture (Amendments to IFRS 10 and IAS 28) - effective date deferred indefinitely (Cont'd)
These requirements apply regardless of the legal form of the transaction, e.g. whether the sale or contribution of assets occurs by an investor transferring shares in a subsidiary that holds the assets (resulting in loss of control of the subsidiary), or by the direct sale of the assets themselves.
The directors will assess the impact of the amendments when they become effective.
IFRS 15 Revenue from Contracts with Customers - effective 1st January 2018
IFRS 15 provides a single, principles based five-step model to be applied to all contracts with customers.
The five steps in the model are as follows:
• Identify the contract with the customer;
• Identify the performance obligations in the contract;
• Determine the transaction price;
• Allocate the transaction price to the performance obligations in the contracts; and
• Recognise revenue when (or as) the entity satisfies a performance obligation.
Guidance is provided on topics such as the point in which revenue is recognised, accounting for variable consideration, costs of fulfilling and obtaining a contract and various related matters. New disclosures about revenue are also introduced.
The Group is still assessing the impact of this new standard, but it is not expected to have a significant effect on its financial performance. There may be an impact on the level of disclosure provided.
IFRS 16 Leases
IFRS 16 was issued in January 2016 and it replaces IAS 17 Leases, IFRIC 4 Determining whether an Arrangement contains a Lease, SIC-15 Operating Leases-Incentives and SIC-27 Evaluating the Substance of Transactions Involving the Legal Form of a Lease. IFRS 16 sets out the principles for the recognition, measurement, presentation and disclosure of leases and requires lessees to account for all leases under a single
on-balance sheet model similar to the accounting for finance leases under IAS 17. The standard includes two recognition exemptions for lessees – leases of ’low-value’ assets (e.g., personal computers) and short-term leases (i.e., leases with a lease term of 12 months or less). At the commencement date of a lease, a lessee will recognise a liability to make lease payments (i.e., the lease liability) and an asset representing the right to use the underlying asset during the lease term (i.e., the right-of-use asset). Lessees will be required to separately recognise the interest expense on the lease liability and the depreciation expense on the right-of-use asset.
Lessees will be also required to remeasure the lease liability upon the occurrence of certain events (e.g., a change in the lease term, a change in future lease payments resulting from a change in an index or rate used to determine those payments). The lessee will generally recognise the amount of the remeasurement of the lease liability as an adjustment to the right-of-use asset.
Lessor accounting under IFRS 16 is substantially unchanged from today’s accounting under IAS 17. Lessors will continue to classify all leases using the same classification principle as in IAS 17 and distinguish between two types of leases: operating and finance leases.
IFRS 16 also requires lessees and lessors to make more extensive disclosures than under IAS 17.
IFRS 16 is effective for annual periods beginning on or after 1st January 2019. Early application is permitted, but not before an entity applies IFRS 15. A lessee can choose to apply the standard using either a full retrospective or a modified retrospective approach. The standard’s transition provisions permit certain reliefs.
In 2017, the Group plans to assess the potential effect of IFRS 16 on its consolidated financial statements.
Recognition of Deferred Tax Assets for Unrealised Losses (Amendments to IAS 12) - effective 1st January 2017
Amendments to IAS 12 Income Taxes have been made to clarify the following aspects:
• Unrealised losses on debt instruments measured at fair value and measured at cost for tax purposes give rise to a deductible temporary difference regardless of whether the debt instrument’s holder expects to recover the carrying amount of the debt instrument by sale or by use.
• The carrying amount of an asset does not limit the estimation of probable future taxable profits.
• Estimates for future taxable profits exclude tax deductions resulting from the reversal of deductible temporary differences.
NOTES TO THE FINANCIAL STATEMENTSFOR THE YEAR ENDED 30TH JUNE 2017
ANNUAL REPORT 2017
155
2. ACCOUNTING POLICIES (CONT’D)
2.4 ACCOUNTING STANDARDS AND INTERPRETATIONS ISSUED BUT NOT YET EFFECTIVE (CONT’D)
Recognition of Deferred Tax Assets for Unrealised Losses (Amendments to IAS 12) - effective 1st January 2017 (Cont'd)
• An entity assesses a deferred tax asset in combination with other deferred tax assets. Where tax law restricts the utilisation of tax losses, an entity would assess a deferred tax asset in combination with other deferred tax assets of the same type.
The directors will assess the impact of the amendments when they become effective.
Disclosure Initiative (amendments to IAS 7) – effective 1st January 2017
Amendments to IAS 7 Statement of Cash Flows were made to clarify that entities shall provide disclosures that enable users of financial statements to evaluate changes in liabilities arising from financing activities.
Clarifications to IFRS 15 ‘Revenue from Contracts with Customers’ - effective 1st January 2018
IASB amended IFRS 15 ‘Revenue from Contracts with Customers’ to clarify three aspects of the standard (identifying performance obligations, principal versus agent considerations, and licensing) and to provide some transition relief for modified contracts and completed contracts.
No early adoption of these standards and interpretations is intended by the Board of directors.
Annual Improvements 2014 – 2016 Cycle - 1st January 2017
The following amendments were made to these standards:
• IFRS 1 - Deletes the short-term exemptions in paragraphs E3–E7 of IFRS 1, because they have now served their intended purpose
• IFRS 12 - Clarifies the scope of the standard by specifying that the disclosure requirements in the standard, except for those in paragraphs B10–B16, apply to an entity’s interests listed in paragraph 5 that are classified as held for sale, as held for distribution or as discontinued operations in accordance with IFRS 5 Non-current Assets Held for Sale and Discontinued Operations
• IAS 28 - Clarifies that the election to measure at fair value through profit or loss an investment in an associate or a joint venture that is held by an entity that is a venture capital
organisation, or other qualifying entity, is available for each investment in an associate or joint venture on an investment-by-investment basis, upon initial recognition
Management is still assessing the impact from the adoption of these new or amended standards and interpretations on the Group’s financial statements.
No early adoption is intended by the Board of directors.
2.5 SUMMARY OF SIGNIFICANT ACCOUNTING POLICIES
(a) Foreign currency translation
The consolidated and separate financial statements are presented in Mauritian Rupees (“Rs”), which is the parent’s functional and presentation currency. Each entity in the Group determines its own functional currency and items included in the financial statements of each entity are measured using that functional currency. Transactions in foreign currencies are initially recorded in the functional currency at the rate ruling at the date of the transaction. Monetary assets and liabilities denominated in foreign currencies are retranslated to the functional currency at the rate of exchange ruling at the reporting date. All differences are taken to profit or loss with the exception of differences on foreign currency borrowings that provide a hedge against a net investment in a foreign entity. These are taken to other comprehensive income until the disposal of the net investment, at which time they are recognised in profit or loss. Tax charges and credits attributable to exchange differences on those borrowings are also dealt with in other comprehensive income. Non-monetary items that are measured in terms of historical cost in a foreign currency are translated using the exchange rates as at the dates of the initial transactions. Non-monetary items measured at fair value in a foreign currency are translated using the exchange rates at the date when the fair value was determined.
Where the functional currency of the subsidiaries at the reporting date is not the presentation currency of the Group (the Mauritian Rupee), the assets and liabilities of these subsidiaries are translated into Mauritian Rupee at the rate of exchange ruling at the reporting date and, income and expenses are translated at the average exchange rates for the year. The exchange differences arising on the translation are taken through other comprehensive income. On disposal of a foreign entity, the deferred cumulative amount recognised in other comprehensive income relating to that particular foreign operation is recognised in profit or loss.
NOTES TO THE FINANCIAL STATEMENTSFOR THE YEAR ENDED 30TH JUNE 2017
LUX ISLAND RESORTS LTD AND ITS SUBSIDIARIES
156
2. ACCOUNTING POLICIES (CONT’D)
2.5 SUMMARY OF SIGNIFICANT ACCOUNTING POLICIES (CONT’D)
(b) Property, plant and equipment
All property, plant and equipment are initially recorded at cost. Land and buildings are subsequently shown at fair value, based on valuations by external independent valuers, less accumulated depreciation for property and impairment losses recognised after the date of revaluation. The policy of the Group is to revalue the Land and Buildings every three years. All other property, plant and equipment are stated at historical cost less accumulated depreciation and impairments.
Construction in progress are stated at cost and are not depreciated. When completed, construction in progress are transferred to plant and equipment.
Increases in the carrying amount arising on revaluation are credited to revaluation reserve in equity. Decreases that offset previous increases of the same asset are charged through other comprehensive income against the revaluation reserve to the extent that the decrease does not exceed the amount held in the revaluation reserve in respect of that same asset; all other decreases are charged to the profit or loss.
The carrying values of property, plant and equipment are reviewed for impairment at each reporting date or when events or changes in circumstances indicate that the carrying value may not be recoverable.
Gains and losses on disposal of property, plant and equipment are determined by reference to their carrying amount and are taken into account in determining operating profit. On disposal of revalued assets, amounts in revaluation and other reserves relating to that asset are transferred to retained earnings.
Depreciation is calculated on the straight line method to write off the cost of each asset, or the revalued amounts, to their residual values over their estimated useful lives. The useful life, residual value and method of depreciation of an item of property, plant and equipment are reviewed at each financial year end and adjusted prospectively if appropriate. The residual values and remaining useful lives of buildings have been estimated by the independent external valuers.
The annual rate of depreciation is as follows:
Buildings - 2% - 9.45 % Plant and equipment - 10% - 20%Furniture and fittings - 10% - 33.33% Motor vehicles - 20%
Computer equipment - 10% - 33.33%
Assets held under finance leases are depreciated over their expected useful lives on the same basis as owned assets or, where shorter, the term of the relevant lease.
An item of property, plant and equipment is derecognised upon disposal or when no future economic benefits are expected to arise from the continued use of the asset. Any gain or loss arising on the disposal or retirement of an item of property, plant and equipment is determined as the difference between the sale proceeds and the carrying amount of the asset and is recognised in profit or loss.
(c) Investment in subsidiaries
Financial statements of the Company
Investment in subsidiary companies are carried at cost which is the aggregate of the fair values, at the date of exchange, of assets given, liabilities incurred or assumed, and equity instruments issued by the acquirer, in exchange for control of the acquirer. Acquisition-related costs are recognized in profit or loss as incurred. The carrying amount is reduced to recognise any impairment in the value of individual investments. The impairment loss is taken to profit or loss.
Consolidated financial statements
The consolidated financial statements incorporate the financial statements of the Company and entities controlled by the Company (its subsidiaries). Subsidiaries are consolidated from the date on which control is transferred to the Group and cease to be consolidated from the date on which control is transferred out of the Group. Business combinations are accounted for using the acquisition method of accounting.
(d) Intangible assets
Goodwill
Goodwill acquired in a business combination is initially measured as the sum of the consideration transferred, the amount of any non-controlling interest in the acquiree, and the fair value of the acquirer’s previously held equity interest in the acquire (if any) over the net of the acquisition-date amounts of the identifiable assets and liabilities assumed. If after reassessment, the net of the acquisition date amounts of the identifiable assets acquired and liabilities assumed exceeds the sum of the consideration transferred, the amount of any non-controlling interests in the acquiree and the fair value of the acquirer’s previously held interest in the acquiree, the excess is recognized in profit or loss as a gain on bargain purchase. Goodwill is reviewed for impairment, annually or more frequently if events or changes in circumstances indicate that the carrying value may be impaired.
NOTES TO THE FINANCIAL STATEMENTSFOR THE YEAR ENDED 30TH JUNE 2017
ANNUAL REPORT 2017
157
2. ACCOUNTING POLICIES (CONT’D)
2.5 SUMMARY OF SIGNIFICANT ACCOUNTING POLICIES (CONT’D)
(d) Intangible assets (Cont'd)
Goodwill (Cont'd)
For the purpose of impairment testing, goodwill acquired in a business combination is, from the acquisition date, allocated to each of the Group’s cash-generating units, or group of cash-generating units, that are expected to benefit from the synergies of the combination, irrespective of whether other assets or liabilities of the Group are assigned to those units or groups of units. Each unit or group of units to which the goodwill is so allocated:
• represents the lowest level within the Group at which the goodwill is monitored for internal management purposes; and
• is not larger than a segment based on either the Group’s primary or the Group’s secondary reporting format determined in accordance with IFRS 8 Segment Reporting.
Impairment is determined by assessing the recoverable amount of the cash-generating unit (group of cash-generating units), to which the goodwill relates. Where the recoverable amount of the cash-generating unit (group of cash-generating units) is less than the carrying amount, an impairment loss is recognised. Where goodwill forms part of a cash-generating unit (group of cash-generating units) and part of the operation within that unit is disposed of, the goodwill associated with the operation disposed of is included in the carrying amount of the operation when determining the gain or loss on disposal of the operation. Goodwill disposed of in this circumstance is measured based on the relative values of the operation disposed of and the portion of the cash-generating unit retained.
Gain on bargain purchase represents the excess of the acquirer’s interest in the fair values of the identifiable net assets and liabilities acquired over the cost of acquisition. It is recognised immediately as income in the statement of comprehensive income.
Gain on bargain purchase arising from the acquisition of an associated company is included as income in the determination of the Group’s share of the associate’s profit or loss of the period in which the associate was acquired.
Other intangible assets
Intangible assets acquired separately are measured on initial recognition at cost. The cost of intangible assets acquired in a business combination is the fair value as at the date of acquisition. Following initial recognition, intangible assets are carried at cost less any accumulated amortisation and
any accumulated impairment losses. Internally generated intangible assets, excluding capitalised development costs, are not capitalised and expenditure is charged against profits in the year in which the expenditure is incurred. The useful lives of intangible assets are assessed to be either finite or indefinite. Intangible assets with finite lives are amortised over the useful economic life and assessed for impairment whenever there is an indication that the intangible asset may be impaired. The amortisation period and the amortisation method for an intangible asset with a finite useful life are reviewed at least at each financial year-end. Changes in the expected useful life or the expected pattern of consumption of future economic benefits embodied in the asset is accounted for by changing the amortisation period or method, as appropriate, and treated as changes in accounting estimates. The amortisation expense on intangible assets with finite lives is recognised in profit or loss in the expense category consistent with the function of the intangible asset. The estimated useful lives of intangible assets with finite useful lives are as follows:
Computer software & Licenses - 5 years
Leasehold rights - over the period of the leases.
Intangible assets with indefinite useful lives are tested for impairment annually either individually or at the cash-generating unit level. Such intangibles are not amortised. The useful life of an intangible asset with an indefinite life is reviewed annually to determine whether indefinite life assessment continues to be supportable. If not, the change in the useful life assessment from indefinite to finite is made on a prospective basis.
(e) Trade and other receivables
Trade and other receivables are initially recognised at original invoice amount and are subsequently carried at amortised cost using the effective interest method less any allowance for impairment. Gains and losses are recognised through profit or loss when the receivables are derecognised or impaired, as well as through the amortisation process.
(f) Other financial assets
Financial assets within the scope of IAS 39 are classified as either financial assets at fair value through profit or loss, loans and receivables, held-to-maturity investments, or available-for-sale financial assets, as appropriate. When financial assets are recognised initially, they are measured at fair value, plus, in the case of investments not at fair value through profit or loss, directly attributable transaction costs. The Group determines the classification of its financial assets after initial recognition and, where allowed and appropriate, re-evaluates this designation at each financial year-end.
NOTES TO THE FINANCIAL STATEMENTSFOR THE YEAR ENDED 30TH JUNE 2017
LUX ISLAND RESORTS LTD AND ITS SUBSIDIARIES
158
2. ACCOUNTING POLICIES (CONT’D)
2.5 SUMMARY OF SIGNIFICANT ACCOUNTING POLICIES (CONT’D)
(f) Other financial assets (Cont’d)
All regular way purchases and sales of financial assets are recognised on the trade date, i.e. the date that the Group commits to purchase the asset. Regular way purchases or sales are purchases or sales of financial assets that require delivery of assets within the period generally established by regulation or convention in the marketplace.
The Group has the following investments:
Available-for-sale financial assets
Available-for-sale financial assets are those non-derivative financial assets that are designated as available-for-sale or are not loans and receivables, held-to-maturity investments or investments held at fair value through profit or loss.
After initial recognition available-for sale financial assets are measured at fair value with gains or losses being recognised in other comprehensive income until the investment is derecognised or until the investment is determined to be impaired at which time the cumulative gain or loss previously reported in other comprehensive income is included in profit or loss.
The fair value of investments that are actively traded in organised financial markets is determined by reference to quoted market bid prices at the close of business on the reporting date. For investments where there is no active market, fair value is determined using valuation techniques. Such techniques include using recent arm’s length market transactions; reference to the current market value of another instrument, which is substantially the same; discounted cash flow analysis and option pricing models.
(g) Cash and cash equivalents
Cash and short-term deposits in the statement of financial position comprise cash at bank and in hand and short-term deposits with an original maturity of three months or less.
For the purpose of the consolidated and separate statement of cash flows, cash and cash equivalents consist of cash and cash equivalents as defined above, net of outstanding bank overdrafts. Such financial assets are carried at amortised cost using the effective interest rate method.
(h) Financial liabilities
Initial recognition and measurement
Financial liabilities within the scope of IAS 39 are classified as financial liabilities at fair value through profit or loss (FVTPL), loans and borrowings, or as derivatives designated as hedging instruments in an effective hedge, as appropriate. The Group determines the classification of its financial liabilities at initial recognition.
All financial liabilities are recognised initially at fair value and in the case of loans and borrowings, plus directly attributable transaction costs. The Group’s financial liabilities include trade and other payables, bank overdrafts and loans and borrowings.
Subsequent measurement
The measurement of financial liabilities depends on their classification as follows:
Loans and borrowings
After initial recognition, interest bearing loans and borrowings are subsequently measured at amortised cost using the effective interest rate method. Gains and losses are recognised in profit or loss when the liabilities are derecognised as well as through the effective interest rate method (EIR) amortisation process. Amortised cost is calculated by taking into account any discount or premium on acquisition and fees or costs that are an integral part of the EIR. The EIR amortisation is included in finance costs in profit or loss.
(i) Derecognition of financial assets and liabilities
Financial assets
A financial asset (or, where applicable a part of a financial asset or part of a group of similar financial assets) is derecognised where:
• the rights to receive cash flows from the asset have expired;
• the Company or the Group retains the right to receive cash flows from the asset, but has assumed an obligation to pay them in full without material delay to a third party under a ‘pass-through’ arrangement; or
• the Company or the Group has transferred its rights to receive cash flows from the asset and either (a) has transferred substantially all the risks and rewards of the asset, or (b) has neither transferred nor retained substantially all the risks and rewards of the asset, but has transferred control of the asset.
NOTES TO THE FINANCIAL STATEMENTSFOR THE YEAR ENDED 30TH JUNE 2017
ANNUAL REPORT 2017
159
2. ACCOUNTING POLICIES (CONT’D)
2.5 SUMMARY OF SIGNIFICANT ACCOUNTING POLICIES (CONT’D)
(i) Derecognition of financial assets and liabilities (Cont’d)
Financial assets (Cont'd)
Where the Company or the Group has transferred its rights to receive cash flows from an asset and has neither transferred nor retained substantially all the risks and rewards of the asset nor transferred control of the asset, the asset is recognised to the extent of the Company’s or the Group’s continuing involvement in the asset. Continuing involvement that takes the form of a guarantee over the transferred asset is measured at the lower of the original carrying amount of the asset and the maximum amount of consideration that the Company or the Group could be required to repay.
Where continuing involvement takes the form of a written and/or purchased option (including a cash-settled option or similar provision) on the transferred asset, the extent of the Group’s continuing involvement is the amount of the transferred asset that the Group may repurchase, except that in the case of a written put option (including a cash-settled option or similar provision) on an asset measured at fair value, the extent of the Group’s continuing involvement is limited to the lower of the fair value of the transferred asset and the option exercise price.
Financial liabilities
A financial liability is derecognised when the obligation under the liability is discharged or cancelled or expires.
Where an existing financial liability is replaced by another from the same lender on substantially different terms, or the terms of an existing liability are substantially modified, such an exchange or modification is treated as a derecognition of the original liability and the recognition of a new liability, and the difference in the respective carrying amounts is recognised in profit or loss.
(j) Impairment of financial assets
The Group assesses, at each reporting date, whether there is objective evidence that a financial asset or a group of financial assets is impaired. An impairment exists if one or more events that has occurred since the initial recognition of the asset (an incurred ‘loss event’), has an impact on the estimated future cash flows of the financial asset or the group of financial assets that can be reliably estimated. Evidence of impairment may include indications that the debtors or a group of debtors is experiencing significant financial difficulty, default or delinquency in interest or principal payments, the probability that they will enter
bankruptcy or other financial reorganisation and observable data indicating that there is a measurable decrease in the estimated future cash flows, such as changes in arrears or economic conditions that correlate with defaults.
Available-for-sale financial assets
If an available-for-sale asset is impaired, if there is objective evidence of a significant or prolonged decline in the fair value of the investment below its cost, an amount comprising the difference between its cost and its current fair value, less any impairment loss previously recognised in profit or loss, the cumulative loss is transferred from other comprehensive income to profit or loss. Reversals in respect of equity instruments classified as available-for-sale are not recognised in profit or loss. Reversals of impairment losses on debt instruments are reversed through profit or loss, only if the increase in fair value of the instrument can be objectively related to an event occurring after the impairment loss was recognised in profit or loss.
Trade and other receivables
For amounts due from customers carried at amortised cost, the Group first assesses individually whether objective evidence of impairment exists individually for financial assets that are individually significant, or collectively for financial assets that are individually not significant. If the Group determines that no objective evidence of impairment exists for individually assessed financial asset, whether significant or not, it includes the asset in a group of financial assets with similar credit risk characteristics and collectively assesses them for impairment.
If there is objective evidence that an impairment loss has been incurred, the amount of the loss is measured as the difference between the asset’s carrying amount and the present value of estimated future cash flows. The carrying amount of the asset is reduced through the use of an allowance account and the amount of the loss is recognised in profit or loss.
(k) Offsetting of financial instruments
Financial assets and financial liabilities are offset and the net amount reported in the consolidated and separate statement of financial position if, and only if, there is a currently enforceable legal right to offset the recognised amounts and there is an intention to settle on a net basis, or to realise the assets and settle the liabilities simultaneously.
NOTES TO THE FINANCIAL STATEMENTSFOR THE YEAR ENDED 30TH JUNE 2017
LUX ISLAND RESORTS LTD AND ITS SUBSIDIARIES
160
2. ACCOUNTING POLICIES (CONT’D)
2.5 SUMMARY OF SIGNIFICANT ACCOUNTING POLICIES (CONT’D)
(l) Fair value of financial instruments
Determination of fair value
The Company measures its investments in financial instruments, such as equities, debentures and other interest bearing investments and derivatives, at fair value at each reporting date.
Fair value is the price that would be received to sell an asset or paid to transfer a liability in an orderly transaction between market participants at the measurement date.
The fair value measurement is based on the presumption that the transaction to sell the asset or transfer the liability takes place either in the principal market for the asset or liability or, in the absence of a principal market, in the most advantageous market for the asset or liability. The principal or the most advantageous market must be accessible to the Company.
The fair value of an asset or a liability is measured using the assumptions that market participants would use when pricing the asset or liability, assuming that market participants act in their economic best interest.
The fair value for financial instruments traded in active markets at the reporting date is based on their quoted price or binding dealer price quotations (bid price for long positions and ask price for short positions), without any deduction for transaction costs. Securities defined in these accounts as ‘listed’ are traded in an active market.
Where the Company has financial assets and financial liabilities with offsetting positions in market risks or counterparty credit risk, it has elected to use the measurement exception provided in IFRS 13 to measure the fair value of its net risk exposure by applying the bid or ask price to the net open position as appropriate.
For all other financial instruments not traded in an active market, the fair value is determined by using valuation techniques deemed to be appropriate in the circumstances. Valuation techniques include the market approach (i.e., using recent arm’s length market transactions adjusted as necessary and reference to the current market value of another instrument that is substantially the same) and the income approach (i.e., discounted cash flow analysis and option pricing models making as much use of available and supportable market data as possible).
All assets and liabilities for which fair value is measured or disclosed in the financial statements are categorised within the fair value hierarchy, described as follows, based on the lowest level input that is significant to the fair value measurement as a whole:
- Level 1 - Quoted (unadjusted) market prices in active markets for identical assets or liabilities
- Level 2 - Valuation techniques for which the lowest level input that is significant to the fair value measurement is directly or indirectly observable
- Level 3 - Valuation techniques for which the lowest level input that is significant to the fair value measurement is unobservable
For assets and liabilities that are recognised in the financial statements on a recurring basis, the Company determines whether transfers have occurred between levels in the hierarchy by re-assessing the categorisation (based on the lowest level input that is significant to the fair value measurement as a whole) at the beginning of each reporting period.
(m) Equity instruments
An equity instrument is any contract that evidences a residual interest in the assets of an entity after deducting all of its liabilities. Equity instruments issued by the Group are recognised at the proceeds received, net of direct issue costs.
Treasury shares
Repurchase of the Company’s own equity instruments is recognised and deducted directly in equity. No gain or loss is recognised in profit or loss on the purchase, sale, issue or cancellation of the Company’s own equity instruments. Any difference between the carrying amount and the consideration is recognised in other reserves.
(n) Hedge accounting
For the purpose of hedge accounting, hedges are classified as:
• fair value hedges when hedging the exposure to changes in the fair value of a recognised asset or liability or an unrecognised firm commitment; or
• cash flow hedges when hedging exposure to variability in cash flows that is either attributable to a particular risk associated with a recognised asset or liability or a highly probable forecast transaction or the foreign currency risk in an unrecognised firm commitment; or
• hedges of a net investment in a foreign operation.
NOTES TO THE FINANCIAL STATEMENTSFOR THE YEAR ENDED 30TH JUNE 2017
ANNUAL REPORT 2017
161
2. ACCOUNTING POLICIES (CONT’D)
2.5 SUMMARY OF SIGNIFICANT ACCOUNTING POLICIES (CONT’D)
(n) Hedge accounting (Cont'd)
At the inception of a hedge relationship, the Group formally designates and documents the hedge relationship to which the Group wishes to apply hedge accounting and the risk management objective and strategy for undertaking the hedge.
The documentation includes identification of the hedging instrument, the hedged item or transaction, the nature of the risk being hedged and how the entity will assess the hedging instrument’s effectiveness in offsetting the exposure to changes in the hedged item’s fair value or cash flows attributable to the hedged risk. Such hedges are expected to be highly effective in achieving offsetting changes in fair value or cash flows and are assessed on an ongoing basis to determine that they actually have been highly effective throughout the financial reporting periods for which they were designated.
The Group currently has only cash flow hedges which are accounted for as follows:
The effective portion of the gain or loss on the hedging instrument is recognised directly in other comprehensive income, while any ineffective portion is recognised immediately in profit or loss.
Amounts taken to other comprehensive income are transferred to profit or loss when the hedged transaction affects profit or loss, such as when the hedged financial income or financial expense is recognised or when a forecast sale occurs. Where the hedged item is the cost of a non-financial asset or non-financial liability, the amounts taken to other comprehensive income are transferred to the initial carrying amount of the non-financial asset or liability.
If the forecast transaction or firm commitment is no longer expected to occur, amounts previously recognised in other comprehensive income are transferred to profit or loss. If the hedging instrument expires or is sold, terminated or exercised without replacement or rollover, or if its designation as a hedge is revoked, amounts previously recognised in other comprehensive income remains separately in equity until the forecast transaction or firm commitment affects profit or loss.
(o) Impairment of non-financial assets
The Group assesses at each reporting date whether there is an indication that an asset may be impaired. Non-financial assets are considered to be impaired when there is objective evidence that, as a result of one or more events that occurred after the initial recognition of the non-financial asset, the estimated
future cash flows of the investment has been affected. If any such indication exists, or when annual impairment testing for an asset is required, the Group makes an estimate of the asset’s recoverable amount. An asset’s recoverable amount is the higher of an asset’s or cash-generating unit’s fair value less costs to sell and its value in use and is determined for an individual asset, unless the asset does not generate cash inflows that are largely independent of those from other assets or groups of assets. Where the carrying amount of an asset exceeds its recoverable amount, the asset is considered impaired and is written down to its recoverable amount. In assessing value in use, the estimated future cash flows are discounted to their present value using a pre-tax discount rate that reflects current market assessments of the time value of money and the risks specific to the asset. Impairment losses of continuing operations are recognised in profit or loss in those expense categories consistent with the function of the impaired asset.
An assessment is made at each reporting date as to whether there is any indication that previously recognised impairment losses may no longer exist or may have decreased. If such indication exists, the recoverable amount is estimated. A previously recognised impairment loss is reversed only if there has been a change in the estimates used to determine the asset’s recoverable amount since the last impairment loss was recognised. If that is the case the carrying amount of the asset is increased to its recoverable amount. That increased amount cannot exceed the carrying amount that would have been determined, net of depreciation, had no impairment loss been recognised for the asset in prior years. Such reversal is recognised in profit or loss unless the asset is carried at revalued amount, in which case the reversal is treated as a revaluation increase. After such a reversal the depreciation charge is adjusted in future periods to allocate the asset’s revised carrying amount, less any residual value, on a systematic basis over its remaining useful life.
(p) Inventories
Inventories are stated at the lower of cost and net realisable value. Costs incurred in bringing each product to its present location and condition, are accounted for on a weighted average cost basis.
Net realisable value is the estimated selling price in the ordinary course of business, less estimated costs of completion and the estimated costs necessary to make the sale.
NOTES TO THE FINANCIAL STATEMENTSFOR THE YEAR ENDED 30TH JUNE 2017
LUX ISLAND RESORTS LTD AND ITS SUBSIDIARIES
162
2. ACCOUNTING POLICIES (CONT’D)
2.5 SUMMARY OF SIGNIFICANT ACCOUNTING POLICIES (CONT’D)
(q) Provisions
Provisions are recognised when the Group has a present obligation (legal or constructive) as a result of a past event and it is probable that an outflow of resources embodying economic benefits will be required to settle the obligation and a reliable estimate can be made of the amount of the obligation. Where the Group expects some or all of a provision to be reimbursed, for example under an insurance contract, the reimbursement is recognised as a separate asset but only when the reimbursement is virtually certain. The expense relating to any provision is presented in profit or loss net of any reimbursement. If the effect of the time value of money is material, provisions are discounted using a current pre-tax rate that reflects, where appropriate, the risks specific to the liability. Where discounting is used, the increase in the provision due to the passage of time is recognised as a borrowing cost.
(r) Retirement benefit obligations
The Group operates a defined benefit plan for some of its employees. For the remaining employees, the Group contributes to a unitised defined contribution pension scheme that was established on 1st July 2002. The employer contributes 9% of salaries less their contribution to the National Pensions Scheme in respect of members of the fund. Members contribute 6% of salaries less their contribution to the National Pensions Scheme. In each case the minimum monthly contribution is Rs. 100.
Defined benefits schemes
The cost of providing benefits under the defined benefit plan is determined using the projected unit credit method. Re-measurements, comprising of actuarial gains and losses, the effect of the asset ceiling, excluding net interest (not applicable to the Group) and the return on plan assets (excluding net interest), are recognized immediately in the statement of financial position with a corresponding debit or credit to retained earnings through OCI in the period in which they occur. Re-measurements are not reclassified to profit or loss in subsequent periods. Past service costs are recognised in profit or loss on the earlier of:
• The date of the plan amendment or curtailment, and
• the date that the Group recognises restructuring-related costs
Net interest is calculated by applying the discount rate to the net defined benefit liability or asset. The Group recognises the following changes in the net defined benefit obligation under ‘employee benefit expenses’ in profit or loss:
• Service costs comprising current service costs, past-service costs, gains and losses on curtailments and non-routine settlements
• Net interest expense or income
Defined contributions schemes
Payments to defined contribution retirement plans are charged as an expense as they fall due. Unpaid contributions are recognized as a liability.
Other retirement benefits
For employees who are not covered by the above plan, the net present value of gratuities payable under the Employment Rights Act 2008 is calculated and a liability accounted for. The obligations under this item are not funded.
Liabilities with respect to above schemes are calculated by Swan Life Ltd (Actuarial Valuer) annually.
Right of set off
The Group does not offset the asset relating to one plan against a liability relating to another plan as it:
• does not have a legally enforceable right to use a surplus in one plan to settle obligations under the other plan; and
• does not intend to either to settle the obligations on a net basis, or to realise the surplus in one plan and settle its obligation under the other plan simultaneously
(s) Taxes
Current tax
Current tax assets and liabilities for the current and prior periods are measured at the amount expected to be recovered from or paid to the taxation authorities. The tax rates and tax laws used to compute the amount are those that are enacted or substantively enacted, at the reporting date in the countries where the Group operates and generates taxable income.
NOTES TO THE FINANCIAL STATEMENTSFOR THE YEAR ENDED 30TH JUNE 2017
ANNUAL REPORT 2017
163
2. ACCOUNTING POLICIES (CONT’D)
2.5 SUMMARY OF SIGNIFICANT ACCOUNTING POLICIES (CONT’D)
(s) Taxes (Cont’d)
Current tax (Cont’d)
Management periodically evaluates positions taken in the tax returns with respect to situations in which applicable tax regulations are subject to interpretation and establishes provisions where appropriate.
Deferred tax
Deferred tax is provided using the liability method on temporary differences at the reporting date between the tax bases of assets and liabilities and their carrying amounts for financial reporting purposes.
Deferred tax liabilities are recognised for all taxable temporary differences, except:
• Where the deferred tax liability arises from the initial recognition of goodwill or of an asset or liability in a transaction that is not a business combination and, at the time of the transaction, affects neither the accounting profit nor taxable profit or loss
• In respect of taxable temporary differences associated with investments in subsidiaries, associates and interests in joint ventures, where the timing of the reversal of the temporary differences can be controlled and it is probable that the temporary differences will not reverse in the foreseeable future
Deferred tax assets are recognised for all deductible temporary differences, carry-forward of unused tax credits and unused tax losses, to the extent that it is probable that taxable profit will be available against which the deductible temporary differences, and the carry-forward of unused tax credits and unused tax losses can be utilized, except:
• Where the deferred tax asset relating to the deductible temporary difference arises from the initial recognition of an asset or liability in a transaction that is not a business combination and, at the time of the transaction, affects neither the accounting profit nor taxable profit or loss
• In respect of deductible temporary differences associated with investments in subsidiaries, associates and interests in joint ventures, deferred tax assets are recognised only to the extent that it is probable that the temporary differences will reverse in the foreseeable future and taxable profit will be available against which the temporary differences can be utilised
The carrying amount of deferred tax assets is reviewed at each reporting date and reduced to the extent that it is no longer probable that sufficient taxable profit will be available to allow all or part of the deferred tax asset to be utilised. Unrecognised deferred tax assets are reassessed at each reporting date and are recognised to the extent that it has become probable that future taxable profit will allow the deferred tax asset to be recovered.
The principal temporary differences arise from depreciation on property, plant and equipment, revaluations of certain non-current assets, provisions for bad debts, tax losses carried forward and retirement benefit obligations.
Deferred tax assets and liabilities are measured at the tax rates that are expected to apply to the year when the asset is realised or the liability is settled, based on tax rates that have been enacted or substantially enacted at the reporting date.
Income tax relating to items recognised directly in other comprehensive income is recognised in other comprehensive income and not profit or loss.
Deferred tax assets and deferred tax liabilities are offset, if a legally enforceable right exists to set off current tax assets against current tax liabilities and the deferred taxes relate to the same taxable entity and the same taxation authority.
Tax benefits acquired as part of a business combination, but not satisfying the criteria for separate recognition at that date, would be recognised subsequently if new information about facts and circumstances changed. The adjustment would either be treated as a reduction to goodwill (as long as it does not exceed goodwill) if it is incurred during the measurement period or in profit or loss.
Value Added Tax
Revenues, expenses and assets are recognised net of the amount of value added tax except:
• Where the value added tax incurred on a purchase of assets or services is not recoverable from the taxation authority, in which case the value added tax is recognised as part of the cost of acquisition of the asset or as part of the expense item as applicable; and
• receivables and payables that are stated with the amount of value added tax included
The net amount of value added tax recoverable from, or payable to, the taxation authority is included as part of accounts receivables or payables in the statement of financial position.
NOTES TO THE FINANCIAL STATEMENTSFOR THE YEAR ENDED 30TH JUNE 2017
LUX ISLAND RESORTS LTD AND ITS SUBSIDIARIES
164
2. ACCOUNTING POLICIES (CONT’D)
2.5 SUMMARY OF SIGNIFICANT ACCOUNTING POLICIES (CONT’D)
(t) Non-current assets held for sale and discontinued operations
Non-current assets and disposal groups are classified as held for sale if the carrying amount will be recovered through a sale rather than through continuing use. This condition is regarded as met only when the sale is highly probable and the non-current asset is available for immediate sale in its present condition. Management must be committed to the sale, which should be expected to qualify for recognition as a completed sale within one year from the date of classification.
Non-current assets (and disposal groups) classified as held for sale are measured at the lower of their carrying amount and fair value less costs attributable to the sale. Property, plant and equipment and intangible assets once classified as held for sale are not depreciated or amortised.
In the consolidated statement of comprehensive income of the reporting period, and of the comparable period, income and expenses from discontinued operations are reported separately from income and expenses from continuing operations, down to the level of profit after taxes. The resulting profit or loss (after taxes) is reported separately in the statement of profit or loss.
(u) Lease
Group as lessee
The determination of whether an arrangement is, or contains a lease is based on the substance of the arrangement and requires an assessment of whether the fulfilment of the arrangement is dependent on the use of a specific asset or assets and the arrangement conveys a right to use the asset.
Leases are classified as finance leases whenever the terms of the lease transfer substantially all the risks and rewards of ownership to the lessee. All other leases are classified as operating leases.
Finance leases, which transfer to the Group substantially all the risks and benefits incidental to ownership of the leased item, are capitalised at the inception of the lease at the fair value of the leased property or, if lower, at the present value of the minimum lease payments. Lease payments are apportioned between the finance charges and reduction of the lease liability so as to achieve a constant rate of interest on the remaining balance of the liability. The interest balance should be recognised as a finance cost.
Capitalised leased assets are depreciated over the shorter of the estimated useful life of the asset and the lease term, if there is no reasonable certainty that the Group will obtain ownership by the end of the lease term.
Operating lease payments are recognised as an expense in profit or loss on a straight-line basis over the lease term. The difference between actual payments and the straight lining of the expense is recognised as a liability or asset in the statement of financial position.
Group as a lessor
Assets subject to operating leases are presented in the statement of financial position according to the nature of the asset. A lease is classified as an operating lease if it does not transfer substantially all the risks and rewards incidental to ownership.
Costs, including depreciation, incurred in earning the lease income are recognised as an expense. Lease income is recognised on a straight-line basis over the lease term even if the receipts are not on such a basis.
(v) Borrowing costs
Borrowing costs directly attributable to the acquisition, construction or production of qualifying assets, which are assets that necessarily take a substantial period of time to get ready for their intended use, are added to the cost of those assets, until such time as the assets are substantially ready for their intended use.
All other borrowing costs are recognised as an expense when incurred.
(w) Government grants
Government grants are recognised where there is reasonable assurance that the grant will be received and all attaching conditions will be complied with. When the grant relates to an expense item, it is recognised as income over the period necessary to match the grant on a systematic basis to the costs that it is intended to compensate. Where the grant relates to an asset, it is recognised as deferred income and released to income in equal annual amounts over the expected useful life of the related asset.
NOTES TO THE FINANCIAL STATEMENTSFOR THE YEAR ENDED 30TH JUNE 2017
ANNUAL REPORT 2017
165
2. ACCOUNTING POLICIES (CONT’D)
2.5 SUMMARY OF SIGNIFICANT ACCOUNTING POLICIES (CONT’D)
(x) Revenue recognition
Revenue is recognised to the extent that it is probable that the economic benefits will flow to the Group and the revenue can be reliably measured. The following specific criteria must also be met:
(i) Sale of goods and services
Revenue is recognised when the significant risks and rewards of ownership of the goods have passed to the buyer and upon customer acceptance, if any, or performance of services, net of value added taxes and discounts, and after eliminating sales within the Group. The Group turnover reflects the invoiced values derived from hotel operations.
(ii) Other revenues
Other revenues earned by the Group are recognised on the following basis:
• Interest income - as it accrues (taking into account the effective yield on the asset) unless collectability is in doubt.
• Dividend income - when the shareholder’s right to receive payment is established.
• Rental income arising from operating leases is accounted for on a straight-line basis over the lease terms
• Management fees are recognised on an accrual basis.
(y) Share based payment
Executives of the Group receive remuneration in the form of share-based payments, whereby they render services as consideration for equity instruments (equity-settled transactions).
The cost of equity-settled transactions is determined by the fair value at the date when the grant is made using an appropriate valuation model. That cost is recognised, together with a corresponding increase in other capital reserves in equity, over the period in which the performance and/or service conditions are fulfilled in employee benefits expense. The cumulative expense recognised for equity-settled transactions at each reporting date until the vesting date reflects the extent to which the vesting period has expired and the Group’s best estimate of the number of equity instruments that will ultimately vest. The statement of profit or loss expense or credit for a period represents the movement in cumulative expense recognised as at the beginning and end of that period and is recognised in employee benefits expense.
No expense is recognised for awards that do not ultimately vest, except for equity-settled transaction for which vesting is conditional upon a market or non-vesting condition. These are treated as vesting irrespective of whether or not the market or non-vesting condition is satisfied, provided that all other performance and/or service conditions are satisfied. When the terms of an equity-settled award are modified, the minimum expense recognised is the expense had the terms had not been modified, if the original terms of the award are met. An additional expense is recognised for any modification that increases the total fair value of the share-based payment transaction, or is otherwise beneficial to the employee as measured at the date of modification.
(z) Current versus non-current classification
The Group presents assets and liabilities in the statement of financial position based on current/non-current classification.
An asset is current when it is:
• Expected to be realised or intended to be sold or consumed in the normal operating cycle
• Held primarily for the purpose of trading
• Expected to be realised within twelve months after the reporting period
Or
• Cash or cash equivalent unless restricted from being exchanged or used to settle a liability for at least twelve months after the reporting period
All other assets are classified as non-current.
A liability is current when:
• It is expected to be settled in the normal operating cycle
• It is held primarily for the purpose of trading
• It is due to be settled within twelve months after the reporting period
Or
• There is no unconditional right to defer the settlement of the liability for at least twelve months after the reporting period
The Group classifies all other liabilities as non-current.
Deferred tax assets and liabilities are classified as non-current assets and liabilities.
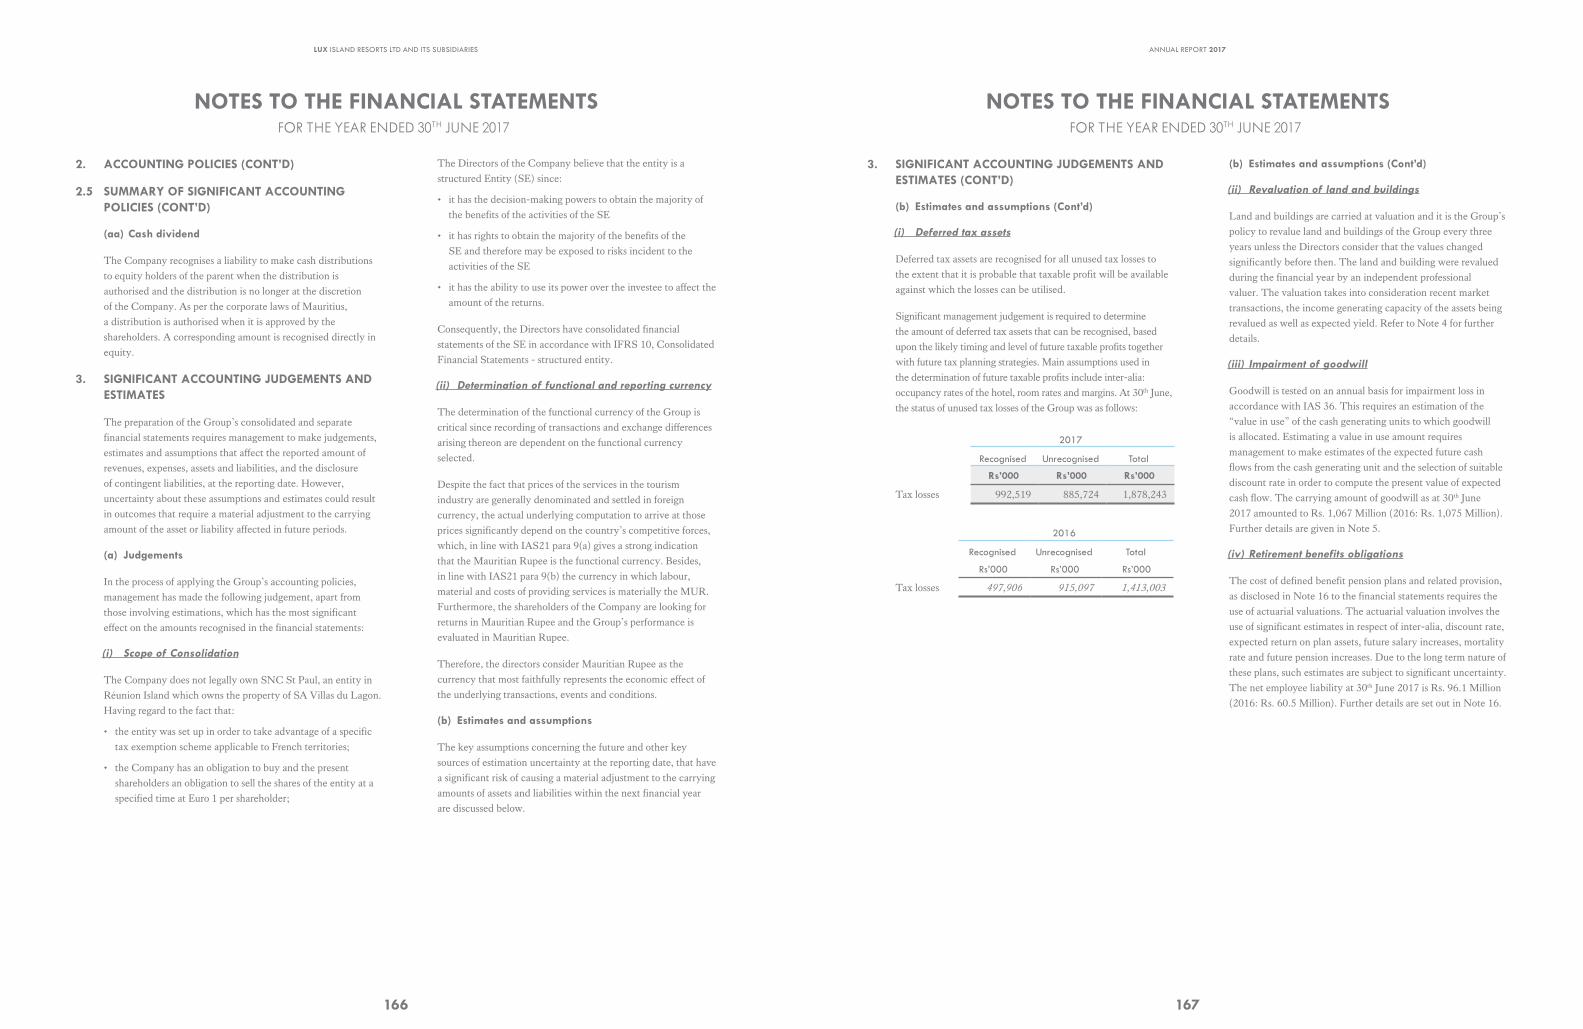
NOTES TO THE FINANCIAL STATEMENTSFOR THE YEAR ENDED 30TH JUNE 2017
LUX ISLAND RESORTS LTD AND ITS SUBSIDIARIES
166
2. ACCOUNTING POLICIES (CONT’D)
2.5 SUMMARY OF SIGNIFICANT ACCOUNTING POLICIES (CONT’D)
(aa) Cash dividend
The Company recognises a liability to make cash distributions to equity holders of the parent when the distribution is authorised and the distribution is no longer at the discretion of the Company. As per the corporate laws of Mauritius, a distribution is authorised when it is approved by the shareholders. A corresponding amount is recognised directly in equity.
3. SIGNIFICANT ACCOUNTING JUDGEMENTS AND ESTIMATES
The preparation of the Group’s consolidated and separate financial statements requires management to make judgements, estimates and assumptions that affect the reported amount of revenues, expenses, assets and liabilities, and the disclosure of contingent liabilities, at the reporting date. However, uncertainty about these assumptions and estimates could result in outcomes that require a material adjustment to the carrying amount of the asset or liability affected in future periods.
(a) Judgements
In the process of applying the Group’s accounting policies, management has made the following judgement, apart from those involving estimations, which has the most significant effect on the amounts recognised in the financial statements:
(i) Scope of Consolidation
The Company does not legally own SNC St Paul, an entity in Réunion Island which owns the property of SA Villas du Lagon. Having regard to the fact that:
• the entity was set up in order to take advantage of a specific tax exemption scheme applicable to French territories;
• the Company has an obligation to buy and the present shareholders an obligation to sell the shares of the entity at a specified time at Euro 1 per shareholder;
The Directors of the Company believe that the entity is a structured Entity (SE) since:
• it has the decision-making powers to obtain the majority of the benefits of the activities of the SE
• it has rights to obtain the majority of the benefits of the SE and therefore may be exposed to risks incident to the activities of the SE
• it has the ability to use its power over the investee to affect the amount of the returns.
Consequently, the Directors have consolidated financial statements of the SE in accordance with IFRS 10, Consolidated Financial Statements - structured entity.
(ii) Determination of functional and reporting currency
The determination of the functional currency of the Group is critical since recording of transactions and exchange differences arising thereon are dependent on the functional currency selected.
Despite the fact that prices of the services in the tourism industry are generally denominated and settled in foreign currency, the actual underlying computation to arrive at those prices significantly depend on the country’s competitive forces, which, in line with IAS21 para 9(a) gives a strong indication that the Mauritian Rupee is the functional currency. Besides, in line with IAS21 para 9(b) the currency in which labour, material and costs of providing services is materially the MUR. Furthermore, the shareholders of the Company are looking for returns in Mauritian Rupee and the Group’s performance is evaluated in Mauritian Rupee.
Therefore, the directors consider Mauritian Rupee as the currency that most faithfully represents the economic effect of the underlying transactions, events and conditions.
(b) Estimates and assumptions
The key assumptions concerning the future and other key sources of estimation uncertainty at the reporting date, that have a significant risk of causing a material adjustment to the carrying amounts of assets and liabilities within the next financial year are discussed below.
NOTES TO THE FINANCIAL STATEMENTSFOR THE YEAR ENDED 30TH JUNE 2017
ANNUAL REPORT 2017
167
3. SIGNIFICANT ACCOUNTING JUDGEMENTS AND ESTIMATES (CONT’D)
(b) Estimates and assumptions (Cont’d)
(i) Deferred tax assets
Deferred tax assets are recognised for all unused tax losses to the extent that it is probable that taxable profit will be available against which the losses can be utilised.
Significant management judgement is required to determine the amount of deferred tax assets that can be recognised, based upon the likely timing and level of future taxable profits together with future tax planning strategies. Main assumptions used in the determination of future taxable profits include inter-alia: occupancy rates of the hotel, room rates and margins. At 30th June, the status of unused tax losses of the Group was as follows:
2017
Recognised Unrecognised Total
Rs’000 Rs’000 Rs’000
Tax losses 992,519 885,724 1,878,243
2016
Recognised Unrecognised Total
Rs’000 Rs’000 Rs’000
Tax losses 497,906 915,097 1,413,003
(b) Estimates and assumptions (Cont’d)
(ii) Revaluation of land and buildings
Land and buildings are carried at valuation and it is the Group’s policy to revalue land and buildings of the Group every three years unless the Directors consider that the values changed significantly before then. The land and building were revalued during the financial year by an independent professional valuer. The valuation takes into consideration recent market transactions, the income generating capacity of the assets being revalued as well as expected yield. Refer to Note 4 for further details.
(iii) Impairment of goodwill
Goodwill is tested on an annual basis for impairment loss in accordance with IAS 36. This requires an estimation of the “value in use” of the cash generating units to which goodwill is allocated. Estimating a value in use amount requires management to make estimates of the expected future cash flows from the cash generating unit and the selection of suitable discount rate in order to compute the present value of expected cash flow. The carrying amount of goodwill as at 30th June 2017 amounted to Rs. 1,067 Million (2016: Rs. 1,075 Million). Further details are given in Note 5.
(iv) Retirement benefits obligations
The cost of defined benefit pension plans and related provision, as disclosed in Note 16 to the financial statements requires the use of actuarial valuations. The actuarial valuation involves the use of significant estimates in respect of inter-alia, discount rate, expected return on plan assets, future salary increases, mortality rate and future pension increases. Due to the long term nature of these plans, such estimates are subject to significant uncertainty. The net employee liability at 30th June 2017 is Rs. 96.1 Million (2016: Rs. 60.5 Million). Further details are set out in Note 16.
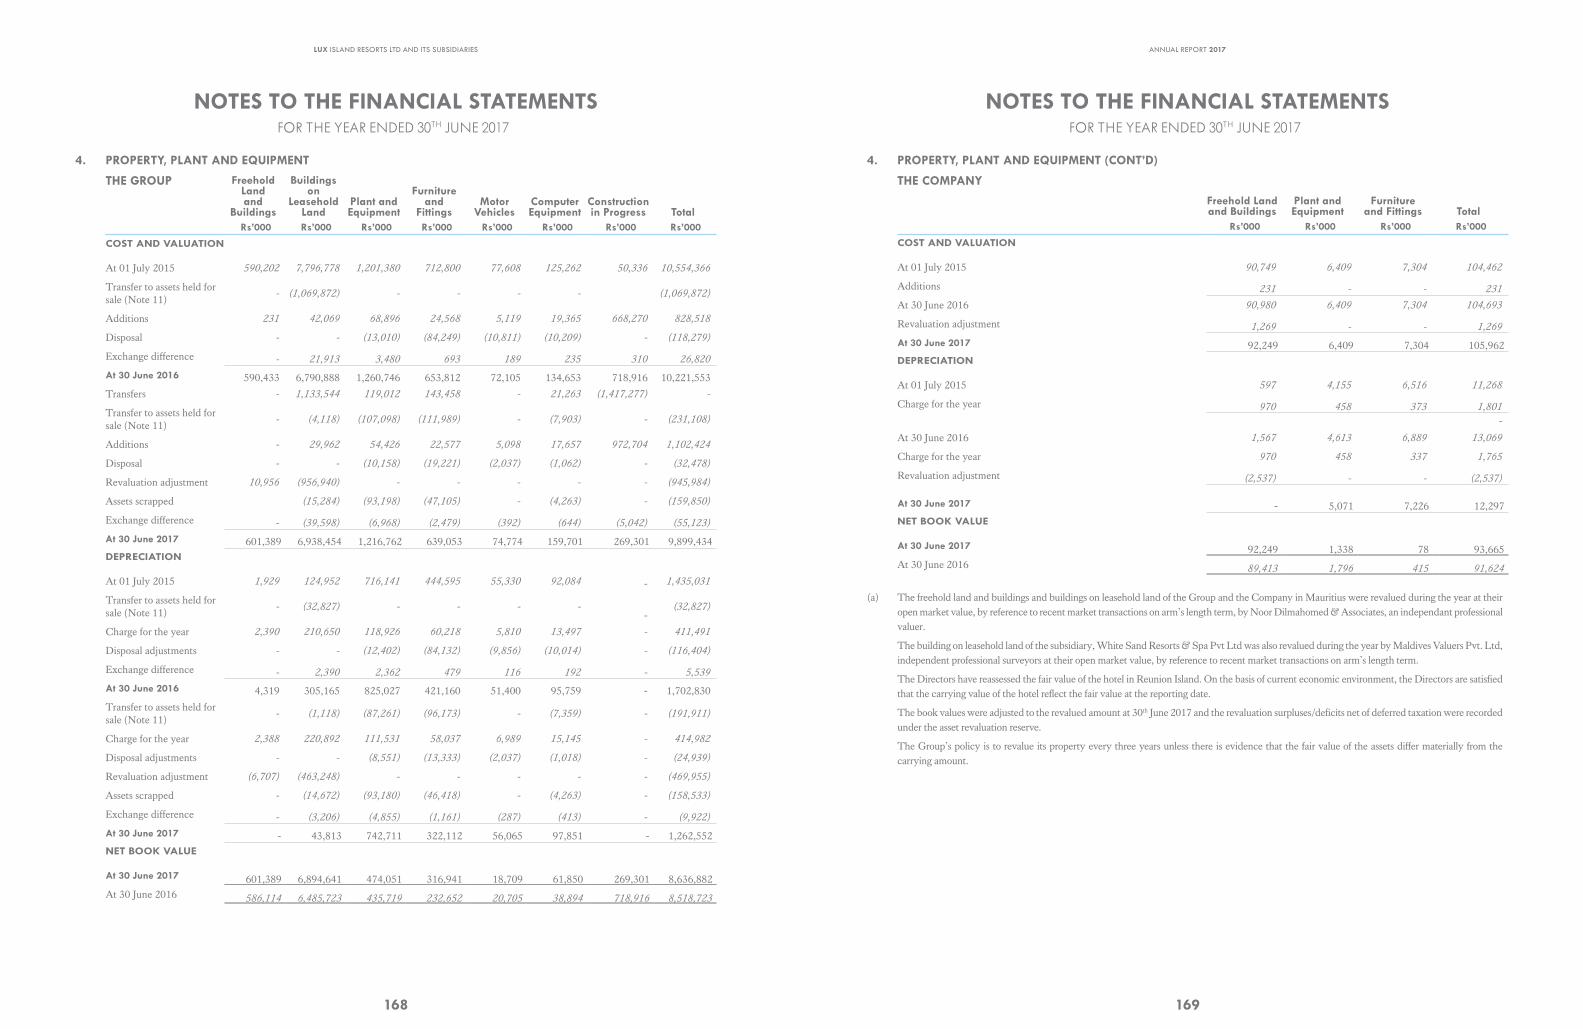
LUX ISLAND RESORTS LTD AND ITS SUBSIDIARIES
168
NOTES TO THE FINANCIAL STATEMENTSFOR THE YEAR ENDED 30TH JUNE 2017
4. PROPERTY, PLANT AND EQUIPMENT
THE GROUP Freehold Land and
Buildings
Buildings on
Leasehold Land
Plant and Equipment
Furniture and
FittingsMotor
VehiclesComputer Equipment
Construction in Progress Total
Rs’000 Rs’000 Rs’000 Rs’000 Rs’000 Rs’000 Rs’000 Rs’000
COST AND VALUATION
At 01 July 2015 590,202 7,796,778 1,201,380 712,800 77,608 125,262 50,336 10,554,366
Transfer to assets held for sale (Note 11)
- (1,069,872) - - - - (1,069,872)
Additions 231 42,069 68,896 24,568 5,119 19,365 668,270 828,518
Disposal - - (13,010) (84,249) (10,811) (10,209) - (118,279)
Exchange difference - 21,913 3,480 693 189 235 310 26,820
At 30 June 2016 590,433 6,790,888 1,260,746 653,812 72,105 134,653 718,916 10,221,553
Transfers - 1,133,544 119,012 143,458 - 21,263 (1,417,277) -
Transfer to assets held for sale (Note 11)
- (4,118) (107,098) (111,989) - (7,903) - (231,108)
Additions - 29,962 54,426 22,577 5,098 17,657 972,704 1,102,424
Disposal - - (10,158) (19,221) (2,037) (1,062) - (32,478)
Revaluation adjustment 10,956 (956,940) - - - - - (945,984)
Assets scrapped (15,284) (93,198) (47,105) - (4,263) - (159,850)
Exchange difference - (39,598) (6,968) (2,479) (392) (644) (5,042) (55,123)
At 30 June 2017 601,389 6,938,454 1,216,762 639,053 74,774 159,701 269,301 9,899,434 DEPRECIATION
At 01 July 2015 1,929 124,952 716,141 444,595 55,330 92,084 - 1,435,031
Transfer to assets held for sale (Note 11)
- (32,827) - - - - -
(32,827)
Charge for the year 2,390 210,650 118,926 60,218 5,810 13,497 - 411,491
Disposal adjustments - - (12,402) (84,132) (9,856) (10,014) - (116,404)
Exchange difference - 2,390 2,362 479 116 192 - 5,539
At 30 June 2016 4,319 305,165 825,027 421,160 51,400 95,759 - 1,702,830
Transfer to assets held for sale (Note 11)
- (1,118) (87,261) (96,173) - (7,359) - (191,911)
Charge for the year 2,388 220,892 111,531 58,037 6,989 15,145 - 414,982
Disposal adjustments - - (8,551) (13,333) (2,037) (1,018) - (24,939)
Revaluation adjustment (6,707) (463,248) - - - - - (469,955)
Assets scrapped - (14,672) (93,180) (46,418) - (4,263) - (158,533)
Exchange difference - (3,206) (4,855) (1,161) (287) (413) - (9,922)
At 30 June 2017 - 43,813 742,711 322,112 56,065 97,851 - 1,262,552 NET BOOK VALUE
At 30 June 2017 601,389 6,894,641 474,051 316,941 18,709 61,850 269,301 8,636,882 At 30 June 2016 586,114 6,485,723 435,719 232,652 20,705 38,894 718,916 8,518,723
ANNUAL REPORT 2017
169
NOTES TO THE FINANCIAL STATEMENTSFOR THE YEAR ENDED 30TH JUNE 2017
4. PROPERTY, PLANT AND EQUIPMENT (CONT’D)
THE COMPANY
Freehold Land and Buildings
Plant and Equipment
Furniture and Fittings Total
Rs’000 Rs’000 Rs’000 Rs’000
COST AND VALUATION
At 01 July 2015 90,749 6,409 7,304 104,462
Additions 231 - - 231
At 30 June 2016 90,980 6,409 7,304 104,693
Revaluation adjustment 1,269 - - 1,269
At 30 June 2017 92,249 6,409 7,304 105,962 DEPRECIATION
At 01 July 2015 597 4,155 6,516 11,268
Charge for the year 970 458 373 1,801
-
At 30 June 2016 1,567 4,613 6,889 13,069
Charge for the year 970 458 337 1,765
Revaluation adjustment (2,537) - - (2,537)
At 30 June 2017 - 5,071 7,226 12,297 NET BOOK VALUE
At 30 June 2017 92,249 1,338 78 93,665 At 30 June 2016 89,413 1,796 415 91,624
(a) The freehold land and buildings and buildings on leasehold land of the Group and the Company in Mauritius were revalued during the year at their open market value, by reference to recent market transactions on arm’s length term, by Noor Dilmahomed & Associates, an independant professional valuer.
The building on leasehold land of the subsidiary, White Sand Resorts & Spa Pvt Ltd was also revalued during the year by Maldives Valuers Pvt. Ltd, independent professional surveyors at their open market value, by reference to recent market transactions on arm’s length term.
The Directors have reassessed the fair value of the hotel in Reunion Island. On the basis of current economic environment, the Directors are satisfied that the carrying value of the hotel reflect the fair value at the reporting date.
The book values were adjusted to the revalued amount at 30th June 2017 and the revaluation surpluses/deficits net of deferred taxation were recorded under the asset revaluation reserve.
The Group’s policy is to revalue its property every three years unless there is evidence that the fair value of the assets differ materially from the carrying amount.
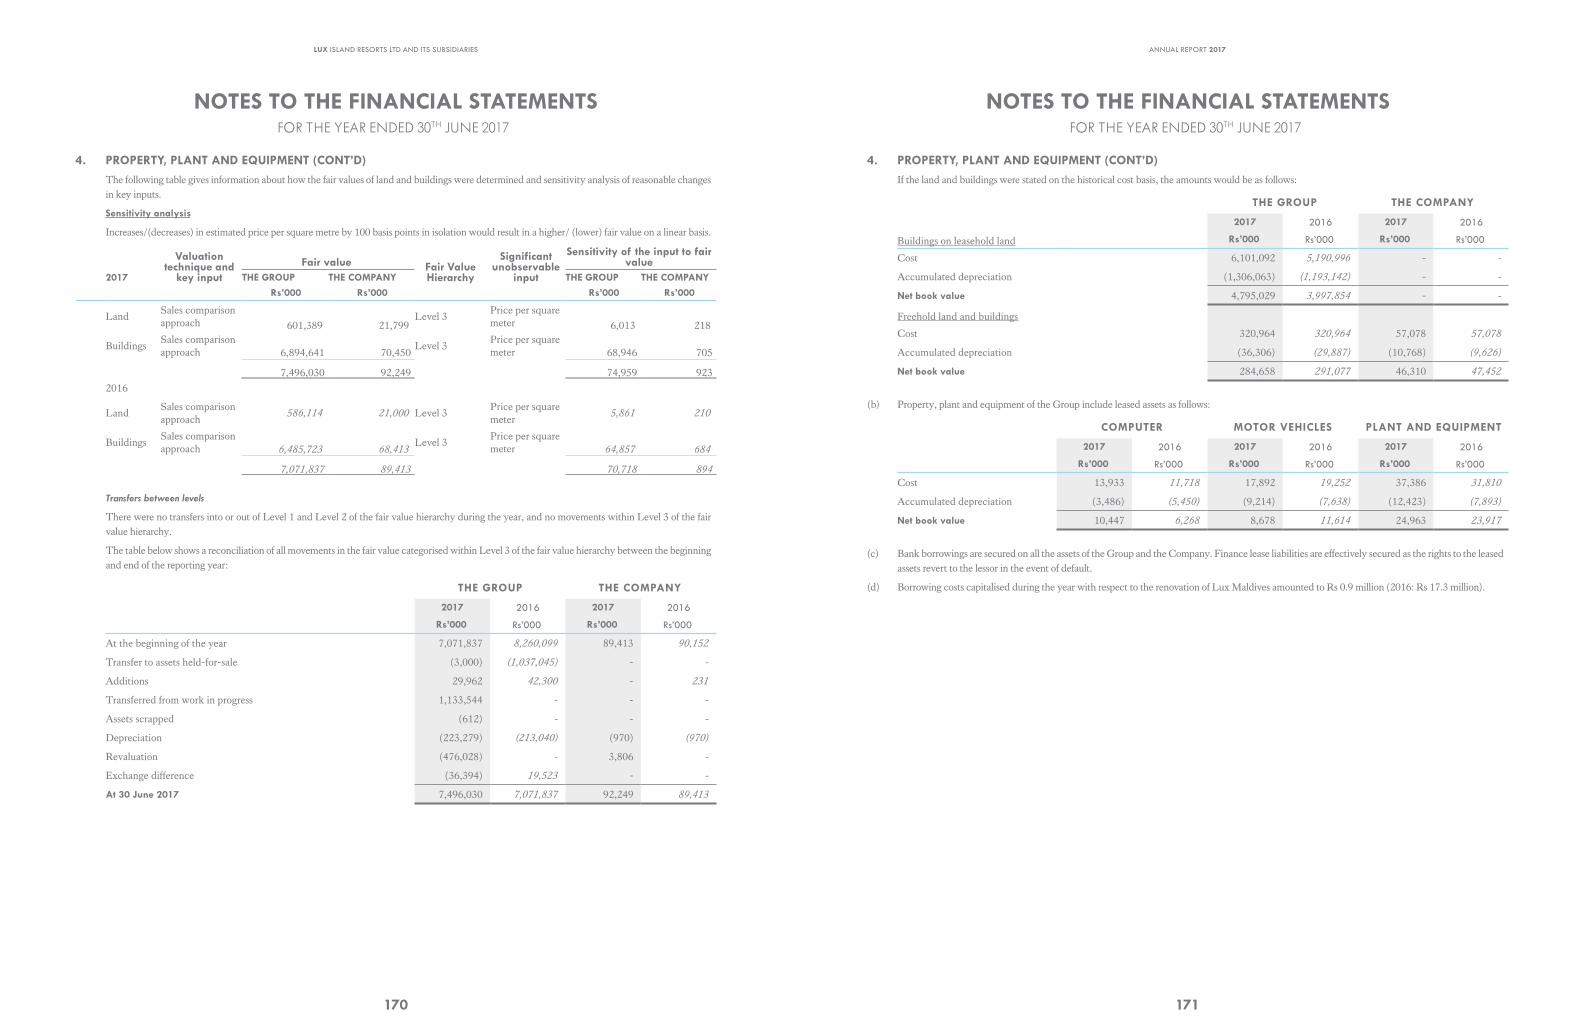
LUX ISLAND RESORTS LTD AND ITS SUBSIDIARIES
170
NOTES TO THE FINANCIAL STATEMENTSFOR THE YEAR ENDED 30TH JUNE 2017
4. PROPERTY, PLANT AND EQUIPMENT (CONT’D)The following table gives information about how the fair values of land and buildings were determined and sensitivity analysis of reasonable changes in key inputs.
Sensitivity analysis
Increases/(decreases) in estimated price per square metre by 100 basis points in isolation would result in a higher/ (lower) fair value on a linear basis.
Valuation technique and
key inputFair value Fair Value
Hierarchy
Significant unobservable
input
Sensitivity of the input to fair value
2017 THE GROUP THE COMPANY THE GROUP THE COMPANYRs’000 Rs’000 Rs’000 Rs’000
LandSales comparison approach 601,389 21,799
Level 3Price per square meter 6,013 218
BuildingsSales comparison approach 6,894,641 70,450
Level 3Price per square meter 68,946 705
7,496,030 92,249 74,959 923
2016
LandSales comparison approach
586,114 21,000 Level 3Price per square meter
5,861 210
BuildingsSales comparison approach 6,485,723 68,413
Level 3Price per square meter 64,857 684
7,071,837 89,413 70,718 894
Transfers between levels
There were no transfers into or out of Level 1 and Level 2 of the fair value hierarchy during the year, and no movements within Level 3 of the fair value hierarchy.
The table below shows a reconciliation of all movements in the fair value categorised within Level 3 of the fair value hierarchy between the beginning and end of the reporting year:
THE GROUP THE COMPANY
2017 2016 2017 2016
Rs’000 Rs’000 Rs’000 Rs’000
At the beginning of the year 7,071,837 8,260,099 89,413 90,152
Transfer to assets held-for-sale (3,000) (1,037,045) - -
Additions 29,962 42,300 - 231
Transferred from work in progress 1,133,544 - - -
Assets scrapped (612) - - -
Depreciation (223,279) (213,040) (970) (970)
Revaluation (476,028) - 3,806 -
Exchange difference (36,394) 19,523 - -
At 30 June 2017 7,496,030 7,071,837 92,249 89,413
ANNUAL REPORT 2017
171
NOTES TO THE FINANCIAL STATEMENTSFOR THE YEAR ENDED 30TH JUNE 2017
4. PROPERTY, PLANT AND EQUIPMENT (CONT’D)If the land and buildings were stated on the historical cost basis, the amounts would be as follows:
THE GROUP THE COMPANY
2017 2016 2017 2016
Buildings on leasehold land Rs’000 Rs’000 Rs’000 Rs’000
Cost 6,101,092 5,190,996 - -
Accumulated depreciation (1,306,063) (1,193,142) - -
Net book value 4,795,029 3,997,854 - -
Freehold land and buildings
Cost 320,964 320,964 57,078 57,078
Accumulated depreciation (36,306) (29,887) (10,768) (9,626)
Net book value 284,658 291,077 46,310 47,452
(b) Property, plant and equipment of the Group include leased assets as follows:
COMPUTER MOTOR VEHICLES PLANT AND EQUIPMENT
2017 2016 2017 2016 2017 2016
Rs’000 Rs’000 Rs’000 Rs’000 Rs’000 Rs’000
Cost 13,933 11,718 17,892 19,252 37,386 31,810
Accumulated depreciation (3,486) (5,450) (9,214) (7,638) (12,423) (7,893)
Net book value 10,447 6,268 8,678 11,614 24,963 23,917
(c) Bank borrowings are secured on all the assets of the Group and the Company. Finance lease liabilities are effectively secured as the rights to the leased assets revert to the lessor in the event of default.
(d) Borrowing costs capitalised during the year with respect to the renovation of Lux Maldives amounted to Rs 0.9 million (2016: Rs 17.3 million).
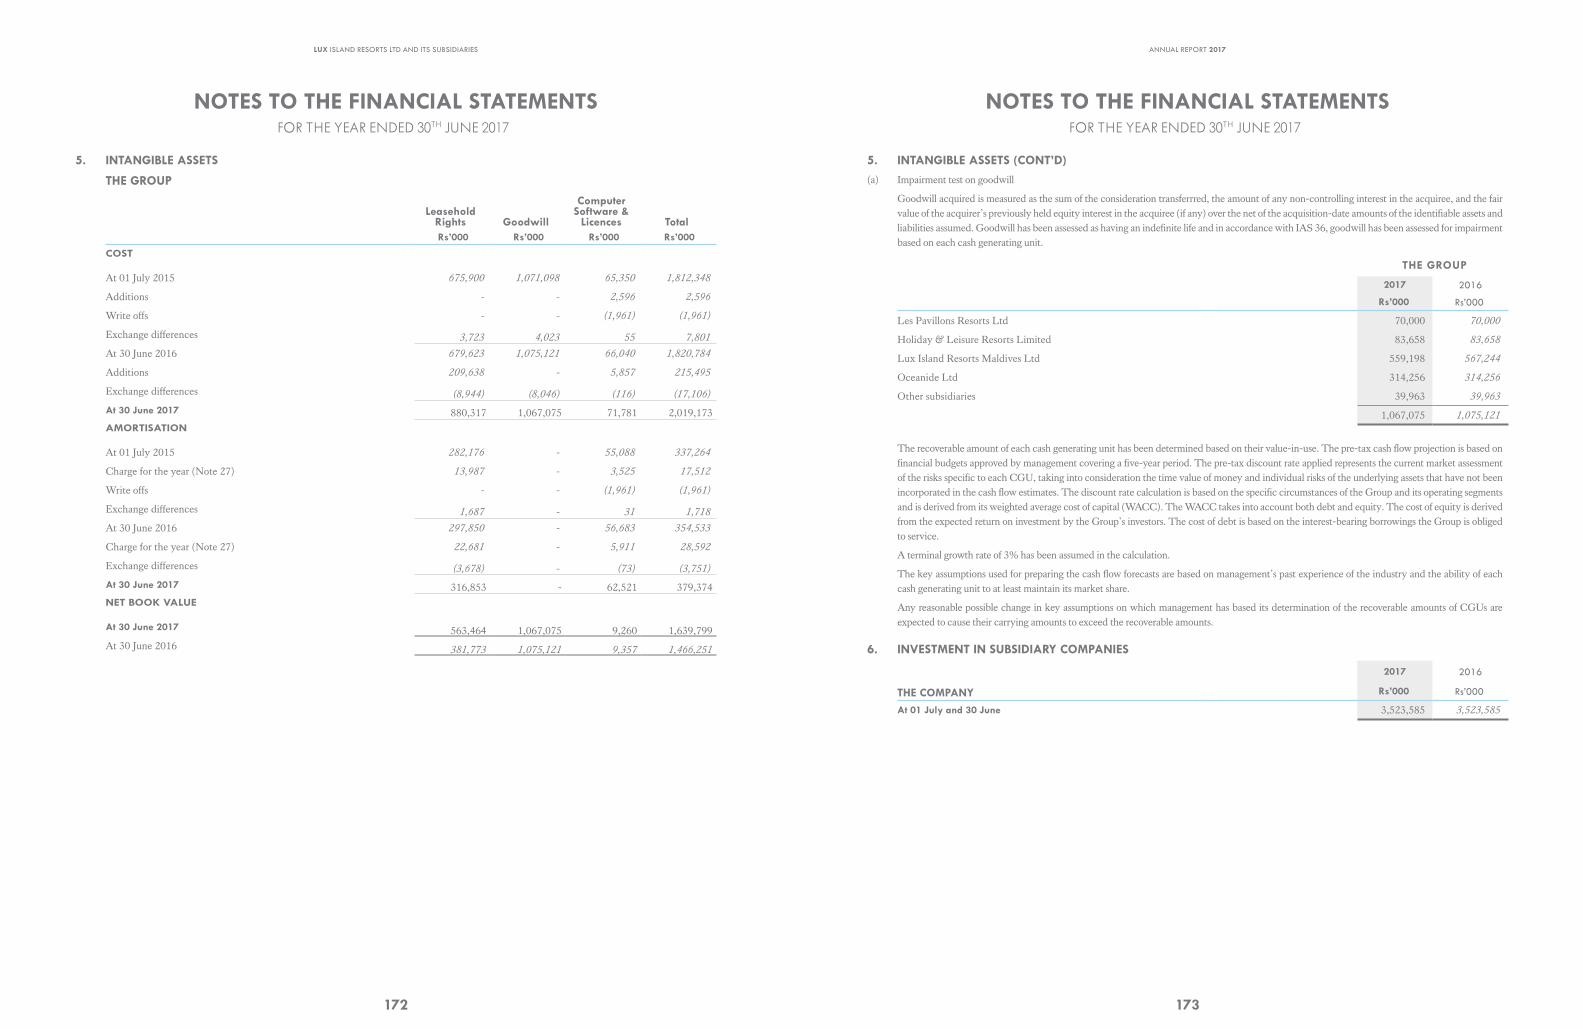
LUX ISLAND RESORTS LTD AND ITS SUBSIDIARIES
172
NOTES TO THE FINANCIAL STATEMENTS FOR THE YEAR ENDED 30TH JUNE 2017
5. INTANGIBLE ASSETS
THE GROUP
Leasehold Rights Goodwill
Computer Software &
Licences TotalRs’000 Rs’000 Rs’000 Rs’000
COST
At 01 July 2015 675,900 1,071,098 65,350 1,812,348
Additions - - 2,596 2,596
Write offs - - (1,961) (1,961)
Exchange differences 3,723 4,023 55 7,801
At 30 June 2016 679,623 1,075,121 66,040 1,820,784
Additions 209,638 - 5,857 215,495
Exchange differences (8,944) (8,046) (116) (17,106)
At 30 June 2017 880,317 1,067,075 71,781 2,019,173 AMORTISATION
At 01 July 2015 282,176 - 55,088 337,264
Charge for the year (Note 27) 13,987 - 3,525 17,512
Write offs - - (1,961) (1,961)
Exchange differences 1,687 - 31 1,718
At 30 June 2016 297,850 - 56,683 354,533
Charge for the year (Note 27) 22,681 - 5,911 28,592
Exchange differences (3,678) - (73) (3,751)
At 30 June 2017 316,853 - 62,521 379,374 NET BOOK VALUE
At 30 June 2017 563,464 1,067,075 9,260 1,639,799 At 30 June 2016 381,773 1,075,121 9,357 1,466,251
ANNUAL REPORT 2017
173
NOTES TO THE FINANCIAL STATEMENTS FOR THE YEAR ENDED 30TH JUNE 2017
5. INTANGIBLE ASSETS (CONT’D)(a) Impairment test on goodwill
Goodwill acquired is measured as the sum of the consideration transferrred, the amount of any non-controlling interest in the acquiree, and the fair value of the acquirer’s previously held equity interest in the acquiree (if any) over the net of the acquisition-date amounts of the identifiable assets and liabilities assumed. Goodwill has been assessed as having an indefinite life and in accordance with IAS 36, goodwill has been assessed for impairment based on each cash generating unit.
THE GROUP
2017 2016
Rs’000 Rs’000
Les Pavillons Resorts Ltd 70,000 70,000
Holiday & Leisure Resorts Limited 83,658 83,658
Lux Island Resorts Maldives Ltd 559,198 567,244
Oceanide Ltd 314,256 314,256
Other subsidiaries 39,963 39,963
1,067,075 1,075,121
The recoverable amount of each cash generating unit has been determined based on their value-in-use. The pre-tax cash flow projection is based on financial budgets approved by management covering a five-year period. The pre-tax discount rate applied represents the current market assessment of the risks specific to each CGU, taking into consideration the time value of money and individual risks of the underlying assets that have not been incorporated in the cash flow estimates. The discount rate calculation is based on the specific circumstances of the Group and its operating segments and is derived from its weighted average cost of capital (WACC). The WACC takes into account both debt and equity. The cost of equity is derived from the expected return on investment by the Group’s investors. The cost of debt is based on the interest-bearing borrowings the Group is obliged to service.
A terminal growth rate of 3% has been assumed in the calculation.
The key assumptions used for preparing the cash flow forecasts are based on management’s past experience of the industry and the ability of each cash generating unit to at least maintain its market share.
Any reasonable possible change in key assumptions on which management has based its determination of the recoverable amounts of CGUs are expected to cause their carrying amounts to exceed the recoverable amounts.
6. INVESTMENT IN SUBSIDIARY COMPANIES
2017 2016
THE COMPANY Rs’000 Rs’000
At 01 July and 30 June 3,523,585 3,523,585
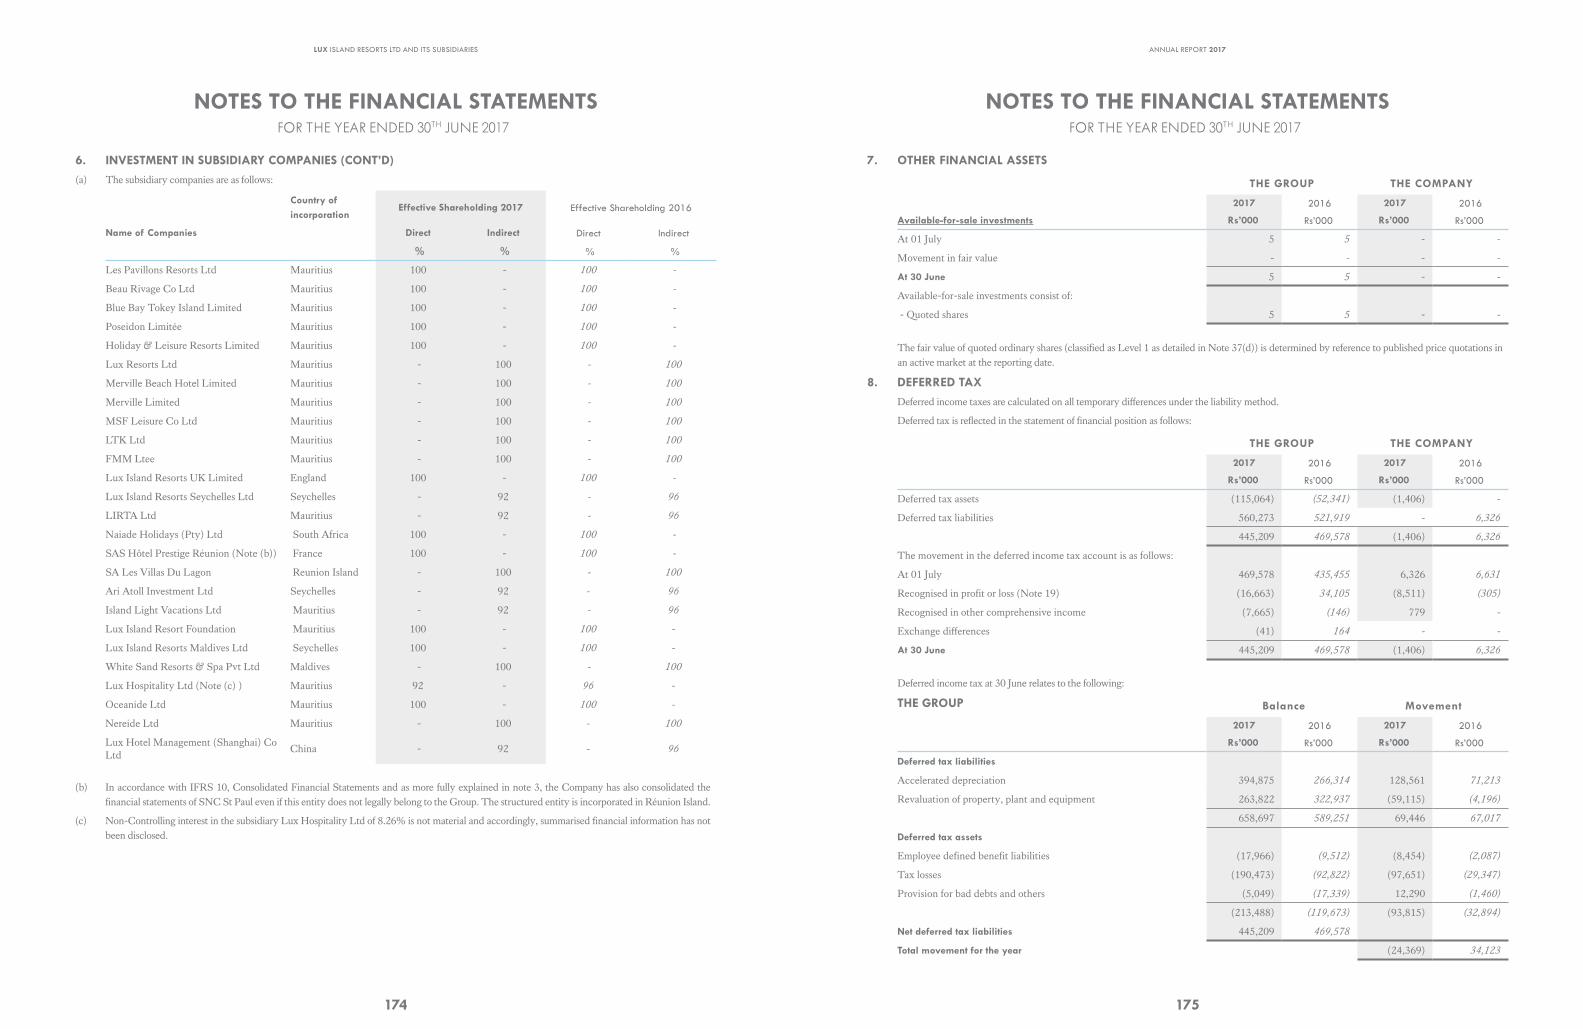
LUX ISLAND RESORTS LTD AND ITS SUBSIDIARIES
174
NOTES TO THE FINANCIAL STATEMENTSFOR THE YEAR ENDED 30TH JUNE 2017
6. INVESTMENT IN SUBSIDIARY COMPANIES (CONT’D)(a) The subsidiary companies are as follows:
Country of incorporation
Effective Shareholding 2017 Effective Shareholding 2016
Name of Companies Direct Indirect Direct Indirect
% % % %
Les Pavillons Resorts Ltd Mauritius 100 - 100 -
Beau Rivage Co Ltd Mauritius 100 - 100 -
Blue Bay Tokey Island Limited Mauritius 100 - 100 -
Poseidon Limitée Mauritius 100 - 100 -
Holiday & Leisure Resorts Limited Mauritius 100 - 100 -
Lux Resorts Ltd Mauritius - 100 - 100
Merville Beach Hotel Limited Mauritius - 100 - 100
Merville Limited Mauritius - 100 - 100
MSF Leisure Co Ltd Mauritius - 100 - 100
LTK Ltd Mauritius - 100 - 100
FMM Ltee Mauritius - 100 - 100
Lux Island Resorts UK Limited England 100 - 100 -
Lux Island Resorts Seychelles Ltd Seychelles - 92 - 96
LIRTA Ltd Mauritius - 92 - 96
Naiade Holidays (Pty) Ltd South Africa 100 - 100 -
SAS Hôtel Prestige Réunion (Note (b)) France 100 - 100 -
SA Les Villas Du Lagon Reunion Island - 100 - 100
Ari Atoll Investment Ltd Seychelles - 92 - 96
Island Light Vacations Ltd Mauritius - 92 - 96
Lux Island Resort Foundation Mauritius 100 - 100 -
Lux Island Resorts Maldives Ltd Seychelles 100 - 100 -
White Sand Resorts & Spa Pvt Ltd Maldives - 100 - 100
Lux Hospitality Ltd (Note (c) ) Mauritius 92 - 96 -
Oceanide Ltd Mauritius 100 - 100 -
Nereide Ltd Mauritius - 100 - 100
Lux Hotel Management (Shanghai) Co Ltd
China - 92 - 96
(b) In accordance with IFRS 10, Consolidated Financial Statements and as more fully explained in note 3, the Company has also consolidated the financial statements of SNC St Paul even if this entity does not legally belong to the Group. The structured entity is incorporated in Réunion Island.
(c) Non-Controlling interest in the subsidiary Lux Hospitality Ltd of 8.26% is not material and accordingly, summarised financial information has not been disclosed.
ANNUAL REPORT 2017
175
NOTES TO THE FINANCIAL STATEMENTSFOR THE YEAR ENDED 30TH JUNE 2017
6. INVESTMENT IN SUBSIDIARY COMPANIES (CONT’D)(a) The subsidiary companies are as follows:
Country of incorporation
Effective Shareholding 2017 Effective Shareholding 2016
Name of Companies Direct Indirect Direct Indirect
% % % %
Les Pavillons Resorts Ltd Mauritius 100 - 100 -
Beau Rivage Co Ltd Mauritius 100 - 100 -
Blue Bay Tokey Island Limited Mauritius 100 - 100 -
Poseidon Limitée Mauritius 100 - 100 -
Holiday & Leisure Resorts Limited Mauritius 100 - 100 -
Lux Resorts Ltd Mauritius - 100 - 100
Merville Beach Hotel Limited Mauritius - 100 - 100
Merville Limited Mauritius - 100 - 100
MSF Leisure Co Ltd Mauritius - 100 - 100
LTK Ltd Mauritius - 100 - 100
FMM Ltee Mauritius - 100 - 100
Lux Island Resorts UK Limited England 100 - 100 -
Lux Island Resorts Seychelles Ltd Seychelles - 92 - 96
LIRTA Ltd Mauritius - 92 - 96
Naiade Holidays (Pty) Ltd South Africa 100 - 100 -
SAS Hôtel Prestige Réunion (Note (b)) France 100 - 100 -
SA Les Villas Du Lagon Reunion Island - 100 - 100
Ari Atoll Investment Ltd Seychelles - 92 - 96
Island Light Vacations Ltd Mauritius - 92 - 96
Lux Island Resort Foundation Mauritius 100 - 100 -
Lux Island Resorts Maldives Ltd Seychelles 100 - 100 -
White Sand Resorts & Spa Pvt Ltd Maldives - 100 - 100
Lux Hospitality Ltd (Note (c) ) Mauritius 92 - 96 -
Oceanide Ltd Mauritius 100 - 100 -
Nereide Ltd Mauritius - 100 - 100
Lux Hotel Management (Shanghai) Co Ltd
China - 92 - 96
(b) In accordance with IFRS 10, Consolidated Financial Statements and as more fully explained in note 3, the Company has also consolidated the financial statements of SNC St Paul even if this entity does not legally belong to the Group. The structured entity is incorporated in Réunion Island.
(c) Non-Controlling interest in the subsidiary Lux Hospitality Ltd of 8.26% is not material and accordingly, summarised financial information has not been disclosed.
NOTES TO THE FINANCIAL STATEMENTS FOR THE YEAR ENDED 30TH JUNE 2017
7. OTHER FINANCIAL ASSETS
THE GROUP THE COMPANY
2017 2016 2017 2016
Available-for-sale investments Rs’000 Rs’000 Rs’000 Rs’000
At 01 July 5 5 - -
Movement in fair value - - - -
At 30 June 5 5 - -
Available-for-sale investments consist of:
- Quoted shares 5 5 - -
The fair value of quoted ordinary shares (classified as Level 1 as detailed in Note 37(d)) is determined by reference to published price quotations in an active market at the reporting date.
8. DEFERRED TAXDeferred income taxes are calculated on all temporary differences under the liability method.
Deferred tax is reflected in the statement of financial position as follows:
THE GROUP THE COMPANY
2017 2016 2017 2016
Rs’000 Rs’000 Rs’000 Rs’000
Deferred tax assets (115,064) (52,341) (1,406) -
Deferred tax liabilities 560,273 521,919 - 6,326
445,209 469,578 (1,406) 6,326
The movement in the deferred income tax account is as follows:
At 01 July 469,578 435,455 6,326 6,631
Recognised in profit or loss (Note 19) (16,663) 34,105 (8,511) (305)
Recognised in other comprehensive income (7,665) (146) 779 -
Exchange differences (41) 164 - -
At 30 June 445,209 469,578 (1,406) 6,326
Deferred income tax at 30 June relates to the following:
THE GROUP Balance Movement
2017 2016 2017 2016
Rs’000 Rs’000 Rs’000 Rs’000
Deferred tax liabilities
Accelerated depreciation 394,875 266,314 128,561 71,213
Revaluation of property, plant and equipment 263,822 322,937 (59,115) (4,196)
658,697 589,251 69,446 67,017
Deferred tax assets
Employee defined benefit liabilities (17,966) (9,512) (8,454) (2,087)
Tax losses (190,473) (92,822) (97,651) (29,347)
Provision for bad debts and others (5,049) (17,339) 12,290 (1,460)
(213,488) (119,673) (93,815) (32,894)
Net deferred tax liabilities 445,209 469,578
Total movement for the year (24,369) 34,123
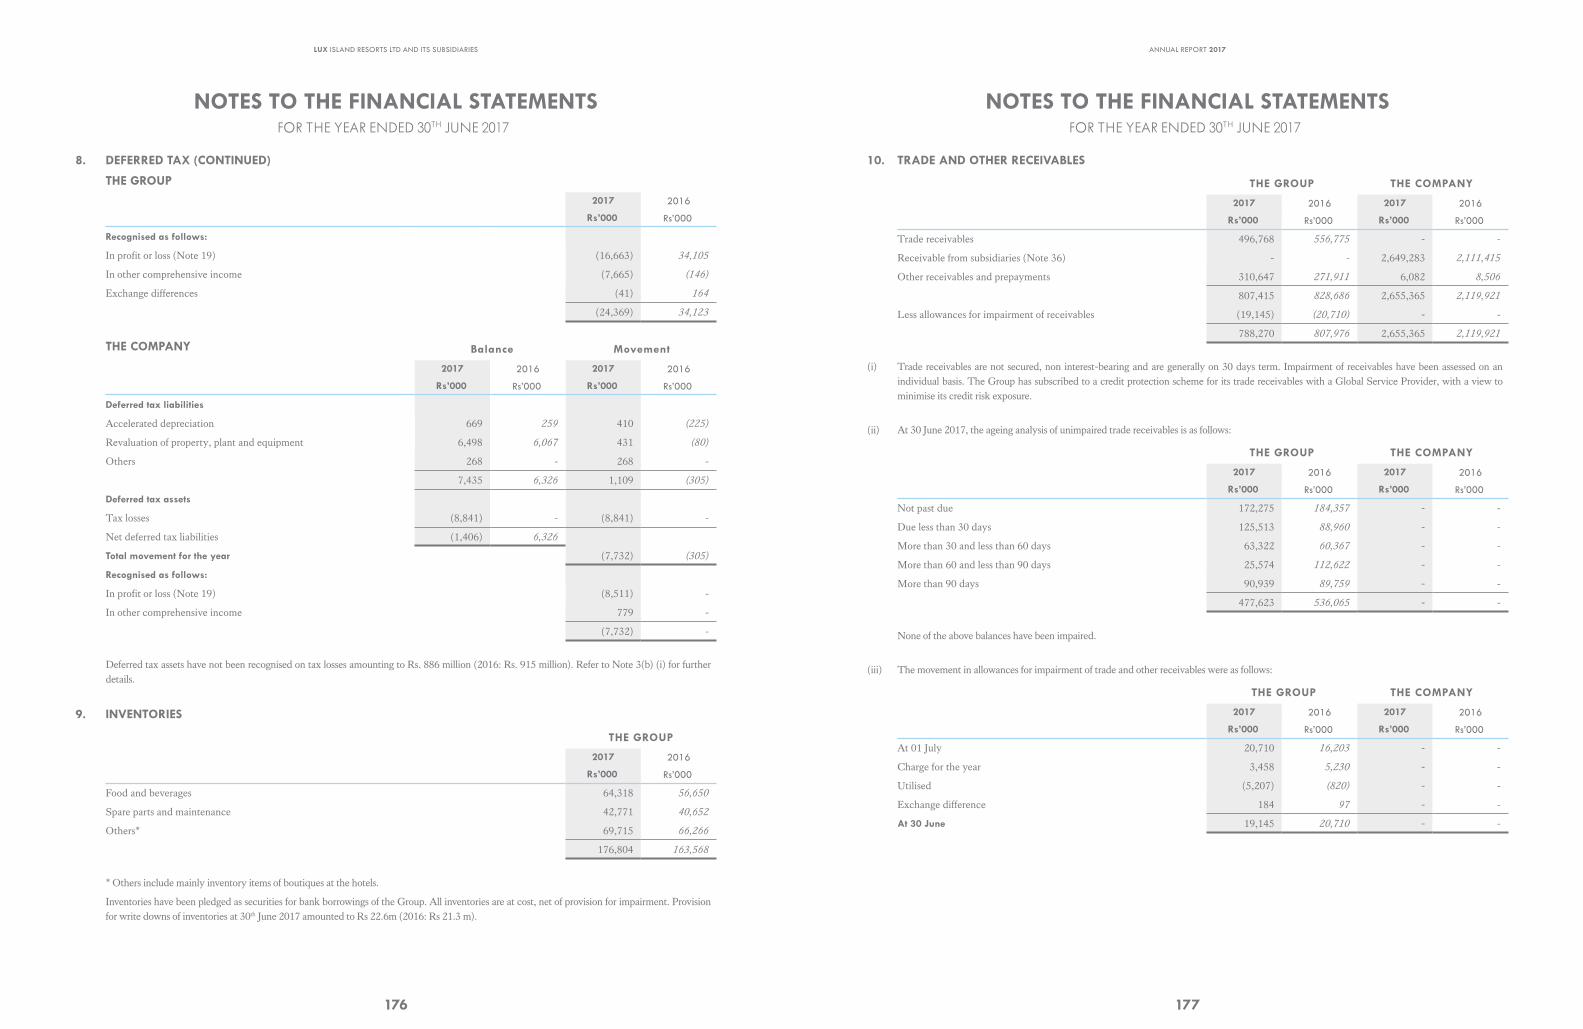
LUX ISLAND RESORTS LTD AND ITS SUBSIDIARIES
176
NOTES TO THE FINANCIAL STATEMENTSFOR THE YEAR ENDED 30TH JUNE 2017
8. DEFERRED TAX (CONTINUED)
THE GROUP2017 2016
Rs’000 Rs’000
Recognised as follows:
In profit or loss (Note 19) (16,663) 34,105
In other comprehensive income (7,665) (146)
Exchange differences (41) 164
(24,369) 34,123
THE COMPANY Balance Movement
2017 2016 2017 2016
Rs’000 Rs’000 Rs’000 Rs’000
Deferred tax liabilities
Accelerated depreciation 669 259 410 (225)
Revaluation of property, plant and equipment 6,498 6,067 431 (80)
Others 268 - 268 -
7,435 6,326 1,109 (305)
Deferred tax assets
Tax losses (8,841) - (8,841) -
Net deferred tax liabilities (1,406) 6,326
Total movement for the year (7,732) (305)
Recognised as follows:
In profit or loss (Note 19) (8,511) -
In other comprehensive income 779 -
(7,732) -
Deferred tax assets have not been recognised on tax losses amounting to Rs. 886 million (2016: Rs. 915 million). Refer to Note 3(b) (i) for further details.
9. INVENTORIES
THE GROUP
2017 2016
Rs’000 Rs’000
Food and beverages 64,318 56,650
Spare parts and maintenance 42,771 40,652
Others* 69,715 66,266
176,804 163,568
* Others include mainly inventory items of boutiques at the hotels.
Inventories have been pledged as securities for bank borrowings of the Group. All inventories are at cost, net of provision for impairment. Provision for write downs of inventories at 30th June 2017 amounted to Rs 22.6m (2016: Rs 21.3 m).
ANNUAL REPORT 2017
177
NOTES TO THE FINANCIAL STATEMENTS FOR THE YEAR ENDED 30TH JUNE 2017
10. TRADE AND OTHER RECEIVABLES
THE GROUP THE COMPANY
2017 2016 2017 2016
Rs’000 Rs’000 Rs’000 Rs’000
Trade receivables 496,768 556,775 - -
Receivable from subsidiaries (Note 36) - - 2,649,283 2,111,415
Other receivables and prepayments 310,647 271,911 6,082 8,506
807,415 828,686 2,655,365 2,119,921
Less allowances for impairment of receivables (19,145) (20,710) - -
788,270 807,976 2,655,365 2,119,921
(i) Trade receivables are not secured, non interest-bearing and are generally on 30 days term. Impairment of receivables have been assessed on an individual basis. The Group has subscribed to a credit protection scheme for its trade receivables with a Global Service Provider, with a view to minimise its credit risk exposure.
(ii) At 30 June 2017, the ageing analysis of unimpaired trade receivables is as follows:
THE GROUP THE COMPANY
2017 2016 2017 2016
Rs’000 Rs’000 Rs’000 Rs’000
Not past due 172,275 184,357 - -
Due less than 30 days 125,513 88,960 - -
More than 30 and less than 60 days 63,322 60,367 - -
More than 60 and less than 90 days 25,574 112,622 - -
More than 90 days 90,939 89,759 - -
477,623 536,065 - -
None of the above balances have been impaired.
(iii) The movement in allowances for impairment of trade and other receivables were as follows:
THE GROUP THE COMPANY
2017 2016 2017 2016
Rs’000 Rs’000 Rs’000 Rs’000
At 01 July 20,710 16,203 - -
Charge for the year 3,458 5,230 - -
Utilised (5,207) (820) - -
Exchange difference 184 97 - -
At 30 June 19,145 20,710 - -
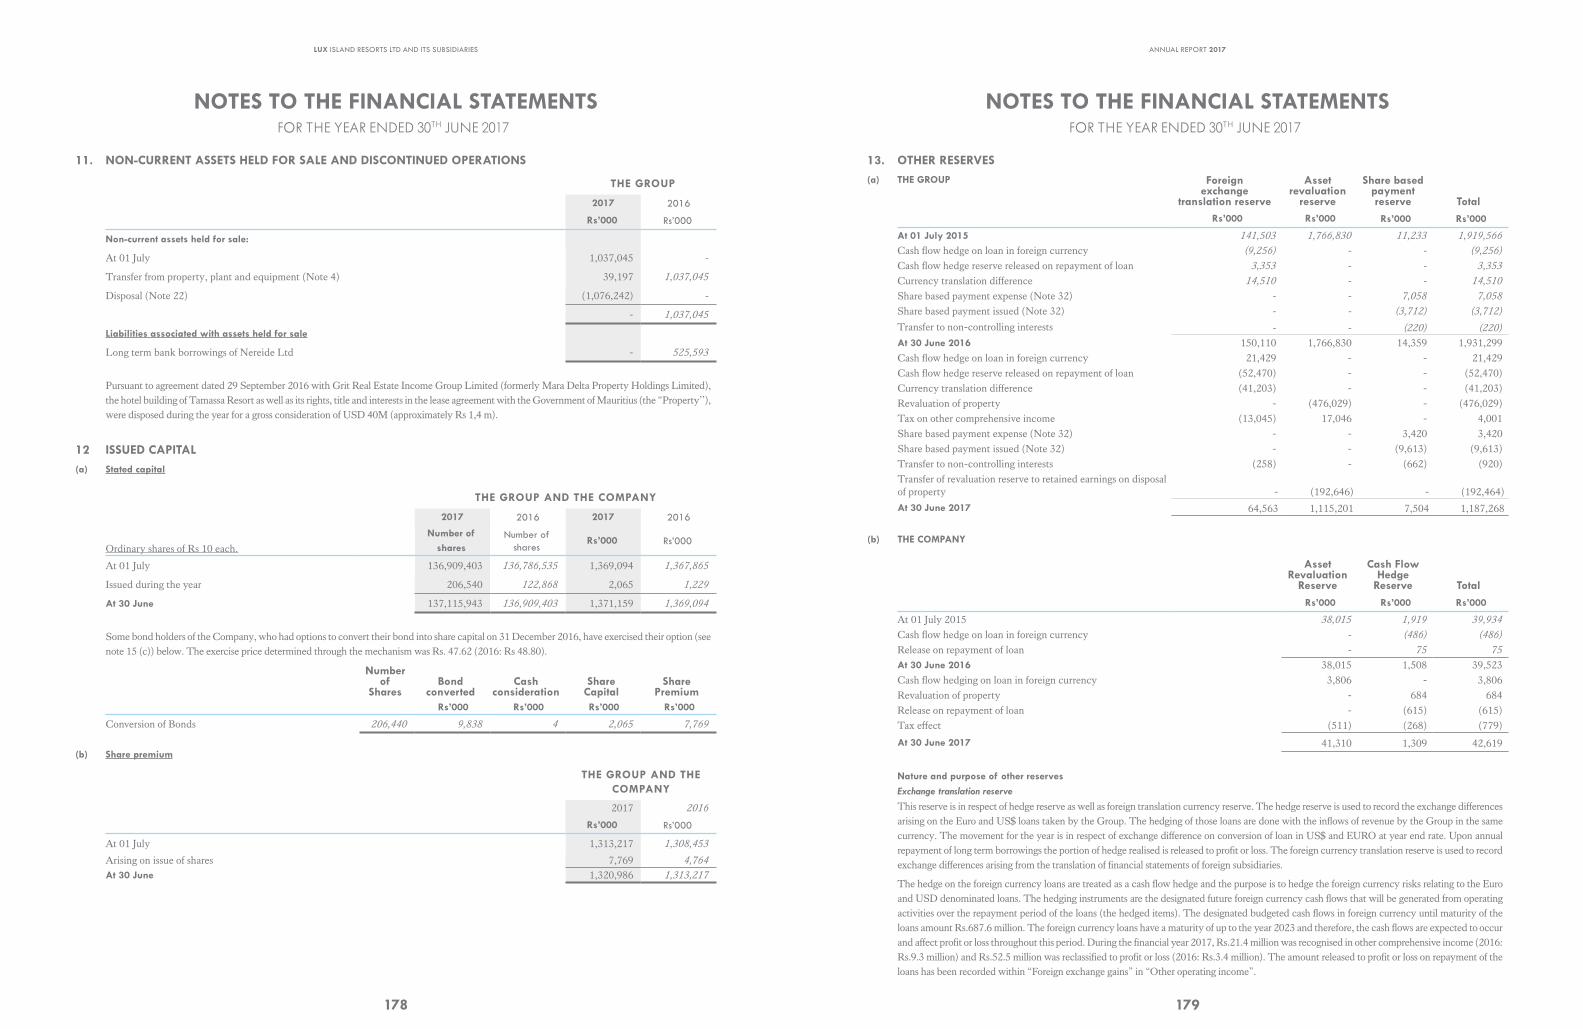
LUX ISLAND RESORTS LTD AND ITS SUBSIDIARIES
178
NOTES TO THE FINANCIAL STATEMENTS FOR THE YEAR ENDED 30TH JUNE 2017
11. NON-CURRENT ASSETS HELD FOR SALE AND DISCONTINUED OPERATIONS
THE GROUP
2017 2016
Rs’000 Rs’000
Non-current assets held for sale:
At 01 July 1,037,045 -
Transfer from property, plant and equipment (Note 4) 39,197 1,037,045
Disposal (Note 22) (1,076,242) -
- 1,037,045
Liabilities associated with assets held for sale
Long term bank borrowings of Nereide Ltd - 525,593
Pursuant to agreement dated 29 September 2016 with Grit Real Estate Income Group Limited (formerly Mara Delta Property Holdings Limited), the hotel building of Tamassa Resort as well as its rights, title and interests in the lease agreement with the Government of Mauritius (the “Property’’), were disposed during the year for a gross consideration of USD 40M (approximately Rs 1,4 m).
12 ISSUED CAPITAL(a) Stated capital
THE GROUP AND THE COMPANY
2017 2016 2017 2016
Ordinary shares of Rs 10 each.
Number of shares
Number of shares
Rs’000 Rs’000
At 01 July 136,909,403 136,786,535 1,369,094 1,367,865
Issued during the year 206,540 122,868 2,065 1,229
At 30 June 137,115,943 136,909,403 1,371,159 1,369,094
Some bond holders of the Company, who had options to convert their bond into share capital on 31 December 2016, have exercised their option (see note 15 (c)) below. The exercise price determined through the mechanism was Rs. 47.62 (2016: Rs 48.80).
Number of
SharesBond
convertedCash
considerationShare
CapitalShare
PremiumRs’000 Rs’000 Rs’000 Rs’000
Conversion of Bonds 206,440 9,838 4 2,065 7,769
(b) Share premium
THE GROUP AND THE COMPANY
2017 2016
Rs’000 Rs’000
At 01 July 1,313,217 1,308,453
Arising on issue of shares 7,769 4,764
At 30 June 1,320,986 1,313,217
ANNUAL REPORT 2017
179
NOTES TO THE FINANCIAL STATEMENTS FOR THE YEAR ENDED 30TH JUNE 2017
11. NON-CURRENT ASSETS HELD FOR SALE AND DISCONTINUED OPERATIONS
THE GROUP
2017 2016
Rs’000 Rs’000
Non-current assets held for sale:
At 01 July 1,037,045 -
Transfer from property, plant and equipment (Note 4) 39,197 1,037,045
Disposal (Note 22) (1,076,242) -
- 1,037,045
Liabilities associated with assets held for sale
Long term bank borrowings of Nereide Ltd - 525,593
Pursuant to agreement dated 29 September 2016 with Grit Real Estate Income Group Limited (formerly Mara Delta Property Holdings Limited), the hotel building of Tamassa Resort as well as its rights, title and interests in the lease agreement with the Government of Mauritius (the “Property’’), were disposed during the year for a gross consideration of USD 40M (approximately Rs 1,4 m).
12 ISSUED CAPITAL(a) Stated capital
THE GROUP AND THE COMPANY
2017 2016 2017 2016
Ordinary shares of Rs 10 each.
Number of shares
Number of shares
Rs’000 Rs’000
At 01 July 136,909,403 136,786,535 1,369,094 1,367,865
Issued during the year 206,540 122,868 2,065 1,229
At 30 June 137,115,943 136,909,403 1,371,159 1,369,094
Some bond holders of the Company, who had options to convert their bond into share capital on 31 December 2016, have exercised their option (see note 15 (c)) below. The exercise price determined through the mechanism was Rs. 47.62 (2016: Rs 48.80).
Number of
SharesBond
convertedCash
considerationShare
CapitalShare
PremiumRs’000 Rs’000 Rs’000 Rs’000
Conversion of Bonds 206,440 9,838 4 2,065 7,769
(b) Share premium
THE GROUP AND THE COMPANY
2017 2016
Rs’000 Rs’000
At 01 July 1,313,217 1,308,453
Arising on issue of shares 7,769 4,764
At 30 June 1,320,986 1,313,217
NOTES TO THE FINANCIAL STATEMENTSFOR THE YEAR ENDED 30TH JUNE 2017
13. OTHER RESERVES(a) THE GROUP Foreign
exchange translation reserve
Asset revaluation
reserve
Share based payment reserve Total
Rs’000 Rs’000 Rs’000 Rs’000
At 01 July 2015 141,503 1,766,830 11,233 1,919,566
Cash flow hedge on loan in foreign currency (9,256) - - (9,256)
Cash flow hedge reserve released on repayment of loan 3,353 - - 3,353
Currency translation difference 14,510 - - 14,510
Share based payment expense (Note 32) - - 7,058 7,058
Share based payment issued (Note 32) - - (3,712) (3,712)
Transfer to non-controlling interests - - (220) (220)
At 30 June 2016 150,110 1,766,830 14,359 1,931,299 Cash flow hedge on loan in foreign currency 21,429 - - 21,429Cash flow hedge reserve released on repayment of loan (52,470) - - (52,470)Currency translation difference (41,203) - - (41,203)Revaluation of property - (476,029) - (476,029)Tax on other comprehensive income (13,045) 17,046 - 4,001Share based payment expense (Note 32) - - 3,420 3,420 Share based payment issued (Note 32) - - (9,613) (9,613)Transfer to non-controlling interests (258) - (662) (920)Transfer of revaluation reserve to retained earnings on disposal of property - (192,646) - (192,464)
At 30 June 2017 64,563 1,115,201 7,504 1,187,268
(b) THE COMPANY
Asset Revaluation
Reserve
Cash Flow Hedge
Reserve TotalRs’000 Rs’000 Rs’000
At 01 July 2015 38,015 1,919 39,934
Cash flow hedge on loan in foreign currency - (486) (486)
Release on repayment of loan - 75 75
At 30 June 2016 38,015 1,508 39,523 Cash flow hedging on loan in foreign currency 3,806 - 3,806Revaluation of property - 684 684Release on repayment of loan - (615) (615)Tax effect (511) (268) (779)
At 30 June 2017 41,310 1,309 42,619
Nature and purpose of other reservesExchange translation reserve
This reserve is in respect of hedge reserve as well as foreign translation currency reserve. The hedge reserve is used to record the exchange differences arising on the Euro and US$ loans taken by the Group. The hedging of those loans are done with the inflows of revenue by the Group in the same currency. The movement for the year is in respect of exchange difference on conversion of loan in US$ and EURO at year end rate. Upon annual repayment of long term borrowings the portion of hedge realised is released to profit or loss. The foreign currency translation reserve is used to record exchange differences arising from the translation of financial statements of foreign subsidiaries.
The hedge on the foreign currency loans are treated as a cash flow hedge and the purpose is to hedge the foreign currency risks relating to the Euro and USD denominated loans. The hedging instruments are the designated future foreign currency cash flows that will be generated from operating activities over the repayment period of the loans (the hedged items). The designated budgeted cash flows in foreign currency until maturity of the loans amount Rs.687.6 million. The foreign currency loans have a maturity of up to the year 2023 and therefore, the cash flows are expected to occur and affect profit or loss throughout this period. During the financial year 2017, Rs.21.4 million was recognised in other comprehensive income (2016: Rs.9.3 million) and Rs.52.5 million was reclassified to profit or loss (2016: Rs.3.4 million). The amount released to profit or loss on repayment of the loans has been recorded within “Foreign exchange gains” in “Other operating income”.
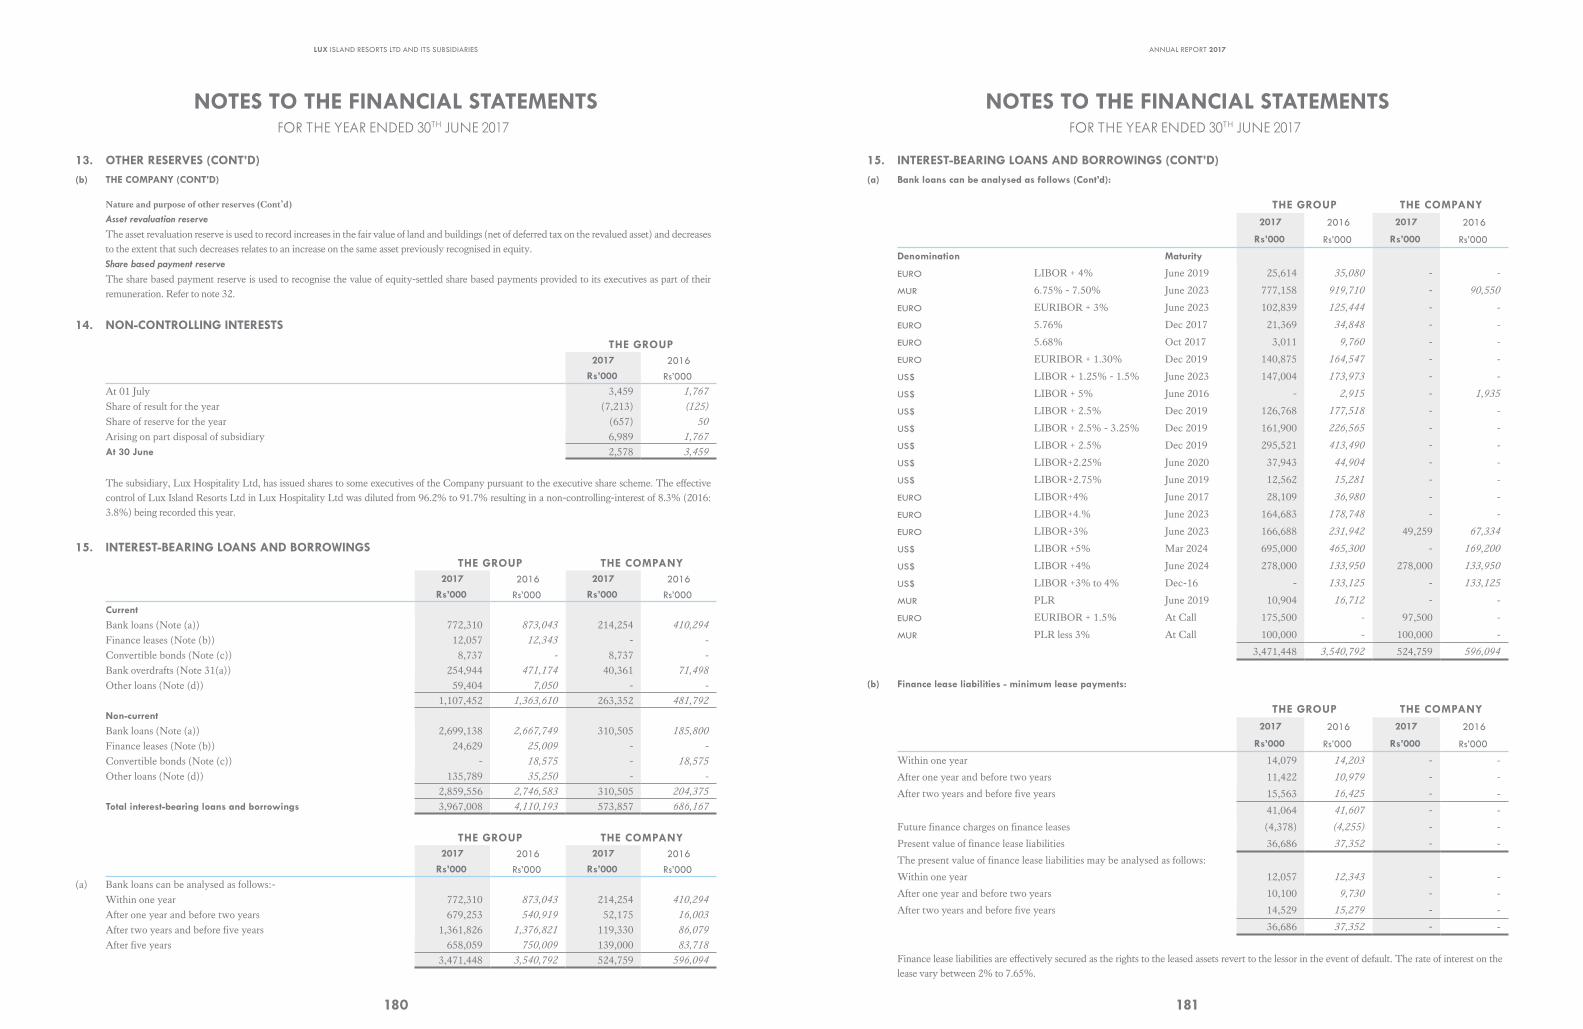
LUX ISLAND RESORTS LTD AND ITS SUBSIDIARIES
180
NOTES TO THE FINANCIAL STATEMENTS FOR THE YEAR ENDED 30TH JUNE 2017
13. OTHER RESERVES (CONT’D)(b) THE COMPANY (CONT’D)
Nature and purpose of other reserves (Cont’d)
Asset revaluation reserve
The asset revaluation reserve is used to record increases in the fair value of land and buildings (net of deferred tax on the revalued asset) and decreases to the extent that such decreases relates to an increase on the same asset previously recognised in equity. Share based payment reserve
The share based payment reserve is used to recognise the value of equity-settled share based payments provided to its executives as part of their remuneration. Refer to note 32.
14. NON-CONTROLLING INTERESTS
THE GROUP2017 2016
Rs’000 Rs’000
At 01 July 3,459 1,767
Share of result for the year (7,213) (125)
Share of reserve for the year (657) 50
Arising on part disposal of subsidiary 6,989 1,767
At 30 June 2,578 3,459
The subsidiary, Lux Hospitality Ltd, has issued shares to some executives of the Company pursuant to the executive share scheme. The effective control of Lux Island Resorts Ltd in Lux Hospitality Ltd was diluted from 96.2% to 91.7% resulting in a non-controlling-interest of 8.3% (2016: 3.8%) being recorded this year.
15. INTEREST-BEARING LOANS AND BORROWINGSTHE GROUP THE COMPANY
2017 2016 2017 2016
Rs’000 Rs’000 Rs’000 Rs’000CurrentBank loans (Note (a)) 772,310 873,043 214,254 410,294
Finance leases (Note (b)) 12,057 12,343 - -
Convertible bonds (Note (c)) 8,737 - 8,737 -
Bank overdrafts (Note 31(a)) 254,944 471,174 40,361 71,498
Other loans (Note (d)) 59,404 7,050 - -
1,107,452 1,363,610 263,352 481,792
Non-currentBank loans (Note (a)) 2,699,138 2,667,749 310,505 185,800
Finance leases (Note (b)) 24,629 25,009 - -
Convertible bonds (Note (c)) - 18,575 - 18,575
Other loans (Note (d)) 135,789 35,250 - -
2,859,556 2,746,583 310,505 204,375
Total interest-bearing loans and borrowings 3,967,008 4,110,193 573,857 686,167
THE GROUP THE COMPANY 2017 2016 2017 2016
Rs’000 Rs’000 Rs’000 Rs’000
(a) Bank loans can be analysed as follows:-Within one year 772,310 873,043 214,254 410,294
After one year and before two years 679,253 540,919 52,175 16,003
After two years and before five years 1,361,826 1,376,821 119,330 86,079
After five years 658,059 750,009 139,000 83,718
3,471,448 3,540,792 524,759 596,094
ANNUAL REPORT 2017
181
NOTES TO THE FINANCIAL STATEMENTSFOR THE YEAR ENDED 30TH JUNE 2017
15. INTEREST-BEARING LOANS AND BORROWINGS (CONT’D)(a) Bank loans can be analysed as follows (Cont’d):
THE GROUP THE COMPANY 2017 2016 2017 2016
Rs’000 Rs’000 Rs’000 Rs’000
Denomination Maturity
EURO LIBOR + 4% June 2019 25,614 35,080 - -
MUR 6.75% - 7.50% June 2023 777,158 919,710 - 90,550
EURO EURIBOR + 3% June 2023 102,839 125,444 - -
EURO 5.76% Dec 2017 21,369 34,848 - -
EURO 5.68% Oct 2017 3,011 9,760 - -
EURO EURIBOR + 1.30% Dec 2019 140,875 164,547 - -
US$ LIBOR + 1.25% - 1.5% June 2023 147,004 173,973 - -
US$ LIBOR + 5% June 2016 - 2,915 - 1,935
US$ LIBOR + 2.5% Dec 2019 126,768 177,518 - -
US$ LIBOR + 2.5% - 3.25% Dec 2019 161,900 226,565 - -
US$ LIBOR + 2.5% Dec 2019 295,521 413,490 - -
US$ LIBOR+2.25% June 2020 37,943 44,904 - -
US$ LIBOR+2.75% June 2019 12,562 15,281 - -
EURO LIBOR+4% June 2017 28,109 36,980 - -
EURO LIBOR+4.% June 2023 164,683 178,748 - -
EURO LIBOR+3% June 2023 166,688 231,942 49,259 67,334
US$ LIBOR +5% Mar 2024 695,000 465,300 - 169,200
US$ LIBOR +4% June 2024 278,000 133,950 278,000 133,950
US$ LIBOR +3% to 4% Dec-16 - 133,125 - 133,125
MUR PLR June 2019 10,904 16,712 - -
EURO EURIBOR + 1.5% At Call 175,500 - 97,500 -
MUR PLR less 3% At Call 100,000 - 100,000 -
3,471,448 3,540,792 524,759 596,094
(b) Finance lease liabilities - minimum lease payments:
THE GROUP THE COMPANY 2017 2016 2017 2016
Rs’000 Rs’000 Rs’000 Rs’000
Within one year 14,079 14,203 - -
After one year and before two years 11,422 10,979 - -
After two years and before five years 15,563 16,425 - -
41,064 41,607 - -
Future finance charges on finance leases (4,378) (4,255) - -
Present value of finance lease liabilities 36,686 37,352 - -
The present value of finance lease liabilities may be analysed as follows:
Within one year 12,057 12,343 - -
After one year and before two years 10,100 9,730 - -
After two years and before five years 14,529 15,279 - -
36,686 37,352 - -
Finance lease liabilities are effectively secured as the rights to the leased assets revert to the lessor in the event of default. The rate of interest on the lease vary between 2% to 7.65%.
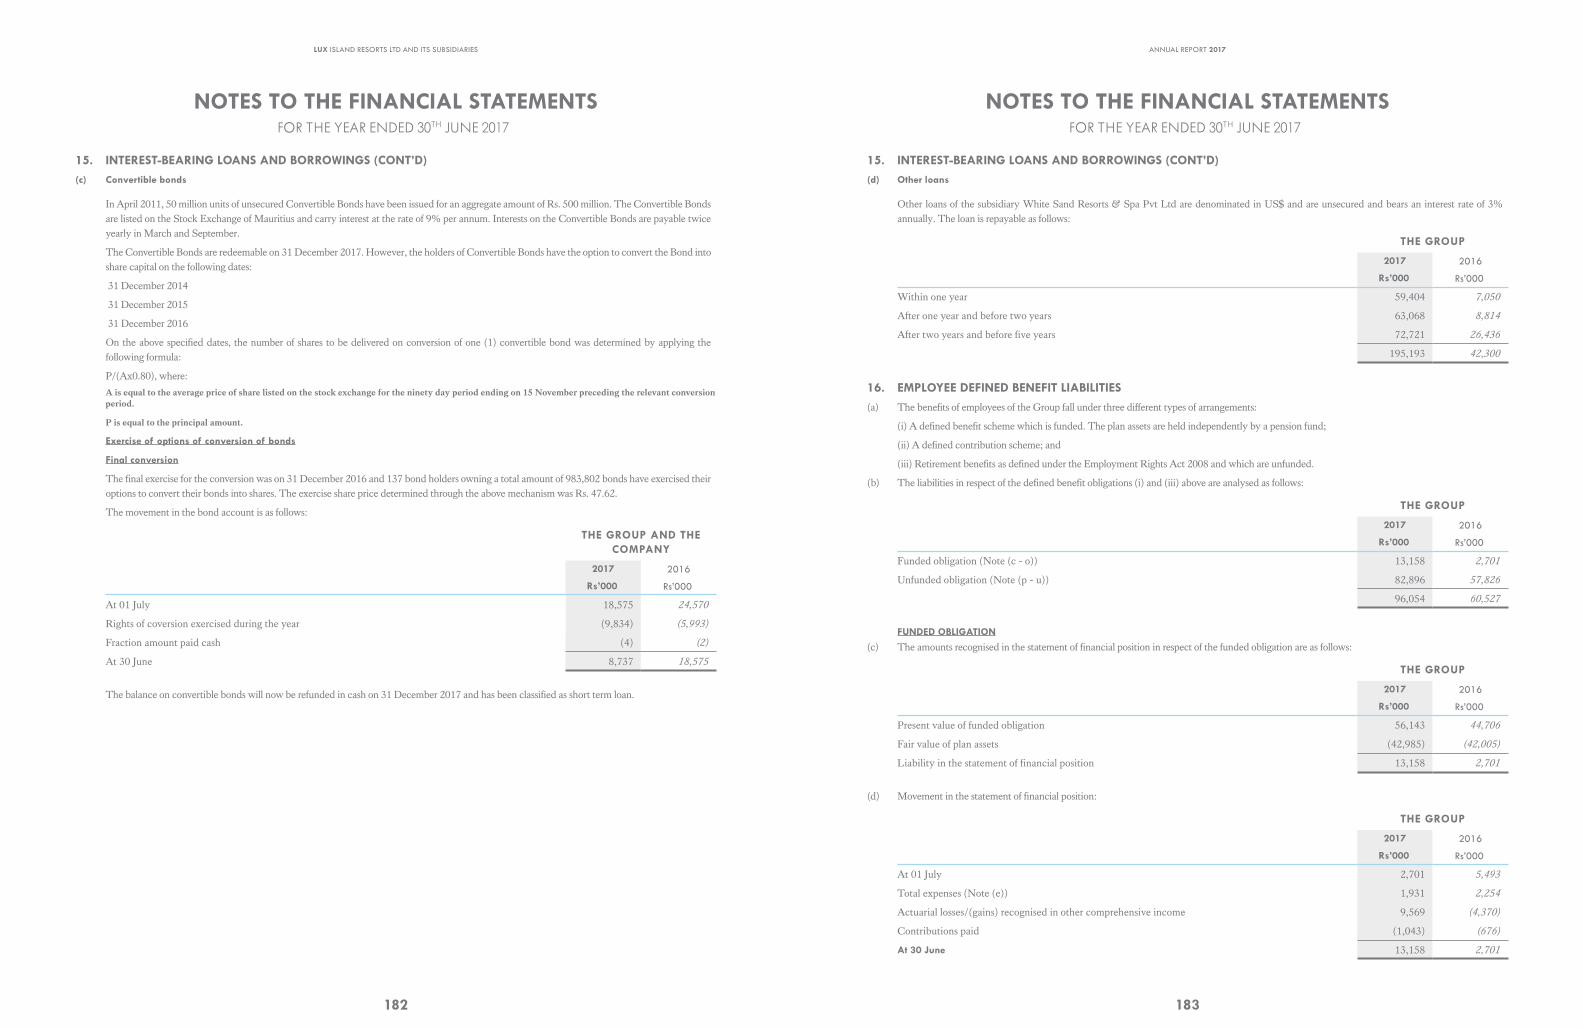
LUX ISLAND RESORTS LTD AND ITS SUBSIDIARIES
182
NOTES TO THE FINANCIAL STATEMENTSFOR THE YEAR ENDED 30TH JUNE 2017
15. INTEREST-BEARING LOANS AND BORROWINGS (CONT’D)(c) Convertible bonds
In April 2011, 50 million units of unsecured Convertible Bonds have been issued for an aggregate amount of Rs. 500 million. The Convertible Bonds are listed on the Stock Exchange of Mauritius and carry interest at the rate of 9% per annum. Interests on the Convertible Bonds are payable twice yearly in March and September.
The Convertible Bonds are redeemable on 31 December 2017. However, the holders of Convertible Bonds have the option to convert the Bond into share capital on the following dates:
31 December 2014
31 December 2015
31 December 2016
On the above specified dates, the number of shares to be delivered on conversion of one (1) convertible bond was determined by applying the following formula:
P/(Ax0.80), where:
A is equal to the average price of share listed on the stock exchange for the ninety day period ending on 15 November preceding the relevant conversion period.
P is equal to the principal amount.
Exercise of options of conversion of bonds
Final conversion
The final exercise for the conversion was on 31 December 2016 and 137 bond holders owning a total amount of 983,802 bonds have exercised their options to convert their bonds into shares. The exercise share price determined through the above mechanism was Rs. 47.62.
The movement in the bond account is as follows:
THE GROUP AND THE COMPANY
2017 2016
Rs’000 Rs’000
At 01 July 18,575 24,570
Rights of coversion exercised during the year (9,834) (5,993)
Fraction amount paid cash (4) (2)
At 30 June 8,737 18,575
The balance on convertible bonds will now be refunded in cash on 31 December 2017 and has been classified as short term loan.
ANNUAL REPORT 2017
183
NOTES TO THE FINANCIAL STATEMENTSFOR THE YEAR ENDED 30TH JUNE 2017
15. INTEREST-BEARING LOANS AND BORROWINGS (CONT’D)(c) Convertible bonds
In April 2011, 50 million units of unsecured Convertible Bonds have been issued for an aggregate amount of Rs. 500 million. The Convertible Bonds are listed on the Stock Exchange of Mauritius and carry interest at the rate of 9% per annum. Interests on the Convertible Bonds are payable twice yearly in March and September.
The Convertible Bonds are redeemable on 31 December 2017. However, the holders of Convertible Bonds have the option to convert the Bond into share capital on the following dates:
31 December 2014
31 December 2015
31 December 2016
On the above specified dates, the number of shares to be delivered on conversion of one (1) convertible bond was determined by applying the following formula:
P/(Ax0.80), where:
A is equal to the average price of share listed on the stock exchange for the ninety day period ending on 15 November preceding the relevant conversion period.
P is equal to the principal amount.
Exercise of options of conversion of bonds
Final conversion
The final exercise for the conversion was on 31 December 2016 and 137 bond holders owning a total amount of 983,802 bonds have exercised their options to convert their bonds into shares. The exercise share price determined through the above mechanism was Rs. 47.62.
The movement in the bond account is as follows:
THE GROUP AND THE COMPANY
2017 2016
Rs’000 Rs’000
At 01 July 18,575 24,570
Rights of coversion exercised during the year (9,834) (5,993)
Fraction amount paid cash (4) (2)
At 30 June 8,737 18,575
The balance on convertible bonds will now be refunded in cash on 31 December 2017 and has been classified as short term loan.
NOTES TO THE FINANCIAL STATEMENTS FOR THE YEAR ENDED 30TH JUNE 2017
15. INTEREST-BEARING LOANS AND BORROWINGS (CONT’D)(d) Other loans
Other loans of the subsidiary White Sand Resorts & Spa Pvt Ltd are denominated in US$ and are unsecured and bears an interest rate of 3% annually. The loan is repayable as follows:
THE GROUP
2017 2016
Rs’000 Rs’000
Within one year 59,404 7,050
After one year and before two years 63,068 8,814
After two years and before five years 72,721 26,436
195,193 42,300
16. EMPLOYEE DEFINED BENEFIT LIABILITIES(a) The benefits of employees of the Group fall under three different types of arrangements:
(i) A defined benefit scheme which is funded. The plan assets are held independently by a pension fund;
(ii) A defined contribution scheme; and
(iii) Retirement benefits as defined under the Employment Rights Act 2008 and which are unfunded.
(b) The liabilities in respect of the defined benefit obligations (i) and (iii) above are analysed as follows:
THE GROUP
2017 2016
Rs’000 Rs’000
Funded obligation (Note (c - o)) 13,158 2,701
Unfunded obligation (Note (p - u)) 82,896 57,826
96,054 60,527
FUNDED OBLIGATION
(c) The amounts recognised in the statement of financial position in respect of the funded obligation are as follows:
THE GROUP
2017 2016
Rs’000 Rs’000
Present value of funded obligation 56,143 44,706
Fair value of plan assets (42,985) (42,005)
Liability in the statement of financial position 13,158 2,701
(d) Movement in the statement of financial position:
THE GROUP
2017 2016
Rs’000 Rs’000
At 01 July 2,701 5,493
Total expenses (Note (e)) 1,931 2,254
Actuarial losses/(gains) recognised in other comprehensive income 9,569 (4,370)
Contributions paid (1,043) (676)
At 30 June 13,158 2,701
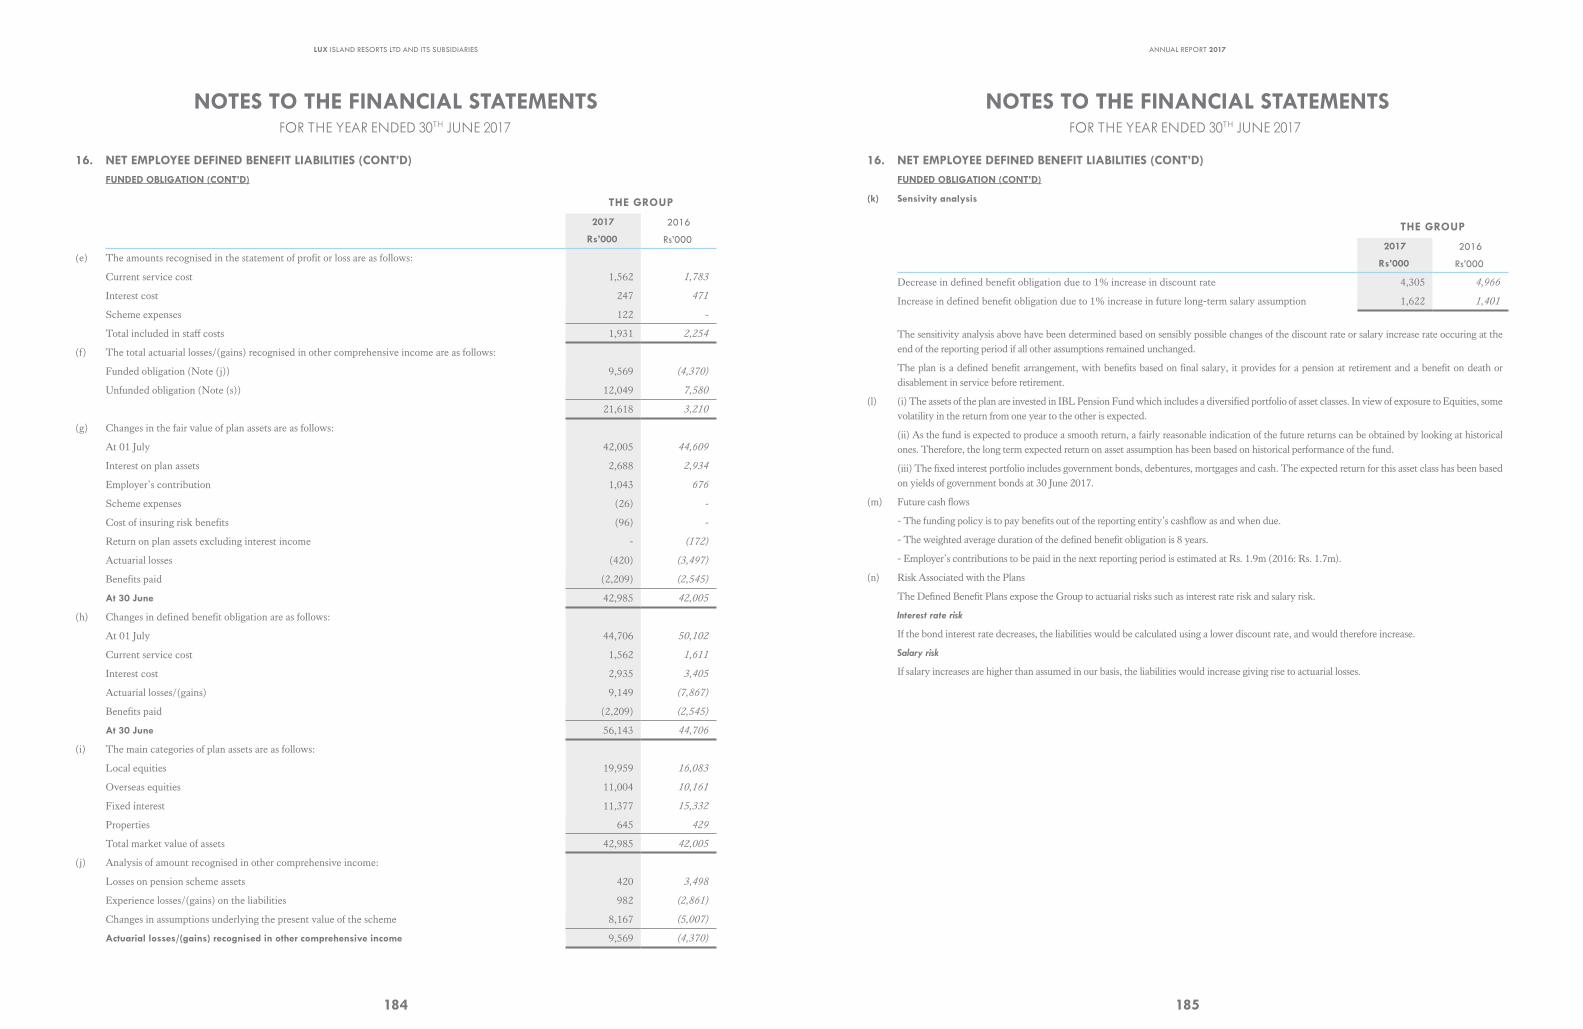
LUX ISLAND RESORTS LTD AND ITS SUBSIDIARIES
184
NOTES TO THE FINANCIAL STATEMENTS FOR THE YEAR ENDED 30TH JUNE 2017
16. NET EMPLOYEE DEFINED BENEFIT LIABILITIES (CONT’D)FUNDED OBLIGATION (CONT’D)
THE GROUP
2017 2016
Rs’000 Rs’000
(e) The amounts recognised in the statement of profit or loss are as follows:
Current service cost 1,562 1,783
Interest cost 247 471
Scheme expenses 122 -
Total included in staff costs 1,931 2,254
(f) The total actuarial losses/(gains) recognised in other comprehensive income are as follows:
Funded obligation (Note (j)) 9,569 (4,370)
Unfunded obligation (Note (s)) 12,049 7,580
21,618 3,210
(g) Changes in the fair value of plan assets are as follows:
At 01 July 42,005 44,609
Interest on plan assets 2,688 2,934
Employer’s contribution 1,043 676
Scheme expenses (26) -
Cost of insuring risk benefits (96) -
Return on plan assets excluding interest income - (172)
Actuarial losses (420) (3,497)
Benefits paid (2,209) (2,545)
At 30 June 42,985 42,005
(h) Changes in defined benefit obligation are as follows:
At 01 July 44,706 50,102
Current service cost 1,562 1,611
Interest cost 2,935 3,405
Actuarial losses/(gains) 9,149 (7,867)
Benefits paid (2,209) (2,545)
At 30 June 56,143 44,706
(i) The main categories of plan assets are as follows:
Local equities 19,959 16,083
Overseas equities 11,004 10,161
Fixed interest 11,377 15,332
Properties 645 429
Total market value of assets 42,985 42,005
(j) Analysis of amount recognised in other comprehensive income:
Losses on pension scheme assets 420 3,498
Experience losses/(gains) on the liabilities 982 (2,861)
Changes in assumptions underlying the present value of the scheme 8,167 (5,007)
Actuarial losses/(gains) recognised in other comprehensive income 9,569 (4,370)
ANNUAL REPORT 2017
185
NOTES TO THE FINANCIAL STATEMENTS FOR THE YEAR ENDED 30TH JUNE 2017
16. NET EMPLOYEE DEFINED BENEFIT LIABILITIES (CONT’D)FUNDED OBLIGATION (CONT’D)
THE GROUP
2017 2016
Rs’000 Rs’000
(e) The amounts recognised in the statement of profit or loss are as follows:
Current service cost 1,562 1,783
Interest cost 247 471
Scheme expenses 122 -
Total included in staff costs 1,931 2,254
(f) The total actuarial losses/(gains) recognised in other comprehensive income are as follows:
Funded obligation (Note (j)) 9,569 (4,370)
Unfunded obligation (Note (s)) 12,049 7,580
21,618 3,210
(g) Changes in the fair value of plan assets are as follows:
At 01 July 42,005 44,609
Interest on plan assets 2,688 2,934
Employer’s contribution 1,043 676
Scheme expenses (26) -
Cost of insuring risk benefits (96) -
Return on plan assets excluding interest income - (172)
Actuarial losses (420) (3,497)
Benefits paid (2,209) (2,545)
At 30 June 42,985 42,005
(h) Changes in defined benefit obligation are as follows:
At 01 July 44,706 50,102
Current service cost 1,562 1,611
Interest cost 2,935 3,405
Actuarial losses/(gains) 9,149 (7,867)
Benefits paid (2,209) (2,545)
At 30 June 56,143 44,706
(i) The main categories of plan assets are as follows:
Local equities 19,959 16,083
Overseas equities 11,004 10,161
Fixed interest 11,377 15,332
Properties 645 429
Total market value of assets 42,985 42,005
(j) Analysis of amount recognised in other comprehensive income:
Losses on pension scheme assets 420 3,498
Experience losses/(gains) on the liabilities 982 (2,861)
Changes in assumptions underlying the present value of the scheme 8,167 (5,007)
Actuarial losses/(gains) recognised in other comprehensive income 9,569 (4,370)
NOTES TO THE FINANCIAL STATEMENTSFOR THE YEAR ENDED 30TH JUNE 2017
16. NET EMPLOYEE DEFINED BENEFIT LIABILITIES (CONT’D)FUNDED OBLIGATION (CONT’D)
(k) Sensivity analysis
THE GROUP
2017 2016
Rs’000 Rs’000
Decrease in defined benefit obligation due to 1% increase in discount rate 4,305 4,966
Increase in defined benefit obligation due to 1% increase in future long-term salary assumption 1,622 1,401
The sensitivity analysis above have been determined based on sensibly possible changes of the discount rate or salary increase rate occuring at the end of the reporting period if all other assumptions remained unchanged.
The plan is a defined benefit arrangement, with benefits based on final salary, it provides for a pension at retirement and a benefit on death or disablement in service before retirement.
(l) (i) The assets of the plan are invested in IBL Pension Fund which includes a diversified portfolio of asset classes. In view of exposure to Equities, some volatility in the return from one year to the other is expected.
(ii) As the fund is expected to produce a smooth return, a fairly reasonable indication of the future returns can be obtained by looking at historical ones. Therefore, the long term expected return on asset assumption has been based on historical performance of the fund.
(iii) The fixed interest portfolio includes government bonds, debentures, mortgages and cash. The expected return for this asset class has been based on yields of government bonds at 30 June 2017.
(m) Future cash flows
- The funding policy is to pay benefits out of the reporting entity’s cashflow as and when due.
- The weighted average duration of the defined benefit obligation is 8 years.
- Employer’s contributions to be paid in the next reporting period is estimated at Rs. 1.9m (2016: Rs. 1.7m).
(n) Risk Associated with the Plans
The Defined Benefit Plans expose the Group to actuarial risks such as interest rate risk and salary risk.
Interest rate risk
If the bond interest rate decreases, the liabilities would be calculated using a lower discount rate, and would therefore increase.
Salary risk
If salary increases are higher than assumed in our basis, the liabilities would increase giving rise to actuarial losses.
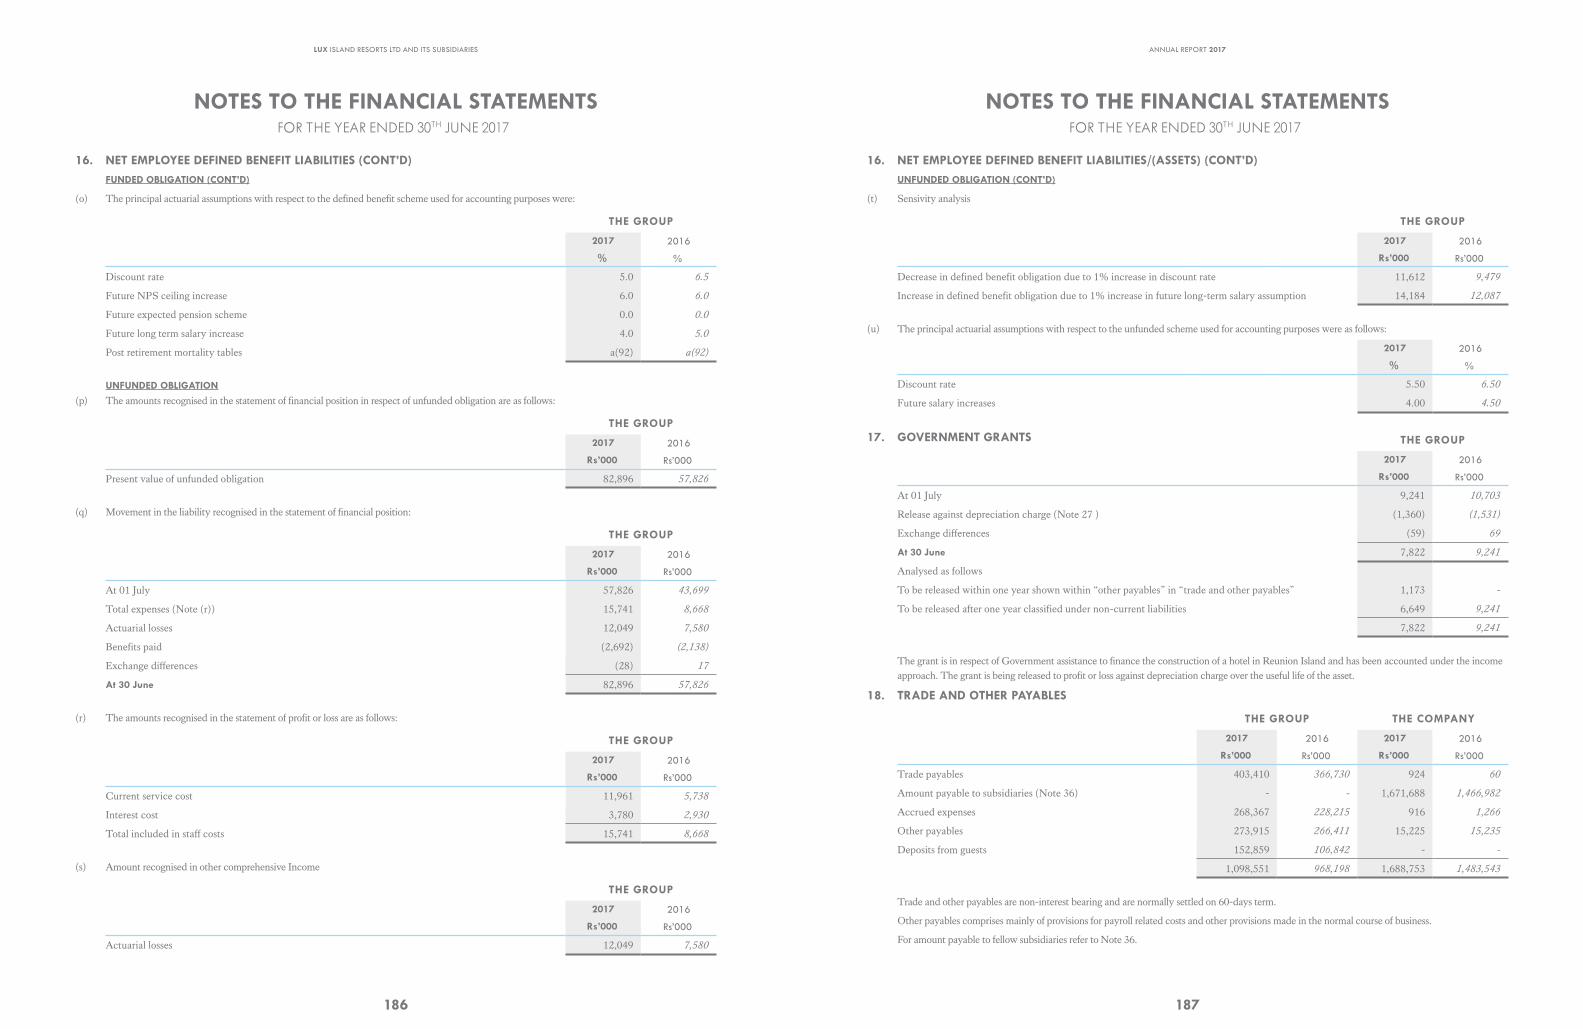
LUX ISLAND RESORTS LTD AND ITS SUBSIDIARIES
186
NOTES TO THE FINANCIAL STATEMENTSFOR THE YEAR ENDED 30TH JUNE 2017
16. NET EMPLOYEE DEFINED BENEFIT LIABILITIES (CONT’D)FUNDED OBLIGATION (CONT’D)
(o) The principal actuarial assumptions with respect to the defined benefit scheme used for accounting purposes were:
THE GROUP
2017 2016
% %
Discount rate 5.0 6.5
Future NPS ceiling increase 6.0 6.0
Future expected pension scheme 0.0 0.0
Future long term salary increase 4.0 5.0
Post retirement mortality tables a(92) a(92)
UNFUNDED OBLIGATION
(p) The amounts recognised in the statement of financial position in respect of unfunded obligation are as follows:
THE GROUP
2017 2016
Rs’000 Rs’000
Present value of unfunded obligation 82,896 57,826
(q) Movement in the liability recognised in the statement of financial position:
THE GROUP
2017 2016
Rs’000 Rs’000
At 01 July 57,826 43,699
Total expenses (Note (r)) 15,741 8,668
Actuarial losses 12,049 7,580
Benefits paid (2,692) (2,138)
Exchange differences (28) 17
At 30 June 82,896 57,826
(r) The amounts recognised in the statement of profit or loss are as follows:
THE GROUP
2017 2016
Rs’000 Rs’000
Current service cost 11,961 5,738
Interest cost 3,780 2,930
Total included in staff costs 15,741 8,668
(s) Amount recognised in other comprehensive Income
THE GROUP
2017 2016
Rs’000 Rs’000
Actuarial losses 12,049 7,580
ANNUAL REPORT 2017
187
NOTES TO THE FINANCIAL STATEMENTSFOR THE YEAR ENDED 30TH JUNE 2017
16. NET EMPLOYEE DEFINED BENEFIT LIABILITIES (CONT’D)FUNDED OBLIGATION (CONT’D)
(o) The principal actuarial assumptions with respect to the defined benefit scheme used for accounting purposes were:
THE GROUP
2017 2016
% %
Discount rate 5.0 6.5
Future NPS ceiling increase 6.0 6.0
Future expected pension scheme 0.0 0.0
Future long term salary increase 4.0 5.0
Post retirement mortality tables a(92) a(92)
UNFUNDED OBLIGATION
(p) The amounts recognised in the statement of financial position in respect of unfunded obligation are as follows:
THE GROUP
2017 2016
Rs’000 Rs’000
Present value of unfunded obligation 82,896 57,826
(q) Movement in the liability recognised in the statement of financial position:
THE GROUP
2017 2016
Rs’000 Rs’000
At 01 July 57,826 43,699
Total expenses (Note (r)) 15,741 8,668
Actuarial losses 12,049 7,580
Benefits paid (2,692) (2,138)
Exchange differences (28) 17
At 30 June 82,896 57,826
(r) The amounts recognised in the statement of profit or loss are as follows:
THE GROUP
2017 2016
Rs’000 Rs’000
Current service cost 11,961 5,738
Interest cost 3,780 2,930
Total included in staff costs 15,741 8,668
(s) Amount recognised in other comprehensive Income
THE GROUP
2017 2016
Rs’000 Rs’000
Actuarial losses 12,049 7,580
NOTES TO THE FINANCIAL STATEMENTS FOR THE YEAR ENDED 30TH JUNE 2017
16. NET EMPLOYEE DEFINED BENEFIT LIABILITIES/(ASSETS) (CONT’D)UNFUNDED OBLIGATION (CONT’D)
(t) Sensivity analysis
THE GROUP
2017 2016
Rs’000 Rs’000
Decrease in defined benefit obligation due to 1% increase in discount rate 11,612 9,479
Increase in defined benefit obligation due to 1% increase in future long-term salary assumption 14,184 12,087
(u) The principal actuarial assumptions with respect to the unfunded scheme used for accounting purposes were as follows:
2017 2016
% %
Discount rate 5.50 6.50
Future salary increases 4.00 4.50
17. GOVERNMENT GRANTS THE GROUP
2017 2016
Rs’000 Rs’000
At 01 July 9,241 10,703
Release against depreciation charge (Note 27 ) (1,360) (1,531)
Exchange differences (59) 69
At 30 June 7,822 9,241
Analysed as follows
To be released within one year shown within “other payables” in “trade and other payables” 1,173 -
To be released after one year classified under non-current liabilities 6,649 9,241
7,822 9,241
The grant is in respect of Government assistance to finance the construction of a hotel in Reunion Island and has been accounted under the income approach. The grant is being released to profit or loss against depreciation charge over the useful life of the asset.
18. TRADE AND OTHER PAYABLES
THE GROUP THE COMPANY
2017 2016 2017 2016
Rs’000 Rs’000 Rs’000 Rs’000
Trade payables 403,410 366,730 924 60
Amount payable to subsidiaries (Note 36) - - 1,671,688 1,466,982
Accrued expenses 268,367 228,215 916 1,266
Other payables 273,915 266,411 15,225 15,235
Deposits from guests 152,859 106,842 - -
1,098,551 968,198 1,688,753 1,483,543
Trade and other payables are non-interest bearing and are normally settled on 60-days term.
Other payables comprises mainly of provisions for payroll related costs and other provisions made in the normal course of business.
For amount payable to fellow subsidiaries refer to Note 36.
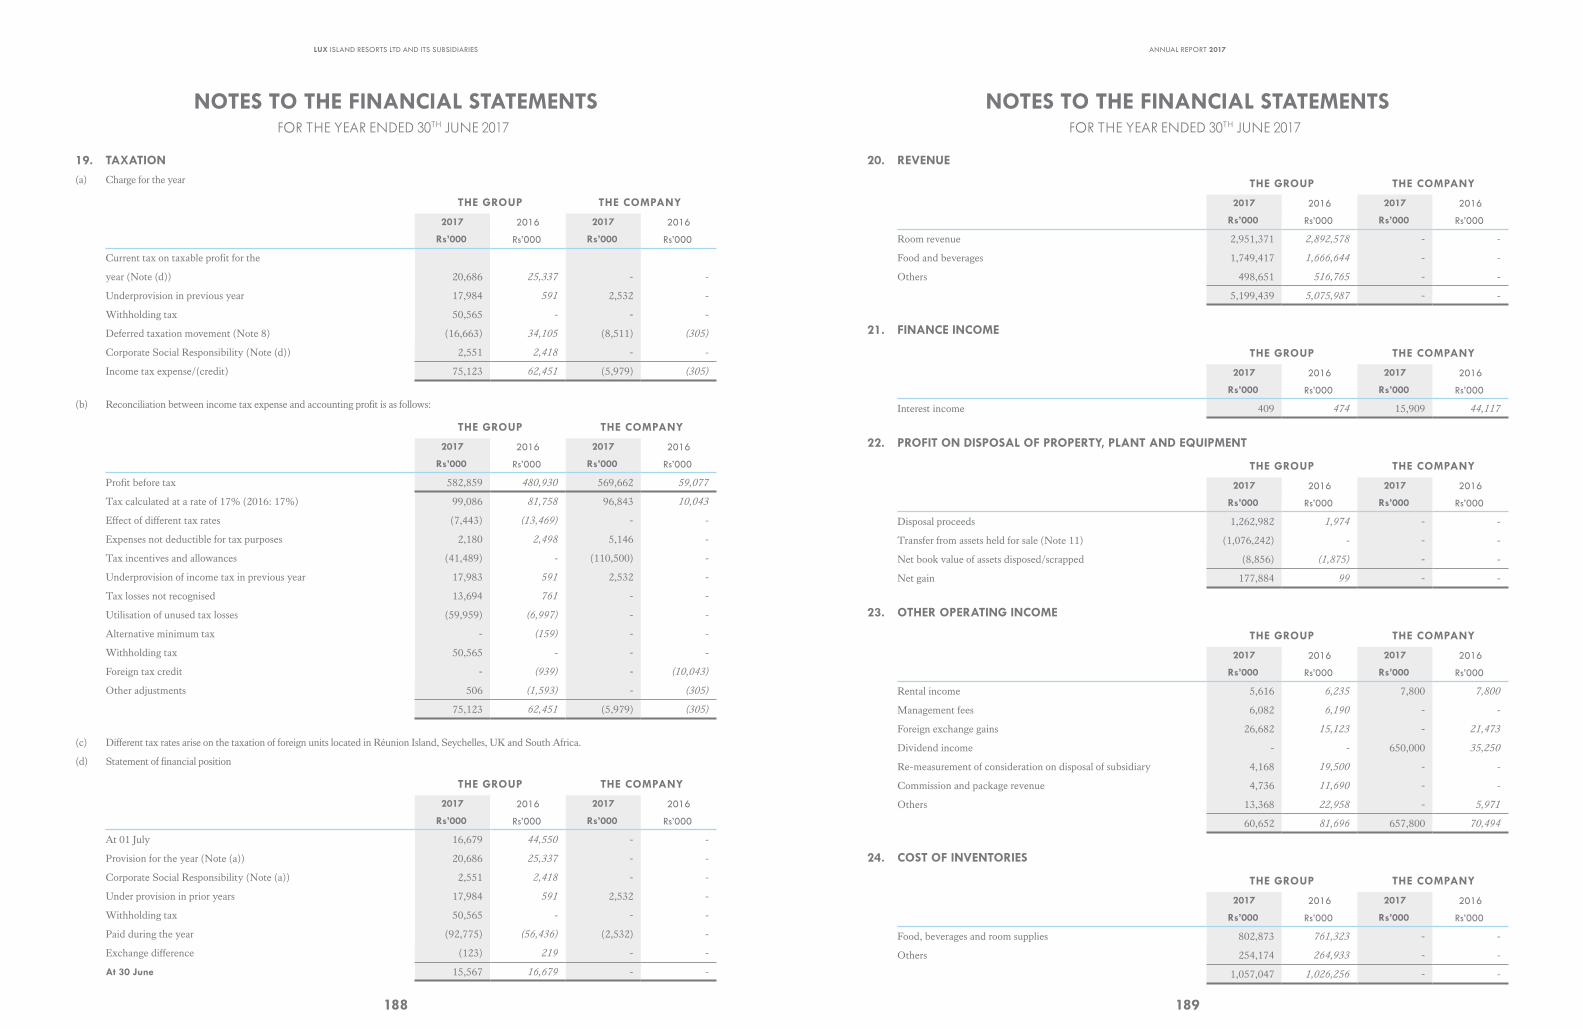
LUX ISLAND RESORTS LTD AND ITS SUBSIDIARIES
188
NOTES TO THE FINANCIAL STATEMENTS FOR THE YEAR ENDED 30TH JUNE 2017
19. TAXATION(a) Charge for the year
THE GROUP THE COMPANY
2017 2016 2017 2016
Rs’000 Rs’000 Rs’000 Rs’000
Current tax on taxable profit for the
year (Note (d)) 20,686 25,337 - -
Underprovision in previous year 17,984 591 2,532 -
Withholding tax 50,565 - - -
Deferred taxation movement (Note 8) (16,663) 34,105 (8,511) (305)
Corporate Social Responsibility (Note (d)) 2,551 2,418 - -
Income tax expense/(credit) 75,123 62,451 (5,979) (305)
(b) Reconciliation between income tax expense and accounting profit is as follows:
THE GROUP THE COMPANY
2017 2016 2017 2016
Rs’000 Rs’000 Rs’000 Rs’000
Profit before tax 582,859 480,930 569,662 59,077
Tax calculated at a rate of 17% (2016: 17%) 99,086 81,758 96,843 10,043
Effect of different tax rates (7,443) (13,469) - -
Expenses not deductible for tax purposes 2,180 2,498 5,146 -
Tax incentives and allowances (41,489) - (110,500) -
Underprovision of income tax in previous year 17,983 591 2,532 -
Tax losses not recognised 13,694 761 - -
Utilisation of unused tax losses (59,959) (6,997) - -
Alternative minimum tax - (159) - -
Withholding tax 50,565 - - -
Foreign tax credit - (939) - (10,043)
Other adjustments 506 (1,593) - (305)
75,123 62,451 (5,979) (305)
(c) Different tax rates arise on the taxation of foreign units located in Réunion Island, Seychelles, UK and South Africa.
(d) Statement of financial position
THE GROUP THE COMPANY
2017 2016 2017 2016
Rs’000 Rs’000 Rs’000 Rs’000
At 01 July 16,679 44,550 - -
Provision for the year (Note (a)) 20,686 25,337 - -
Corporate Social Responsibility (Note (a)) 2,551 2,418 - -
Under provision in prior years 17,984 591 2,532 -
Withholding tax 50,565 - - -
Paid during the year (92,775) (56,436) (2,532) -
Exchange difference (123) 219 - -
At 30 June 15,567 16,679 - -
ANNUAL REPORT 2017
189
NOTES TO THE FINANCIAL STATEMENTS FOR THE YEAR ENDED 30TH JUNE 2017
19. TAXATION(a) Charge for the year
THE GROUP THE COMPANY
2017 2016 2017 2016
Rs’000 Rs’000 Rs’000 Rs’000
Current tax on taxable profit for the
year (Note (d)) 20,686 25,337 - -
Underprovision in previous year 17,984 591 2,532 -
Withholding tax 50,565 - - -
Deferred taxation movement (Note 8) (16,663) 34,105 (8,511) (305)
Corporate Social Responsibility (Note (d)) 2,551 2,418 - -
Income tax expense/(credit) 75,123 62,451 (5,979) (305)
(b) Reconciliation between income tax expense and accounting profit is as follows:
THE GROUP THE COMPANY
2017 2016 2017 2016
Rs’000 Rs’000 Rs’000 Rs’000
Profit before tax 582,859 480,930 569,662 59,077
Tax calculated at a rate of 17% (2016: 17%) 99,086 81,758 96,843 10,043
Effect of different tax rates (7,443) (13,469) - -
Expenses not deductible for tax purposes 2,180 2,498 5,146 -
Tax incentives and allowances (41,489) - (110,500) -
Underprovision of income tax in previous year 17,983 591 2,532 -
Tax losses not recognised 13,694 761 - -
Utilisation of unused tax losses (59,959) (6,997) - -
Alternative minimum tax - (159) - -
Withholding tax 50,565 - - -
Foreign tax credit - (939) - (10,043)
Other adjustments 506 (1,593) - (305)
75,123 62,451 (5,979) (305)
(c) Different tax rates arise on the taxation of foreign units located in Réunion Island, Seychelles, UK and South Africa.
(d) Statement of financial position
THE GROUP THE COMPANY
2017 2016 2017 2016
Rs’000 Rs’000 Rs’000 Rs’000
At 01 July 16,679 44,550 - -
Provision for the year (Note (a)) 20,686 25,337 - -
Corporate Social Responsibility (Note (a)) 2,551 2,418 - -
Under provision in prior years 17,984 591 2,532 -
Withholding tax 50,565 - - -
Paid during the year (92,775) (56,436) (2,532) -
Exchange difference (123) 219 - -
At 30 June 15,567 16,679 - -
NOTES TO THE FINANCIAL STATEMENTSFOR THE YEAR ENDED 30TH JUNE 2017
20. REVENUE
THE GROUP THE COMPANY
2017 2016 2017 2016
Rs’000 Rs’000 Rs’000 Rs’000
Room revenue 2,951,371 2,892,578 - -
Food and beverages 1,749,417 1,666,644 - -
Others 498,651 516,765 - -
5,199,439 5,075,987 - -
21. FINANCE INCOME
THE GROUP THE COMPANY
2017 2016 2017 2016
Rs’000 Rs’000 Rs’000 Rs’000
Interest income 409 474 15,909 44,117
22. PROFIT ON DISPOSAL OF PROPERTY, PLANT AND EQUIPMENT
THE GROUP THE COMPANY
2017 2016 2017 2016
Rs’000 Rs’000 Rs’000 Rs’000
Disposal proceeds 1,262,982 1,974 - -
Transfer from assets held for sale (Note 11) (1,076,242) - - -
Net book value of assets disposed/scrapped (8,856) (1,875) - -
Net gain 177,884 99 - -
23. OTHER OPERATING INCOME
THE GROUP THE COMPANY
2017 2016 2017 2016
Rs’000 Rs’000 Rs’000 Rs’000
Rental income 5,616 6,235 7,800 7,800
Management fees 6,082 6,190 - -
Foreign exchange gains 26,682 15,123 - 21,473
Dividend income - - 650,000 35,250
Re-measurement of consideration on disposal of subsidiary 4,168 19,500 - -
Commission and package revenue 4,736 11,690 - -
Others 13,368 22,958 - 5,971
60,652 81,696 657,800 70,494
24. COST OF INVENTORIES
THE GROUP THE COMPANY
2017 2016 2017 2016
Rs’000 Rs’000 Rs’000 Rs’000
Food, beverages and room supplies 802,873 761,323 - -
Others 254,174 264,933 - -
1,057,047 1,026,256 - -
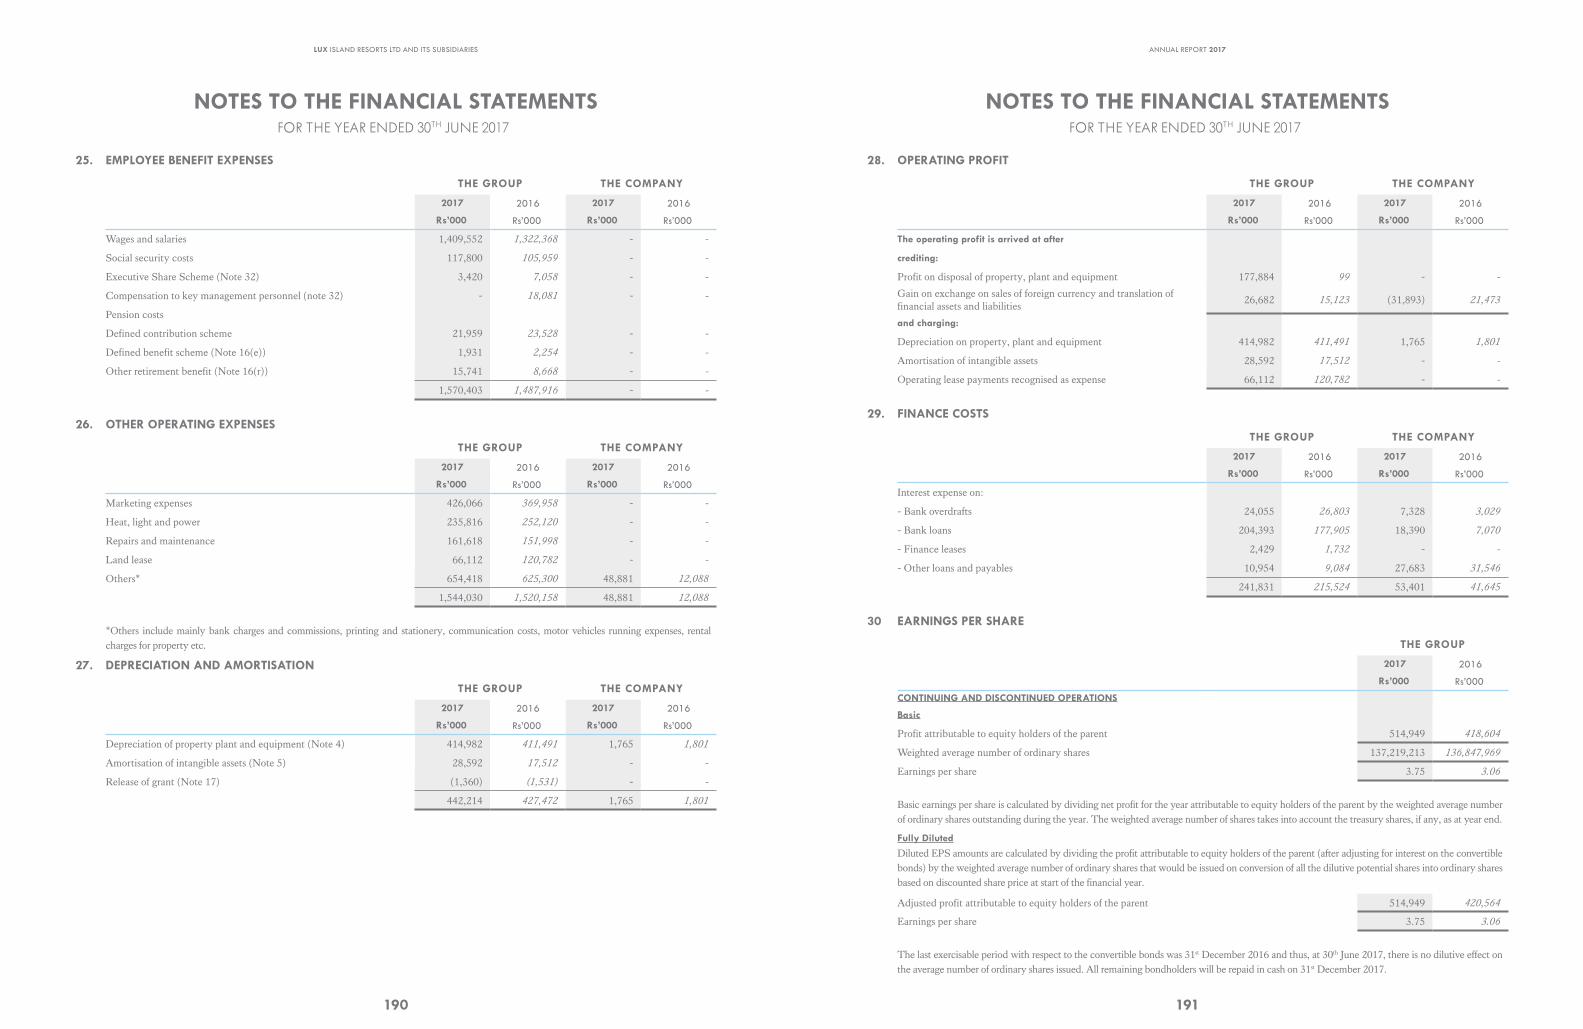
LUX ISLAND RESORTS LTD AND ITS SUBSIDIARIES
190
NOTES TO THE FINANCIAL STATEMENTSFOR THE YEAR ENDED 30TH JUNE 2017
25. EMPLOYEE BENEFIT EXPENSES
THE GROUP THE COMPANY
2017 2016 2017 2016
Rs’000 Rs’000 Rs’000 Rs’000
Wages and salaries 1,409,552 1,322,368 - -
Social security costs 117,800 105,959 - -
Executive Share Scheme (Note 32) 3,420 7,058 - -
Compensation to key management personnel (note 32) - 18,081 - -
Pension costs
Defined contribution scheme 21,959 23,528 - -
Defined benefit scheme (Note 16(e)) 1,931 2,254 - -
Other retirement benefit (Note 16(r)) 15,741 8,668 - -
1,570,403 1,487,916 - -
26. OTHER OPERATING EXPENSES
THE GROUP THE COMPANY
2017 2016 2017 2016
Rs’000 Rs’000 Rs’000 Rs’000
Marketing expenses 426,066 369,958 - -
Heat, light and power 235,816 252,120 - -
Repairs and maintenance 161,618 151,998 - -
Land lease 66,112 120,782 - -
Others* 654,418 625,300 48,881 12,088
1,544,030 1,520,158 48,881 12,088
*Others include mainly bank charges and commissions, printing and stationery, communication costs, motor vehicles running expenses, rental charges for property etc.
27. DEPRECIATION AND AMORTISATION
THE GROUP THE COMPANY
2017 2016 2017 2016
Rs’000 Rs’000 Rs’000 Rs’000
Depreciation of property plant and equipment (Note 4) 414,982 411,491 1,765 1,801
Amortisation of intangible assets (Note 5) 28,592 17,512 - -
Release of grant (Note 17) (1,360) (1,531) - -
442,214 427,472 1,765 1,801
ANNUAL REPORT 2017
191
NOTES TO THE FINANCIAL STATEMENTSFOR THE YEAR ENDED 30TH JUNE 2017
25. EMPLOYEE BENEFIT EXPENSES
THE GROUP THE COMPANY
2017 2016 2017 2016
Rs’000 Rs’000 Rs’000 Rs’000
Wages and salaries 1,409,552 1,322,368 - -
Social security costs 117,800 105,959 - -
Executive Share Scheme (Note 32) 3,420 7,058 - -
Compensation to key management personnel (note 32) - 18,081 - -
Pension costs
Defined contribution scheme 21,959 23,528 - -
Defined benefit scheme (Note 16(e)) 1,931 2,254 - -
Other retirement benefit (Note 16(r)) 15,741 8,668 - -
1,570,403 1,487,916 - -
26. OTHER OPERATING EXPENSES
THE GROUP THE COMPANY
2017 2016 2017 2016
Rs’000 Rs’000 Rs’000 Rs’000
Marketing expenses 426,066 369,958 - -
Heat, light and power 235,816 252,120 - -
Repairs and maintenance 161,618 151,998 - -
Land lease 66,112 120,782 - -
Others* 654,418 625,300 48,881 12,088
1,544,030 1,520,158 48,881 12,088
*Others include mainly bank charges and commissions, printing and stationery, communication costs, motor vehicles running expenses, rental charges for property etc.
27. DEPRECIATION AND AMORTISATION
THE GROUP THE COMPANY
2017 2016 2017 2016
Rs’000 Rs’000 Rs’000 Rs’000
Depreciation of property plant and equipment (Note 4) 414,982 411,491 1,765 1,801
Amortisation of intangible assets (Note 5) 28,592 17,512 - -
Release of grant (Note 17) (1,360) (1,531) - -
442,214 427,472 1,765 1,801
NOTES TO THE FINANCIAL STATEMENTS FOR THE YEAR ENDED 30TH JUNE 2017
28. OPERATING PROFIT
THE GROUP THE COMPANY
2017 2016 2017 2016
Rs’000 Rs’000 Rs’000 Rs’000
The operating profit is arrived at after
crediting:
Profit on disposal of property, plant and equipment 177,884 99 - -
Gain on exchange on sales of foreign currency and translation of financial assets and liabilities
26,682 15,123 (31,893) 21,473
and charging:
Depreciation on property, plant and equipment 414,982 411,491 1,765 1,801
Amortisation of intangible assets 28,592 17,512 - -
Operating lease payments recognised as expense 66,112 120,782 - -
29. FINANCE COSTS
THE GROUP THE COMPANY
2017 2016 2017 2016
Rs’000 Rs’000 Rs’000 Rs’000
Interest expense on:
- Bank overdrafts 24,055 26,803 7,328 3,029
- Bank loans 204,393 177,905 18,390 7,070
- Finance leases 2,429 1,732 - -
- Other loans and payables 10,954 9,084 27,683 31,546
241,831 215,524 53,401 41,645
30 EARNINGS PER SHARE
THE GROUP
2017 2016
Rs’000 Rs’000
CONTINUING AND DISCONTINUED OPERATIONS
Basic
Profit attributable to equity holders of the parent 514,949 418,604
Weighted average number of ordinary shares 137,219,213 136,847,969
Earnings per share 3.75 3.06
Basic earnings per share is calculated by dividing net profit for the year attributable to equity holders of the parent by the weighted average number of ordinary shares outstanding during the year. The weighted average number of shares takes into account the treasury shares, if any, as at year end.
Fully Diluted
Diluted EPS amounts are calculated by dividing the profit attributable to equity holders of the parent (after adjusting for interest on the convertible bonds) by the weighted average number of ordinary shares that would be issued on conversion of all the dilutive potential shares into ordinary shares based on discounted share price at start of the financial year.
Adjusted profit attributable to equity holders of the parent 514,949 420,564
Earnings per share 3.75 3.06
The last exercisable period with respect to the convertible bonds was 31st December 2016 and thus, at 30th June 2017, there is no dilutive effect on the average number of ordinary shares issued. All remaining bondholders will be repaid in cash on 31st December 2017.
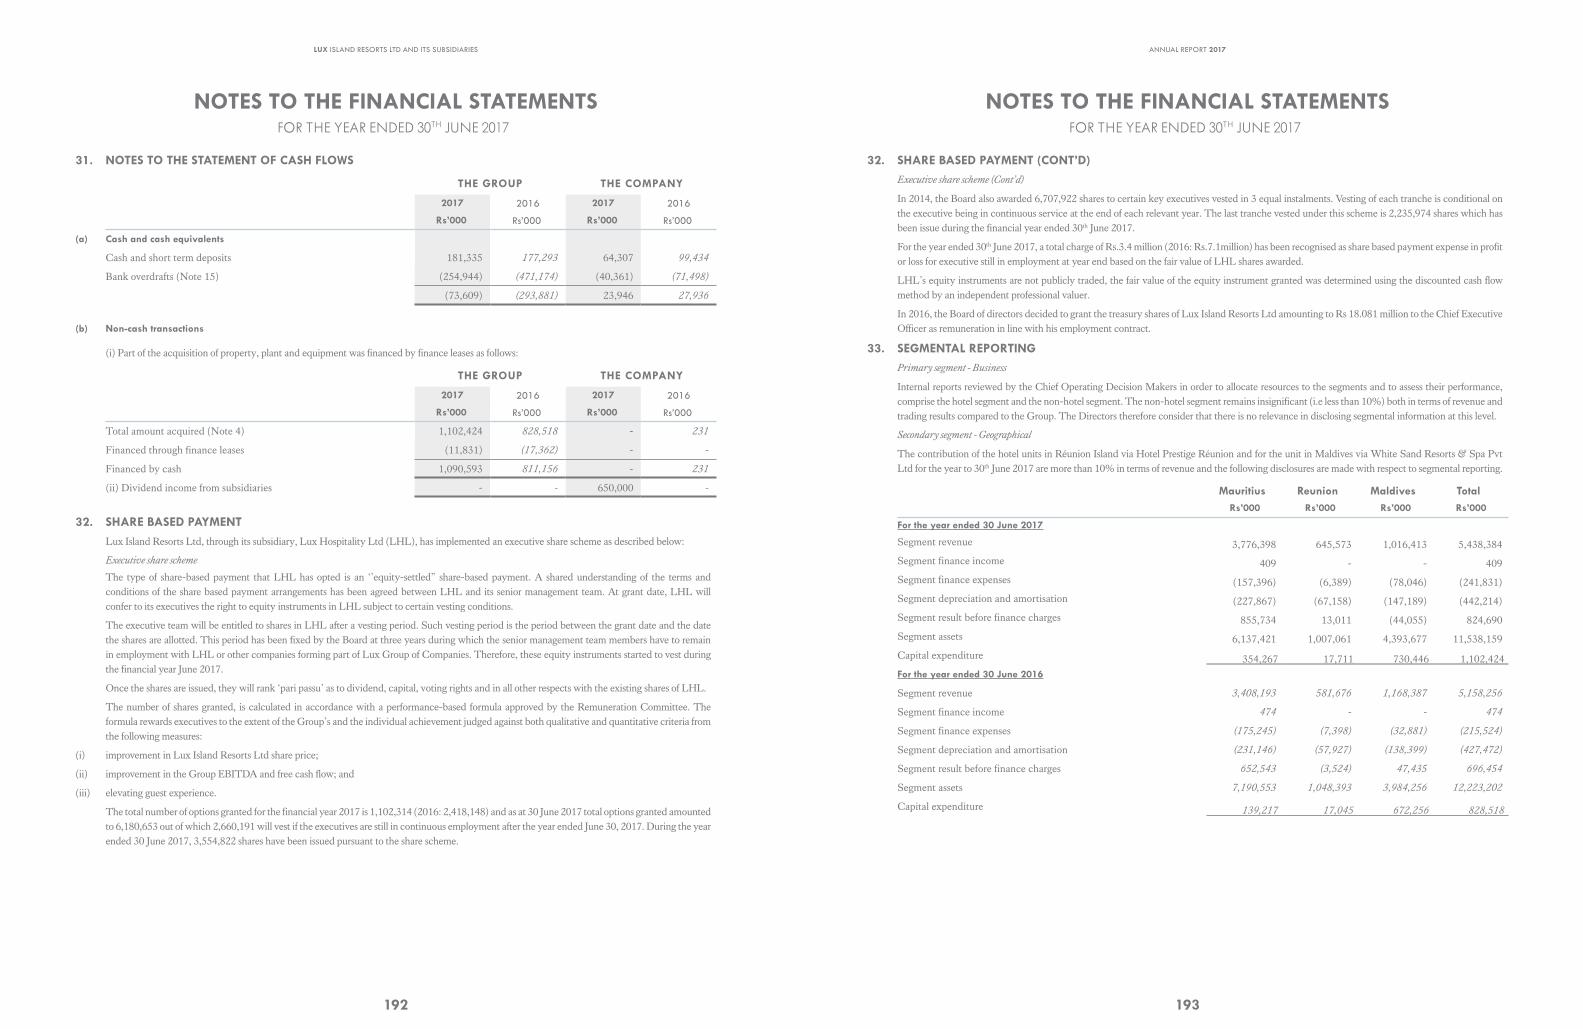
LUX ISLAND RESORTS LTD AND ITS SUBSIDIARIES
192
NOTES TO THE FINANCIAL STATEMENTSFOR THE YEAR ENDED 30TH JUNE 2017
31. NOTES TO THE STATEMENT OF CASH FLOWS
THE GROUP THE COMPANY
2017 2016 2017 2016
Rs’000 Rs’000 Rs’000 Rs’000
(a) Cash and cash equivalents
Cash and short term deposits 181,335 177,293 64,307 99,434
Bank overdrafts (Note 15) (254,944) (471,174) (40,361) (71,498)
(73,609) (293,881) 23,946 27,936
(b) Non-cash transactions
(i) Part of the acquisition of property, plant and equipment was financed by finance leases as follows:
THE GROUP THE COMPANY
2017 2016 2017 2016
Rs’000 Rs’000 Rs’000 Rs’000
Total amount acquired (Note 4) 1,102,424 828,518 - 231
Financed through finance leases (11,831) (17,362) - -
Financed by cash 1,090,593 811,156 - 231
(ii) Dividend income from subsidiaries - - 650,000 -
32. SHARE BASED PAYMENTLux Island Resorts Ltd, through its subsidiary, Lux Hospitality Ltd (LHL), has implemented an executive share scheme as described below:
Executive share scheme
The type of share-based payment that LHL has opted is an ‘’equity-settled” share-based payment. A shared understanding of the terms and conditions of the share based payment arrangements has been agreed between LHL and its senior management team. At grant date, LHL will confer to its executives the right to equity instruments in LHL subject to certain vesting conditions.
The executive team will be entitled to shares in LHL after a vesting period. Such vesting period is the period between the grant date and the date the shares are allotted. This period has been fixed by the Board at three years during which the senior management team members have to remain in employment with LHL or other companies forming part of Lux Group of Companies. Therefore, these equity instruments started to vest during the financial year June 2017.
Once the shares are issued, they will rank ‘pari passu’ as to dividend, capital, voting rights and in all other respects with the existing shares of LHL.
The number of shares granted, is calculated in accordance with a performance-based formula approved by the Remuneration Committee. The formula rewards executives to the extent of the Group’s and the individual achievement judged against both qualitative and quantitative criteria from the following measures:
(i) improvement in Lux Island Resorts Ltd share price;
(ii) improvement in the Group EBITDA and free cash flow; and
(iii) elevating guest experience.
The total number of options granted for the financial year 2017 is 1,102,314 (2016: 2,418,148) and as at 30 June 2017 total options granted amounted to 6,180,653 out of which 2,660,191 will vest if the executives are still in continuous employment after the year ended June 30, 2017. During the year ended 30 June 2017, 3,554,822 shares have been issued pursuant to the share scheme.
ANNUAL REPORT 2017
193
NOTES TO THE FINANCIAL STATEMENTSFOR THE YEAR ENDED 30TH JUNE 2017
32. SHARE BASED PAYMENT (CONT’D)Executive share scheme (Cont’d)
In 2014, the Board also awarded 6,707,922 shares to certain key executives vested in 3 equal instalments. Vesting of each tranche is conditional on the executive being in continuous service at the end of each relevant year. The last tranche vested under this scheme is 2,235,974 shares which has been issue during the financial year ended 30th June 2017.
For the year ended 30th June 2017, a total charge of Rs.3.4 million (2016: Rs.7.1million) has been recognised as share based payment expense in profit or loss for executive still in employment at year end based on the fair value of LHL shares awarded.
LHL’s equity instruments are not publicly traded, the fair value of the equity instrument granted was determined using the discounted cash flow method by an independent professional valuer.
In 2016, the Board of directors decided to grant the treasury shares of Lux Island Resorts Ltd amounting to Rs 18.081 million to the Chief Executive Officer as remuneration in line with his employment contract.
33. SEGMENTAL REPORTINGPrimary segment - Business
Internal reports reviewed by the Chief Operating Decision Makers in order to allocate resources to the segments and to assess their performance, comprise the hotel segment and the non-hotel segment. The non-hotel segment remains insignificant (i.e less than 10%) both in terms of revenue and trading results compared to the Group. The Directors therefore consider that there is no relevance in disclosing segmental information at this level.
Secondary segment - Geographical
The contribution of the hotel units in Réunion Island via Hotel Prestige Réunion and for the unit in Maldives via White Sand Resorts & Spa Pvt Ltd for the year to 30th June 2017 are more than 10% in terms of revenue and the following disclosures are made with respect to segmental reporting.
Mauritius Reunion Maldives TotalRs’000 Rs’000 Rs’000 Rs’000
For the year ended 30 June 2017
Segment revenue 3,776,398 645,573 1,016,413 5,438,384
Segment finance income 409 - - 409
Segment finance expenses (157,396) (6,389) (78,046) (241,831)
Segment depreciation and amortisation (227,867) (67,158) (147,189) (442,214)
Segment result before finance charges 855,734 13,011 (44,055) 824,690
Segment assets 6,137,421 1,007,061 4,393,677 11,538,159
Capital expenditure 354,267 17,711 730,446 1,102,424 For the year ended 30 June 2016
Segment revenue 3,408,193 581,676 1,168,387 5,158,256
Segment finance income 474 - - 474
Segment finance expenses (175,245) (7,398) (32,881) (215,524)
Segment depreciation and amortisation (231,146) (57,927) (138,399) (427,472)
Segment result before finance charges 652,543 (3,524) 47,435 696,454
Segment assets 7,190,553 1,048,393 3,984,256 12,223,202
Capital expenditure 139,217 17,045 672,256 828,518
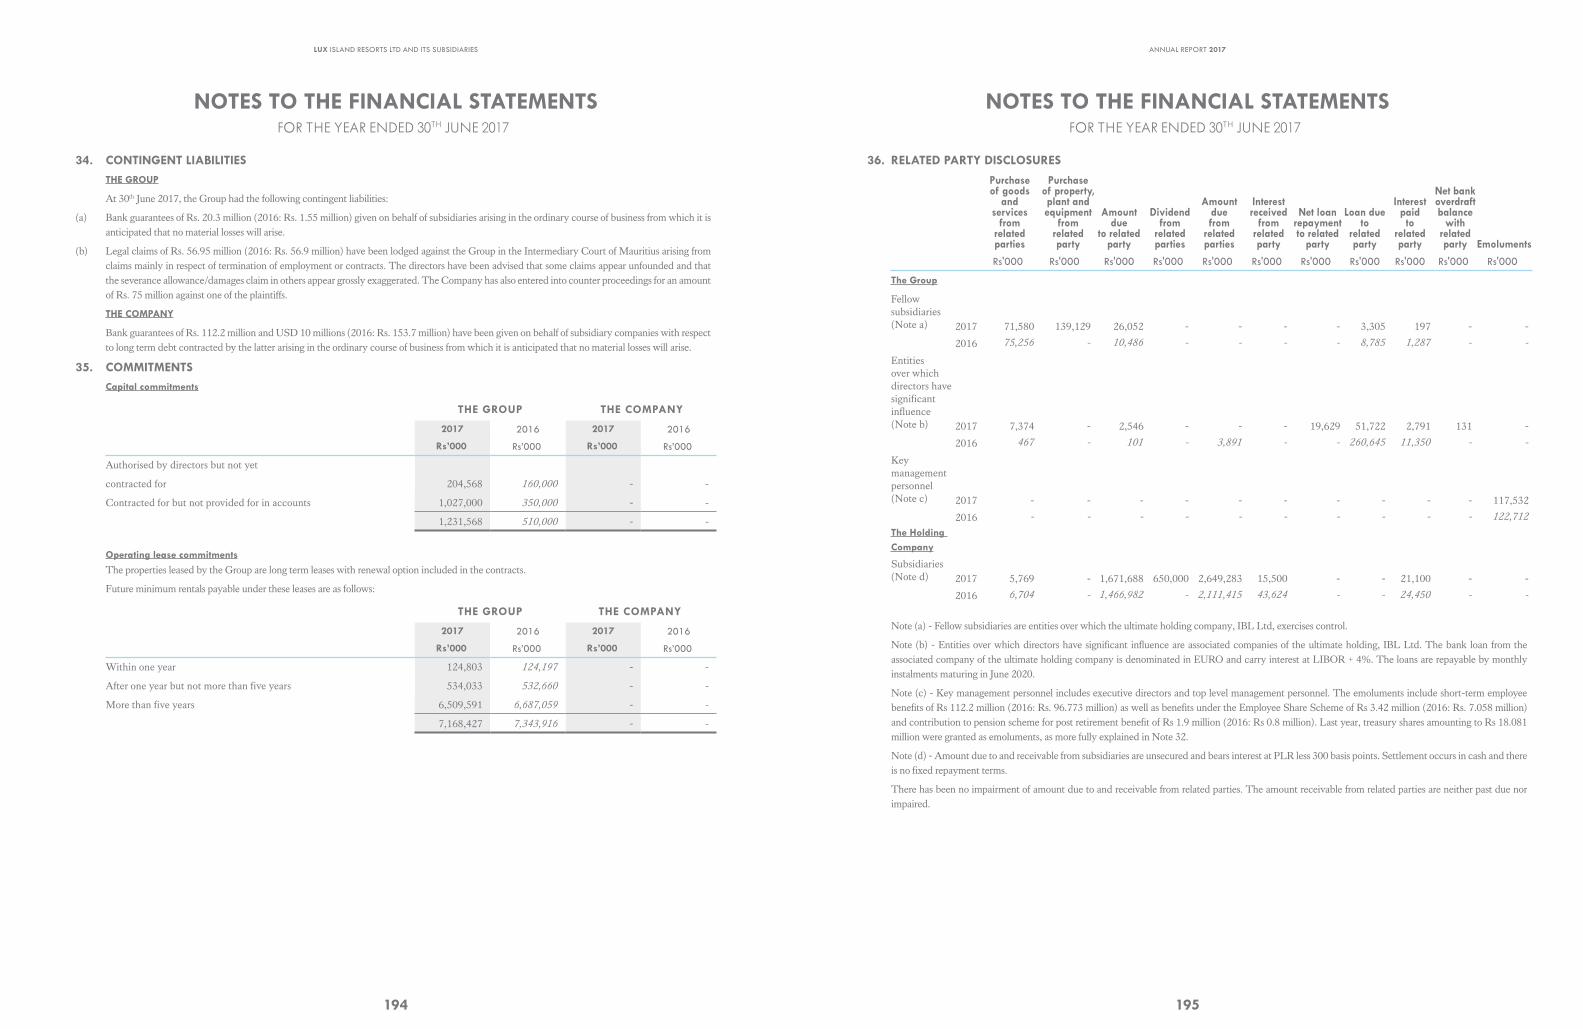
LUX ISLAND RESORTS LTD AND ITS SUBSIDIARIES
194
NOTES TO THE FINANCIAL STATEMENTS FOR THE YEAR ENDED 30TH JUNE 2017
34. CONTINGENT LIABILITIESTHE GROUP
At 30th June 2017, the Group had the following contingent liabilities:
(a) Bank guarantees of Rs. 20.3 million (2016: Rs. 1.55 million) given on behalf of subsidiaries arising in the ordinary course of business from which it is anticipated that no material losses will arise.
(b) Legal claims of Rs. 56.95 million (2016: Rs. 56.9 million) have been lodged against the Group in the Intermediary Court of Mauritius arising from claims mainly in respect of termination of employment or contracts. The directors have been advised that some claims appear unfounded and that the severance allowance/damages claim in others appear grossly exaggerated. The Company has also entered into counter proceedings for an amount of Rs. 75 million against one of the plaintiffs.
THE COMPANY
Bank guarantees of Rs. 112.2 million and USD 10 millions (2016: Rs. 153.7 million) have been given on behalf of subsidiary companies with respect to long term debt contracted by the latter arising in the ordinary course of business from which it is anticipated that no material losses will arise.
35. COMMITMENTSCapital commitments
THE GROUP THE COMPANY
2017 2016 2017 2016
Rs’000 Rs’000 Rs’000 Rs’000
Authorised by directors but not yet
contracted for 204,568 160,000 - -
Contracted for but not provided for in accounts 1,027,000 350,000 - -
1,231,568 510,000 - -
Operating lease commitments
The properties leased by the Group are long term leases with renewal option included in the contracts.
Future minimum rentals payable under these leases are as follows:
THE GROUP THE COMPANY
2017 2016 2017 2016
Rs’000 Rs’000 Rs’000 Rs’000
Within one year 124,803 124,197 - -
After one year but not more than five years 534,033 532,660 - -
More than five years 6,509,591 6,687,059 - -
7,168,427 7,343,916 - -
ANNUAL REPORT 2017
195
NOTES TO THE FINANCIAL STATEMENTSFOR THE YEAR ENDED 30TH JUNE 2017
36. RELATED PARTY DISCLOSURES
Purchase of goods
and services
from related parties
Purchase of property, plant and equipment
from related party
Amount due
to related party
Dividend from
related parties
Amount due from
related parties
Interest received
from related party
Net loan repayment to related
party
Loan due to
related party
Interest paid to
related party
Net bank overdraft balance
with related party Emoluments
Rs'000 Rs'000 Rs'000 Rs'000 Rs'000 Rs'000 Rs'000 Rs'000 Rs'000 Rs'000 Rs'000
The Group
Fellow subsidiaries (Note a) 2017 71,580 139,129 26,052 - - - - 3,305 197 - -
2016 75,256 - 10,486 - - - - 8,785 1,287 - -
Entities over which directors have significant influence (Note b) 2017 7,374 - 2,546 - - - 19,629 51,722 2,791 131 -
2016 467 - 101 - 3,891 - - 260,645 11,350 - -
Key management personnel (Note c) 2017 - - - - - - - - - - 117,532
2016 - - - - - - - - - - 122,712
The Holding Company
Subsidiaries (Note d) 2017 5,769 - 1,671,688 650,000
2,649,283 15,500 - - 21,100 - -
2016 6,704 - 1,466,982 - 2,111,415 43,624 - - 24,450 - -
Note (a) - Fellow subsidiaries are entities over which the ultimate holding company, IBL Ltd, exercises control.
Note (b) - Entities over which directors have significant influence are associated companies of the ultimate holding, IBL Ltd. The bank loan from the associated company of the ultimate holding company is denominated in EURO and carry interest at LIBOR + 4%. The loans are repayable by monthly instalments maturing in June 2020.
Note (c) - Key management personnel includes executive directors and top level management personnel. The emoluments include short-term employee benefits of Rs 112.2 million (2016: Rs. 96.773 million) as well as benefits under the Employee Share Scheme of Rs 3.42 million (2016: Rs. 7.058 million) and contribution to pension scheme for post retirement benefit of Rs 1.9 million (2016: Rs 0.8 million). Last year, treasury shares amounting to Rs 18.081 million were granted as emoluments, as more fully explained in Note 32.
Note (d) - Amount due to and receivable from subsidiaries are unsecured and bears interest at PLR less 300 basis points. Settlement occurs in cash and there is no fixed repayment terms.
There has been no impairment of amount due to and receivable from related parties. The amount receivable from related parties are neither past due nor impaired.
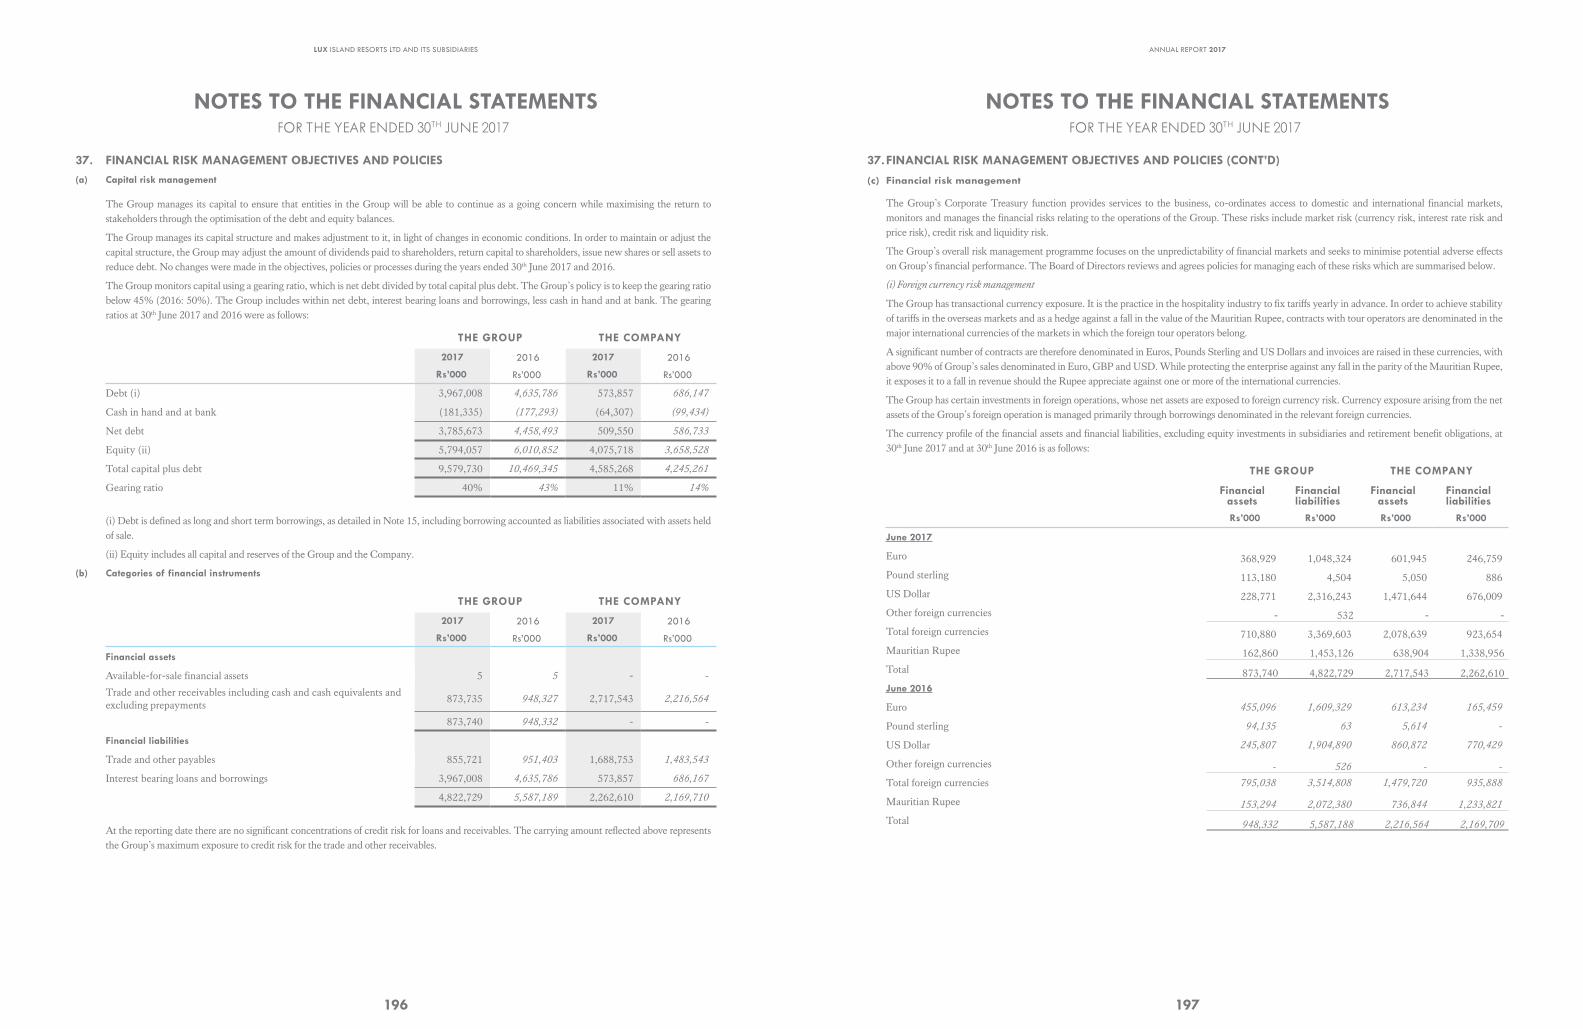
LUX ISLAND RESORTS LTD AND ITS SUBSIDIARIES
196
NOTES TO THE FINANCIAL STATEMENTSFOR THE YEAR ENDED 30TH JUNE 2017
37. FINANCIAL RISK MANAGEMENT OBJECTIVES AND POLICIES(a) Capital risk management
The Group manages its capital to ensure that entities in the Group will be able to continue as a going concern while maximising the return to stakeholders through the optimisation of the debt and equity balances.
The Group manages its capital structure and makes adjustment to it, in light of changes in economic conditions. In order to maintain or adjust the capital structure, the Group may adjust the amount of dividends paid to shareholders, return capital to shareholders, issue new shares or sell assets to reduce debt. No changes were made in the objectives, policies or processes during the years ended 30th June 2017 and 2016.
The Group monitors capital using a gearing ratio, which is net debt divided by total capital plus debt. The Group’s policy is to keep the gearing ratio below 45% (2016: 50%). The Group includes within net debt, interest bearing loans and borrowings, less cash in hand and at bank. The gearing ratios at 30th June 2017 and 2016 were as follows:
THE GROUP THE COMPANY
2017 2016 2017 2016
Rs’000 Rs’000 Rs’000 Rs’000
Debt (i) 3,967,008 4,635,786 573,857 686,147
Cash in hand and at bank (181,335) (177,293) (64,307) (99,434)
Net debt 3,785,673 4,458,493 509,550 586,733
Equity (ii) 5,794,057 6,010,852 4,075,718 3,658,528
Total capital plus debt 9,579,730 10,469,345 4,585,268 4,245,261
Gearing ratio 40% 43% 11% 14%
(i) Debt is defined as long and short term borrowings, as detailed in Note 15, including borrowing accounted as liabilities associated with assets held of sale.
(ii) Equity includes all capital and reserves of the Group and the Company.
(b) Categories of financial instruments
THE GROUP THE COMPANY
2017 2016 2017 2016
Rs’000 Rs’000 Rs’000 Rs’000
Financial assets
Available-for-sale financial assets 5 5 - -
Trade and other receivables including cash and cash equivalents and excluding prepayments
873,735 948,327 2,717,543 2,216,564
873,740 948,332 - -
Financial liabilities
Trade and other payables 855,721 951,403 1,688,753 1,483,543
Interest bearing loans and borrowings 3,967,008 4,635,786 573,857 686,167
4,822,729 5,587,189 2,262,610 2,169,710
At the reporting date there are no significant concentrations of credit risk for loans and receivables. The carrying amount reflected above represents the Group’s maximum exposure to credit risk for the trade and other receivables.
ANNUAL REPORT 2017
197
NOTES TO THE FINANCIAL STATEMENTSFOR THE YEAR ENDED 30TH JUNE 2017
37. FINANCIAL RISK MANAGEMENT OBJECTIVES AND POLICIES(a) Capital risk management
The Group manages its capital to ensure that entities in the Group will be able to continue as a going concern while maximising the return to stakeholders through the optimisation of the debt and equity balances.
The Group manages its capital structure and makes adjustment to it, in light of changes in economic conditions. In order to maintain or adjust the capital structure, the Group may adjust the amount of dividends paid to shareholders, return capital to shareholders, issue new shares or sell assets to reduce debt. No changes were made in the objectives, policies or processes during the years ended 30th June 2017 and 2016.
The Group monitors capital using a gearing ratio, which is net debt divided by total capital plus debt. The Group’s policy is to keep the gearing ratio below 45% (2016: 50%). The Group includes within net debt, interest bearing loans and borrowings, less cash in hand and at bank. The gearing ratios at 30th June 2017 and 2016 were as follows:
THE GROUP THE COMPANY
2017 2016 2017 2016
Rs’000 Rs’000 Rs’000 Rs’000
Debt (i) 3,967,008 4,635,786 573,857 686,147
Cash in hand and at bank (181,335) (177,293) (64,307) (99,434)
Net debt 3,785,673 4,458,493 509,550 586,733
Equity (ii) 5,794,057 6,010,852 4,075,718 3,658,528
Total capital plus debt 9,579,730 10,469,345 4,585,268 4,245,261
Gearing ratio 40% 43% 11% 14%
(i) Debt is defined as long and short term borrowings, as detailed in Note 15, including borrowing accounted as liabilities associated with assets held of sale.
(ii) Equity includes all capital and reserves of the Group and the Company.
(b) Categories of financial instruments
THE GROUP THE COMPANY
2017 2016 2017 2016
Rs’000 Rs’000 Rs’000 Rs’000
Financial assets
Available-for-sale financial assets 5 5 - -
Trade and other receivables including cash and cash equivalents and excluding prepayments
873,735 948,327 2,717,543 2,216,564
873,740 948,332 - -
Financial liabilities
Trade and other payables 855,721 951,403 1,688,753 1,483,543
Interest bearing loans and borrowings 3,967,008 4,635,786 573,857 686,167
4,822,729 5,587,189 2,262,610 2,169,710
At the reporting date there are no significant concentrations of credit risk for loans and receivables. The carrying amount reflected above represents the Group’s maximum exposure to credit risk for the trade and other receivables.
NOTES TO THE FINANCIAL STATEMENTSFOR THE YEAR ENDED 30TH JUNE 2017
37.FINANCIAL RISK MANAGEMENT OBJECTIVES AND POLICIES (CONT’D)
(c) Financial risk management
The Group’s Corporate Treasury function provides services to the business, co-ordinates access to domestic and international financial markets, monitors and manages the financial risks relating to the operations of the Group. These risks include market risk (currency risk, interest rate risk and price risk), credit risk and liquidity risk.
The Group’s overall risk management programme focuses on the unpredictability of financial markets and seeks to minimise potential adverse effects on Group’s financial performance. The Board of Directors reviews and agrees policies for managing each of these risks which are summarised below.
(i) Foreign currency risk management
The Group has transactional currency exposure. It is the practice in the hospitality industry to fix tariffs yearly in advance. In order to achieve stability of tariffs in the overseas markets and as a hedge against a fall in the value of the Mauritian Rupee, contracts with tour operators are denominated in the major international currencies of the markets in which the foreign tour operators belong.
A significant number of contracts are therefore denominated in Euros, Pounds Sterling and US Dollars and invoices are raised in these currencies, with above 90% of Group’s sales denominated in Euro, GBP and USD. While protecting the enterprise against any fall in the parity of the Mauritian Rupee, it exposes it to a fall in revenue should the Rupee appreciate against one or more of the international currencies.
The Group has certain investments in foreign operations, whose net assets are exposed to foreign currency risk. Currency exposure arising from the net assets of the Group’s foreign operation is managed primarily through borrowings denominated in the relevant foreign currencies.
The currency profile of the financial assets and financial liabilities, excluding equity investments in subsidiaries and retirement benefit obligations, at 30th June 2017 and at 30th June 2016 is as follows:
THE GROUP THE COMPANY
Financial assets
Financial liabilities
Financial assets
Financial liabilities
Rs’000 Rs’000 Rs’000 Rs’000
June 2017
Euro 368,929 1,048,324 601,945 246,759
Pound sterling 113,180 4,504 5,050 886
US Dollar 228,771 2,316,243 1,471,644 676,009
Other foreign currencies - 532 - -
Total foreign currencies 710,880 3,369,603 2,078,639 923,654
Mauritian Rupee 162,860 1,453,126 638,904 1,338,956
Total 873,740 4,822,729 2,717,543 2,262,610 June 2016
Euro 455,096 1,609,329 613,234 165,459
Pound sterling 94,135 63 5,614 -
US Dollar 245,807 1,904,890 860,872 770,429
Other foreign currencies - 526 - -
Total foreign currencies 795,038 3,514,808 1,479,720 935,888
Mauritian Rupee 153,294 2,072,380 736,844 1,233,821
Total 948,332 5,587,188 2,216,564 2,169,709
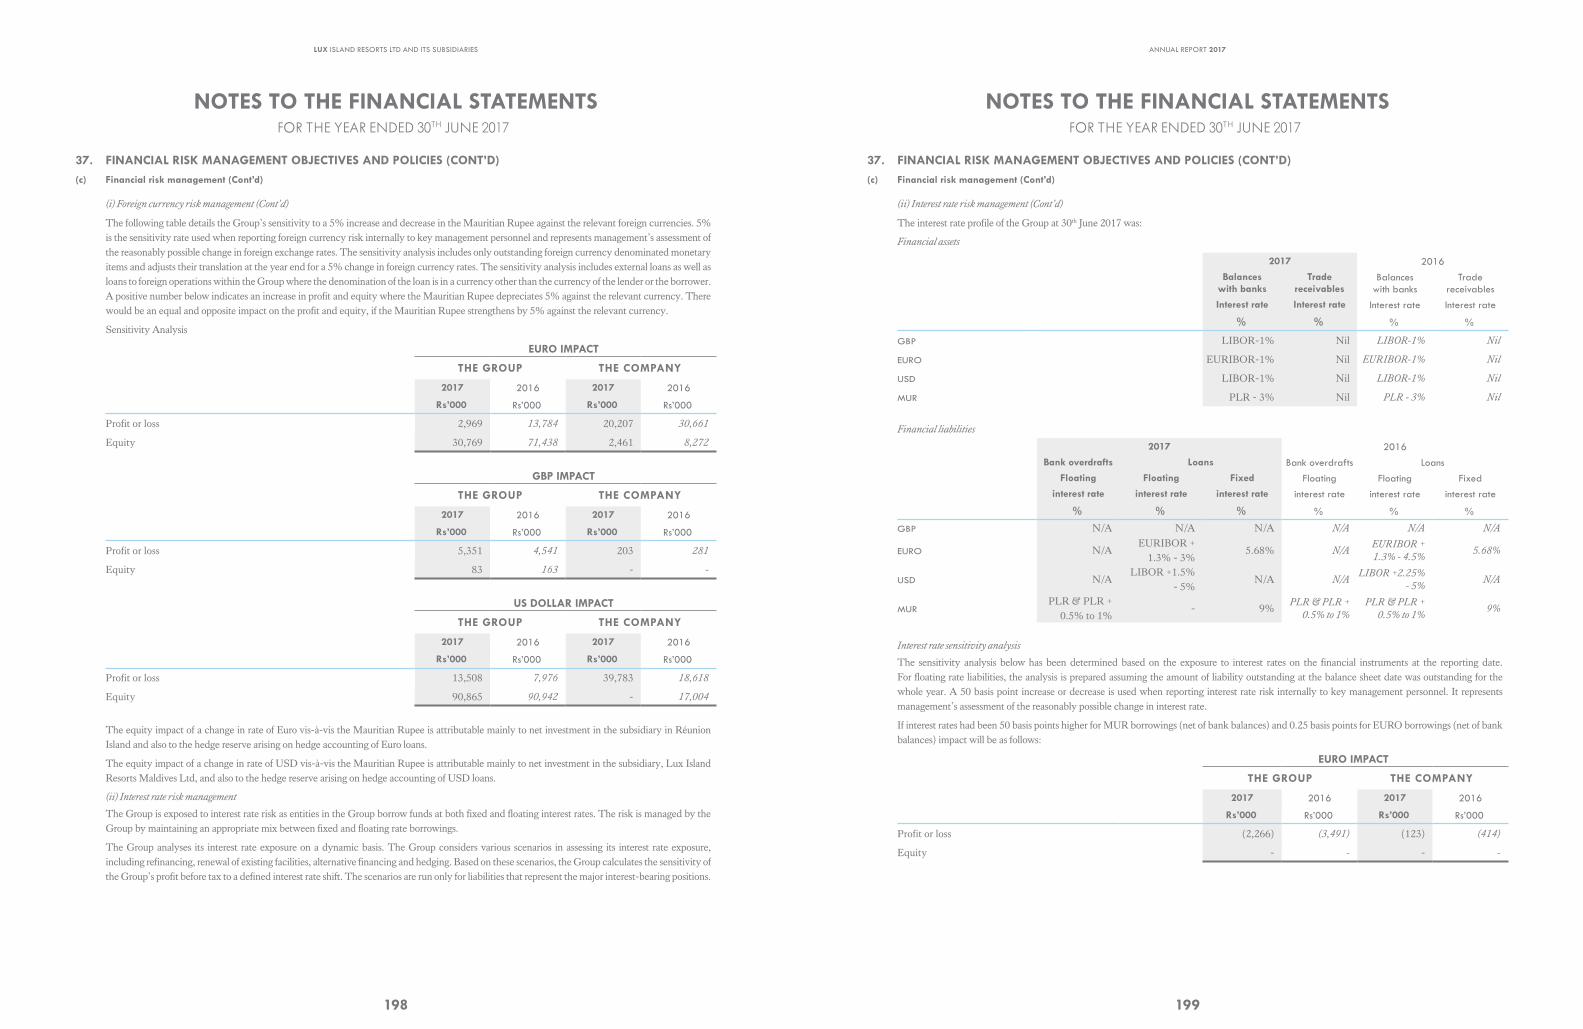
LUX ISLAND RESORTS LTD AND ITS SUBSIDIARIES
198
NOTES TO THE FINANCIAL STATEMENTSFOR THE YEAR ENDED 30TH JUNE 2017
37. FINANCIAL RISK MANAGEMENT OBJECTIVES AND POLICIES (CONT’D)(c) Financial risk management (Cont’d)
(i) Foreign currency risk management (Cont’d)
The following table details the Group’s sensitivity to a 5% increase and decrease in the Mauritian Rupee against the relevant foreign currencies. 5% is the sensitivity rate used when reporting foreign currency risk internally to key management personnel and represents management’s assessment of the reasonably possible change in foreign exchange rates. The sensitivity analysis includes only outstanding foreign currency denominated monetary items and adjusts their translation at the year end for a 5% change in foreign currency rates. The sensitivity analysis includes external loans as well as loans to foreign operations within the Group where the denomination of the loan is in a currency other than the currency of the lender or the borrower. A positive number below indicates an increase in profit and equity where the Mauritian Rupee depreciates 5% against the relevant currency. There would be an equal and opposite impact on the profit and equity, if the Mauritian Rupee strengthens by 5% against the relevant currency.
Sensitivity Analysis
EURO IMPACT
THE GROUP THE COMPANY
2017 2016 2017 2016
Rs’000 Rs’000 Rs’000 Rs’000
Profit or loss 2,969 13,784 20,207 30,661
Equity 30,769 71,438 2,461 8,272
GBP IMPACT
THE GROUP THE COMPANY
2017 2016 2017 2016
Rs’000 Rs’000 Rs’000 Rs’000
Profit or loss 5,351 4,541 203 281
Equity 83 163 - -
US DOLLAR IMPACT
THE GROUP THE COMPANY
2017 2016 2017 2016
Rs’000 Rs’000 Rs’000 Rs’000
Profit or loss 13,508 7,976 39,783 18,618
Equity 90,865 90,942 - 17,004
The equity impact of a change in rate of Euro vis-à-vis the Mauritian Rupee is attributable mainly to net investment in the subsidiary in Réunion Island and also to the hedge reserve arising on hedge accounting of Euro loans.
The equity impact of a change in rate of USD vis-à-vis the Mauritian Rupee is attributable mainly to net investment in the subsidiary, Lux Island Resorts Maldives Ltd, and also to the hedge reserve arising on hedge accounting of USD loans.
(ii) Interest rate risk management
The Group is exposed to interest rate risk as entities in the Group borrow funds at both fixed and floating interest rates. The risk is managed by the Group by maintaining an appropriate mix between fixed and floating rate borrowings.
The Group analyses its interest rate exposure on a dynamic basis. The Group considers various scenarios in assessing its interest rate exposure, including refinancing, renewal of existing facilities, alternative financing and hedging. Based on these scenarios, the Group calculates the sensitivity of the Group’s profit before tax to a defined interest rate shift. The scenarios are run only for liabilities that represent the major interest-bearing positions.
ANNUAL REPORT 2017
199
NOTES TO THE FINANCIAL STATEMENTSFOR THE YEAR ENDED 30TH JUNE 2017
37. FINANCIAL RISK MANAGEMENT OBJECTIVES AND POLICIES (CONT’D)(c) Financial risk management (Cont’d)
(i) Foreign currency risk management (Cont’d)
The following table details the Group’s sensitivity to a 5% increase and decrease in the Mauritian Rupee against the relevant foreign currencies. 5% is the sensitivity rate used when reporting foreign currency risk internally to key management personnel and represents management’s assessment of the reasonably possible change in foreign exchange rates. The sensitivity analysis includes only outstanding foreign currency denominated monetary items and adjusts their translation at the year end for a 5% change in foreign currency rates. The sensitivity analysis includes external loans as well as loans to foreign operations within the Group where the denomination of the loan is in a currency other than the currency of the lender or the borrower. A positive number below indicates an increase in profit and equity where the Mauritian Rupee depreciates 5% against the relevant currency. There would be an equal and opposite impact on the profit and equity, if the Mauritian Rupee strengthens by 5% against the relevant currency.
Sensitivity Analysis
EURO IMPACT
THE GROUP THE COMPANY
2017 2016 2017 2016
Rs’000 Rs’000 Rs’000 Rs’000
Profit or loss 2,969 13,784 20,207 30,661
Equity 30,769 71,438 2,461 8,272
GBP IMPACT
THE GROUP THE COMPANY
2017 2016 2017 2016
Rs’000 Rs’000 Rs’000 Rs’000
Profit or loss 5,351 4,541 203 281
Equity 83 163 - -
US DOLLAR IMPACT
THE GROUP THE COMPANY
2017 2016 2017 2016
Rs’000 Rs’000 Rs’000 Rs’000
Profit or loss 13,508 7,976 39,783 18,618
Equity 90,865 90,942 - 17,004
The equity impact of a change in rate of Euro vis-à-vis the Mauritian Rupee is attributable mainly to net investment in the subsidiary in Réunion Island and also to the hedge reserve arising on hedge accounting of Euro loans.
The equity impact of a change in rate of USD vis-à-vis the Mauritian Rupee is attributable mainly to net investment in the subsidiary, Lux Island Resorts Maldives Ltd, and also to the hedge reserve arising on hedge accounting of USD loans.
(ii) Interest rate risk management
The Group is exposed to interest rate risk as entities in the Group borrow funds at both fixed and floating interest rates. The risk is managed by the Group by maintaining an appropriate mix between fixed and floating rate borrowings.
The Group analyses its interest rate exposure on a dynamic basis. The Group considers various scenarios in assessing its interest rate exposure, including refinancing, renewal of existing facilities, alternative financing and hedging. Based on these scenarios, the Group calculates the sensitivity of the Group’s profit before tax to a defined interest rate shift. The scenarios are run only for liabilities that represent the major interest-bearing positions.
NOTES TO THE FINANCIAL STATEMENTSFOR THE YEAR ENDED 30TH JUNE 2017
37. FINANCIAL RISK MANAGEMENT OBJECTIVES AND POLICIES (CONT’D)(c) Financial risk management (Cont’d)
(ii) Interest rate risk management (Cont’d)
The interest rate profile of the Group at 30th June 2017 was:
Financial assets
2017 2016
Balances with banks
Trade receivables
Balances with banks
Trade receivables
Interest rate Interest rate Interest rate Interest rate
% % % %
GBP LIBOR-1% Nil LIBOR-1% Nil
EURO EURIBOR-1% Nil EURIBOR-1% Nil
USD LIBOR-1% Nil LIBOR-1% Nil
MUR PLR - 3% Nil PLR - 3% Nil
Financial liabilities
2017 2016
Bank overdrafts Loans Bank overdrafts Loans
Floating Floating Fixed Floating Floating Fixed
interest rate interest rate interest rate interest rate interest rate interest rate
% % % % % %
GBP N/A N/A N/A N/A N/A N/A
EURO N/A EURIBOR +
1.3% - 3% 5.68% N/A
EURIBOR +
1.3% - 4.5% 5.68%
USD N/A LIBOR +1.5%
- 5% N/A N/A
LIBOR +2.25%
- 5% N/A
MUR PLR & PLR +
0.5% to 1% - 9%
PLR & PLR +
0.5% to 1%
PLR & PLR +
0.5% to 1% 9%
Interest rate sensitivity analysis
The sensitivity analysis below has been determined based on the exposure to interest rates on the financial instruments at the reporting date. For floating rate liabilities, the analysis is prepared assuming the amount of liability outstanding at the balance sheet date was outstanding for the whole year. A 50 basis point increase or decrease is used when reporting interest rate risk internally to key management personnel. It represents management’s assessment of the reasonably possible change in interest rate.
If interest rates had been 50 basis points higher for MUR borrowings (net of bank balances) and 0.25 basis points for EURO borrowings (net of bank balances) impact will be as follows:
EURO IMPACT
THE GROUP THE COMPANY
2017 2016 2017 2016
Rs’000 Rs’000 Rs’000 Rs’000
Profit or loss (2,266) (3,491) (123) (414)
Equity - - - -
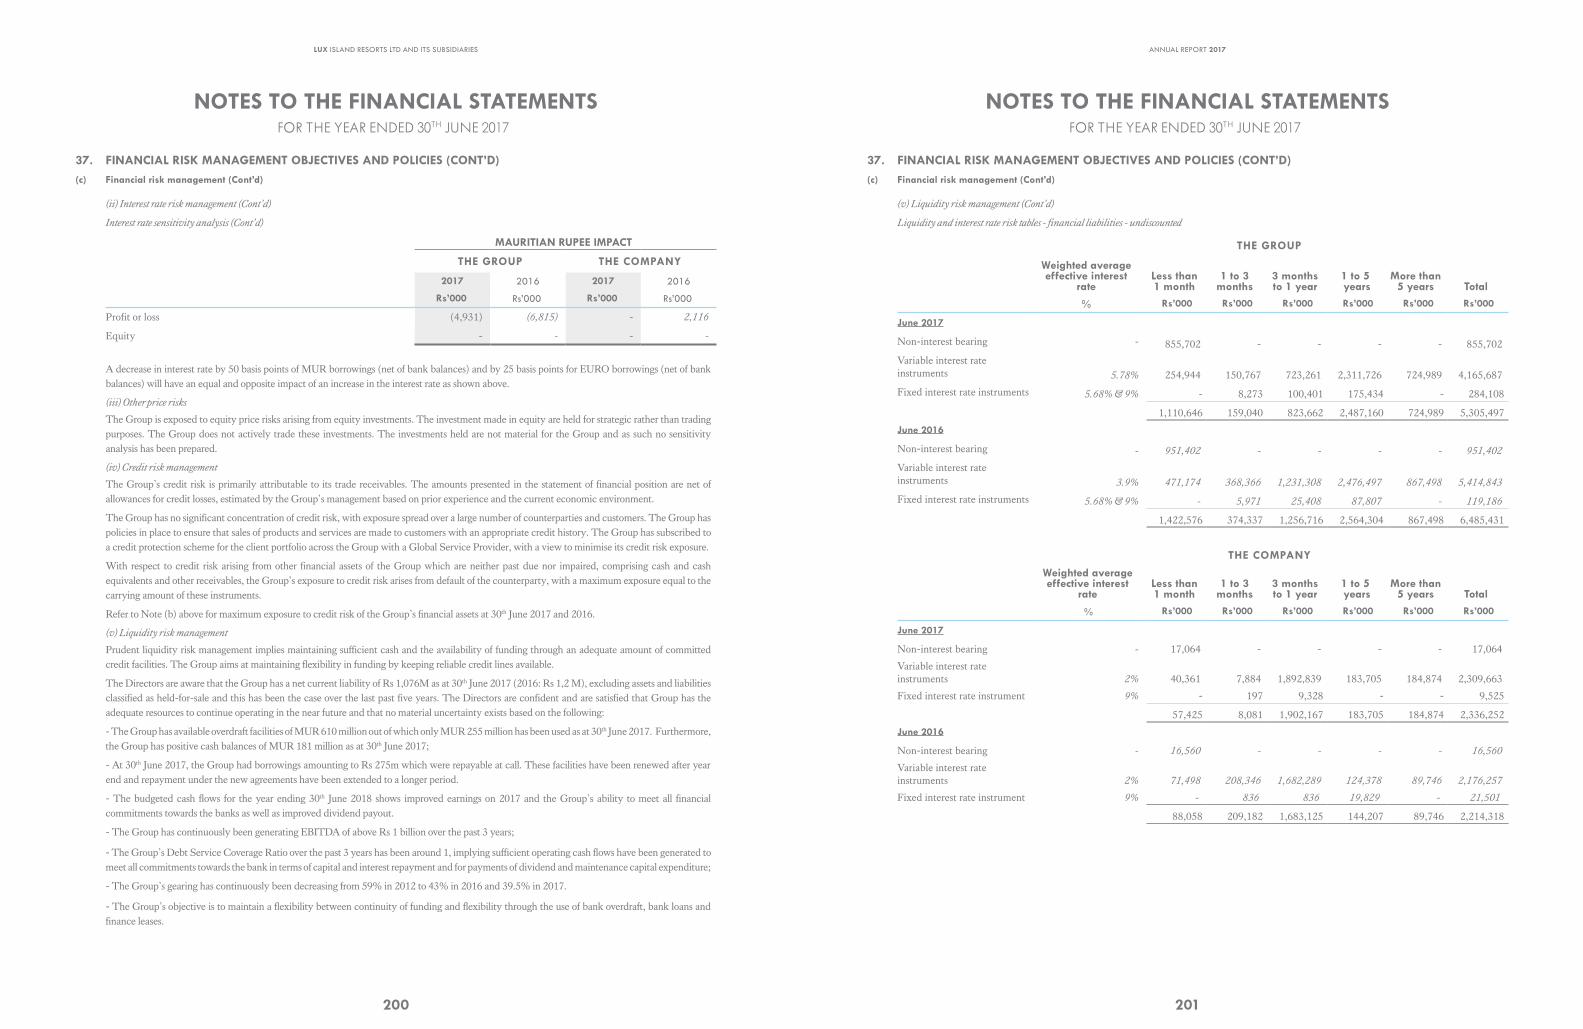
LUX ISLAND RESORTS LTD AND ITS SUBSIDIARIES
200
NOTES TO THE FINANCIAL STATEMENTS FOR THE YEAR ENDED 30TH JUNE 2017
37. FINANCIAL RISK MANAGEMENT OBJECTIVES AND POLICIES (CONT’D)(c) Financial risk management (Cont’d)
(ii) Interest rate risk management (Cont’d)
Interest rate sensitivity analysis (Cont’d)
MAURITIAN RUPEE IMPACT
THE GROUP THE COMPANY
2017 2016 2017 2016
Rs’000 Rs’000 Rs’000 Rs’000
Profit or loss (4,931) (6,815) - 2,116
Equity - - - -
A decrease in interest rate by 50 basis points of MUR borrowings (net of bank balances) and by 25 basis points for EURO borrowings (net of bank balances) will have an equal and opposite impact of an increase in the interest rate as shown above.
(iii) Other price risks
The Group is exposed to equity price risks arising from equity investments. The investment made in equity are held for strategic rather than trading purposes. The Group does not actively trade these investments. The investments held are not material for the Group and as such no sensitivity analysis has been prepared.
(iv) Credit risk management
The Group’s credit risk is primarily attributable to its trade receivables. The amounts presented in the statement of financial position are net of allowances for credit losses, estimated by the Group’s management based on prior experience and the current economic environment.
The Group has no significant concentration of credit risk, with exposure spread over a large number of counterparties and customers. The Group has policies in place to ensure that sales of products and services are made to customers with an appropriate credit history. The Group has subscribed to a credit protection scheme for the client portfolio across the Group with a Global Service Provider, with a view to minimise its credit risk exposure.
With respect to credit risk arising from other financial assets of the Group which are neither past due nor impaired, comprising cash and cash equivalents and other receivables, the Group’s exposure to credit risk arises from default of the counterparty, with a maximum exposure equal to the carrying amount of these instruments.
Refer to Note (b) above for maximum exposure to credit risk of the Group’s financial assets at 30th June 2017 and 2016.
(v) Liquidity risk management
Prudent liquidity risk management implies maintaining sufficient cash and the availability of funding through an adequate amount of committed credit facilities. The Group aims at maintaining flexibility in funding by keeping reliable credit lines available.
The Directors are aware that the Group has a net current liability of Rs 1,076M as at 30th June 2017 (2016: Rs 1,2 M), excluding assets and liabilities classified as held-for-sale and this has been the case over the last past five years. The Directors are confident and are satisfied that Group has the adequate resources to continue operating in the near future and that no material uncertainty exists based on the following:
- The Group has available overdraft facilities of MUR 610 million out of which only MUR 255 million has been used as at 30th June 2017. Furthermore, the Group has positive cash balances of MUR 181 million as at 30th June 2017;
- At 30th June 2017, the Group had borrowings amounting to Rs 275m which were repayable at call. These facilities have been renewed after year end and repayment under the new agreements have been extended to a longer period.
- The budgeted cash flows for the year ending 30th June 2018 shows improved earnings on 2017 and the Group’s ability to meet all financial commitments towards the banks as well as improved dividend payout.
- The Group has continuously been generating EBITDA of above Rs 1 billion over the past 3 years;
- The Group’s Debt Service Coverage Ratio over the past 3 years has been around 1, implying sufficient operating cash flows have been generated to meet all commitments towards the bank in terms of capital and interest repayment and for payments of dividend and maintenance capital expenditure;
- The Group’s gearing has continuously been decreasing from 59% in 2012 to 43% in 2016 and 39.5% in 2017.
- The Group’s objective is to maintain a flexibility between continuity of funding and flexibility through the use of bank overdraft, bank loans and finance leases.
ANNUAL REPORT 2017
201
NOTES TO THE FINANCIAL STATEMENTS FOR THE YEAR ENDED 30TH JUNE 2017
37. FINANCIAL RISK MANAGEMENT OBJECTIVES AND POLICIES (CONT’D)(c) Financial risk management (Cont’d)
(v) Liquidity risk management (Cont’d)
Liquidity and interest rate risk tables - financial liabilities - undiscounted
THE GROUP
Weighted average effective interest
rateLess than 1 month
1 to 3 months
3 months to 1 year
1 to 5 years
More than 5 years Total
% Rs’000 Rs’000 Rs’000 Rs’000 Rs’000 Rs’000
June 2017
Non-interest bearing - 855,702 - - - - 855,702
Variable interest rate instruments 5.78% 254,944 150,767 723,261 2,311,726 724,989 4,165,687
Fixed interest rate instruments 5.68% & 9% - 8,273 100,401 175,434 - 284,108
1,110,646 159,040 823,662 2,487,160 724,989 5,305,497
June 2016
Non-interest bearing - 951,402 - - - - 951,402
Variable interest rate instruments 3.9% 471,174 368,366 1,231,308 2,476,497 867,498 5,414,843
Fixed interest rate instruments 5.68% & 9% - 5,971 25,408 87,807 - 119,186
1,422,576 374,337 1,256,716 2,564,304 867,498 6,485,431
THE COMPANY
Weighted average effective interest
rateLess than 1 month
1 to 3 months
3 months to 1 year
1 to 5 years
More than 5 years Total
% Rs’000 Rs’000 Rs’000 Rs’000 Rs’000 Rs’000
June 2017
Non-interest bearing - 17,064 - - - - 17,064
Variable interest rate instruments 2% 40,361 7,884 1,892,839 183,705 184,874 2,309,663
Fixed interest rate instrument 9% - 197 9,328 - - 9,525
57,425 8,081 1,902,167 183,705 184,874 2,336,252
June 2016
Non-interest bearing - 16,560 - - - - 16,560
Variable interest rate instruments 2% 71,498 208,346 1,682,289 124,378 89,746 2,176,257
Fixed interest rate instrument 9% - 836 836 19,829 - 21,501
88,058 209,182 1,683,125 144,207 89,746 2,214,318
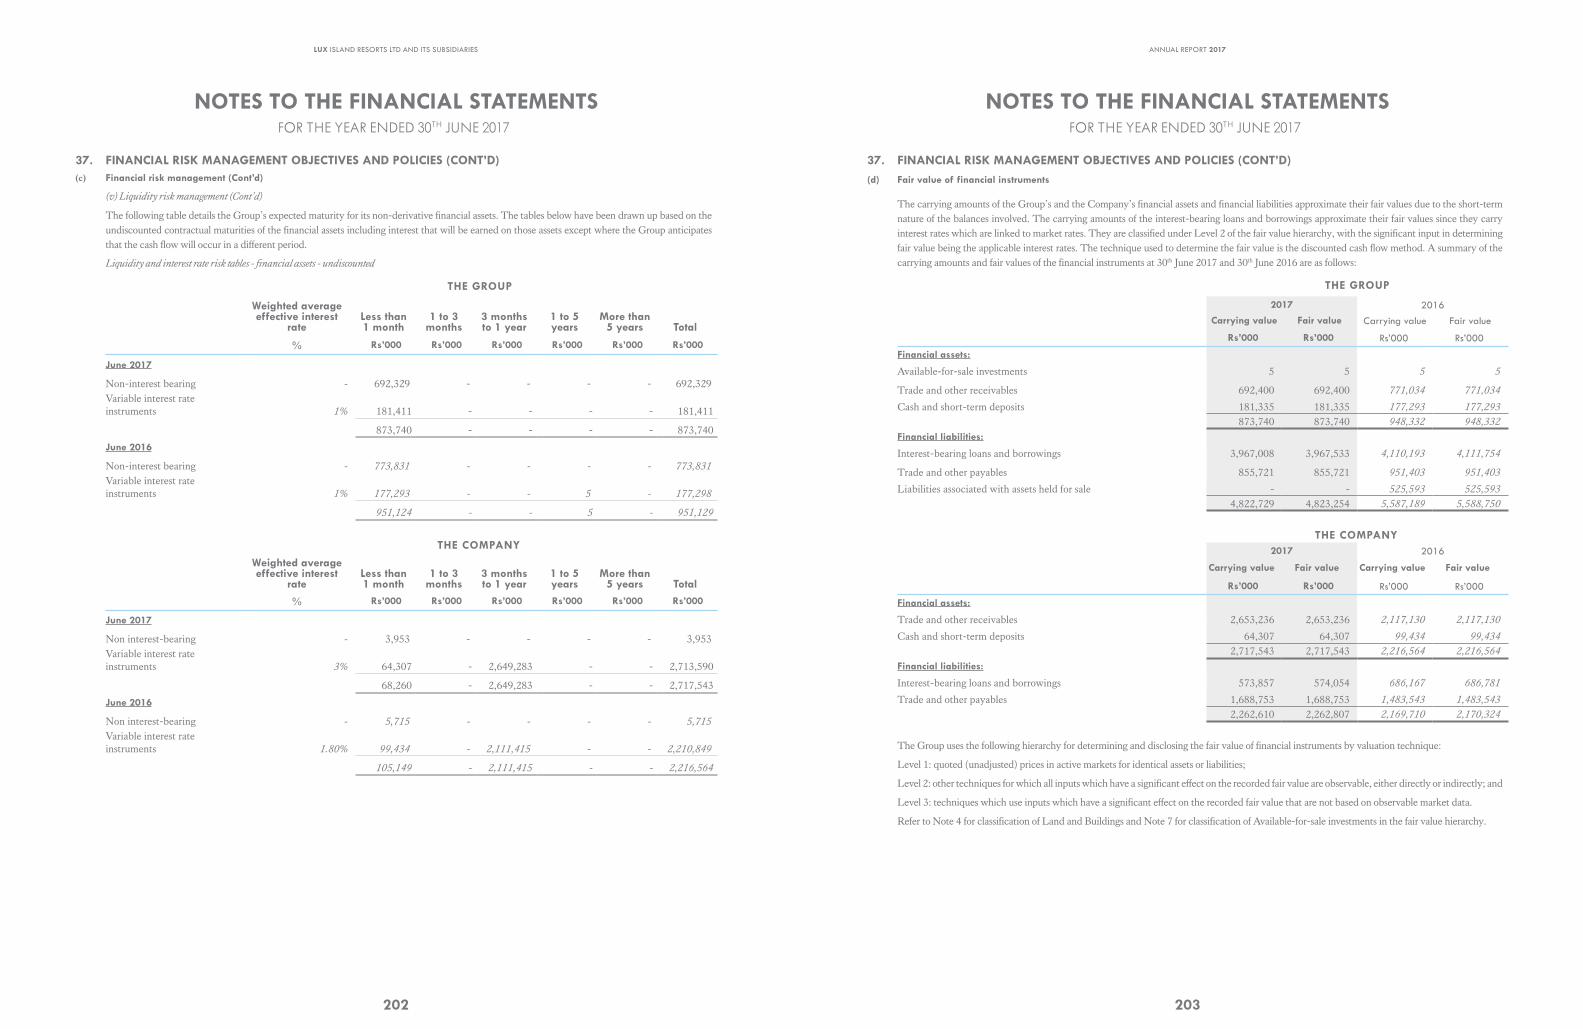
LUX ISLAND RESORTS LTD AND ITS SUBSIDIARIES
202
NOTES TO THE FINANCIAL STATEMENTSFOR THE YEAR ENDED 30TH JUNE 2017
37. FINANCIAL RISK MANAGEMENT OBJECTIVES AND POLICIES (CONT’D)(c) Financial risk management (Cont’d)
(v) Liquidity risk management (Cont’d)
The following table details the Group’s expected maturity for its non-derivative financial assets. The tables below have been drawn up based on the undiscounted contractual maturities of the financial assets including interest that will be earned on those assets except where the Group anticipates that the cash flow will occur in a different period.
Liquidity and interest rate risk tables - financial assets - undiscounted
THE GROUP
Weighted average effective interest
rateLess than 1 month
1 to 3 months
3 months to 1 year
1 to 5 years
More than 5 years Total
% Rs’000 Rs’000 Rs’000 Rs’000 Rs’000 Rs’000
June 2017
Non-interest bearing - 692,329 - - - - 692,329 Variable interest rate instruments 1% 181,411 - - - - 181,411
873,740 - - - - 873,740
June 2016
Non-interest bearing - 773,831 - - - - 773,831
Variable interest rate instruments 1% 177,293 - - 5 - 177,298
951,124 - - 5 - 951,129
THE COMPANY
Weighted average effective interest
rateLess than 1 month
1 to 3 months
3 months to 1 year
1 to 5 years
More than 5 years Total
% Rs’000 Rs’000 Rs’000 Rs’000 Rs’000 Rs’000
June 2017
Non interest-bearing - 3,953 - - - - 3,953 Variable interest rate instruments 3% 64,307 - 2,649,283 - - 2,713,590
68,260 - 2,649,283 - - 2,717,543
June 2016
Non interest-bearing - 5,715 - - - - 5,715
Variable interest rate instruments 1.80% 99,434 - 2,111,415 - - 2,210,849
105,149 - 2,111,415 - - 2,216,564
ANNUAL REPORT 2017
203
NOTES TO THE FINANCIAL STATEMENTS FOR THE YEAR ENDED 30TH JUNE 2017
37. FINANCIAL RISK MANAGEMENT OBJECTIVES AND POLICIES (CONT’D)(d) Fair value of financial instruments
The carrying amounts of the Group’s and the Company’s financial assets and financial liabilities approximate their fair values due to the short-term nature of the balances involved. The carrying amounts of the interest-bearing loans and borrowings approximate their fair values since they carry interest rates which are linked to market rates. They are classified under Level 2 of the fair value hierarchy, with the significant input in determining fair value being the applicable interest rates. The technique used to determine the fair value is the discounted cash flow method. A summary of the carrying amounts and fair values of the financial instruments at 30th June 2017 and 30th June 2016 are as follows:
THE GROUP
2017 2016
Carrying value Fair value Carrying value Fair value
Rs’000 Rs’000 Rs’000 Rs’000
Financial assets:
Available-for-sale investments 5 5 5 5
Trade and other receivables 692,400 692,400 771,034 771,034
Cash and short-term deposits 181,335 181,335 177,293 177,293
873,740 873,740 948,332 948,332
Financial liabilities:
Interest-bearing loans and borrowings 3,967,008 3,967,533 4,110,193 4,111,754
Trade and other payables 855,721 855,721 951,403 951,403
Liabilities associated with assets held for sale - - 525,593 525,593
4,822,729 4,823,254 5,587,189 5,588,750
THE COMPANY2017 2016
Carrying value Fair value Carrying value Fair value
Rs’000 Rs’000 Rs’000 Rs’000
Financial assets:
Trade and other receivables 2,653,236 2,653,236 2,117,130 2,117,130
Cash and short-term deposits 64,307 64,307 99,434 99,434
2,717,543 2,717,543 2,216,564 2,216,564
Financial liabilities:
Interest-bearing loans and borrowings 573,857 574,054 686,167 686,781
Trade and other payables 1,688,753 1,688,753 1,483,543 1,483,543
2,262,610 2,262,807 2,169,710 2,170,324
The Group uses the following hierarchy for determining and disclosing the fair value of financial instruments by valuation technique:
Level 1: quoted (unadjusted) prices in active markets for identical assets or liabilities;
Level 2: other techniques for which all inputs which have a significant effect on the recorded fair value are observable, either directly or indirectly; and
Level 3: techniques which use inputs which have a significant effect on the recorded fair value that are not based on observable market data.
Refer to Note 4 for classification of Land and Buildings and Note 7 for classification of Available-for-sale investments in the fair value hierarchy.
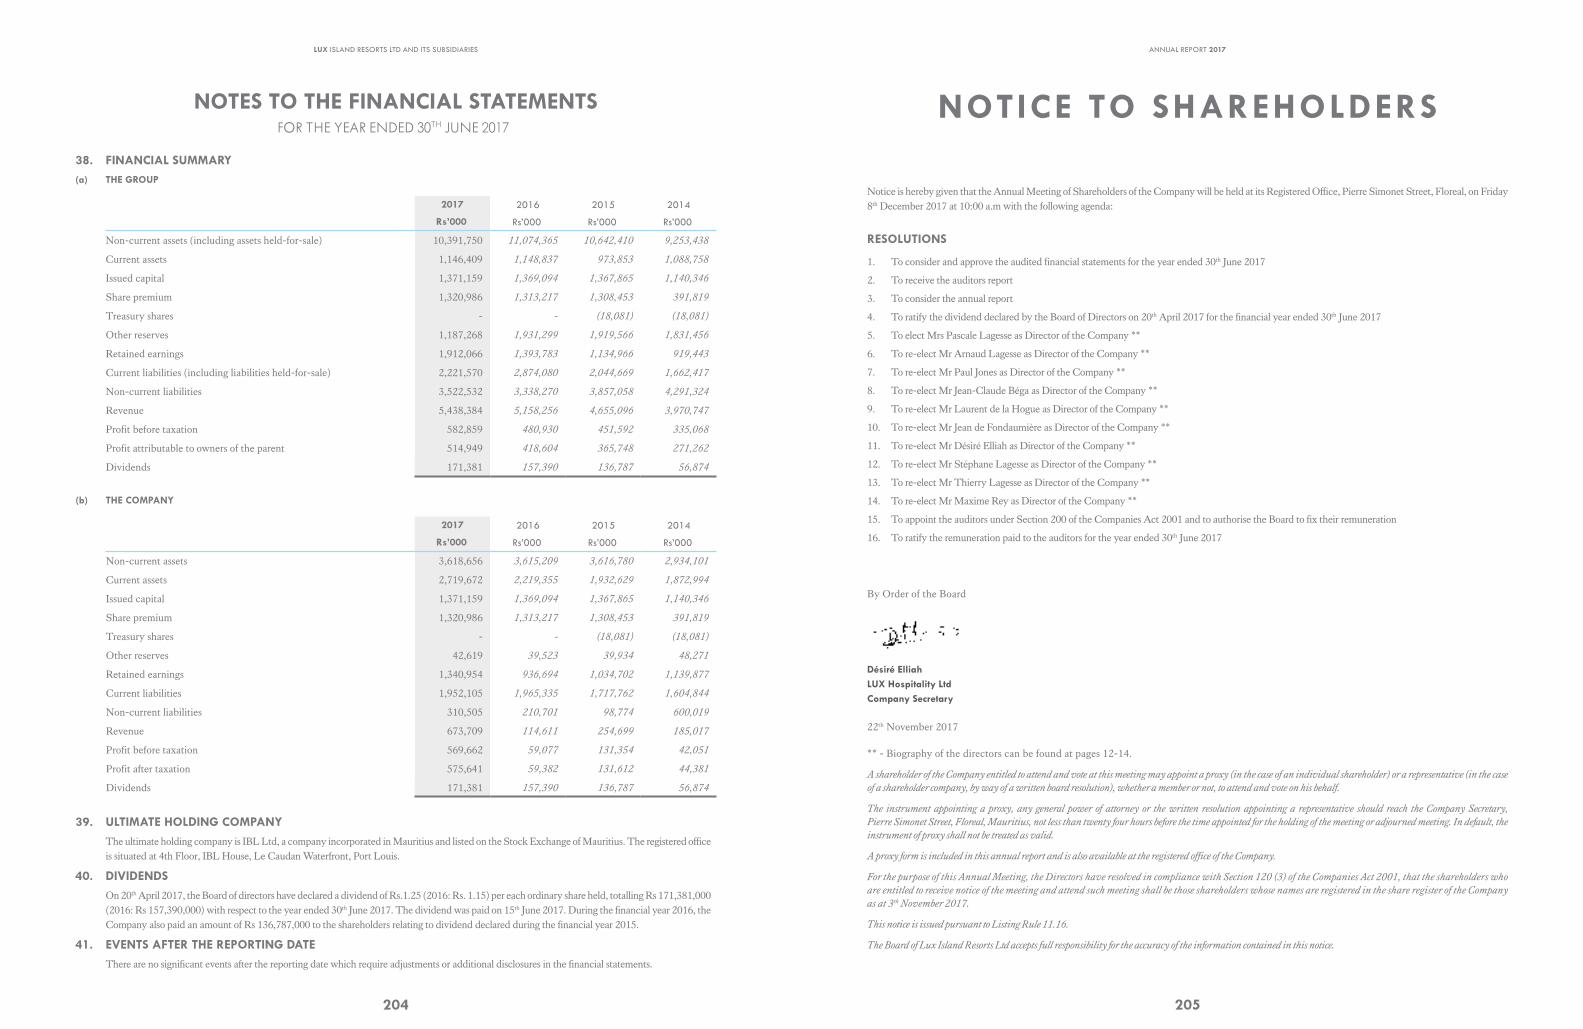
LUX ISLAND RESORTS LTD AND ITS SUBSIDIARIES
204
NOTES TO THE FINANCIAL STATEMENTS FOR THE YEAR ENDED 30TH JUNE 2017
38. FINANCIAL SUMMARY(a) THE GROUP
2017 2016 2015 2014
Rs’000 Rs’000 Rs’000 Rs’000
Non-current assets (including assets held-for-sale) 10,391,750 11,074,365 10,642,410 9,253,438
Current assets 1,146,409 1,148,837 973,853 1,088,758
Issued capital 1,371,159 1,369,094 1,367,865 1,140,346
Share premium 1,320,986 1,313,217 1,308,453 391,819
Treasury shares - - (18,081) (18,081)
Other reserves 1,187,268 1,931,299 1,919,566 1,831,456
Retained earnings 1,912,066 1,393,783 1,134,966 919,443
Current liabilities (including liabilities held-for-sale) 2,221,570 2,874,080 2,044,669 1,662,417
Non-current liabilities 3,522,532 3,338,270 3,857,058 4,291,324
Revenue 5,438,384 5,158,256 4,655,096 3,970,747
Profit before taxation 582,859 480,930 451,592 335,068
Profit attributable to owners of the parent 514,949 418,604 365,748 271,262
Dividends 171,381 157,390 136,787 56,874
(b) THE COMPANY
2017 2016 2015 2014
Rs’000 Rs’000 Rs’000 Rs’000
Non-current assets 3,618,656 3,615,209 3,616,780 2,934,101
Current assets 2,719,672 2,219,355 1,932,629 1,872,994
Issued capital 1,371,159 1,369,094 1,367,865 1,140,346
Share premium 1,320,986 1,313,217 1,308,453 391,819
Treasury shares - - (18,081) (18,081)
Other reserves 42,619 39,523 39,934 48,271
Retained earnings 1,340,954 936,694 1,034,702 1,139,877
Current liabilities 1,952,105 1,965,335 1,717,762 1,604,844
Non-current liabilities 310,505 210,701 98,774 600,019
Revenue 673,709 114,611 254,699 185,017
Profit before taxation 569,662 59,077 131,354 42,051
Profit after taxation 575,641 59,382 131,612 44,381
Dividends 171,381 157,390 136,787 56,874
39. ULTIMATE HOLDING COMPANYThe ultimate holding company is IBL Ltd, a company incorporated in Mauritius and listed on the Stock Exchange of Mauritius. The registered office is situated at 4th Floor, IBL House, Le Caudan Waterfront, Port Louis.
40. DIVIDENDSOn 20th April 2017, the Board of directors have declared a dividend of Rs.1.25 (2016: Rs. 1.15) per each ordinary share held, totalling Rs 171,381,000 (2016: Rs 157,390,000) with respect to the year ended 30th June 2017. The dividend was paid on 15th June 2017. During the financial year 2016, the Company also paid an amount of Rs 136,787,000 to the shareholders relating to dividend declared during the financial year 2015.
41. EVENTS AFTER THE REPORTING DATEThere are no significant events after the reporting date which require adjustments or additional disclosures in the financial statements.
ANNUAL REPORT 2017
205
Notice is hereby given that the Annual Meeting of Shareholders of the Company will be held at its Registered Office, Pierre Simonet Street, Floreal, on Friday 8th December 2017 at 10:00 a.m with the following agenda:
RESOLUTIONS
1. To consider and approve the audited financial statements for the year ended 30th June 2017
2. To receive the auditors report
3. To consider the annual report
4. To ratify the dividend declared by the Board of Directors on 20th April 2017 for the financial year ended 30th June 2017
5. To elect Mrs Pascale Lagesse as Director of the Company **
6. To re-elect Mr Arnaud Lagesse as Director of the Company **
7. To re-elect Mr Paul Jones as Director of the Company **
8. To re-elect Mr Jean-Claude Béga as Director of the Company **
9. To re-elect Mr Laurent de la Hogue as Director of the Company **
10. To re-elect Mr Jean de Fondaumière as Director of the Company **
11. To re-elect Mr Désiré Elliah as Director of the Company **
12. To re-elect Mr Stéphane Lagesse as Director of the Company **
13. To re-elect Mr Thierry Lagesse as Director of the Company **
14. To re-elect Mr Maxime Rey as Director of the Company **
15. To appoint the auditors under Section 200 of the Companies Act 2001 and to authorise the Board to fix their remuneration
16. To ratify the remuneration paid to the auditors for the year ended 30th June 2017
By Order of the Board
Désiré ElliahLUX Hospitality LtdCompany Secretary
22th November 2017
** - Biography of the directors can be found at pages 12-14.
A shareholder of the Company entitled to attend and vote at this meeting may appoint a proxy (in the case of an individual shareholder) or a representative (in the case
of a shareholder company, by way of a written board resolution), whether a member or not, to attend and vote on his behalf.
The instrument appointing a proxy, any general power of attorney or the written resolution appointing a representative should reach the Company Secretary,
Pierre Simonet Street, Floreal, Mauritius, not less than twenty four hours before the time appointed for the holding of the meeting or adjourned meeting. In default, the
instrument of proxy shall not be treated as valid.
A proxy form is included in this annual report and is also available at the registered office of the Company.
For the purpose of this Annual Meeting, the Directors have resolved in compliance with Section 120 (3) of the Companies Act 2001, that the shareholders who
are entitled to receive notice of the meeting and attend such meeting shall be those shareholders whose names are registered in the share register of the Company
as at 3th November 2017.
This notice is issued pursuant to Listing Rule 11.16.
The Board of Lux Island Resorts Ltd accepts full responsibility for the accuracy of the information contained in this notice.
NOTICE TO SHAREHOLDERS
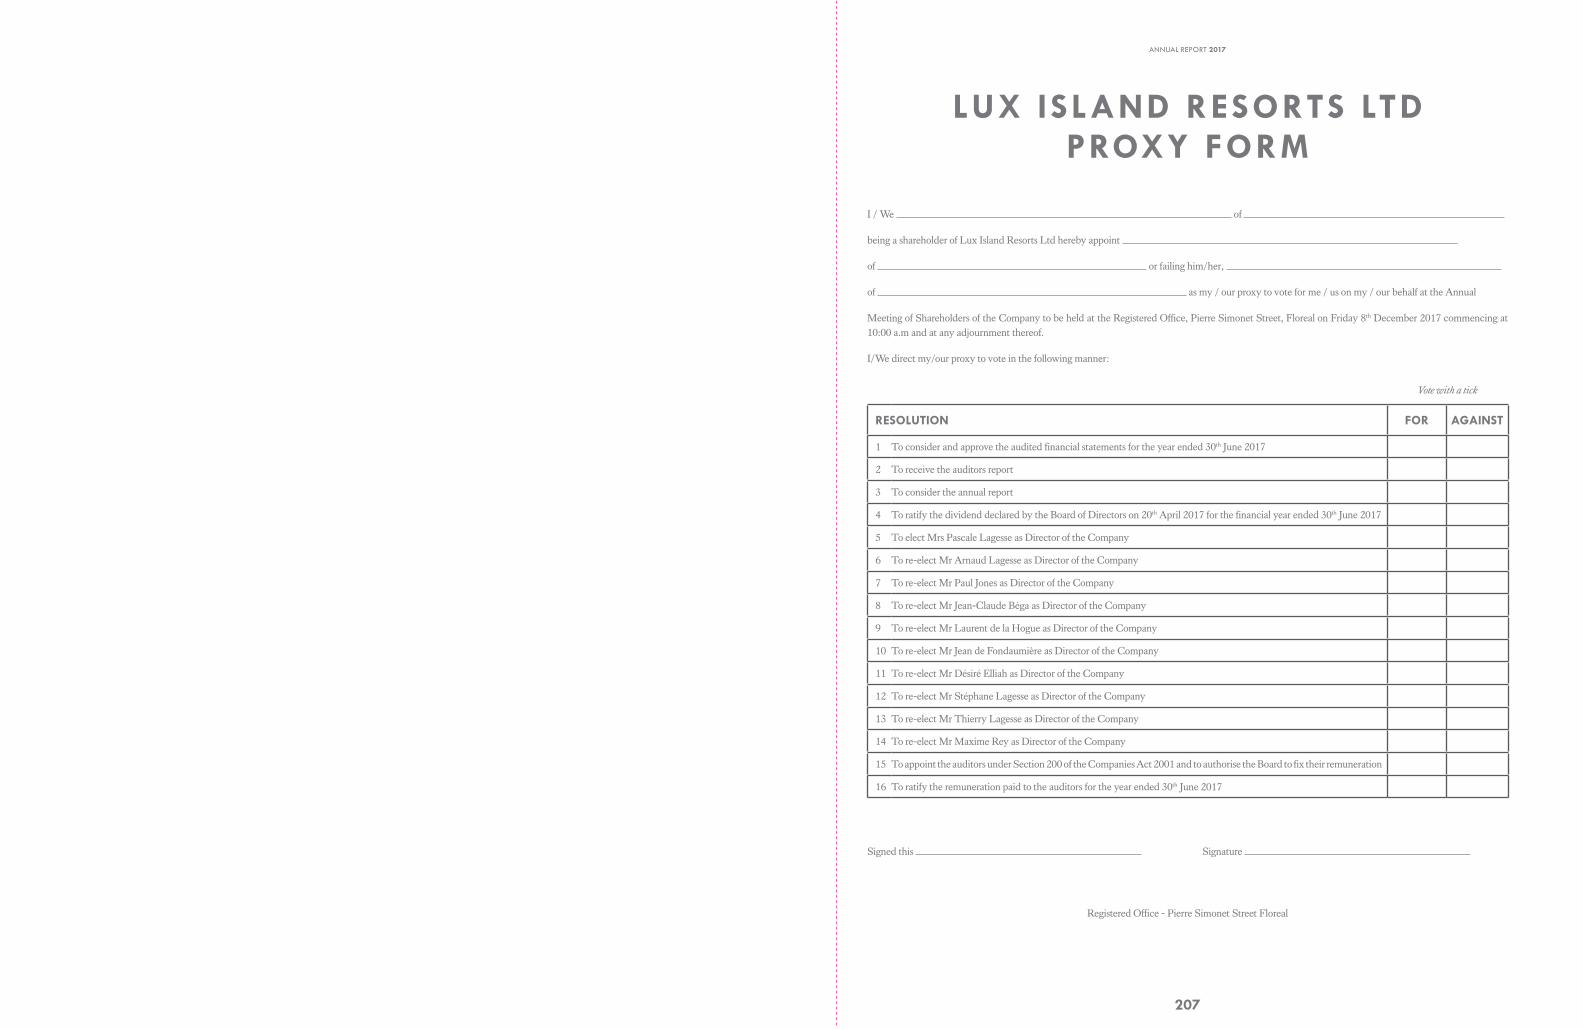
ANNUAL REPORT 2017
207
LUX ISLAND RESORTS LTDPROXY FORM
I / We of
being a shareholder of Lux Island Resorts Ltd hereby appoint
of or failing him/her,
of as my / our proxy to vote for me / us on my / our behalf at the Annual
Meeting of Shareholders of the Company to be held at the Registered Office, Pierre Simonet Street, Floreal on Friday 8th December 2017 commencing at 10:00 a.m and at any adjournment thereof.
I/We direct my/our proxy to vote in the following manner:
Vote with a tick
RESOLUTION FOR AGAINST
1 To consider and approve the audited financial statements for the year ended 30th June 2017
2 To receive the auditors report
3 To consider the annual report
4 To ratify the dividend declared by the Board of Directors on 20th April 2017 for the financial year ended 30th June 2017
5 To elect Mrs Pascale Lagesse as Director of the Company
6 To re-elect Mr Arnaud Lagesse as Director of the Company
7 To re-elect Mr Paul Jones as Director of the Company
8 To re-elect Mr Jean-Claude Béga as Director of the Company
9 To re-elect Mr Laurent de la Hogue as Director of the Company
10 To re-elect Mr Jean de Fondaumière as Director of the Company
11 To re-elect Mr Désiré Elliah as Director of the Company
12 To re-elect Mr Stéphane Lagesse as Director of the Company
13 To re-elect Mr Thierry Lagesse as Director of the Company
14 To re-elect Mr Maxime Rey as Director of the Company
15 To appoint the auditors under Section 200 of the Companies Act 2001 and to authorise the Board to fix their remuneration
16 To ratify the remuneration paid to the auditors for the year ended 30th June 2017
Signed this Signature
Registered Office - Pierre Simonet Street Floreal
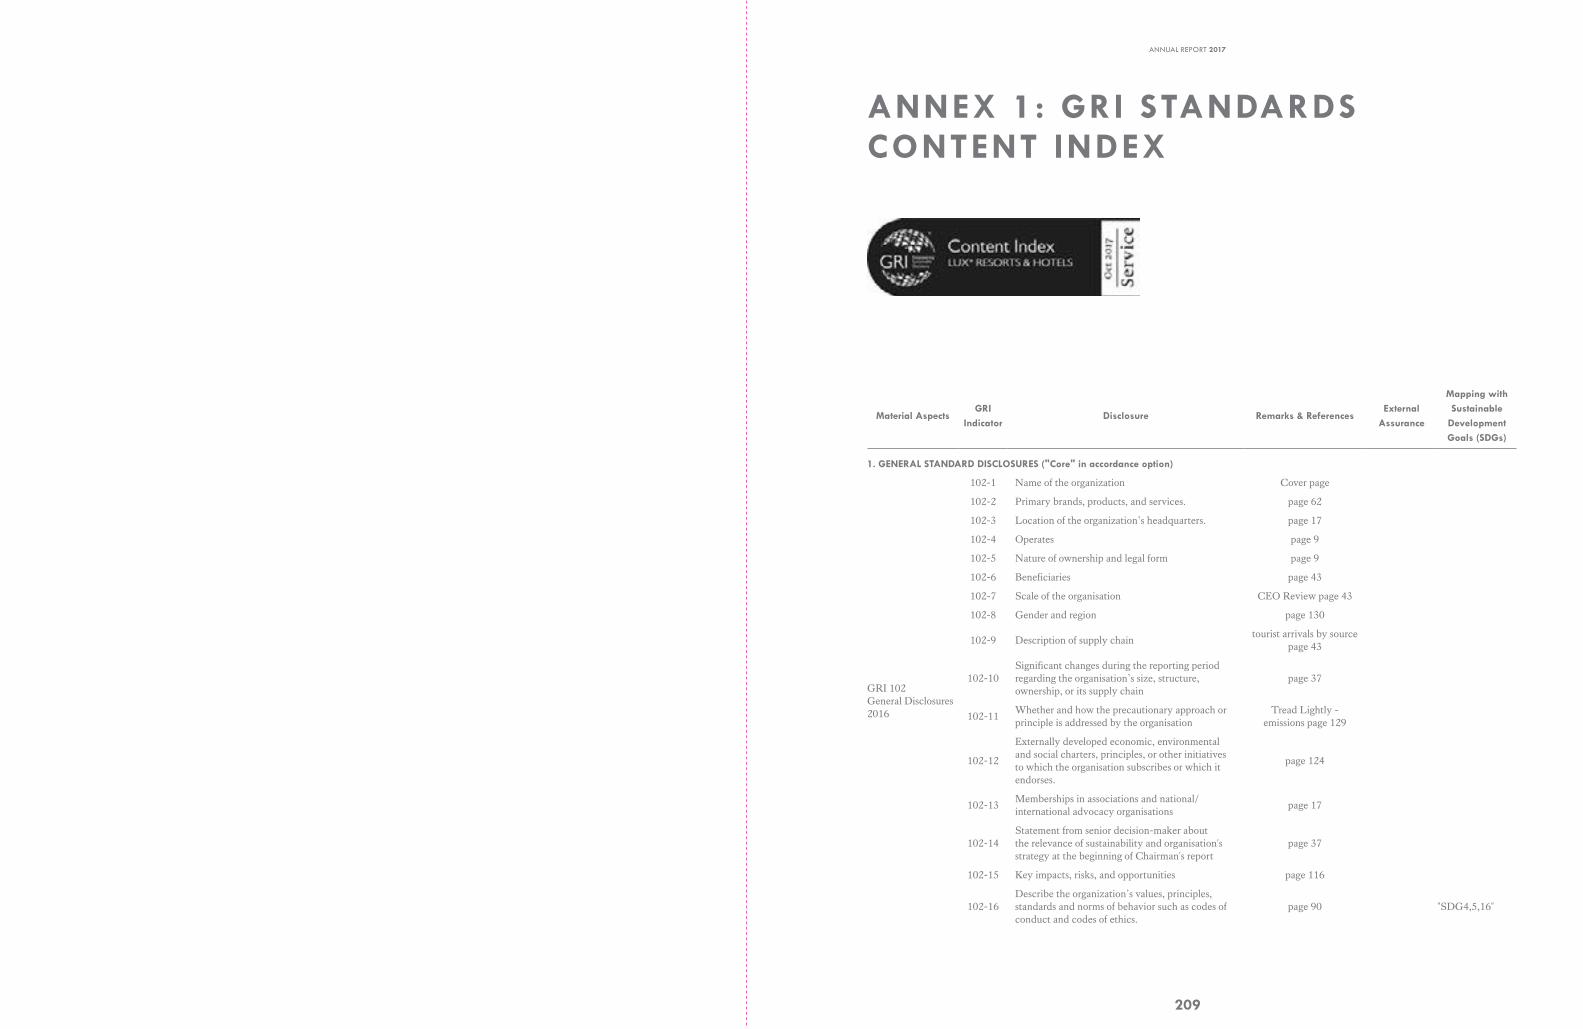
ANNUAL REPORT 2017
209
ANNEX 1: GRI STANDARDS CONTENT INDEX
Material AspectsGRI
IndicatorDisclosure Remarks & References
External Assurance
Mapping with Sustainable
Development Goals (SDGs)
1. GENERAL STANDARD DISCLOSURES ("Core" in accordance option)
GRI 102General Disclosures 2016
102-1 Name of the organization Cover page
102-2 Primary brands, products, and services. page 62
102-3 Location of the organization’s headquarters. page 17
102-4 Operates page 9
102-5 Nature of ownership and legal form page 9
102-6 Beneficiaries page 43
102-7 Scale of the organisation CEO Review page 43
102-8 Gender and region page 130
102-9 Description of supply chaintourist arrivals by source
page 43
102-10Significant changes during the reporting period regarding the organisation’s size, structure, ownership, or its supply chain
page 37
102-11Whether and how the precautionary approach or principle is addressed by the organisation
Tread Lightly - emissions page 129
102-12
Externally developed economic, environmental and social charters, principles, or other initiatives to which the organisation subscribes or which it endorses.
page 124
102-13Memberships in associations and national/ international advocacy organisations
page 17
102-14Statement from senior decision-maker about the relevance of sustainability and organisation's strategy at the beginning of Chairman's report
page 37
102-15 Key impacts, risks, and opportunities page 116
102-16Describe the organization’s values, principles, standards and norms of behavior such as codes of conduct and codes of ethics.
page 90 "SDG4,5,16"
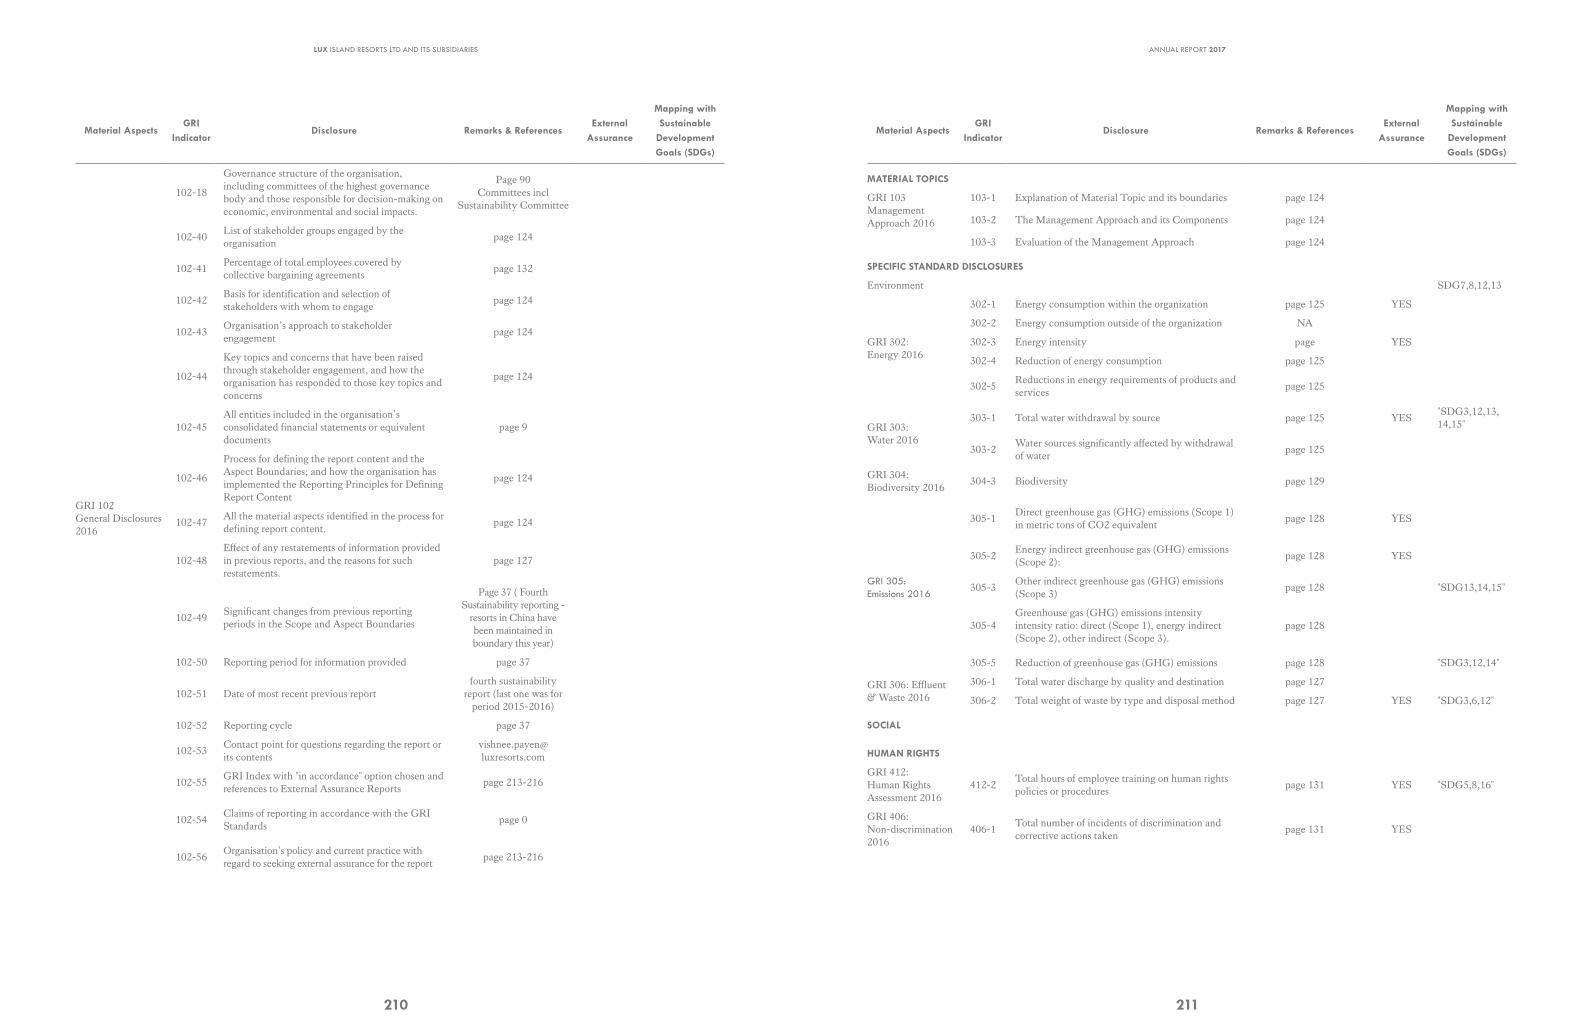
LUX ISLAND RESORTS LTD AND ITS SUBSIDIARIES
210
Material AspectsGRI
IndicatorDisclosure Remarks & References
External Assurance
Mapping with Sustainable
Development Goals (SDGs)
GRI 102General Disclosures 2016
102-18
Governance structure of the organisation, including committees of the highest governance body and those responsible for decision-making on economic, environmental and social impacts.
Page 90Committees incl
Sustainability Committee
102-40List of stakeholder groups engaged by the organisation
page 124
102-41Percentage of total employees covered by collective bargaining agreements
page 132
102-42Basis for identification and selection of stakeholders with whom to engage
page 124
102-43Organisation’s approach to stakeholder engagement
page 124
102-44
Key topics and concerns that have been raised through stakeholder engagement, and how the organisation has responded to those key topics and concerns
page 124
102-45All entities included in the organisation’s consolidated financial statements or equivalent documents
page 9
102-46
Process for defining the report content and the Aspect Boundaries; and how the organisation has implemented the Reporting Principles for Defining Report Content
page 124
102-47All the material aspects identified in the process for defining report content.
page 124
102-48Effect of any restatements of information provided in previous reports, and the reasons for such restatements.
page 127
102-49Significant changes from previous reporting periods in the Scope and Aspect Boundaries
Page 37 ( Fourth Sustainability reporting -
resorts in China have been maintained in boundary this year)
102-50 Reporting period for information provided page 37
102-51 Date of most recent previous reportfourth sustainability
report (last one was for period 2015-2016)
102-52 Reporting cycle page 37
102-53Contact point for questions regarding the report or its contents
102-55GRI Index with "in accordance" option chosen and references to External Assurance Reports
page 213-216
102-54Claims of reporting in accordance with the GRI Standards
page 0
102-56Organisation’s policy and current practice with regard to seeking external assurance for the report
page 213-216
ANNUAL REPORT 2017
211
Material AspectsGRI
IndicatorDisclosure Remarks & References
External Assurance
Mapping with Sustainable
Development Goals (SDGs)
MATERIAL TOPICS
GRI 103Management Approach 2016
103-1 Explanation of Material Topic and its boundaries page 124
103-2 The Management Approach and its Components page 124
103-3 Evaluation of the Management Approach page 124
SPECIFIC STANDARD DISCLOSURES
Environment SDG7,8,12,13
GRI 302: Energy 2016
302-1 Energy consumption within the organization page 125 YES
302-2 Energy consumption outside of the organization NA
302-3 Energy intensity page YES
302-4 Reduction of energy consumption page 125
302-5Reductions in energy requirements of products and services
page 125
GRI 303: Water 2016
303-1 Total water withdrawal by source page 125 YES"SDG3,12,13, 14,15"
303-2Water sources significantly affected by withdrawal of water
page 125
GRI 304: Biodiversity 2016
304-3 Biodiversity page 129
GRI 305: Emissions 2016
305-1Direct greenhouse gas (GHG) emissions (Scope 1) in metric tons of CO2 equivalent
page 128 YES
305-2Energy indirect greenhouse gas (GHG) emissions (Scope 2):
page 128 YES
305-3Other indirect greenhouse gas (GHG) emissions (Scope 3)
page 128 "SDG13,14,15"
305-4Greenhouse gas (GHG) emissions intensity intensity ratio: direct (Scope 1), energy indirect (Scope 2), other indirect (Scope 3).
page 128
305-5 Reduction of greenhouse gas (GHG) emissions page 128 "SDG3,12,14"
GRI 306: Effluent & Waste 2016
306-1 Total water discharge by quality and destination page 127
306-2 Total weight of waste by type and disposal method page 127 YES "SDG3,6,12"
SOCIAL
HUMAN RIGHTS
GRI 412: Human Rights Assessment 2016
412-2Total hours of employee training on human rights policies or procedures
page 131 YES "SDG5,8,16"
GRI 406: Non-discrimination2016
406-1Total number of incidents of discrimination and corrective actions taken
page 131 YES
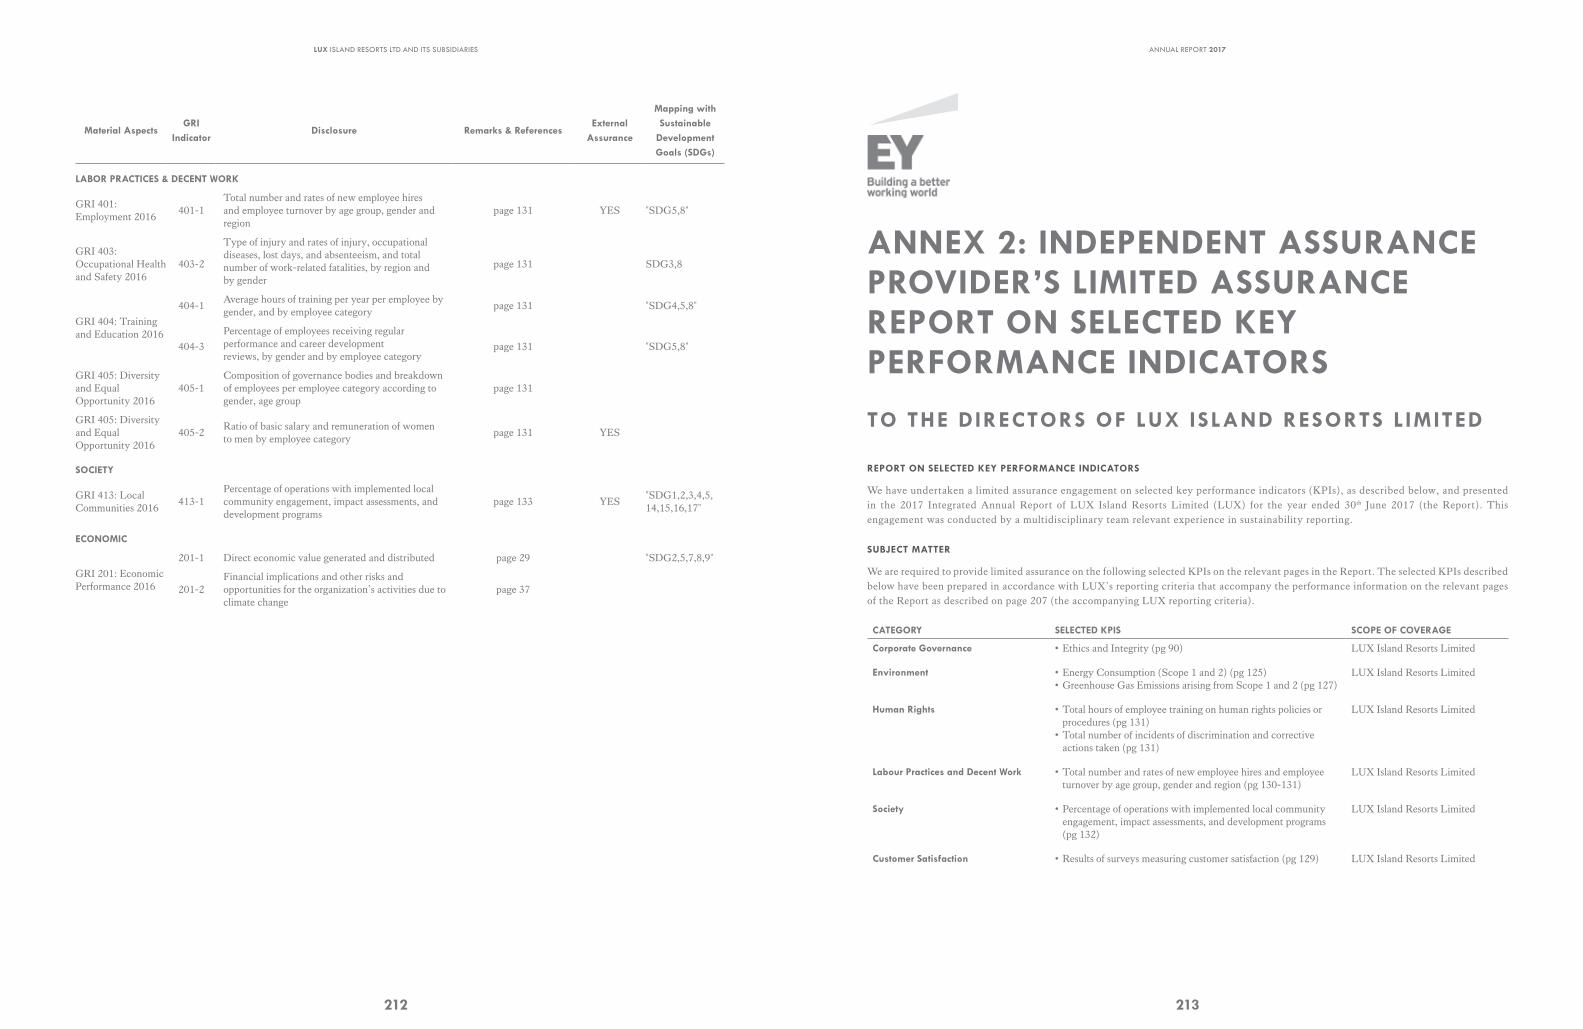
LUX ISLAND RESORTS LTD AND ITS SUBSIDIARIES
212
Material AspectsGRI
IndicatorDisclosure Remarks & References
External Assurance
Mapping with Sustainable
Development Goals (SDGs)
LABOR PRACTICES & DECENT WORK
GRI 401: Employment 2016
401-1Total number and rates of new employee hires and employee turnover by age group, gender and region
page 131 YES "SDG5,8"
GRI 403: Occupational Health and Safety 2016
403-2
Type of injury and rates of injury, occupationaldiseases, lost days, and absenteeism, and totalnumber of work-related fatalities, by region and by gender
page 131 SDG3,8
GRI 404: Training and Education 2016
404-1Average hours of training per year per employee by gender, and by employee category
page 131 "SDG4,5,8"
404-3
Percentage of employees receiving regularperformance and career developmentreviews, by gender and by employee category
page 131 "SDG5,8"
GRI 405: Diversity and Equal Opportunity 2016
405-1Composition of governance bodies and breakdown of employees per employee category according to gender, age group
page 131
GRI 405: Diversity and Equal Opportunity 2016
405-2Ratio of basic salary and remuneration of women to men by employee category
page 131 YES
SOCIETY
GRI 413: LocalCommunities 2016
413-1Percentage of operations with implemented local community engagement, impact assessments, and development programs
page 133 YES"SDG1,2,3,4,5, 14,15,16,17"
ECONOMIC
GRI 201: Economic Performance 2016
201-1 Direct economic value generated and distributed page 29 "SDG2,5,7,8,9"
201-2Financial implications and other risks and opportunities for the organization’s activities due to climate change
page 37
ANNUAL REPORT 2017
213
ANNEX 2: INDEPENDENT ASSURANCE PROVIDER’S LIMITED ASSURANCE REPORT ON SELECTED KEY PERFORMANCE INDICATORS
TO THE DIRECTORS OF LUX ISLAND RESORTS L IMITED
REPORT ON SELECTED KEY PERFORMANCE INDICATORS
We have undertaken a limited assurance engagement on selected key performance indicators (KPIs), as described below, and presented in the 2017 Integrated Annual Report of LUX Island Resorts Limited (LUX) for the year ended 30th June 2017 (the Report). This engagement was conducted by a multidisciplinary team relevant experience in sustainability reporting.
SUBJECT MATTER
We are required to provide limited assurance on the following selected KPIs on the relevant pages in the Report. The selected KPIs described below have been prepared in accordance with LUX’s reporting criteria that accompany the performance information on the relevant pages of the Report as described on page 207 (the accompanying LUX reporting criteria).
CATEGORY SELECTED KPIS SCOPE OF COVERAGE
Corporate Governance • Ethics and Integrity (pg 90) LUX Island Resorts Limited
Environment • Energy Consumption (Scope 1 and 2) (pg 125) • Greenhouse Gas Emissions arising from Scope 1 and 2 (pg 127)
LUX Island Resorts Limited
Human Rights • Total hours of employee training on human rights policies or procedures (pg 131)
• Total number of incidents of discrimination and corrective actions taken (pg 131)
LUX Island Resorts Limited
Labour Practices and Decent Work • Total number and rates of new employee hires and employee turnover by age group, gender and region (pg 130-131)
LUX Island Resorts Limited
Society • Percentage of operations with implemented local community engagement, impact assessments, and development programs (pg 132)
LUX Island Resorts Limited
Customer Satisfaction • Results of surveys measuring customer satisfaction (pg 129) LUX Island Resorts Limited
LUX ISLAND RESORTS LTD AND ITS SUBSIDIARIES
214
DIRECTORS’ RESPONSIBILITIES
The Directors are responsible for the selection, preparation and presentation of the selected KPIs in accordance with the accompanying LUX reporting criteria. This responsibility includes the identification of stakeholders and stakeholder requirements, material issues, commitments with respect to sustainability performance and design, implementation and maintenance of internal control relevant to the preparation of the Report that is free from material misstatement, whether due to fraud or error.
OUR INDEPENDENCE AND QUALITY CONTROL
We have complied with the independence and all other ethical requirements of the Code of Ethics for Professional Accountants issued by the International Ethics Standards Board for Accountants, which is founded on fundamental principles of integrity, objectivity, professional competence and due care, confidentiality and professional behaviour.
We have applied the International Standard on Quality Control 1 and accordingly maintain a comprehensive system of quality control including documented policies and procedures regarding compliance with ethical requirements, professional standards and applicable legal and regulatory requirements.
OUR RESPONSIBILITY
Our responsibility is to express a limited assurance conclusion on the selected KPIs based on the procedures we have performed and the evidence we have obtained. We conducted our limited assurance engagement in accordance with the International Standard on Assurance Engagements (ISAE) 3000 (Revised), Assurance Engagements other than the Audits or Reviews of Historical Financial Information and in respect of greenhouse gas emissions, in accordance with ISAE 3410, Assurance Engagements on Greenhouse Gas Statements issued by the International Auditing and Assurance Standards Board. That Standard requires that we plan and perform our engagement to obtain limited assurance about whether the selected KPIs are free from material misstatement.
A limited assurance engagement undertaken in accordance with ISAE 3000 (Revised) and ISAE 3410 involves assessing the suitability in the circumstances of LUX’s use of its reporting criteria as the basis of preparation for the selected KPIs, assessing the risks of material misstatement of the selected KPIs whether due to fraud or error, responding to the assessed risks as necessary in the circumstances, and evaluating the overall presentation of the selected KPIs. A limited assurance engagement is substantially less in scope than a reasonable assurance engagement in relation to both risk assessment procedures, including an understanding of internal control, and the procedures performed in response to the assessed risks. The procedures we performed were based on our professional judgement and included inquiries, observation of processes followed, inspection of documents, analytical procedures, evaluating the appropriateness of quantification methods and reporting policies, and agreeing or reconciling with underlying records.
Given the circumstances of the engagement, in performing the procedures listed above we:
> Interviewed management and senior executives to obtain an understanding of the internal control environment, risk assessment process and information systems relevant to the sustainability reporting process;
> Inspected documentation to corroborate the statements of management and senior executives in our interviews;
> Tested the processes and systems to generate, collate, aggregate, monitor and report the selected KPIs;
> Performed a controls walkthrough of identified key controls;
> Inspected supporting documentation on a sample basis and performed analytical procedures to evaluate the data generation and reporting processes against the reporting criteria;
> Evaluated the reasonableness and appropriateness of significant estimates and judgments made by the directors in the preparation of the selected KPIs; and
> Evaluated whether the selected KPIs presented in the Report is consistent with our overall knowledge and experience of sustainability management and performance at LUX.
ANNUAL REPORT 2017
215
OUR RESPONSIBILITY (CONTINUED)
The procedures performed in a limited assurance engagement vary in nature and form, and are less in extent than for a reasonable assurance engagement. As a result the level of assurance obtained in a limited assurance engagement is substantially lower than the assurance that would have been obtained had we performed a reasonable assurance engagement. Accordingly, we do not express a reasonable assurance opinion about whether LUX’s selected KPIs have been prepared, in all material respects, in accordance with the accompanying LUX reporting criteria.
LIMITED ASSURANCE CONCLUSION
Based on the procedures we have performed and the evidence we have obtained nothing has come to our attention that causes us to believe that the selected KPIs as set out in the subject matter paragraph for the year ended 30th June 2017 are not prepared, in all material respects, in accordance with the accompanying LUX reporting criteria.
OTHER MATTERS
The maintenance and integrity of the LUX’s Website is the responsibility of LUX management. Our procedures did not involve consideration of these matters and, accordingly we accept no responsibility for any changes to either the information in the Report or our independent limited assurance report that may have occurred since the initial date of its presentation on LUX website.
RESTRICTION OF LIABILITY
Our work has been undertaken to enable us to express a limited assurance conclusion on the selected KPIs to the Directors of LUX in accordance with the terms of our engagement, and for no other purpose. We do not accept or assume liability to any party other than LUX, for our work, for this report, or for the conclusion we have reached.
ERNST & YOUNG THIERRY LEUNG HING WAH, F.C.C.A
Ebène, Mauritius Licensed by FRC
Date: 26th September 2017
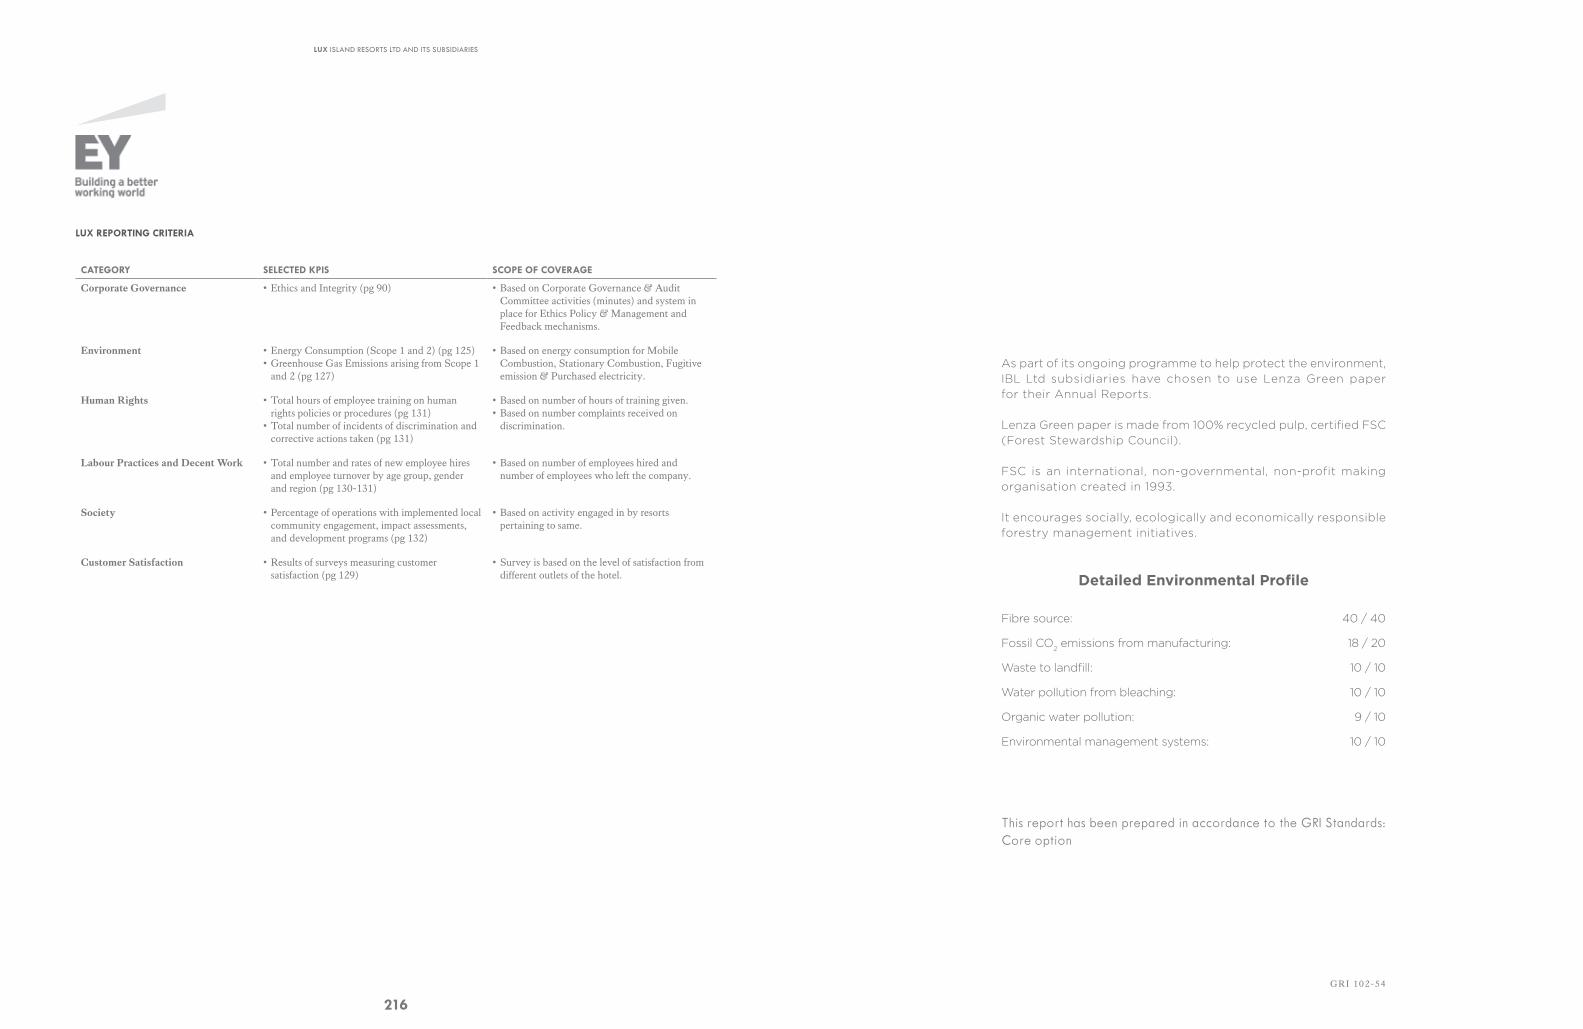
LUX ISLAND RESORTS LTD AND ITS SUBSIDIARIES
216
LUX REPORTING CRITERIA
CATEGORY SELECTED KPIS SCOPE OF COVERAGE
Corporate Governance • Ethics and Integrity (pg 90) • Based on Corporate Governance & Audit Committee activities (minutes) and system in place for Ethics Policy & Management and Feedback mechanisms.
Environment • Energy Consumption (Scope 1 and 2) (pg 125) • Greenhouse Gas Emissions arising from Scope 1 and 2 (pg 127)
• Based on energy consumption for Mobile Combustion, Stationary Combustion, Fugitive emission & Purchased electricity.
Human Rights • Total hours of employee training on human rights policies or procedures (pg 131)
• Total number of incidents of discrimination and corrective actions taken (pg 131)
• Based on number of hours of training given. • Based on number complaints received on discrimination.
Labour Practices and Decent Work • Total number and rates of new employee hires and employee turnover by age group, gender and region (pg 130-131)
• Based on number of employees hired and number of employees who left the company.
Society • Percentage of operations with implemented local community engagement, impact assessments, and development programs (pg 132)
• Based on activity engaged in by resorts pertaining to same.
Customer Satisfaction • Results of surveys measuring customer satisfaction (pg 129)
• Survey is based on the level of satisfaction from different outlets of the hotel.
As part of its ongoing programme to help protect the environment, IBL Ltd subsidiaries have chosen to use Lenza Green paper for their Annual Reports.
Lenza Green paper is made from 100% recycled pulp, certified FSC (Forest Stewardship Council).
FSC is an international, non-governmental, non-profit making organisation created in 1993.
It encourages socially, ecologically and economically responsible forestry management initiatives.
Fibre source: 40 / 40
Fossil CO2 emissions from manufacturing: 18 / 20
Waste to landfill: 10 / 10
Water pollution from bleaching: 10 / 10
Organic water pollution: 9 / 10
Environmental management systems: 10 / 10
Detailed Environmental Profile
This report has been prepared in accordance to the GRI Standards: Core option
GRI 102-54

LIGHTER. BRIGHTER.