Embed Size (px)
Citation preview
142 West Street, Sandown, 2196, South AfricaTel +27 (0)11 302 0300, Fax +27 (0)11 302 0729www.mercantile.co.za
Integrated Annual Report 2012
your bank, your partner, our focus
Mercantile B
ank Holdings Lim
ited Integrated Annual R
eport 2012
Integrated Annual Report 2012 1
Mercantile Bank Holdings LimitedReg No: 1989/000164/06
Member of CGD Group
This is Mercantile’s second Integrated Annual Report, prepared in accordance with the provisions of King III. The aim of this report is to provide effective and transparent communication with all stakeholders, in a useful, accessible and informative format.
Bank Regulations public disclosure
The December 2012 disclosure, required in terms of Regulation 43 of the Bank Regulations, is published on the Group’s website.
Table of contents Glossary of terms 2
Group structure 3
Board of Directors and administration 4
Five-year Group salient features 5
Group review 6
Sustainability 8
Corporate governance 12
Compliance Officer’s report 21
Annual financial statements 23
Group addresses 87
2 Integrated Annual Report 2012
Glossary of terms
Abbreviation: Definition/Description:
AGM Annual General MeetingALCO Asset and Liability CommitteeALM Asset and Liability ManagementBanks Act Banks Act, No. 94 of 1990, as amendedBank Regulations Regulations relating to banks issued under section 90 of the Banks Act, No. 94 of 1990, as amendedBEE Black Economic EmpowermentCEO Chief Executive OfficerCGD Caixa Geral de Depósitos S.A., a company registered in PortugalCompanies Act Companies Act, No.71 of 2008CPA Consumer Protection Act, No. 68 of 2008CREDCOM Credit CommitteeCustom Capital Custom Capital (Pty) LtdDAC Directors’ Affairs CommitteeEXCO Executive CommitteeFAIS The Financial Advisory and Intermediary Services Act, No. 37 of 2002FICA The Financial Intelligence Centre Act, No. 38 of 2001GAC Group Audit CommitteeIFC International Finance CorporationIFRS International Financial Reporting Standards and InterpretationsJSE Johannesburg Stock Exchange LimitedKing III King Report on Corporate Governance for South Africa 2009Mercantile Mercantile Bank Holdings Limited and its subsidiariesMulti Risk Multi Risk Investment Holdings (Pty) LtdNCA The National Credit Act, No. 34 of 2005RMC Risk and Capital Management CommitteeROA Return on average assetsROE Return on average equitySARB South African Reserve Bankthe Bank Mercantile Bank Limitedthe Board Where applicable, the Board of Directors of Mercantile Bank Holdings Limited or collectively
the Board of Directors of Mercantile Bank Holdings Limited and Mercantile Bank Limited the Company Mercantile Bank Holdings Limitedthe Code Code of Banking Practicethe Group Mercantile Bank Holdings Limited and its subsidiaries
Integrated Annual Report 2012 3
Group structure
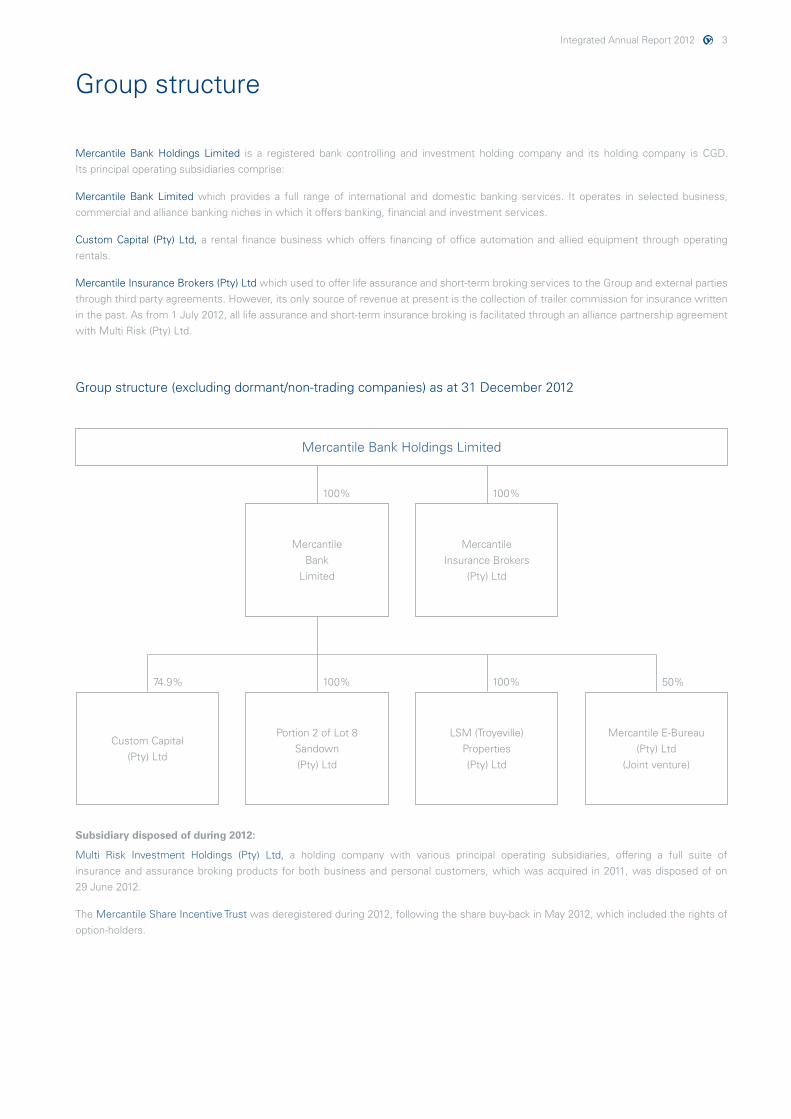
Mercantile Bank Holdings Limited is a registered bank controlling and investment holding company and its holding company is CGD. Its principal operating subsidiaries comprise:
Mercantile Bank Limited which provides a full range of international and domestic banking services. It operates in selected business, commercial and alliance banking niches in which it offers banking, financial and investment services.
Custom Capital (Pty) Ltd, a rental finance business which offers financing of office automation and allied equipment through operating rentals.
Mercantile Insurance Brokers (Pty) Ltd which used to offer life assurance and short-term broking services to the Group and external parties through third party agreements. However, its only source of revenue at present is the collection of trailer commission for insurance written in the past. As from 1 July 2012, all life assurance and short-term insurance broking is facilitated through an alliance partnership agreement with Multi Risk (Pty) Ltd.
Group structure (excluding dormant/non-trading companies) as at 31 December 2012
Mercantile Bank Holdings Limited
Custom Capital (Pty) Ltd
Mercantile Bank
Limited
Portion 2 of Lot 8 Sandown (Pty) Ltd
Mercantile Insurance Brokers
(Pty) Ltd
LSM (Troyeville) Properties (Pty) Ltd
Mercantile E-Bureau (Pty) Ltd
(Joint venture)
74.9%
100%
100%
100%
100% 50%
Subsidiary disposed of during 2012:
Multi Risk Investment Holdings (Pty) Ltd, a holding company with various principal operating subsidiaries, offering a full suite of insurance and assurance broking products for both business and personal customers, which was acquired in 2011, was disposed of on 29 June 2012.
The Mercantile Share Incentive Trust was deregistered during 2012, following the share buy-back in May 2012, which included the rights of option-holders.
4 Integrated Annual Report 2012
Board of Directors and administrationat 20 February 2013
J A S de Andrade Campos (Chairman, Non-Executive Director, Portuguese)
Joaquim holds a degree in Law from Coimbra University in Portugal. Having started his career as a public prosecutor, he later held senior positions in various banks and other companies in Europe and Africa, including as Chairman of Banque Franco Portugaise in Paris (part of the CGD group).
D J Brown (CEO)
Dave holds a BComm degree from the University of South Africa and an MBA from the University of Cape Town. In addition, he attended the Management Development Programme at the School of Business Leadership, and the Advanced Management Programme at Harvard Business School in the USA. He spent 30 years with the Standard Bank group, where he held various senior positions including Managing Director of Stanbic Bank Botswana, Managing Director of Stanbic Bank Zambia, Managing Director of Stannic Asset Finance and Managing Director of Standard Bank Commercial Banking Division. He was appointed CEO of Mercantile in 2004.
K R Kumbier (Deputy CEO)
Karl holds a BCompt degree from the University of South Africa and a PGDA from the University of Cape Town. He is a Chartered Accountant (SA) and a Chartered Financial Analyst (CFA Institute). Before joining Mercantile, he worked for the Standard Bank group for nine years in various positions, most recently as Provincial Director, Western Cape, and Chief Operating Officer of Stanbic Bank Ghana Limited. He joined Mercantile in 2010.
J P M Lopes (Executive Director, Portuguese)
Julio holds a degree in Law from the Lusiada University of Lisbon, and a Certificate in Corporate Finance from the London School of Business. He has been employed by CGD since 1991 and spent a number of years in London where he successfully managed Derivative Products and Structured Products. His most recent appointment was that of Managing Director of Banco Interatlântico, which is an affiliated bank of CGD, operating in the Republic of Cape Verde, focusing on Corporate Banking, Trade Financing and Private Banking. He was appointed as Executive Director of Mercantile in 2005.
L Hyne (Independent Non-Executive Director)
Louis is a Chartered Accountant (SA). He attended executive programmes at Witwatersrand Graduate School of Business and Stanford University in the USA. He was appointed as a partner with Deloitte & Touche in 1970 and later became Chief Operating Officer and Deputy Chairman, from which position he retired in May 2003. He holds directorships with various companies.
Administration
Acting Group Secretary F J Schutte (appointed 6 December 2012)Registered office 1st Floor Postal address Mercantile Bank PO Box 782699 142 West Street Sandton 2146 Sandown 2196
A T Ikalafeng (Independent Non-Executive Director)
Thebe holds BSc (Business Administration) and MBA degrees from Marquette University in the USA and has completed executive development courses in Finance at Wits and Harvard Business School. A chartered marketer (CM(SA)), he has held various marketing positions in the USA and Africa. He is the Founder and Managing Director of Brand Leadership Group and a member of the Vega School of Brand Communications advisory council.
G P de Kock (Independent Non-Executive Director)
Deon attended executive programmes at the Business Schools of the Universities of Cape Town and Stanford, California (SEP). He retired in 2004 as Managing Director of Woolworths Financial Services (Pty) Limited and as an executive director of Woolworths Holdings Limited. Before that, he was the General Manager of the Credit Card Division of Edgars Stores Limited. He is currently operating as an independent consultant in the retail and financial services industries.
D Naidoo (Independent Non-Executive Director)
Daisy holds several academic qualifications. After completing her BCom undergraduate degree, she went on to complete a Post Graduate Diploma in Accounting, a Masters in Accounting (Taxation) and is also a qualified Chartered Accountant (SA). At present, Daisy serves as an independent non-executive director on the boards of a number of companies, including, STRATE Limited, Hudaco Industries Limited, Omnia Holdings Limited, Marriott Unit Trust Management Company Limited, Old Mutual Unit Trust Managers Limited and Mr Price Group Limited. Daisy started her career at Ernst & Young in Durban, before taking on the role of Financial Planner at South African Breweries, and later, Tax Manager at Deloitte & Touche. Thereafter, Daisy joined Sanlam, where she held various positions including heading up their Debt Structuring Unit.
T H Njikizana (Independent Non-Executive Director, Zimbabwean)
Tapiwa has over 18 years’ experience in public practice as a qualified Chartered Accountant (SA) and Registered Auditor. He trained with Coopers & Lybrand and after qualifying as a Chartered Accountant, he also gained experience with Ernst & Young and Andersen, internationally. Tapiwa’s professional career includes international experience in Africa (Zimbabwe, Botswana and South Africa), the United Kingdom and the Republic of Ireland. He is a director at W.Consulting, which offers professional training and consulting services across Africa, the United Kingdom and Australia. Tapiwa is involved in many aspects affecting the accounting profession, he’s a member of the Association for the Advancement of Black Accountants in Southern Africa and sits on various SAICA committees, including the Accounting Practices Committee since 2007. In 2007, T H Njikizana served as a member of the GAAP Monitoring Panel of the Johannesburg Securities Exchange.
Board of Directors
Integrated Annual Report 2012 5
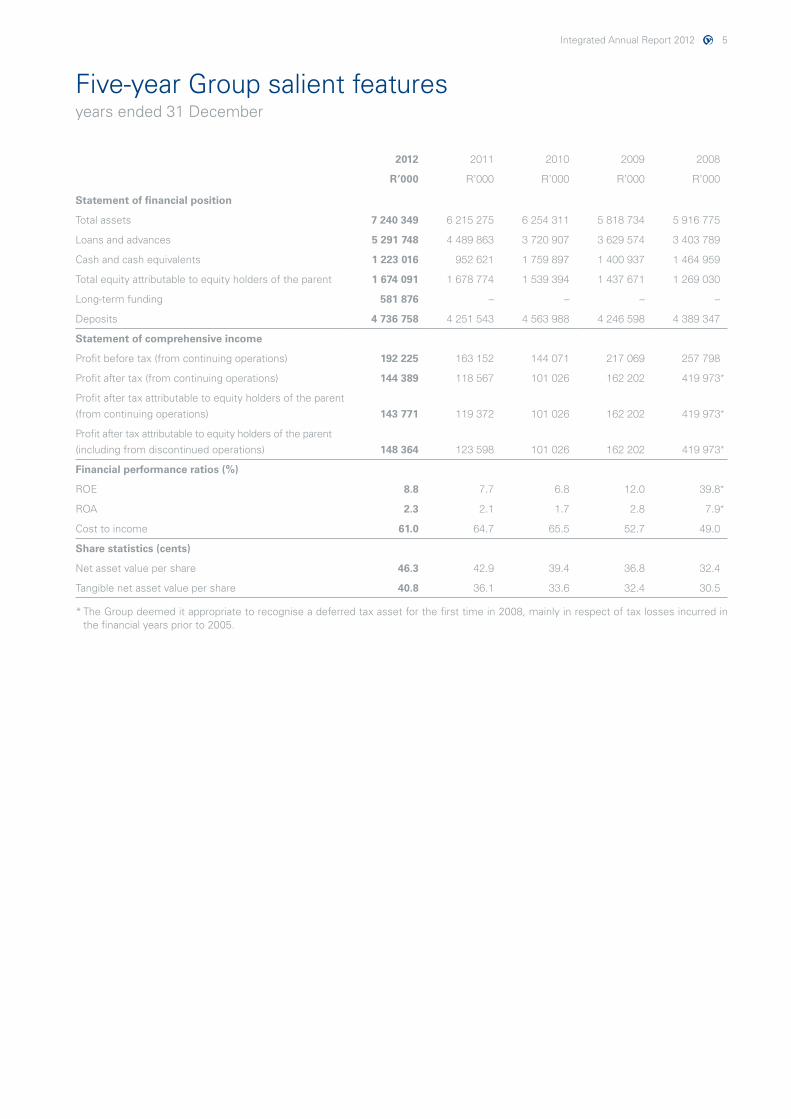
Five-year Group salient featuresyears ended 31 December
2012 2011 2010 2009 2008
R’000 R’000 R’000 R’000 R’000
Statement of financial position
Total assets 7 240 349 6 215 275 6 254 311 5 818 734 5 916 775
Loans and advances 5 291 748 4 489 863 3 720 907 3 629 574 3 403 789
Cash and cash equivalents 1 223 016 952 621 1 759 897 1 400 937 1 464 959
Total equity attributable to equity holders of the parent 1 674 091 1 678 774 1 539 394 1 437 671 1 269 030
Long-term funding 581 876 – – – –
Deposits 4 736 758 4 251 543 4 563 988 4 246 598 4 389 347
Statement of comprehensive income
Profit before tax (from continuing operations) 192 225 163 152 144 071 217 069 257 798
Profit after tax (from continuing operations) 144 389 118 567 101 026 162 202 419 973*
Profit after tax attributable to equity holders of the parent (from continuing operations) 143 771 119 372 101 026 162 202 419 973*
Profit after tax attributable to equity holders of the parent (including from discontinued operations) 148 364 123 598 101 026 162 202 419 973*
Financial performance ratios (%)
ROE 8.8 7.7 6.8 12.0 39.8*
ROA 2.3 2.1 1.7 2.8 7.9*
Cost to income 61.0 64.7 65.5 52.7 49.0
Share statistics (cents)
Net asset value per share 46.3 42.9 39.4 36.8 32.4
Tangible net asset value per share 40.8 36.1 33.6 32.4 30.5
* The Group deemed it appropriate to recognise a deferred tax asset for the first time in 2008, mainly in respect of tax losses incurred in the financial years prior to 2005.
6 Integrated Annual Report 2012
Group review
Holding companyCGD, which is wholly owned by the Portuguese state, is the Group’s holding company. On 22 May 2012, the Group bought out minority shareholders and delisted from the JSE, resulting in CGD owning 100% of the Company.
Business focusThe Group’s business focus is unchanged, namely:• to grow enterprise banking by offering products and services
to small- and mid-sized commercial businesses across the South African spectrum, while retaining a key segment focus on Portuguese customers;
• togrowexisting,andseekoutnew,opportunitiesinthealliancebanking arena, primarily in the areas of payment products; and
• togrowitsmarketshareofrentalfinancethroughitssubsidiary,Custom Capital.
Trading conditionsThe subdued trading conditions experienced in South Africa in 2011 continued into 2012. Business confidence remained suppressed, with the situation exacerbated by labour unrest during the year. The South African small business sector is starting to feel the effects of this difficult environment. During 2012, central bank rates were lowered by 50 basis points, resulting in an adverse impact on the Group’s net interest income. This was mainly due to the negative endowment effect on the Group’s high-level of excess capital and substantial credit balances on non-interest-bearing customer current accounts.
Financial overviewThe Group has produced a strong set of results for the year under review, with net profit after tax from continuing operations increasing year-on-year by 20.4%, mainly due to:• 20.0% growth in net interest income, as a result of a 17.9%
increase in loans and advances and a strong focus on margin management;
• growthinnetnon-interestincomeof11.8%;• aprofitofR26.6million,asaresultofdisposalofinvestmentsin
the structured loan portfolio;• R14.6millionprofitfromthesaleof50%oftheGroup’sshares
in VISA Inc.; and• an ongoing strong emphasis on cost management. Core
operating expenditure increased by only 5.7%, with total operating expenditure increasing by 9.4%, largely due to increased provisions for operational losses and incentives.
Whilst the charge for credit losses increased from R11.6 million in 2011 to R29.2 million in 2012, the credit loss ratio of 0.6% (as a percentage of average lending), is still well within acceptable industry norms. The quality of the Group’s lending portfolio remains sound.
Custom Capital, which was acquired in 2011, performed ahead of expectations. It broke even from a monthly net profit perspective, a year ahead of schedule, has grown its rental finance book to R354.5 million and has contributed R1.8 million to the Groups’ net profit after tax.
Cost to income ratio of 61.0% improved when compared to 64.4% for the year ended 31 December 2011. Both ROE at 8.8% (December 2011: 7.7%) and ROA at 2.3% (December 2011: 2.1%) improved as a result of the growth in operating income.
Business acquisitions and corporate activityOn 29 June 2012, the Group sold its investment in Multi Risk, whose financial contribution has been reported under discontinued operations. The Group decided to convert from a shareholding structure to a formal alliance partnership model. This means that as from 1 July 2012, the Group was no longer a shareholder in Multi Risk, however the Group will share in the commission earned on short-term insurance and life assurance written on the Group’s own customer base, through the formal alliance partnership with Multi Risk.
In the previous Integrated Annual Report, it was recorded that the Company had decided to make an offer to minorities by way of a scheme of arrangement. The necessary special resolution was passed and on 22 May 2012, all shares owned by minority shareholders and rights held by option-holders were acquired at 52 cents per share and/or right. The Company subsequently delisted from the JSE.
The Group will continue to explore opportunities for acquisitions and joint ventures that will assist in achieving strategic objectives. Particular emphasis will be on companies that will contribute towards growing the Group’s non-funded revenue.
Basel IIIThe Group is currently fully compliant with the capital adequacy, liquidity cover ratio (LCR) and net stable funding ratio (NSFR), as required under Basel III. To ensure ongoing compliance and support our growth projections, initiatives are underway to securitise the Bank’s residential home loan book and Custom Capital’s rental finance book. If successful, the Group should be able to raise in the region of R850 million through these initiatives.
Financial Sector CharterThe Group remains committed to achieving targets established with regard to employment equity, procurement, loans to Black SMEs and Corporate Social Responsibility (“CSR”).
During the year, the Group signed an agreement with The Hope Factory, for a very exciting initiative in the CSR space. The Group has committed to The Hope Factory to invest R0.8 million per year for three years, in order to provide a number of black entrepreneurs with skills training and the necessary tools to operate and grow successful businesses.
Integrated Annual Report 2012 7
Group review(continued)
Financial Sector Charter (continued)The Financial Sector Code (“FSC”) became effective on 26 November 2012, and is binding on all stakeholders in the Financial Sector, replacing the DTI’s B-BBEE Generic Code. The Group fully subscribes to the Code, which reflects the accord reached by all of the stakeholders regarding their joint commitment to fostering B-BBEE, specifically in the financial sector and in the South African economy. The Social, Ethics and Transformation Committee is a subcommittee of the Board charged with ensuring that the Group complies with the FSC, and also oversees the development and successful implementation of the Group’s BEE transformation strategy.
The Group remains committed to empowerment at shareholder level and will continue to explore opportunities in this regard.
Directorate and Company SecretaryD Naidoo was appointed to the Board on 23 May 2012 as a Non-Executive Director. A de Villiers resigned as Company Secretary on 30 June 2012, and her successor, M Naidoo, appointed on 1 July 2012, resigned on 5 December 2012. F J Schutte (Head of Legal for the Group) was appointed as Acting Company Secretary with effect from 6 December 2012.
RatingsMoody’s issued the following RSA national scale issuer ratings for the Bank on 11 December 2012:
Short-term P-3.za (previously P-2.za)Long-term Baa3.za (previously Baa1.za)Outlook Negative (previously Stable)
The change in the ratings and outlook was driven solely by the downgrade of the Bank’s parent company CGD, and apart from Moody’s assessed concerns on CGD contagion risks, the rating agency has assessed the Bank’s financial fundamentals as remaining sound.
Outlook2013 will continue to pose challenges for the Group as a result of the low interest rate environment and the tough trading conditions for our business and commercial customers. We remain confident that, with the strong partnerships we enjoy with our clients, together we will continue to grow despite these challenges.
Our thanks go out to all our stakeholders. As a result of the commitment and dedication of all our staff during the year under review and the strong support of our other stakeholders, being clients, shareholders, alliance and joint venture partners, regulators and suppliers, we were able to grow our business and deliver a good set of results.
The Group commenced with succession planning for the CEO role two-and-a-half-years ago and formalised the process towards the end of last year, subject to approvals from the SARB and CGD. These approvals were received in January 2013 and with effect from 1 April 2013, Karl Kumbier, currently Deputy CEO, will be appointed as CEO of the Company and the Bank. Dave Brown will take up a position on both Boards as a Non-Executive director, effective until March 2014.
J A S de Andrade Campos D J Brown
Chairman Chief Executive Officer
20 February 2013 20 February 2013
8 Integrated Annual Report 2012
Sustainability
The Group subscribes to a sustainable future, and to this end, aims to ensure sustainable practices across the entire scope of its business activities and the activities of all stakeholders, both external and internal. The Sustainability Policy identifies and documents the themes, principles, strategy, objectives, management, performance and reporting of sustainability, with the aim of integrating sustainability into the culture of Mercantile, and aligning our sustainability strategy with our business strategy.
As a member of the Banking Association of South Africa, the Group subscribes to the Association’s Code of Conduct for Managing Environmental and Social Risk. The Group’s sustainability themes are accordingly based on the Association’s Code and recommendations set out in King III, read with the JSE Sustainability Reporting Index criteria, and taking into account the size of our business and the community and industry that the Group operates in. The broad categories are:• environment– materials,energy,water,emissions,effluentand
waste, products and services;• society– education,employmentpractices,occupationalhealth
and safety, training and development; and• governanceandrelatedsustainabilityconcerns– goodcorporate
practices.
The Board is responsible for ensuring that the Group operates as a responsible corporate citizen, and has set strategic guidelines for meeting sustainability requirements recognised by the Group, with the aim of translating its corporate values into sustainable business practices and interaction with all its stakeholders, with key focus areas covering the short-, medium- and long-term as follows:
Environmental principlesThe Group acknowledges that the sound management of natural resources is a cornerstone of sustainable development. As a financial institution, the Group recognises that its direct environmental impacts are associated primarily with the operation of the Group’s office infrastructure. Systems aimed at reducing resource consumption, over time, are in place. The Group continuously explores ways in which to reduce paper, energy and water usage. The Group is also cognisant of the fact that, through its lending practices, it impacts indirectly on the environment. Assessment and management of environmental risks associated with a particular client or credit application is integral to the credit decision-making process. In order to apply those environmental standards, the Group is adhering to its Environmental Risk Management Policy, and has adopted elements of the IFC’s Sustainability Framework into its Environmental Risk Management Policy.
The Group is therefore committed to complying with relevant environmental legislation and regulations applicable to all its operations, as well as incorporating best practice where appropriate.
Ethical standardsThe Group is committed to high moral, ethical and legal standards, and expects all representatives of the Group to act in accordance with the highest standards of personal and professional integrity and honesty in all aspects of their activities, to be accountable for
their actions, and to comply with all applicable laws, regulations and the Group’s policies in the performance of its banking activities with all its stakeholders, i.e. shareholders, customers, employees, alliance partners, service providers, joint venture partners, the community, government and society at large.
The Group’s commitment is clearly stated in its Code of Conduct (Ethics), which contains a set of standards that the Group believes will contribute to its commercial success, as adherence thereto is a strategic business imperative and a source of competitive advantage. The Code is a constantly evolving document that is intended to be a permanent fixture in the daily activities of the Group and its employees. It is reviewed and benchmarked on an annual basis to ensure compliance with legislative requirements/good governance principles, and best practices. Annually, the Compliance function undertakes an exercise whereby all staff are required to re-affirm their commitment to the standards enshrined in the Code of Conduct, thereby ensuring that there are adequate levels of awareness of and commitment to the Code.
The standards in the Code are designed to preserve the highest standards of professional confidentiality in terms of access to, as well as management and processing of all information and, in general, in the performance of our banking activity as a whole, and ensuring the adoption of best banking and financial practice, and transparent, responsible and prudent business and risk management. It contributes to the promotion of an organisational culture of compliance with legislation and conformity, with the values and principles adopted, in addition to the development of best corporate governance principles and ethical conduct.
The Board’s Social, Ethics and Transformation Committee is confident that the Group has adhered to Mercantile’s ethical standards during the year under review.
Safety and healthThe Group is striving to improve its facilities on an ongoing basis to ensure the safety and wellbeing of its employees during the execution of their duties, and of persons who may enter any of its premises. Regular inspections of the workplace are carried out to identify potential hazards, and the Group does not hesitate to take and enforce practical measures to eliminate or mitigate any hazard or potential hazard to the safety of its employees or other persons.
Talent managementThe culture transformation process outlined later in this report identified a need for enhanced leadership and management development. The top 20% of management on the talent matrix were identified as the first target audience who will participate in a leadership development programme in 2013. The leadership and management development work stream completed a needs analysis with the candidates and their respective line managers. Wits and GIBS business schools have been selected to provide the leadership development training. A separate budget has been made available to fund this project. The programme links into career development.
Integrated Annual Report 2012 9
Sustainability(continued)
Talent management (continued)The Supervisory Development programme aimed at middle- and junior-management-level employees celebrated the graduation of 12 supervisors and managers who successfully completed the programme. The programme was implemented to address skills required to lead and manage people. The candidates who completed the 2011 programme were registered on the ETDP Seta national learner database, with NQF level 5 credits in supervisory skills.
Following the successful funding application and candidate selection process, two middle managers participated in the one-year Milpark Certificate in Management Development programme, sponsored by Bankseta. The NQF level 5 qualification is aimed at improving management skills and competencies.
The Bankseta International Executive Development Programme provides an opportunity for one of our senior managers to participate in the programme. This will allow career growth and exposure within the Retail and Investment banking sector. In December 2012, we were notified by Bank Seta that after a rigorous selection process, one of our business unit heads had been selected to attend the 2013 course.
During 2012, Mercantile provided training and up-skilling to thirteen Bankseta learners made up of 10 matriculants and three graduates. One candidate has thus far been permanently appointed within the Group.
Employee satisfaction and commitmentThe flexible work arrangement policy that was implemented in 2009, allows employees the flexibility to meet family needs, personal obligations, avoid traffic and the stress of commuting during peak hours, thereby increasing personal control over their work schedule, reducing potential burnout, and allowing employees to work when they accomplish the most. For the Group, it increases morale, engagement and commitment, and at the same time reduces absenteeism and the staff turnover rate.
The attrition rate is monitored on a quarterly basis. There has been a consistent decline in the attrition rate since 2007, from 19.6% to 12.11% in 2012.
In April 2011, the Group introduced a reward and recognition programme, namely the Wings Awards, through which employees have the opportunity to nominate their colleagues who show commitment and exceptional performance. The nominations criteria were reviewed in 2012 and aligned to the desired culture. The programme allows for three winners to be selected per month. In May 2012, the Group held its first CEO Awards function, where gold, silver and bronze prizes were awarded to three employees who were selected from the monthly winners.
Culture transformation processIn 2011, the Group started on a process of aligning the culture of the Group to the identified growth strategy. The process included an analysis of the current culture of the Group through a survey and focus group discussions that were held with existing employees, ex-employees and customers of the Group. A number of themes emerged from the focus group discussions, encapsulating the key elements requiring attention. During the course of 2012, the key elements needing attention were distilled into four distinct work streams, and each was assigned an owner and project team who would drive the various sub-projects required to address the identified issues or challenges. The four work streams were identified as follows:• communication and strategic direction – improving two way
communication and a clear understanding of the Bank’s strategy;• leadership development – improving skills and performance
across all levels of management within the Group;• empowermentandcustomerexperience–Bank-wideprocess
refinements aimed at improving experiences for various stakeholders, and for increasing efficiencies; and
• hygienefactors–refiningandimprovingtheworkingconditionsand working environment for all staff.
On a monthly basis, each work stream reported back on progress to the Steering Committee overseeing the culture process.
Good progress was made this year with the various work streams, but the business is mindful of the fact that changing a culture is a journey that will take time.
Four pillars have been identified and are central to the new culture we are aspiring to instil in the Group:• Passionateaboutservice• Customersdonotwait• Tailoredsolutions• Dedicatedrelationships
During 2012, the Bank rolled out the first culture index survey. The survey aims to assess to what extent staff behaviours are aligned to the four pillars, and takes the form of an online anonymous assessment. Feedback for individuals and teams are captured and consolidated from peers, subordinates and line managers. This will ultimately form part of employees’ annual performance review, to ensure a strong incentive to align to the new culture.
There is a strong emphasis on the customer and on ensuring that we continue to offer a differentiated service proposition to all who bank with Mercantile. Customer satisfaction is a key strategic initiative aligned to our customer-centric operating model, and a survey is conducted annually to gauge the levels of customer satisfaction. The Customer Satisfaction Index has been tracked for the past eight years, and new targets and action plans are implemented every year. 2012 again showed a positive improvement in the customer satisfaction results, achieving an overall level of 84%.
10 Integrated Annual Report 2012
Employee health and wellnessThe health, wellness and productivity of our employees are viewed as very important, and hence the Company offers a comprehensive Employee Assistance Programme, provided by an external company, to all employees and their immediate family members residing with them. This programme contributes to the reduction in healthcare costs and absenteeism, and thus potentially increasing productivity. A 24-hour telephone counselling service is supplemented with face-to-face counselling (if required). Issues raised by employees are monitored by the service provider, and quarterly reports are provided, indicating trends and frequency of usage. Employees receive health and wellness information on a monthly basis via email. A Health and Awareness Day was also implemented, where employees had the opportunity to benefit from services such as health screening, eye testing and various health presentations and offerings.
The Group runs an absenteeism management programme to assist management and employees in understanding the impact of absenteeism. It actively monitors trends and engages employees to potentially reduce this impact. The programme also supports a sustainable and value-adding approach to the way the Group manages its absenteeism and employee wellness. It assists management and employees to understand the impact of unplanned absenteeism, as well as why it is important for them to take a more pro-active stance. It supports the effective utilisation of the Employee Assistance Programme to address potential external drivers causing absenteeism, and timeous identification of incapacity cases, thereby reducing the direct and indirect costs of absenteeism and working towards creating a wellness-culture. Sick leave data is analysed on a monthly basis. The absenteeism rate has declined steadily from 1.7% in 2011 to 1.5% in 2012.
TransformationThe Group is fully committed to social and economic transformation and regards it as a key business imperative. Initiatives are driven and directed by the Board and integrated into the Group’s strategic business plans. The Social, Ethics and Transformation Committee receives regular and detailed reports on progress from the Group’s executive teams, and monitors the progress of transformation in the Group. The Committee’s charter stipulates how transformation will be implemented, monitored and integrated across the Group. The Group subscribes to and is bound by the objectives of the Financial Sector Code.
Employment EquityTransformation in the workplace is an important aspect of employment equity, and the Group strives to provide an environment that values and fosters diversity and equality. This includes developing a culture that supports mutual trust, respect and dignity for all employees.
Adherence to the Employment Equity Act and associated Skills Development, Basic Conditions of Employment and Labour Relations legislation, is regarded as essential. The desired results of the implementation of the employment equity plan are to improve the representation of black people, women, and people with disabilities, towards reflecting the demographic profile of the country and prioritising the development and career advancement of the designated groups.
As employment equity is regarded as a key business imperative, targets were set for 2009 to 2012, and progress is monitored on a quarterly basis. Good progress has been made in the employment of black people in the skilled/technical/junior management/semi-skilled categories, and the employment of people with disabilities. The overall level of representation of black people in the Bank has increased from 35% in 2004 to 60% in 2012. Although some progress has been made in management levels, the challenge remains the attraction, employment and retention of suitably experienced and skilled employment equity candidates for middle management, professional, specialist banking positions, and senior management level positions – see tables on page 22 and SkillsDevelopment statistics on page 23. Employment Equity targets and performance for Custom Capital have been incorporated into the Group’s reporting structures for the first time in 2012. The overall level of representation of black people in Custom Capital is 20%. This will be addressed over the next three years as part of the Employment Equity action plan, which Custom Capital has submitted to the Department of Labour.
ProcurementA targeted procurement strategy to enhance Broad-Based Black Economic Empowerment (“BBBEE”) has been adopted. The principles are detailed in the Group’s Procurement Charter and Procurement Policy. The objective is to actively promote the effective support of suppliers and contractors from BEE-accredited enterprises as set out in the Financial Sector Charter (“FSC”) and the Department of Trade and Industry’s (“DTI”) Broad-Based Black Economic Empowerment Codes of Good Practice. The Group has successfully met the DTI and FSC procurement targets since 2008, and is confident that we will achieve the 2014 target of 70% of procurement spend with BEE enterprises.
Loan approval to black SMEsThe gazetting of the Financial Sector Code was delayed until November 2012. Accordingly, the target for the Group for 2012 had been based on previous objectives encompassing a broader-based definition of Black SMEs (than defined in the code). The Group projected a target of R480 million in loans to black SMEs for 2012 and achieved R511 million.
Sustainability(continued)
Integrated Annual Report 2012 11
Corporate Social ResponsibilityThe Group has an objective of making a meaningful contribution to the society in which it operates and the communities that are in essence its key stakeholders. It aims to ensure that its Corporate Social Responsibility (“CSR”) Policy is closely linked to its market positioning, so that the various initiatives it supports are aligned to all of its stakeholders, both external and internal. The purpose of the CSR Policy is to identify and document the themes, principles, strategy, objectives, management, performance and reporting of the Group’s CSR, to ensure that the maximum value is extracted for all stakeholders from the spend made by the Group. To this end, the following CSR objectives have been identified:• adoption, implementation and ongoing refinement of a CSR
strategy;• compliancewiththeFinancialSectorCharterandtheassociated
outlined contributions to CSR;• ensuring we continue to behave and be viewed as a good
corporate citizen in the eyes of our various stakeholders;• tomakeameaningfulcontributionto thesociety inwhichwe
operate and to the market which we serve;• to create a targeted and focused outlet point for staff-led
community outreach projects;• tooptimisethevalueofourGroupCSRspendinourcorefocus
areas; and• toensureclosealignmenttotheagreedstrategyoftheBank.
The Bank signed a partnership agreement with The Hope Factory in December 2012, to be their exclusive banking partner for their Johannesburg programme. The Hope Factory’s Johannesburg programme seeks to replicate the success that the Hope Factory has had in developing entrepreneurs via its primary operation in Port Elizabeth. The partnership commenced on 1 January 2013 and will be valid for the next three years, with an option to extend thereafter. The Johannesburg offering will primarily focus on existing entrepreneurs, giving them guidance and support to grow their businesses. This has great alignment to Mercantile’s target market of owner-managed businesses. Our contribution will not only be financial in nature, but we will also provide support in terms of guidance from a group of internal content experts. For the Bank, this affords us a great opportunity to support an initiative that not only creates awareness of the Brand and what we do, but also allows us to make a lasting difference to the lives of the people we touch.
In 2012, a refined approach was adopted towards CSR to ensure that we continue to optimise the benefits for all stakeholders from these investments. The budgeted funding will be allocated on an 80:20 split, where 80% will be used for formal entrepreneurial development, and 20% for initiatives that involve staff participation. A formal legal entity, namely The Mercantile Foundation, was established to manage the investments made on behalf of the Group. Participation is from a cross-section of staff from different levels and areas of the business, to ensure that all areas are fairly represented. A significantly increased CSR budget has been approved for the 2013 financial year, which will be reported on in next year’s report.
During the year under review, Mercantile participated in a number of CSR projects initiated by both employees and/or the Bank.
The initiatives that employees and the Bank contributed to include a blanket drive, where staff donated funds which were then matched by the Bank on a 1:1 basis and were used to purchase over 440 blankets for the Salvation Army. Another charity which received continued support was the Azuriah Foundation. Funds were used to buy new school shoes and stationery items for over 290 needy children. Staff also arranged a Christmas party for the underprivileged children, with snacks and drinks being provided.
Ownership and controlThe Group remains committed to empowerment at shareholder level, and will continue to explore opportunities in this regard.
Sustainability(continued)
12 Integrated Annual Report 2012
The Boards of Directors of the Company and the Bank (collectively referred to as “the Board”) hold joint Board meetings. The Board aims to entrench the collective behaviours and practices in the Group that will ensure delivery of our obligation to sound governance. The Board subscribes to and is committed to ensuring that the Group complies with the corporate governance principles of fairness, accountability, responsibility and transparency, as set out in King III.
In accordance with the principles of King III, the Board, acting in the best interests of the Company and the Bank, has followed the “apply or explain” approach.
The following is a summary of the corporate governance processes of the Group for the year ended 31 December 2012:
Board of DirectorsThe Board exercises effective control over the Group and gives strategic direction to the Bank’s management.
Key responsibilities of the Board, assisted by its Board Committees are to:• approvetheGroup‘sstrategy,visionandobjectives,andmonitor/
review the implementation thereof;• approveandannuallyreviewtheGroup’slimitsofauthorities;• annuallyreviewcorporategovernanceprocessesandassessthe
achievement of these against objectives set;• annuallyreviewitscharterandapprovechangestothecharters
of the Board Committees;• annually reviewandapprovetheExecutiveandNon-Executive
Directors’ remuneration and submit such for approval and ratification by shareholders at the AGM;
• consider, approve, govern and review long-term incentiveremuneration structures for the Group;
• annuallyapprovetheGroup’sfinancialbudget(includingcapitalexpenditure);
• beaccountableforfinancial,operationalandinternalsystemsofcontrol and overall risk management;
• approve changes to the Group’s financial and accountingpolicies;
• reviewandapprovetheauditedfinancialstatementsandinterimresults;
• be responsible for ensuring that the Group complieswith allrelevant laws, regulations, codes of business practice and ethics;
• appoint appropriate Board Committees and determine thecomposition thereof; and
• annually approve the Board and Board Committees’ self-evaluations conducted on their effectiveness.
The Board comprises Non-Executive and Executive Directors with different skills, professional knowledge and experience, with independent Non-Executive Directors comprising the majority on the Board, ensuring that no individual director has unfettered powers of decision-making. For detail on the composition of the Board, the frequency of meetings and attendance thereof, refer to Annexure A to this document. The roles of the Chairman of the Board and CEO, who are appointed by the Board, are separated, thereby ensuring a clear division of responsibilities at the head of the Group. The Chairman of the Board is a Non-Executive Director.
Non-Executive Directors offer independent and objective judgement and, apart from their fees, there are no extraneous factors that could materially affect their judgement. If there is an actual or potential conflict of interest, the Director (Executive or Non-Executive) concerned, after declaring his/her interest in terms of the Companies Act, is excluded from the related decision-making process.
The process of identification of suitable candidates to fill vacancies on the Board and to re-appoint Directors upon termination of their term of office, is conducted by the DAC. This Committee’s nominations are submitted to the Board for approval, subject to the SARB having no objections to the nominations of new appointments. Any person appointed to fill a casual vacancy or as an addition to the Board, will retain office only until the next AGM, unless the appointment is confirmed at that meeting.
All Directors, except the CEO, retire on a three-year rotational basis. The service contract (due to expire on 31 March 2014) of Mr D J Brown, the CEO, has been amended to expire on 31 March 2013, when he will take up a position on the Board as a Non-Executive Director until 31 March 2014. Mr K R Kumbier (presently the Deputy CEO) will take up the position of CEO on 1 April 2013 for the Company and the Bank. The service contract of Mr J P M Lopes, an Executive Director seconded by the major shareholder, was extended in 2011 to terminate on 31 July 2014. A new independent Non-Executive Director, Ms D Naidoo, was appointed during the year. Directors are required to retire from the Board at age 70, subject to the Board’s discretion, to allow a Director to continue in office beyond this age. Such Director is still subject to retirement by the rotation provisions as explained above.
The Board operates in terms of a charter which defines its duties, responsibilities and powers. The charter is reviewed annually. The evaluation of the performance of the Board as a whole is conducted annually by means of a self-evaluation process. An evaluation of the Chairman is conducted by the other Directors. The evaluation of individual Non-Executive Directors’ performance is conducted on a bilateral basis between the Chairman and each Director. At 31 December 2012, the Board, which has a unitary board structure, comprised nine Directors, of which three were executives.
Corporate governance
Integrated Annual Report 2012 13
Board of Directors (continued)In accordance with King III, an annual formal evaluation of the independence of Non-Executive Directors was approved by the Board and implemented during the year. The evaluation consists of a comprehensive questionnaire, which is independently assessed via an online software tool, and includes a personal declaration by each Director. With the exception of the Chairman, all of the Non-Executive Directors are classified as independent. Three of the Non-Executive Directors are classified as black in terms of the relevant legislation. The Board is satisfied that its composition currently reflects an appropriate balance in this respect.
The Board has unrestricted access to all Company information, records, documents, property and management. If required, Directors are entitled to obtain independent professional advice at the Group’s expense.
Group SecretaryThe appointment and removal of the Group Secretary is a matter for consideration by the Board as a whole. The Group Secretary ensures that statutory and regulatory procedures are complied with, and acts as custodian of good governance. The Group Secretary attends all Board and Board Committee meetings, and has unrestricted access to the Chairman. The Group Secretary provides a central source of advice and guidance on business ethics, compliance with good corporate governance, and changes in legislation, assisting the Board as a whole and its members individually with guidance as to how their duties, responsibilities and powers should be adequately discharged and exercised in the best interests of the Group.
The Group Secretary also maintains and regularly updates a corporate governance manual, copies of which are distributed to all Directors, and organises and conducts a Board-approved induction programme to familiarise new Directors with the Group’s operations, their fiduciary duties and responsibilities, and the Group’s corporate governance processes. The Group Secretary assists the Board in developing a training framework annually to assist the Non-Executive Directors with continuous development as Directors, and in particular in a banking environment. The Group Secretary is not a Director of Mercantile.
The previous Group Secretary, Ms A De Villiers, resigned on 30 June 2012 and was replaced by Ms M Naidoo on 1 July 2012. Ms N Naidoo resigned on 5 December 2012 and Mr F J Schutte (Head of Legal for the Group) was appointed as Acting Company Secretary, with effect from 6 December 2012.
Board CommitteesThe Board has appointed a number of Board Committees to assist the Board in carrying out its duties and responsibilities. This does not relieve the Board of any of its responsibilities, and the Board critically evaluates the recommendations and reports of these committees before approving such recommendations or accepting such reports. These committees all operate in terms of Board-approved charters, which define their roles. All Board Committees’ charters are reviewed annually by the Board.
The performance of Board Committees, based on the duties and responsibilities as set out in the respective charters, are evaluated annually by means of a self-evaluation process, and the results are discussed at the Board Committee concerned and then reviewed and approved by the Board.
For detail on the composition of the Board Committees, frequency of meetings and attendance thereof, refer to page 20.
All Directors who are not members of the Board Committees may attend Board Committee meetings, but will not be able to participate in the proceedings without the consent of the relevant chairman, and will not have a vote.
All Directors who are not Board Committee members receive copies of all documentation sent to the Board Committees from time to time.
Further details on the Board Committees are provided below.
GAC
The GAC comprises four independent Non-Executive Directors, one of whom acts as chairman, who is not the Chairman of the Board. The CEO and the Deputy CEO attend GAC meetings as permanent invitees. The Board is satisfied that the collective skills of the members of the GAC are appropriate, relative to the size and circumstances of the Company.
GAC meetings are held at least four times per annum. The meetings of the GAC are attended by the head of Internal Audit, the External Auditors, the head of Risk, the Compliance Officer, the head of Finance and the head of Treasury. If a special meeting is called, the attendance of non-members is at the discretion of the Chairman of the GAC. The head of Internal Audit, the Compliance Officer, the head of Finance, the head of Risk, the CEO, the Deputy CEO and the External Auditors have unrestricted access to the Chairman of the GAC. As defined in its charter, the primary objective of the GAC is to assist the Board in fulfilling its responsibilities relative to:• financialcontrolandintegratedreporting;• compliance with statutory and regulatory legislation, which
includes but is not limited to the Banks Act, Companies Act, common law, IFRS, and tax legislation;
• corporategovernance;• riskmanagement;and• shareholderreporting.
The GAC reviews, inter alia, accounting policies, the audited annual financial statements, interim results, internal and external auditors’ reports, regulatory public disclosures required in terms of the Regulations to the Banks Act, the adequacy and efficiency of internal control systems, the effectiveness of management information systems, the internal audit process, the Bank’s continuing viability as a going concern, and its complaints handling duties in terms of the Companies Act. The Compliance Officer also gives feedback to the GAC on compliance issues and updates on changes to legislation which could have an impact on the Group.
Corporate governance(continued)
14 Integrated Annual Report 2012
Board Committees (continued)GAC (continued)
The external auditors’ appointment is recommended by the GAC and approved at the AGM. The GAC reviews the external auditors’ terms of engagement and fees, and also pre-approves an engagement letter on the principles of what non-audit services the external auditors could provide. The GAC meets with the external auditors, separate from management, at least annually.
The GAC carried out its function during the year by considering all information provided by management for discussion, decision and/or recommendation to the Board for approval at its meetings (refer to page 20). The GAC has fulfilled its statutory duties and responsibilities in terms of its charter during the year under review.
The report of the GAC (included in the annual financial statements section on pages 26 and 27) provides comprehensive details of its terms of reference, composition, meetings, statutory duties and delegated duties with respect to internal financial controls and internal audit, regulatory compliance, external audit, the financial function and financial statements.
RMC
The RMC comprises six members, four of whom are Non-Executive Directors, the CEO, and an Executive Director. The Chairman of the Board chairs the RMC. The Board has considered the position of the chair of the RMC in view of King III, and is satisfied that the Chairman of the Board is the most appropriate Board member to act as Chairman of the RMC, given his experience and individual skills set. This position will be reviewed on an annual basis.
RMC meetings are held at least four times per annum. The RMC meetings are attended by the head of Risk, the head of Treasury, Middle Office and Asset and Liability Management, the head of Finance, the Compliance Officer, and the head of Internal Audit.
As defined in its charter, the RMC’s objectives are to:• assist the Board to fulfil its risk management and control
responsibilities in the discharge of its duties relating to risk and control management, assurance, monitoring and reporting of all risks identified and managed through the Enterprise Wide Risk Management Framework;
• monitorandoverseetheriskmanagementprocess;• facilitatecommunicationbetweentheBoard,theGAC,Internal
Auditors, Compliance and other parties engaged in the risk management activities;
• ensure the quality, integrity and reliability of the Group’s riskmanagement and control;
• reviewtheGroup’sprocessandallocationofcapitalandcapitalmanagement; and
• providean independentandobjectiveoversightand reviewofthe information presented by management on risk management, generally and specifically taking into account reports by management and the GAC to the Board on financial, operational and strategic risks.
The RMC has fulfilled its responsibilities in terms of its charter during the year under review.
For more detailed information relating to the Risk Management of the Group refer to pages 75 to 86.
DAC
The DAC comprises all the Non-Executive Directors. The Chairman of the Board chairs the DAC and the CEO attends the meetings by invitation. Meetings are held at least four times per annum.
As defined in its charter, the primary objectives of the DAC are to:• assisttheBoardinitsdetermination,evaluationandmonitoring
of the appropriateness and effectiveness of the corporate governance structures, processes, practices and instruments of the Group;
• establishandmaintainacontinuityplanfortheBoard;• be responsible for the process of Board nominations and
appointments for recommendation to the Board, and in doing so, review the skills, experience and other qualities required for the effectiveness of the Board;
• ensurethatamanagementsuccessionplanisinplace;and• assist the Board in determining whether the employment/
appointment of any Directors should be terminated (excludes resignations).
The DAC has fulfilled its responsibilities in terms of its charter during the year under review.
Remuneration Committee
This committee comprises all of the Independent Non-Executive Directors. An Independent Non-Executive Director chairs this committee, and the CEO attends the meetings by invitation. The Remuneration Committee must meet at least twice per annum.
As defined in its charter, this committee’s primary objectives are to:• assist theBoard indetermining thebroadpolicy forexecutive
and senior management remuneration, and oversee the Bank’s remuneration philosophy;
• ensurealignmentoftheremunerationstrategy/philosophyandpolicy with Mercantile’s business strategy, risk and reward, desired culture, shareholders’ interests and commercial wellbeing;
• assist the Board in the consideration of performance-relatedincentive schemes, performance criteria and measurements, including allocations in terms of the Conditional Phantom Share Plan (“CPSP”) and other long-term awards;
• assist the Board in reviewing CEO performance against setmanagement and performance criteria, and:
– recommend guaranteed and performance-based individualremuneration, including CPSP and other long-term award allocations of the Executive Directors and Company Secretary;
– ensure full disclosure of Director and prescribed officers’remuneration in the Integrated Annual Report on an individual basis, giving details of earnings, long-term awards, restraint payments and other benefits. There are no designated prescribed officers other than the Executive Directors;
Corporate governance(continued)
Integrated Annual Report 2012 15
Board Committees (continued)Remuneration Committee (continued)
– approve guaranteed and performance-based individualremuneration, including CPSP and other long-term award allocations of senior management; and
• assisttheBoardinreviewingtheNon-ExecutiveDirectors’fees.
The Remuneration Committee has fulfilled its responsibilities in terms of its charter during the year under review.
Social, Ethics and Transformation Committee (“SETCom”)
This committee comprises three Non-Executive Directors, two of which are independent, and of which, one acts as Chairman, and the CEO. This committee must meet at least four times per annum.
As defined in its charter, the SETCom’s primary objectives are to monitor Mercantile’s activities with regard to:• social and economic development, including the goals and
purposes of: – theUnitedNationsGlobalCompactprinciples; – theOECDrecommendationsregardingcorruption; – theEmploymentEquityAct;and – theBroad-BasedBlackEconomicEmpowermentAct;• goodCorporateCitizenship,including: – thepromotionofequality,preventionofunfairdiscrimination,
and reduction of corruption; – contributiontodevelopmentofthecommunitiesinwhichits
products and services are predominantly marketed; and – sponsorship,donationsandcharitablegiving;• theenvironment,healthandpublicsafety,includingtheimpact
of Mercantile’s products or services;• consumer relationships, including advertising, public relations
and compliance with consumer protection laws; and• labourandemployment,including: – Mercantile’s standing in terms of the International Labour
Organisation Protocol on decent work and working conditions; and
– Mercantile’s employment relationships and its contributiontoward the educational development of its employees.
The SETCom has fulfilled its responsibilities in terms of its charter during the year under review.
Technology Committee
This committee is mandated to assist the Board in its duties with regard to the governance of Information Technology in accordance with the provisions of King III. The Technology Committee comprises two independent Non-Executive Directors and two Executive Directors. An independent Non-Executive Director chairs this committee. The Deputy CEO, the head of Information Technology (“IT”), the IT Governance manager and the head of Internal Audit are permanent invitees.
As defined in its charter, the Technology Committee’s primary objectives are to:• strategically align IT with the performance and sustainability
objectives of the Bank;
• ensurethatprudentandreasonablestepshavebeentakenwithregard to IT governance, by developing and implementing an IT governance framework;
• concentrateonoptimisingexpenditureandprovingthebusinessvalue of IT;
• ensureappropriateITriskassessmentandmanagement;• addressthesafeguardingandsecurityofITassets,continuityof
operations and disaster recovery; and• adequatelyprotectandmanageinformation.
The Technology Committee has fulfilled its responsibilities in terms of its charter during the year under review.
Management CommitteesA number of Management Committees have been formed to assist executive management and the Board in carrying out its duties and responsibilities. These are:• GroupEXCO;• ALCO;• CREDCOM;• EmploymentEquityCommittee;• BusinessandCommercialManagementCommittee,• TreasuryManagementCommittee;• AllianceBankingManagementCommittee;• HumanResourcesCommittee;• ITSteeringCommittee;• NewProductCommittee;and• ProcurementCommittee.
All of these committees operate in terms of their charters, which define their duties and responsibilities. Directors may attend any Management Committee meetings.
Subsidiaries
Subsidiaries are governed by their respective boards of directors in accordance with their own governance structures and the provisions of the Companies Act. Reports from these boards are received and considered by the GAC, RMC and the Board. The Group governance policies and procedures apply to all Group companies, and the subsidiaries are subject to monitoring and review by the Risk, Compliance and Internal Audit functions. Remuneration policies for subsidiaries have not, at this stage, been aligned to the Company’s policies.
Remuneration philosophy and governance principlesThe Remuneration Committee approves and oversees the remuneration philosophy of the Group. The main purpose of the remuneration philosophy adopted by the Group is:• to promote performance-based and equitable remuneration
practices;• toensurecompliancewithrespectivelegislationandcontractual
obligations contained in the contracts of employment and conditions of service; and
• toplayavitalroleintheGroupachievingitsstrategicobjectives.
Corporate governance(continued)
16 Integrated Annual Report 2012
Remuneration philosophy and governance principles (continued)It encapsulates five elements, which include compensation, benefits, work-life balance, performance-based recognition, and development of career opportunities to help attract, motivate and retain the talent needed to achieve the Group’s objectives, and optimise management of employees, i.e. involved employees who are enthusiastic about work and hence further the Group’s interests. Bonus pools and long-term incentives are reviewed and monitored on a regular basis, to align with the Company’s risk management strategy.
To attract, motivate and retain employees, the Group ensures that remuneration practices are fair, equitable and competitive, and aligns risk and reward. The three main components of remuneration are described below:
The total guaranteed package concept gives all employees a certain degree of flexibility as they can structure their packages to include a 13th cheque, select the appropriate level of travel allowance (in accordance with SARS’ regulations), and have the option of two medical aid schemes to choose from. It also includes retirement contribution, i.e. the employer contributes 11% to the Pension Fund and the employee contributes 7.5%. External equity is ensured by comparing packages to market levels through salary surveys. This is done at least once a year, prior to annual salary review processes. Market benchmarking information compiled by Remchannel is used to compare the appropriateness and competitiveness of guaranteed packages.
Increases and movements in individual pay levels are based on performance, levels of competence, and current position/pay level within the market. The market median pay level for the comparative position is used as a guideline.
Short-term incentives (bonus pools) form an important component of variable pay. The objective of the short-term incentive scheme is to reward performance, and to motivate employees to perform beyond expectations and drive the Company results. It is also an important element of establishing a performance culture and retaining the services of key contributors who assist in achieving the goals of the Group. Payouts occur in April each year, and for employees with payouts in excess of R250 000, payment is split into two equal tranches (April and October). Measurement criteria are aligned to Company strategic objectives and financial growth and performance targets, as well as customer service satisfaction targets and culture transformation.
The rules include a range of payouts as a percentage of the guaranteed package according to job level. Whereas Company performance determines the size of the bonus pool and the range of incentive percentages per broadband (job grade) that may be awarded, individual performance determines the actual incentive percentage within the range that is awarded. Individual performance is measured by way of a Performance Management process, incorporating an aligned Balanced Scorecard framework through which Key Result Areas are agreed and documented in a Personal Performance Contract. Financial performance is measured by reference to the annual budget cycle. No deferral of short-term incentive payments takes place (except as outlined above), unless the Board was of the view that revenues recognised during the budget year may be reversed in future years. Periodic reviews of the short-term incentive scheme take place at the discretion of the Board Remuneration Committee and/or Executive Directors, to ensure market competitiveness and alignment to regulatory requirements/good governance.
The third element of the remuneration mix is long-term incentives. The purpose of this element is to attract and reward key staff members whose contribution within the next three to five years is viewed as critical, and whose retention is regarded as a priority. A long-term incentive scheme, the Conditional Share Plan (“CSP”), was introduced in 2008 in place of the previous share option scheme, and was amended in 2009. Due to ongoing lack of liquidity of the Company shares in the market and the consequential impact on the share price, the Board decided during November 2011 to discontinue new awards under the CSP scheme for an indefinite period, and to convert existing unvested awards to a new performance-based Conditional Phantom Share Plan (“CPSP”) – a deferred bonus scheme settled in cash. Conditional awardsare made annually to participants on the basis of their job grade as a percentage of their cost to company packages. Participants are selected from eligible employees (earning >R300k per annum) who can have an impact on the future strategic growth of the Company. Awards will normally vest three years after the grant date, and will be settled in cash. The value of a phantom share is a function of the net asset value of the Company on vesting date, and a percentage (as determined by the Remuneration Committee) of the median price to book ratio of the four major banks in South Africa. The number of phantom shares vesting to determine the cash settlement will be subject to performance criteria set by the Remuneration Committee, and approved by the Board. Vesting of awards will occur within a range of 25% to 175% of the original conditional awards made, depending on whether performance conditions are achieved. Performance conditions are based on the achievement of specified targets for growth in Group earnings and ROE. The key drivers of earnings and ROE measured over a three-year period would allow for the longer-term impact of short-term decisions to manifest itself. PWC Remchannel provided expert input to the Remuneration Committee as part of the design of the CSP and the CPSP schemes.
Corporate governance(continued)
Integrated Annual Report 2012 17
Remuneration philosophy and governance principles (continued)The CSP scheme and/or the share option scheme may be reinstituted by the Board, at their discretion, at a future date. All of the long-term incentive schemes include protection of participants in the event of a change of control or similar corporate action. The CPSP scheme is considered to be particularly suitable to the Group, following its delisting from the JSE in 2012.
The remuneration of Non-Executive Directors takes into account the responsibilities of the role, and the skills and experience of the individual, whilst not losing sight of the requirement for market related, fair and defendable compensation from a regulatory and stakeholder viewpoint. King III requires fair and responsible remuneration policies in relation to Non-Executive Director remuneration, and hence our Remuneration Committee advises the Board on appropriate remuneration for Non-Executive Directors. Incentives such as share options/plans or rewards geared to the Company’s share price or performance does not form part of the remuneration of Non-Executive Directors. Shareholders annually approve all Directors’ fees.
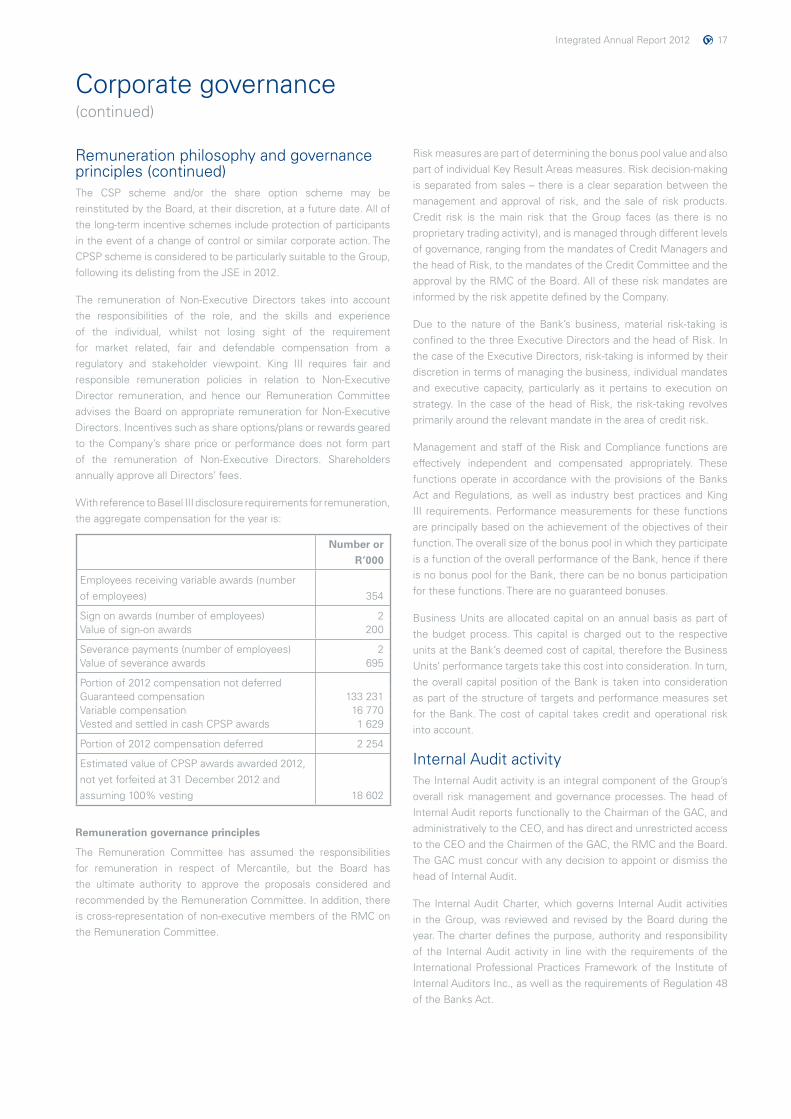
With reference to Basel III disclosure requirements for remuneration, the aggregate compensation for the year is:
Number or
R’000
Employees receiving variable awards (number of employees) 354
Sign on awards (number of employees) 2Value of sign-on awards 200
Severance payments (number of employees) 2Value of severance awards 695
Portion of 2012 compensation not deferredGuaranteed compensation 133 231Variable compensation 16 770Vested and settled in cash CPSP awards 1 629
Portion of 2012 compensation deferred 2 254
Estimated value of CPSP awards awarded 2012, not yet forfeited at 31 December 2012 and assuming 100% vesting 18 602
Remuneration governance principles
The Remuneration Committee has assumed the responsibilities for remuneration in respect of Mercantile, but the Board has the ultimate authority to approve the proposals considered and recommended by the Remuneration Committee. In addition, there is cross-representation of non-executive members of the RMC on the Remuneration Committee.
Risk measures are part of determining the bonus pool value and also part of individual Key Result Areas measures. Risk decision-making isseparatedfromsales–thereisaclearseparationbetweenthemanagement and approval of risk, and the sale of risk products. Credit risk is the main risk that the Group faces (as there is no proprietary trading activity), and is managed through different levels of governance, ranging from the mandates of Credit Managers and the head of Risk, to the mandates of the Credit Committee and the approval by the RMC of the Board. All of these risk mandates are informed by the risk appetite defined by the Company.
Due to the nature of the Bank’s business, material risk-taking is confined to the three Executive Directors and the head of Risk. In the case of the Executive Directors, risk-taking is informed by their discretion in terms of managing the business, individual mandates and executive capacity, particularly as it pertains to execution on strategy. In the case of the head of Risk, the risk-taking revolves primarily around the relevant mandate in the area of credit risk.
Management and staff of the Risk and Compliance functions are effectively independent and compensated appropriately. These functions operate in accordance with the provisions of the Banks Act and Regulations, as well as industry best practices and King III requirements. Performance measurements for these functions are principally based on the achievement of the objectives of their function. The overall size of the bonus pool in which they participate is a function of the overall performance of the Bank, hence if there is no bonus pool for the Bank, there can be no bonus participation for these functions. There are no guaranteed bonuses.
Business Units are allocated capital on an annual basis as part of the budget process. This capital is charged out to the respective units at the Bank’s deemed cost of capital, therefore the Business Units’ performance targets take this cost into consideration. In turn, the overall capital position of the Bank is taken into consideration as part of the structure of targets and performance measures set for the Bank. The cost of capital takes credit and operational risk into account.
Internal Audit activityThe Internal Audit activity is an integral component of the Group’s overall risk management and governance processes. The head of Internal Audit reports functionally to the Chairman of the GAC, and administratively to the CEO, and has direct and unrestricted access to the CEO and the Chairmen of the GAC, the RMC and the Board. The GAC must concur with any decision to appoint or dismiss the head of Internal Audit.
The Internal Audit Charter, which governs Internal Audit activities in the Group, was reviewed and revised by the Board during the year. The charter defines the purpose, authority and responsibility of the Internal Audit activity in line with the requirements of the International Professional Practices Framework of the Institute of Internal Auditors Inc., as well as the requirements of Regulation 48 of the Banks Act.
Corporate governance(continued)
18 Integrated Annual Report 2012
Internal Audit activity (continued)All operations, business activities and support functions are subject to Internal Audit review. The annual internal audit plan is risk-based and is approved by the GAC. Audits are conducted according to a risk-based approach, and the audit plan is updated quarterly or as needed to reflect any changes in the risk profile of the Group. Updated plans are then presented to the GAC for review and approval.
The Internal Audit activity is responsible for reviewing the adequacy and effectiveness of control and governance processes throughout the Group. Any significant or material control weaknesses are reported to management, the GAC, and/or the RMC for consideration and remedial action, if necessary.
The activity also works closely with the Risk and Compliance Management departments to ensure that audit issues of an ethical, compliance or governance nature are made known and are appropriately resolved. The Risk and Compliance Management processes are also reviewed by the Internal Audit activity in accordance with the annual internal audit plan.
To complement the Internal Audit activity, the Bank has entered into a co-sourcing arrangement with KPMG to provide specialist internal audit skills in the IT environment.
External Auditors’ services: non-audit servicesThe Group will not contract its external auditors for non-audit services where such an engagement compromises their independence and, in particular, the following areas are specifically excluded from the services that are procured from the external auditors:• bookkeepingorotherservicesrelatedtoaccountingrecordsor
annual financial statements;• financialinformationsystemsdesignandimplementation;• appraisalorvaluationservices,fairnessopinions,orcontribution-
in-kind reports for financial reporting purposes;• actuarialservices;• internalauditoutsourcingand/orco-sourcing;• performanceofmanagementfunctions;• staff-recruitmentagents;• broker-dealer, investment advisor or investment banking
services; and• legalservices.
The following is a summary of the policy adopted by the GAC to ensure proper governance and approval of the use of external auditors to provide non-audit services:
The GAC approved a “Blanket” engagement letter for non-audit services (“the Engagement Letter”) on the basis that the external auditors confirm in writing, prior to providing a service contained in the Engagement Letter, that such service does not impair their independence, and that they may provide such service. The GAC has approved that non-audit services, which the external auditors may provide in terms of the Engagement Letter, with a value of R250 000 or less, may be provided subject to the CEO’s approval. A report on these services provided is submitted to the GAC meetings for notification. The GAC requires that all non-audit services which the External Auditors may provide in terms of the Engagement Letter, with a value of more than R250 000, must be submitted to the GAC for approval prior to the External Auditors providing the service.
The CodeAs a member of the Banking Association of South Africa, the Group subscribes to the Code that promotes good banking practices by setting standards for disclosure and conduct, thereby providing valuable safeguards for its clients. The Group aims to conduct its business with uncompromising integrity and fairness, so as to promote complete trust and confidence. In meeting this fundamental objective, the Group conducts its relationships with the regulatory authorities, clients, competitors, employees, shareholders, suppliers and the community at large, by striving for high service levels with veracity, and encourages its employees to acquaint themselves with the Code and honour its precepts.
Corporate governance(continued)
Integrated Annual Report 2012 19
Corporate governance(continued)
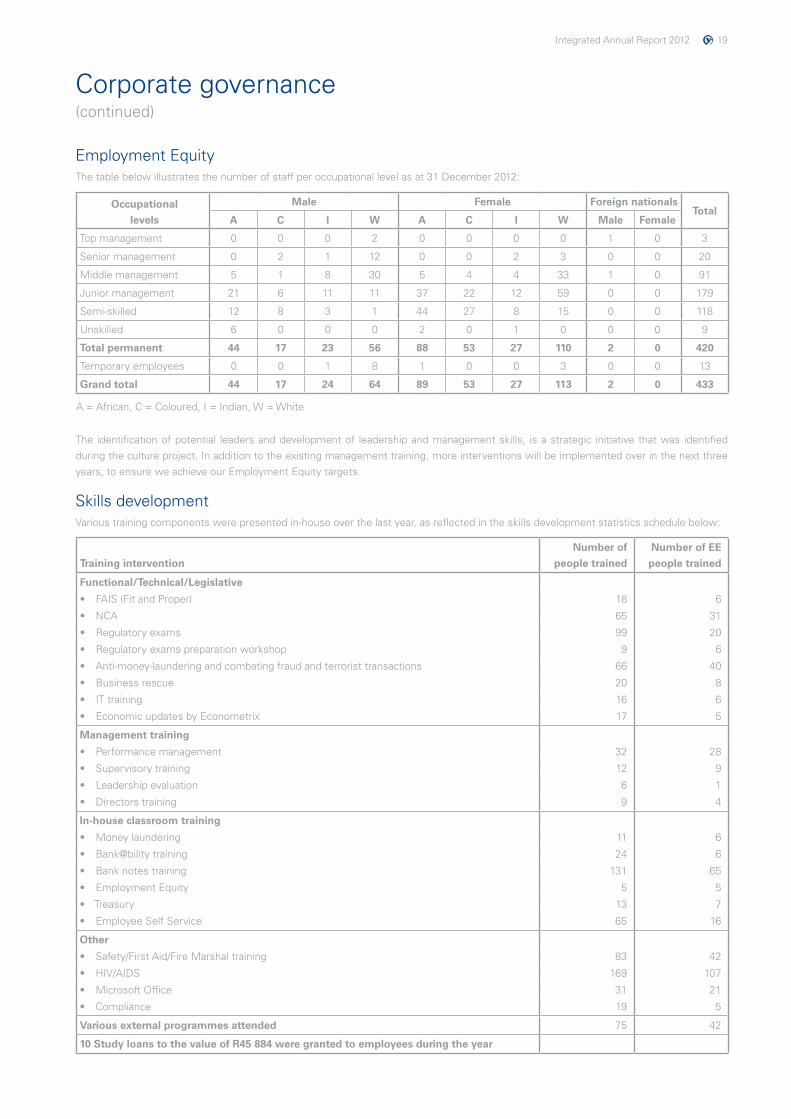
Employment EquityThe table below illustrates the number of staff per occupational level as at 31 December 2012:
Occupational
levels
Male Female Foreign nationalsTotal
A C I W A C I W Male Female
Top management 0 0 0 2 0 0 0 0 1 0 3
Senior management 0 2 1 12 0 0 2 3 0 0 20
Middle management 5 1 8 30 5 4 4 33 1 0 91
Junior management 21 6 11 11 37 22 12 59 0 0 179
Semi-skilled 12 8 3 1 44 27 8 15 0 0 118
Unskilled 6 0 0 0 2 0 1 0 0 0 9
Total permanent 44 17 23 56 88 53 27 110 2 0 420
Temporary employees 0 0 1 8 1 0 0 3 0 0 13
Grand total 44 17 24 64 89 53 27 113 2 0 433
A = African, C = Coloured, I = Indian, W = White
The identification of potential leaders and development of leadership and management skills, is a strategic initiative that was identified during the culture project. In addition to the existing management training, more interventions will be implemented over in the next three years, to ensure we achieve our Employment Equity targets.
Skills developmentVarious training components were presented in-house over the last year, as reflected in the skills development statistics schedule below:
Training intervention
Number of
people trained
Number of EE
people trained
Functional/Technical/Legislative
• FAIS(FitandProper) 18 6
• NCA 65 31
• Regulatoryexams 99 20
• Regulatoryexamspreparationworkshop 9 6
• Anti-money-launderingandcombatingfraudandterroristtransactions 66 40
• Businessrescue 20 8
• ITtraining 16 6
• EconomicupdatesbyEconometrix 17 5
Management training
• Performancemanagement 32 28
• Supervisorytraining 12 9
• Leadershipevaluation 6 1
• Directorstraining 9 4
In-house classroom training
• Moneylaundering 11 6
• Bank@bilitytraining 24 6
• Banknotestraining 131 65
• EmploymentEquity 5 5
• Treasury 13 7
• EmployeeSelfService 65 16
Other
• Safety/FirstAid/FireMarshaltraining 83 42
• HIV/AIDS 169 107
• MicrosoftOffice 31 21
• Compliance 19 5
Various external programmes attended 75 42
10 Study loans to the value of R45 884 were granted to employees during the year
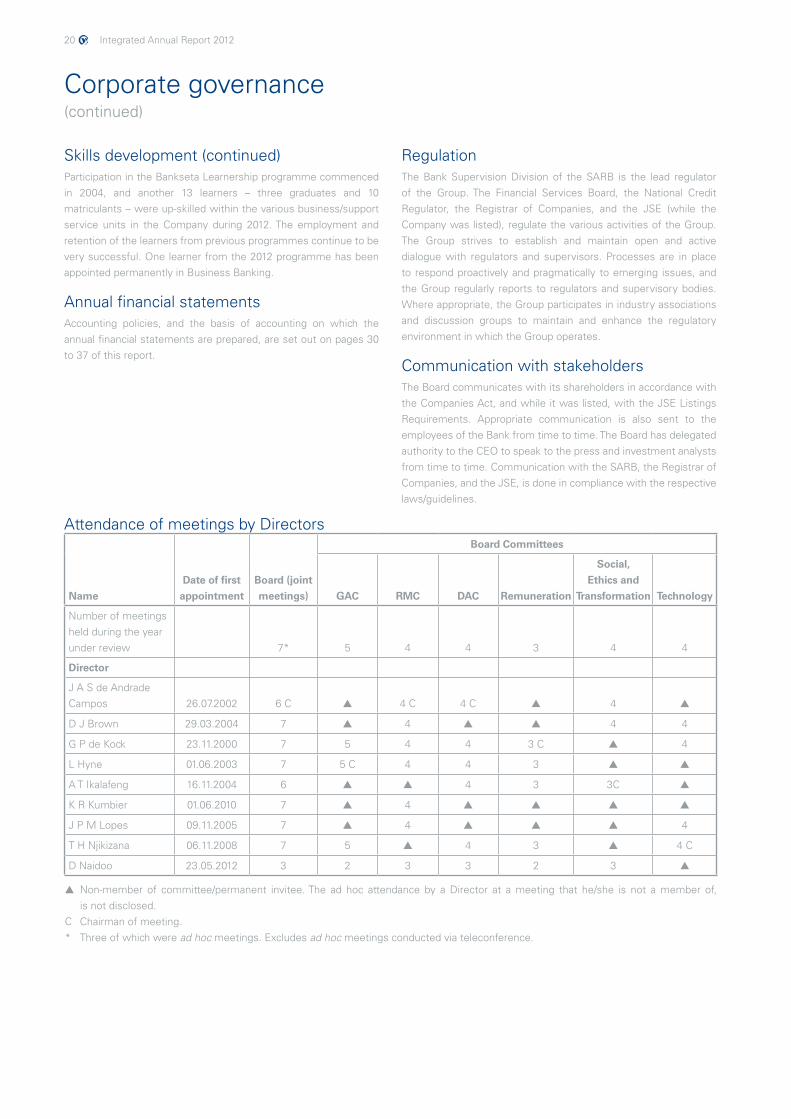
20 Integrated Annual Report 2012
RegulationThe Bank Supervision Division of the SARB is the lead regulator of the Group. The Financial Services Board, the National Credit Regulator, the Registrar of Companies, and the JSE (while the Company was listed), regulate the various activities of the Group. The Group strives to establish and maintain open and active dialogue with regulators and supervisors. Processes are in place to respond proactively and pragmatically to emerging issues, and the Group regularly reports to regulators and supervisory bodies. Where appropriate, the Group participates in industry associations and discussion groups to maintain and enhance the regulatory environment in which the Group operates.
Communication with stakeholdersThe Board communicates with its shareholders in accordance with the Companies Act, and while it was listed, with the JSE Listings Requirements. Appropriate communication is also sent to the employees of the Bank from time to time. The Board has delegated authority to the CEO to speak to the press and investment analysts from time to time. Communication with the SARB, the Registrar of Companies, and the JSE, is done in compliance with the respective laws/guidelines.
Corporate governance(continued)
Skills development (continued)Participation in the Bankseta Learnership programme commenced in 2004, and another 13 learners – three graduates and 10matriculants–wereup-skilledwithinthevariousbusiness/supportservice units in the Company during 2012. The employment and retention of the learners from previous programmes continue to be very successful. One learner from the 2012 programme has been appointed permanently in Business Banking.
Annual financial statementsAccounting policies, and the basis of accounting on which the annual financial statements are prepared, are set out on pages 30 to 37 of this report.
Attendance of meetings by DirectorsBoard Committees
Name
Date of first
appointment
Board (joint
meetings) GAC RMC DAC Remuneration
Social,
Ethics and
Transformation Technology
Number of meetings held during the year under review 7* 5 4 4 3 4 4
Director
J A S de Andrade Campos 26.07.2002 6 C ▲ 4 C 4 C ▲ 4 ▲
D J Brown 29.03.2004 7 ▲ 4 ▲ ▲ 4 4
G P de Kock 23.11.2000 7 5 4 4 3 C ▲ 4
L Hyne 01.06.2003 7 5 C 4 4 3 ▲ ▲
A T Ikalafeng 16.11.2004 6 ▲ ▲ 4 3 3C ▲
K R Kumbier 01.06.2010 7 ▲ 4 ▲ ▲ ▲ ▲
J P M Lopes 09.11.2005 7 ▲ 4 ▲ ▲ ▲ 4
T H Njikizana 06.11.2008 7 5 ▲ 4 3 ▲ 4 C
D Naidoo 23.05.2012 3 2 3 3 2 3 ▲
▲ Non-member of committee/permanent invitee. The ad hoc attendance by a Director at a meeting that he/she is not a member of, is not disclosed.
C Chairman of meeting.* Three of which were ad hoc meetings. Excludes ad hoc meetings conducted via teleconference.
Integrated Annual Report 2012 21
Compliance Officer’s report
Compliance risk is the risk to earnings, capital and reputation arising from violations of, or non-compliance with, laws, rules, regulations, supervisory requirements, prescribed practices, or ethical standards. The role of the Compliance function is to identify, assess and monitor the statutory and regulatory risks faced by the Group, and advise and report to senior management and the Board on these risks.
The objective of the Compliance function is to ensure that the Group continuously manages and complies with existing and emerging regulations impacting on our business activities.
To ensure the independence of the Compliance function from the business activities of the Group, in accordance with the requirements stipulated in section 60A of the Banks Act, read with the provisions of regulation 49, the Board authorised the Compliance function to:• carryoutitsresponsibilitiesonitsowninitiativeinallareasofthe
Group in which regulatory risk may or may not exist;• ensure it is providedwith sufficient resources to enable it to
carry out its responsibilities effectively; and• nothavedirectbusinesslineresponsibilities.
The head of Compliance reports to the head of Risk and has unrestricted and unfettered access to the CEO, the Chairmen of the Board, the GAC and the RMC. The head of Compliance is supported by two Compliance Officers, a Money Laundering Control Officer, a Compliance Monitoring Specialist, and a Money Laundering Control/Compliance Analyst. The compliance function at Mercantile follows a centralised structure co-ordinating activities across the Group and business units.
A Compliance Charter has been approved, and is annually reviewed by the Board to assess the extent to which the Group is managing its regulatory risks effectively.
The GAC annually reviews and approves a compliance plan. The GAC monitors the progress against the compliance plan, which sets out training, monitoring and review of compliance with the regulatory requirements in the Group.
A successful compliance function is built on relationships. These relationships are in the form of senior management, Board and staff buy-in, relationships with industry bodies, the regulators, and other governance functions (such as internal audit. The Compliance function keeps senior management and the Board informed about significant regulatory issues and any trends exhibited, and identifies where urgent intervention is needed. The Group’s Compliance Officers are charged with developing and maintaining constructive working relationships with Regulators, Supervisors and Compliance staff, and work closely with business and operational units to ensure consistent management of compliance risk.
Compliance risk is managed within the Group through the following key activities:• creating awareness by training employees in respect of the
impact and responsibilities related to legislative requirements;• monitoring and reporting on the level of compliance with
regulatory requirements, including reporting specific incidents of non-compliance to senior management and the Board;
• providing assurance that the risks relating to regulatoryrequirements are identified, understood and effectively managed; and
• consulting with the business units and providing complianceopinions with regard to new business ventures and processes.
The Compliance risk management tools provided to management include a comprehensive and consolidated Compliance Manual, Compliance Risk Management Plans, Compliance Opinions, and Compliance Monitoring Reports.
Reporting to the Board is done in the form of several Compliance Reports via Board sub-committees. Certain reports are also submitted to the SARB, once they have been presented to the sub-committees.
The key Acts that the Compliance function focused on during the year under review, were:• TheBanksAct,No.94of1990;• TheCompaniesAct,No.71of2008;• TheNationalCreditAct,No.34of2005(NCA);• TheFinancialIntelligenceCentreAct,No.38of2001;• The FinancialAdvisory and IntermediaryServicesAct,No. 37
of 2002;• TheConsumerProtectionAct,No.68of2008;• TheNationalPaymentSystemAct,No.78of1998;and• TheOccupationalHealthandSafetyAct,No.85of1993.
The most notable development and focus area in respect of regulatory reforms, during the upcoming year, is the anticipated implementation of a twin-peaks model of financial regulation in South Africa, and ongoing adjustments to the regulatory framework in terms of the implementation of the Basel III reforms. The new regulations relating to banks became effective on 1 January 2012 and incorporated, among others, amendments and additions to supervisory standards and banking legislation. In addition, as South Africa is following international best practices and standards on financial regulation, supervision and market conduct, it is anticipated that ongoing changes in these areas will be incorporated into the regulatory framework, and will place additional pressure on banks, and arguably, this increased workload will have a disproportionate impact on smaller banks.
22 Integrated Annual Report 2012
Compliance Officer’s report(continued)
Compliance with FICA, as amended, and the Protection of Constitutional Democracy against Terrorist and Related Activities Act, No. 12 of 2004, is ongoing. The requirements provided by these pieces of legislation are set out in the Group anti-money-laundering and anti-terror financing policy, which also incorporates Mercantile’s client acceptance policy. The electronic Anti-Money-Laundering system focuses on transaction monitoring and the detection of potential money laundering activity. This system includes cross-referencing clients against international databases consisting of adverse client information (including persons named on the United Nations’ lists). The Anti-Money-Laundering system was enhanced to address suspicious activity reporting, and to determine potentially suspicious activities. Such activities are further investigated to determine whether they need to be reported to the Financial Intelligence Centre as required by legislation. A further enhancement to the system has been to automate cash threshold reporting, a FICA requirement from December 2010. In accordance with the amended FICA requirements, all Mercantile divisions that are ‘accountable institutions’ have been registeredwith the Financial Intelligence Centre. All cash threshold reports and suspicious transaction reports are submitted to the Financial Intelligence Centre centrally by the Money Laundering Control Officer. The initiative to implement these enhancements in the system is ongoing. Training of staff on anti-money-laundering and related topics remains a key focus area, and the training material is constantly updated to provide for any changes in legislation, international best practice, and industry trends.
Consumer protection regulation continued to be a key focus in 2012, with ongoing monitoring and reporting of compliance with the requirements of FAIS, the NCA and the CPA. The NCA and the CPA have imposed strict requirements on credit and service providers, including affordability assessments, disclosures to consumers, advertising and marketing practices, complaints, pricing, and reporting to the respective regulators. Business processes have been reformulated, and undergo ongoing enhancements to ensure compliance with these pieces of legislation. Compliance carried out extensive training and monitoring reviews throughout the year.
The ongoing implementation of the FAIS Fit and Proper requirements, and especially the requirement for all Key Individuals and Representatives to undertake regulatory examinations, continued as the major imperative for Business and the Compliance function during the year. The Group has a declaration of interest process designed to proactively identify potential conflicts of interest. Emphasis is placed on declaring outside business interests and gifts.
Through the Banking Association of South Africa, a Code of Banking Practice has been endorsed by its members to provide safeguards for consumers. A revised Code came into operation on 1 January 2012, and this will constitute a further major area of focus for Business and Compliance in the coming year.
Compliance risk is managed through internal policies and processes, which include legal, regulatory and business-specific requirements. A compliance tool was developed to assist management in reporting compliance breaches electronically, and thereby supporting Compliance in fulfilling its obligations. The compliance officers provide regular training to ensure that all employees are familiar with their regulatory obligations. They also provide advice on regulatory issues. Compliance staff independently monitor the business units to ensure adherence to policies and procedures, and other technical requirements. Compliance staff work closely with business and operational units to ensure consistent management of compliance risk.
No material incidents of non-compliance were reported during the year under review.
H Stoffberg
Head: Compliance
20 February 2013
Integrated Annual Report 2012 23
Contents Directors’ responsibility statement 24
Certificate from the Company Secretary 24
Independent auditor’s report 25
Audit Committee report 26
Directors’ report 28
Accounting policies 30
Statements of financial position 38
Statements of comprehensive income 39
Statements of changes in equity 40
Statements of cash flows 42
Notes to the annual financial statements 43
Risk management and control 75
In terms of section 29(1)(e)(ii) of the Companies Act, it is confirmed that the preparation of these annual financial statements is the responsibility of Mr K R Kumbier (CA)SA, Deputy CEO.
These annual financial statements have been audited in compliance with the requirements of section 29(1)(e)(i) of the Companies Act.
Annual financial statements
24 Integrated Annual Report 2012
Directors’ responsibility statement
In terms of the Companies Act, the Directors are required to maintain adequate accounting records and prepare annual financial statements that fairly present the financial position at year-end, and the results and cash flows for the year of the Company and the Group.
To enable the Board to discharge its responsibilities, management has developed, and continues to maintain, a system of internal controls. The Board has ultimate responsibility for this system of internal controls, and reviews the effectiveness of its operations, primarily through the GAC and other risk-monitoring committees and functions.
The internal controls include risk-based systems of accounting and administrative controls designed to provide reasonable, but not absolute, assurance that assets are safeguarded and that transactions are executed and recorded in accordance with sound business practices, and the Group’s written policies and procedures. These controls are implemented by trained and skilled staff, with clearly defined lines of accountability and appropriate segregation of duties. The controls are monitored by management, and include a budgeting and reporting system operating within strict deadlines and an appropriate control framework. As part of the system of internal controls, the Group’s internal audit function conducts inspections, and financial and specific audits, and co-ordinates audit coverage with the external auditors.
The external auditors are responsible for reporting on the fair presentation of the Company and Group annual financial statements.
The Company and Group annual financial statements are prepared in accordance with IFRS, issued by the International Accounting Standards Board and incorporate responsible disclosures in line with the accounting policies of the Group. The Company and Group annual financial statements are based on appropriate accounting policies consistently applied, except as otherwise stated, and are supported by reasonable and prudent judgements and estimates. The Board believes that the Group will be a going concern in the year ahead. For this reason, they continue to adopt the going concern basis in preparing the annual financial statements.
Certificate from the Company Secretary
In terms of the provisions of the Companies Act, I certify that, to the best of my knowledge and belief, the Company has lodged with the Registrar of Companies for the financial year ended 31 December 2012, all such returns as are required of a public company in terms of the Companies Act, and that all such returns are true, correct and up to date.
F J Schutte
Acting Company Secretary
20 February 2013
These annual financial statements, set out on pages 26 to 86, have been approved by the Board of Mercantile Bank Holdings Limited, and are signed on their behalf by:
J A S de Andrade Campos D J Brown
Chairman Chief Executive Officer
20 February 2013 20 February 2013
Integrated Annual Report 2012 25
Report on the financial statementsWe have audited the Group annual financial statements and annual financial statements of the Company, which comprise the statements of financial position at 31 December 2012, the statements of comprehensive income, the statements of changes in equity, and the statements of cash flows, for the year then ended, a summary of significant accounting policies and other explanatory information as set out on pages 30 to 86.
Directors’ responsibility for the financial statementsThe Directors are responsible for the preparation and fair presentation of these financial statements in accordance with IFRS, and the requirements of the Companies Act of South Africa, and for such internal control as the Directors determine is necessary to enable the preparation of financial statements that are free from material misstatement, whether due to fraud or error.
Auditor’s responsibilityOur responsibility is to express an opinion on these financial statements, based on our audit. We conducted our audit in accordance with International Standards on Auditing. Those standards require that we comply with ethical requirements, and plan and perform the audit to obtain reasonable assurance whether the financial statements are free from material misstatement.
An audit involves performing procedures to obtain audit evidence about amounts and disclosures in the financial statements. The procedures selected depend on the auditor’s judgement, including the assessment of the risks of material misstatement of the financial statements, whether due to fraud or error. In making those risk assessments, the auditor considers internal controls relevant to the entity’s preparation and fair presentation of the financial statements, in order to design audit procedures that are appropriate in the circumstances, but not for the purpose of expressing an opinion on the effectiveness of the entity’s internal control. An audit also includes evaluating the appropriateness of accounting policies used, and the reasonableness of accounting estimates made by the Directors, as well as evaluating the overall presentation of the financial statements. We believe that the audit evidence we have obtained is sufficient and appropriate to provide a basis for our audit opinion.
Independent auditor’s reportto the shareholder of Mercantile Bank Holdings Limited
OpinionIn our opinion, these financial statements present fairly, in all material respects, the consolidated and separate financial position of the Company as at 31 December 2012, and its consolidated and separate financial performance and cash flows for the year then ended, are in accordance with IFRS and in the manner required by the Companies Act of South Africa.
Other reports required by the Companies ActAs part of our audit of the financial statements for the year ended 31 December 2012, we have read the Audit Committee report and the Directors’ report for the purpose of identifying whether there are material inconsistencies between the reports and the audited financial statements. The reports are the responsibility of the respective preparers. Based on reading the reports, we have not identified material inconsistencies between the reports and the audited financial statements. However, we have not audited the reports, and accordingly do not express an opinion on the reports.
Deloitte & Touche
Registered AuditorsPer Danie CrowtherPartner
20 February 2013
Building 8, Deloitte Place, The Woodlands, Woodmead Drive, Sandton, 2196
National Executive: LL Bam Chief Executive, AE Swiegers Chief Operating Officer, GM Pinnock Audit, DL Kennedy Risk Advisory & Legal Services, NB Kader Tax, TP Pillay Consulting, K Black Clients & Industries, JK Mazzocco Talent & Transformation, CR Beukman Finance, M Jordan Strategy, S Gwala Special Projects, TJ Brown Chairman of the Board, MJ Comber Deputy Chairman of the Board
A full list of partners and directors is available on request
B-BBEE rating: Level 2 contributor in terms of the Charter Accountancy Profession Sector Code
Member of Deloitte Touche Tohmatsu Limited
26 Integrated Annual Report 2012
Audit Committee reportfor the year ended 31 December 2012
The GAC is a committee of the Board and has assumed the responsibilities of an audit committee in respect of all subsidiaries of Mercantile, and therefore a separate GAC has not been formed for the Bank or any other subsidiaries. The GAC assists the Board in fulfilling its monitoring and controlling responsibilities in terms of applicable legislation.
Terms of referenceThe GAC is a Board committee appointed by the Board and is accountable to it. Its powers and terms of reference are delegated to it by the Board, and are formalised in its charter, which is reviewed annually and approved by the Board. The GAC has executed its duties during the past financial year in accordance with its charter and the Companies Act.
CompositionThe GAC comprises four independent Non-Executive Directors. At 31 December 2012, the members were:• LHyne(Chairman)CA(SA)• GPdeKock• THNjikizanaCA(SA)• DNaidooCA(SA)
The CEO, Deputy CEO, head of Finance, representatives from the External and Internal Auditors, and the head of Compliance, attend the committee meetings by invitation. The External and Internal Auditors have unrestricted access to the GAC Chairman, or any other member of the committee, as required.
MeetingsThe GAC held five meetings during the period under review. During their tenure as members of the committee, all members attended each of these meetings.
Statutory dutiesIn execution of its statutory duties during the financial year under review, the GAC:• nominated for appointment as external auditor, Deloitte &
Touche which, in its opinion, is independent of the Company;• determinedthefeestobepaidtoDeloitte&Toucheasdisclosed
in note 26 to the annual financial statements;• determinedDeloitte&Touche’stermsofengagement;• believestheappointmentofDeloitte&Touchecomplieswiththe
relevant provisions of the Companies Act and King III;• pre-approved all non-audit service contracts with Deloitte &
Touche in accordance with its policy;• receivednocomplaintswithregardtoaccountingpracticesand
the internal audit of the Company, the content or auditing of its financial statements, the internal financial controls of the Company, and any other related matters; and
• advised the Board that, regarding matters concerning theCompany’s accounting policies, financial control, records and reporting, it concurs that the adoption of the going concern premise in the preparation of the financial statements, is appropriate.
Internal financial control and internal auditIn the execution of its delegated duties in this area, the GAC has:• reviewed and recommended the internal audit charter for
approval;• evaluatedtheindependence,effectivenessandperformanceof
the internal audit function;• reviewedtheeffectivenessoftheCompany’ssystemofinternal
financial controls;• reviewedsignificant issues raisedby theexternal and internal
audit process, and the adequacy of corrective action in response to such findings;
• obtained assurance from the external auditors that adequateaccounting records were maintained; and
• reviewedpoliciesandproceduresforpreventinganddetectingfraud.
The head of Internal Audit functionally reported to the GAC, and had unrestricted access to the GAC Chairman, and is of the opinion that significant internal financial controls operated effectively during the period under review.
Based on the processes and assurances obtained, the GAC believes that significant internal financial controls are effective.
Regulatory complianceThe GAC has complied with all applicable legal, regulatory and other responsibilities.
External auditBased on processes followed and assurances received, the GAC is satisfied that both Deloitte & Touche and the audit partner, D Crowther, are independent of the Group. The GAC confirmed that no reportable irregularities were identified and reported by the external auditors, in terms of the Auditing Professions Act, No. 26 of 2005.
Based on our satisfaction with the results of the activities outlined above, the GAC has recommended to the Board that Deloitte & Touche should be re-appointed for 2013.
Integrated Annual Report 2012 27
Audit Committee reportfor the year ended 31 December 2012 (continued)
Finance functionThe GAC believes that Mr K R Kumbier, the Deputy CEO, who is responsible for Finance, for the duration of 2012 up to the date of this report, possessed the appropriate expertise and experience to meet his responsibilities in that position. We are also satisfied with the expertise and adequacy of resources within the finance function.
In making these assessments, we have obtained feedback from both external and internal audit.
Based on the processes and assurances obtained, we believe that the accounting practices are effective.
Financial statementsBased on the processes and assurances obtained, we recommend the current annual financial statements be approved by the Board.
On behalf of the GAC
L Hyne
Chairman of the GAC
20 February 2013
28 Integrated Annual Report 2012
Directors’ report for the year ended 31 December 2012
The Directors have pleasure in presenting their report, which forms part of the audited annual financial statements of the Company and the Group for the year ended 31 December 2012.
1. Nature of business
The Company is a registered bank controlling and investment holding company incorporated in the Republic of South Africa. Through its subsidiaries, the Company is involved in the full spectrum of domestic and international banking and financial services to niche markets in business, commercial and alliance banking.
2. Holding company
The 100% shareholder of the Company is CGD (2011: 91.75%).
3. Financial results
An overview of the financial results is set out in the Group Review, commencing on page 6 of the Integrated Annual Report. Details of the Company and Group financial results are set out on pages 30 to 86, and in the opinion of the Directors, require no further comment.
4. Share capital
The Company delisted from the JSE in 2012, and there were no changes to the authorised share capital of the Company during the year (2011: nil). During 2012, 6 576 128 shares were issued (2011: nil) and 331 476 457 shares (2011: nil) were bought back. The authorised and issued share capital of the Company and the Group is detailed in note 15 to the annual financial statements.
5. Directors, Company Secretary and registered addresses
The Directors of the Company during the year were as follows:
J A S de Andrade Campos*+ (Chairman) D J Brown# (CEO) G P de Kock° L Hyne° A T Ikalafeng° K R Kumbier# J P M Lopes*# T H Njikizana^° D Naidoo° (appointed 23 May 2012)
* Portuguese, ^ Zimbabwean, # Executive, ° Independent Non-Executive, + Non-Executive
The Directors of the Company, as at 20 February 2013, and details of their backgrounds, are shown on page 4.
A de Villiers resigned as Company Secretary on 30 June 2012, and her successor, M Naidoo, appointed on 1 July 2012, resigned on 5 December 2012. F J Schutte was appointed as Acting Company Secretary with effect from 6 December 2012:
Postal: Physical:
PO Box 782699 1st Floor Sandton Mercantile Bank 2146 142 West Street Sandown 2196
6. Dividends
A dividend of R29.672 million was declared on 20 February 2013 in respect of the year ended 31 December 2012. (2011: Rnil).
7. Subsidiary companies and companies not consolidated
All subsidiary companies are incorporated in the Republic of South Africa. A register containing details of all non-trading companies is available for inspection at the registered office of the Company.
Aggregate income after tax earned by subsidiaries amounted to R150.2 million (2011: R138.0 million), and aggregate losses amounted to R0.2 million (2011: R2.4 million).
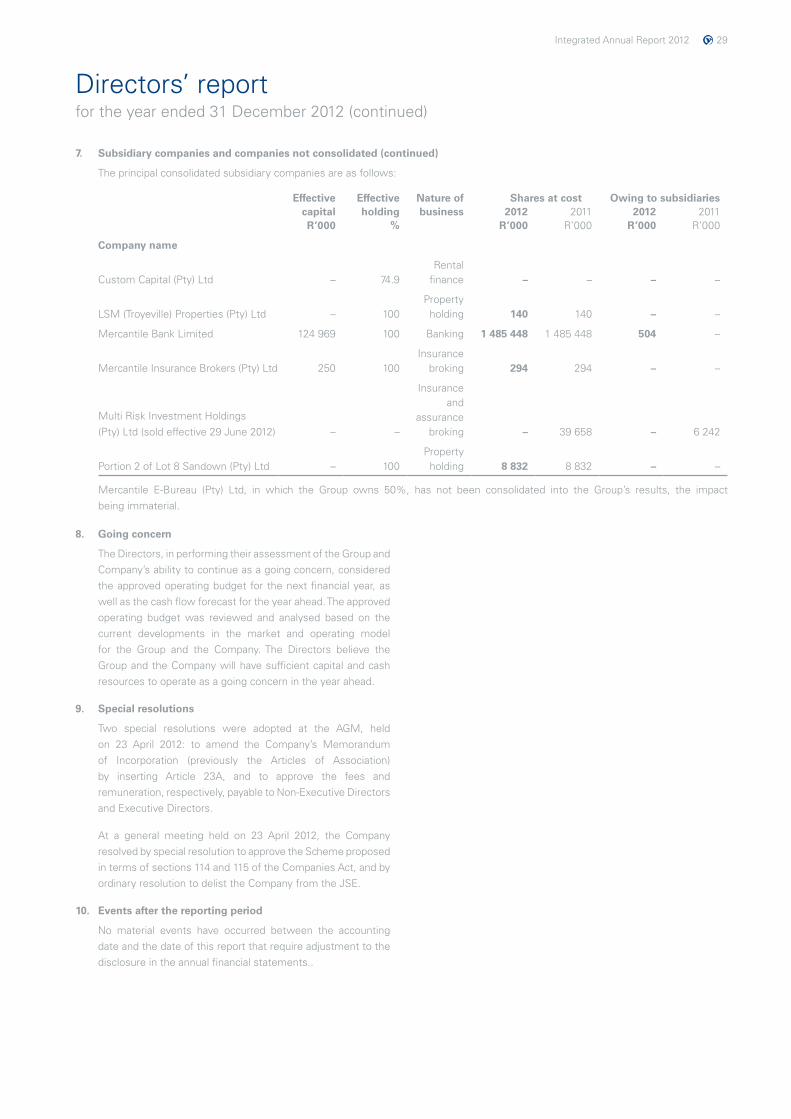
Integrated Annual Report 2012 29
7. Subsidiary companies and companies not consolidated (continued)
The principal consolidated subsidiary companies are as follows:
Effective Effective Nature of Shares at cost Owing to subsidiariescapital holding business 2012 2011 2012 2011R’000 % R’000 R’000 R’000 R’000
Company name
Custom Capital (Pty) Ltd – 74.9Rental
finance – – – –
LSM (Troyeville) Properties (Pty) Ltd – 100Propertyholding 140 140 – –
Mercantile Bank Limited 124 969 100 Banking 1 485 448 1 485 448 504 –
Mercantile Insurance Brokers (Pty) Ltd 250 100Insurance
broking 294 294 – –
Multi Risk Investment Holdings (Pty) Ltd (sold effective 29 June 2012) – –
Insuranceand
assurancebroking – 39 658 – 6 242
Portion 2 of Lot 8 Sandown (Pty) Ltd – 100Propertyholding 8 832 8 832 – –
Mercantile E-Bureau (Pty) Ltd, in which the Group owns 50%, has not been consolidated into the Group’s results, the impact being immaterial.
Directors’ report for the year ended 31 December 2012 (continued)
8. Going concern
The Directors, in performing their assessment of the Group and Company’s ability to continue as a going concern, considered the approved operating budget for the next financial year, as well as the cash flow forecast for the year ahead. The approved operating budget was reviewed and analysed based on the current developments in the market and operating model for the Group and the Company. The Directors believe the Group and the Company will have sufficient capital and cash resources to operate as a going concern in the year ahead.
9. Special resolutions
Two special resolutions were adopted at the AGM, held on 23 April 2012: to amend the Company’s Memorandum of Incorporation (previously the Articles of Association) by inserting Article 23A, and to approve the fees and remuneration, respectively, payable to Non-Executive Directors and Executive Directors.
At a general meeting held on 23 April 2012, the Company resolved by special resolution to approve the Scheme proposed in terms of sections 114 and 115 of the Companies Act, and by ordinary resolution to delist the Company from the JSE.
10. Events after the reporting period
No material events have occurred between the accounting date and the date of this report that require adjustment to the disclosure in the annual financial statements..
30 Integrated Annual Report 2012
Accounting policiesfor the year ended 31 December 2012
The principal accounting policies adopted in the preparation of these annual financial statements are set out below:
1. Basis of presentation
The Company and Group annual financial statements have been prepared in accordance with IFRS, issued by the International Accounting Standards Board, using the historical cost convention as modified by the revaluation of certain financial assets, liabilities and properties.
IFRSs, which became effective in the current reporting period, have had no impact on the Group.
2. Basis of consolidation
Subsidiaries are all entities over which the Group has the power to govern the financial and operating policies generally accompanying a shareholding of more than one-half of the voting rights. The existence and effect of potential voting rights that are currently exercisable or convertible, are considered when assessing whether the Group controls another entity. Subsidiaries are fully consolidated from the date on which control is transferred to the Group. They are de-consolidated from the date that control ceases.
Inter-company transactions, balances and unrealised gains on transactions between Group companies are eliminated. Unrealised losses are also eliminated, unless the transaction provides evidence of impairment of the asset transferred. Accounting policies of subsidiaries have been changed where necessary, to ensure consistency with the policies adopted by the Group.
3. Business combinations
Acquisitions of businesses are accounted for using the acquisition method. The consideration transferred in a business combination is measured at fair value, which is calculated as the sum of the acquisition-date fair values of the assets transferred by the Group, liabilities incurred by the Group to the former owners of the acquiree, and the equity interests issued by the Group in exchange for control of the acquiree. Acquisition-related costs are generally recognised in profit or loss, as incurred. At the acquisition date, the identifiable assets acquired and the liabilities assumed, are recognised at their fair value.
Goodwill is measured as the excess of the sum of the consideration transferred, the amount of any non-controlling interests in the acquiree, and the fair value of the acquirer’s previously held equity interest in the acquiree (if any), over the net of the acquisition-date amounts of the identifiable assets acquired and the liabilities assumed.
The interest of the non-controlling interest in the acquiree is initially measured at the non-controlling interest’s proportion of the net realisable assets of the acquiree.
4. Goodwill
Goodwill arising on an acquisition of a business is carried at cost, as established at the date of acquisition of the business (see accounting policy 3 above), less accumulated impairment losses, if any.
Goodwill is tested for impairment annually. Any impairment loss for goodwill is recognised directly in profit or loss in the consolidated statement of comprehensive income. An impairment loss recognised for goodwill is not reversed in subsequent periods. On disposal of the relevant business, the attributable amount of goodwill is included in the determination of the profit or loss on disposal.
5. Recognition of assets and liabilities
5.1 Assets
The Group recognises assets when it obtains control of a resource as a result of past events, and from which future economic benefits are expected to flow to the Group.
5.2 Liabilities
The Group recognises liabilities when it has a present obligation as a result of past events, and it is probable that an outflow of resources embodying economic benefits will be required to settle the obligation.
5.3 Provisions
Provisions are recognised when the Group has a present legal or constructive obligation as a result of past events, and it is probable that an outflow of resources embodying economic benefits will be required to settle the obligation, and a reliable estimate of the amount of the obligation can be made.
5.4 Contingent liabilities
The Group discloses a contingent liability where it has a possible obligation as a result of past events, the existence of which will be confirmed only by the occurrence or non-occurrence of one or more uncertain future events not wholly within the control of the Group, or it is possible that an outflow of resources will be required to settle the obligation, or the amount of the obligation cannot be measured with sufficient reliability.
6. Financial instruments
Financial assets and financial liabilities are recognised in the Group’s statement of financial position when the Group has become a party to the contractual provisions of that instrument. Regular way purchases or sales of financial assets are recognised using settlement date accounting. On initial recognition, financial instruments are recognised at their fair value, and in the case of a financial instrument not at fair value, through profit and loss; transaction costs that are directly attributable to the acquisition or issue of the financial instrument are included.
Integrated Annual Report 2012 31
6. Financial instruments (continued)
The Group derecognises a financial asset when: • the contractual rights to the cash flows arising from the
financial assets have expired or have been forfeited by the Group; or
• ittransfersthefinancialasset,includingsubstantially,alltherisks and rewards of ownership of the asset; or
• it transfers the financial asset, neither retaining nortransferring substantially, all the risks and rewards of ownership of the asset, but no longer retaining control of the asset.
A financial liability is derecognised when, and only when, the liability is extinguished, that is, when the obligation specified in the contract is discharged, cancelled or has expired.
The difference between the carrying amount of a financial liability (or part thereof) extinguished or transferred to another party and consideration paid, including any non-cash assets transferred or liabilities assumed, is recognised in profit and loss.
6.1 Derivative financial instruments
Derivative financial assets and liabilities are classified as held-for-trading.
The Group uses the following derivative financial instruments to reduce its underlying financial risks and/or to enhance returns:
• forwardexchangecontracts; • foreigncurrencyswaps; • interestrateswaps;and • unlistedequityoptions.
Derivative financial instruments (“derivatives”) are not entered into for trading or speculative purposes. All derivatives are recognised in the statement of financial position. Derivative financial instruments are recorded at cost, and are measured to fair value, excluding transactions costs, at each reporting date. Changes in the fair value of derivatives are recognised in profit and loss.
Derivatives in unlisted equity options, where the underlying asset does not have a quoted market price in an active market, and whose fair value cannot be reliably measured, and derivatives that are linked to and must be settled by, delivery of such unquoted equity instruments, are measured at cost, less impairment.
A derivative’s notional principal reflects the value of the Group’s investment in derivative financial instruments, and represents the amount to which a rate or price is applied to calculate the exchange of cash flows.
6.2 Financial assets
The Group’s principal financial assets are cash and cash equivalents, bank term deposits, other investments, negotiable securities, loans and advances, and other accounts receivable.
Financial assets at fair value through profit and loss
Financial assets are designated at fair value through profit and loss, primarily to eliminate or significantly reduce the accounting mismatch. The Group seeks to demonstrate that by applying the fair value option, which measures fair value gains and losses in profit and loss, it significantly reduces measurement inconsistency that would otherwise arise from measuring derivatives and such designated financial assets, at amortised cost.
Available-for-sale financial assets
Available-for-sale financial assets are those non-derivatives that are designated as available-for-sale, or are not classified as loans and receivables, held to maturity investments or financial assets at fair value through profit and loss.
Cash and cash equivalents
Cash and cash equivalents comprise cash on hand, deposits held by the Group with the SARB, domestic banks, foreign banks and Money Market funds. These financial assets have been designated as loans and receivables, and are measured at amortised cost.
Bank term deposits
Bank term deposits comprise deposits held by the Group with domestic and foreign banks, with a residual maturity of greater than three months. These financial assets have been designated as loans and receivables, and are measured at amortised cost.
Other investments
Investments consist of unlisted and listed equity investments. Other investments, which are an integral part of the Group’s structured loan portfolio, are designated at fair value through profit and loss. All other investments have been designated as available-for-sale. These assets are measured at fair value at each reporting date, with the resultant gains or losses being recognised in other comprehensive income until the financial asset is sold or otherwise disposed of. At that time, the cumulative gains or losses previously recognised in other comprehensive income, are included in profit and loss.
Negotiable securities
Negotiable securities consist of government stock, treasury bills, debentures and promissory notes.
Accounting policiesfor the year ended 31 December 2012 (continued)
32 Integrated Annual Report 2012
Accounting policiesfor the year ended 31 December 2012 (continued)
6. Financial instruments (continued)
6.2 Financial assets (continued) Negotiable securities (continued) Government stock has been designated as available-for-
sale. These assets are measured at fair value at each reporting date, with the resultant gains or losses being recognised in other comprehensive income until the financial asset is sold, otherwise disposed of, or found to be impaired. At that time, the cumulative gains or losses previously recognised in other comprehensive income, are included in profit and loss.
All other negotiable securities are classified as loans and receivables, and are carried at amortised cost subject to impairment.
Loans and advances Loans and advances principally comprise amounts
advanced to third parties in terms of certain products. Fixed rate loans and advances are designated at fair value through profit and loss, with resultant gains and losses being included in profit and loss. Variable rate loans and advances are designated as loans and receivables, and are measured at amortised cost.
Interest on non-performing loans and advances is not recognised to profit and loss, but is suspended. In certain instances, interest is also suspended where portfolio impairments are recognised.
Other account receivables Other accounts receivable comprise items in transit,
pre-payments and deposits, and other receivables. These assets have been designated as loans and receivables, and are measured at amortised cost.
6.3 Financial liabilities The Group’s financial liabilities include deposits and other
accounts payable, consisting of accruals, product-related credits, and sundry creditors. All financial liabilities, other than liabilities designated at fair value through profit and loss and derivative instruments, are measured at amortised cost. For financial liabilities designated at fair value through profit and loss, and derivative instruments which are measured at fair value through profit and loss, the resultant gains and losses are included in profit and loss.
6.4 Fair value estimation The fair value of publicly traded derivatives, securities
and investments is based on quoted market values at the reporting date. In the case of an asset held by the Group, the current bid price is used as a measure of fair value. In the case of a liability held, the current offer or asking price is used as a measure of fair value. Mid-market prices are used as a measure of fair value, where there are matching asset and liability positions.
In assessing the fair value of non-traded derivatives and other financial instruments, the Group uses a variety of methods and assumptions that are based on market conditions and risks existing at each reporting date. Quoted market prices or dealer quotes for the same or similar instruments are used for the majority of securities, long-term investments, and long-term debt. Other techniques, such as earnings multiples, option pricing models, estimated discounted value of future cash flows, replacement cost, termination cost, and net asset values of underlying investee entities, are used to determine fair value for all remaining financial instruments.
6.5 Amortised cost Amortised cost is determined using the effective interest
rate method. The effective interest rate method is a way of calculating amortisation using the effective interest rate of a financial asset or financial liability. It is the rate that discounts the expected stream of future cash flows to maturity, or the next market-based revaluation date, to the current net carrying amount of the financial asset or financial liability.
6.6 Impairments Specific impairments are made against identified financial
assets. Portfolio impairments are maintained to cover potential losses which, although not specifically identified, may be present in the advances portfolio.
Advances which are deemed uncollectible, are written off against the specific impairments. A direct reduction of an impaired financial asset occurs when the Group writes off an impaired account. The Group’s policies set out the criteria for write-offs, which involve an assessment of the likelihood of commercially viable recovery of the carrying amount of impaired financial assets. Both the specific and portfolio impairments raised during the year, less the recoveries of advances previously written off, are charged to profit and loss.
The recoverable amount is the sum of the estimated future cash flows, discounted to their present value, using a pre-tax discount rate that reflects the portfolio of advances’ effective interest rate.
If the recoverable amount of the advance is estimated to be less than the carrying amount, the carrying amount of the advance is reduced to its recoverable amount by raising a specific impairment, which is recognised as an expense. Where the impairment loss subsequently reverses, the carrying amount of the advance is increased to the revised estimate of its recoverable amount, subject to the increased carrying amount, not exceeding the carrying amount that would have been determined, had no impairment loss been recognised for the advance in prior years. A reversal of an impairment loss is recognised through profit and loss immediately, except for the reversal of an impairment of equity instruments designated as available-for-sale, which is recognised in other comprehensive income.
Integrated Annual Report 2012 33
Accounting policiesfor the year ended 31 December 2012 (continued)
7. Foreign currency transactions
Transactions in foreign currencies are converted into the functional currency at prevailing exchange rates on the transaction date. Monetary assets, liabilities and commitments in foreign currencies are translated into the functional currency using the rates of exchange ruling at each reporting date. Gains and losses on foreign exchange are included in profit and loss.
8. Subsidiaries
Investments in subsidiaries in the Company’s annual financial statements are designated as available-for-sale assets, and are recognised at fair value. All gains and losses on the sale of subsidiaries are recognised in profit and loss.
9. Associated companies
Associated companies are those companies in which the Group exercises significant influence, but has no control or joint control over their financial and operating policies, and holds between 20% and 50% interest therein.
The carrying values of investments in associated companies represent the aggregate of the cost of the investments, plus post-acquisition equity-accounted income and reserves. These investments are accounted for using the equity method in the Group’s annual financial statements. This method is applied from the effective date on which the enterprise became an associated company, up to the date on which it ceases to be an associated company.
The results and assets and liabilities of associated companies are incorporated in the financial statements using the equity method of accounting.
10. Investment properties
Investment properties are held to earn rentals and/or for capital appreciation. The Group carries investment properties in the statement of financial position at open-market fair value, based on valuations by independent registered professional valuators at each reporting date. The open-market fair value is based on capitalisation rates for open-market net rentals for each property. Fair value movements are included in profit and loss in the year in which they arise.
11. Property and equipment
Owner-occupied properties are held for use in the supply of services or for administrative purposes, and are stated in the statement of financial position at open-market fair value on the basis of their existing use, at the date of revaluation, less any subsequent accumulated depreciation calculated using the straight-line method and subsequent accumulated impairment losses. The open-market fair value is based on capitalisation rates for open-market net rentals for each property. Revaluations are performed annually by independent registered professional valuators.
Any revaluation increase, arising on the revaluation of owner-occupied properties, is credited to other comprehensive income, except to the extent that it reverses a revaluation decrease for the same asset previously recognised as an expense. The increase is credited to profit and loss, to the extent that an expense was previously charged to profit and loss. A decrease in the carrying amount arising on the revaluation of owner-occupied properties, is charged as an expense to the extent that it exceeds the balance, if any, held in the non-distributable reserve relating to a previous revaluation of that asset. On the subsequent sale or retirement of a revalued property, the revaluation surplus relating to that property in the non-distributable reserve, is transferred to distributable reserves. The properties’ residual values and useful lives, are reviewed and adjusted, if appropriate, at each reporting date.
All equipment is stated at historical cost, less accumulated depreciation and subsequent accumulated impairment losses. Historical cost includes expenditure that is directly attributable to the acquisition of the items. Subsequent costs are included in the asset’s carrying amount, or are recognised as a separate asset, as appropriate, only when it is probable that future economic benefits associated with the item will flow to the Group, and the cost of the item can be measured reliably. All other repairs and maintenance are charged to profit and loss as they are incurred.
Depreciation on equipment is calculated using the straight-line method, to allocate cost to residual values over estimated useful lives. Leasehold improvements are depreciated over the period of the lease, or over such lesser period as is considered appropriate. Equipment residual values and useful lives are reviewed for impairment where there are indicators of impairment, and adjusted, if appropriate, at each reporting date.
Assets are reviewed for impairment whenever events or changes in circumstances indicate that the carrying amount may not be recoverable. An asset’s carrying amount is written down immediately to its recoverable amount, if the asset’s carrying amount is greater than its estimated recoverable amount. The recoverable amount is the higher of the asset’s fair value, less costs to sell, or its value in use.
The estimated useful lives of property and equipment are as follows:
Leaseholdimprovements 5–10years Computerequipment 3–5years Furniture and fittings 10 years Officeequipment 5–10years Motor vehicles 5 years Owner-occupied properties 50 years Land Not depreciated
34 Integrated Annual Report 2012
11. Property and equipment (continued)
Gains and losses on disposal of property and equipment are determined by comparing proceeds with the carrying amount, and are recognised in profit and loss. Depreciation of an asset begins when it is available for use, and ceases at the earlier of the dates that the asset is classified as held for sale, or the date the asset is derecognised.
12. Intangible assets
12.1 Computer software
Direct costs associated with purchasing, developing and maintaining computer software programmes, and the acquisition of software licences, are recognised as intangible assets if they are expected to generate future economic benefits that exceed related costs beyond one year.
Computer software and licences that are recognised as intangible assets are amortised on the straight-line basis, at rates appropriate to the expected useful lives of the assets, which is usually between three and five years, but where appropriate, over a maximum of 10 years, and are carried at cost less any accumulated amortisation and any accumulated impairment losses.
12.2 Intangible assets acquired in a business combination
Intangible assets acquired in a business combination and recognised separately from goodwill, are initially recognised at their fair value at the acquisition date (which is regarded as their cost). Such assets are amortised on the straight-line basis, at rates appropriate to the expected useful lives of the assets, which is usually between one and five years.
Subsequent to initial recognition, intangible assets acquired in a business combination are reported at cost, less accumulated amortisation and accumulated impairment losses, on the same basis as intangible assets that are acquired separately.
12.3 De-recognition of intangible assets
An intangible asset is de-recognised on disposal, or when no future economic benefits are expected from use or disposal. Gains or losses arising from de-recognition of an intangible asset, measured as the difference between the net disposal proceeds and the carrying amount of the asset, are recognised in profit or loss when the asset is derecognised.
12.4 Impairment of intangible assets
At the end of each reporting period, the Group reviews the carrying amounts of intangible assets, to determine whether there is any indication that those assets have suffered an impairment loss. If any such indication exists, the recoverable amount of the asset is estimated in order to determine the extent of the impairment loss.
The recoverable amount is the higher of fair value, less costs to sell or its value in use. If the recoverable amount is estimated to be less than its carrying amount, the carrying amount is reduced to its recoverable amount. An impairment loss is immediately recognised in profit and loss.
Intangible assets with indefinite useful lives and intangible assets not yet available for use, are tested for impairment at least annually, and whenever there is an indication that the asset may be impaired.
13. Non-current assets held for sale
Non-current assets are classified as held for sale if their carrying amount will be recovered principally through a sale transaction, rather than through continuing use. This condition is regarded as met, only when the sale is probable within 12 months, the asset is available for immediate sale in its present condition, and management is committed to the sale.
Non-current assets classified as held for sale are measured at the lower of their carrying amount and fair value, less costs to sell.
14. Tax
Income tax expense represents the sum of the tax currently payable, and deferred tax.
14.1 Current tax
The tax currently payable is based on taxable profit for the year. Taxable profit differs from profit as reported in the statement of comprehensive income, because it excludes items of income or expense that are taxable or deductible in other years, and it further excludes items that are neither taxable nor deductible. The Group’s liability for current tax is calculated using tax rates that have been enacted or substantively enacted by the reporting date.
14.2 Deferred tax
Deferred tax is recognised on differences between the carrying amounts of assets and liabilities in the financial statements, and the corresponding tax bases used in the computation of taxable profit, and is accounted for using the balance sheet liability method. Deferred tax liabilities are generally recognised for all taxable temporary differences, and deferred tax assets are generally recognised for all deductible temporary differences, to the extent that it is probable that taxable profits will be available against which those deductible temporary differences can be utilised. Such assets and liabilities are not recognised if the temporary difference arises from goodwill, or from the initial recognition (other than in a business combination) of other assets and liabilities, in a transaction that affects neither the taxable profit nor the accounting profit.
Accounting policiesfor the year ended 31 December 2012 (continued)
Integrated Annual Report 2012 35
Accounting policiesfor the year ended 31 December 2012 (continued)
14. Tax (continued)
14.2 Deferred tax (continued)
Deferred tax liabilities are recognised for taxable temporary differences associated with investments in subsidiaries and associates, and interests in joint ventures, except where the Group is able to control the reversal of the temporary difference, and it is probable that the temporary difference will not reverse in the foreseeable future.
Deferred tax assets arising from deductible temporary differences associated with such investments and interests, are only recognised to the extent that it is probable that there will be sufficient taxable profits against which to utilise the benefits of the temporary differences, and that they are expected to reverse in the foreseeable future.
The carrying amount of deferred tax assets is reviewed at each reporting date, and is reduced to the extent that it is no longer probable that sufficient taxable profits will be available to allow all or part of the asset to be recovered.
Deferred tax assets and liabilities are measured at the tax rates that are expected to apply in the period in which the liability is settled or the asset realised, based on tax rates (and tax laws) that have been enacted or substantively enacted by the reporting date. The measurement of deferred tax liabilities and assets reflects the tax consequences that would follow from the manner in which the Group expects, at the reporting date, to recover or settle the carrying amount of its assets and liabilities.
Deferred tax assets and liabilities are offset when there is a legally enforceable right to set-off current tax assets against current tax liabilities, and when they relate to income taxes levied by the same tax authority, and the Group intends to settle its current tax assets and liabilities on a net basis.
14.3 Current and deferred tax for the year
Current and deferred tax are recognised as an expense or income in profit or loss, except when they relate to items credited or debited to other comprehensive income, in which case, the tax is recognised in other comprehensive income.
15. Instalment sales and leases
15.1 Group as the lessee
Leases entered into by the Group (including rental assets) are primarily operating leases. The total payments made under operating leases are charged to profit and loss on a straight-line basis over the period of the lease. When an operating lease is terminated before the lease period has expired, any payment required to
be made to the lessor by way of penalty is recognised as an expense in the period in which termination takes place.
15.2 The Group as the lessor Leases and instalment sale agreements are regarded
as financing transactions with rentals and instalments receivable, less unearned finance charges being included in advances. Lease income is recognised over the term of the lease using the net investment method, which reflects a constant periodic rate of return.
16. Interest income and interest expense
Except where interest is suspended, interest income and expense are recognised in profit and loss for all interest-bearing instruments measured at amortised cost, using the effective interest method. The effective interest rate is the rate that exactly discounts estimated future cash payments or receipts through the expected life of the financial instrument or, when appropriate, a shorter period to the net carrying amount of the financial asset or financial liability. When calculating the effective interest rate, the Group estimates cash flows considering all contractual terms of the financial instrument, but does not consider future credit losses. The calculation includes all fees and basis points paid or received between parties to the contract that are an integral part of the effective interest rate, transaction costs and all other premiums or discounts.
17. Fee, commission and dividend income
Fees and commissions are recognised on an accrual basis, unless included in the effective interest rate. Dividend income from investments is recognised when the shareholder’s right to receive payment has been established.
18. Retirement funds
The Group operates a defined contribution fund, the assets of which are in the process of being transferred to an independently trustee-administered umbrella fund. The retirement fund is funded by payments from employees and by the relevant Group companies. The Group contributions to the retirement funds are based on a percentage of the payroll, and are charged to profit and loss, as accrued.
19. Post-retirement medical benefits
The Group provides for post-retirement medical benefits to certain retired employees. These benefits are only applicable to employees who were members of the Group’s medical aid scheme prior to May 2000, and who elected to retain the benefits in 2005, and are based on these employees remaining in service up to retirement age. The Group provides for the present value of the obligations in excess of the fair value of the plan assets, which are intended to offset the expected costs relating to the post-retirement medical benefits. The costs of the defined benefit plan are assessed using the projected unit credit method. Under this method, the cost of providing post-retirement medical benefits is charged to profit and loss, so as to spread the regular cost over the service lives of employees in accordance with the advice of qualified actuaries, who value the plans annually. Actuarial gains and
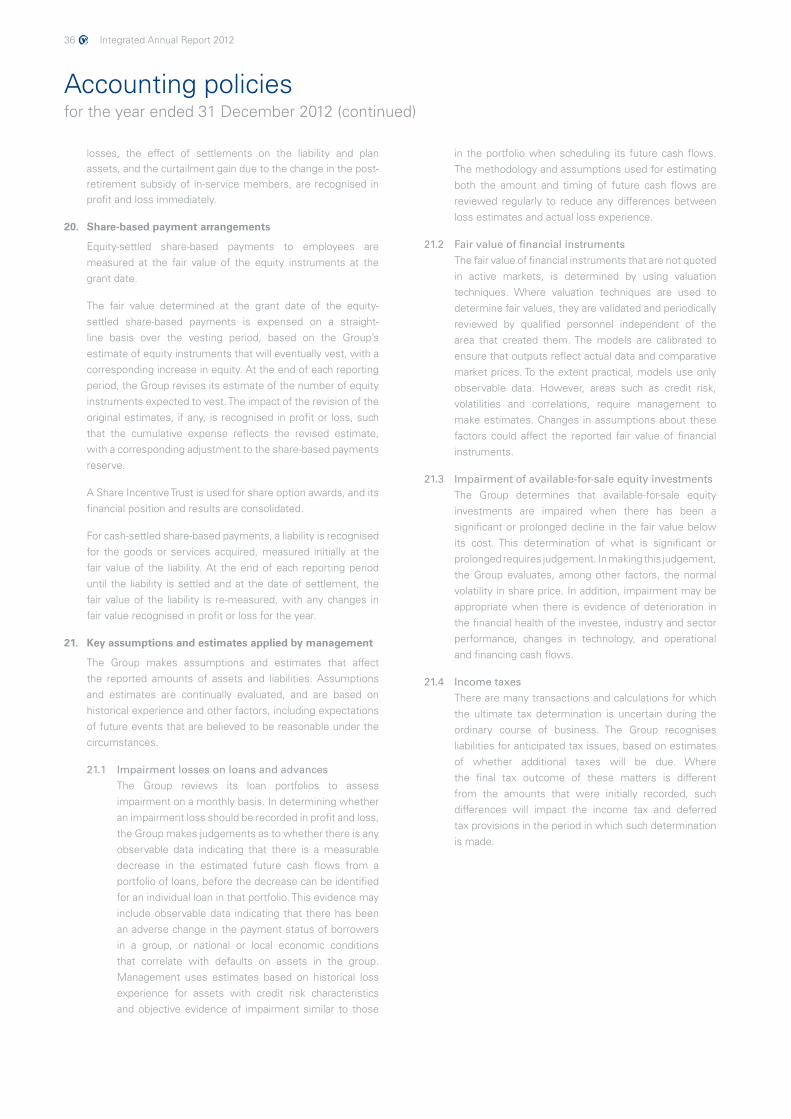
36 Integrated Annual Report 2012
losses, the effect of settlements on the liability and plan assets, and the curtailment gain due to the change in the post-retirement subsidy of in-service members, are recognised in profit and loss immediately.
20. Share-based payment arrangements
Equity-settled share-based payments to employees are measured at the fair value of the equity instruments at the grant date.
The fair value determined at the grant date of the equity-settled share-based payments is expensed on a straight-line basis over the vesting period, based on the Group’s estimate of equity instruments that will eventually vest, with a corresponding increase in equity. At the end of each reporting period, the Group revises its estimate of the number of equity instruments expected to vest. The impact of the revision of the original estimates, if any, is recognised in profit or loss, such that the cumulative expense reflects the revised estimate, with a corresponding adjustment to the share-based payments reserve.
A Share Incentive Trust is used for share option awards, and its financial position and results are consolidated.
For cash-settled share-based payments, a liability is recognised for the goods or services acquired, measured initially at the fair value of the liability. At the end of each reporting period until the liability is settled and at the date of settlement, the fair value of the liability is re-measured, with any changes in fair value recognised in profit or loss for the year.
21. Key assumptions and estimates applied by management
The Group makes assumptions and estimates that affect the reported amounts of assets and liabilities. Assumptions and estimates are continually evaluated, and are based on historical experience and other factors, including expectations of future events that are believed to be reasonable under the circumstances.
21.1 Impairment losses on loans and advances
The Group reviews its loan portfolios to assess impairment on a monthly basis. In determining whether an impairment loss should be recorded in profit and loss, the Group makes judgements as to whether there is any observable data indicating that there is a measurable decrease in the estimated future cash flows from a portfolio of loans, before the decrease can be identified for an individual loan in that portfolio. This evidence may include observable data indicating that there has been an adverse change in the payment status of borrowers in a group, or national or local economic conditions that correlate with defaults on assets in the group. Management uses estimates based on historical loss experience for assets with credit risk characteristics and objective evidence of impairment similar to those
in the portfolio when scheduling its future cash flows. The methodology and assumptions used for estimating both the amount and timing of future cash flows are reviewed regularly to reduce any differences between loss estimates and actual loss experience.
21.2 Fair value of financial instruments
The fair value of financial instruments that are not quoted in active markets, is determined by using valuation techniques. Where valuation techniques are used to determine fair values, they are validated and periodically reviewed by qualified personnel independent of the area that created them. The models are calibrated to ensure that outputs reflect actual data and comparative market prices. To the extent practical, models use only observable data. However, areas such as credit risk, volatilities and correlations, require management to make estimates. Changes in assumptions about these factors could affect the reported fair value of financial instruments.
21.3 Impairment of available-for-sale equity investments
The Group determines that available-for-sale equity investments are impaired when there has been a significant or prolonged decline in the fair value below its cost. This determination of what is significant or prolonged requires judgement. In making this judgement, the Group evaluates, among other factors, the normal volatility in share price. In addition, impairment may be appropriate when there is evidence of deterioration in the financial health of the investee, industry and sector performance, changes in technology, and operational and financing cash flows.
21.4 Income taxes
There are many transactions and calculations for which the ultimate tax determination is uncertain during the ordinary course of business. The Group recognises liabilities for anticipated tax issues, based on estimates of whether additional taxes will be due. Where the final tax outcome of these matters is different from the amounts that were initially recorded, such differences will impact the income tax and deferred tax provisions in the period in which such determination is made.
Accounting policiesfor the year ended 31 December 2012 (continued)
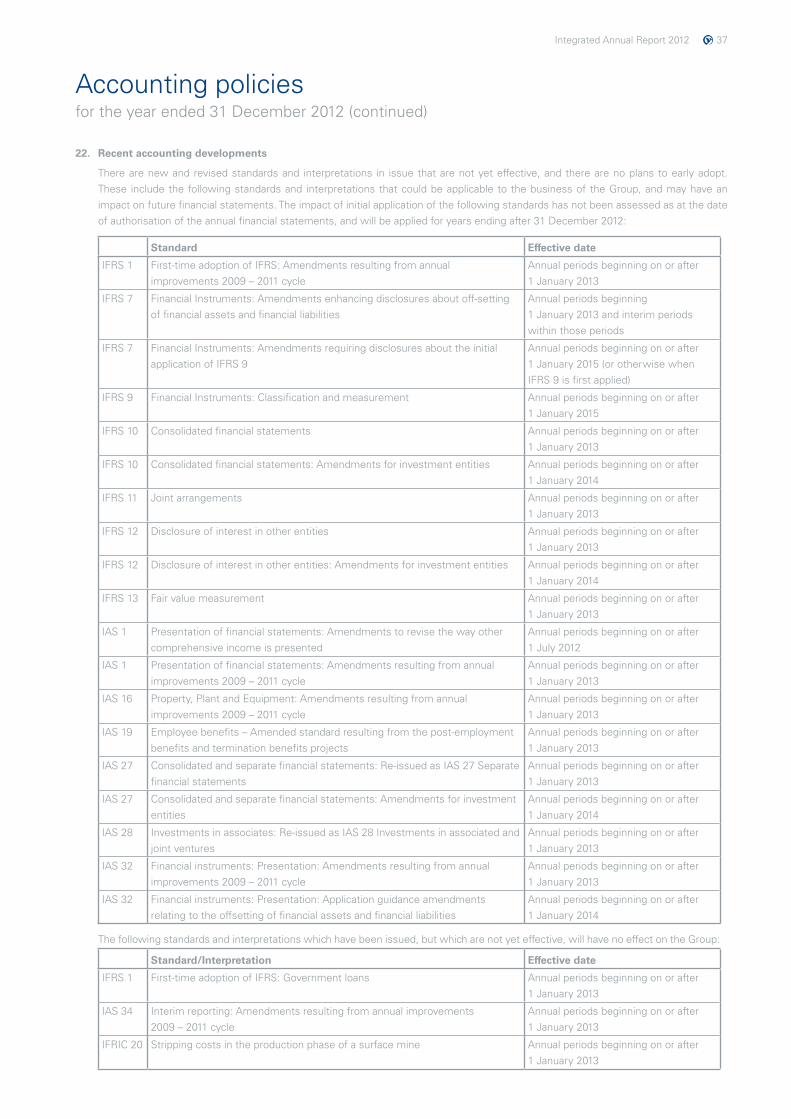
Integrated Annual Report 2012 37
Accounting policiesfor the year ended 31 December 2012 (continued)
22. Recent accounting developments
There are new and revised standards and interpretations in issue that are not yet effective, and there are no plans to early adopt. These include the following standards and interpretations that could be applicable to the business of the Group, and may have an impact on future financial statements. The impact of initial application of the following standards has not been assessed as at the date of authorisation of the annual financial statements, and will be applied for years ending after 31 December 2012:
Standard Effective date
IFRS 1 First-time adoption of IFRS: Amendments resulting from annual improvements2009–2011cycle
Annual periods beginning on or after 1 January 2013
IFRS 7 Financial Instruments: Amendments enhancing disclosures about off-setting of financial assets and financial liabilities
Annual periods beginning 1 January 2013 and interim periods within those periods
IFRS 7 Financial Instruments: Amendments requiring disclosures about the initial application of IFRS 9
Annual periods beginning on or after 1 January 2015 (or otherwise when IFRS 9 is first applied)
IFRS 9 Financial Instruments: Classification and measurement Annual periods beginning on or after 1 January 2015
IFRS 10 Consolidated financial statements Annual periods beginning on or after 1 January 2013
IFRS 10 Consolidated financial statements: Amendments for investment entities Annual periods beginning on or after 1 January 2014
IFRS 11 Joint arrangements Annual periods beginning on or after 1 January 2013
IFRS 12 Disclosure of interest in other entities Annual periods beginning on or after 1 January 2013
IFRS 12 Disclosure of interest in other entities: Amendments for investment entities Annual periods beginning on or after 1 January 2014
IFRS 13 Fair value measurement Annual periods beginning on or after 1 January 2013
IAS 1 Presentation of financial statements: Amendments to revise the way other comprehensive income is presented
Annual periods beginning on or after 1 July 2012
IAS 1 Presentation of financial statements: Amendments resulting from annual improvements2009–2011cycle
Annual periods beginning on or after 1 January 2013
IAS 16 Property, Plant and Equipment: Amendments resulting from annual improvements2009–2011cycle
Annual periods beginning on or after 1 January 2013
IAS 19 Employeebenefits–Amendedstandardresultingfromthepost-employmentbenefits and termination benefits projects
Annual periods beginning on or after 1 January 2013
IAS 27 Consolidated and separate financial statements: Re-issued as IAS 27 Separate financial statements
Annual periods beginning on or after 1 January 2013
IAS 27 Consolidated and separate financial statements: Amendments for investment entities
Annual periods beginning on or after 1 January 2014
IAS 28 Investments in associates: Re-issued as IAS 28 Investments in associated and joint ventures
Annual periods beginning on or after 1 January 2013
IAS 32 Financial instruments: Presentation: Amendments resulting from annual improvements2009–2011cycle
Annual periods beginning on or after 1 January 2013
IAS 32 Financial instruments: Presentation: Application guidance amendments relating to the offsetting of financial assets and financial liabilities
Annual periods beginning on or after 1 January 2014
The following standards and interpretations which have been issued, but which are not yet effective, will have no effect on the Group:
Standard/Interpretation Effective date
IFRS 1 First-time adoption of IFRS: Government loans Annual periods beginning on or after 1 January 2013
IAS 34 Interim reporting: Amendments resulting from annual improvements 2009–2011cycle
Annual periods beginning on or after 1 January 2013
IFRIC 20 Stripping costs in the production phase of a surface mine Annual periods beginning on or after 1 January 2013
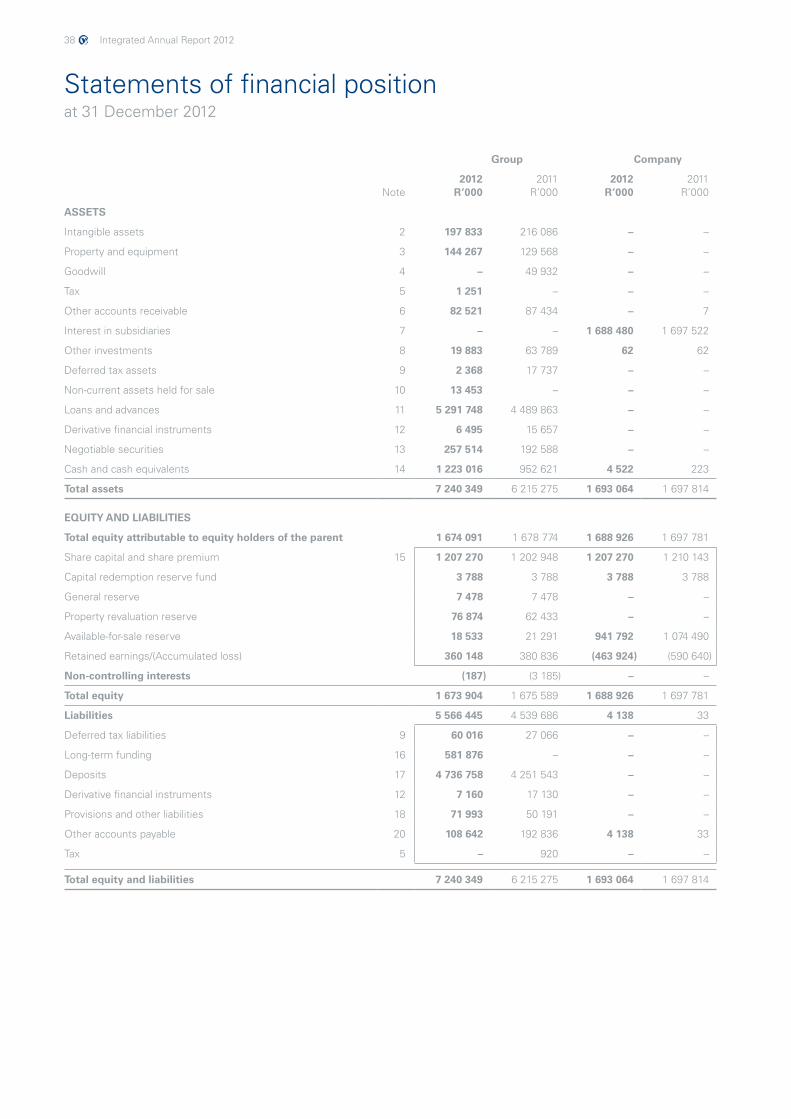
38 Integrated Annual Report 2012
Statements of financial positionat 31 December 2012
Group Company
Note2012
R’000 2011
R’000 2012
R’000 2011
R’000
ASSETS
Intangible assets 2 197 833 216 086 – –
Property and equipment 3 144 267 129 568 – –
Goodwill 4 – 49 932 – –
Tax 5 1 251 – – –
Other accounts receivable 6 82 521 87 434 – 7
Interest in subsidiaries 7 – – 1 688 480 1 697 522
Other investments 8 19 883 63 789 62 62
Deferred tax assets 9 2 368 17 737 – –
Non-current assets held for sale 10 13 453 – – –
Loans and advances 11 5 291 748 4 489 863 – –
Derivative financial instruments 12 6 495 15 657 – –
Negotiable securities 13 257 514 192 588 – –
Cash and cash equivalents 14 1 223 016 952 621 4 522 223
Total assets 7 240 349 6 215 275 1 693 064 1 697 814
EQUITY AND LIABILITIES
Total equity attributable to equity holders of the parent 1 674 091 1 678 774 1 688 926 1 697 781
Share capital and share premium 15 1 207 270 1 202 948 1 207 270 1 210 143
Capital redemption reserve fund 3 788 3 788 3 788 3 788
General reserve 7 478 7 478 – –
Property revaluation reserve 76 874 62 433 – –
Available-for-sale reserve 18 533 21 291 941 792 1 074 490
Retained earnings/(Accumulated loss) 360 148 380 836 (463 924) (590 640)
Non-controlling interests (187) (3 185) – –
Total equity 1 673 904 1 675 589 1 688 926 1 697 781
Liabilities 5 566 445 4 539 686 4 138 33
Deferred tax liabilities 9 60 016 27 066 – –
Long-term funding 16 581 876 – – –
Deposits 17 4 736 758 4 251 543 – –
Derivative financial instruments 12 7 160 17 130 – –
Provisions and other liabilities 18 71 993 50 191 – –
Other accounts payable 20 108 642 192 836 4 138 33
Tax 5 – 920 – –
Total equity and liabilities 7 240 349 6 215 275 1 693 064 1 697 814
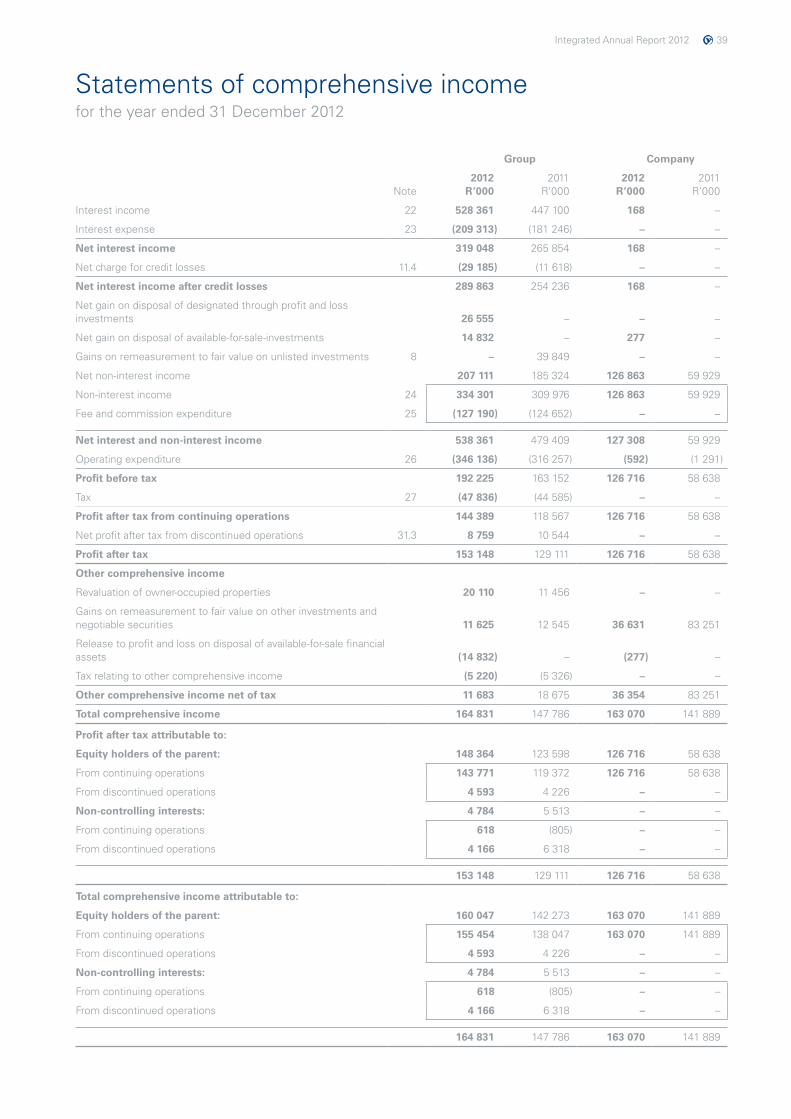
Integrated Annual Report 2012 39
Statements of comprehensive incomefor the year ended 31 December 2012
Group Company
Note2012
R’000 2011
R’000 2012
R’000 2011
R’000
Interest income 22 528 361 447 100 168 –
Interest expense 23 (209 313) (181 246) – –
Net interest income 319 048 265 854 168 –
Net charge for credit losses 11.4 (29 185) (11 618) – –
Net interest income after credit losses 289 863 254 236 168 –
Net gain on disposal of designated through profit and loss investments 26 555 – – –
Net gain on disposal of available-for-sale-investments 14 832 – 277 –
Gains on remeasurement to fair value on unlisted investments 8 – 39 849 – –
Net non-interest income 207 111 185 324 126 863 59 929
Non-interest income 24 334 301 309 976 126 863 59 929
Fee and commission expenditure 25 (127 190) (124 652) – –
Net interest and non-interest income 538 361 479 409 127 308 59 929
Operating expenditure 26 (346 136) (316 257) (592) (1 291)
Profit before tax 192 225 163 152 126 716 58 638
Tax 27 (47 836) (44 585) – –
Profit after tax from continuing operations 144 389 118 567 126 716 58 638
Net profit after tax from discontinued operations 31.3 8 759 10 544 – –
Profit after tax 153 148 129 111 126 716 58 638
Other comprehensive income
Revaluation of owner-occupied properties 20 110 11 456 – –
Gains on remeasurement to fair value on other investments and negotiable securities 11 625 12 545 36 631 83 251
Release to profit and loss on disposal of available-for-sale financial assets (14 832) – (277) –
Tax relating to other comprehensive income (5 220) (5 326) – –
Other comprehensive income net of tax 11 683 18 675 36 354 83 251
Total comprehensive income 164 831 147 786 163 070 141 889
Profit after tax attributable to:
Equity holders of the parent: 148 364 123 598 126 716 58 638
From continuing operations 143 771 119 372 126 716 58 638
From discontinued operations 4 593 4 226 – –
Non-controlling interests: 4 784 5 513 – –
From continuing operations 618 (805) – –
From discontinued operations 4 166 6 318 – –
153 148 129 111 126 716 58 638
Total comprehensive income attributable to:
Equity holders of the parent: 160 047 142 273 163 070 141 889
From continuing operations 155 454 138 047 163 070 141 889
From discontinued operations 4 593 4 226 – –
Non-controlling interests: 4 784 5 513 – –
From continuing operations 618 (805) – –
From discontinued operations 4 166 6 318 – –
164 831 147 786 163 070 141 889
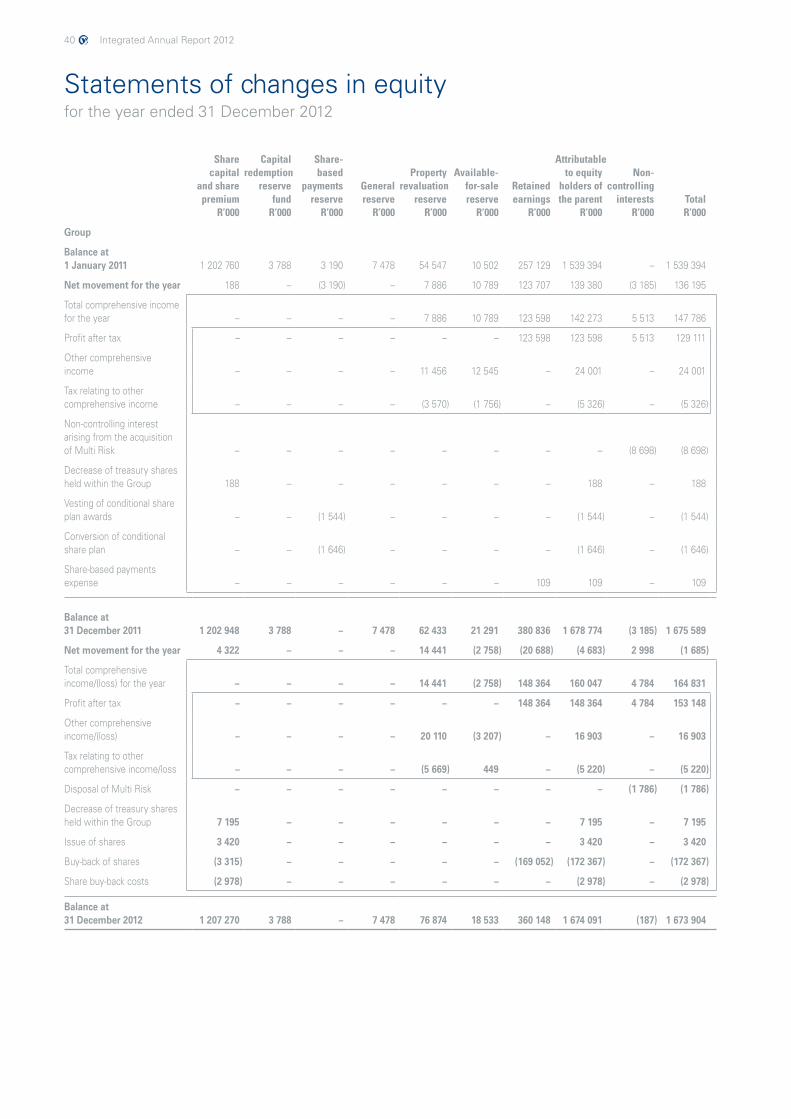
40 Integrated Annual Report 2012
Statements of changes in equityfor the year ended 31 December 2012
Share capital
and share premium
R’000
Capitalredemption
reserve fund
R’000
Share-based
payments reserve
R’000
General reserve
R’000
Property revaluation
reserve R’000
Available-for-sale reserve
R’000
Retained earnings
R’000
Attributable to equity
holders of the parent
R’000
Non-controlling
interests R’000
Total R’000
Group
Balance at 1 January 2011 1 202 760 3 788 3 190 7 478 54 547 10 502 257 129 1 539 394 – 1 539 394
Net movement for the year 188 – (3 190) – 7 886 10 789 123 707 139 380 (3 185) 136 195
Total comprehensive income for the year – – – – 7 886 10 789 123 598 142 273 5 513 147 786
Profit after tax – – – – – – 123 598 123 598 5 513 129 111
Other comprehensive income – – – – 11 456 12 545 – 24 001 – 24 001
Tax relating to other comprehensive income – – – – (3 570) (1 756) – (5 326) – (5 326)
Non-controlling interest arising from the acquisition of Multi Risk – – – – – – – – (8 698) (8 698)
Decrease of treasury shares held within the Group 188 – – – – – – 188 – 188
Vesting of conditional share plan awards – – (1 544) – – – – (1 544) – (1 544)
Conversion of conditional share plan – – (1 646) – – – – (1 646) – (1 646)
Share-based payments expense – – – – – – 109 109 – 109
Balance at 31 December 2011 1 202 948 3 788 – 7 478 62 433 21 291 380 836 1 678 774 (3 185) 1 675 589
Net movement for the year 4 322 – – – 14 441 (2 758) (20 688) (4 683) 2 998 (1 685)
Total comprehensive income/(loss) for the year – – – – 14 441 (2 758) 148 364 160 047 4 784 164 831
Profit after tax – – – – – – 148 364 148 364 4 784 153 148
Other comprehensive income/(loss) – – – – 20 110 (3 207) – 16 903 – 16 903
Tax relating to other comprehensive income/loss – – – – (5 669) 449 – (5 220) – (5 220)
Disposal of Multi Risk – – – – – – – – (1 786) (1 786)
Decrease of treasury shares held within the Group 7 195 – – – – – – 7 195 – 7 195
Issue of shares 3 420 – – – – – – 3 420 – 3 420
Buy-back of shares (3 315) – – – – – (169 052) (172 367) – (172 367)
Share buy-back costs (2 978) – – – – – – (2 978) – (2 978)
Balance at 31 December 2012 1 207 270 3 788 – 7 478 76 874 18 533 360 148 1 674 091 (187) 1 673 904
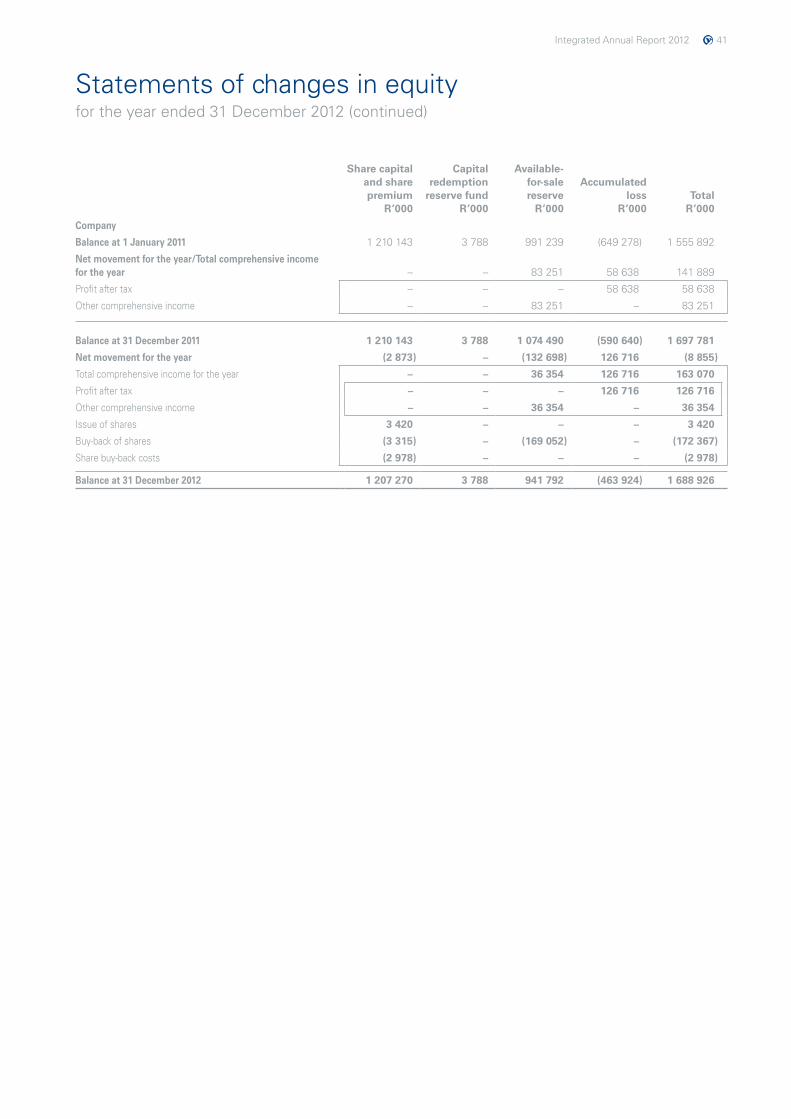
Integrated Annual Report 2012 41
Statements of changes in equityfor the year ended 31 December 2012 (continued)
Share capital and share premium
R’000
Capital redemption
reserve fund R’000
Available-for-sale reserve
R’000
Accumulated loss
R’000Total
R’000
Company
Balance at 1 January 2011 1 210 143 3 788 991 239 (649 278) 1 555 892
Net movement for the year/Total comprehensive income for the year – – 83 251 58 638 141 889
Profit after tax – – – 58 638 58 638
Other comprehensive income – – 83 251 – 83 251
Balance at 31 December 2011 1 210 143 3 788 1 074 490 (590 640) 1 697 781
Net movement for the year (2 873) – (132 698) 126 716 (8 855)
Total comprehensive income for the year – – 36 354 126 716 163 070
Profit after tax – – – 126 716 126 716
Other comprehensive income – – 36 354 – 36 354
Issue of shares 3 420 – – – 3 420
Buy-back of shares (3 315) – (169 052) – (172 367)
Share buy-back costs (2 978) – – – (2 978)
Balance at 31 December 2012 1 207 270 3 788 941 792 (463 924) 1 688 926
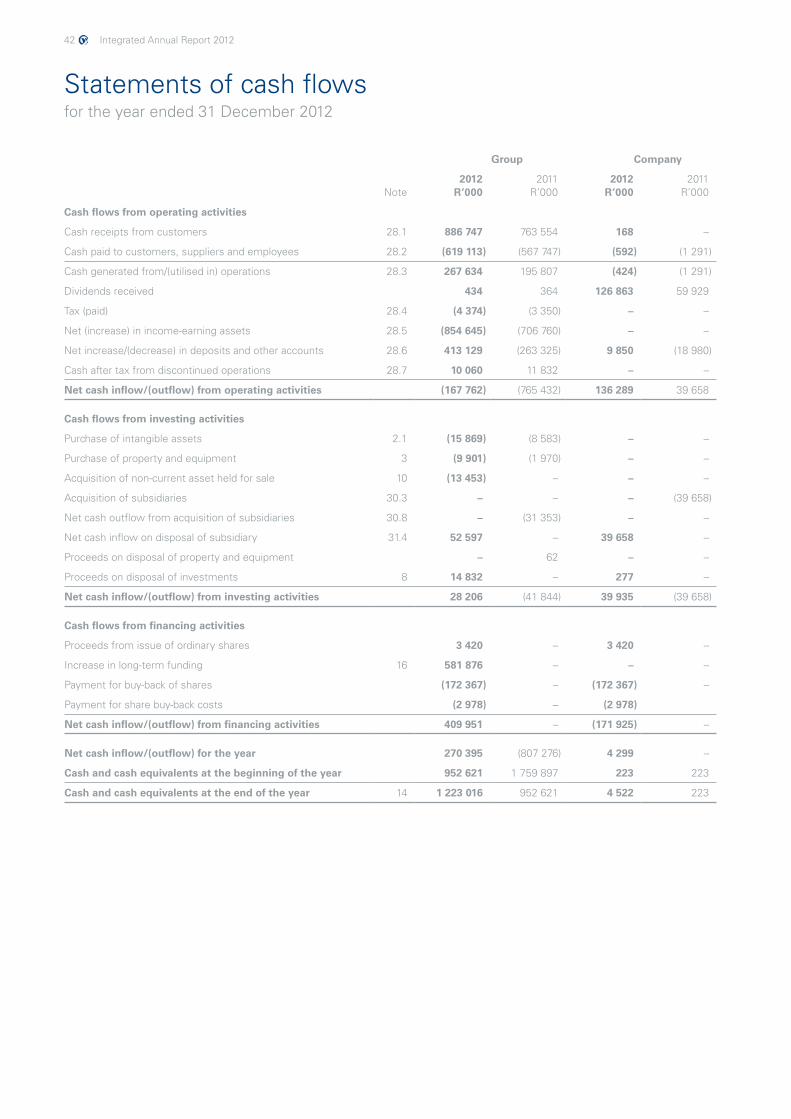
42 Integrated Annual Report 2012
Statements of cash flowsfor the year ended 31 December 2012
Group Company
Note2012
R’000 2011
R’000 2012
R’0002011
R’000
Cash flows from operating activities
Cash receipts from customers 28.1 886 747 763 554 168 –
Cash paid to customers, suppliers and employees 28.2 (619 113) (567 747) (592) (1 291)
Cash generated from/(utilised in) operations 28.3 267 634 195 807 (424) (1 291)
Dividends received 434 364 126 863 59 929
Tax (paid) 28.4 (4 374) (3 350) – –
Net (increase) in income-earning assets 28.5 (854 645) (706 760) – –
Net increase/(decrease) in deposits and other accounts 28.6 413 129 (263 325) 9 850 (18 980)
Cash after tax from discontinued operations 28.7 10 060 11 832 – –
Net cash inflow/(outflow) from operating activities (167 762) (765 432) 136 289 39 658
Cash flows from investing activities
Purchase of intangible assets 2.1 (15 869) (8 583) – –
Purchase of property and equipment 3 (9 901) (1 970) – –
Acquisition of non-current asset held for sale 10 (13 453) – – –
Acquisition of subsidiaries 30.3 – – – (39 658)
Net cash outflow from acquisition of subsidiaries 30.8 – (31 353) – –
Net cash inflow on disposal of subsidiary 31.4 52 597 – 39 658 –
Proceeds on disposal of property and equipment – 62 – –
Proceeds on disposal of investments 8 14 832 – 277 –
Net cash inflow/(outflow) from investing activities 28 206 (41 844) 39 935 (39 658)
Cash flows from financing activities
Proceeds from issue of ordinary shares 3 420 – 3 420 –
Increase in long-term funding 16 581 876 – – –
Payment for buy-back of shares (172 367) – (172 367) –
Payment for share buy-back costs (2 978) – (2 978)
Net cash inflow/(outflow) from financing activities 409 951 – (171 925) –
Net cash inflow/(outflow) for the year 270 395 (807 276) 4 299 –
Cash and cash equivalents at the beginning of the year 952 621 1 759 897 223 223
Cash and cash equivalents at the end of the year 14 1 223 016 952 621 4 522 223
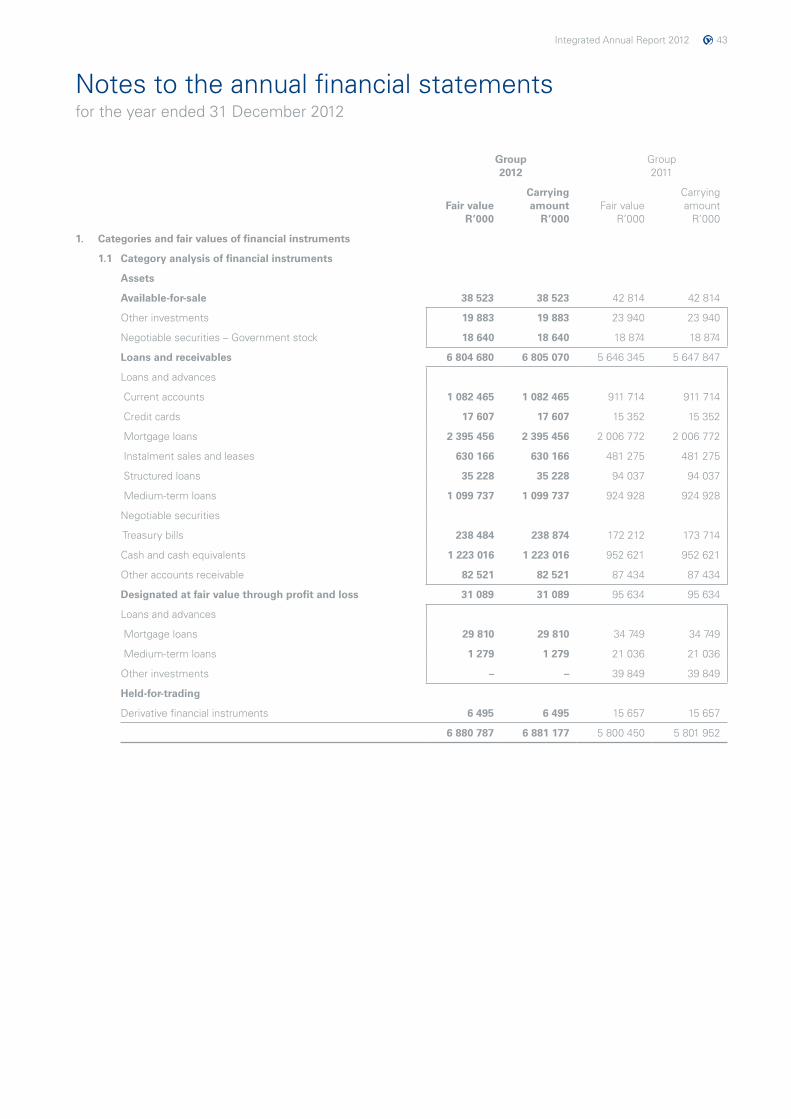
Integrated Annual Report 2012 43
Notes to the annual financial statementsfor the year ended 31 December 2012
Group 2012
Group 2011
Fair value R’000
Carrying amount
R’000Fair value
R’000
Carrying amount
R’000
1. Categories and fair values of financial instruments
1.1 Category analysis of financial instruments
Assets
Available-for-sale 38 523 38 523 42 814 42 814
Other investments 19 883 19 883 23 940 23 940
Negotiable securities – Government stock 18 640 18 640 18 874 18 874
Loans and receivables 6 804 680 6 805 070 5 646 345 5 647 847
Loans and advances
Current accounts 1 082 465 1 082 465 911 714 911 714
Credit cards 17 607 17 607 15 352 15 352
Mortgage loans 2 395 456 2 395 456 2 006 772 2 006 772
Instalment sales and leases 630 166 630 166 481 275 481 275
Structured loans 35 228 35 228 94 037 94 037
Medium-term loans 1 099 737 1 099 737 924 928 924 928
Negotiable securities
Treasury bills 238 484 238 874 172 212 173 714
Cash and cash equivalents 1 223 016 1 223 016 952 621 952 621
Other accounts receivable 82 521 82 521 87 434 87 434
Designated at fair value through profit and loss 31 089 31 089 95 634 95 634
Loans and advances
Mortgage loans 29 810 29 810 34 749 34 749
Medium-term loans 1 279 1 279 21 036 21 036
Other investments – – 39 849 39 849
Held-for-trading
Derivative financial instruments 6 495 6 495 15 657 15 657
6 880 787 6 881 177 5 800 450 5 801 952
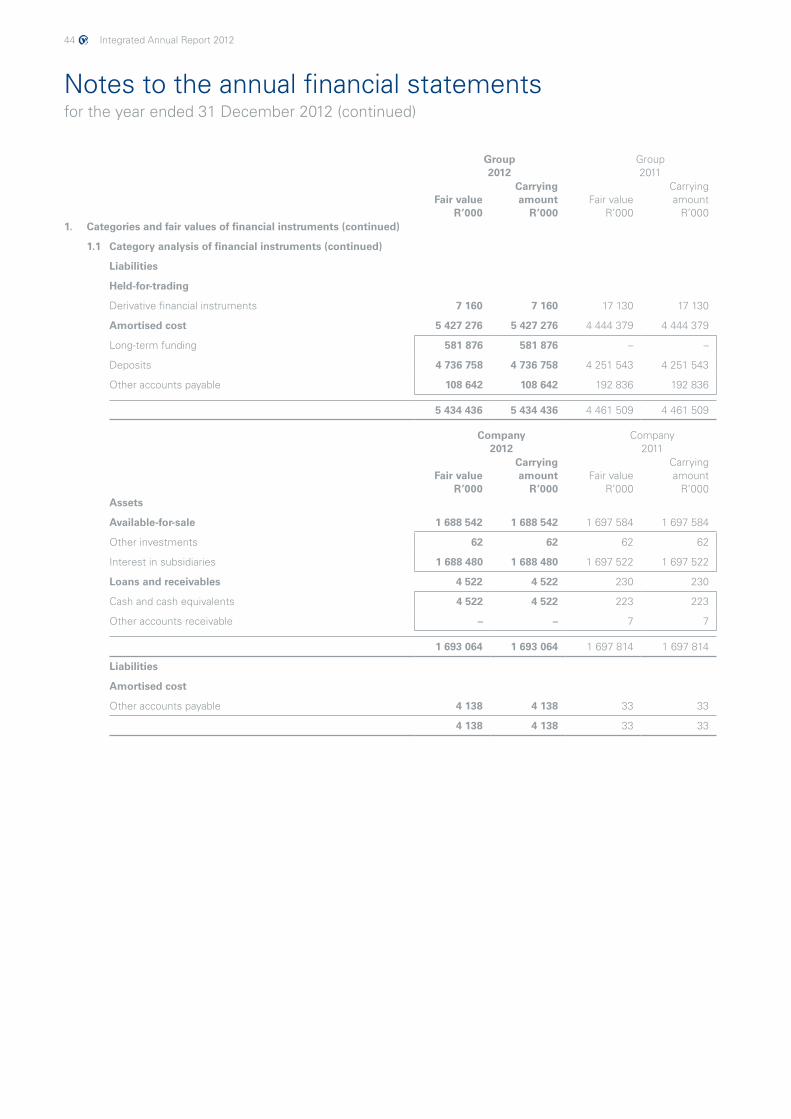
44 Integrated Annual Report 2012
Notes to the annual financial statementsfor the year ended 31 December 2012 (continued)
Group 2012
Group 2011
Fair value R’000
Carrying amount
R’000Fair value
R’000
Carrying amount
R’0001. Categories and fair values of financial instruments (continued)
1.1 Category analysis of financial instruments (continued)
Liabilities
Held-for-trading
Derivative financial instruments 7 160 7 160 17 130 17 130
Amortised cost 5 427 276 5 427 276 4 444 379 4 444 379
Long-term funding 581 876 581 876 – –
Deposits 4 736 758 4 736 758 4 251 543 4 251 543
Other accounts payable 108 642 108 642 192 836 192 836
5 434 436 5 434 436 4 461 509 4 461 509
Company 2012
Company 2011
Fair value R’000
Carrying amount
R’000Fair value
R’000
Carrying amount
R’000Assets
Available-for-sale 1 688 542 1 688 542 1 697 584 1 697 584
Other investments 62 62 62 62
Interest in subsidiaries 1 688 480 1 688 480 1 697 522 1 697 522
Loans and receivables 4 522 4 522 230 230
Cash and cash equivalents 4 522 4 522 223 223
Other accounts receivable – – 7 7
1 693 064 1 693 064 1 697 814 1 697 814
Liabilities
Amortised cost
Other accounts payable 4 138 4 138 33 33
4 138 4 138 33 33
Integrated Annual Report 2012 45
Notes to the annual financial statementsfor the year ended 31 December 2012 (continued)
1. Categories and fair values of financial instruments (continued)
1.2 Valuation techniques and assumptions applied for the purpose of measuring fair value
• Cash and cash equivalents have short terms to maturity and are carried at amortised cost. For this reason, the carrying amounts at the reporting date approximate the fair value.
• Treasury bills have short terms to maturity and are carried at amortised cost. Fair value is based on quoted market values at the reporting date.
• The fair value of loans and advances that are carried at amortised cost approximate the fair value reported, as they bear variable rates of interest. The fair value is adjusted for deterioration of credit quality through the application of the credit impairment models.
• Long-term funding is carried at amortised cost and approximates the fair value reported as it bears variable rates of interest.
• Deposits generally have short terms to maturity, thus the values reported approximate the fair value.
• The fair value of publicly traded derivatives, securities and investments, is based on quoted market values at the reporting date.
• The fair value of other financial assets and financial liabilities, excluding derivatives, is determined in accordance with generally accepted pricing models, based on discounted cash flow analysis, using prices from observable current market transactions and adjusted by relevant market pricing.
• Depending on the business and nature of the underlying investment, the fair value of other unlisted investments which are an integral part of the Group’s structured loan portfolio are valued in terms of the shareholders’ agreement conditions, net asset value or an EBITDA multiple (based on the latest management accounts available). The fair value of other investments and interest in subsidiaries which are unlisted, is determined by reference to the net asset value of the entity and/or the underlying net asset value of its investment holdings.
• The fair value of loans and advances, designated at fair value through profit and loss, is calculated using the credit spread observed at origination. The fair value is adjusted for deterioration of credit quality, through the application of the credit impairment models.
1.3 Fair value measurements recognised in the statement of financial position
Financial instruments that are measured subsequent to initial recognition at fair value are grouped into Levels 1 to 3 based on the degree to which the fair value is observable:
• Level 1 fair value measurements are those derived from quoted prices (unadjusted) in active markets for identical assets or liabilities;
• Level 2 fair value measurements are those derived from inputs other than quoted prices included within Level 1 that are observable for the asset or liability, either directly (i.e. as prices) or indirectly (i.e. derived from prices); and
• Level 3 fair value measurements are those derived from valuation techniques that include inputs for the asset or liability that are not based on observable market data (unobservable inputs).
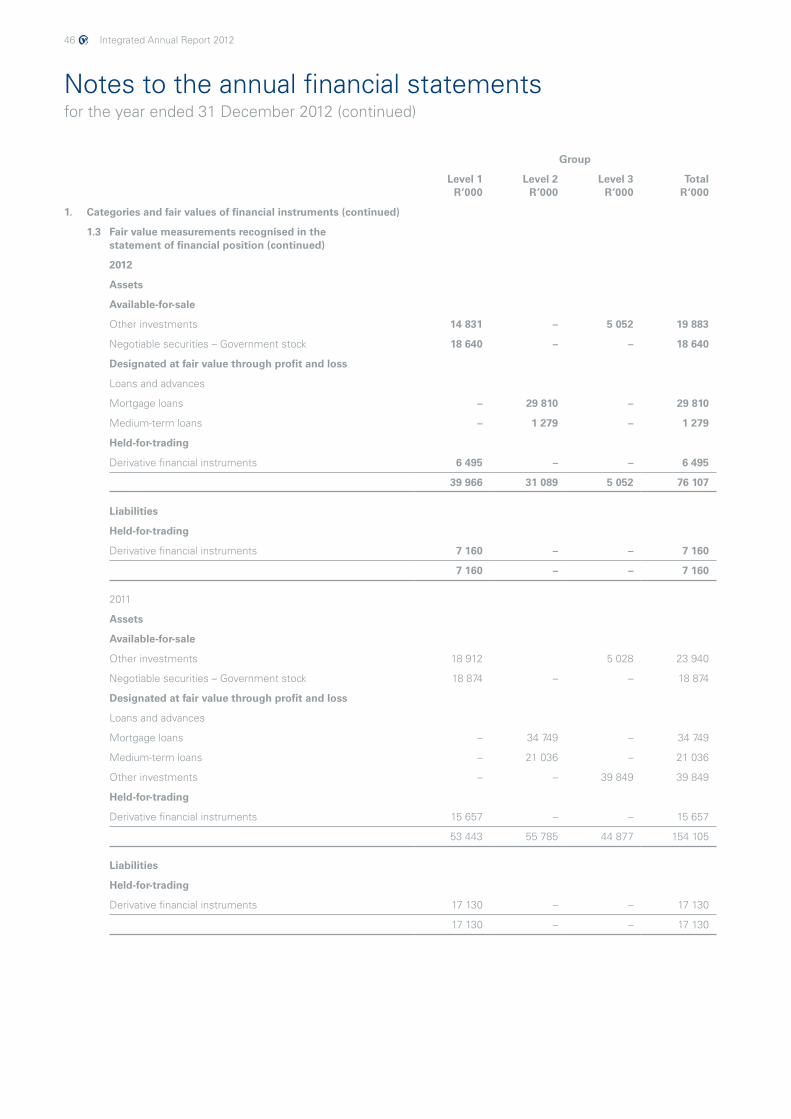
46 Integrated Annual Report 2012
Notes to the annual financial statementsfor the year ended 31 December 2012 (continued)
Group
Level 1 R’000
Level 2 R’000
Level 3 R’000
Total R’000
1. Categories and fair values of financial instruments (continued)
1.3 Fair value measurements recognised in the statement of financial position (continued)
2012
Assets
Available-for-sale
Other investments 14 831 – 5 052 19 883
Negotiable securities – Government stock 18 640 – – 18 640
Designated at fair value through profit and loss
Loans and advances
Mortgage loans – 29 810 – 29 810
Medium-term loans – 1 279 – 1 279
Held-for-trading
Derivative financial instruments 6 495 – – 6 495
39 966 31 089 5 052 76 107
Liabilities
Held-for-trading
Derivative financial instruments 7 160 – – 7 160
7 160 – – 7 160
2011
Assets
Available-for-sale
Other investments 18 912 5 028 23 940
Negotiable securities – Government stock 18 874 – – 18 874
Designated at fair value through profit and loss
Loans and advances
Mortgage loans – 34 749 – 34 749
Medium-term loans – 21 036 – 21 036
Other investments – – 39 849 39 849
Held-for-trading
Derivative financial instruments 15 657 – – 15 657
53 443 55 785 44 877 154 105
Liabilities
Held-for-trading
Derivative financial instruments 17 130 – – 17 130
17 130 – – 17 130
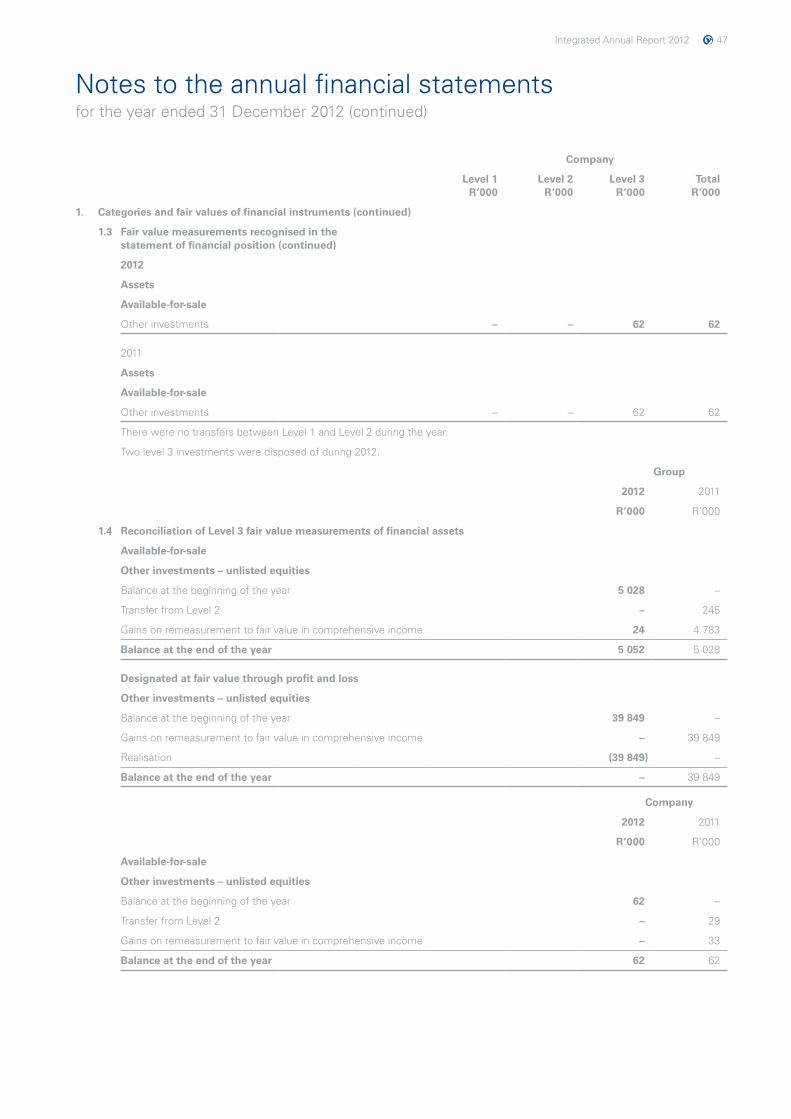
Integrated Annual Report 2012 47
Notes to the annual financial statementsfor the year ended 31 December 2012 (continued)
Company
Level 1 R’000
Level 2 R’000
Level 3 R’000
Total R’000
1. Categories and fair values of financial instruments (continued)
1.3 Fair value measurements recognised in the statement of financial position (continued)
2012
Assets
Available-for-sale
Other investments – – 62 62
2011
Assets
Available-for-sale
Other investments – – 62 62
There were no transfers between Level 1 and Level 2 during the year.
Two level 3 investments were disposed of during 2012.
Group
2012 2011
R’000 R’000
1.4 Reconciliation of Level 3 fair value measurements of financial assets
Available-for-sale
Other investments – unlisted equities
Balance at the beginning of the year 5 028 –
Transfer from Level 2 – 245
Gains on remeasurement to fair value in comprehensive income 24 4 783
Balance at the end of the year 5 052 5 028
Designated at fair value through profit and loss
Other investments – unlisted equities
Balance at the beginning of the year 39 849 –
Gains on remeasurement to fair value in comprehensive income – 39 849
Realisation (39 849) –
Balance at the end of the year – 39 849
Company
2012 2011
R’000 R’000
Available-for-sale
Other investments – unlisted equities
Balance at the beginning of the year 62 –
Transfer from Level 2 – 29
Gains on remeasurement to fair value in comprehensive income – 33
Balance at the end of the year 62 62
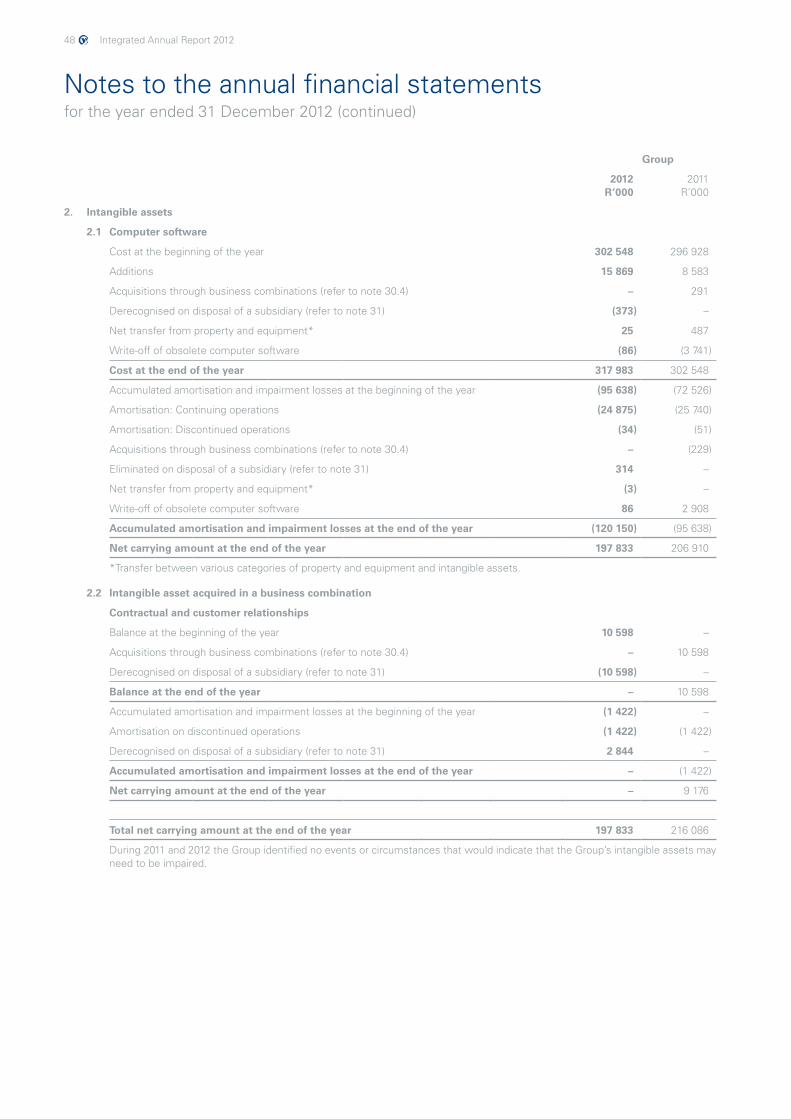
48 Integrated Annual Report 2012
Notes to the annual financial statementsfor the year ended 31 December 2012 (continued)
Group
2012 R’000
2011 R’000
2. Intangible assets
2.1 Computer software
Cost at the beginning of the year 302 548 296 928
Additions 15 869 8 583
Acquisitions through business combinations (refer to note 30.4) – 291
Derecognised on disposal of a subsidiary (refer to note 31) (373) –
Net transfer from property and equipment* 25 487
Write-off of obsolete computer software (86) (3 741)
Cost at the end of the year 317 983 302 548
Accumulated amortisation and impairment losses at the beginning of the year (95 638) (72 526)
Amortisation: Continuing operations (24 875) (25 740)
Amortisation: Discontinued operations (34) (51)
Acquisitions through business combinations (refer to note 30.4) – (229)
Eliminated on disposal of a subsidiary (refer to note 31) 314 –
Net transfer from property and equipment* (3) –
Write-off of obsolete computer software 86 2 908
Accumulated amortisation and impairment losses at the end of the year (120 150) (95 638)
Net carrying amount at the end of the year 197 833 206 910
*Transfer between various categories of property and equipment and intangible assets.
2.2 Intangible asset acquired in a business combination
Contractual and customer relationships
Balance at the beginning of the year 10 598 –
Acquisitions through business combinations (refer to note 30.4) – 10 598
Derecognised on disposal of a subsidiary (refer to note 31) (10 598) –
Balance at the end of the year – 10 598
Accumulated amortisation and impairment losses at the beginning of the year (1 422) –
Amortisation on discontinued operations (1 422) (1 422)
Derecognised on disposal of a subsidiary (refer to note 31) 2 844 –
Accumulated amortisation and impairment losses at the end of the year – (1 422)
Net carrying amount at the end of the year – 9 176
Total net carrying amount at the end of the year 197 833 216 086
During 2011 and 2012 the Group identified no events or circumstances that would indicate that the Group’s intangible assets may need to be impaired.
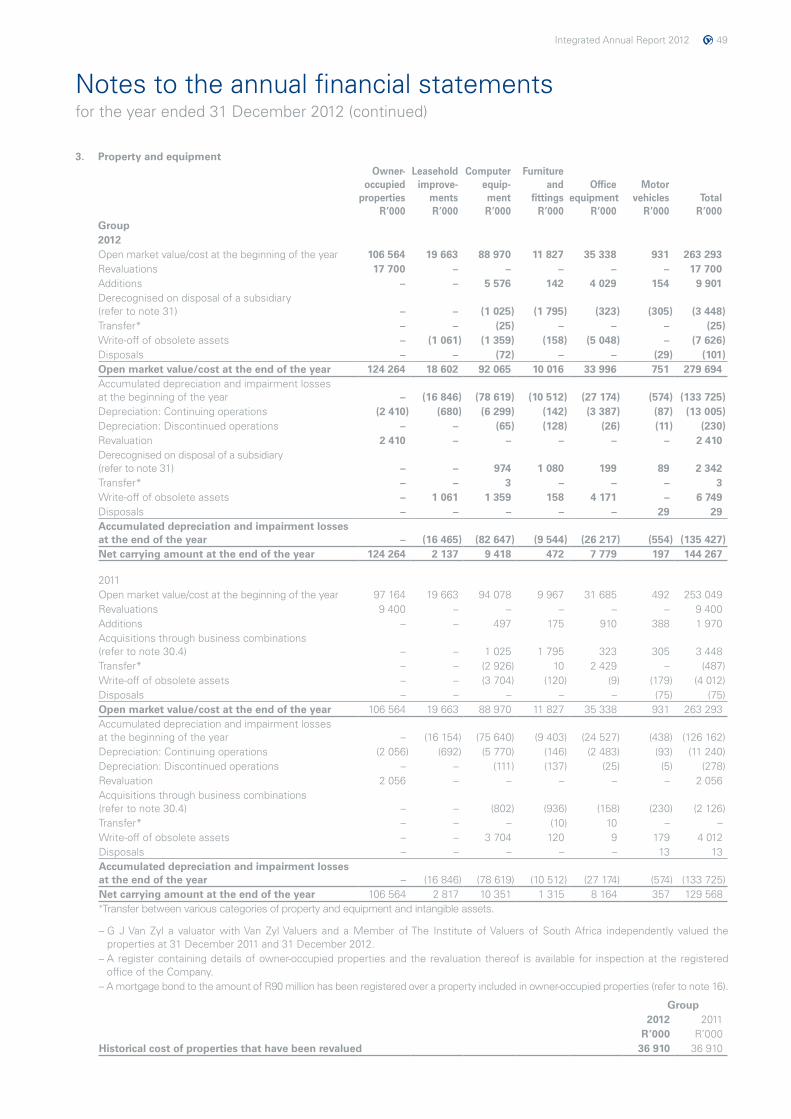
Integrated Annual Report 2012 49
Notes to the annual financial statementsfor the year ended 31 December 2012 (continued)
3. Property and equipmentOwner-
occupiedproperties
R’000
Leaseholdimprove-
mentsR’000
Computerequip-mentR’000
Furnitureand
fittingsR’000
Officeequipment
R’000
Motorvehicles
R’000Total
R’000Group2012Open market value/cost at the beginning of the year 106 564 19 663 88 970 11 827 35 338 931 263 293 Revaluations 17 700 – – – – – 17 700 Additions – – 5 576 142 4 029 154 9 901 Derecognised on disposal of a subsidiary (refer to note 31) – – (1 025) (1 795) (323) (305) (3 448)Transfer* – – (25) – – – (25)Write-off of obsolete assets – (1 061) (1 359) (158) (5 048) – (7 626)Disposals – – (72) – – (29) (101)Open market value/cost at the end of the year 124 264 18 602 92 065 10 016 33 996 751 279 694 Accumulated depreciation and impairment losses at the beginning of the year – (16 846) (78 619) (10 512) (27 174) (574) (133 725)Depreciation: Continuing operations (2 410) (680) (6 299) (142) (3 387) (87) (13 005)Depreciation: Discontinued operations – – (65) (128) (26) (11) (230)Revaluation 2 410 – – – – – 2 410 Derecognised on disposal of a subsidiary (refer to note 31) – – 974 1 080 199 89 2 342 Transfer* – – 3 – – – 3 Write-off of obsolete assets – 1 061 1 359 158 4 171 – 6 749 Disposals – – – – – 29 29 Accumulated depreciation and impairment losses at the end of the year – (16 465) (82 647) (9 544) (26 217) (554) (135 427)Net carrying amount at the end of the year 124 264 2 137 9 418 472 7 779 197 144 267
2011Open market value/cost at the beginning of the year 97 164 19 663 94 078 9 967 31 685 492 253 049 Revaluations 9 400 – – – – – 9 400 Additions – – 497 175 910 388 1 970 Acquisitions through business combinations (refer to note 30.4) – – 1 025 1 795 323 305 3 448 Transfer* – – (2 926) 10 2 429 – (487)Write-off of obsolete assets – – (3 704) (120) (9) (179) (4 012)Disposals – – – – – (75) (75)Open market value/cost at the end of the year 106 564 19 663 88 970 11 827 35 338 931 263 293 Accumulated depreciation and impairment losses at the beginning of the year – (16 154) (75 640) (9 403) (24 527) (438) (126 162)Depreciation: Continuing operations (2 056) (692) (5 770) (146) (2 483) (93) (11 240)Depreciation: Discontinued operations – – (111) (137) (25) (5) (278)Revaluation 2 056 – – – – – 2 056 Acquisitions through business combinations (refer to note 30.4) – – (802) (936) (158) (230) (2 126)Transfer* – – – (10) 10 – – Write-off of obsolete assets – – 3 704 120 9 179 4 012 Disposals – – – – – 13 13 Accumulated depreciation and impairment losses at the end of the year – (16 846) (78 619) (10 512) (27 174) (574) (133 725)Net carrying amount at the end of the year 106 564 2 817 10 351 1 315 8 164 357 129 568 *Transfer between various categories of property and equipment and intangible assets.
– G J Van Zyl a valuator with Van Zyl Valuers and a Member of The Institute of Valuers of South Africa independently valued the properties at 31 December 2011 and 31 December 2012.
– A register containing details of owner-occupied properties and the revaluation thereof is available for inspection at the registered office of the Company.
– A mortgage bond to the amount of R90 million has been registered over a property included in owner-occupied properties (refer to note 16).
Group2012 2011
R’000 R’000Historical cost of properties that have been revalued 36 910 36 910
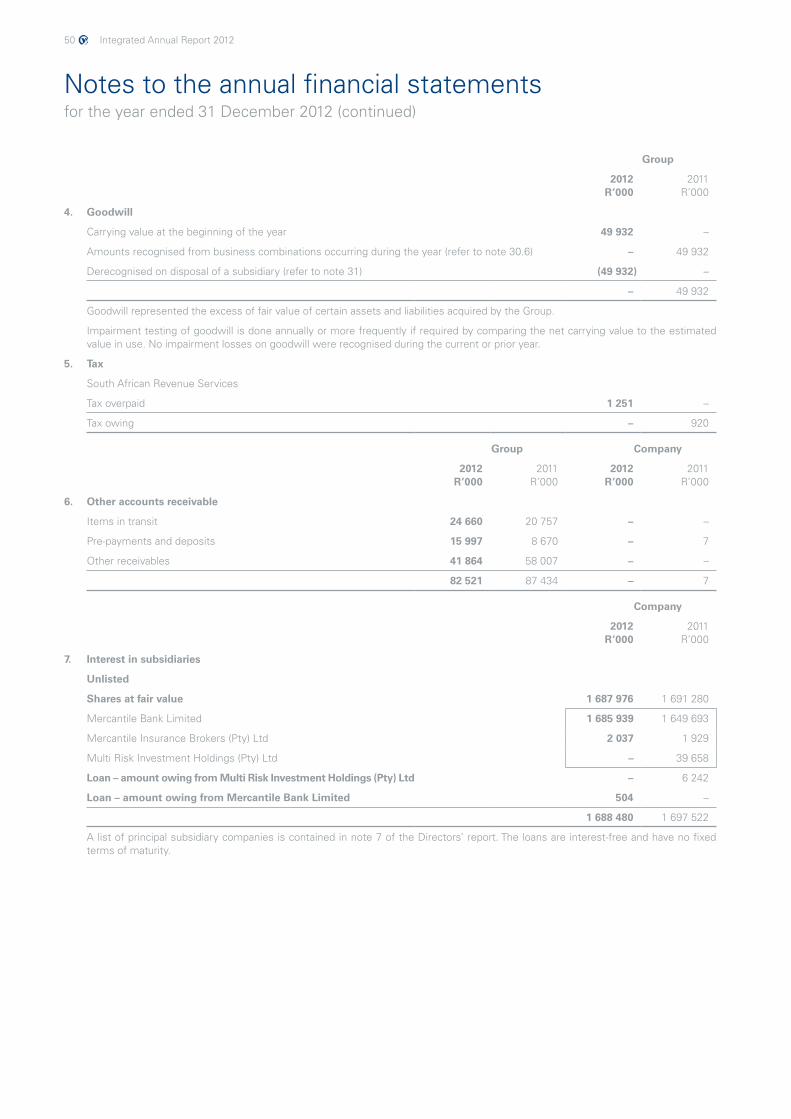
50 Integrated Annual Report 2012
Notes to the annual financial statementsfor the year ended 31 December 2012 (continued)
Group
2012R’000
2011R’000
4. Goodwill
Carrying value at the beginning of the year 49 932 –
Amounts recognised from business combinations occurring during the year (refer to note 30.6) – 49 932
Derecognised on disposal of a subsidiary (refer to note 31) (49 932) –
– 49 932
Goodwill represented the excess of fair value of certain assets and liabilities acquired by the Group.
Impairment testing of goodwill is done annually or more frequently if required by comparing the net carrying value to the estimated value in use. No impairment losses on goodwill were recognised during the current or prior year.
5. Tax
South African Revenue Services
Tax overpaid 1 251 –
Tax owing – 920
Group Company
2012 R’000
2011 R’000
2012 R’000
2011 R’000
6. Other accounts receivable
Items in transit 24 660 20 757 – –
Pre-payments and deposits 15 997 8 670 – 7
Other receivables 41 864 58 007 – –
82 521 87 434 – 7
Company
2012 R’000
2011 R’000
7. Interest in subsidiaries
Unlisted
Shares at fair value 1 687 976 1 691 280
Mercantile Bank Limited 1 685 939 1 649 693
Mercantile Insurance Brokers (Pty) Ltd 2 037 1 929
Multi Risk Investment Holdings (Pty) Ltd – 39 658
Loan – amount owing from Multi Risk Investment Holdings (Pty) Ltd – 6 242
Loan – amount owing from Mercantile Bank Limited 504 –
1 688 480 1 697 522
A list of principal subsidiary companies is contained in note 7 of the Directors’ report. The loans are interest-free and have no fixed terms of maturity.
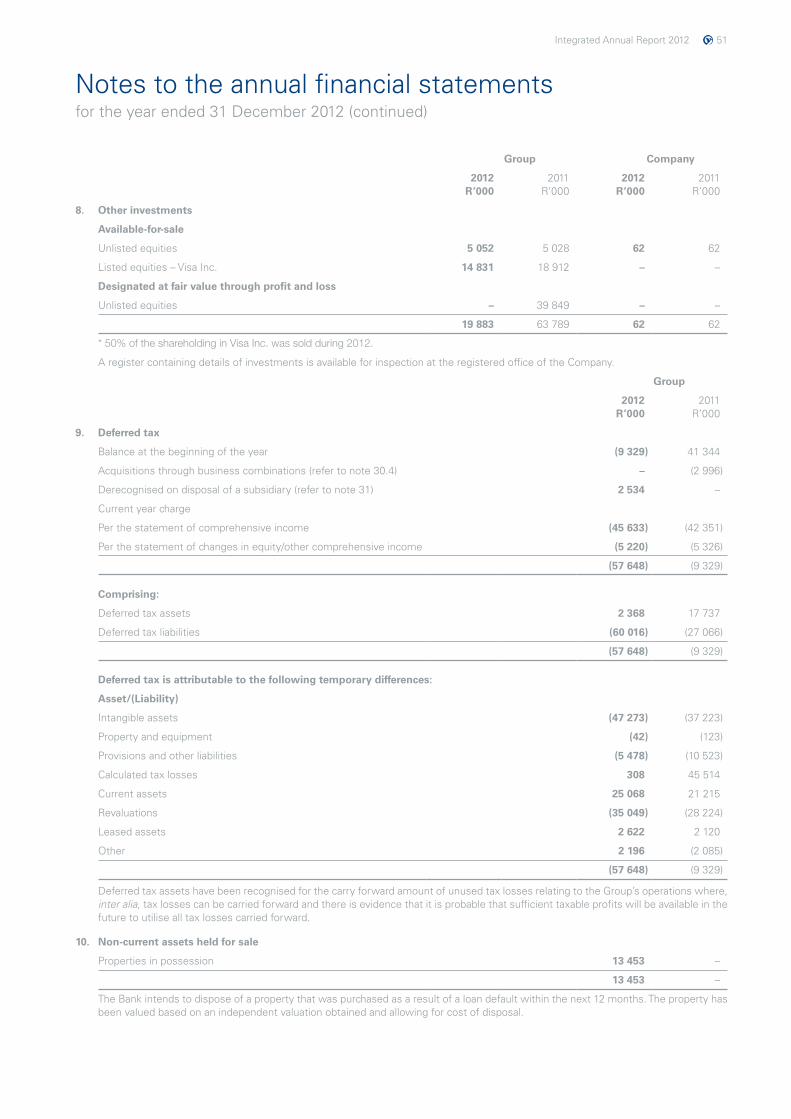
Integrated Annual Report 2012 51
Notes to the annual financial statementsfor the year ended 31 December 2012 (continued)
Group Company
2012 R’000
2011 R’000
2012 R’000
2011 R’000
8. Other investments
Available-for-sale
Unlisted equities 5 052 5 028 62 62
Listed equities – Visa Inc. 14 831 18 912 – –
Designated at fair value through profit and loss
Unlisted equities – 39 849 – –
19 883 63 789 62 62
* 50% of the shareholding in Visa Inc. was sold during 2012.
A register containing details of investments is available for inspection at the registered office of the Company.
Group
2012 R’000
2011 R’000
9. Deferred tax
Balance at the beginning of the year (9 329) 41 344
Acquisitions through business combinations (refer to note 30.4) – (2 996)
Derecognised on disposal of a subsidiary (refer to note 31) 2 534 –
Current year charge
Per the statement of comprehensive income (45 633) (42 351)
Per the statement of changes in equity/other comprehensive income (5 220) (5 326)
(57 648) (9 329)
Comprising:
Deferred tax assets 2 368 17 737
Deferred tax liabilities (60 016) (27 066)
(57 648) (9 329)
Deferred tax is attributable to the following temporary differences:
Asset/(Liability)
Intangible assets (47 273) (37 223)
Property and equipment (42) (123)
Provisions and other liabilities (5 478) (10 523)
Calculated tax losses 308 45 514
Current assets 25 068 21 215
Revaluations (35 049) (28 224)
Leased assets 2 622 2 120
Other 2 196 (2 085)
(57 648) (9 329)
Deferred tax assets have been recognised for the carry forward amount of unused tax losses relating to the Group’s operations where, inter alia, tax losses can be carried forward and there is evidence that it is probable that sufficient taxable profits will be available in the future to utilise all tax losses carried forward.
10. Non-current assets held for sale
Properties in possession 13 453 –
13 453 –
The Bank intends to dispose of a property that was purchased as a result of a loan default within the next 12 months. The property has been valued based on an independent valuation obtained and allowing for cost of disposal.
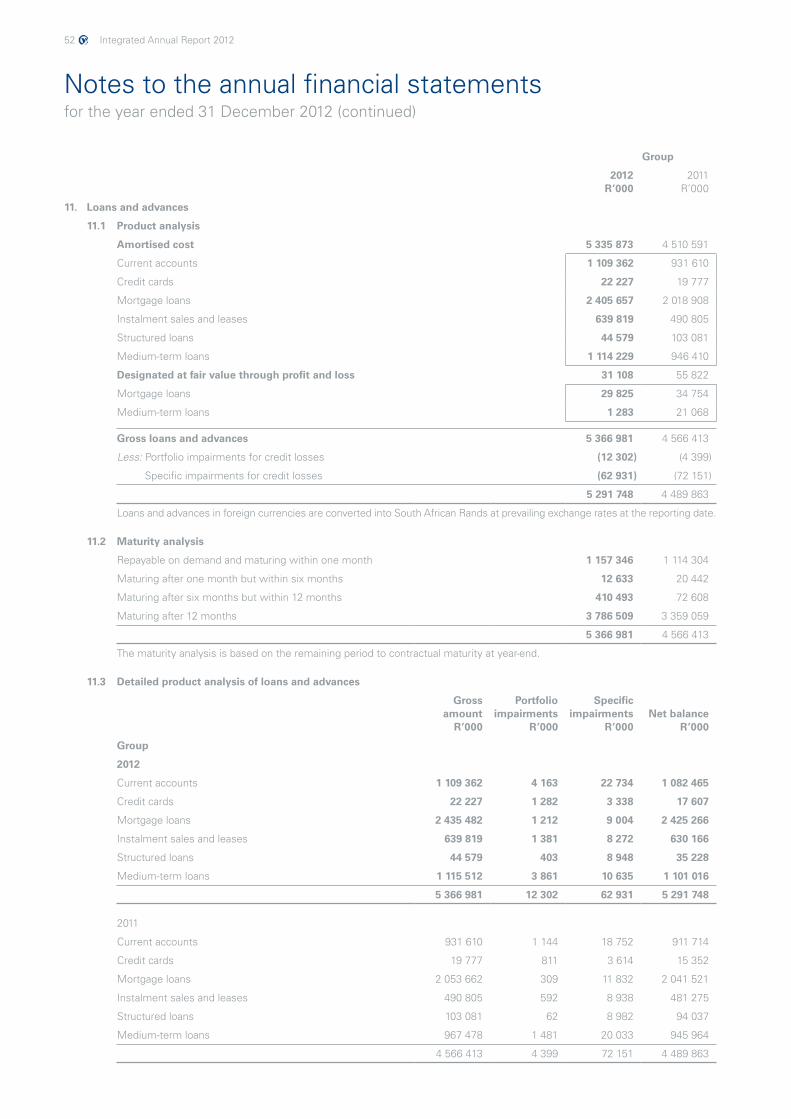
52 Integrated Annual Report 2012
Notes to the annual financial statementsfor the year ended 31 December 2012 (continued)
Group
2012 R’000
2011 R’000
11. Loans and advances
11.1 Product analysis
Amortised cost 5 335 873 4 510 591
Current accounts 1 109 362 931 610
Credit cards 22 227 19 777
Mortgage loans 2 405 657 2 018 908
Instalment sales and leases 639 819 490 805
Structured loans 44 579 103 081
Medium-term loans 1 114 229 946 410
Designated at fair value through profit and loss 31 108 55 822
Mortgage loans 29 825 34 754
Medium-term loans 1 283 21 068
Gross loans and advances 5 366 981 4 566 413
Less: Portfolio impairments for credit losses (12 302) (4 399)
Specific impairments for credit losses (62 931) (72 151)
5 291 748 4 489 863
Loans and advances in foreign currencies are converted into South African Rands at prevailing exchange rates at the reporting date.
11.2 Maturity analysis
Repayable on demand and maturing within one month 1 157 346 1 114 304
Maturing after one month but within six months 12 633 20 442
Maturing after six months but within 12 months 410 493 72 608
Maturing after 12 months 3 786 509 3 359 059
5 366 981 4 566 413
The maturity analysis is based on the remaining period to contractual maturity at year-end.
11.3 Detailed product analysis of loans and advances
Gross amount
R’000
Portfolio impairments
R’000
Specific impairments
R’000Net balance
R’000
Group
2012
Current accounts 1 109 362 4 163 22 734 1 082 465
Credit cards 22 227 1 282 3 338 17 607
Mortgage loans 2 435 482 1 212 9 004 2 425 266
Instalment sales and leases 639 819 1 381 8 272 630 166
Structured loans 44 579 403 8 948 35 228
Medium-term loans 1 115 512 3 861 10 635 1 101 016
5 366 981 12 302 62 931 5 291 748
2011
Current accounts 931 610 1 144 18 752 911 714
Credit cards 19 777 811 3 614 15 352
Mortgage loans 2 053 662 309 11 832 2 041 521
Instalment sales and leases 490 805 592 8 938 481 275
Structured loans 103 081 62 8 982 94 037
Medium-term loans 967 478 1 481 20 033 945 964
4 566 413 4 399 72 151 4 489 863
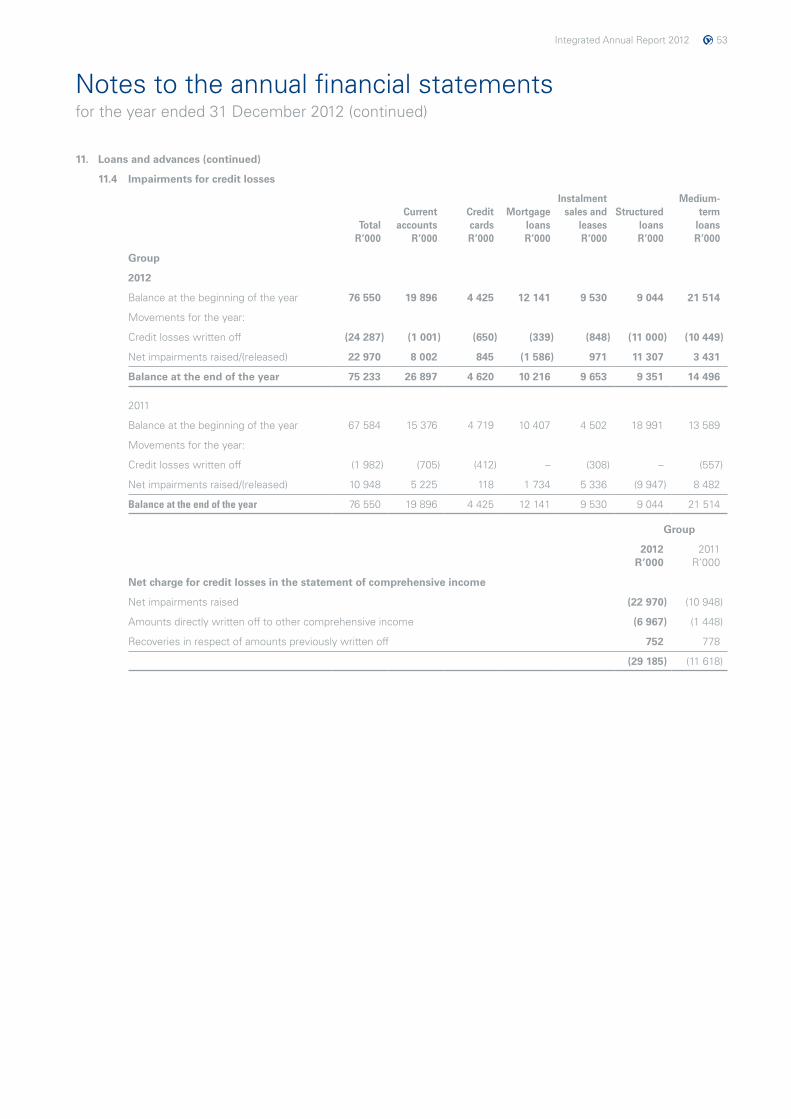
Integrated Annual Report 2012 53
Notes to the annual financial statementsfor the year ended 31 December 2012 (continued)
11. Loans and advances (continued)
11.4 Impairments for credit losses
Instalment sales and
leasesR’000
Medium-term
loansR’000
TotalR’000
Current accounts
R’000
CreditcardsR’000
MortgageloansR’000
StructuredloansR’000
Group
2012
Balance at the beginning of the year 76 550 19 896 4 425 12 141 9 530 9 044 21 514
Movements for the year:
Credit losses written off (24 287) (1 001) (650) (339) (848) (11 000) (10 449)
Net impairments raised/(released) 22 970 8 002 845 (1 586) 971 11 307 3 431
Balance at the end of the year 75 233 26 897 4 620 10 216 9 653 9 351 14 496
2011
Balance at the beginning of the year 67 584 15 376 4 719 10 407 4 502 18 991 13 589
Movements for the year:
Credit losses written off (1 982) (705) (412) – (308) – (557)
Net impairments raised/(released) 10 948 5 225 118 1 734 5 336 (9 947) 8 482
Balance at the end of the year 76 550 19 896 4 425 12 141 9 530 9 044 21 514
Group
2012 R’000
2011 R’000
Net charge for credit losses in the statement of comprehensive income
Net impairments raised (22 970) (10 948)
Amounts directly written off to other comprehensive income (6 967) (1 448)
Recoveries in respect of amounts previously written off 752 778
(29 185) (11 618)
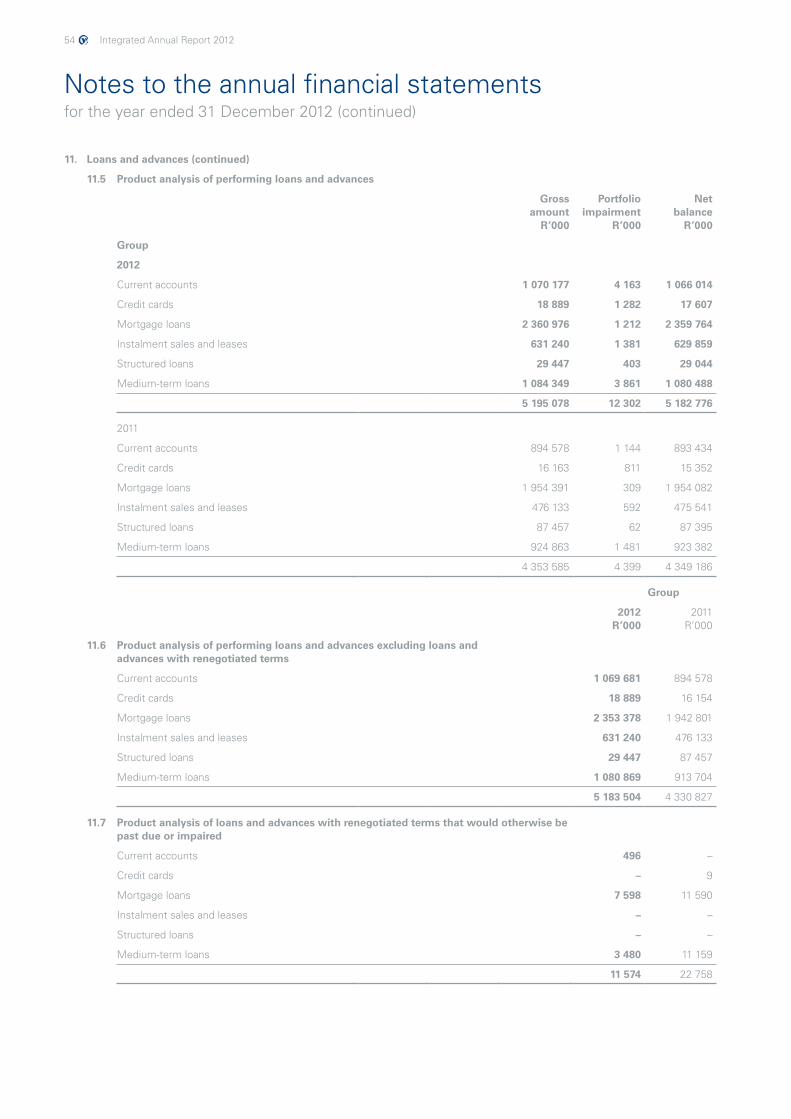
54 Integrated Annual Report 2012
Notes to the annual financial statementsfor the year ended 31 December 2012 (continued)
11. Loans and advances (continued)
11.5 Product analysis of performing loans and advances
Gross amount
R’000
Portfolio impairment
R’000
Netbalance
R’000
Group
2012
Current accounts 1 070 177 4 163 1 066 014
Credit cards 18 889 1 282 17 607
Mortgage loans 2 360 976 1 212 2 359 764
Instalment sales and leases 631 240 1 381 629 859
Structured loans 29 447 403 29 044
Medium-term loans 1 084 349 3 861 1 080 488
5 195 078 12 302 5 182 776
2011
Current accounts 894 578 1 144 893 434
Credit cards 16 163 811 15 352
Mortgage loans 1 954 391 309 1 954 082
Instalment sales and leases 476 133 592 475 541
Structured loans 87 457 62 87 395
Medium-term loans 924 863 1 481 923 382
4 353 585 4 399 4 349 186
Group
2012 R’000
2011 R’000
11.6 Product analysis of performing loans and advances excluding loans and advances with renegotiated terms
Current accounts 1 069 681 894 578
Credit cards 18 889 16 154
Mortgage loans 2 353 378 1 942 801
Instalment sales and leases 631 240 476 133
Structured loans 29 447 87 457
Medium-term loans 1 080 869 913 704
5 183 504 4 330 827
11.7 Product analysis of loans and advances with renegotiated terms that would otherwise be past due or impaired
Current accounts 496 –
Credit cards – 9
Mortgage loans 7 598 11 590
Instalment sales and leases – –
Structured loans – –
Medium-term loans 3 480 11 159
11 574 22 758
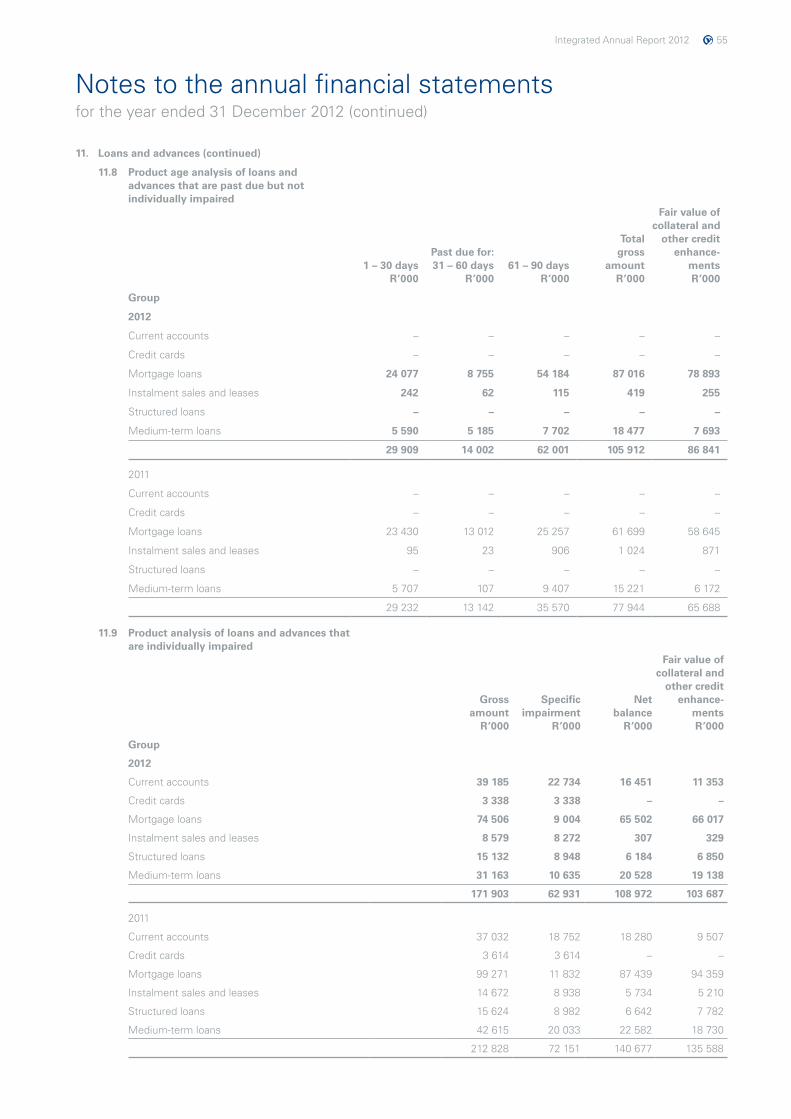
Integrated Annual Report 2012 55
Notes to the annual financial statementsfor the year ended 31 December 2012 (continued)
11. Loans and advances (continued)
11.8 Product age analysis of loans and advances that are past due but not individually impaired
1 – 30 days R’000
Past due for: 31 – 60 days
R’00061 – 90 days
R’000
Total gross
amount R’000
Fair value ofcollateral and
other credit enhance-
ments R’000
Group
2012
Current accounts – – – – –
Credit cards – – – – –
Mortgage loans 24 077 8 755 54 184 87 016 78 893
Instalment sales and leases 242 62 115 419 255
Structured loans – – – – –
Medium-term loans 5 590 5 185 7 702 18 477 7 693
29 909 14 002 62 001 105 912 86 841
2011
Current accounts – – – – –
Credit cards – – – – –
Mortgage loans 23 430 13 012 25 257 61 699 58 645
Instalment sales and leases 95 23 906 1 024 871
Structured loans – – – – –
Medium-term loans 5 707 107 9 407 15 221 6 172
29 232 13 142 35 570 77 944 65 688
11.9 Product analysis of loans and advances that are individually impaired
Grossamount
R’000
Specificimpairment
R’000
Netbalance
R’000
Fair value ofcollateral and
other creditenhance-
mentsR’000
Group
2012
Current accounts 39 185 22 734 16 451 11 353
Credit cards 3 338 3 338 – –
Mortgage loans 74 506 9 004 65 502 66 017
Instalment sales and leases 8 579 8 272 307 329
Structured loans 15 132 8 948 6 184 6 850
Medium-term loans 31 163 10 635 20 528 19 138
171 903 62 931 108 972 103 687
2011
Current accounts 37 032 18 752 18 280 9 507
Credit cards 3 614 3 614 – –
Mortgage loans 99 271 11 832 87 439 94 359
Instalment sales and leases 14 672 8 938 5 734 5 210
Structured loans 15 624 8 982 6 642 7 782
Medium-term loans 42 615 20 033 22 582 18 730
212 828 72 151 140 677 135 588
56 Integrated Annual Report 2012
Notes to the annual financial statementsfor the year ended 31 December 2012 (continued)
11. Loans and advances (continued)
11.10 Collateral held as security and other credit enhancements
Fair value of collateral and other credit enhancements are determined with reference to the realisable value of security.
All customers of the Bank are accorded a client risk grading. The risk grading of a client is dependent upon the client’s creditworthiness and standing with the Bank and is subjected to ongoing assessment of the client’s financial standing and the acceptability of their dealings with the Bank including adherence to repayment terms and compliance with other set conditions.
Description of collateral held as security and other
credit enhancements
Method of valuation
Cession of debtors 15% – 75% of debtors due and payable under 90 days and depending on debtor credit quality
Pledge of shares 50% of listed shares value; nil for unlisted shares
Pledge and cession variable depending on asset type and value
Cession of life and endowment policies 100% of surrender value
Pledge of call and savings accounts fixed and notice deposits 100% of asset value
Vacant land 50% of professional valuation
Residential properties 75% of professional valuation
Commercial and industrial properties 70% of professional valuation
Catering industrial and office equipment variable depending on asset type and depreciated value
Trucks variable depending on asset type and depreciated value
Earthmoving equipment variable depending on asset type and depreciated value
Motor vehicles variable depending on asset type and depreciated value
General notarial bond variable depending on asset type and depreciated value
Special notarial bond variable depending on asset type and depreciated value
All collateral held by the Group in respect of a loan and advance can be realised in accordance with the terms of the agreement or the facility conditions applicable thereto. Cash collateral and pledged assets that can be realised in accordance with the terms of the pledge and cession or suretyship are applied in reduction of related exposures. Pledged assets other than cash or cash equivalent collateral and tangible security articles are appropriated and disposed of where necessary after legal action in compliance with the applicable Court rules and directives.
A customer in default will be advised of the default and afforded an opportunity to regularise the arrears. Failing normalisation of the account legal action and repossession procedures will be followed and all attached assets disposed of in accordance with the applicable legislation. In the case of insolvent and deceased estates the duly appointed liquidator/trustee will dispose of all assets.
11.11 Structured loans
The Group has acquired zero cost equity options attached to certain structured loans that have been recognised at cost in accordance with accounting policy 6.1.
Integrated Annual Report 2012 57
Notes to the annual financial statementsfor the year ended 31 December 2012 (continued)
12. Derivative financial instruments
Notionalprincipalof assets
R’000
Fair valueof assets
R’000
Notionalprincipal
of liabilitiesR’000
Fair valueof liabilities
R’000
Group
2012
Held-for-trading
Foreign exchange contracts 395 050 6 495 386 522 5 620
Interest rate swaps – – 31 237 1 540
395 050 6 495 417 759 7 160
2011
Held-for-trading
Foreign exchange contracts 979 843 15 657 784 018 14 750
Interest rate swaps – – 50 573 2 380
979 843 15 657 834 591 17 130
Group
2012 R’000
2011 R’000
13. Negotiable securities
Loans and receivables
Treasury bills 238 874 173 714
Available-for-sale
Government stock 18 640 18 874
257 514 192 588
Maturity analysis
Maturing within one month 2 329 74 643
Maturing after one month but within six months 125 058 99 071
Maturing after six months but within 12 months 111 487 –
Maturing after one year but within five years 18 640 18 874
257 514 192 588
The maturity analysis is based on the remaining period to contractual maturity at year-end.
Group Company
2012 R’000
2011 R’000
2012 R’000
2011 R’000
14. Cash and cash equivalents
Cash on hand 34 417 38 128 – –
Central Bank balances 125 565 125 632 – –
Money Market funds 854 068 51 455 – –
Rand-denominated domestic bank balances 88 266 102 789 4 522 223
Foreign currency-denominated bank balances 120 700 634 617 – –
1 223 016 952 621 4 522 223
58 Integrated Annual Report 2012
Notes to the annual financial statementsfor the year ended 31 December 2012 (continued)
15. Share capital and share premium
Number of issued
ordinary shares
Sharecapital R’000
Share premium
R’000Total
R’000
15.1 Issued – Group
Shares in issue net of treasury shares at 1 January 2011 3 911 958 625 32 006 1 170 754 1 202 760
Decrease of treasury shares held within the Group 576 027 188 – 188
At 31 December 2011 3 912 534 652 32 194 1 170 754 1 202 948
Decrease of treasury shares held within the Group 26 383 872 7 195 – 7 195
Issue of shares 6 576 128 66 3 354 3 420
Buy-back of shares (331 476 457) (3 315) – (3 315)
Share buy-back costs – – (2 978) (2 978)
At 31 December 2012 3 614 018 195 36 140 1 171 130 1 207 270
In total nil (December 2011: 26 383 872) Treasury shares have been eliminated from share capital and premium.
Treasury shares were utilised during the share buy-back to settle share options exercised by staff of the Bank.
15.2 Issued – Company
Shares in issue at 1 January 2011 and 31 December 2011 3 938 918 524 39 389 1 170 754 1 210 143
Issue of shares 6 576 128 66 3 354 3 420
Buy-back of shares (331 476 457) (3 315) – (3 315)
Share buy-back costs – – (2 978) (2 978)
At 31 December 2012 3 614 018 195 36 140 1 171 130 1 207 270
15.3 Authorised
The total authorised number of ordinary shares is 4 465 955 440 shares (2011: 4 465 955 440 shares) with a par value of 1 cent each. The total authorised number of preference shares is 15 150 486 shares (2011: 15 150 486 shares) with a par value of 25 cents each.
15.4 Unissued
The unissued ordinary and preference shares are under the control of the Directors until the next AGM.
15.5 Share-based payments
Share option scheme
As from 2007, no options have been granted to employees of the Bank under this scheme and as at 31 December 2011, all options issued under the scheme had vested. Due to the share buy-back of the Company’s shares, all options were exercised by the Bank’s employees and in terms of the Scheme of Arrangement for the de-listing of the Company, option holders received 52 cents per share, minus the exercise price per option. The Mercantile Share Incentive Trust, which acted as an agent on behalf of the Bank in respect of this scheme, was subsequently dissolved during 2012.
Conditional share plan
This scheme was implemented in 2008, but due to the ongoing lack of liquidity of the Company’s shares in the market, the Board decided to discontinue new awards under the scheme in 2011. All existing unvested awards were converted to a new cash-settled conditional phantom share plan, which is a deferred bonus scheme (refer to note 18).
Integrated Annual Report 2012 59
Notes to the annual financial statementsfor the year ended 31 December 2012 (continued)
15. Share capital and share premium (continued)
15.5 Share-based payments (continued)
The tables below set out the movement in the options and conditional share awards:
ExerciseOptions
at theForfeited/
Lapsed Exercised Options atExercisable
optionsprice beginning during during the end of at the end Relating to
(cents) of the year the year the year the year of the year directors*
Share option scheme
Grant date
2012
11 February 2002 32 160 000 – (160 000) – – –
5 October 2004 18 5 000 000 – (5 000 000) – – 5 000 000
7 October 2004 17 250 000 – (250 000) – – –
11 February 2005 20 500 000 – (500 000) – – –
27 July 2005 32 750 000 – (750 000) – – –
9 February 2006 41 750 000 – (750 000) – – –
22 March 2006 40 9 800 000 (150 000) (9 650 000) – – 7 000 000
26 February 2007 34 15 750 000 (150 000) (15 600 000) – – 8 000 000
32 960 000 (300 000) (32 660 000) – – 20 000 000
2011
20 November 2001 32 394 400 (394 400) – – – –
11 February 2002 32 160 000 – – 160 000 160 000 –
5 October 2004 18 5 000 000 – – 5 000 000 5 000 000 5 000 000
7 October 2004 17 250 000 – – 250 000 250 000 –
11 February 2005 20 500 000 – – 500 000 500 000 –
27 July 2005 32 750 000 – – 750 000 750 000 –
9 February 2006 41 750 000 – – 750 000 750 000 –
22 March 2006 40 9 800 000 – – 9 800 000 9 800 000 7 000 000
26 February 2007 34 16 150 000 (400 000) – 15 750 000 15 750 000 8 000 000
1 June 2007 36 500 000 (500 000) – – – –
34 254 400 (1 294 400) – 32 960 000 32 960 000 20 000 000
Market price
at dateof grant
(cents)
Conditionalawards
at the beginningof the year
Grantedduring
the year
Forfeited/Lapsedduring
the year
Settledduring
the year
Conversion of the
schemeduring
the year
Conditionalawards atthe end of
the yearConditional share plan
Grant date
2011
22 February 2008 32 21 515 000 – (16 406 250) (5 108 750) – –
26 March 2008 31 4 000 000 – (3 000 000) (1 000 000) – –
24 July 2008 26 375 000 – (281 250) (93 750) – –
1 November 2008 28 2 000 000 – (1 500 000) (500 000) – –
18 March 2009 26 14 500 000 – (11 500 171) (212 329) (2 787 500) –
1 July 2009 25 1 000 000 – (819 178) (180 822) – –
25 February 2010 20 20 050 000 – (4 917 124) (182 876) (14 950 000) –
1 June 2010 24 10 000 000 – – – (10 000 000) –
1 December 2010 20 1 500 000 – – – (1 500 000) –
25 March 2011 21 – 24 050 000 (200 000) – (23 850 000) –
74 940 000 24 050 000 (38 623 973) (7 278 527) (53 087 500) –
* Refer to note 29.3.
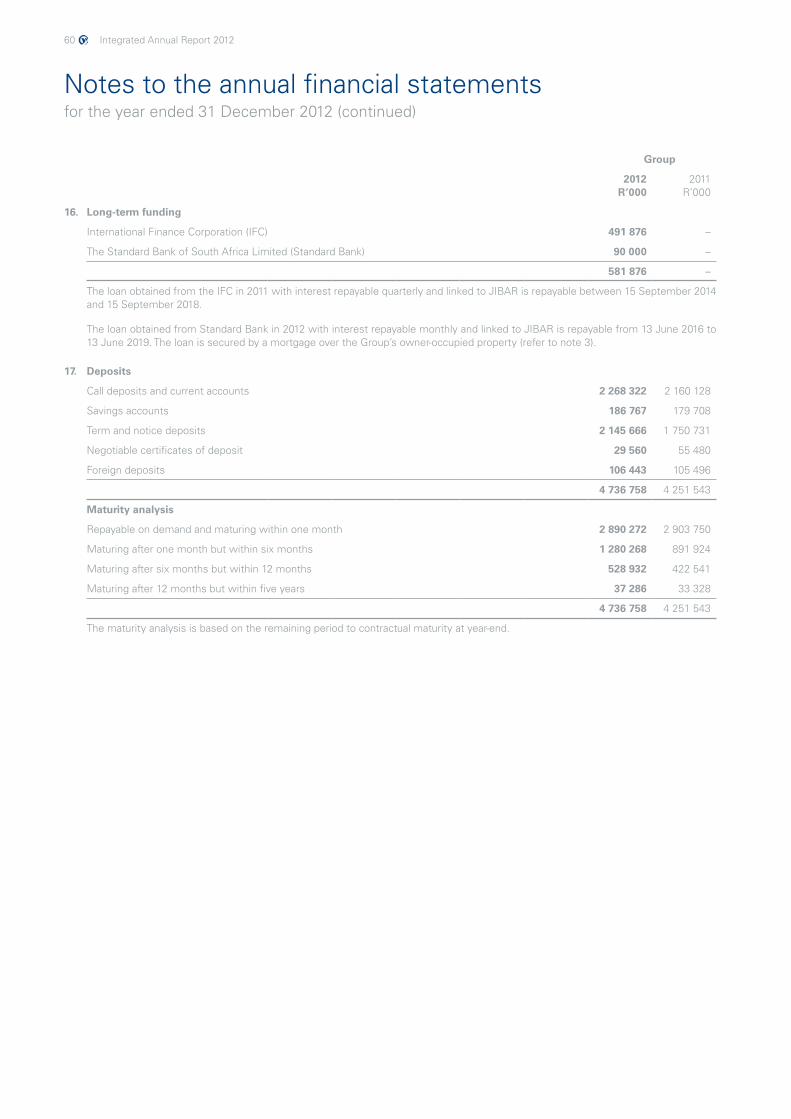
60 Integrated Annual Report 2012
Notes to the annual financial statementsfor the year ended 31 December 2012 (continued)
Group
2012 R’000
2011 R’000
16. Long-term funding
International Finance Corporation (IFC) 491 876 –
The Standard Bank of South Africa Limited (Standard Bank) 90 000 –
581 876 –
The loan obtained from the IFC in 2011 with interest repayable quarterly and linked to JIBAR is repayable between 15 September 2014 and 15 September 2018.
The loan obtained from Standard Bank in 2012 with interest repayable monthly and linked to JIBAR is repayable from 13 June 2016 to 13 June 2019. The loan is secured by a mortgage over the Group’s owner-occupied property (refer to note 3).
17. Deposits
Call deposits and current accounts 2 268 322 2 160 128
Savings accounts 186 767 179 708
Term and notice deposits 2 145 666 1 750 731
Negotiable certificates of deposit 29 560 55 480
Foreign deposits 106 443 105 496
4 736 758 4 251 543
Maturity analysis
Repayable on demand and maturing within one month 2 890 272 2 903 750
Maturing after one month but within six months 1 280 268 891 924
Maturing after six months but within 12 months 528 932 422 541
Maturing after 12 months but within five years 37 286 33 328
4 736 758 4 251 543
The maturity analysis is based on the remaining period to contractual maturity at year-end.
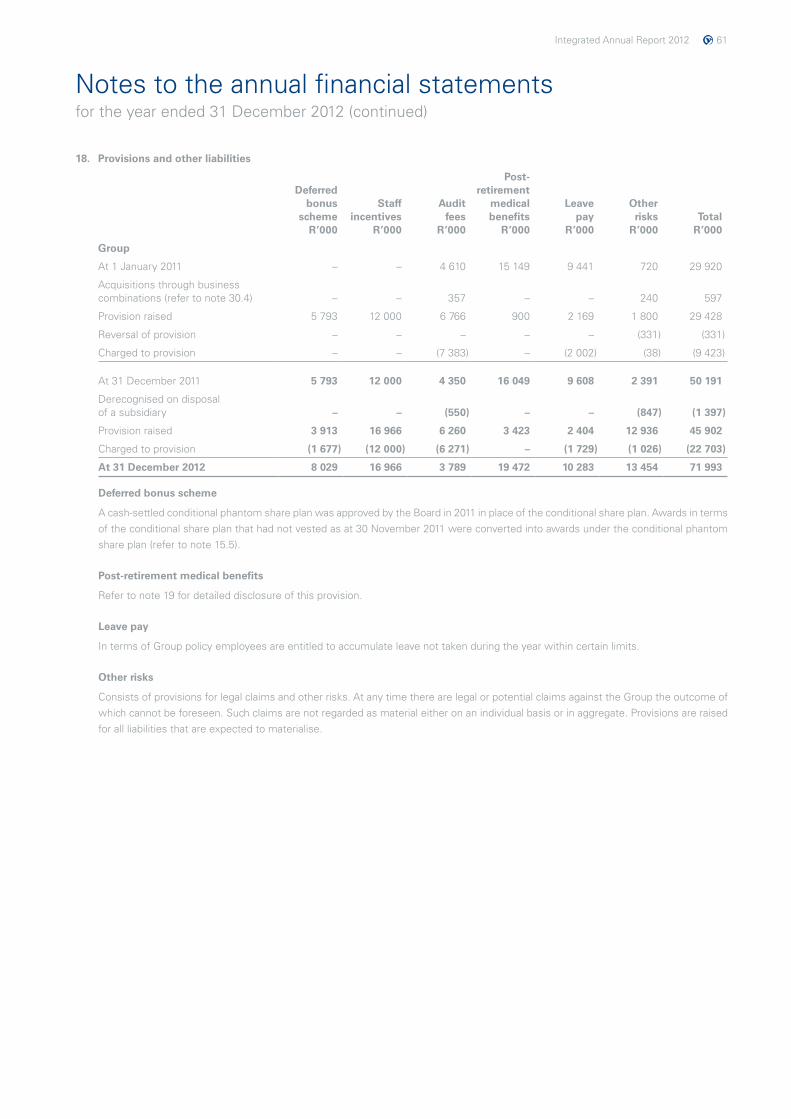
Integrated Annual Report 2012 61
Notes to the annual financial statementsfor the year ended 31 December 2012 (continued)
18. Provisions and other liabilities
Deferredbonus
schemeR’000
Staffincentives
R’000
Auditfees
R’000
Post-retirement
medicalbenefits
R’000
Leavepay
R’000
Otherrisks
R’000Total
R’000
Group
At 1 January 2011 – – 4 610 15 149 9 441 720 29 920
Acquisitions through business combinations (refer to note 30.4) – – 357 – – 240 597
Provision raised 5 793 12 000 6 766 900 2 169 1 800 29 428
Reversal of provision – – – – – (331) (331)
Charged to provision – – (7 383) – (2 002) (38) (9 423)
At 31 December 2011 5 793 12 000 4 350 16 049 9 608 2 391 50 191
Derecognised on disposal of a subsidiary – – (550) – – (847) (1 397)
Provision raised 3 913 16 966 6 260 3 423 2 404 12 936 45 902
Charged to provision (1 677) (12 000) (6 271) – (1 729) (1 026) (22 703)
At 31 December 2012 8 029 16 966 3 789 19 472 10 283 13 454 71 993
Deferred bonus scheme
A cash-settled conditional phantom share plan was approved by the Board in 2011 in place of the conditional share plan. Awards in terms of the conditional share plan that had not vested as at 30 November 2011 were converted into awards under the conditional phantom share plan (refer to note 15.5).
Post-retirement medical benefits
Refer to note 19 for detailed disclosure of this provision.
Leave pay
In terms of Group policy employees are entitled to accumulate leave not taken during the year within certain limits.
Other risks
Consists of provisions for legal claims and other risks. At any time there are legal or potential claims against the Group the outcome of which cannot be foreseen. Such claims are not regarded as material either on an individual basis or in aggregate. Provisions are raised for all liabilities that are expected to materialise.
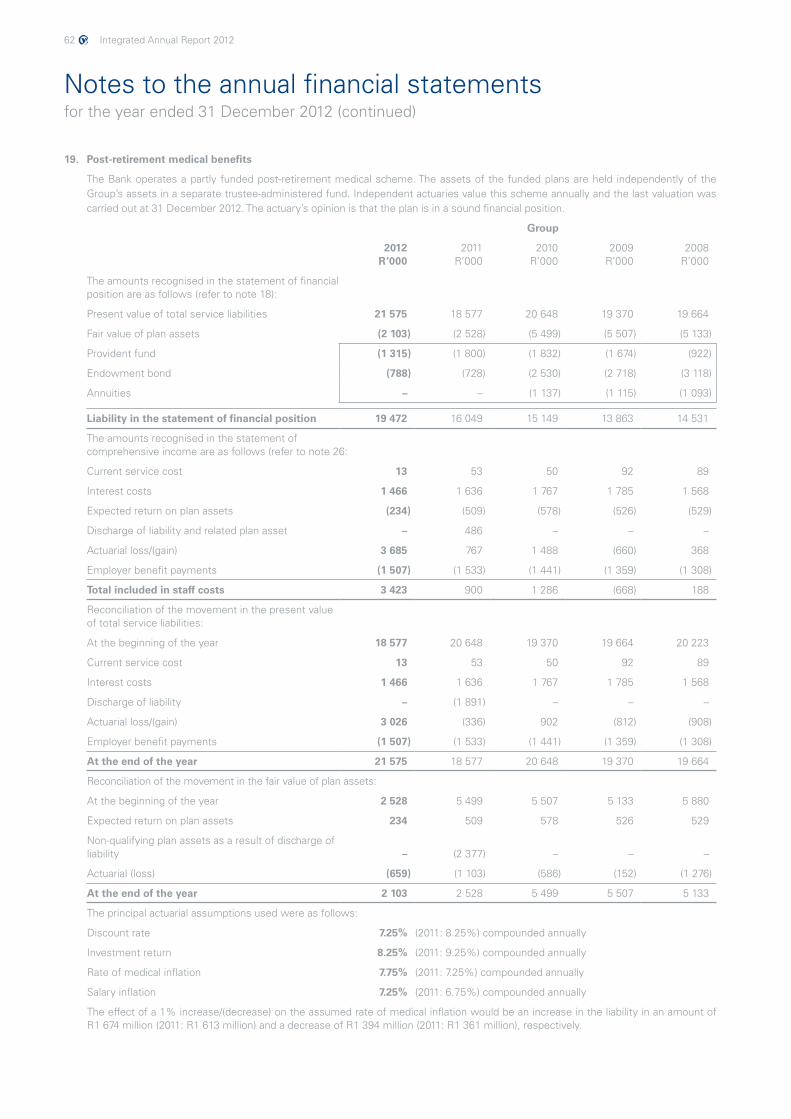
62 Integrated Annual Report 2012
Notes to the annual financial statementsfor the year ended 31 December 2012 (continued)
19. Post-retirement medical benefits
The Bank operates a partly funded post-retirement medical scheme. The assets of the funded plans are held independently of the Group’s assets in a separate trustee-administered fund. Independent actuaries value this scheme annually and the last valuation was carried out at 31 December 2012. The actuary’s opinion is that the plan is in a sound financial position.
Group
2012 R’000
2011 R’000
2010 R’000
2009 R’000
2008 R’000
The amounts recognised in the statement of financial position are as follows (refer to note 18):
Present value of total service liabilities 21 575 18 577 20 648 19 370 19 664
Fair value of plan assets (2 103) (2 528) (5 499) (5 507) (5 133)
Provident fund (1 315) (1 800) (1 832) (1 674) (922)
Endowment bond (788) (728) (2 530) (2 718) (3 118)
Annuities – – (1 137) (1 115) (1 093)
Liability in the statement of financial position 19 472 16 049 15 149 13 863 14 531
The amounts recognised in the statement of comprehensive income are as follows (refer to note 26:
Current service cost 13 53 50 92 89
Interest costs 1 466 1 636 1 767 1 785 1 568
Expected return on plan assets (234) (509) (578) (526) (529)
Discharge of liability and related plan asset – 486 – – –
Actuarial loss/(gain) 3 685 767 1 488 (660) 368
Employer benefit payments (1 507) (1 533) (1 441) (1 359) (1 308)
Total included in staff costs 3 423 900 1 286 (668) 188
Reconciliation of the movement in the present value of total service liabilities:
At the beginning of the year 18 577 20 648 19 370 19 664 20 223
Current service cost 13 53 50 92 89
Interest costs 1 466 1 636 1 767 1 785 1 568
Discharge of liability – (1 891) – – –
Actuarial loss/(gain) 3 026 (336) 902 (812) (908)
Employer benefit payments (1 507) (1 533) (1 441) (1 359) (1 308)
At the end of the year 21 575 18 577 20 648 19 370 19 664
Reconciliation of the movement in the fair value of plan assets:
At the beginning of the year 2 528 5 499 5 507 5 133 5 880
Expected return on plan assets 234 509 578 526 529
Non-qualifying plan assets as a result of discharge of liability – (2 377) – – –
Actuarial (loss) (659) (1 103) (586) (152) (1 276)
At the end of the year 2 103 2 528 5 499 5 507 5 133
The principal actuarial assumptions used were as follows:
Discount rate 7.25% (2011: 8.25%) compounded annually
Investment return 8.25% (2011: 9.25%) compounded annually
Rate of medical inflation 7.75% (2011: 7.25%) compounded annually
Salary inflation 7.25% (2011: 6.75%) compounded annually
The effect of a 1% increase/(decrease) on the assumed rate of medical inflation would be an increase in the liability in an amount of R1 674 million (2011: R1 613 million) and a decrease of R1 394 million (2011: R1 361 million), respectively.
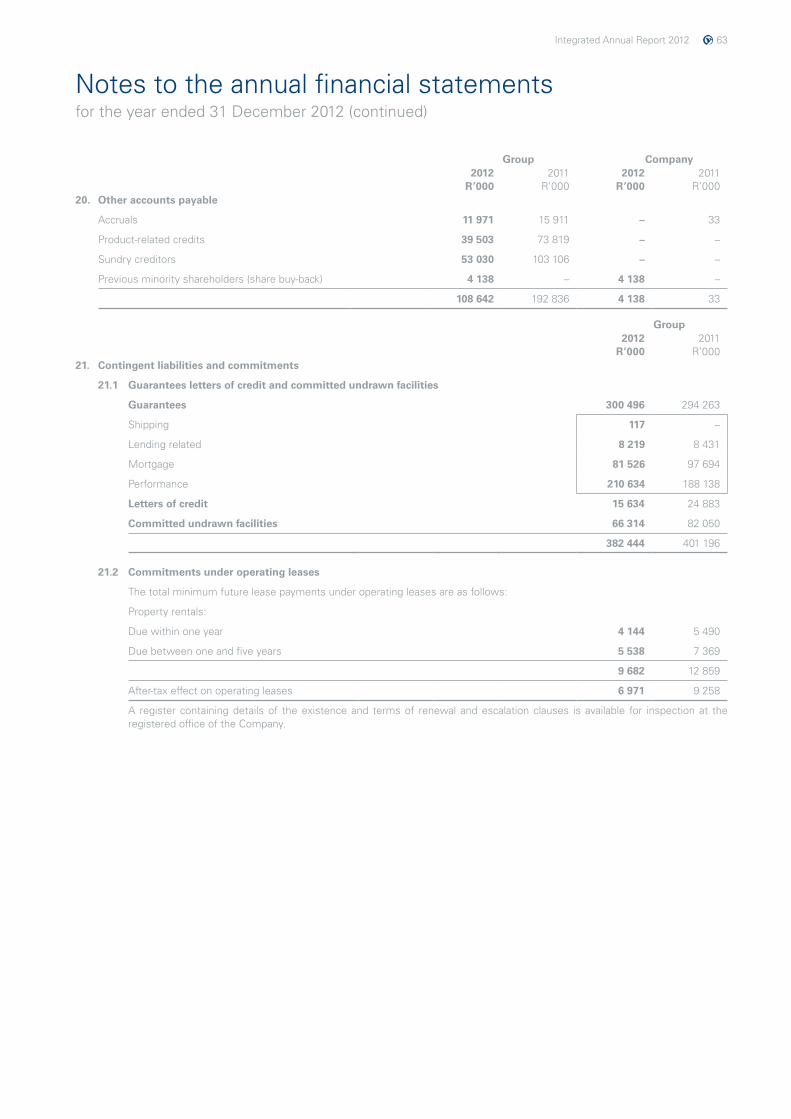
Integrated Annual Report 2012 63
Notes to the annual financial statementsfor the year ended 31 December 2012 (continued)
Group Company2012
R’0002011
R’0002012
R’0002011
R’00020. Other accounts payable
Accruals 11 971 15 911 – 33
Product-related credits 39 503 73 819 – –
Sundry creditors 53 030 103 106 – –
Previous minority shareholders (share buy-back) 4 138 – 4 138 –
108 642 192 836 4 138 33
Group2012
R’0002011
R’00021. Contingent liabilities and commitments
21.1 Guarantees letters of credit and committed undrawn facilities
Guarantees 300 496 294 263
Shipping 117 –
Lending related 8 219 8 431
Mortgage 81 526 97 694
Performance 210 634 188 138
Letters of credit 15 634 24 883
Committed undrawn facilities 66 314 82 050
382 444 401 196
21.2 Commitments under operating leases
The total minimum future lease payments under operating leases are as follows:
Property rentals:
Due within one year 4 144 5 490
Due between one and five years 5 538 7 369
9 682 12 859
After-tax effect on operating leases 6 971 9 258
A register containing details of the existence and terms of renewal and escalation clauses is available for inspection at the registered office of the Company.
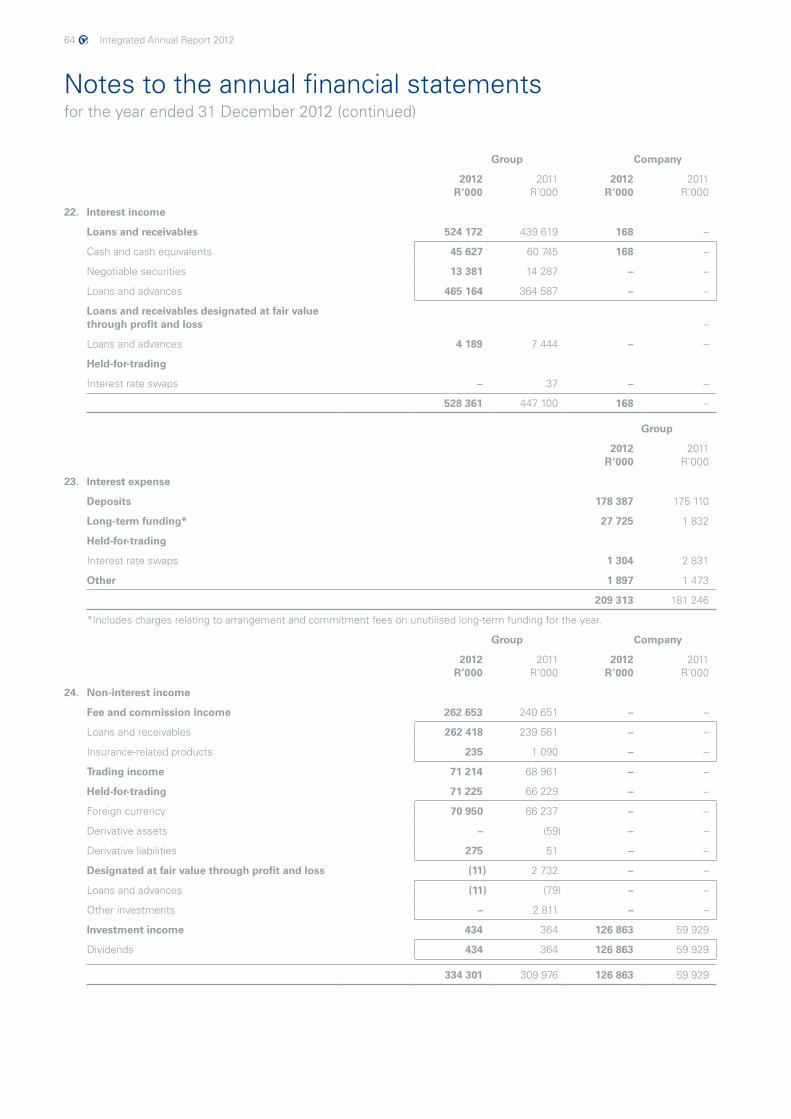
64 Integrated Annual Report 2012
Notes to the annual financial statementsfor the year ended 31 December 2012 (continued)
Group Company
2012 R’000
2011 R’000
2012 R’000
2011 R’000
22. Interest income
Loans and receivables 524 172 439 619 168 –
Cash and cash equivalents 45 627 60 745 168 –
Negotiable securities 13 381 14 287 – –
Loans and advances 465 164 364 587 – –
Loans and receivables designated at fair value through profit and loss –
Loans and advances 4 189 7 444 – –
Held-for-trading
Interest rate swaps – 37 – –
528 361 447 100 168 –
Group
2012 R’000
2011 R’000
23. Interest expense
Deposits 178 387 175 110
Long-term funding* 27 725 1 832
Held-for-trading
Interest rate swaps 1 304 2 831
Other 1 897 1 473
209 313 181 246
*Includes charges relating to arrangement and commitment fees on unutilised long-term funding for the year.
Group Company
2012 R’000
2011 R’000
2012 R’000
2011 R’000
24. Non-interest income
Fee and commission income 262 653 240 651 – –
Loans and receivables 262 418 239 561 – –
Insurance-related products 235 1 090 – –
Trading income 71 214 68 961 – –
Held-for-trading 71 225 66 229 – –
Foreign currency 70 950 66 237 – –
Derivative assets – (59) – –
Derivative liabilities 275 51 – –
Designated at fair value through profit and loss (11) 2 732 – –
Loans and advances (11) (79) – –
Other investments – 2 811 – –
Investment income 434 364 126 863 59 929
Dividends 434 364 126 863 59 929
334 301 309 976 126 863 59 929
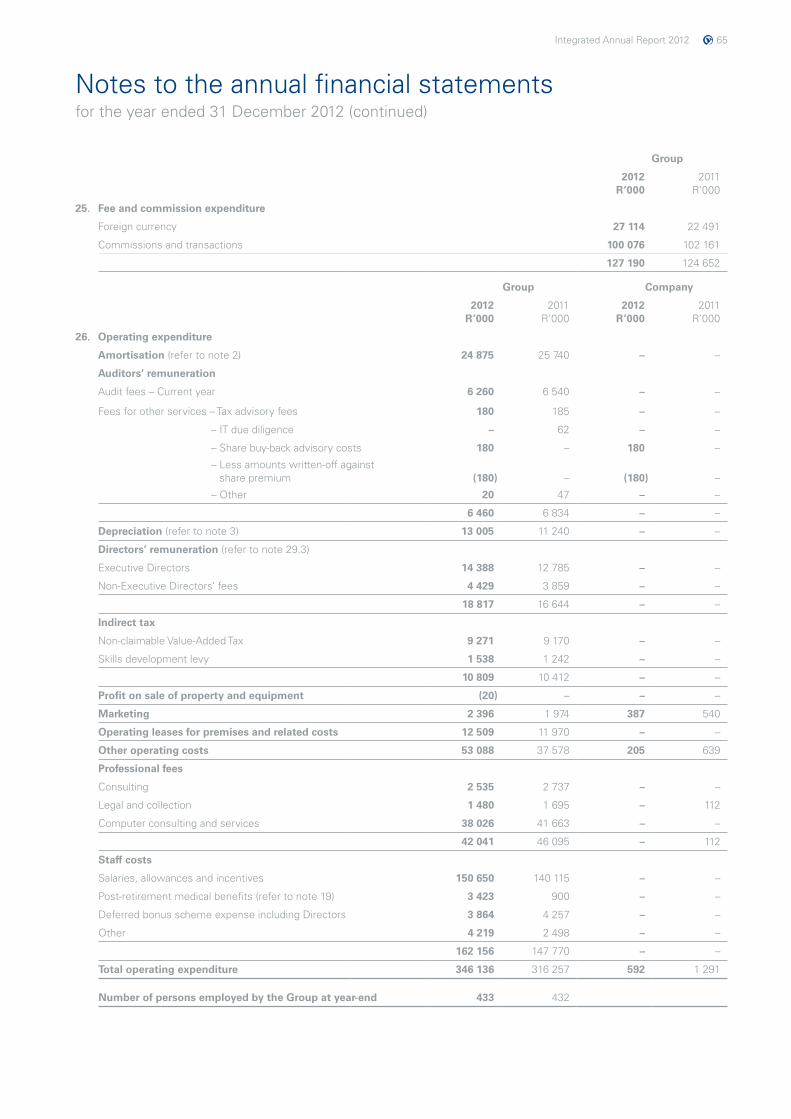
Integrated Annual Report 2012 65
Notes to the annual financial statementsfor the year ended 31 December 2012 (continued)
Group
2012 R’000
2011 R’000
25. Fee and commission expenditure
Foreign currency 27 114 22 491
Commissions and transactions 100 076 102 161
127 190 124 652
Group Company
2012 R’000
2011 R’000
2012 R’000
2011 R’000
26. Operating expenditure
Amortisation (refer to note 2) 24 875 25 740 – –
Auditors’ remuneration
Audit fees – Current year 6 260 6 540 – –
Fees for other services – Tax advisory fees 180 185 – –
– IT due diligence – 62 – –
– Share buy-back advisory costs 180 – 180 –
– Less amounts written-off against share premium (180) – (180) –
– Other 20 47 – –
6 460 6 834 – –
Depreciation (refer to note 3) 13 005 11 240 – –
Directors’ remuneration (refer to note 29.3)
Executive Directors 14 388 12 785 – –
Non-Executive Directors’ fees 4 429 3 859 – –
18 817 16 644 – –
Indirect tax
Non-claimable Value-Added Tax 9 271 9 170 – –
Skills development levy 1 538 1 242 – –
10 809 10 412 – –
Profit on sale of property and equipment (20) – – –
Marketing 2 396 1 974 387 540
Operating leases for premises and related costs 12 509 11 970 – –
Other operating costs 53 088 37 578 205 639
Professional fees
Consulting 2 535 2 737 – –
Legal and collection 1 480 1 695 – 112
Computer consulting and services 38 026 41 663 – –
42 041 46 095 – 112
Staff costs
Salaries, allowances and incentives 150 650 140 115 – –
Post-retirement medical benefits (refer to note 19) 3 423 900 – –
Deferred bonus scheme expense including Directors 3 864 4 257 – –
Other 4 219 2 498 – –
162 156 147 770 – –
Total operating expenditure 346 136 316 257 592 1 291
Number of persons employed by the Group at year-end 433 432
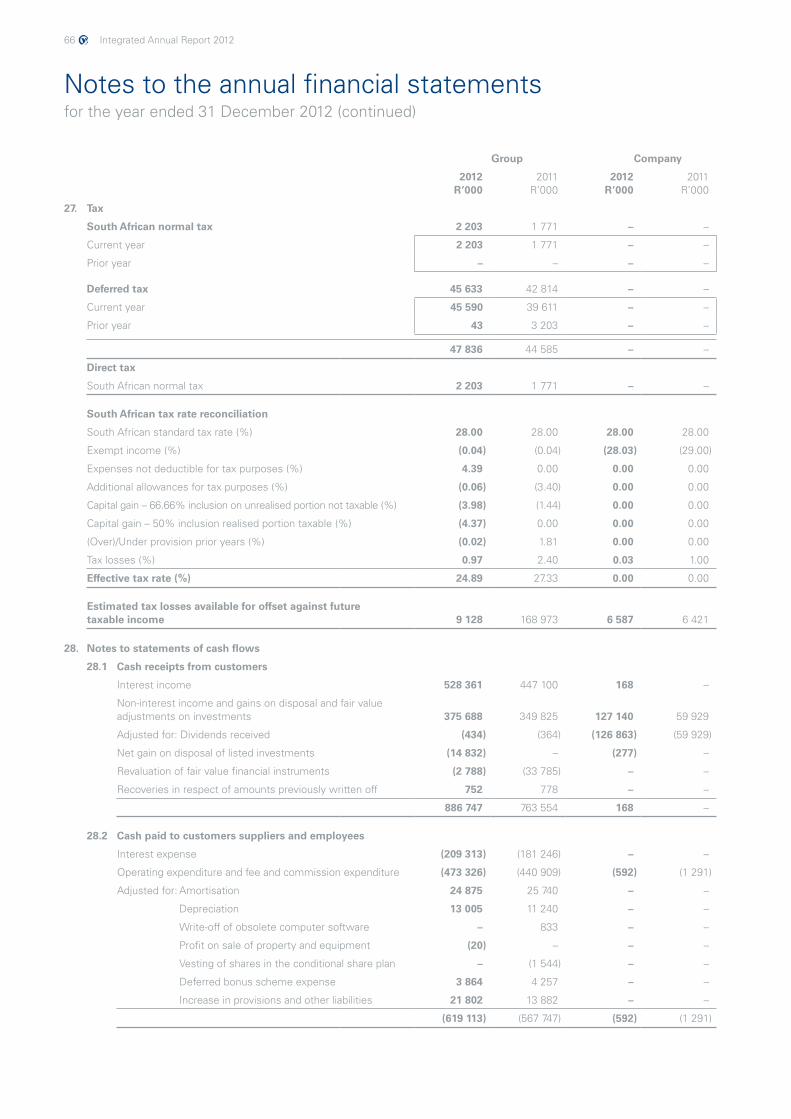
66 Integrated Annual Report 2012
Notes to the annual financial statementsfor the year ended 31 December 2012 (continued)
Group Company
2012 R’000
2011 R’000
2012 R’000
2011 R’000
27. Tax
South African normal tax 2 203 1 771 – –
Current year 2 203 1 771 – –
Prior year – – – –
Deferred tax 45 633 42 814 – –
Current year 45 590 39 611 – –
Prior year 43 3 203 – –
47 836 44 585 – –
Direct tax
South African normal tax 2 203 1 771 – –
South African tax rate reconciliation
South African standard tax rate (%) 28.00 28.00 28.00 28.00
Exempt income (%) (0.04) (0.04) (28.03) (29.00)
Expenses not deductible for tax purposes (%) 4.39 0.00 0.00 0.00
Additional allowances for tax purposes (%) (0.06) (3.40) 0.00 0.00
Capital gain – 66.66% inclusion on unrealised portion not taxable (%) (3.98) (1.44) 0.00 0.00
Capital gain – 50% inclusion realised portion taxable (%) (4.37) 0.00 0.00 0.00
(Over)/Under provision prior years (%) (0.02) 1.81 0.00 0.00
Tax losses (%) 0.97 2.40 0.03 1.00
Effective tax rate (%) 24.89 27.33 0.00 0.00
Estimated tax losses available for offset against future taxable income 9 128 168 973 6 587 6 421
28. Notes to statements of cash flows
28.1 Cash receipts from customers
Interest income 528 361 447 100 168 –
Non-interest income and gains on disposal and fair value adjustments on investments 375 688 349 825 127 140 59 929
Adjusted for: Dividends received (434) (364) (126 863) (59 929)
Net gain on disposal of listed investments (14 832) – (277) –
Revaluation of fair value financial instruments (2 788) (33 785) – –
Recoveries in respect of amounts previously written off 752 778 – –
886 747 763 554 168 –
28.2 Cash paid to customers suppliers and employees
Interest expense (209 313) (181 246) – –
Operating expenditure and fee and commission expenditure (473 326) (440 909) (592) (1 291)
Adjusted for: Amortisation 24 875 25 740 – –
Depreciation 13 005 11 240 – –
Write-off of obsolete computer software – 833 – –
Profit on sale of property and equipment (20) – – –
Vesting of shares in the conditional share plan – (1 544) – –
Deferred bonus scheme expense 3 864 4 257 – –
Increase in provisions and other liabilities 21 802 13 882 – –
(619 113) (567 747) (592) (1 291)
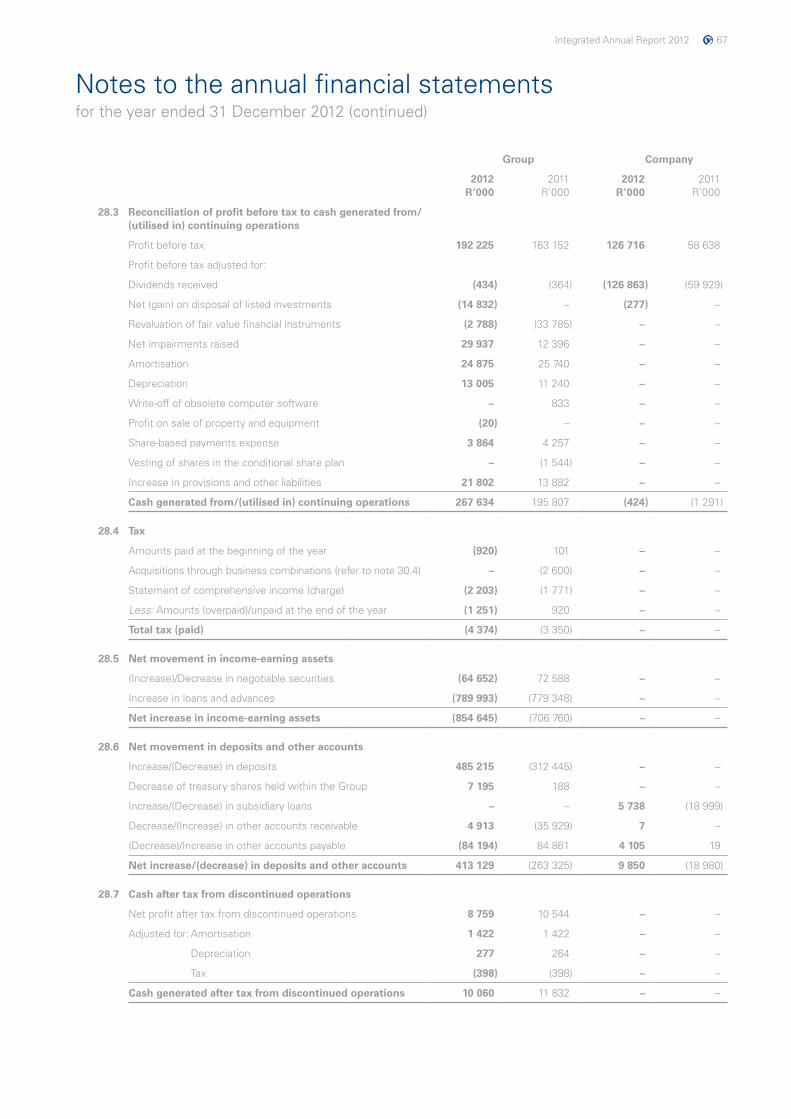
Integrated Annual Report 2012 67
Notes to the annual financial statementsfor the year ended 31 December 2012 (continued)
Group Company
2012 R’000
2011 R’000
2012 R’000
2011 R’000
28.3 Reconciliation of profit before tax to cash generated from/(utilised in) continuing operations
Profit before tax 192 225 163 152 126 716 58 638
Profit before tax adjusted for:
Dividends received (434) (364) (126 863) (59 929)
Net (gain) on disposal of listed investments (14 832) – (277) –
Revaluation of fair value financial instruments (2 788) (33 785) – –
Net impairments raised 29 937 12 396 – –
Amortisation 24 875 25 740 – –
Depreciation 13 005 11 240 – –
Write-off of obsolete computer software – 833 – –
Profit on sale of property and equipment (20) – – –
Share-based payments expense 3 864 4 257 – –
Vesting of shares in the conditional share plan – (1 544) – –
Increase in provisions and other liabilities 21 802 13 882 – –
Cash generated from/(utilised in) continuing operations 267 634 195 807 (424) (1 291)
28.4 Tax
Amounts paid at the beginning of the year (920) 101 – –
Acquisitions through business combinations (refer to note 30.4) – (2 600) – –
Statement of comprehensive income (charge) (2 203) (1 771) – –
Less: Amounts (overpaid)/unpaid at the end of the year (1 251) 920 – –
Total tax (paid) (4 374) (3 350) – –
28.5 Net movement in income-earning assets
(Increase)/Decrease in negotiable securities (64 652) 72 588 – –
Increase in loans and advances (789 993) (779 348) – –
Net increase in income-earning assets (854 645) (706 760) – –
28.6 Net movement in deposits and other accounts
Increase/(Decrease) in deposits 485 215 (312 445) – –
Decrease of treasury shares held within the Group 7 195 188 – –
Increase/(Decrease) in subsidiary loans – – 5 738 (18 999)
Decrease/(Increase) in other accounts receivable 4 913 (35 929) 7 –
(Decrease)/Increase in other accounts payable (84 194) 84 861 4 105 19
Net increase/(decrease) in deposits and other accounts 413 129 (263 325) 9 850 (18 980)
28.7 Cash after tax from discontinued operations
Net profit after tax from discontinued operations 8 759 10 544 – –
Adjusted for: Amortisation 1 422 1 422 – –
Depreciation 277 264 – –
Tax (398) (398) – –
Cash generated after tax from discontinued operations 10 060 11 832 – –
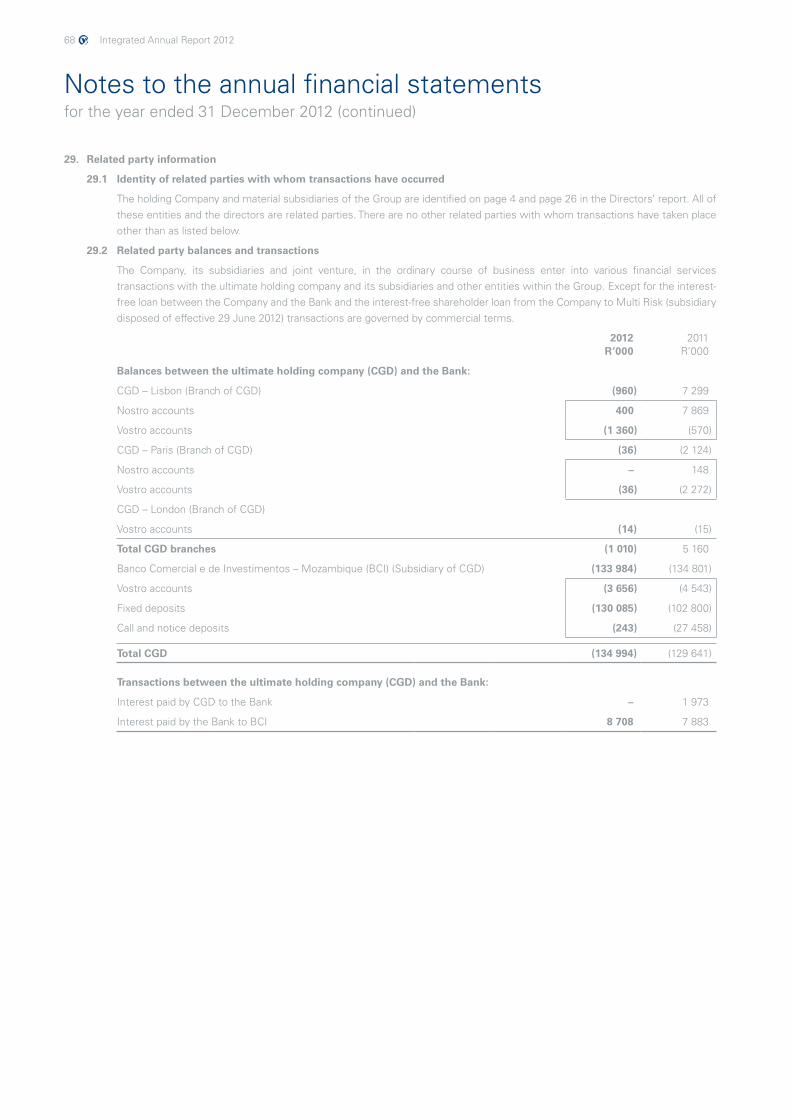
68 Integrated Annual Report 2012
Notes to the annual financial statementsfor the year ended 31 December 2012 (continued)
29. Related party information
29.1 Identity of related parties with whom transactions have occurred
The holding Company and material subsidiaries of the Group are identified on page 4 and page 26 in the Directors’ report. All of these entities and the directors are related parties. There are no other related parties with whom transactions have taken place other than as listed below.
29.2 Related party balances and transactions
The Company, its subsidiaries and joint venture, in the ordinary course of business enter into various financial services transactions with the ultimate holding company and its subsidiaries and other entities within the Group. Except for the interest-free loan between the Company and the Bank and the interest-free shareholder loan from the Company to Multi Risk (subsidiary disposed of effective 29 June 2012) transactions are governed by commercial terms.
2012 R’000
2011 R’000
Balances between the ultimate holding company (CGD) and the Bank:
CGD – Lisbon (Branch of CGD) (960) 7 299
Nostro accounts 400 7 869
Vostro accounts (1 360) (570)
CGD – Paris (Branch of CGD) (36) (2 124)
Nostro accounts – 148
Vostro accounts (36) (2 272)
CGD – London (Branch of CGD)
Vostro accounts (14) (15)
Total CGD branches (1 010) 5 160
Banco Comercial e de Investimentos – Mozambique (BCI) (Subsidiary of CGD) (133 984) (134 801)
Vostro accounts (3 656) (4 543)
Fixed deposits (130 085) (102 800)
Call and notice deposits (243) (27 458)
Total CGD (134 994) (129 641)
Transactions between the ultimate holding company (CGD) and the Bank:
Interest paid by CGD to the Bank – 1 973
Interest paid by the Bank to BCI 8 708 7 883
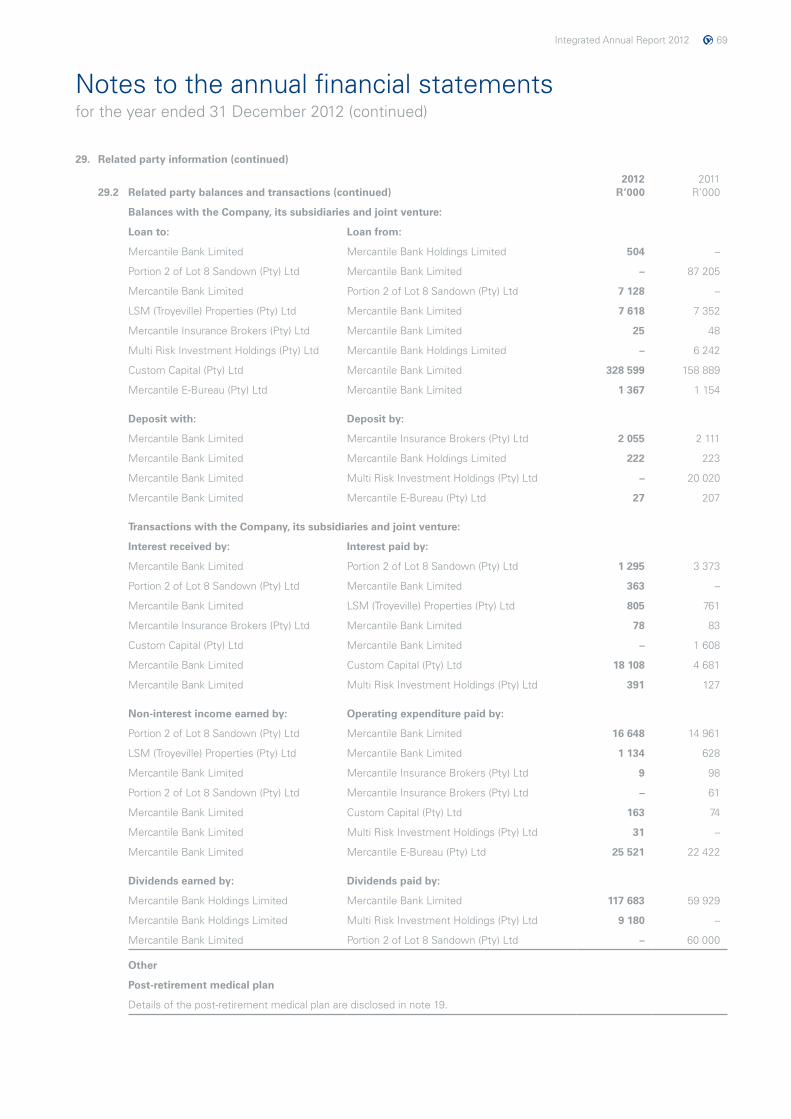
Integrated Annual Report 2012 69
Notes to the annual financial statementsfor the year ended 31 December 2012 (continued)
29. Related party information (continued)
29.2 Related party balances and transactions (continued)2012
R’0002011
R’000
Balances with the Company, its subsidiaries and joint venture:
Loan to: Loan from:
Mercantile Bank Limited Mercantile Bank Holdings Limited 504 –
Portion 2 of Lot 8 Sandown (Pty) Ltd Mercantile Bank Limited – 87 205
Mercantile Bank Limited Portion 2 of Lot 8 Sandown (Pty) Ltd 7 128 –
LSM (Troyeville) Properties (Pty) Ltd Mercantile Bank Limited 7 618 7 352
Mercantile Insurance Brokers (Pty) Ltd Mercantile Bank Limited 25 48
Multi Risk Investment Holdings (Pty) Ltd Mercantile Bank Holdings Limited – 6 242
Custom Capital (Pty) Ltd Mercantile Bank Limited 328 599 158 889
Mercantile E-Bureau (Pty) Ltd Mercantile Bank Limited 1 367 1 154
Deposit with: Deposit by:
Mercantile Bank Limited Mercantile Insurance Brokers (Pty) Ltd 2 055 2 111
Mercantile Bank Limited Mercantile Bank Holdings Limited 222 223
Mercantile Bank Limited Multi Risk Investment Holdings (Pty) Ltd – 20 020
Mercantile Bank Limited Mercantile E-Bureau (Pty) Ltd 27 207
Transactions with the Company, its subsidiaries and joint venture:
Interest received by: Interest paid by:
Mercantile Bank Limited Portion 2 of Lot 8 Sandown (Pty) Ltd 1 295 3 373
Portion 2 of Lot 8 Sandown (Pty) Ltd Mercantile Bank Limited 363 –
Mercantile Bank Limited LSM (Troyeville) Properties (Pty) Ltd 805 761
Mercantile Insurance Brokers (Pty) Ltd Mercantile Bank Limited 78 83
Custom Capital (Pty) Ltd Mercantile Bank Limited – 1 608
Mercantile Bank Limited Custom Capital (Pty) Ltd 18 108 4 681
Mercantile Bank Limited Multi Risk Investment Holdings (Pty) Ltd 391 127
Non-interest income earned by: Operating expenditure paid by:
Portion 2 of Lot 8 Sandown (Pty) Ltd Mercantile Bank Limited 16 648 14 961
LSM (Troyeville) Properties (Pty) Ltd Mercantile Bank Limited 1 134 628
Mercantile Bank Limited Mercantile Insurance Brokers (Pty) Ltd 9 98
Portion 2 of Lot 8 Sandown (Pty) Ltd Mercantile Insurance Brokers (Pty) Ltd – 61
Mercantile Bank Limited Custom Capital (Pty) Ltd 163 74
Mercantile Bank Limited Multi Risk Investment Holdings (Pty) Ltd 31 –
Mercantile Bank Limited Mercantile E-Bureau (Pty) Ltd 25 521 22 422
Dividends earned by: Dividends paid by:
Mercantile Bank Holdings Limited Mercantile Bank Limited 117 683 59 929
Mercantile Bank Holdings Limited Multi Risk Investment Holdings (Pty) Ltd 9 180 –
Mercantile Bank Limited Portion 2 of Lot 8 Sandown (Pty) Ltd – 60 000
Other
Post-retirement medical plan
Details of the post-retirement medical plan are disclosed in note 19.
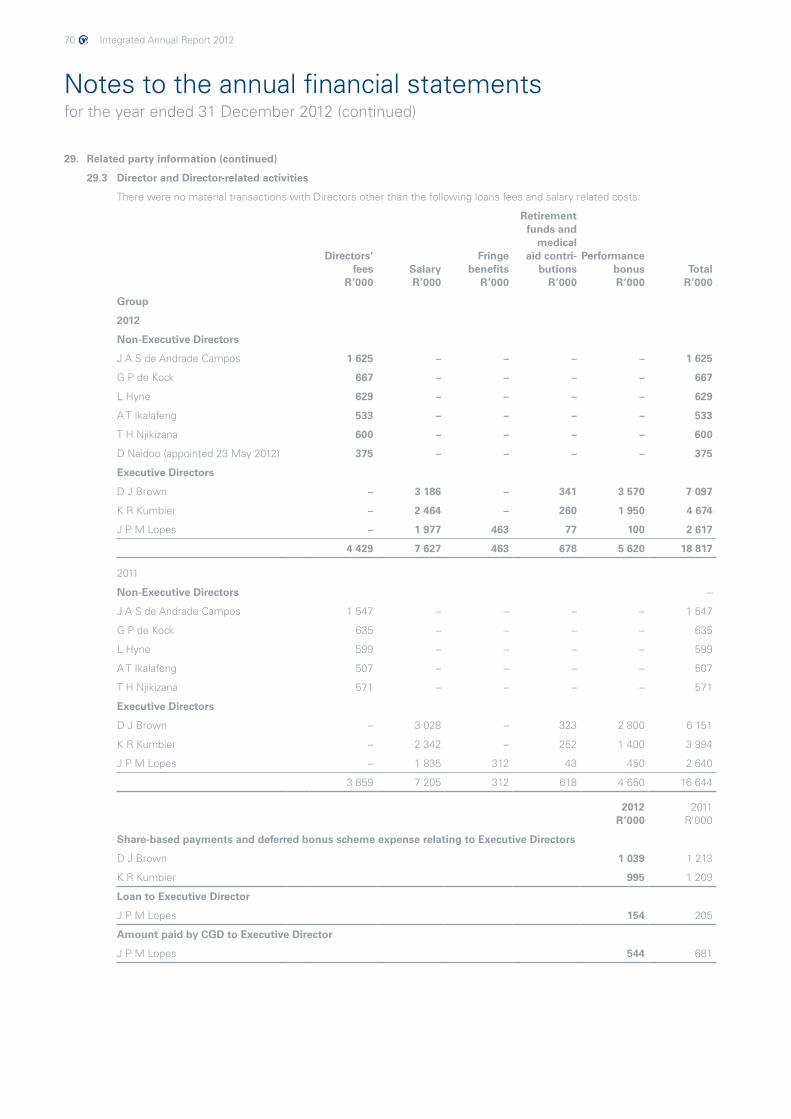
70 Integrated Annual Report 2012
Notes to the annual financial statementsfor the year ended 31 December 2012 (continued)
29. Related party information (continued)
29.3 Director and Director-related activities
There were no material transactions with Directors other than the following loans fees and salary related costs:
Directors’fees
R’000SalaryR’000
Fringe benefits
R’000
Retirementfunds and
medicalaid contri-
butionsR’000
PerformancebonusR’000
TotalR’000
Group
2012
Non-Executive Directors
J A S de Andrade Campos 1 625 – – – – 1 625
G P de Kock 667 – – – – 667
L Hyne 629 – – – – 629
A T Ikalafeng 533 – – – – 533
T H Njikizana 600 – – – – 600
D Naidoo (appointed 23 May 2012) 375 – – – – 375
Executive Directors
D J Brown – 3 186 – 341 3 570 7 097
K R Kumbier – 2 464 – 260 1 950 4 674
J P M Lopes – 1 977 463 77 100 2 617
4 429 7 627 463 678 5 620 18 817
2011
Non-Executive Directors –
J A S de Andrade Campos 1 547 – – – – 1 547
G P de Kock 635 – – – – 635
L Hyne 599 – – – – 599
A T Ikalafeng 507 – – – – 507
T H Njikizana 571 – – – – 571
Executive Directors
D J Brown – 3 028 – 323 2 800 6 151
K R Kumbier – 2 342 – 252 1 400 3 994
J P M Lopes – 1 835 312 43 450 2 640
3 859 7 205 312 618 4 650 16 644
2012 R’000
2011 R’000
Share-based payments and deferred bonus scheme expense relating to Executive Directors
D J Brown 1 039 1 213
K R Kumbier 995 1 209
Loan to Executive Director
J P M Lopes 154 205
Amount paid by CGD to Executive Director
J P M Lopes 544 681
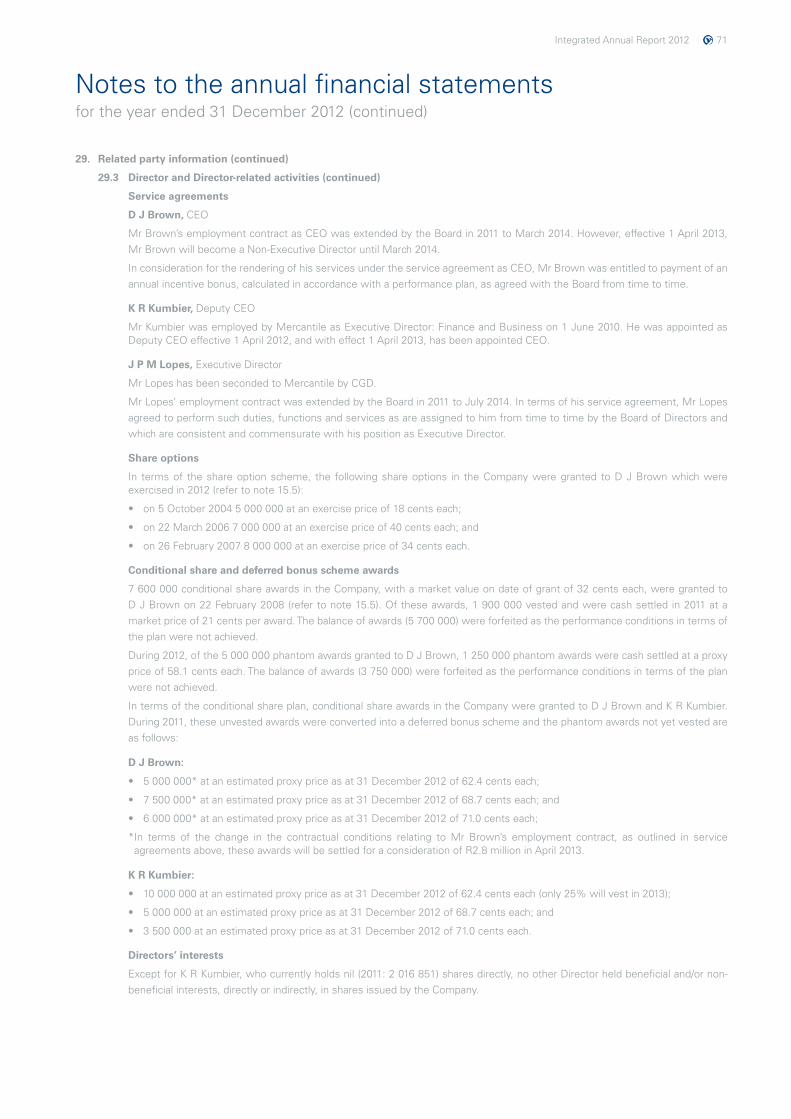
Integrated Annual Report 2012 71
Notes to the annual financial statementsfor the year ended 31 December 2012 (continued)
29. Related party information (continued)
29.3 Director and Director-related activities (continued)
Service agreements
D J Brown, CEO
Mr Brown’s employment contract as CEO was extended by the Board in 2011 to March 2014. However, effective 1 April 2013, Mr Brown will become a Non-Executive Director until March 2014.
In consideration for the rendering of his services under the service agreement as CEO, Mr Brown was entitled to payment of an annual incentive bonus, calculated in accordance with a performance plan, as agreed with the Board from time to time.
K R Kumbier, Deputy CEO
Mr Kumbier was employed by Mercantile as Executive Director: Finance and Business on 1 June 2010. He was appointed as Deputy CEO effective 1 April 2012, and with effect 1 April 2013, has been appointed CEO.
J P M Lopes, Executive Director
Mr Lopes has been seconded to Mercantile by CGD.
Mr Lopes’ employment contract was extended by the Board in 2011 to July 2014. In terms of his service agreement, Mr Lopes agreed to perform such duties, functions and services as are assigned to him from time to time by the Board of Directors and which are consistent and commensurate with his position as Executive Director.
Share options
In terms of the share option scheme, the following share options in the Company were granted to D J Brown which were exercised in 2012 (refer to note 15.5):
• on 5 October 2004 5 000 000 at an exercise price of 18 cents each;
• on 22 March 2006 7 000 000 at an exercise price of 40 cents each; and
• on 26 February 2007 8 000 000 at an exercise price of 34 cents each.
Conditional share and deferred bonus scheme awards
7 600 000 conditional share awards in the Company, with a market value on date of grant of 32 cents each, were granted to D J Brown on 22 February 2008 (refer to note 15.5). Of these awards, 1 900 000 vested and were cash settled in 2011 at a market price of 21 cents per award. The balance of awards (5 700 000) were forfeited as the performance conditions in terms of the plan were not achieved.
During 2012, of the 5 000 000 phantom awards granted to D J Brown, 1 250 000 phantom awards were cash settled at a proxy price of 58.1 cents each. The balance of awards (3 750 000) were forfeited as the performance conditions in terms of the plan were not achieved.
In terms of the conditional share plan, conditional share awards in the Company were granted to D J Brown and K R Kumbier. During 2011, these unvested awards were converted into a deferred bonus scheme and the phantom awards not yet vested are as follows:
D J Brown:
• 5 000 000* at an estimated proxy price as at 31 December 2012 of 62.4 cents each;
• 7 500 000* at an estimated proxy price as at 31 December 2012 of 68.7 cents each; and
• 6 000 000* at an estimated proxy price as at 31 December 2012 of 71.0 cents each;
* In terms of the change in the contractual conditions relating to Mr Brown’s employment contract, as outlined in service agreements above, these awards will be settled for a consideration of R2.8 million in April 2013.
K R Kumbier:
• 10000000atanestimatedproxypriceasat31December2012of62.4centseach(only25%willvestin2013);
• 5000000atanestimatedproxypriceasat31December2012of68.7centseach;and
• 3500000atanestimatedproxypriceasat31December2012of71.0centseach.
Directors’ interests
Except for K R Kumbier, who currently holds nil (2011: 2 016 851) shares directly, no other Director held beneficial and/or non-beneficial interests, directly or indirectly, in shares issued by the Company.
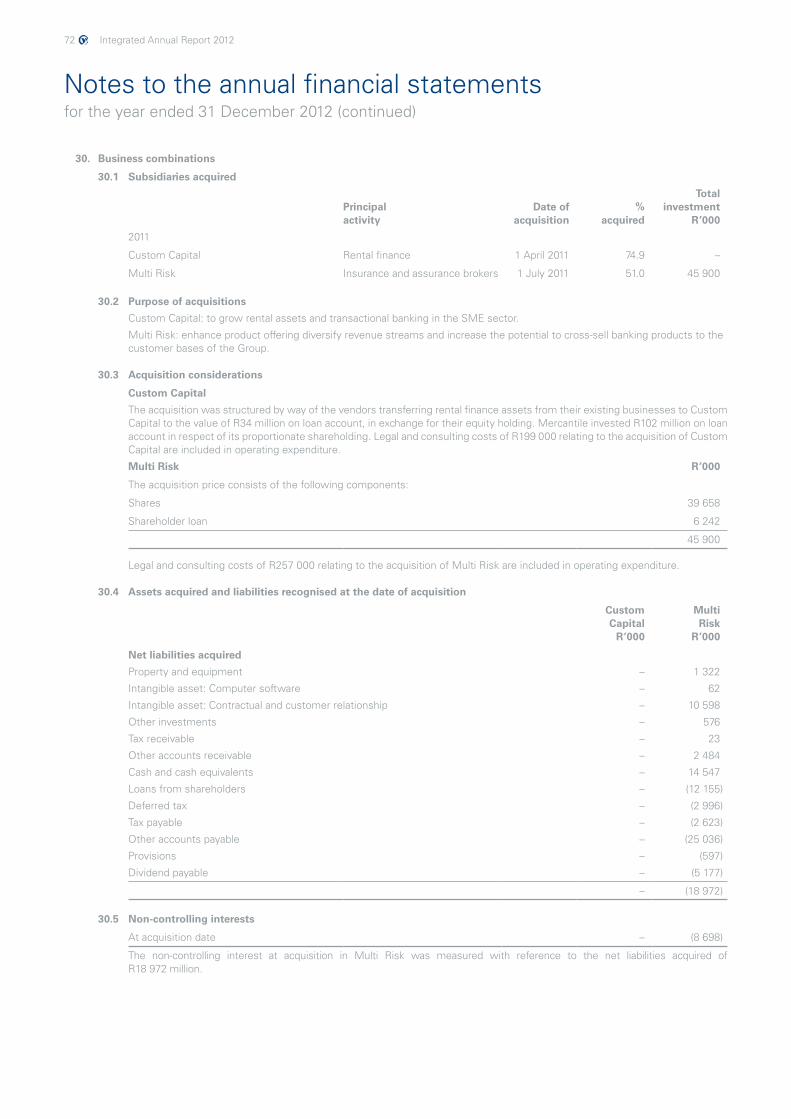
72 Integrated Annual Report 2012
Notes to the annual financial statementsfor the year ended 31 December 2012 (continued)
30. Business combinations
30.1 Subsidiaries acquired
Principalactivity
Date ofacquisition
% acquired
Total investment
R’000
2011
Custom Capital Rental finance 1 April 2011 74.9 –
Multi Risk Insurance and assurance brokers 1 July 2011 51.0 45 900
30.2 Purpose of acquisitions
Custom Capital: to grow rental assets and transactional banking in the SME sector.
Multi Risk: enhance product offering diversify revenue streams and increase the potential to cross-sell banking products to the customer bases of the Group.
30.3 Acquisition considerations
Custom Capital
The acquisition was structured by way of the vendors transferring rental finance assets from their existing businesses to Custom Capital to the value of R34 million on loan account, in exchange for their equity holding. Mercantile invested R102 million on loan account in respect of its proportionate shareholding. Legal and consulting costs of R199 000 relating to the acquisition of Custom Capital are included in operating expenditure.
Multi Risk R’000
The acquisition price consists of the following components:
Shares 39 658
Shareholder loan 6 242
45 900
Legal and consulting costs of R257 000 relating to the acquisition of Multi Risk are included in operating expenditure.
30.4 Assets acquired and liabilities recognised at the date of acquisition
Custom Capital
R’000
MultiRisk
R’000
Net liabilities acquired
Property and equipment – 1 322
Intangible asset: Computer software – 62
Intangible asset: Contractual and customer relationship – 10 598
Other investments – 576
Tax receivable – 23
Other accounts receivable – 2 484
Cash and cash equivalents – 14 547
Loans from shareholders – (12 155)
Deferred tax – (2 996)
Tax payable – (2 623)
Other accounts payable – (25 036)
Provisions – (597)
Dividend payable – (5 177)
– (18 972)
30.5 Non-controlling interests
At acquisition date – (8 698)
The non-controlling interest at acquisition in Multi Risk was measured with reference to the net liabilities acquired of R18 972 million.
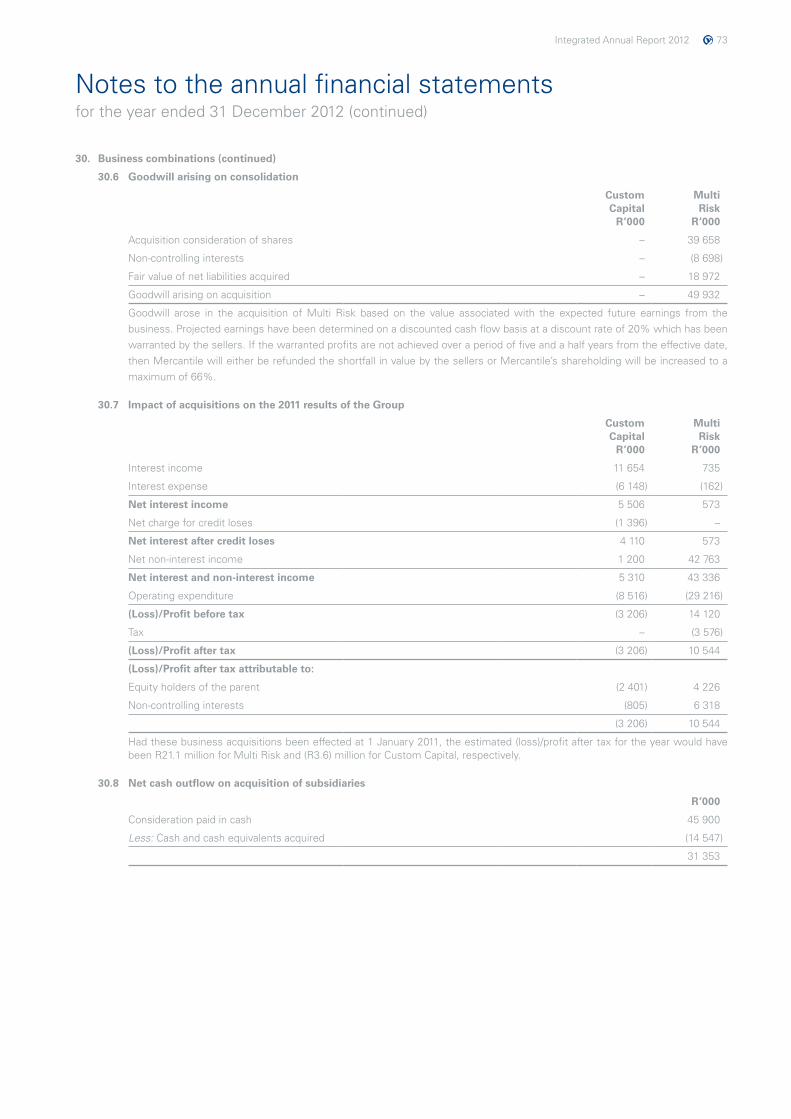
Integrated Annual Report 2012 73
Notes to the annual financial statementsfor the year ended 31 December 2012 (continued)
30. Business combinations (continued)
30.6 Goodwill arising on consolidation
Custom Capital
R’000
MultiRisk
R’000
Acquisition consideration of shares – 39 658
Non-controlling interests – (8 698)
Fair value of net liabilities acquired – 18 972
Goodwill arising on acquisition – 49 932
Goodwill arose in the acquisition of Multi Risk based on the value associated with the expected future earnings from the business. Projected earnings have been determined on a discounted cash flow basis at a discount rate of 20% which has been warranted by the sellers. If the warranted profits are not achieved over a period of five and a half years from the effective date, then Mercantile will either be refunded the shortfall in value by the sellers or Mercantile’s shareholding will be increased to a maximum of 66%.
30.7 Impact of acquisitions on the 2011 results of the Group
Custom Capital
R’000
MultiRisk
R’000
Interest income 11 654 735
Interest expense (6 148) (162)
Net interest income 5 506 573
Net charge for credit loses (1 396) –
Net interest after credit loses 4 110 573
Net non-interest income 1 200 42 763
Net interest and non-interest income 5 310 43 336
Operating expenditure (8 516) (29 216)
(Loss)/Profit before tax (3 206) 14 120
Tax – (3 576)
(Loss)/Profit after tax (3 206) 10 544
(Loss)/Profit after tax attributable to:
Equity holders of the parent (2 401) 4 226
Non-controlling interests (805) 6 318
(3 206) 10 544
Had these business acquisitions been effected at 1 January 2011, the estimated (loss)/profit after tax for the year would have been R21.1 million for Multi Risk and (R3.6) million for Custom Capital, respectively.
30.8 Net cash outflow on acquisition of subsidiaries
R’000
Consideration paid in cash 45 900
Less: Cash and cash equivalents acquired (14 547)
31 353
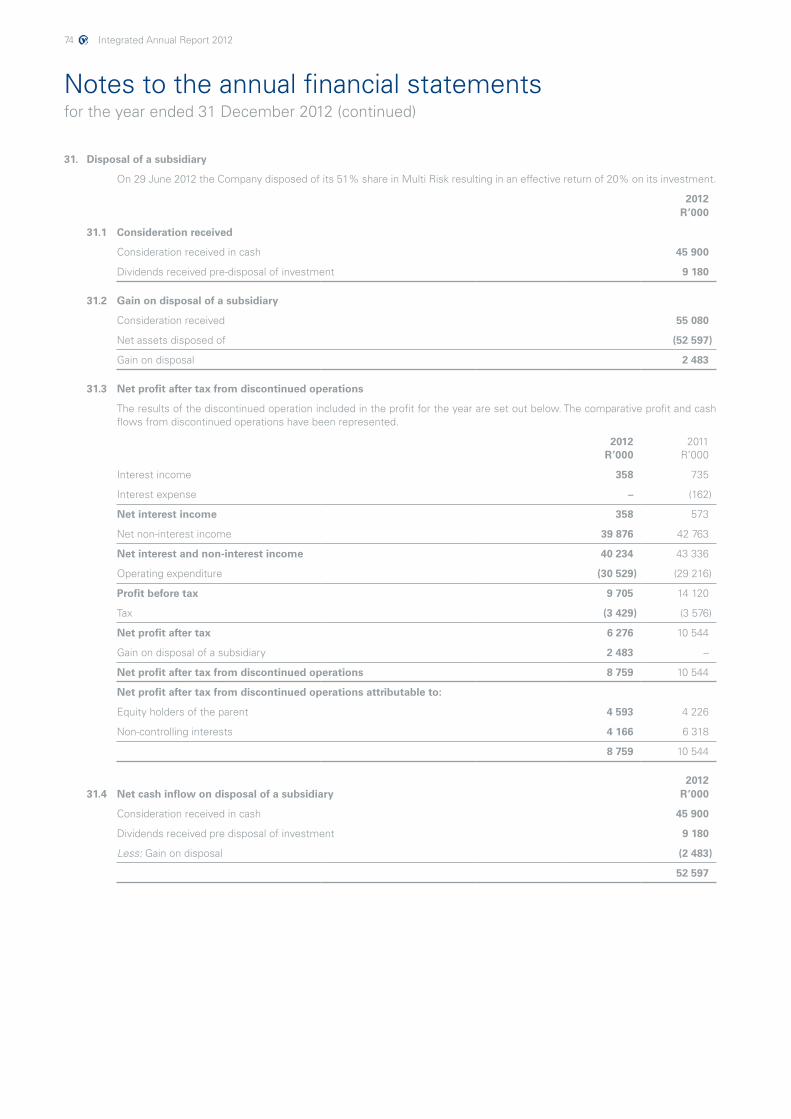
74 Integrated Annual Report 2012
31. Disposal of a subsidiary
On 29 June 2012 the Company disposed of its 51% share in Multi Risk resulting in an effective return of 20% on its investment.
2012R’000
31.1 Consideration received
Consideration received in cash 45 900
Dividends received pre-disposal of investment 9 180
31.2 Gain on disposal of a subsidiary
Consideration received 55 080
Net assets disposed of (52 597)
Gain on disposal 2 483
31.3 Net profit after tax from discontinued operations
The results of the discontinued operation included in the profit for the year are set out below. The comparative profit and cash flows from discontinued operations have been represented.
2012 R’000
2011 R’000
Interest income 358 735
Interest expense – (162)
Net interest income 358 573
Net non-interest income 39 876 42 763
Net interest and non-interest income 40 234 43 336
Operating expenditure (30 529) (29 216)
Profit before tax 9 705 14 120
Tax (3 429) (3 576)
Net profit after tax 6 276 10 544
Gain on disposal of a subsidiary 2 483 –
Net profit after tax from discontinued operations 8 759 10 544
Net profit after tax from discontinued operations attributable to:
Equity holders of the parent 4 593 4 226
Non-controlling interests 4 166 6 318
8 759 10 544
201231.4 Net cash inflow on disposal of a subsidiary R’000
Consideration received in cash 45 900
Dividends received pre disposal of investment 9 180
Less: Gain on disposal (2 483)
52 597
Notes to the annual financial statementsfor the year ended 31 December 2012 (continued)
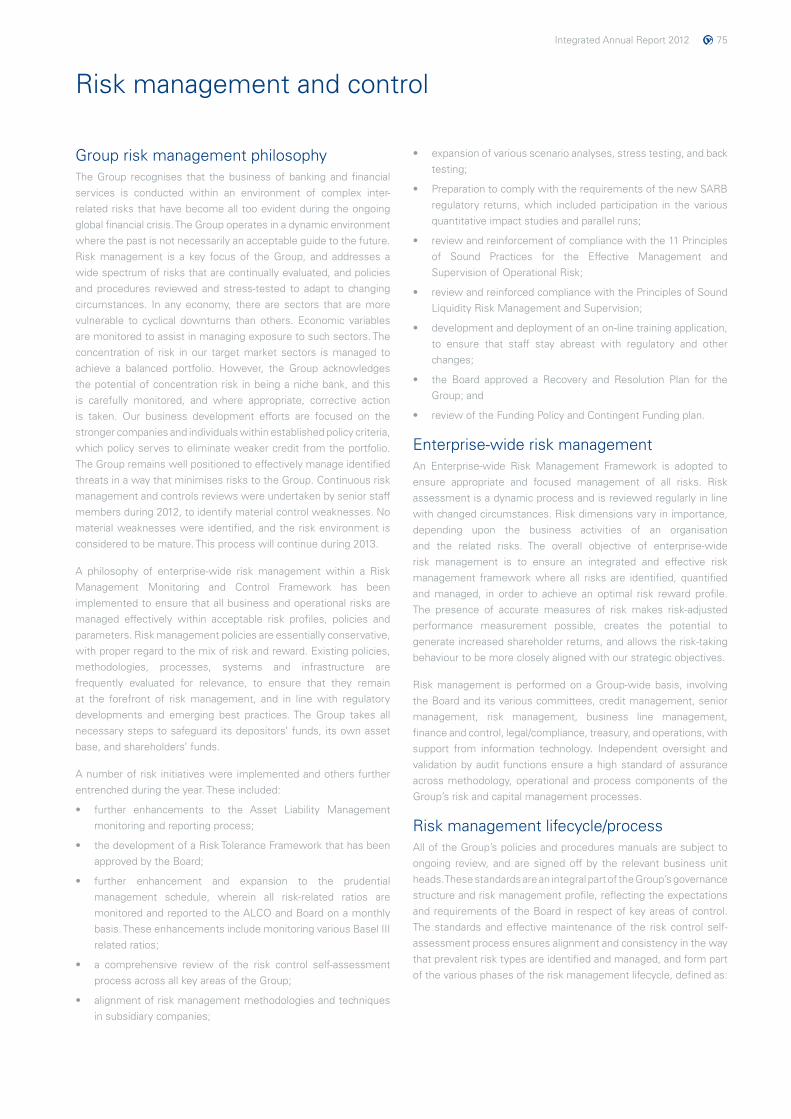
Integrated Annual Report 2012 75
Risk management and control
Group risk management philosophyThe Group recognises that the business of banking and financial services is conducted within an environment of complex inter-related risks that have become all too evident during the ongoing global financial crisis. The Group operates in a dynamic environment where the past is not necessarily an acceptable guide to the future. Risk management is a key focus of the Group, and addresses a wide spectrum of risks that are continually evaluated, and policies and procedures reviewed and stress-tested to adapt to changing circumstances. In any economy, there are sectors that are more vulnerable to cyclical downturns than others. Economic variables are monitored to assist in managing exposure to such sectors. The concentration of risk in our target market sectors is managed to achieve a balanced portfolio. However, the Group acknowledges the potential of concentration risk in being a niche bank, and this is carefully monitored, and where appropriate, corrective action is taken. Our business development efforts are focused on the stronger companies and individuals within established policy criteria, which policy serves to eliminate weaker credit from the portfolio. The Group remains well positioned to effectively manage identified threats in a way that minimises risks to the Group. Continuous risk management and controls reviews were undertaken by senior staff members during 2012, to identify material control weaknesses. No material weaknesses were identified, and the risk environment is considered to be mature. This process will continue during 2013.
A philosophy of enterprise-wide risk management within a Risk Management Monitoring and Control Framework has been implemented to ensure that all business and operational risks are managed effectively within acceptable risk profiles, policies and parameters. Risk management policies are essentially conservative, with proper regard to the mix of risk and reward. Existing policies, methodologies, processes, systems and infrastructure are frequently evaluated for relevance, to ensure that they remain at the forefront of risk management, and in line with regulatory developments and emerging best practices. The Group takes all necessary steps to safeguard its depositors’ funds, its own asset base, and shareholders’ funds.
A number of risk initiatives were implemented and others further entrenched during the year. These included:
• further enhancements to the Asset Liability Management monitoring and reporting process;
• thedevelopmentofaRiskToleranceFrameworkthathasbeenapproved by the Board;
• further enhancement and expansion to the prudentialmanagement schedule, wherein all risk-related ratios are monitored and reported to the ALCO and Board on a monthly basis. These enhancements include monitoring various Basel III related ratios;
• a comprehensive review of the risk control self-assessmentprocess across all key areas of the Group;
• alignment of risk management methodologies and techniques in subsidiary companies;
• expansionofvariousscenarioanalyses,stresstesting,andbacktesting;
• PreparationtocomplywiththerequirementsofthenewSARBregulatory returns, which included participation in the various quantitative impact studies and parallel runs;
• reviewandreinforcementofcompliancewiththe11Principlesof Sound Practices for the Effective Management and Supervision of Operational Risk;
• reviewandreinforcedcompliancewiththePrinciplesofSoundLiquidity Risk Management and Supervision;
• developmentanddeploymentofanon-linetrainingapplication,to ensure that staff stay abreast with regulatory and other changes;
• the Board approved a Recovery and Resolution Plan for theGroup; and
• reviewoftheFundingPolicyandContingentFundingplan.
Enterprise-wide risk managementAn Enterprise-wide Risk Management Framework is adopted to ensure appropriate and focused management of all risks. Risk assessment is a dynamic process and is reviewed regularly in line with changed circumstances. Risk dimensions vary in importance, depending upon the business activities of an organisation and the related risks. The overall objective of enterprise-wide risk management is to ensure an integrated and effective risk management framework where all risks are identified, quantified and managed, in order to achieve an optimal risk reward profile. The presence of accurate measures of risk makes risk-adjusted performance measurement possible, creates the potential to generate increased shareholder returns, and allows the risk-taking behaviour to be more closely aligned with our strategic objectives.
Risk management is performed on a Group-wide basis, involving the Board and its various committees, credit management, senior management, risk management, business line management, finance and control, legal/compliance, treasury, and operations, with support from information technology. Independent oversight and validation by audit functions ensure a high standard of assurance across methodology, operational and process components of the Group’s risk and capital management processes.
Risk management lifecycle/processAll of the Group’s policies and procedures manuals are subject to ongoing review, and are signed off by the relevant business unit heads. These standards are an integral part of the Group’s governance structure and risk management profile, reflecting the expectations and requirements of the Board in respect of key areas of control. The standards and effective maintenance of the risk control self-assessment process ensures alignment and consistency in the way that prevalent risk types are identified and managed, and form part of the various phases of the risk management lifecycle, defined as:
76 Integrated Annual Report 2012
Risk management and control(continued)
Risk management lifecycle/process (continued)Risk identification (and comprehension)
Risk identification focuses on recognising and understanding existing risks, or risks that may arise from positions taken, and future business activity as a continuing practice.
Risk measurement (and evaluation using
a range of analytical tools)
Once risks have been identified, they need to be measured. Certain risks will lend themselves more easily to determination and measurability than others, but it is necessary to ascertain the magnitude of each risk, whether quantifiable or not, and whether direct or indirect.
To consider risk appetite and the alignment against broader financial targets, the Group mainly considers the level of earnings, growth and volatility that it is willing to accept from certain risks that are core to its business. Economic and regulatory capital required for such transactions is also considered, together with the resultant return on the required capital. The Group also maintains a capital buffer for unforeseen events and business expansion.
Risk management (as an independent function)
The Group’s principal business focuses on the management of liabilities and assets in the statement of financial position. Major risks are managed and reviewed by an independent risk function. The ALCO, RMC and CREDCOM meet on a regular basis to collaborate on risk control, process review, and establish how much risk is acceptable, and to decide how the Group will stay within targets laid down in risk tolerance thresholds.
Risk monitoring (and compliance with documented policies)
Open, two-way communication between the Group and the SARB is fundamental to the entire risk monitoring and supervisory process. To achieve this, responsible line heads are required to document conclusions and communicate findings to the ALCO, RMC and CREDCOM, and to the SARB, through Banks Act returns and periodic meetings.
Risk control (stress and back-testing)
The Group follows a policy of ongoing stress-testing. Critical variables are sensitive to market changes, both domestic and international. These are identified and modelled to determine the possible impact of any deterioration of such identified variables on the Group’s results. Both internal and external events are considered in formulating appropriate modelling criteria. A policy of back-testing for identified key variables has been approved by the Board and deployed within the Group.
Management of riskPrincipal risk categories have been identified, defined and categorised into direct and indirect risks. This set of risk definitions forms the basis of management and control relative to each division within the Group, and also forms a consistent common language for outside examiners and/or regulators to follow.
Direct risks are found in most banking transactions. They are quantifiable and can be clearly defined. These risks are evaluated through examination of our databases, statistics and other records.
Indirect risks are considered to ensure that a complete risk assessment is carried out. They are present in almost every decision made by management and the Board, and thus impact on the Group’s image and success. These decisions are usually intended to enhance the Group’s long-term viability or success, and therefore are difficult to quantify at a given point in time.
Board committees monitor various aspects of the identified risks within the Enterprise-wide Risk Management Framework, which include:
Direct Risks Indirect Risks
Credit Risk Strategic Risk
Counterparty Risk Reputation Risk
Currency Risk Legal Risk
Liquidity Risk Fraud Risk
Interest Rate Risk International Risk
Market (Position) Risk Political Risk
Solvency Risk Competitive Risk
Operational Risk Pricing Risk
Technology Risk Compliance Risk
The responsibility for understanding the risks incurred by the Group, and ensuring that they are appropriately managed, lies with the Board. The Board approves risk management strategies and delegates the power to take decisions on risks, and to implement strategies on risk management and control to the RMC. Discretionary limits and authorities are, in turn, delegated to line heads and line managers within laid-down parameters, to enable them to execute the Group’s strategic objectives within predefined risk management policies and tolerance levels. Major risks are managed, controlled and reviewed by an independent risk function.
The Board fully recognises that it is accountable for the process of risk management and the system of internal control. Management reports regularly to the Board on the effectiveness of internal control systems, and on any significant control weaknesses identified.
A process is in place whereby the Top 10 risks faced by the Group are identified. These risks are assessed and evaluated in terms of a risk score attached to inherent risk and residual risk. Action plans are put in place to reduce the identified inherent risks to within acceptable residual risk parameters. The Top 10 risks are re-evaluated quarterly, and any changes are approved by the RMC. Business and Operating Divisions are integrally involved in the process in both risk identification and evaluation.
The Group subscribes to the 11 Principles of Sound Practices for the Effective Management and Supervision of Operational Risk, as defined by the Basel Committee on Banking Supervision.
Integrated Annual Report 2012 77
Risk management and control(continued)
Management of risk (continued)Continued focus remains on Business Continuity Management. Business Continuity Management ensures the availability of key staff and processes required to support essential activities in the event of an interruption to or disruption of business. Business Continuity Management is an important aspect of risk management, and its value has been proven in creating a more resilient operational platform through activities such as business impact assessments, business continuity planning and implementation, testing of business continuity, and implementing corrective actions. Comprehensive simulations are conducted on an ongoing basis, with identified gaps addressed and/or plans put in place to resolve the identified issues.
The Capital Management Committee, under the auspices of the RMC, proactively evaluates and manages the capital requirements of the Group as determined by Basel requirements. A comprehensive re-evaluation of the capital requirements under the Internal Capital Adequacy Assessment Process is regularly undertaken with consideration being given to all risks impacting on the need for capital reserves within the Group. The outcome of these assessments resulted in the Group identifying different levels of risk related to specific characteristics of the business where it was deemed prudent to hold a capital buffer in addition to the regulatory capital requirements. Such buffer requirements are re-evaluated half-yearly and adjusted where appropriate.
The Group employs a comprehensive, consistent and integrated approach to stress testing that is ingrained as a business planning and management tool, emphasising scenario-based analyses. Stress testing measures potential volatility of earnings under various scenarios.
Under the Enterprise-wide Risk Management Framework, the direct risks of the Group have been categorised and those deemed to be of the most significance are reported on below:
Credit riskCredit parameters and tolerance levels are clearly defined and reflected in governing procedures and policies. The Group offers a spread of banking products common to the banking industry, with a specific focus on small- and medium-sized businesses, across a wide variety of industries. Whilst personal market products are also offered, no specific targeting of the broader personal retail-based market is undertaken. The primary risks encountered are associated with the lending of money and the issuing of contingent financial or performance guarantees to third parties on behalf of customers.
Dependent upon the risk profile of the customer, the risk inherent in the product offering and the track record/payment history of the client, varying types and levels of security are taken to mitigate credit-related risks. Clean or unsecured lending will only be considered for financially strong borrowers.
Counterparties to derivatives expose the Group to credit-related losses in the event of non-performance. The counterparties to these contracts are financial institutions. The Group continually monitors its positions and the credit ratings of its counterparties, and limits the value of contracts it enters into with any one party to within pre-approved transactional limits.
At year-end, the Group did not have any significant concentration of risk which had not been adequately provided for. There were no material exposures in advances made to foreign entities at year-end.
A portfolio analysis report is prepared and presented to the RMC analysing the performance and make-up of the book, including customer and segment concentration.
The Group has adopted a conservative approach to credit granting, within a specifically defined and structured approval process. The granting of credit is managed via a mandated approval process, whereby levels of credit approval are determined by the experience of the mandated individual, with dual or multiple sign-off on all material values. An ongoing weekly review is also undertaken by the CREDCOM of all new and renewal proposals for lending in excess of R2 million (in aggregate). In addition, an early warning system is applied to actively manage all accounts within the risk structure. The system identifies a number of characteristics relating to the performance of the accounts, and based on various predefined algorithms, flags issues of concern. Monitoring is done by the Portfolio Management Department, and any concerns are raised with the Credit Department and Business or Commercial banking units.
There have been no material changes in the credit approval structure or overall make-up of the book from the prior reporting period.
A philosophy of enterprise-wide risk management within a Risk Management Monitoring and Control Framework has been implemented, to ensure that all business and operational risks are managed effectively within acceptable risk profiles, policies and parameters. Risk management policies are conservative, with proper regard to the mix of risk and reward. The Group takes all necessary steps to safeguard its depositors’ funds, its own asset base, and shareholders’ funds.
78 Integrated Annual Report 2012
Risk management and control(continued)
Credit risk (continued)The table below summarises the Group’s maximum exposure to credit risk at reporting date:
Loans and advances
R’000
Committed undrawn facilities
R’000Other R’000
Total R’000
2012
Current accounts 1 109 362 – – 1 109 362
Credit cards 22 227 13 702 – 35 929
Mortgage loans 2 435 482 52 612 – 2 488 094
Instalment sales and leases 639 819 – – 639 819
Structured loans 44 579 – – 44 579
Medium-term loans 1 115 512 – – 1 115 512
Negotiable securities – – 257 514 257 514
Cash and cash equivalents – – 1 223 016 1 223 016
Guarantees – – 300 496 300 496
Letters of credit – – 15 634 15 634
5 366 981 66 314 1 796 660 7 229 955
2011
Current accounts 931 610 – – 931 610
Credit cards 19 777 14 049 – 33 826
Mortgage loans 2 053 662 68 001 – 2 121 663
Instalment sales and leases 490 805 – – 490 805
Structured loans 103 081 – – 103 081
Medium-term loans 967 478 – – 967 478
Negotiable securities – – 192 588 192 588
Cash and cash equivalents – – 952 621 952 621
Guarantees – – 294 263 294 263
Letters of credit – – 24 883 24 883
4 566 413 82 050 1 464 355 6 112 818
Operational riskOperational risks faced by the Group are extensive, and include robbery, fraud, theft of data, systems access and controls, legal challenges, statutory and legislative compliance, operational processes, employment policies, documentation risk, and business continuity. Operational risk can also cause reputational damage, and therefore, efforts to identify, manage and mitigate operational risk are equally sensitive to reputational risk, as well as the risk of financial loss.
Operational risk management’s aim is to enhance the level of risk maturity across the Group, by implementing and embedding process-based risk and control identification and assessments, and integrating the operational risk management process in all business units, to ensure adequate risk management in an ever-changing business and financial industry.
Strategies, procedures and action plans to monitor, manage and limit the risks associated with operational processes, systems and external events, include:
• documented operational policies, processes and procedures with segregation of duties;
• ongoing training and up-skilling of staff on operational procedures and legislative compliance;
• an internal operational loss data base, wherein all losses associated with operational issues, including theft and robbery, are recorded and evaluated to facilitate corrective action;
• ongoing improvements to the Disaster Recovery and Business Continuity plans, including conducting a variety of simulation exercises in critical operations environments;
• conducting a variety of internal audits and reviews by both the Compliance and Internal Audit Departments, in line with annual plans approved by the Board;
• comprehensive data security and protection;
• ongoing review of the Group-wide risk control self-assessment process, rolled out to job functional level in high-risk operational processing areas;
Integrated Annual Report 2012 79
Risk management and control(continued)
Operational risk (continued)• ongoing review of key risk indicators, as a tool to further assist
with risk identification and assessment;
• limiting access to systems and enforcing strong password controls; and
• a comprehensive insurance programme to safeguard the Group’s financial and non-financial assets.
The Group subscribes to the 11 Principles of Sound Practices for the Effective Management and Supervision of Operational Risk. Compliance with the principles was reviewed, and action plans put in place to ensure compliance with the principles.
Technology riskThe technology risk management forms a key component of the Enterprise-wide Risk Management Framework, and all components are effectively managed under the auspices of the IT Steering Committee, a Board-appointed committee. The compliance and governance aspects are independently managed within the risk environment, and are reported on independently to the Technology Committee.
The Group is currently in the final stages of implementing a new treasury system (BaNCS Treasury), which will interface with the core banking system (BaNCS). Significant progress has been made, and final implementation is scheduled for March 2013.
The Group is in the final stages of selecting new IT services partners, in order to replace its current core IT services partner. The current service partner’s contract is expiring in April 2013. Negotiations with new vendors are well underway and all services will be successfully transitioned before the end of the second quarter of 2013. The Group does not have any unmitigated concerns regarding this transition.
A number of IT-related initiatives were implemented, and others further entrenched during the year. These included:
• development of IT governance and information security frameworks;
• comprehensive review of the core banking system’s infrastructure;
• ODS rectification project;
• consolidation of the Oracle Database;
• redesign of the network boundary defence; and
• ongoing upgrade of the Group’s disaster-recovery capabilities.
Market riskMarket risk is the risk of revaluation of any financial instrument as a consequence of changes in market prices or rates, and can be quantified as the potential change in the value of the banking book, as a result of changes in the financial environment between now and a future point in time. The Board determines market risk limits. These limits are reviewed at least annually, depending on market events.
The Group does not currently take proprietary trading positions, and therefore has minimal exposure to market risk. Should the Group consider entering into a proprietary trading position, the Trading Committee and RMC will have to evaluate and approve entering into such positions. The Trading Committee will ensure that the Group is prudently positioned, taking into account agreed limits, policies, prevailing markets, available liquidity, and the relationship between risk and reward, primarily to the financial risks of changes in foreign currency exchange rates and interest rates.
The Group enters into derivative financial instruments to manage its exposure to interest rate and foreign currency risk, including:
• forward exchange contracts;
• interest rate and foreign currency swaps; and
• fully hedged currency options.
Detailed market risk reports are produced on a daily basis, which allows for monitoring against prescribed prudential and regulatory limits. In the unlikely event of an unauthorised limit violation, the ALM forum records such violation, and is immediately corrected and reported to the ALCO, which is a management committee accountable to the RMC.
The Group does not perform a detailed sensitivity analysis on the potential impact of a change in exchange rates on a daily basis, due to the fact that the Group does not currently have any proprietary trading positions. The impact of changes in open foreign currency client positions is modelled, to take cognisance of credit risks associated with volatility in foreign currency exchange rates, with the purpose of covering adverse positions through calling for initial and variation margins. A detailed sensitivity analysis is performed for liquidity and interest rate risk (described on pages 80 to 84).
There has been no significant change to the Group’s exposure to market risks, or the manner in which it manages and measures the risk. Various conservative prudential risk limits are in place, and were expanded further during the current financial year. Exposures under prudential risk limits and various sensitivities relating thereto, are reported to the ALCO, RMC and Board on a regular basis.
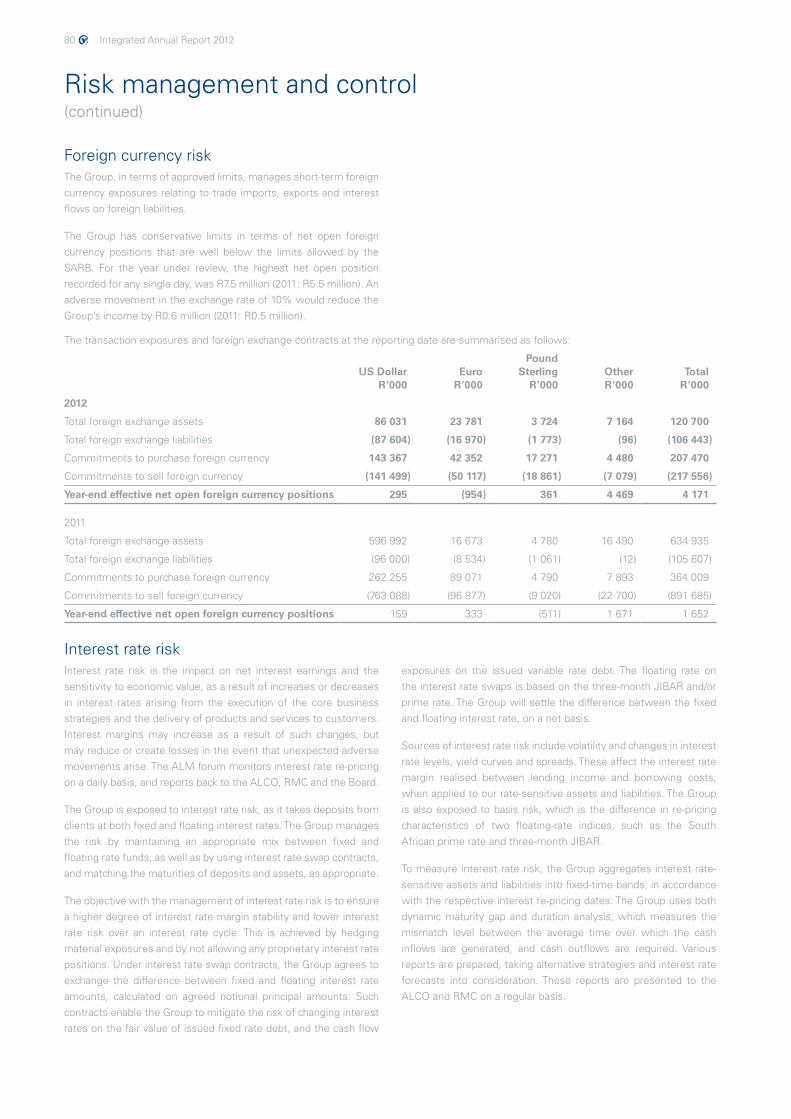
80 Integrated Annual Report 2012
Risk management and control(continued)
Foreign currency riskThe Group, in terms of approved limits, manages short-term foreign currency exposures relating to trade imports, exports and interest flows on foreign liabilities.
The Group has conservative limits in terms of net open foreign currency positions that are well below the limits allowed by the SARB. For the year under review, the highest net open position recorded for any single day, was R7.5 million (2011: R5.5 million). An adverse movement in the exchange rate of 10% would reduce the Group’s income by R0.6 million (2011: R0.5 million).
The transaction exposures and foreign exchange contracts at the reporting date are summarised as follows:
US Dollar R’000
Euro R’000
PoundSterling
R’000Other R’000
Total R’000
2012
Total foreign exchange assets 86 031 23 781 3 724 7 164 120 700
Total foreign exchange liabilities (87 604) (16 970) (1 773) (96) (106 443)
Commitments to purchase foreign currency 143 367 42 352 17 271 4 480 207 470
Commitments to sell foreign currency (141 499) (50 117) (18 861) (7 079) (217 556)
Year-end effective net open foreign currency positions 295 (954) 361 4 469 4 171
2011
Total foreign exchange assets 596 992 16 673 4 780 16 490 634 935
Total foreign exchange liabilities (96 000) (8 534) (1 061) (12) (105 607)
Commitments to purchase foreign currency 262 255 89 071 4 790 7 893 364 009
Commitments to sell foreign currency (763 088) (96 877) (9 020) (22 700) (891 685)
Year-end effective net open foreign currency positions 159 333 (511) 1 671 1 652
Interest rate riskInterest rate risk is the impact on net interest earnings and the sensitivity to economic value, as a result of increases or decreases in interest rates arising from the execution of the core business strategies and the delivery of products and services to customers. Interest margins may increase as a result of such changes, but may reduce or create losses in the event that unexpected adverse movements arise. The ALM forum monitors interest rate re-pricing on a daily basis, and reports back to the ALCO, RMC and the Board.
The Group is exposed to interest rate risk, as it takes deposits from clients at both fixed and floating interest rates. The Group manages the risk by maintaining an appropriate mix between fixed and floating rate funds, as well as by using interest rate swap contracts, and matching the maturities of deposits and assets, as appropriate.
The objective with the management of interest rate risk is to ensure a higher degree of interest rate margin stability and lower interest rate risk over an interest rate cycle. This is achieved by hedging material exposures and by not allowing any proprietary interest rate positions. Under interest rate swap contracts, the Group agrees to exchange the difference between fixed and floating interest rate amounts, calculated on agreed notional principal amounts. Such contracts enable the Group to mitigate the risk of changing interest rates on the fair value of issued fixed rate debt, and the cash flow
exposures on the issued variable rate debt. The floating rate on the interest rate swaps is based on the three-month JIBAR and/or prime rate. The Group will settle the difference between the fixed and floating interest rate, on a net basis.
Sources of interest rate risk include volatility and changes in interest rate levels, yield curves and spreads. These affect the interest rate margin realised between lending income and borrowing costs, when applied to our rate-sensitive assets and liabilities. The Group is also exposed to basis risk, which is the difference in re-pricing characteristics of two floating-rate indices, such as the South African prime rate and three-month JIBAR.
To measure interest rate risk, the Group aggregates interest rate-sensitive assets and liabilities into fixed-time bands, in accordance with the respective interest re-pricing dates. The Group uses both dynamic maturity gap and duration analysis, which measures the mismatch level between the average time over which the cash inflows are generated, and cash outflows are required. Various reports are prepared, taking alternative strategies and interest rate forecasts into consideration. These reports are presented to the ALCO and RMC on a regular basis.
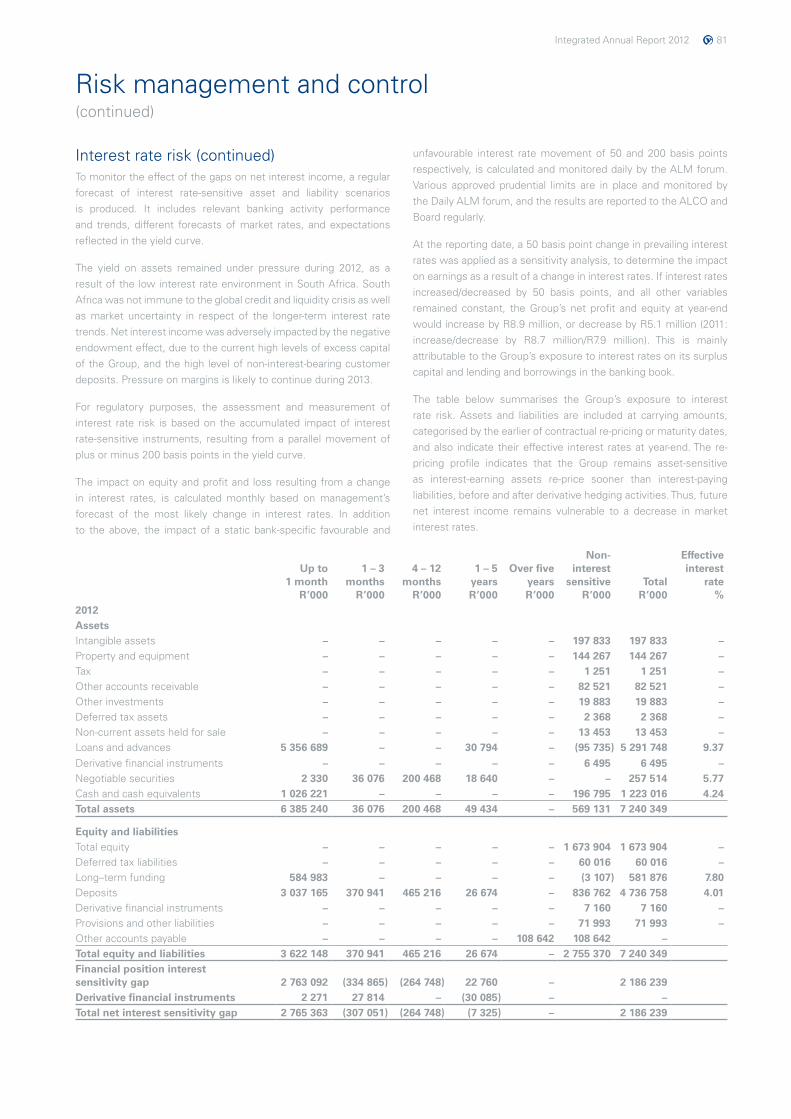
Integrated Annual Report 2012 81
Risk management and control(continued)
Interest rate risk (continued)To monitor the effect of the gaps on net interest income, a regular forecast of interest rate-sensitive asset and liability scenarios is produced. It includes relevant banking activity performance and trends, different forecasts of market rates, and expectations reflected in the yield curve.
The yield on assets remained under pressure during 2012, as a result of the low interest rate environment in South Africa. South Africa was not immune to the global credit and liquidity crisis as well as market uncertainty in respect of the longer-term interest rate trends. Net interest income was adversely impacted by the negative endowment effect, due to the current high levels of excess capital of the Group, and the high level of non-interest-bearing customer deposits. Pressure on margins is likely to continue during 2013.
For regulatory purposes, the assessment and measurement of interest rate risk is based on the accumulated impact of interest rate-sensitive instruments, resulting from a parallel movement of plus or minus 200 basis points in the yield curve.
The impact on equity and profit and loss resulting from a change in interest rates, is calculated monthly based on management’s forecast of the most likely change in interest rates. In addition to the above, the impact of a static bank-specific favourable and
unfavourable interest rate movement of 50 and 200 basis points respectively, is calculated and monitored daily by the ALM forum. Various approved prudential limits are in place and monitored by the Daily ALM forum, and the results are reported to the ALCO and Board regularly.
At the reporting date, a 50 basis point change in prevailing interest rates was applied as a sensitivity analysis, to determine the impact on earnings as a result of a change in interest rates. If interest rates increased/decreased by 50 basis points, and all other variables remained constant, the Group’s net profit and equity at year-end would increase by R8.9 million, or decrease by R5.1 million (2011: increase/decrease by R8.7 million/R7.9 million). This is mainly attributable to the Group’s exposure to interest rates on its surplus capital and lending and borrowings in the banking book.
The table below summarises the Group’s exposure to interest rate risk. Assets and liabilities are included at carrying amounts, categorised by the earlier of contractual re-pricing or maturity dates, and also indicate their effective interest rates at year-end. The re-pricing profile indicates that the Group remains asset-sensitive as interest-earning assets re-price sooner than interest-paying liabilities, before and after derivative hedging activities. Thus, future net interest income remains vulnerable to a decrease in market interest rates.
Up to 1 month
R’000
1 – 3 months
R’000
4 – 12 months
R’000
1 – 5 years R’000
Over five years R’000
Non-interest
sensitive R’000
Total R’000
Effective interest
rate%
2012AssetsIntangible assets – – – – – 197 833 197 833 –Property and equipment – – – – – 144 267 144 267 –Tax – – – – – 1 251 1 251 –Other accounts receivable – – – – – 82 521 82 521 –Other investments – – – – – 19 883 19 883 –Deferred tax assets – – – – – 2 368 2 368 –Non-current assets held for sale – – – – – 13 453 13 453 –Loans and advances 5 356 689 – – 30 794 – (95 735) 5 291 748 9.37Derivative financial instruments – – – – – 6 495 6 495 –Negotiable securities 2 330 36 076 200 468 18 640 – – 257 514 5.77Cash and cash equivalents 1 026 221 – – – – 196 795 1 223 016 4.24Total assets 6 385 240 36 076 200 468 49 434 – 569 131 7 240 349
Equity and liabilitiesTotal equity – – – – – 1 673 904 1 673 904 –Deferred tax liabilities – – – – – 60 016 60 016 –Long–term funding 584 983 – – – – (3 107) 581 876 7.80Deposits 3 037 165 370 941 465 216 26 674 – 836 762 4 736 758 4.01Derivative financial instruments – – – – – 7 160 7 160 –Provisions and other liabilities – – – – – 71 993 71 993 –Other accounts payable – – – – 108 642 108 642 –Total equity and liabilities 3 622 148 370 941 465 216 26 674 – 2 755 370 7 240 349Financial position interest sensitivity gap 2 763 092 (334 865) (264 748) 22 760 – 2 186 239Derivative financial instruments 2 271 27 814 – (30 085) – –Total net interest sensitivity gap 2 765 363 (307 051) (264 748) (7 325) – 2 186 239
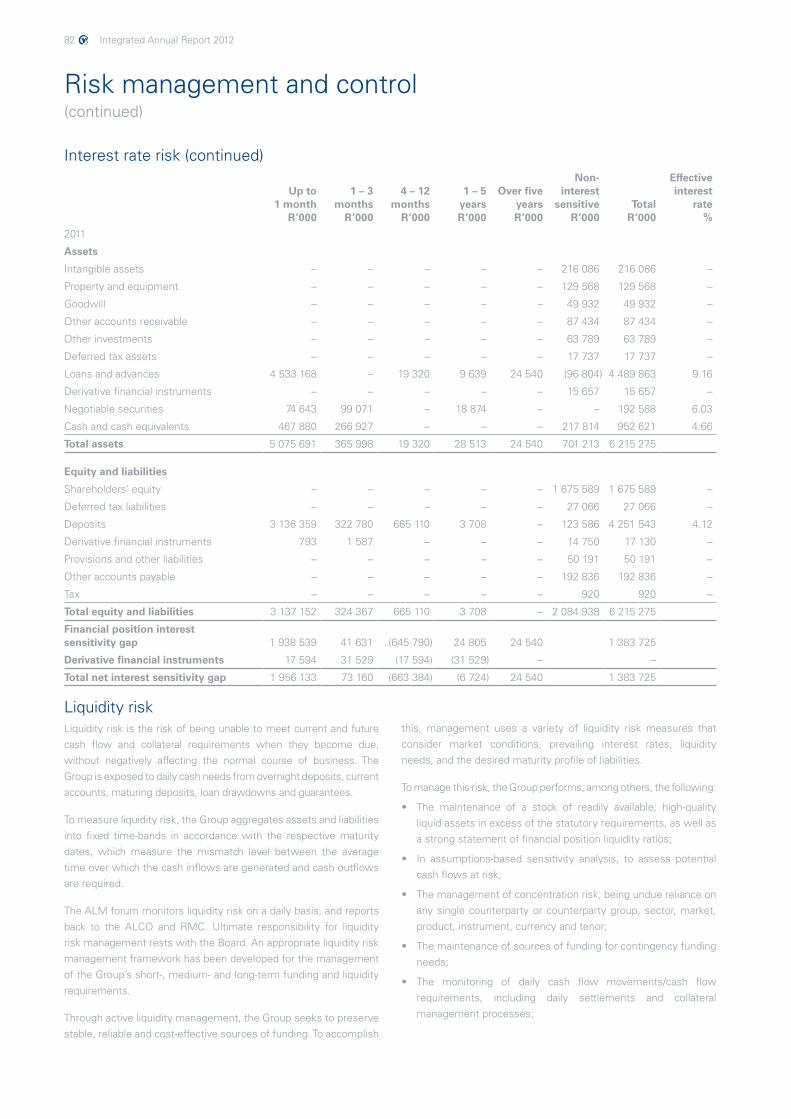
82 Integrated Annual Report 2012
Risk management and control(continued)
Interest rate risk (continued)
Up to 1 month
R’000
1 – 3 months
R’000
4 – 12 months
R’000
1 – 5 years R’000
Over five years R’000
Non-interest
sensitive R’000
Total R’000
Effective interest
rate%
2011
Assets
Intangible assets – – – – – 216 086 216 086 –
Property and equipment – – – – – 129 568 129 568 –
Goodwill – – – – – 49 932 49 932 –
Other accounts receivable – – – – – 87 434 87 434 –
Other investments – – – – – 63 789 63 789 –
Deferred tax assets – – – – – 17 737 17 737 –
Loans and advances 4 533 168 – 19 320 9 639 24 540 (96 804) 4 489 863 9.16
Derivative financial instruments – – – – – 15 657 15 657 –
Negotiable securities 74 643 99 071 – 18 874 – – 192 588 6.03
Cash and cash equivalents 467 880 266 927 – – – 217 814 952 621 4.66
Total assets 5 075 691 365 998 19 320 28 513 24 540 701 213 6 215 275
Equity and liabilities
Shareholders’ equity – – – – – 1 675 589 1 675 589 –
Deferred tax liabilities – – – – – 27 066 27 066 –
Deposits 3 136 359 322 780 665 110 3 708 – 123 586 4 251 543 4.12
Derivative financial instruments 793 1 587 – – – 14 750 17 130 –
Provisions and other liabilities – – – – – 50 191 50 191 –
Other accounts payable – – – – – 192 836 192 836 –
Tax – – – – – 920 920 –
Total equity and liabilities 3 137 152 324 367 665 110 3 708 – 2 084 938 6 215 275
Financial position interest sensitivity gap 1 938 539 41 631 (645 790) 24 805 24 540 1 383 725
Derivative financial instruments 17 594 31 529 (17 594) (31 529) – –
Total net interest sensitivity gap 1 956 133 73 160 (663 384) (6 724) 24 540 1 383 725
Liquidity riskLiquidity risk is the risk of being unable to meet current and future cash flow and collateral requirements when they become due, without negatively affecting the normal course of business. The Group is exposed to daily cash needs from overnight deposits, current accounts, maturing deposits, loan drawdowns and guarantees.
To measure liquidity risk, the Group aggregates assets and liabilities into fixed time-bands in accordance with the respective maturity dates, which measure the mismatch level between the average time over which the cash inflows are generated and cash outflows are required.
The ALM forum monitors liquidity risk on a daily basis, and reports back to the ALCO and RMC. Ultimate responsibility for liquidity risk management rests with the Board. An appropriate liquidity risk management framework has been developed for the management of the Group’s short-, medium- and long-term funding and liquidity requirements.
Through active liquidity management, the Group seeks to preserve stable, reliable and cost-effective sources of funding. To accomplish
this, management uses a variety of liquidity risk measures that consider market conditions, prevailing interest rates, liquidity needs, and the desired maturity profile of liabilities.
To manage this risk, the Group performs, among others, the following:
• The maintenance of a stock of readily available, high-quality liquid assets in excess of the statutory requirements, as well as a strong statement of financial position liquidity ratios;
• In assumptions-based sensitivity analysis, to assess potential cash flows at risk;
• The management of concentration risk, being undue reliance on any single counterparty or counterparty group, sector, market, product, instrument, currency and tenor;
• The maintenance of sources of funding for contingency funding needs;
• The monitoring of daily cash flow movements/cash flow requirements, including daily settlements and collateral management processes;
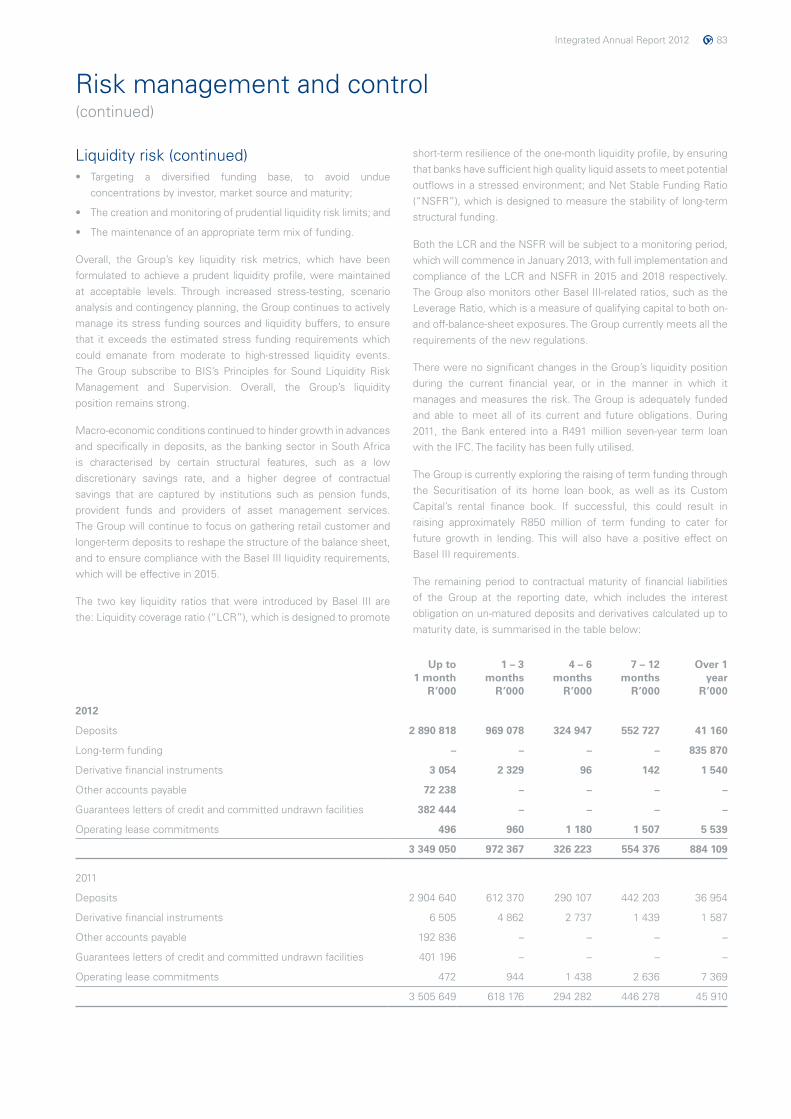
Integrated Annual Report 2012 83
Risk management and control(continued)
Liquidity risk (continued)• Targeting a diversified funding base, to avoid undue
concentrations by investor, market source and maturity;
• The creation and monitoring of prudential liquidity risk limits; and
• The maintenance of an appropriate term mix of funding.
Overall, the Group’s key liquidity risk metrics, which have been formulated to achieve a prudent liquidity profile, were maintained at acceptable levels. Through increased stress-testing, scenario analysis and contingency planning, the Group continues to actively manage its stress funding sources and liquidity buffers, to ensure that it exceeds the estimated stress funding requirements which could emanate from moderate to high-stressed liquidity events. The Group subscribe to BIS’s Principles for Sound Liquidity Risk Management and Supervision. Overall, the Group’s liquidity position remains strong.
Macro-economic conditions continued to hinder growth in advances and specifically in deposits, as the banking sector in South Africa is characterised by certain structural features, such as a low discretionary savings rate, and a higher degree of contractual savings that are captured by institutions such as pension funds, provident funds and providers of asset management services. The Group will continue to focus on gathering retail customer and longer-term deposits to reshape the structure of the balance sheet, and to ensure compliance with the Basel III liquidity requirements, which will be effective in 2015.
The two key liquidity ratios that were introduced by Basel III are the: Liquidity coverage ratio (“LCR”), which is designed to promote
short-term resilience of the one-month liquidity profile, by ensuring that banks have sufficient high quality liquid assets to meet potential outflows in a stressed environment; and Net Stable Funding Ratio (“NSFR”), which is designed to measure the stability of long-term structural funding.
Both the LCR and the NSFR will be subject to a monitoring period, which will commence in January 2013, with full implementation and compliance of the LCR and NSFR in 2015 and 2018 respectively. The Group also monitors other Basel III-related ratios, such as the Leverage Ratio, which is a measure of qualifying capital to both on- and off-balance-sheet exposures. The Group currently meets all the requirements of the new regulations.
There were no significant changes in the Group’s liquidity position during the current financial year, or in the manner in which it manages and measures the risk. The Group is adequately funded and able to meet all of its current and future obligations. During 2011, the Bank entered into a R491 million seven-year term loan with the IFC. The facility has been fully utilised.
The Group is currently exploring the raising of term funding through the Securitisation of its home loan book, as well as its Custom Capital’s rental finance book. If successful, this could result in raising approximately R850 million of term funding to cater for future growth in lending. This will also have a positive effect on Basel III requirements.
The remaining period to contractual maturity of financial liabilities of the Group at the reporting date, which includes the interest obligation on un-matured deposits and derivatives calculated up to maturity date, is summarised in the table below:
Up to 1 month
R’000
1 – 3 months
R’000
4 – 6 months
R’000
7 – 12 months
R’000
Over 1 year
R’000
2012
Deposits 2 890 818 969 078 324 947 552 727 41 160
Long-term funding – – – – 835 870
Derivative financial instruments 3 054 2 329 96 142 1 540
Other accounts payable 72 238 – – – –
Guarantees letters of credit and committed undrawn facilities 382 444 – – – –
Operating lease commitments 496 960 1 180 1 507 5 539
3 349 050 972 367 326 223 554 376 884 109
2011
Deposits 2 904 640 612 370 290 107 442 203 36 954
Derivative financial instruments 6 505 4 862 2 737 1 439 1 587
Other accounts payable 192 836 – – – –
Guarantees letters of credit and committed undrawn facilities 401 196 – – – –
Operating lease commitments 472 944 1 438 2 636 7 369
3 505 649 618 176 294 282 446 278 45 910
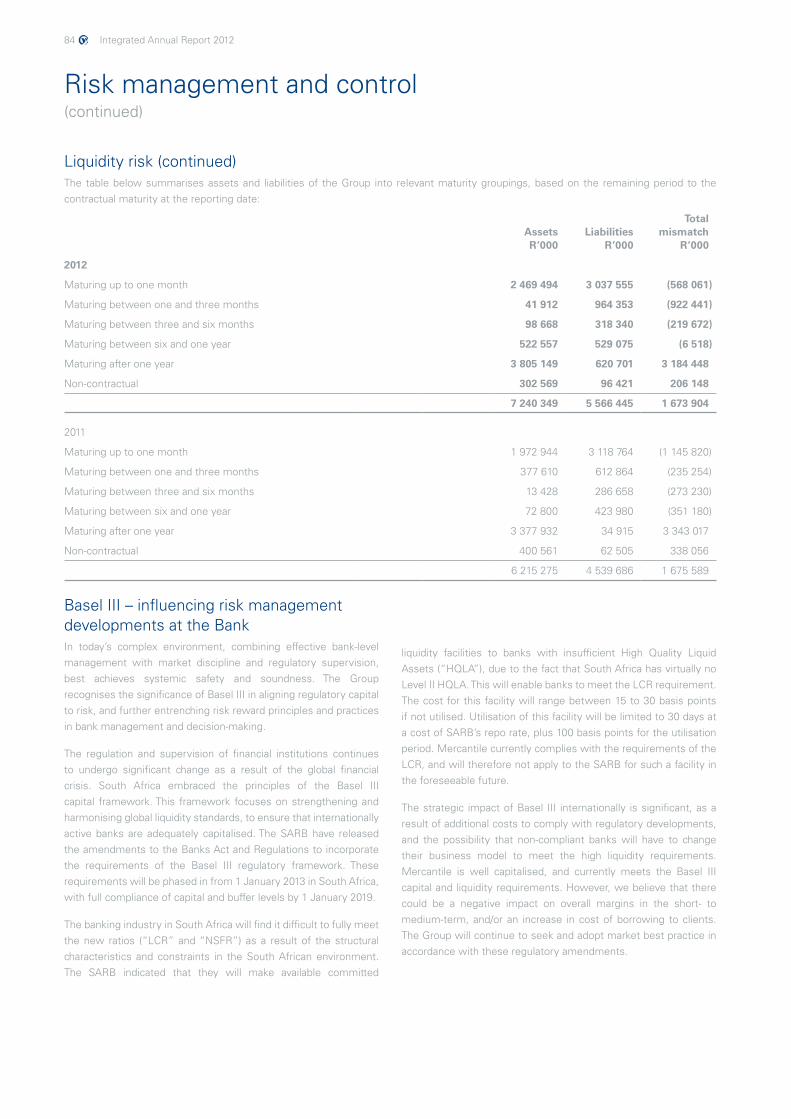
84 Integrated Annual Report 2012
Risk management and control(continued)
Liquidity risk (continued)The table below summarises assets and liabilities of the Group into relevant maturity groupings, based on the remaining period to the contractual maturity at the reporting date:
Assets R’000
Liabilities R’000
Totalmismatch
R’000
2012
Maturing up to one month 2 469 494 3 037 555 (568 061)
Maturing between one and three months 41 912 964 353 (922 441)
Maturing between three and six months 98 668 318 340 (219 672)
Maturing between six and one year 522 557 529 075 (6 518)
Maturing after one year 3 805 149 620 701 3 184 448
Non-contractual 302 569 96 421 206 148
7 240 349 5 566 445 1 673 904
2011
Maturing up to one month 1 972 944 3 118 764 (1 145 820)
Maturing between one and three months 377 610 612 864 (235 254)
Maturing between three and six months 13 428 286 658 (273 230)
Maturing between six and one year 72 800 423 980 (351 180)
Maturing after one year 3 377 932 34 915 3 343 017
Non-contractual 400 561 62 505 338 056
6 215 275 4 539 686 1 675 589
Basel III – influencing risk management developments at the BankIn today’s complex environment, combining effective bank-level management with market discipline and regulatory supervision, best achieves systemic safety and soundness. The Group recognises the significance of Basel III in aligning regulatory capital to risk, and further entrenching risk reward principles and practices in bank management and decision-making.
The regulation and supervision of financial institutions continues to undergo significant change as a result of the global financial crisis. South Africa embraced the principles of the Basel III capital framework. This framework focuses on strengthening and harmonising global liquidity standards, to ensure that internationally active banks are adequately capitalised. The SARB have released the amendments to the Banks Act and Regulations to incorporate the requirements of the Basel III regulatory framework. These requirements will be phased in from 1 January 2013 in South Africa, with full compliance of capital and buffer levels by 1 January 2019.
The banking industry in South Africa will find it difficult to fully meet the new ratios (“LCR” and “NSFR”) as a result of the structural characteristics and constraints in the South African environment. The SARB indicated that they will make available committed
liquidity facilities to banks with insufficient High Quality Liquid Assets (“HQLA”), due to the fact that South Africa has virtually no Level II HQLA. This will enable banks to meet the LCR requirement. The cost for this facility will range between 15 to 30 basis points if not utilised. Utilisation of this facility will be limited to 30 days at a cost of SARB’s repo rate, plus 100 basis points for the utilisation period. Mercantile currently complies with the requirements of the LCR, and will therefore not apply to the SARB for such a facility in the foreseeable future.
The strategic impact of Basel III internationally is significant, as a result of additional costs to comply with regulatory developments, and the possibility that non-compliant banks will have to change their business model to meet the high liquidity requirements. Mercantile is well capitalised, and currently meets the Basel III capital and liquidity requirements. However, we believe that there could be a negative impact on overall margins in the short- to medium-term, and/or an increase in cost of borrowing to clients. The Group will continue to seek and adopt market best practice in accordance with these regulatory amendments.
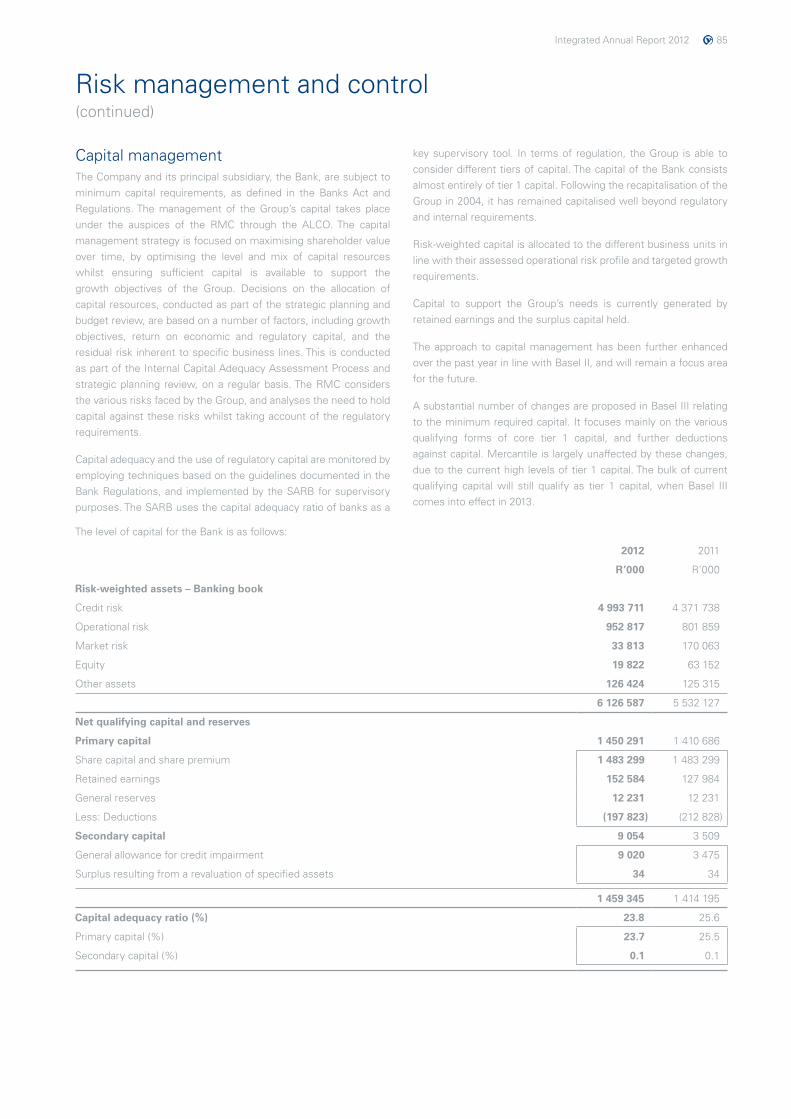
Integrated Annual Report 2012 85
Risk management and control(continued)
Capital managementThe Company and its principal subsidiary, the Bank, are subject to minimum capital requirements, as defined in the Banks Act and Regulations. The management of the Group’s capital takes place under the auspices of the RMC through the ALCO. The capital management strategy is focused on maximising shareholder value over time, by optimising the level and mix of capital resources whilst ensuring sufficient capital is available to support the growth objectives of the Group. Decisions on the allocation of capital resources, conducted as part of the strategic planning and budget review, are based on a number of factors, including growth objectives, return on economic and regulatory capital, and the residual risk inherent to specific business lines. This is conducted as part of the Internal Capital Adequacy Assessment Process and strategic planning review, on a regular basis. The RMC considers the various risks faced by the Group, and analyses the need to hold capital against these risks whilst taking account of the regulatory requirements.
Capital adequacy and the use of regulatory capital are monitored by employing techniques based on the guidelines documented in the Bank Regulations, and implemented by the SARB for supervisory purposes. The SARB uses the capital adequacy ratio of banks as a
key supervisory tool. In terms of regulation, the Group is able to consider different tiers of capital. The capital of the Bank consists almost entirely of tier 1 capital. Following the recapitalisation of the Group in 2004, it has remained capitalised well beyond regulatory and internal requirements.
Risk-weighted capital is allocated to the different business units in line with their assessed operational risk profile and targeted growth requirements.
Capital to support the Group’s needs is currently generated by retained earnings and the surplus capital held.
The approach to capital management has been further enhanced over the past year in line with Basel II, and will remain a focus area for the future.
A substantial number of changes are proposed in Basel III relating to the minimum required capital. It focuses mainly on the various qualifying forms of core tier 1 capital, and further deductions against capital. Mercantile is largely unaffected by these changes, due to the current high levels of tier 1 capital. The bulk of current qualifying capital will still qualify as tier 1 capital, when Basel III comes into effect in 2013.
The level of capital for the Bank is as follows:
2012 2011
R’000 R’000
Risk-weighted assets – Banking book
Credit risk 4 993 711 4 371 738
Operational risk 952 817 801 859
Market risk 33 813 170 063
Equity 19 822 63 152
Other assets 126 424 125 315
6 126 587 5 532 127
Net qualifying capital and reserves
Primary capital 1 450 291 1 410 686
Share capital and share premium 1 483 299 1 483 299
Retained earnings 152 584 127 984
General reserves 12 231 12 231
Less: Deductions (197 823) (212 828)
Secondary capital 9 054 3 509
General allowance for credit impairment 9 020 3 475
Surplus resulting from a revaluation of specified assets 34 34
1 459 345 1 414 195
Capital adequacy ratio (%) 23.8 25.6
Primary capital (%) 23.7 25.5
Secondary capital (%) 0.1 0.1
86 Integrated Annual Report 2012
FraudPayment card fraud:The Bank is an issuer of MasterCard and Visa cards and has, in line with the card associations’ regulations, adopted proactive measures to prevent fraudulent use of these products. The Group makes use of monitoring fraud reports, based on a set of parameters prescribed by the card associations, and is reviewed on a daily basis with the aim of identifying suspicious transactional behaviour.
In addition to standard monitoring measures, the Bank offers an SMS notification service on both its credit and debit card products. Since its introduction, this service has contributed to the early detection of fraudulent transactions and mitigation of losses.
If fraudulent activity is confirmed, action is taken to prevent further use of the card/card number. Confirmed fraudulent transactions are investigated and reported to the relevant card associations and the South African Banking Risk Information Centre (‘SABRIC”), which determines common trends and then alerts the industry accordingly.
The Bank recently launched Merchant acquiring, and offers merchants point-of-sale devices to acquire transactions on behalf of VISA and MasterCard. In order to address the fraud risks associated with merchant acquiring, the Bank has implemented fraud prevention systems and merchant account monitoring tools that comply with the relevant card associations’ requirements.
Fraud other than payment card fraud:The Group has adopted a zero tolerance approach towards all types of fraud and theft. The Forensic Investigator investigates all incidents relating to external fraud, and internal fraud is investigated by our internal audit division.
If an incident of fraud is brought to our attention, it is investigated immediately, evidence is collected, and statements are taken. If the incident was perpetrated externally, criminal charges are laid. If the incident was perpetrated internally, disciplinary action is instituted in addition to criminal charges being laid. All incidents are reported to the SABRIC and the South African Police Service.
Fraud awareness
Fraud awareness training is conducted on a regular basis, and awareness newsletters are compiled and disseminated to all staff. These newsletters address a wide range of topics, and are not limited to payment card fraud only. Fraud awareness newsletters are also compiled and distributed to clients.
During the latter part of 2012, the Fraud Department initiated a Fraud Awareness User Guide, consisting of a number of modules. The aim of each module is to cover specific and current fraud trends. Additional modules will be distributed during 2013 assisting staff to compile a comprehensive fraud awareness reference manual.
Fraud Department staff members attend meetings of industry role players, and utilise internet-based sources to stay abreast of fraud trends and the prevention thereof. The Bank also works closely with SABRIC, the Payment Association of South Africa, and card associations.
Whistle-blowingThe Group has a comprehensive Protected Disclosures Policy based on the Act of the same name. The policy addresses the reporting of corrupt activities, as well as any improper conduct, under a section on whistle-blowing. Employees are encouraged to make disclosures in good faith and on reasonable grounds.
All employees receive, twice annually, an electronic step-by-step guide on what to report and how to report it.
To this end, an enhanced anonymous reporting system is in place to enable employees to report directly to Compliance and Internal Audit, using a web-based tool. This system simplifies the anonymous reporting procedure, and encourages employees to make use of the process.
Integrated Annual Report 2012 87
Group addresses
Custom CapitalHead Office18 Bute Street, Morningside, Durban, 4001PO Box 47290, Greyville, 4023Tel: +27 31 303 2292Fax: +27 31 303 2612
Germiston Business CentreThe Lake Shopping Centre, cnr William Hilland Lake Street, Germiston, 1401PO Box 31558, Braamfontein, 2017Tel: +27 11 824 5813 Fax: +27 11 824 5823
Horizon Business Centre153 Ontdekkers Road, Horizon, 1730PO Box 31558, Braamfontein, 2017Tel: +27 11 763 6000 Fax: +27 11 763 8742
Pretoria Hatfield Business CentrePro-Equity Court, cnr Pretorius andGordon Streets, Hatfield, Pretoria, 0083PO Box 31558, Braamfontein, 2017Tel: +27 12 342 1151 Fax: +27 12 342 1191
Pretoria West Business Centre477 Mitchell Street,Pretoria West, 0183PO Box 31558, Braamfontein, 2017Tel: +27 12 327 4671 Fax: +27 12 327 4645
Sandton Business CentreGround Floor, 142 West Street,Sandown, 2196PO Box 31558, Braamfontein, 2017Tel: +27 11 302 0775 Fax: +27 11 884 1821
Strijdompark Business CentreShop 2, Homeworld Centre,cnr Malibongwe Drive and CR SwartRoad, Strijdom Park, Randburg, 2194PO Box 31558, Braamfontein, 2017Tel: +27 11 791 0854 Fax: +27 11 791 2387
Mercantile Insurance Brokers Head Office142 West Street, Sandown, 2196PO Box 782699, Sandton, 2146Tel: +27 11 302 0300 Fax: +27 11 883 7765
Mercantile Bank Business CentresBoksburg Business CentreNorth Atlas Centre, cnr Atlas andNorth Rand Roads, Boksburg, 1459PO Box 31558, Braamfontein, 2017Tel: +27 11 918 5276 Fax: +27 11 918 4159
Bruma Business Centre11 Ernest Oppenheimer Boulevard, Bruma, 2198PO Box 31558, Braamfontein, 2017Tel: +27 11 622 0916 Fax: +27 11 622 8833
Cape Town City Business CentreGround Floor, M&B House, Pier Place, Foreshore, Cape Town, 8001PO Box 51, Cape Town, 8000Tel: +27 21 419 9402 Fax: +27 21 419 5929
Cape Town Tygerberg Business CentreGround Floor, Tygerpoort Building, 7 Mispel Street, Belville, 7530PO Box 5436, Tygervalley, 7536Tel: +27 21 910 0161 Fax: +27 21 910 0163
Comaro Crossing Business CentreShop FF9, Comaro Crossing Shopping Centre, Orpen and Comaro Roads, Oakdene, 2190PO Box 31558, Braamfontein, 2017Tel: +27 11 435 0640 Fax: + 27 11 435 1586
Durban Business CentreCowey Centre, 123 Cowey Road,Morningside, Durban, 4001PO Box 519, Durban, 4000Tel: +27 31 209 9048 Fax: +27 31 209 9446
Mercantile Bank Group Head Office142 West Street, Sandown, 2196PO Box 782699, Sandton, 2146Tel: +27 11 302 0300 Fax: +27 11 883 7765
Troyeville Business Centre77 Bezuidenhout Street, Bertrams, 2094PO Box 31558, Braamfontein, 2017Tel: +27 11 624 1450 Fax: +27 11 614 9611
Vanderbijlpark Business CentreShop 1 & 2, Russell’s Building,54 President Kruger Street,Vanderbijlpark, 1911PO Box 31558, Braamfontein, 2017Tel: +27 16 981 4132 Fax: +27 16 981 0767
Welkom Business CentreTulbagh House, 11 Tulbagh Street,Welkom, 9459PO Box 2207, Welkom, 9460Tel: +27 57 357 3143Fax: +27 57 352 7879

88 Integrated Annual Report 2012
Notes
142 West Street, Sandown, 2196, South AfricaTel +27 (0)11 302 0300, Fax +27 (0)11 302 0729www.mercantile.co.za
Integrated Annual Report 2012
your bank, your partner, our focus
Mercantile B
ank Holdings Lim
ited Integrated Annual R
eport 2012


![[XLS] · Web view1 302 2 302 3 302 4 302 5 302 6 363 7 363 8 302 9 302 10 307 11 302 12 302 13 223244 14 302 15 302 16 224 17 302 18 302 19 302 20 302 21 302 22 23 24 25 26 302 27](https://img.pdfslide.us/doc/110x75/5b00c3a37f8b9a952f8d6104/xls-view1-302-2-302-3-302-4-302-5-302-6-363-7-363-8-302-9-302-10-307-11-302-12.jpg)