Embed Size (px)
Citation preview

Integrated Accounting IssuesWinter 2006
Rodney K. Rogers, Ph.D., CPA
School of Business Administration
Portland State University

Traditional Stakeholders of Firm
Operations/Investing Vendor Customer
Goods
$
$
Goods
Creditors Investors
$ $ $ $Financial Intermediaries
InformationIntermediaries
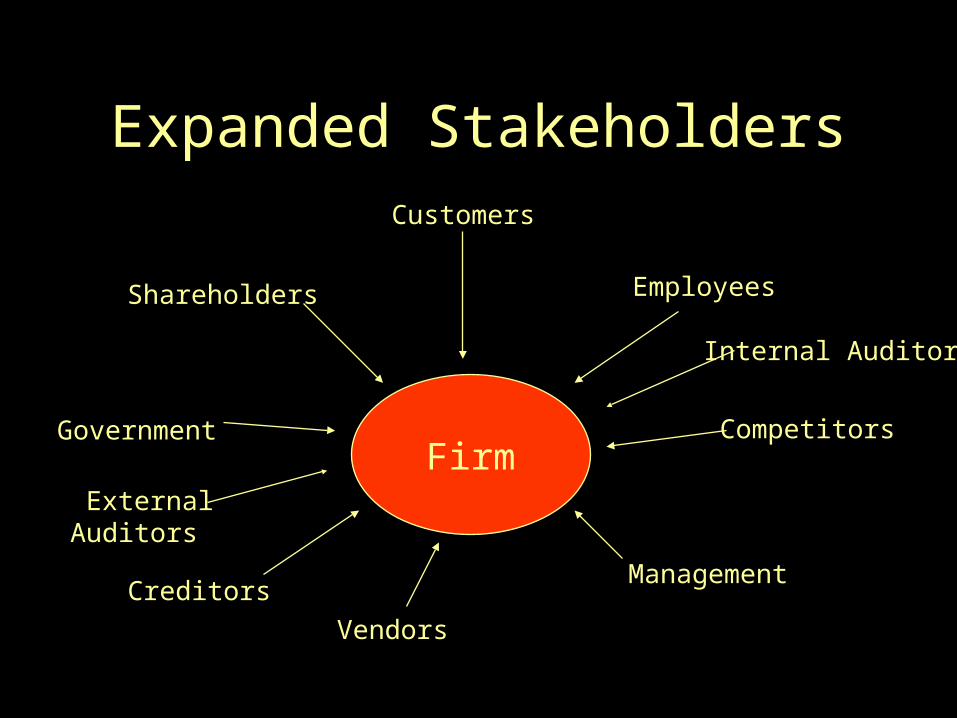
Expanded Stakeholders
Firm
Shareholders
Creditors
Employees
Management
CompetitorsGovernment
Customers
Vendors
ExternalAuditors
Internal Auditors

Market Environment Organization Strategy
Organization Activities
Accounting System
Financial Statements
Accounting Environment
Accounting Strategy
From Business Activities to Financial StatementsOrganization Structure

Analysis of a Company• Market Environment – “Context”
– Macroeconomic, governmental, legal considerations,
• Organization Strategy Analysis – “Expectations”– Key profit drivers, business risks and profit potential
• Organization Structure – “Capabilities”– Current structure of organization
• Accounting Analysis– Evaluate the “quality” of the accounting numbers
• Financial Analysis– Evaluate performance using financial and non-financial information – (past
and current results)
• Prospective Analysis– Forecasts and valuation

SWOT Analysis
• Internal– Strengths– Weaknesses
• External– Opportunities– Threats

Market Environment
• Interest Rates
• US and foreign GNP Growth
• Unemployment Levels
• Trends in Consumer savings/borrowing
• Others
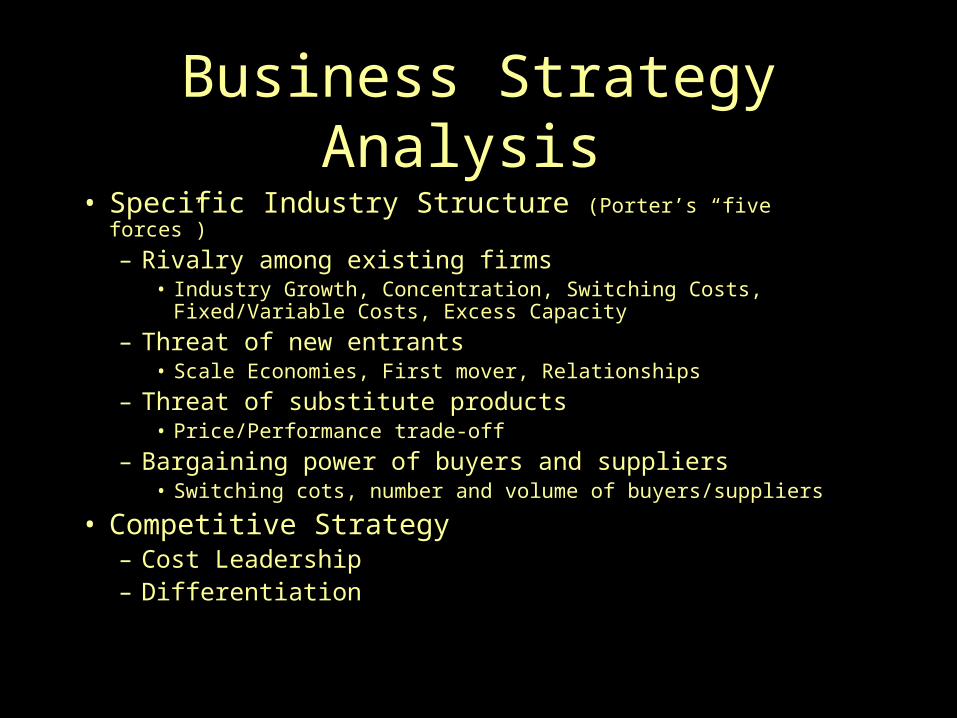
Business Strategy Analysis • Specific Industry Structure (Porter’s “five forces”)
– Rivalry among existing firms• Industry Growth, Concentration, Switching Costs, Fixed/Variable Costs,
Excess Capacity
– Threat of new entrants• Scale Economies, First mover, Relationships
– Threat of substitute products• Price/Performance trade-off
– Bargaining power of buyers and suppliers• Switching cots, number and volume of buyers/suppliers
• Competitive Strategy– Cost Leadership– Differentiation

Competitive Strategy
• Cost Leadership– Same product or service at lower cost
• Economies of scale, efficient production, design
• Differentiation– Unique product or service at a premium price
• Product design, variety, customer service, brand, R&D, innovation
• How to maintain competitive status?

Business Strategy Analysis
• Quality of Management
• Regulatory Developments
• Social Issues
• Technology

Output: Basic Financial Statements
• Balance Sheet
• Income Statement
• Statement of Cash Flows
• Retained Earnings Statement
• Statement of Comprehensive Income

Analyzing a Firm
Operations/Investing Vendor Customer
Goods
$
$
Goods
Creditors Investors
$ $ $ $Financial Intermediaries
InformationIntermediaries

Accounting Analysis
• Quality of Disclosures
• Quality of Numbers
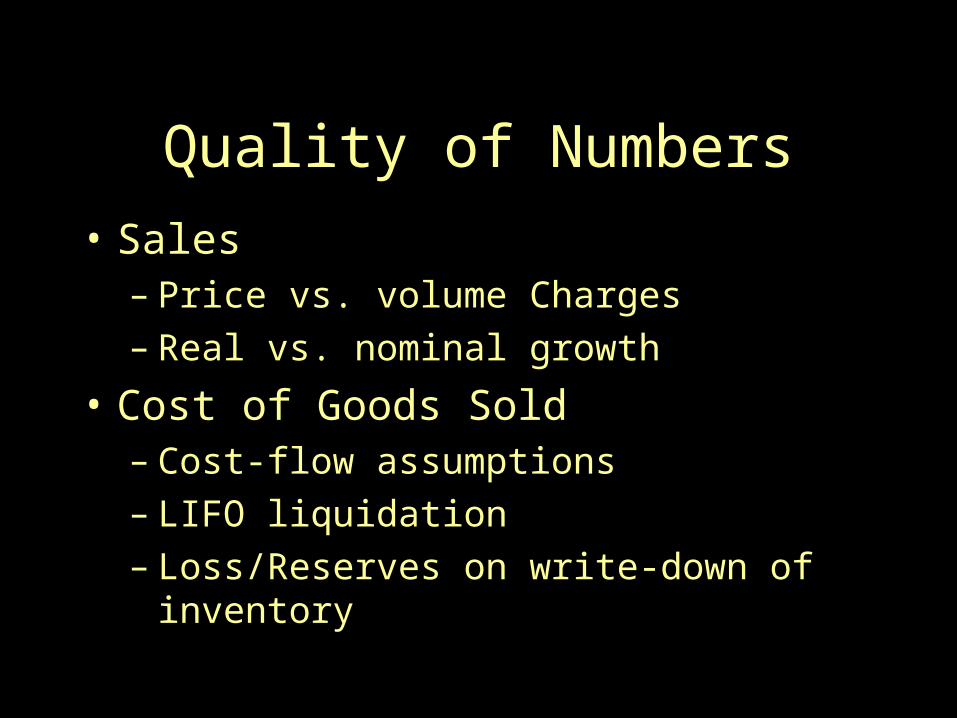
Quality of Numbers
• Sales– Price vs. volume Charges– Real vs. nominal growth
• Cost of Goods Sold– Cost-flow assumptions– LIFO liquidation– Loss/Reserves on write-down of inventory

Quality of Numbers• Operating Expenses
– Discretionary expenses• R&D• Repair and Maintenance• Advertising and Marketing
– Depreciation• Methods• Estimates
– Pension Accounting

Quality of Numbers• Nonoperating Revenue and Expenses
– Gains/Losses from Sales of Assets– Interest Income– Equity Income– Loss recognition on write-down of assets– Accounting changes– Extraordinary items– Reserves on restructuring charges

Financial Analysis:Levers for Value Creation
Return on Equity = Net Income
Shareholder’s Equity
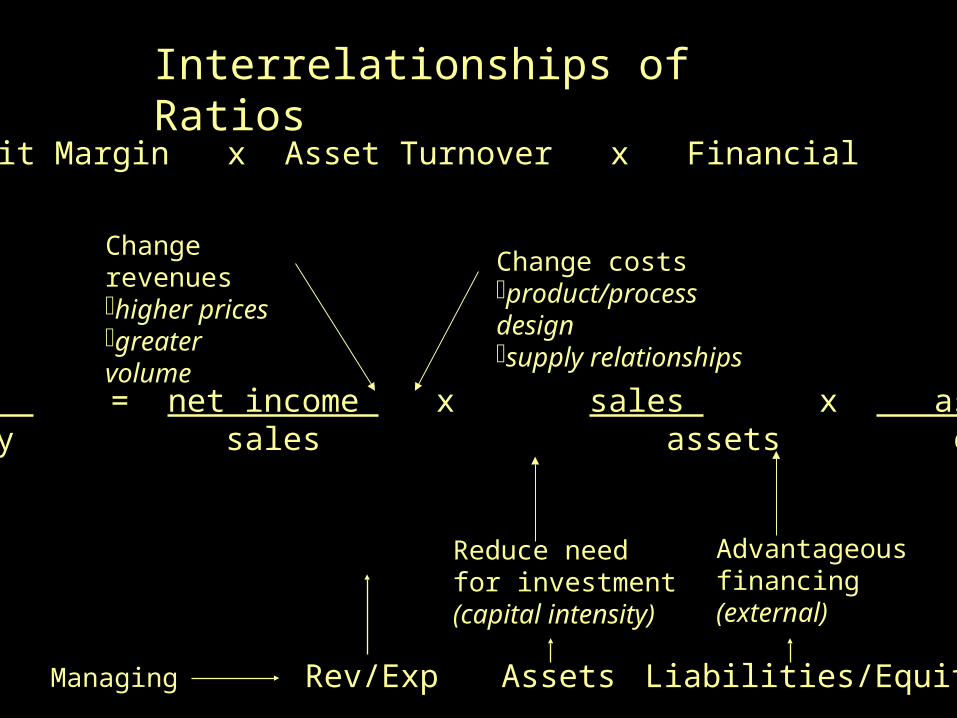
Return on = Profit Margin x Asset Turnover x FinancialEquity Leverage
net income = net income x sales x assets owner’s equity sales assets owner’s equity
Change revenueshigher pricesgreater volume
Change costsproduct/process designsupply relationships
Reduce needfor investment(capital intensity)
Advantageousfinancing(external)
Interrelationships of Ratios
Managing Rev/Exp Assets Liabilities/Equity

Managing Sales and Expenses
• Gross Profit
• Operating Profit
• Issues to Consider– Price vs. Volume Changes– Real vs. Nominal Growth– Inventory Issues

Many terms
• Net Income
• EBIDA
• EBIT or Operating Income (pre-tax)
• EBITDA
• FCF
• NOPAT or prefinancing operating earnings

Profitability Ratios
Gross Profit Margin = Gross Profit Net Sales
Operating Profit Margin = Operating Profit Net Sales
Net Profit Margin = Net Earnings Net Sales

Profitability Ratios
Return on Investment (ROI) = Net Earnings Total Assets
SGA % = Selling, General and Admin. Expenses Net Sales
Cash Flow Margin = Cash flow from operations Net Sales
Return on Assets (ROA) = NOPAT Total Assets

Managing AssetsDays in Receivables = Accounts Receivable
Avg.Daily Sales
A.R. Turnover = Net SalesAccounts Receivables
Inventory Turnover = Cost of Goods Sold Inventory
Fixed Asset Turnover = Net SalesNet Prop.Plant&Equip.
Total Asset Turnover = Net Sales Total Assets

Managing Liabilities and Equity
Current Ratio = Current AssetsCurrent Liabilities
Quick Ratio = Current Assets-Inventory Current Liabilities

Managing Liabilities and EquityDebt Ratio = Total Liabilities
Total Assets
L.T. Debt to Total Capital = LT Debt LT Debt + S.E.
Debt to Equity = Total LiabilitiesShareholders’ Equity
Times Interest Earned = Operating ProfitInterest Expense

Return on = Profit Margin x Asset Turnover x FinancialEquity Leverage
net income = net income x sales x assets owner’s equity sales assets owner’s equity
Change revenueshigher pricesgreater volume
Change costsproduct/process designsupply relationships
Reduce needfor investment(capital intensity)
Advantageousfinancing(external)
Interrelationships of Ratios
Managing Rev/Exp Assets Liabilities/Equity
(common earnings leverage) (capital structure leverage)

Market RatiosEarnings Per Share = Net Earnings
Avg. Shares Outstanding
Price to Earnings Ratio = Market Price of Common StockEarnings Per Share
Dividend Payout Ratio = Dividends Per Share Earnings Per Share
Dividend Yield = Dividends Per Share Market Price of Common Stock

Financial Performance Measures by Area and Viewpoint
Management Owners LendersOperational AnalysisGross ProfitProfit MarginOperating Exp.AnalysisContribution
ProfitabilityReturn on Net WorthReturn on Comm.EquityEarnings Per Share
LiquidityCurrent RatioAcid Test Ratio
Asset ManagementAsset TurnoverWorking CapitalInventory TurnA.R. Turn; A.P.
Disposition ofEarningsCash flow per shareDividends per shareDividend yieldPayout/retention
LeverageDebt to AssetsDebt to CapitalizationDebt to Equity
ProfitabilityReturn on AssetsEarnings before Int/TaxReturn on Assets
Market IndicatorsPrice/Earnings RatioMarket to Book Value
Debt ServiceInterest CoverageInterest/Principal Cov.