Embed Size (px)
Citation preview
INTAKE DIVERSION DAMYellowstone River, Montana
Fish Protection and PassageConcept Study Report
Water Resources Research Laboratory
Prepared for:United States Bureau of ReclamationMontana Area Office
January, 2000
INTAKE DIVERSION DAMy ellowstone River, Montana
Fish Protection and PassageConcept Study Report
Water Resources Research Laboratory
Prepared for:United States Bureau of ReclamationMontana Area Office By:Brent Mefford, Rick Christensen, andArthur Glickman
January, 2000
Contents
Page
Project Description 1Intake Diversion Dam 1Diversion Headworks and Canal 2Hydraulics 2Water Surface Modeling 3Fish Protection 6Barrier Location 6Barrier Designs . . . . . . . . . . . . . . . . . . . . . . . . . . . . . . . . . . . . . . . . . . . . . . . . . . . . . . . . . . . . . 7Flow Criteria for Fish Barriers . . . . . . . . . . . . . . . . . . . . . . . . . . . . . . . . . . . . . . . . . . . . . . . 7Positive Barrier Screen Concept 8Recommended Screen Design 10Louver Concept 13Fish Passage Fishway Concepts . . . . . . . . . . . . . . . . . . . . . . . . . . . . . . . . . . . . . . . . . . . . . . . . 15Flume and Baffle Fishway Concept 15Riprap Channel Fishway Concept . . . . . . . . . . . . . . . . . . . . . . . . . . . . . . . . . . . . . . . . . . . . . . 17
Figures
1. Location ofIntake Diversion Dam, Montana 22. View of intake dam and main canal headworks . . . . . . . . . . . . . . . . . . . . . . . . . . . . . . . . . . . 33. Location of survey data points measured for the concept study . . . . . . . . . . . . . . . . . . . . . . . 44. Estimated water surface profiles across intake dam for river and canal flows 55. Flow relationship between the river at intake dam and the high flow channel 56. View looking upstream toward the main canal headworks 77. View looking upstream at the Bums wasteway flow control gates . . . . . . . . . . . . . . . . . . . . . 78. Typical layout of a linear flat plate fish screen structure 99. Typical layout of a "Y" shaped fish screen structure . . . . . . . . . . . . . . . . . . . . . . . . 910. Layout of a rotating drum fish screen structure 911. Intake fish screen concept design . . . . . . . . . . . . . . . . . . . . . . . . . . . . . . . . . . . . . . . . . . . . 1112. Yakima Tieton Canal fishscreen 1213. Louver style fish barrier, Rhone 1955 1414. Intake fish louver concept design . . . . . . . . . . . . . . . . . . . . . . . . . . . . . . . . . . . . . . . . . . . . 1615. Yellowstone concrete fish ladder 1816. Yellowstone riprap fish ladder . . . . . . . . . . . . . . . . . . . . . . . . . . . . . . . . . . . . . . . . . . . . . . 19
Appendix AWater Surface Model Data
Figure A-I Yellowstone . . . . . . . . . . . . . . . . . . . . . . . . . . . . . . . . . . . . . . . . . . . . . . . . . . . . . . 21Figure A-2 Hec-Ras geometry plan showing cross-section locations 22Figure A-3 Yellowstone reach above dam 23Figure A-4 Yellowstone reach below dam 24Figure A-5 River intake canal 25Table A-I Hec-Ras water surface profile output for flows given in figure 4 26
AppendixBConstruction Cost Estimate Sheets
1. Fish screen facilities screen structure totals sheet 302. Fish screening facilities screen option 313. Fish screen structure - mechanical 324. Fish screen facilities louver structure totals sheet 335. Fish screen facilities louver option 346. Fish louver structure - mechanical 357. Baffled fishway structure 368. Rock fishway structure 37
Tables
Table 1. Agency Velocity criteria for screening salmonids 8
ii
Intake Diversion Dam Fish Protection and Passage Feasibility Report
Intake Diversion Dam and the diversion headworks for the Lower Yellowstone hrigationDistrict's Main Canal are located on the Yellowstone River about 17 miles north east of Glendive,Montana, figure 1. The affect of the dam and unscreened diversion on the fisheries of the lowerYellowstone River has been the subject of multiple studies by state and federal resource agencies.Entrainment studies by Heibert (2000) show significant numbers offish are entrained withdiversion flow into the canal. Fish population studies conducted by Montana Fish Wildlife andParks (Stewart, 1986, 1988, 1990,1991) indicate the dam is a partial barrier to many species andlikely a total barrier to some species. The purpose of this study is to present designs for reducingfish entrainment into the canal and increasing fish passage past the diversion dam.
Project Description - Lower Yellowstone Irrigation Project (Reclamation ProjectData, 1981)
The Reclamation Service began investigating the project in 1903. A report by a board ofconsulting engineers, dated April 23, 1904, served as a basis for authorization of the project. Theproject was authorized by the Secretary ofthe Interior on May 10, 1904, under the ReclamationAct ofJune 17, 1902. Construction of a diversion dam, canal headworks and delivery canals werebegan on July 22,1905. Water was available for irrigation during the season of 1909.
The Lower Yellowstone hrigation Project lies in east-central Montana and western NorthDakota. The project includes the Lower Yellowstone Diversion Dam, Thomas Point PumpingPlant, the Main Canal, 225 miles oflaterals, and 118 miles of drains. The purpose ofthe projectis to furnish a dependable supply of irrigation water for 52,133 acres offertile land along the westbank ofthe Yellowstone River. About one-third of the project lands are in North Dakota andtwo-thirds in Montana.
Water is diverted from the Yellowstone River into the Main Canal by the Lower YellowstoneDiversion Dam near Intake, Montana. It is carried by gravity to the greater portion ofthe projectlands. About 2,300 acres of benchland are irrigated by water pumped from the canal by theThomas Point Pumping Plant.
Intake Diversion Dam
Intake Dam was originally constructed as a rock-filled timber crib weir about 12 ft high and 700 ftlong. The original dam contained 23,000 cubic yards ofmaterial. The dam raises the upstreamwater elevation from about three to five feet depending on river flows. Since the construction ofIntake Dam, the structure has required frequent repair to maintain the needed upstream head todivert flow into the canal. Heavy ice and large flood flows work to progressively move riprapmaterial from the dam downstream. A cableway that crosses the river over the crest ofthe damis used to place riprap along the dam crest when repairs are required. Over the years, largequantities ofrock have been added to the dam to replace rock displaced by the river. Riprap nowextends several hundred feet downstream ofthe dam across the width ofthe dam.
1

Diversion Headworks and Canal
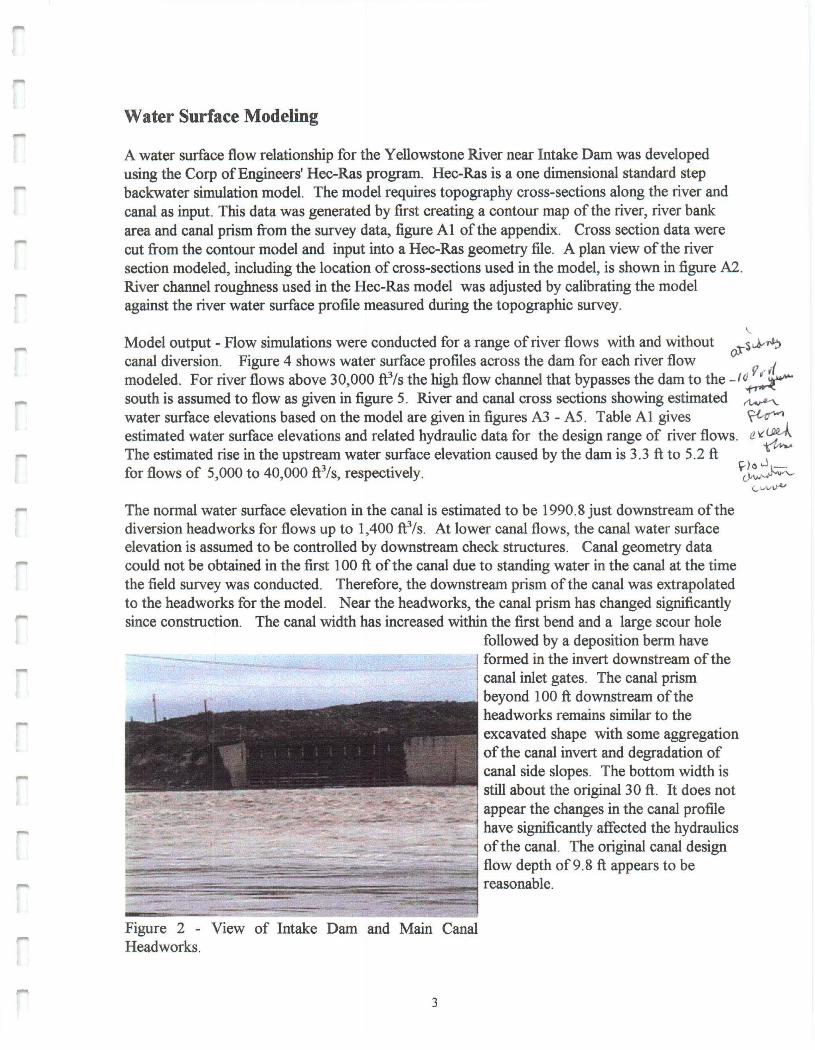
The Main Canal diverts to the west side of the Yellowstone River at Intake and extends down thevalley to the confluence of the Yellowstone and Missouri Rivers. The canal is 71.6 miles long,unlined and has an initial capacity of about 1,400 ft3/s. The canal headworks is a concretestructure with 11 5-ft-diameter sluice gates, figure 2. There are no trashracks in front oftheintake gates. The canal was originally designed with a 30 ft bottom width with 1.5: 1 side slopes.The canal is designed to convey it's full capacity at a flow depth of about lOft. The canaloperates from late April through October of each year.
Hydraulics
Flow and water level data for the river and canal were needed to design fish protection andpassage structures. For the feasibility level design these data were estimated by conducting alimited site survey and developing a water surface computer model.
\
8/oomlleld Rd
leOliY'eor~8fIt"9'\/'
1'1/Figure 1 - Location ofIntake Diversion Dam, Montana.
A site survey was conducted on April 18 and 19, 1999. The survey was conducted prior to thecanal being watered up for the irrigation season. The survey included; measuring cross sectionsthrough the canal for a distance of about 1600 ft downstream of the diversion headworks;
107. surveying random river bank elevationsfor a distance of about 1.0 mile upstream
. ./ and downstream ofthe diversion dam;and conducting river bathymetryY measurements for a distance of about 1.5
~s miles upstream and downstream of the. >/ diversion dam. The land based survey'/or} data was obtained using a GIS system. I' referenced to a benchmark located just
1~ east of Thirteen Mile Creek at the railroad~.(; crossing. River bathymetry data was
Jt' obtained using a boat mounted ADCP(acoustic doppler current profiler) with aGIS link. The ADCP provided nearlycontinuous location, flow depth and
11. velocity data along the path taken by the~r. survey boat. The location of all survey
it data collected are shown onfigure 3. Note, no bathymetry data wascollected for a distance of about 500 ftdownstream of the dam crest due toshallow and turbulent flow conditions.
2
-
Water Surface Modeling
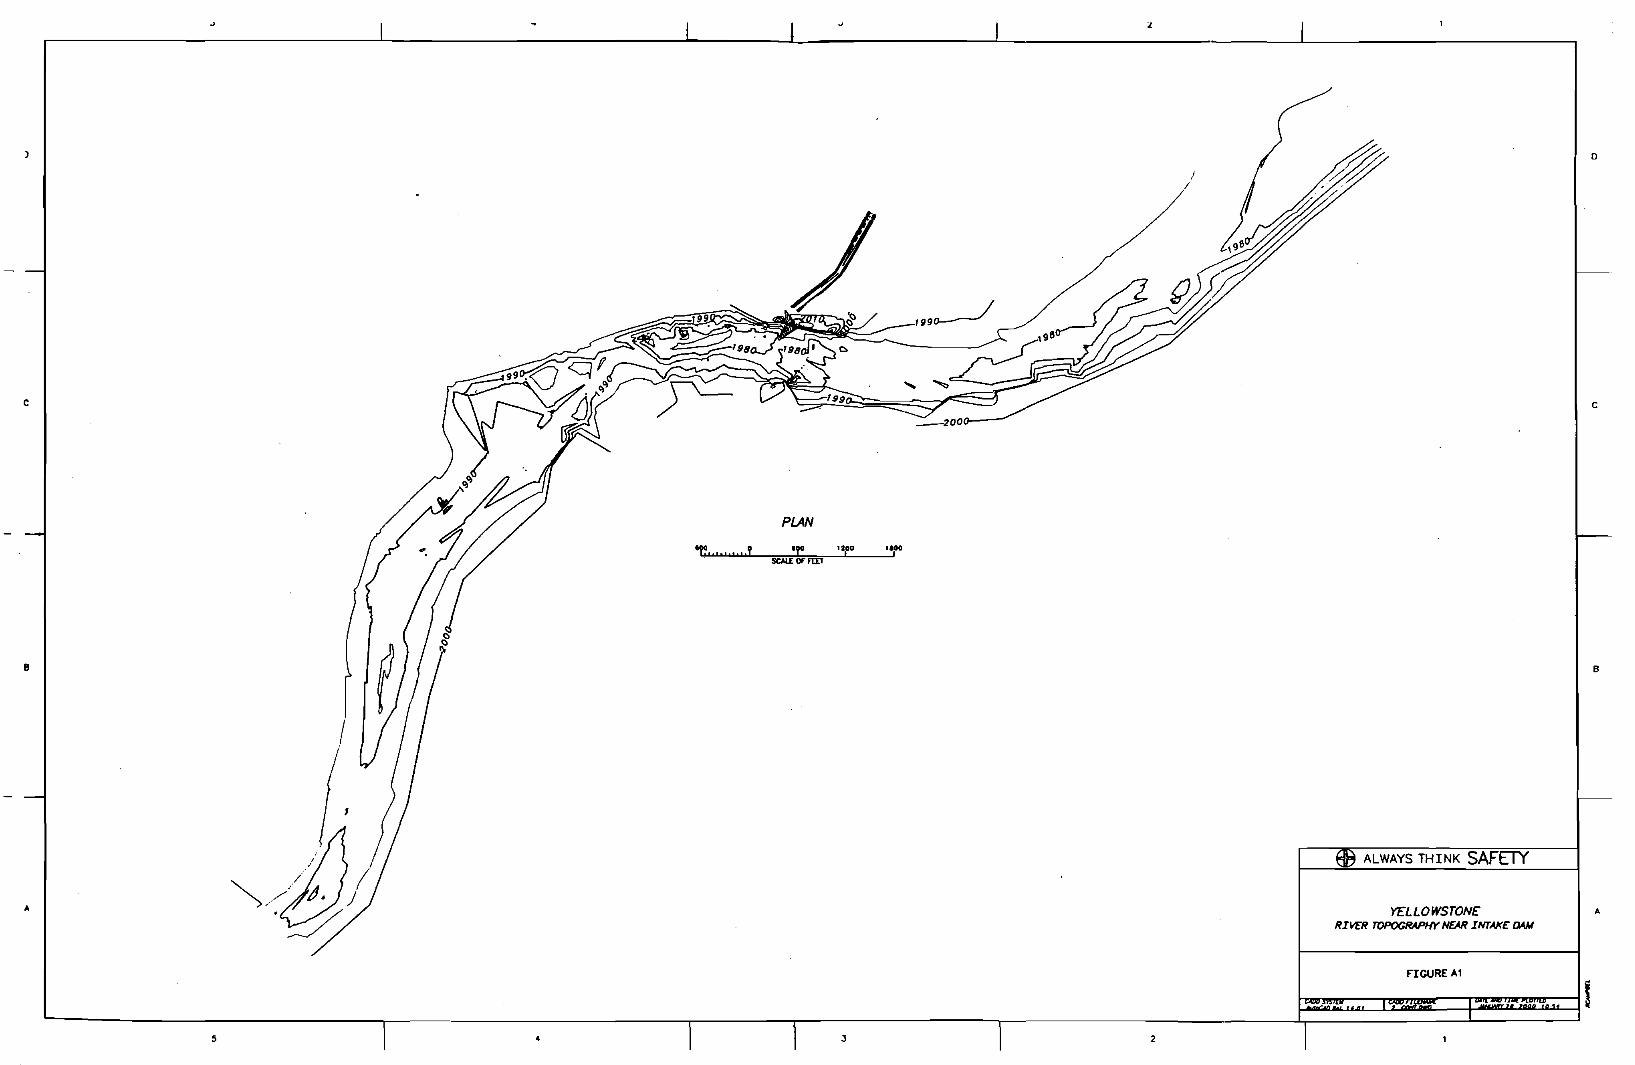
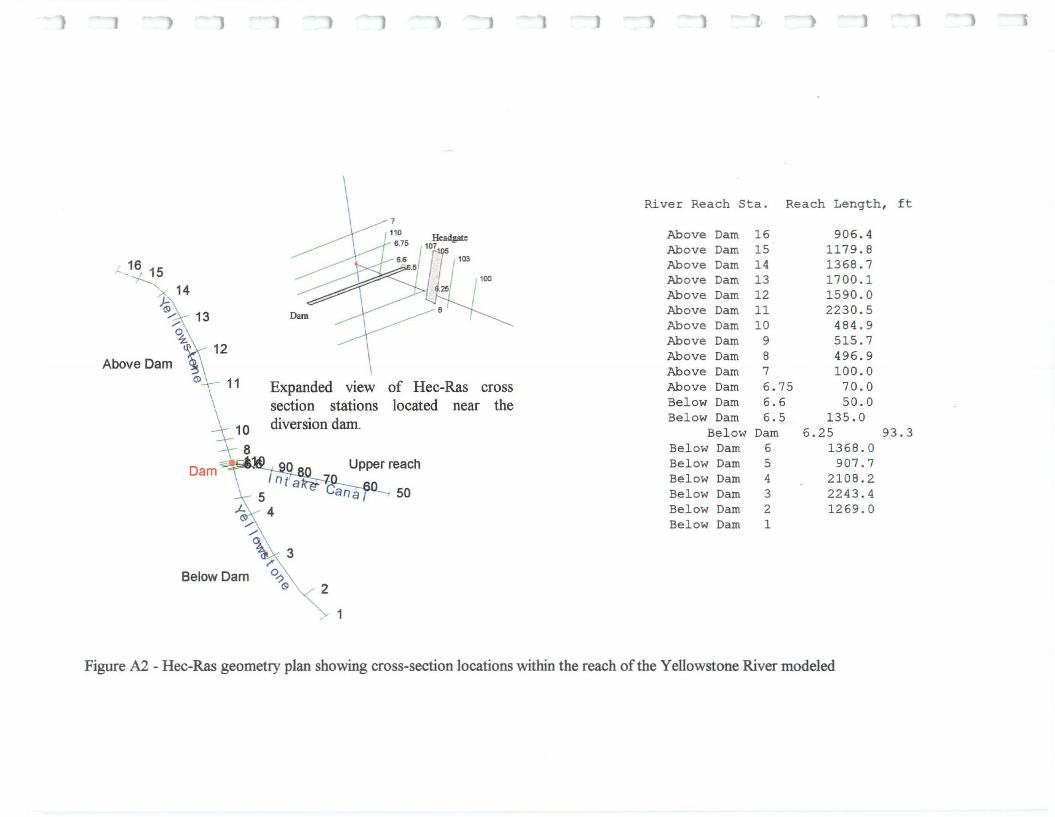
A water surface flow relationship for the Yellowstone River near Intake Dam was developedusing the Corp ofEngineers' Hec-Ras program. Hec-Ras is a one dimensional standard stepbackwater simulation model. The model requires topography cross-sections along the river andcanal as input. This data was generated by first creating a contour map of the river, river bankarea and canal prism from the survey data, figure Al of the appendix. Cross section data werecut from the contour model and input into a Hec-Ras geometry file. A plan view ofthe riversection modeled, including the location of cross-sections used in the model, is shown in figure A2.River channel roughness used in the Hec-Ras model was adjusted by calibrating the modelagainst the river water surface profile measured during the topographic survey.
Model output - Flow simulations were conducted for a range of river flows with and without ot"s~
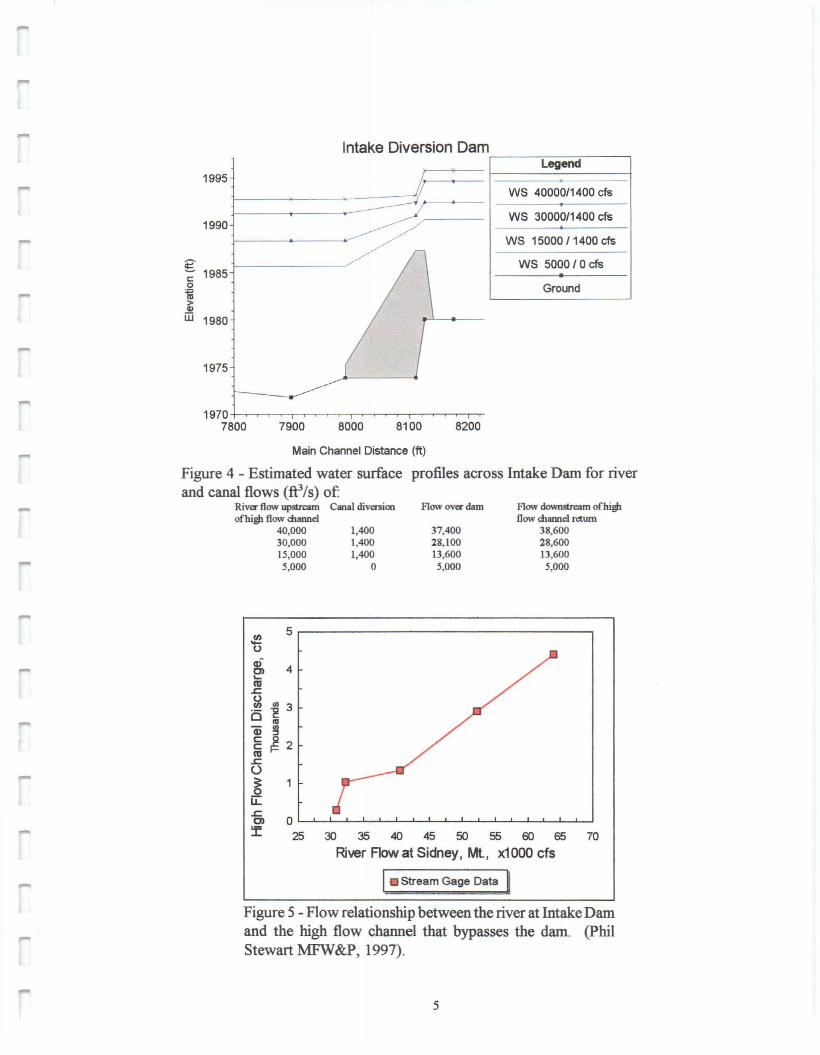
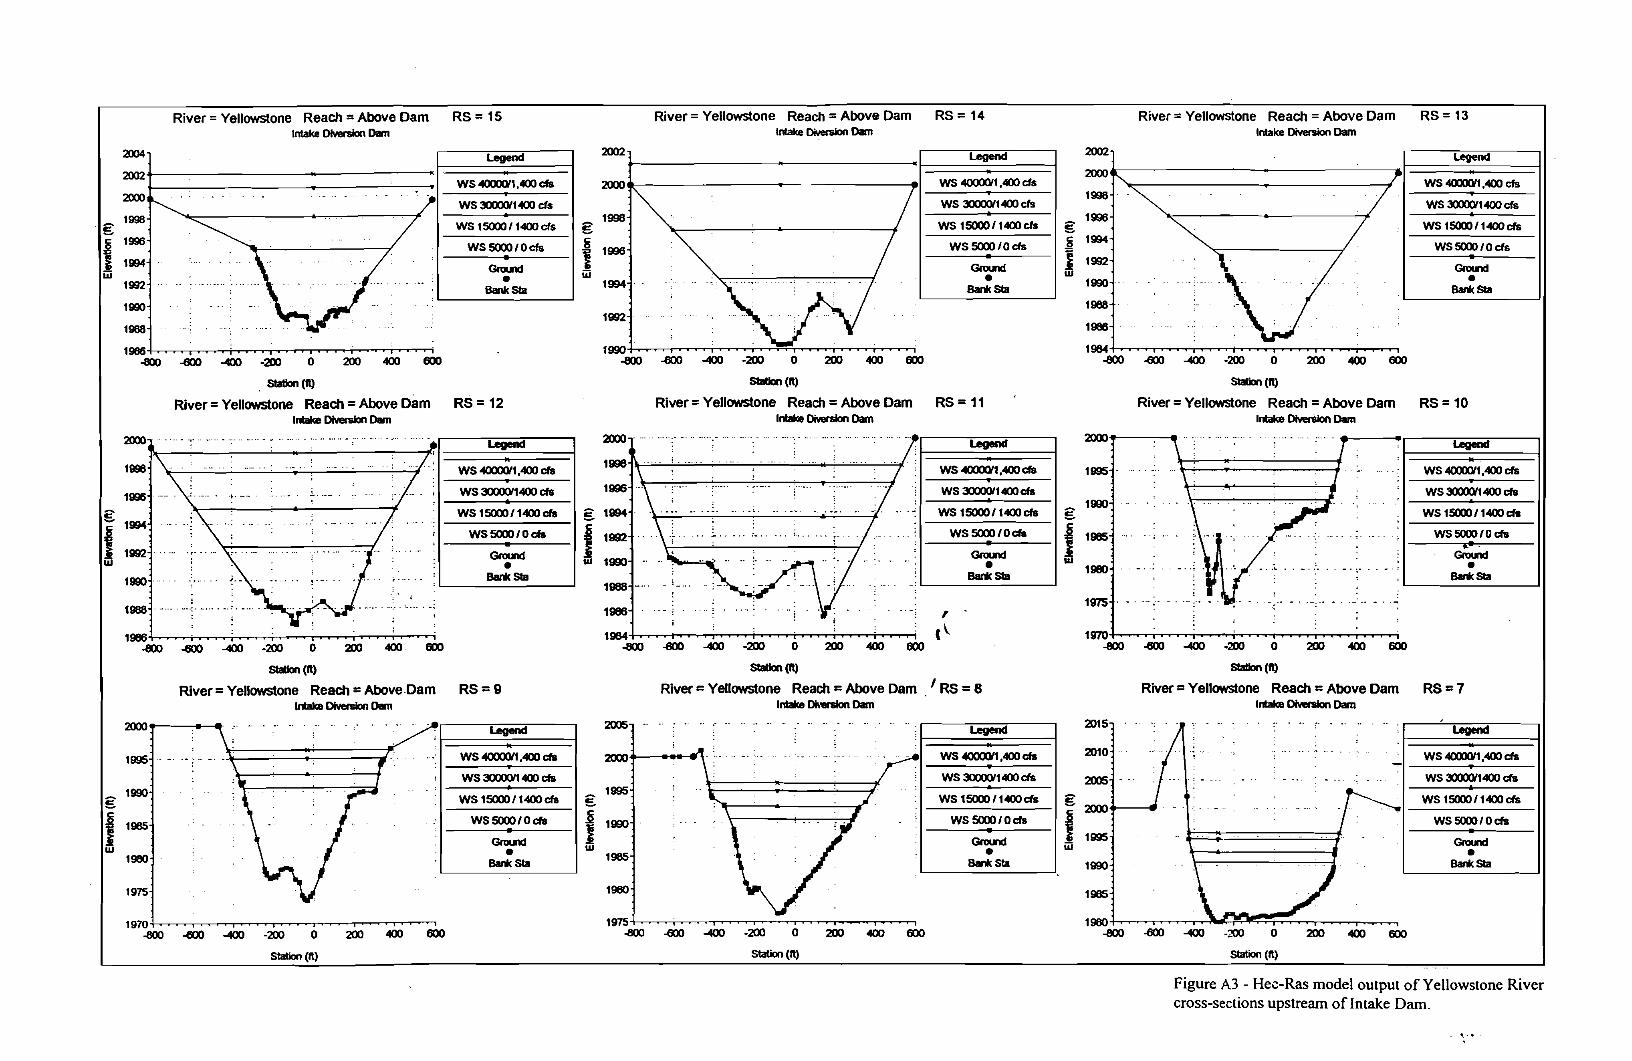
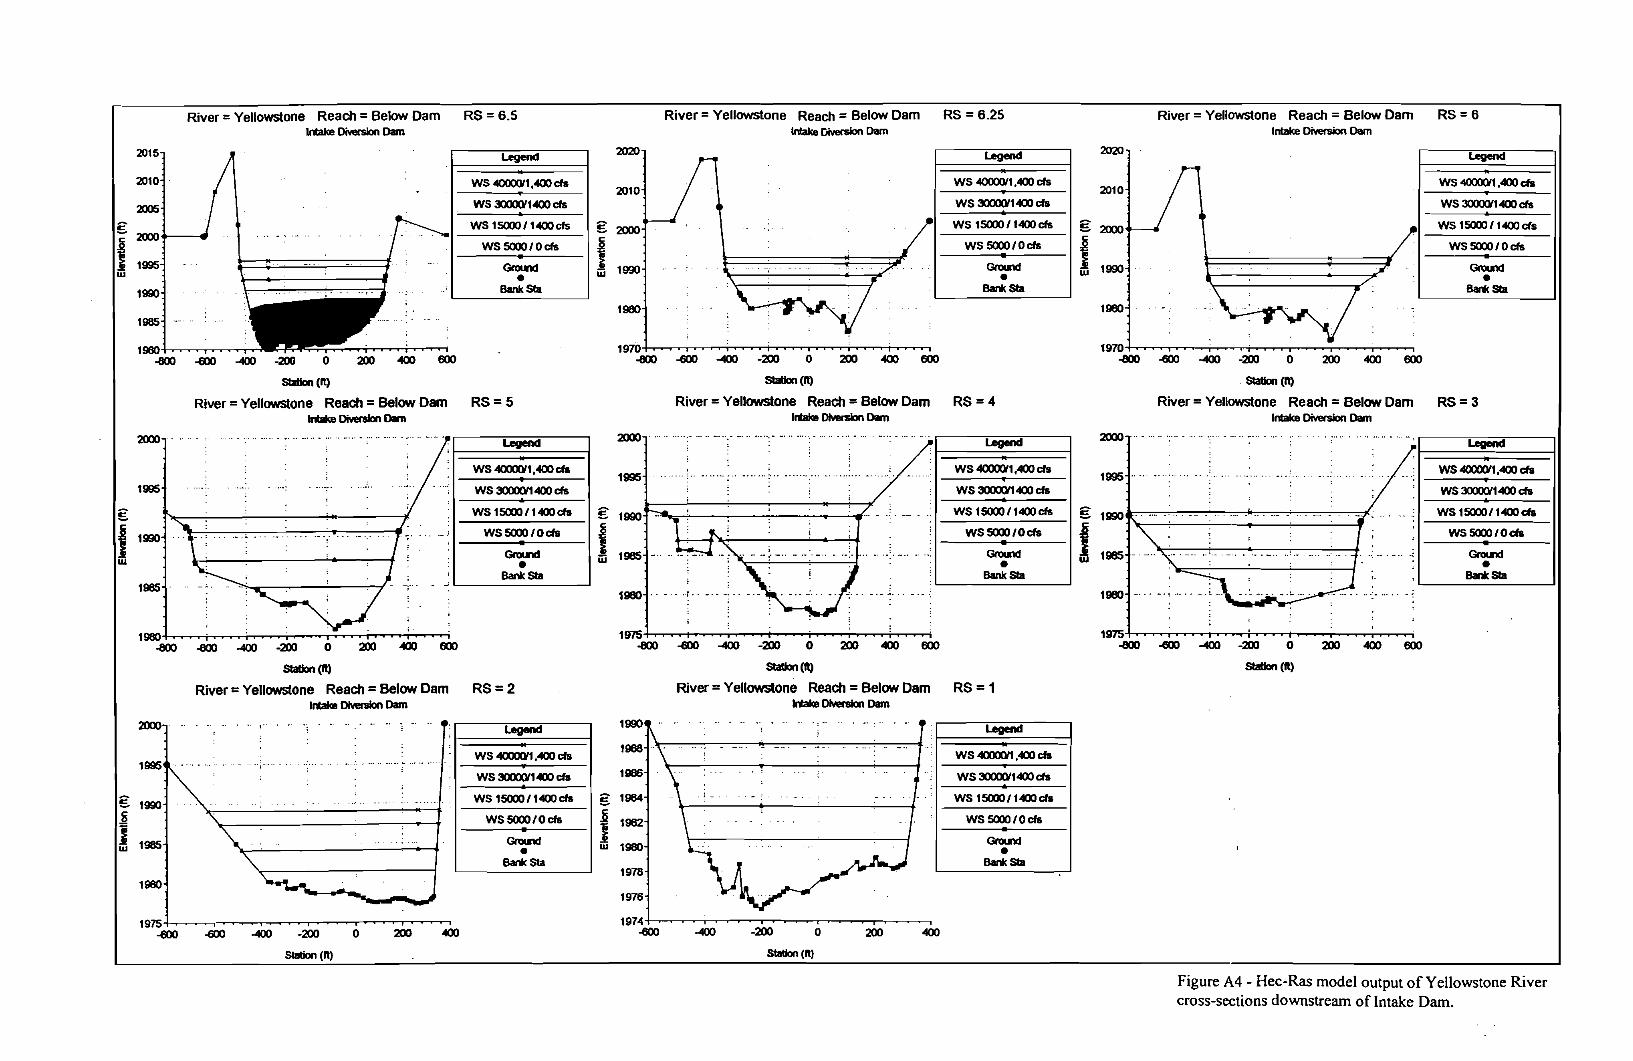
canal diversion. Figure 4 shows water surface profiles across the dam for each river flow II .(modeled. For river flows above 30,000 ft3/s the high flow channel that bypasses the dam to the_/~south is assumed to flow as given in figure 5. River and canal cross sections showing estimated ~water surface elevations based on the model are given in figures A3 - A5. Table Al gives ~
estimated water surface elevations and related hydraulic data for the design range of river flows. (!\(~The estimated rise in the upstream water surface elevation caused by the dam is 3.3 ft to 5.2 ft ...l
for flows of 5,000 to 40,000 ft3/S, respectively. YJ~LvVV"
The normal water surface elevation in the canal is estimated to be 1990.8 just downstream of thediversion headworks for flows up to 1,400 ft3/S. At lower canal flows, the canal water surfaceelevation is assumed to be controlled by downstream check structures. Canal geometry datacould not be obtained in the first 100 ft of the canal due to standing water in the canal at the timethe field survey was conducted. Therefore, the downstream prism of the canal was extrapolatedto the headworks for the model. Near the headworks, the canal prism has changed significantlysince construction. The canal width has increased within the first bend and a large scour hole
followed by a deposition berm haveformed in the invert downstream of thecanal inlet gates. The canal prismbeyond 100 ft downstream oftheheadworks remains similar to theexcavated shape with some aggregationofthe canal invert and degradation ofcanal side slopes. The bottom width isstill about the original 30 ft. It does notappear the changes in the canal profilehave significantly affected the hydraulicsof the canal. The original canal designflow depth of 9.8 ft appears to be
-=--=---"P:~:==~~;~~~~====:;;;;;iiii:i~~~~~ reasonable.
Figure 2 - View of Intake Dam and Main CanalHeadworks.
3
Elevation, ft• 1966.8 - 1977• 1977 -1977.9
1977.9 -1978.51978.5 -1979.31979.3 -1980.41980A -1981.41981A -1983.2
• 1983.2 -1985.6• 1985.6 -1987.4• 1987A -1988.5• 1988.5 -1989.3• 1989.3-1990• 1990 -1991• 1991 - 1992.6• 1992.6 - 2041
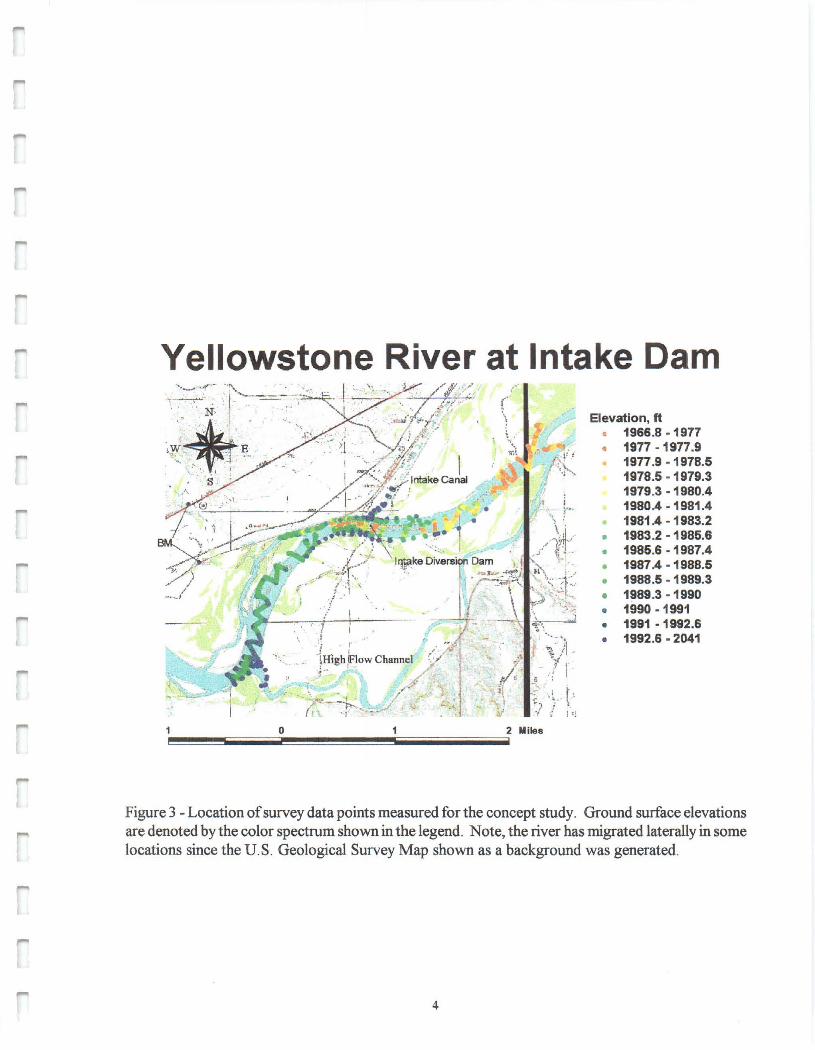
Yellowstone River at Intake Damt"I('
\
"",''"." ., 'Ii ..
",\'I oj"".
Figure 3 - Location ofsurvey data points measured for the concept study. Ground surface elevationsare denoted by the color spectrum shown in the legend. Note, the river has migrated laterally in somelocations since the U.S. Geological Survey Map shown as a background was generated.
4
Intake Diversion DamLegend
rif ws 40000/1400 cfs
-;::3 WS 30000/1400 cfs
WS 15000/1400 cfs
WS 5000 / 0 cfs•
Ground
\
II
~
, ,
Flow downstream ofhi!!ltflow channel return
38,60028,60013,6005,000
8200
37,40028,10013,6005,000
Flow ovec dam
8100
1,4001,4001,400
o
8000
Main Channel Distance (ft)
profiles across Intake Dam for river
79001970
7800
1995
1990
g1985c:
0
iii>
'"ill 1980
1975
Figure 4 - Estimated water surfaceand canal flows (ft3/S) of:
Rive.- flow uplUcam Canal div....ionofhigb flow channel
40,00030,00015,0005,000
--
7030 35 40 45 50 55 60 65
River Flow at Sidney, Mt., x1 000 cfs
Stream Gage Data I
OL....Jc........1----L----'---'---'---'--'----'---'-----'--'---..l..-J-...L....J'--L----l
25
5r------------------,
Figure 5 - Flow relationship between the river at IntakeDamand the high flow channel that bypasses the dam. (philStewart MFW&P, 1997).
5
Fish Protection
Various methods of reducing fish entrainment are used at water diversions. These methods aregenerally divided into two categories, positive barriers and behavioral barriers. Positive barrierscreens prevent all fish larger than fingerling size and a high percentage of fry from passing ondownstream. Screens allow water to pass through while guiding fish to escape routes commonlycalled fish bypasses. Behavioral barriers rely on triggering an avoidance response in fish. Mostbehavioral barriers use artificially imposed stimulus to guide fish away from diverted flow. Themost common behavioral barriers are louvers, strobe lights, sound generators and electric fields.Behavioral barriers vary widely in effectiveness and application, however no behavioral barriers areconsidered 100 percent effective. Louvers are a course mesh structural barrier that are designed togenerate flow turbulence that fish can detect and avoid. Light, sound and electric fields are nonstructural barriers. In most cases, non-structural barriers have not been proven to be effectivesubstitutions for structural barriers. They should only be considered if structural barriers can notbe constructed due to site restrictions or cost.
Barrier Location
A fish protection facility at Intake Diversion Dam could be placed on-river in front of the diversionheadworks structure or off-river in the canal downstream of the headworks. Both locations haveadvantages and disadvantages. On-river fish barriers are generally preferred where applicablebecause they prevent fish from ever leaving the river. On the down side, on-river means the barriermust be designed to contend with large debris, ice, large changes in river stage and relatively pooraccess to the barrier for maintenance. An off-river location downstream ofthe canal headworks hasthe advantage of being removed from the extremes offlow and debris that occur in the river. Thestructure can be unwatered for maintenance and inspection each year after the irrigation season.The down side of an off-river location is the uncertainty of fish mortality or injury associated withpassing through the headworks gates and the potential for increased predation by predator fish dueto the concentration of fish in bypass flows. At Intake Dam, the severity of flood flows, largedebris and ice jams favor an off-river fish barrier.
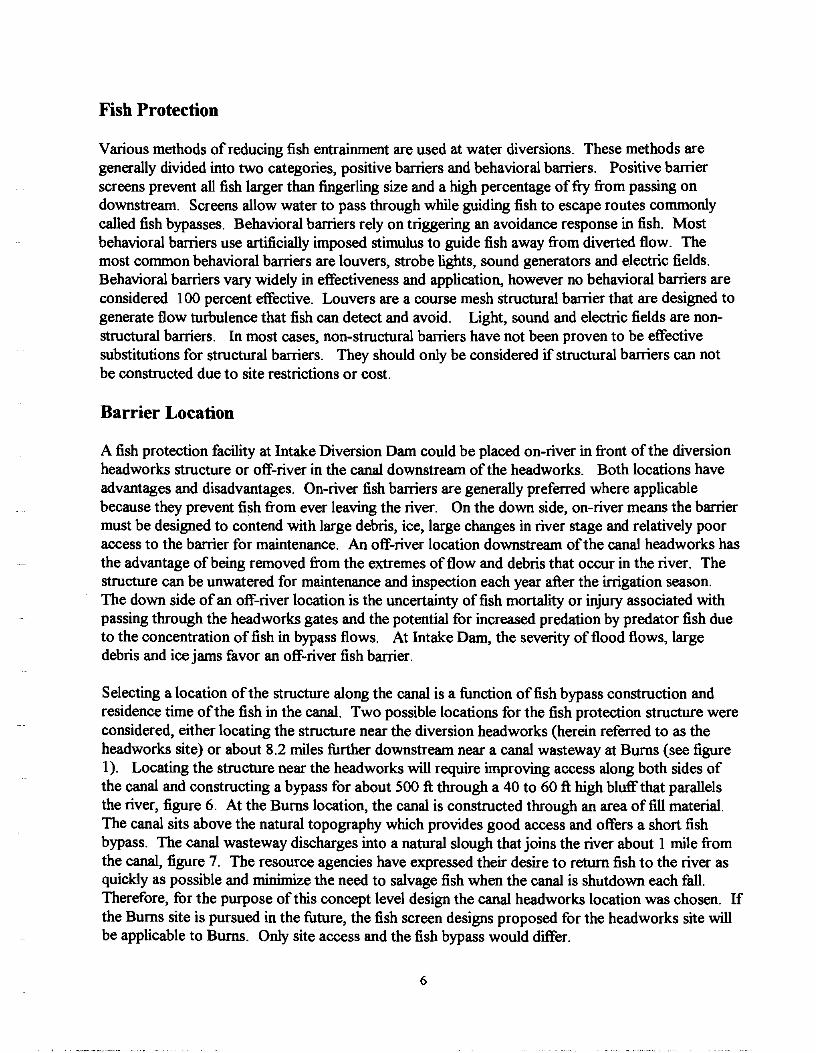
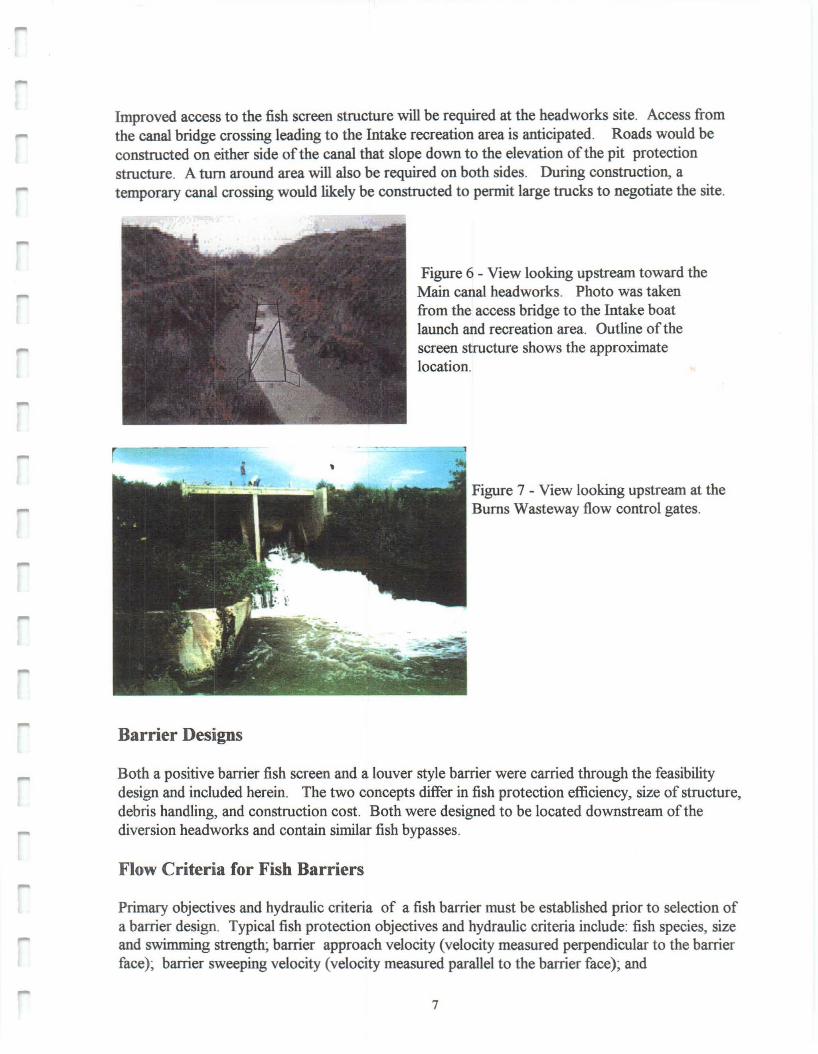
Selecting a location ofthe structure along the canal is a function offish bypass construction andresidence time ofthe fish in the canal. Two possible locations for the fish protection structure wereconsidered, either locating the structure near the diversion headworks (herein referred to as theheadworks site) or about 8.2 miles further downstream near a canal wasteway at Bums (see figure1). Locating the structure near the headworks will require improving access along both sides ofthe canal and constructing a bypass for about 500 ft through a 40 to 60 ft high bluff that parallelsthe river, figure 6. At the Bums location, the canal is constructed through an area of fill material.The canal sits above the natural topography which provides good access and offers a short fishbypass. The canal wasteway discharges into a natural slough that joins the river about 1 mile fromthe canal, figure 7. The resource agencies have expressed their desire to return fish to the river asquickly as possible and minimize the need to salvage fish when the canal is shutdown each fall.Therefore, for the purpose of this concept level design the canal headworks location was chosen. Ifthe Bums site is pursued in the future, the fish screen designs proposed for the headworks site willbe applicable to Bums. Only site access and the fish bypass would differ.
6
hnproved access to the fish screen structure will be required at the headworks site. Access fromthe canal bridge crossing leading to the Intake recreation area is anticipated. Roads would beconstructed on either side of the canal that slope down to the elevation of the pit protectionstructure. A turn around area will also be required on both sides. During construction, atemporary canal crossing would likely be constructed to permit large trucks to negotiate the site.
Figure 6 - View looking upstream toward theMain canal headworks. Photo was takenfrom the access bridge to the Intake boatlaunch and recreation area. Outline of thescreen structure shows the approximatelocation.
Figure 7 - View looking upstream at theBurns Wasteway flow control gates.
Barrier Designs
Both a positive barrier fish screen and a louver style barrier were carried through the feasibilitydesign and included herein. The two concepts differ in fish protection efficiency, size of structure,debris handling, and construction cost. Both were designed to be located downstream of thediversion headworks and contain similar fish bypasses.
Flow Criteria for Fish Barriers
Primary objectives and hydraulic criteria of a fish barrier must be established prior to selection ofa barrier design. Typical fish protection objectives and hydraulic criteria include: fish species, sizeand swimming strength; barrier approach velocity (velocity measured perpendicular to the barrierface); barrier sweeping velocity (velocity measured parallel to the barrier face); and
7
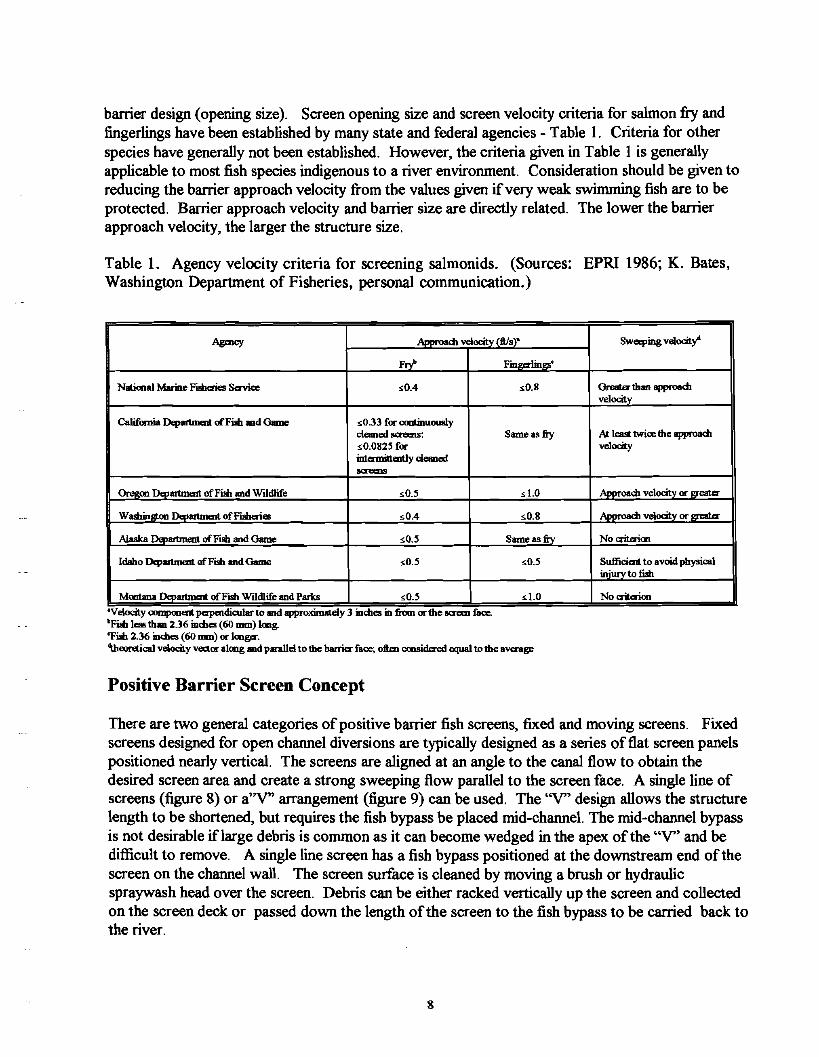
barrier design (opening size). Screen opening size and screen velocity criteria for salmon try andfingerlings have been established by many state and federal agencies - Table 1. Criteria for otherspecies have generally not been established. However, the criteria given in Table 1 is generallyapplicable to most fish species indigenous to a river environment. Consideration should be given toreducing the barrier approach velocity from the values given ifvery weak swimming fish are to beprotected. Barrier approach velocity and barrier size are directly related. The lower the barrierapproach velocity, the larger the structure size.
Table 1. Agency velocity criteria for screening salmonids. (Sources: EPRI 1986; K. Bates,Washington Department of Fisheries, personal communication.)
AgaIcy velocitv (Ills)' Swe<ping velocity'
Fro! Finv.erlin2ll'
National Marine Fi!beries Scni<e <0.4 <0.8 0re8Ia" th.. approadtvelocitv
California~ ofFish ..d Game <0.33 for oontinuouslycleaned ocrems: Same as fty Alleasl twice tbe approadt<0.0825 for velocityintennittwtJy cleanedoaems
Oregon l>qJlIrtnI<nt ofFish and Wildlife <0.5 <1.0 ADDroadt velocitv or ereata"
WIllIhin~ l>qJlIrtnI<nt ofFisheries <0.4 <0.8 .•. velocity or_
Alaska l>qJlIrtnI<nt ofFish and Game <0.5 Same as fry Noaiterion
Idaho DqoIlllmaJl ofFish and Game <0.5 <0.5 Sufficimllo avoid physicaliniurv to fish
Montana Dqoartment ofFish Wildlife and ParI<s <0.5 <1.0 Noaiterion.Velocity~mlpapendiadar to and approximately 3 meltes m from or the ........ liloe.'Fish I... th.. 2.36 ineltes (60 mm) long.'Fish 2.36 indtes (60 mm) or longer.'theontical velocity veaor along ..d parallel 10 the barrie< faoe; ollm considered equal to the aven8l'
Positive Barrier Screen Concept
There are two general categories ofpositive barrier fish screens, fixed and moving screens. Fixedscreens designed for open channel diversions are typically designed as a series offlat screen panelspositioned nearly vertical. The screens are aligned at an angle to the canal flow to obtain thedesired screen area and create a strong sweeping flow parallel to the screen face. A single line ofscreens (figure 8) or a''V'' arrangement (figure 9) can be used. The "V" design allows the structurelength to be shortened, but requires the fish bypass be placed mid-channel. The mid-channel bypassis not desirable iflarge debris is common as it can become wedged in the apex ofthe "V" and bedifficult to remove. A single line screen has a fish bypass positioned at the downstream end of thescreen on the channel wall. The screen surface is cleaned by moving a brush or hydraulicspraywash head over the screen. Debris can be either racked vertically up the screen and collectedon the screen deck or passed down the length ofthe screen to the fish bypass to be carried back tothe river.
8
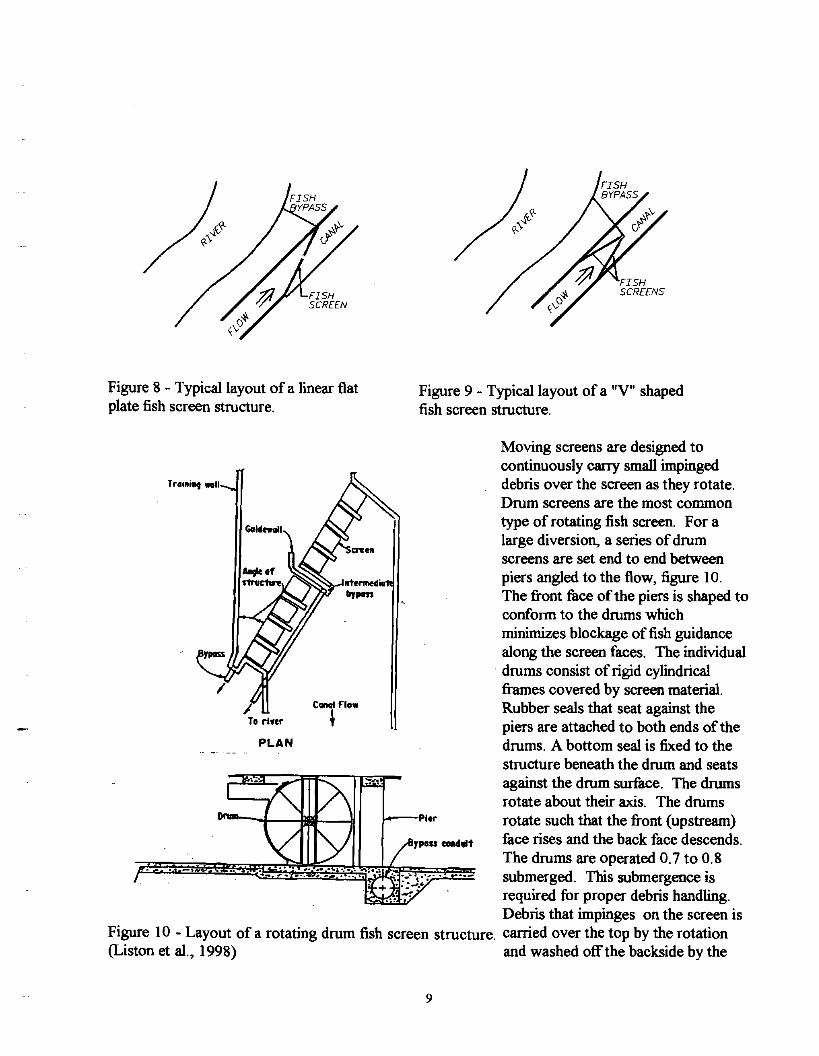
Figure 8 - Typical layout of a linear flatplate fish screen structure.
Figure 9 - Typical layout of a "V" shapedfish screen structure.
PLAN
To rife.
Training wotl
Moving screens are designed tocontinuously carry small impingeddebris over the screen as they rotate.Drum screens are the most commontype of rotating fish screen. For alarge diversion, a series of drumscreens are set end to end betweenpiers angled to the flow, figure 10.The front face of the piers is shaped toconform to the drums whichminimizes blockage of fish guidancealong the screen faces. The individual
. drums consist of rigid cylindricalframes covered by screen material.Rubber seals that seat against thepiers are attached to both ends of thedrums. A bottom seal is fixed to thestructure beneath the drum and seatsagainst the drum surface. The drumsrotate about their axis. The drumsrotate such that the front (upstream)face rises and the back face descends.The drums are operated 0.7 to 0.8submerged. This submergence isrequired for proper debris handling.Debris that impinges on the screen is
Figure 10 - Layout of a rotating drum fish screen structure. carried over the top by the rotation(Liston et al., 1998) and washed off the backside by the
9
through flow. This tends to be a very effective cleaning mechanism making drum screens a goodself cleaning design. Ifthe submergence drops much below 0.7, debris tends to not cling to andcarry over the drum but instead accumulates along the front face. Larger debris like logs can roll infront of the screen and require manual removal. Drums have been constructed ranging from a fewfeet up to 20 feet in diameter and from the typical 10 to 12 feet length up to 25 to 30 feet in length.
Recommended Screen Design
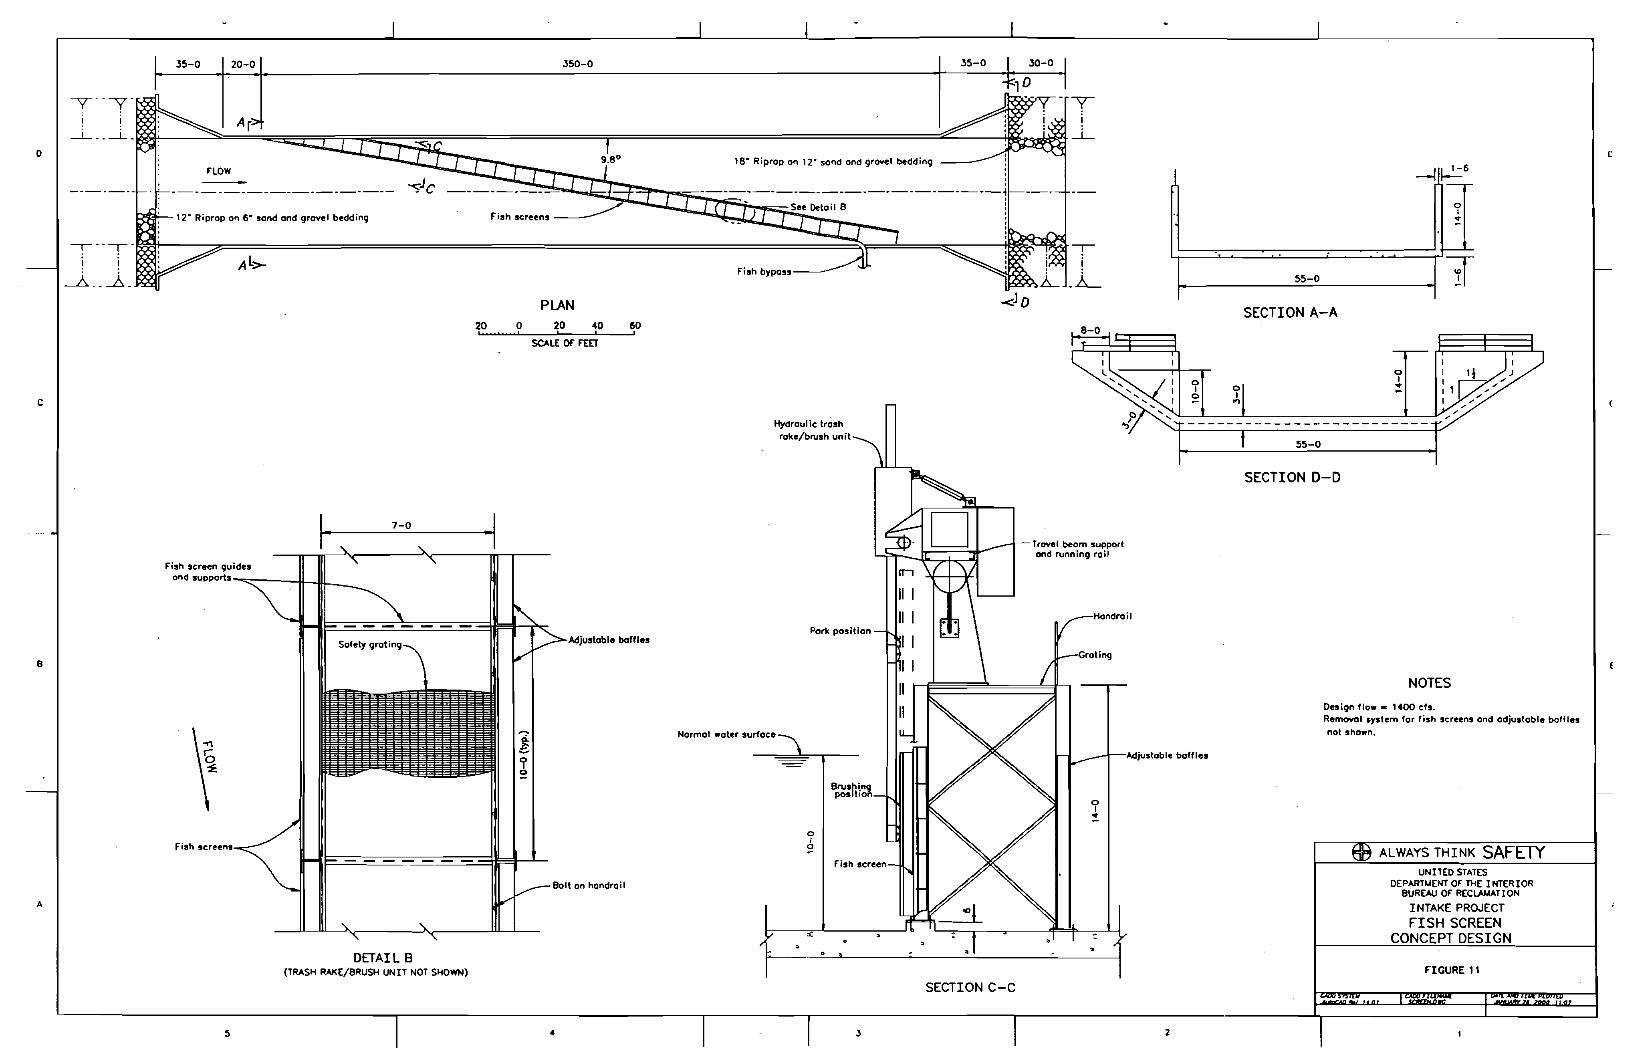
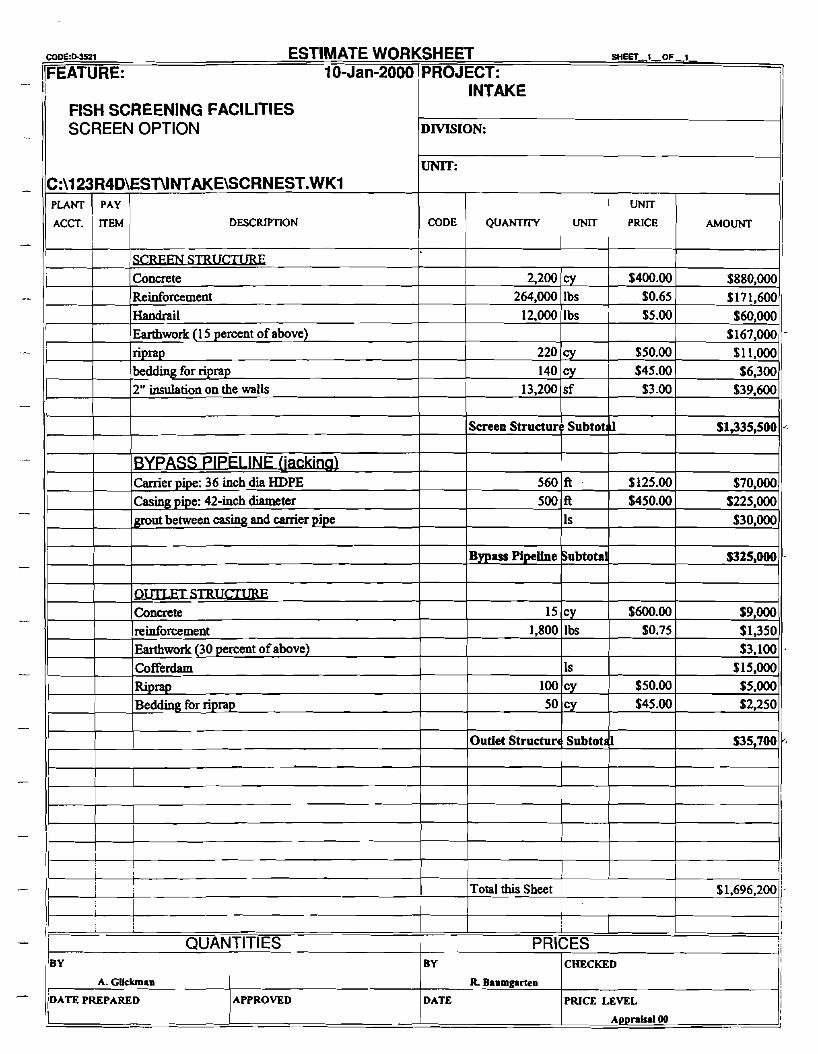
A flat plate linear screen structure is recommended as the best screen option for the Main Canal.The layout ofthe structure is shown in figure 11. The design requires a concrete flume 440 ft long,55ft wide and 14 ft deep be constructed within the existing canal prism, figure 11. Within theconcrete flume a 300 ft long and 10ft high screen and baffle structure angles across the channel at a9.8 degree angle. The screen structure is mounted on a 6 inch high concrete sill. The sill enhancesmovement ofbottom sediments toward the fish bypass entrance and reduces problems of cleaningthe screen area near the channel invert.
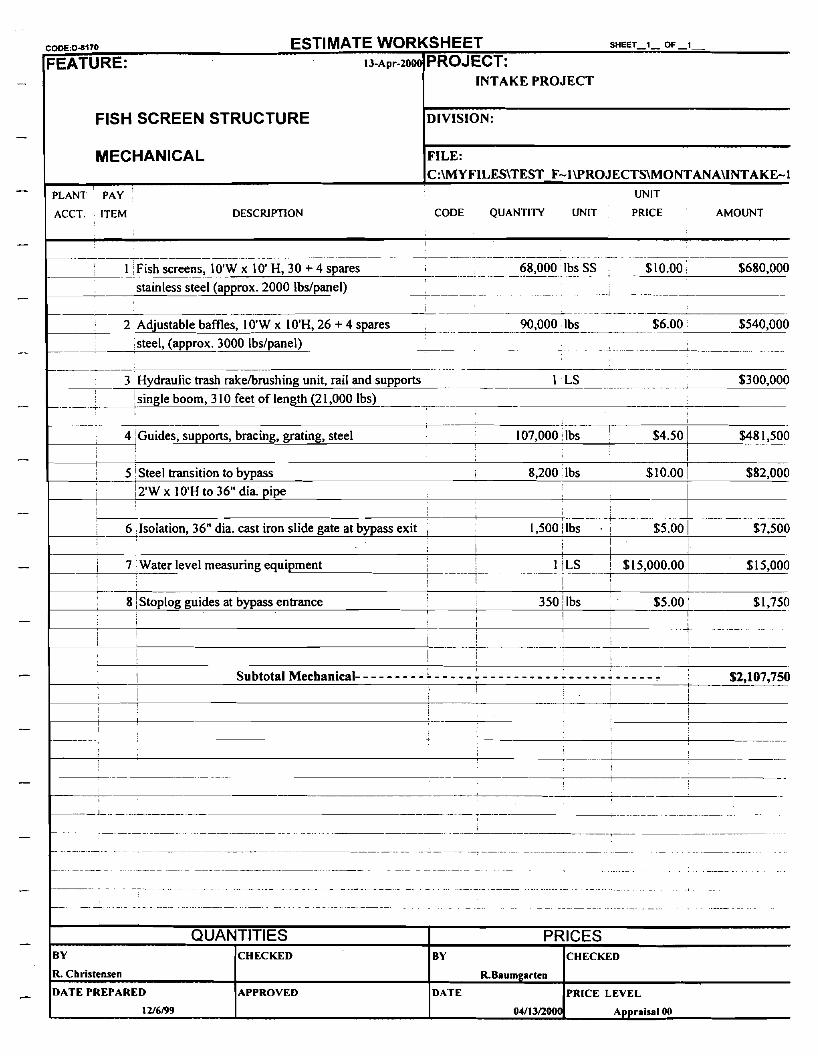
The screen structure is designed to pass 1,400 ft3/s with a screen approach velocity of 0.5 ft/s.Although several types of screen material are available, 3/32 opening stainless steel wedge wirescreen material with about a 50 percent porosity is recommended. This screen material is verydurable and will withstand the impact oflarger sticks that frequently enter the canal. Wedge wirescreen has been in use for many years at other fish screening facilities and has performed very well.The screen is designed with 10-ft-square panels each weighing 2,000 lbs mounted in vertical guides.As shown, the panels would be raised by mobile crane for removal or maintenance. A mobile cranecapable oflifting 3,000 lbs (weight ofbaffle panels) at a 40 ft reach would be required. Duringinitial construction of the screen panels up to four spare screen panels should be made. These couldbe installed ifpanels are damaged during the irrigation season.
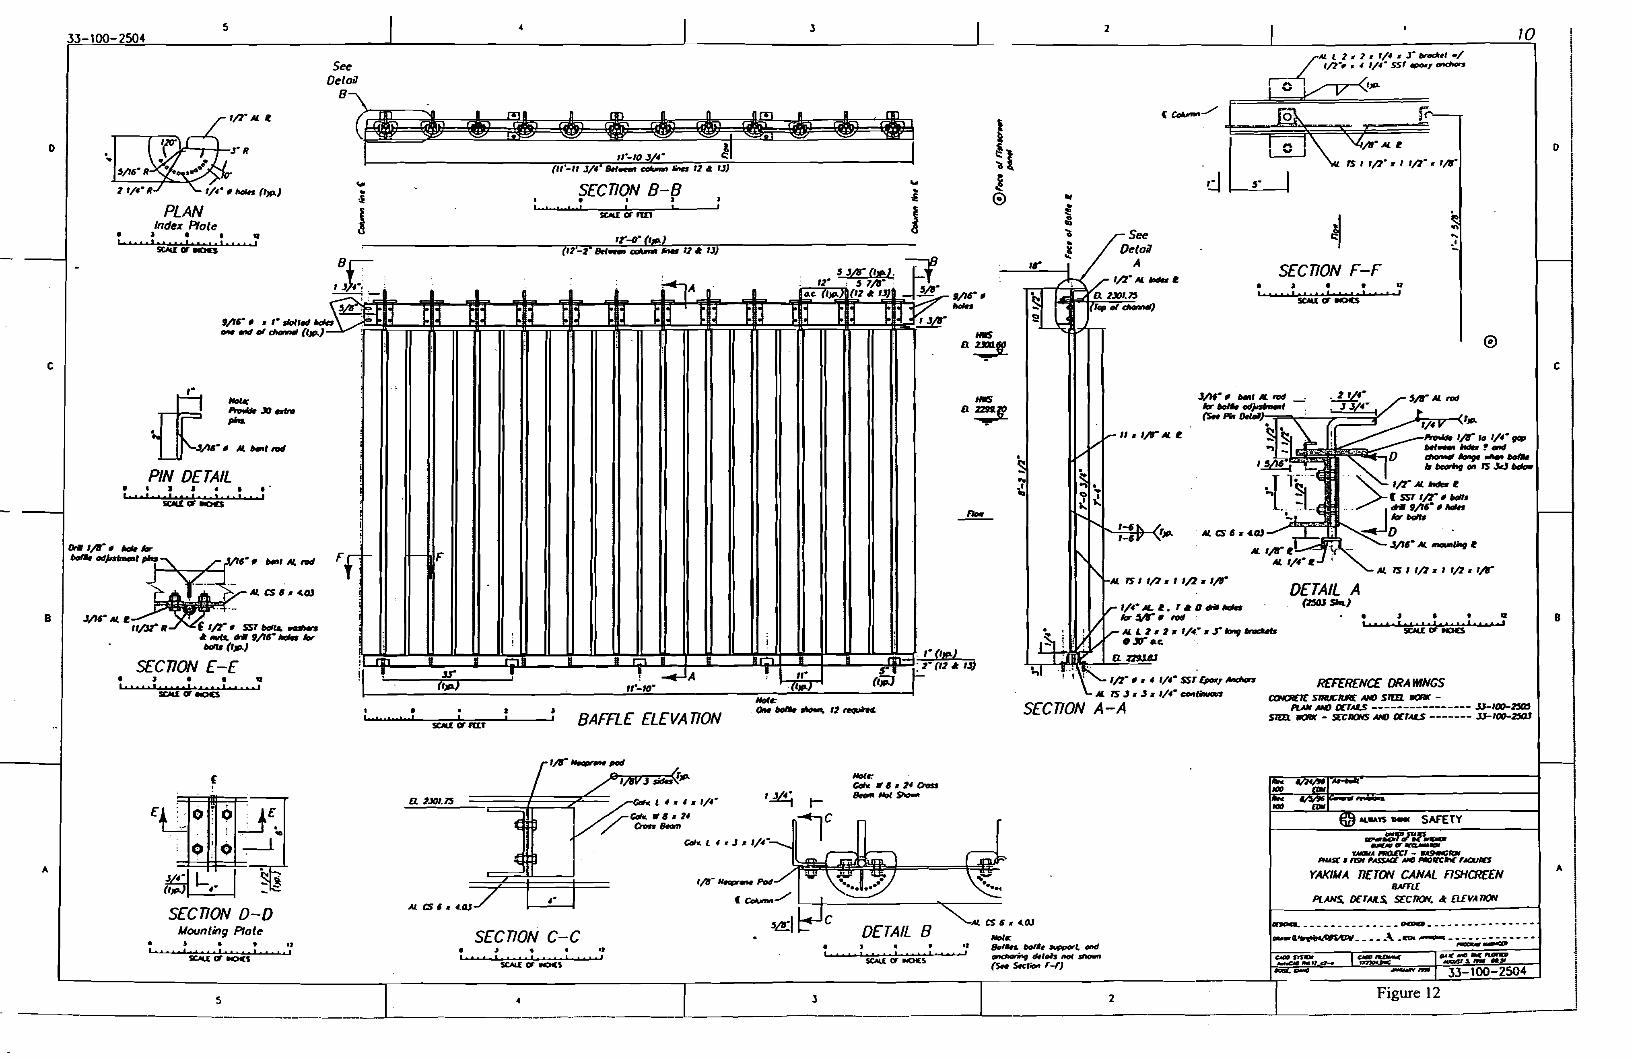
The screen is expected to cause about 0.3 ft or less ofwater surface drop (headloss) through thestructure. The majority of the headloss in a properly cleaned screen structure occurs at the baffles.Baffles are used to adjust the flow distribution passing through the screen. An even through-screenflow distribution is important to prevent high velocity hot spots from occurring that can cause fishimpingement and debris cleaning difficulties. Adjustable baffles are mounted parallel to the screenon the downstream side, see figure 11 section C-C. Baffles are typically 6-inch-wide to lO-inchwide steel plates with a pin mounted on each end to allow them to be rotated. A typical baffledesign used on the Yakima Tieton Canal Fish screen is shown in figure 12. Baffles are designed tocreate high resistance to the flow in areas where the canal approach velocity is high and lowresistance in areas where velocity is low. Flow between two baffles can be adjusted by rotating thebaffles to increase or decrease the opening between the baffles. The difference in flow resistancealong the structure caused by the baffles then forces a more uniform flow distribution through thefish screen. The greater the non-uniformity of flow velocity approaching the screen structure thetighter the baffles must be closed to even out the flow and the greater the headloss. The upstreambend in the canal and unbalanced inlet gate operation are factors that can create non-uniform flowvelocity upstream of the screen.
10
o c
FIGURE 11
NOTES
oI•
UNITEo STATESDEPARTt.fENT OF THE INTERIOR
BUREAU OF REClAt.tATION
INTAKE PROJECT
FISH SCREENCONCEPT DESIGN
ALWAYS THINK SAFETY
De'ign flow _ 1400 ef,.Removal system for fish screens and adjustable bofflesnot ,hawn.
SECTION 0-0
SECTION A-A
oI•
II I
II I
I I
I I
IIII
oI
o
Porit position
Hydraul ic trashrake/brush unit
Fi.h bypa••---
Normal water surface
60,
Adju.table baffle.
Bolt on handrail
PLAN
SCALE OF FEET
o 20 40, , ,
·1
20,
7-0
DETAIL 8(TRASH RAKE/BRUSH UN IT NOT SHOWN)
I·
Fish screen,
Fish screen CjJuidesond supports ...., __-j~_JIj.-__
------ --------------------
12" Riprop on 6- sand and grovel beddinCjJ
---.----,-~~-~===========================::::::;~~=h=~--~~~I I
--.A __ ...A_
C
A
B
SECTION C-C
5 • J 2
c
B
o
10
At rs, '/2' , '/2' '/11"
J • • "'shUJ.:ou' , . ,
.....
.'
• .J • • Q, I I, , I ,
SCAI: lIT oocs
DETAIL A(aJJ -.)
SECTION F-F
REFERENCE ORA'MNGSCDICIICIC SIJIUC/IIl£ AND srm lICRl' -
PLAN AND OCTM.S ---------------- »-,00-Z5Q5SIEEl. lICRl' - scr:~ AND OCTM.S ------- »-'00-Z9J.J
••
'/." IlL e. T ~ D tHI_ItT~" _
At. L Z • Z • '/4." • r """ _.»" a ..
2
'IZ" ••• '/." SST c,o.,-.At. rs J • J. ,/." _ ......
SECTION A-A
".
..i
J
.3
'r'-I1" ('p)
8AmE ELEVA TlON•I
SECTION 8-8. . ,I , ,
•I•,
, J ~.;
-l DA : '1" ,51ft":!/!"-----i ~ ....?ip] ('1 ~ U), . ,/I'
5ftn J tJ tiJ [ 13 [,J [ j t ° [ :l t 1:1 t j t j t J ]:{,/II"-.
:, D.
.D.
Ffl- i-- F
;
! ,I
.., . ," ('tel
'IJr , , ..... A ~ $" . 1" ('1 ~ tJ)
/I" I('JP.) ".-,0- ?i."..T (ijpJIII
'/1'". .,"-,.-.- - 01_ (tJP.)
PLANIndex Plate
, • • Q'I , , ••• I ,
PIN DETAIL• I J .. • •, • ' • ' • I ,. ,
Sl:'U lIT 000
5
•I
0.- '/11". _ ItT
- od~' phs"'\ L (/I'"" "." At -
J~:-i) At CS II • 4.1JJ
J/I'" Ate~SST/>dra. -.~ _ tH1 '/1'" _ ItT-. ('JP.)
SECTION E-E. ~ . ., , , , , • I • • ,
33-100-2504
o
c
B
. Ii.!:
~33-100-2504
SAfETY
--Figure 12
_=,.",...r_..." ara.AIM_r....,.. I'WOECT - WA9MlCItW
IIN.tSC • trSH 'ASSA« MIG IWOllCatC 'M:VIII.'S
YAKIAIA nETON CANAL FlSHCR££NBNnC
PlANS, OCTAltS, seCTION• .t aCVATION
I('SICIlQ,. .. ~ __ .. 0CI:lG • __ .. - - .. - - - -
...._I~ ..:\..1I'Dll""""'" - - -- -- .. ---2
-"80'''' bot.~ AflpCW"c, tJttd-"'odl/~""'_(SH 5«,,,,,, r -r)
"IDETAIL B
•I
.3
L " • f • ,/,.
r /Cdc .11.1'/ 0-_
Cdw. L f ,.J • ,/,,-
0'I• •
'~J .0.:5
SECTION C-C•I ••
D. 1.J01.15
--'--------._------
0'I
5
SECTION D-DAlountin9 Plate, .
I , , I •
{,
£tjI~,J/DIL" I .~ -!
A
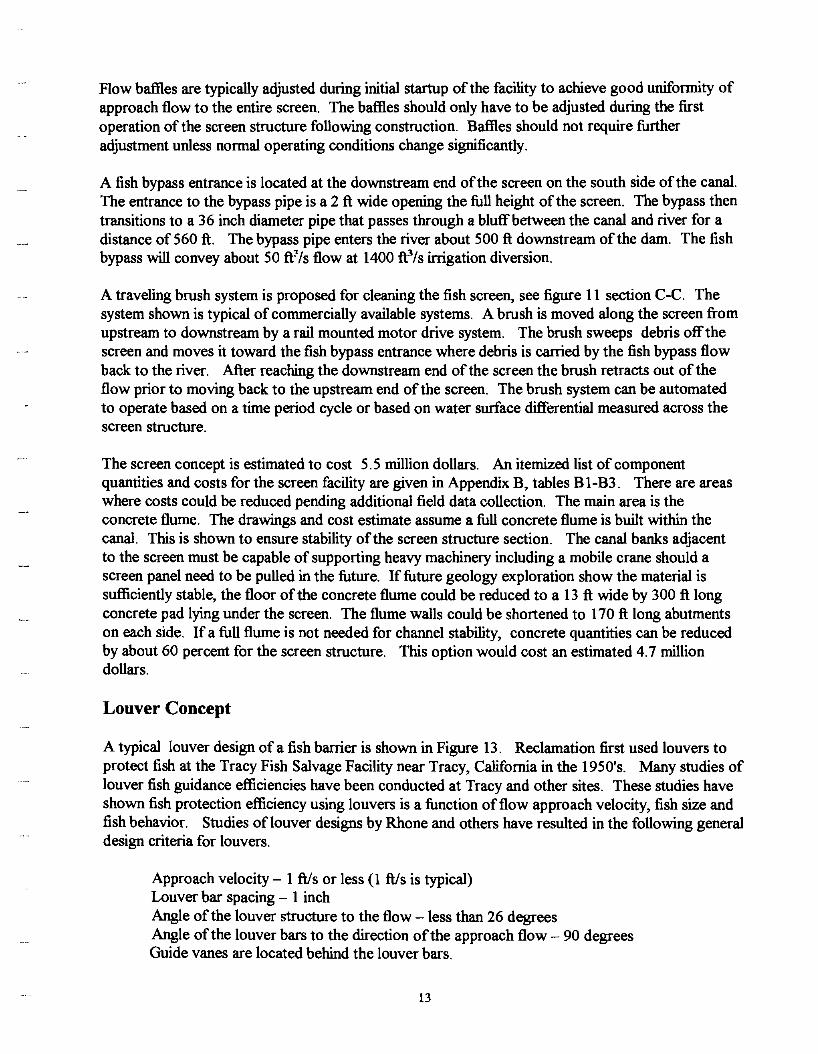
Flow baffies are typically adjusted during initial startup ofthe facility to achieve good uniformity ofapproach flow to the entire screen. The baffies should only have to be adjusted during the firstoperation of the screen structure following construction. Baffies should not require furtheradjustment unless normal operating conditions change significantly.
A fish bypass entrance is located at the downstream end ofthe screen on the south side ofthe canal.The entrance to the bypass pipe is a 2 ft wide opening the full height of the screen. The bypass thentransitions to a 36 inch diameter pipe that passes through a bluffbetween the canal and river for adistance of560 ft. The bypass pipe enters the river about 500 ft downstream of the dam. The fishbypass will convey about 50 ft~/s flow at 1400 W/s irrigation diversion.
A traveling brush system is proposed for cleaning the fish screen, see figure 11 section C-C. Thesystem shown is typical of commercially available systems. A brush is moved along the screen fromupstream to downstream by a rail mounted motor drive system. The brush sweeps debris offthescreen and moves it toward the fish bypass entrance where debris is carried by the fish bypass flowback to the river. After reaching the downstream end of the screen the brush retracts out of theflow prior to moving back to the upstream end of the screen. The brush system can be automatedto operate based on a time period cycle or based on water surface differential measured across thescreen structure.
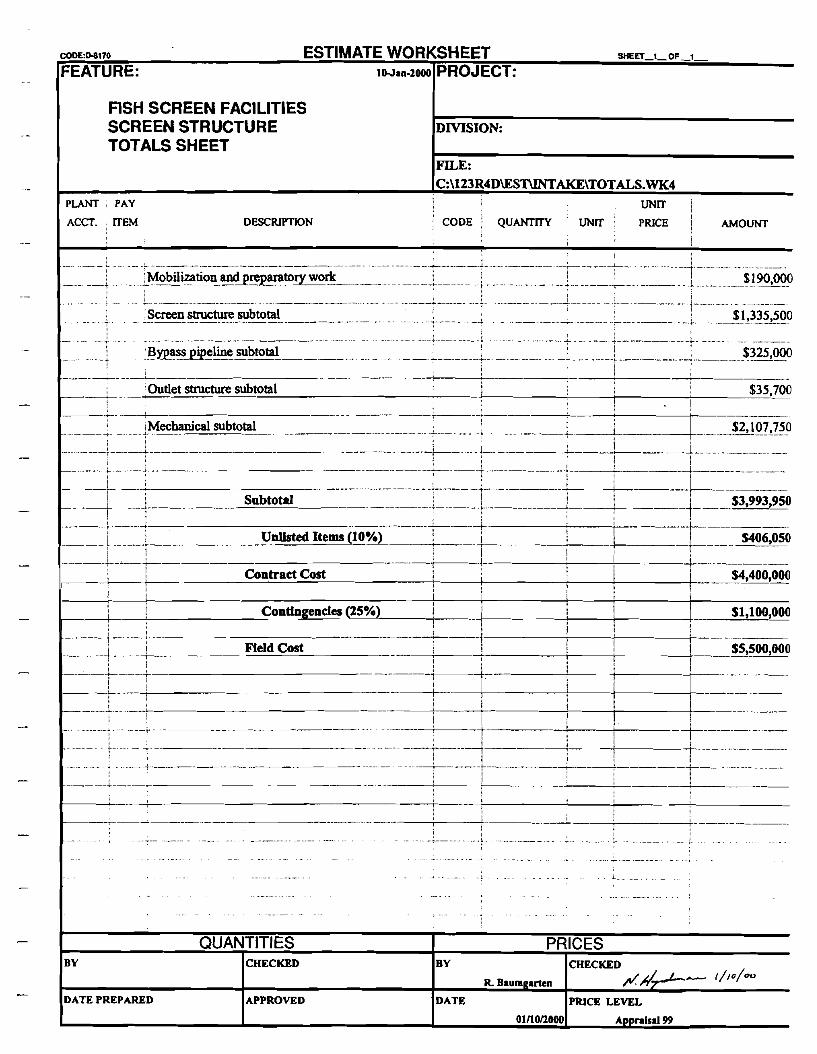
The screen concept is estimated to cost 5.5 million dollars. An itemized list of componentquantities and costs for the screen facility are given in Appendix B, tables B I-B3. There are areaswhere costs could be reduced pending additional field data collection. The main area is theconcrete flume. The drawings and cost estimate assume a full concrete flume is built within thecanal. This is shown to ensure stability ofthe screen structure section. The canal banks adjacentto the screen must be capable of supporting heavy machinery including a mobile crane should ascreen panel need to be pulled in the future. If future geology exploration show the material issufficiently stable, the floor of the concrete flume could be reduced to a 13 ft wide by 300 ft longconcrete pad lying under the screen. The flume walls could be shortened to 170 ft long abutmentson each side. If a full flume is not needed for channel stability, concrete quantities can be reducedby about 60 percent for the screen structure. This option would cost an estimated 4.7 milliondollars.
Louver Concept
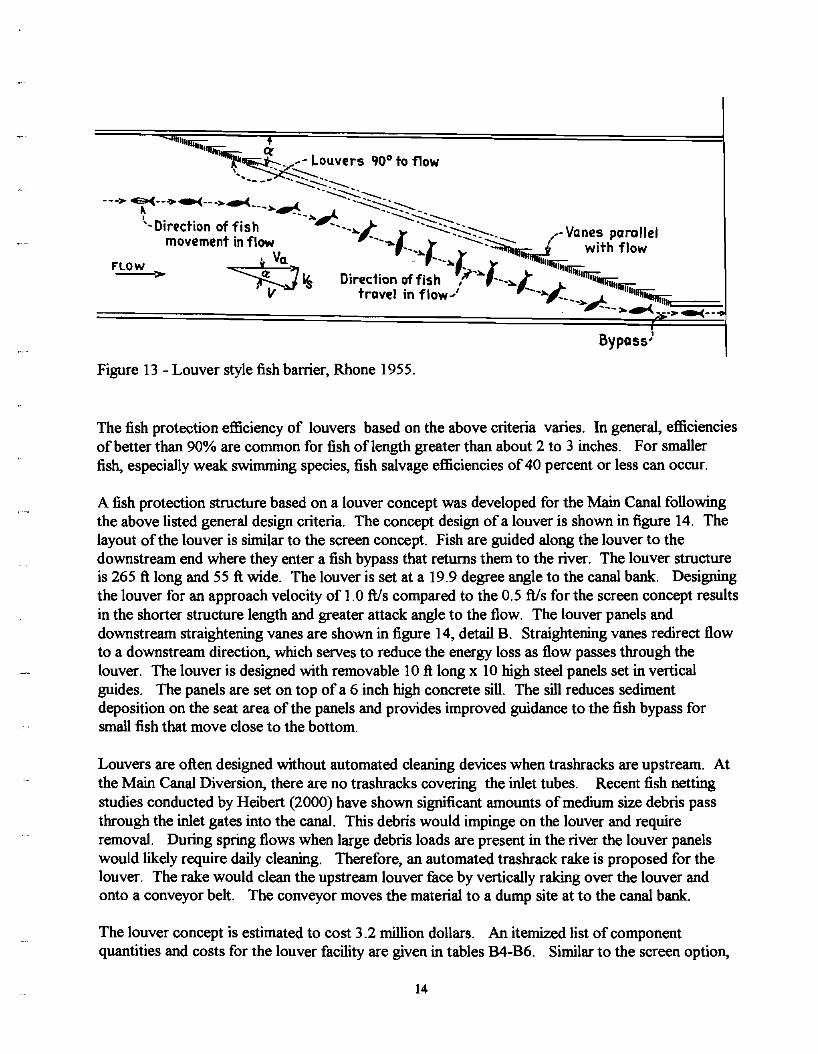
A typical louver design ofa fish barrier is shown in Figure 13. Reclamation first used louvers toprotect fish at the Tracy Fish Salvage Facility near Tracy, California in the 1950's. Many studies oflouver fish guidance efficiencies have been conducted at Tracy and other sites. These studies haveshown fish protection efficiency using louvers is a function offlow approach velocity, fish size andfish behavior. Studies oflouver designs by Rhone and others have resulted in the following generaldesign criteria for louvers.
Approach velocity - 1 ft/s or less (1 ft/s is typical)Louver bar spacing - 1 inchAngle of the louver structure to the flow - less than 26 degreesAngle ofthe louver bars to the direction ofthe approach flow - 90 degreesGuide vanes are located behind the louver bars.
13
IIIUIijj;::"1IIiiQ- ct'~~_/- Louvers qoo to flow
\ ..... ~~.....- -' .... ~-.:::=--'. "::::--::':'
---> ~--....-<---~-<---~~ --.::::..~-:::--."-Direction of!'ish -...~--~ ?~-:::-_. -Vanes parallel
movement In flow -....,--_...r ---.;:.~~{ with flow"LOW ~\Va. .' ,--_...r I- IllIiiiiiiIliiih.r ,~_ IlII1Qii::
--~ Q; ~ Direction of fish /,... ---~I:. ~ II~kqlllliih.:V travel in flow j --)".,---_::...-4.. 1I1
11't1liiii1111iiiiij.-::::::::=:==:1. -,-~-::..-<. --';'-<--
Bypass)
Figure 13 - Louver style fish barrier, Rhone 1955.
The fish protection efficiency of louvers based on the above criteria varies. In general, efficienciesofbetter than 90% are common for fish oflength greater than about 2 to 3 inches. For smallerfish, especially weak swimming species, fish salvage efficiencies of 40 percent or less can occur.
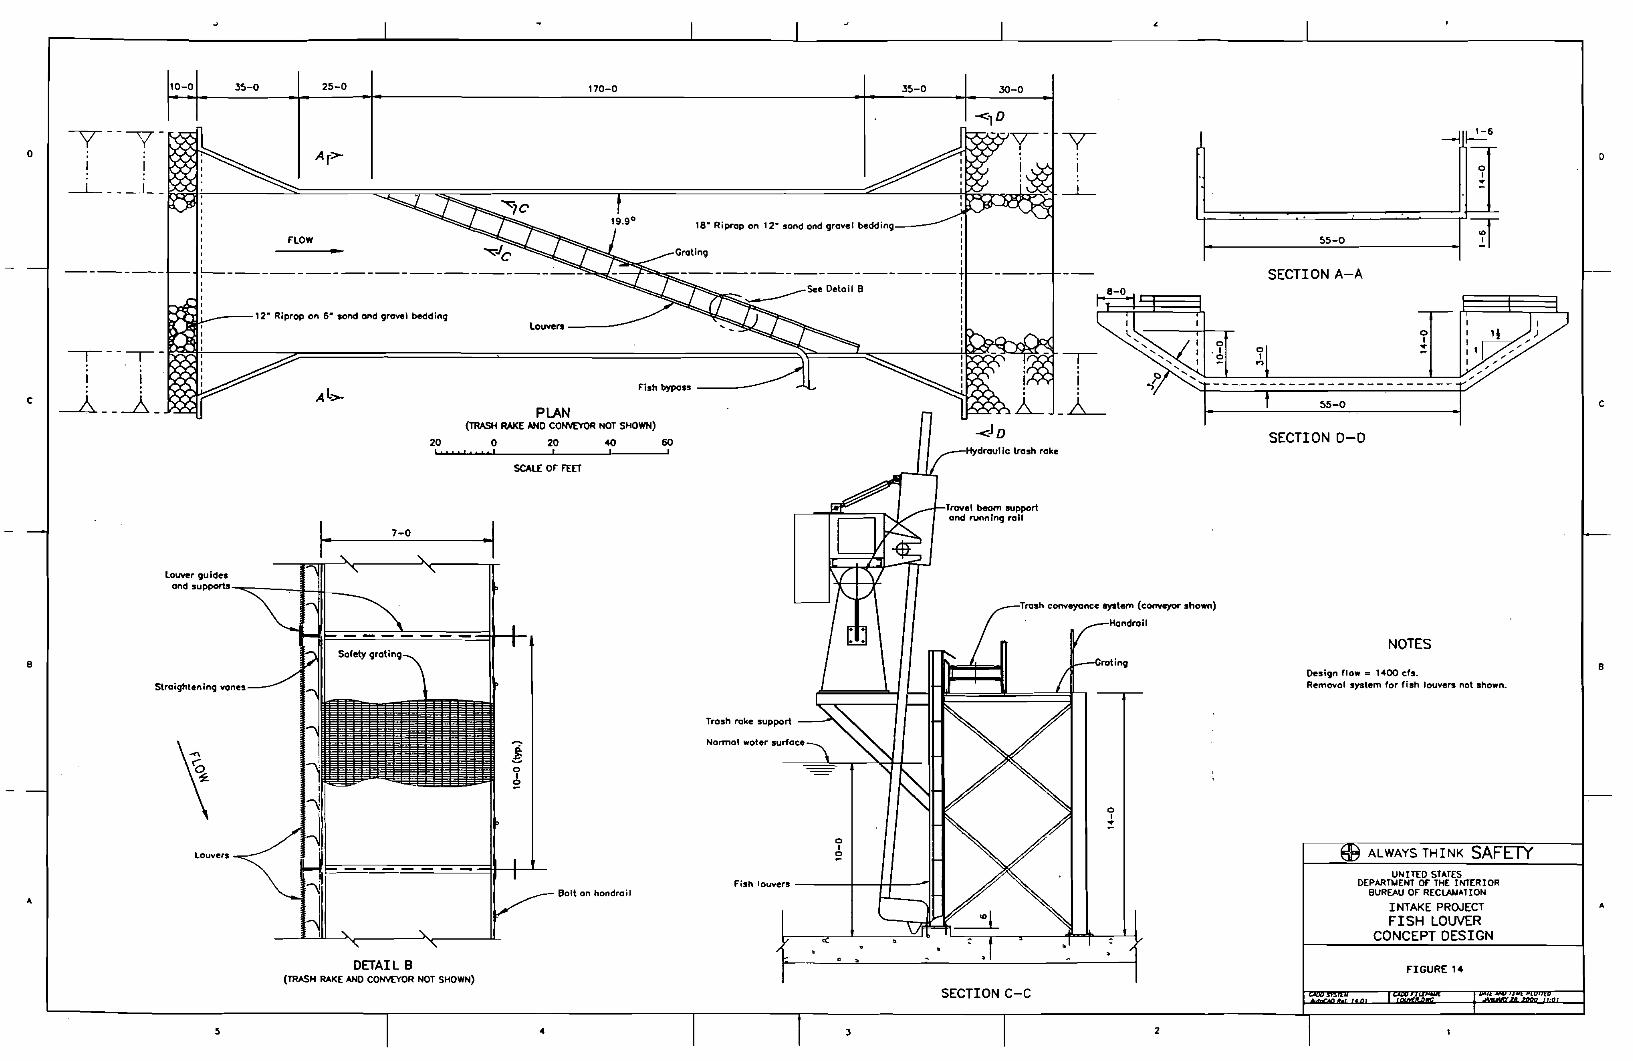
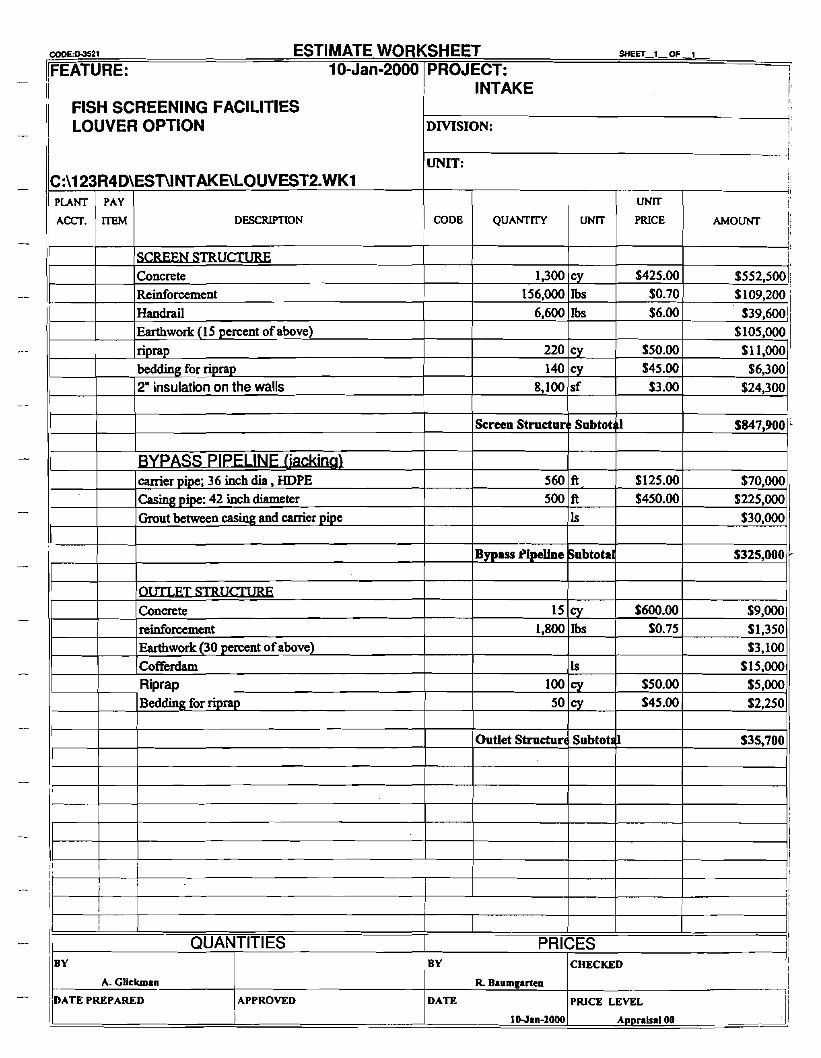
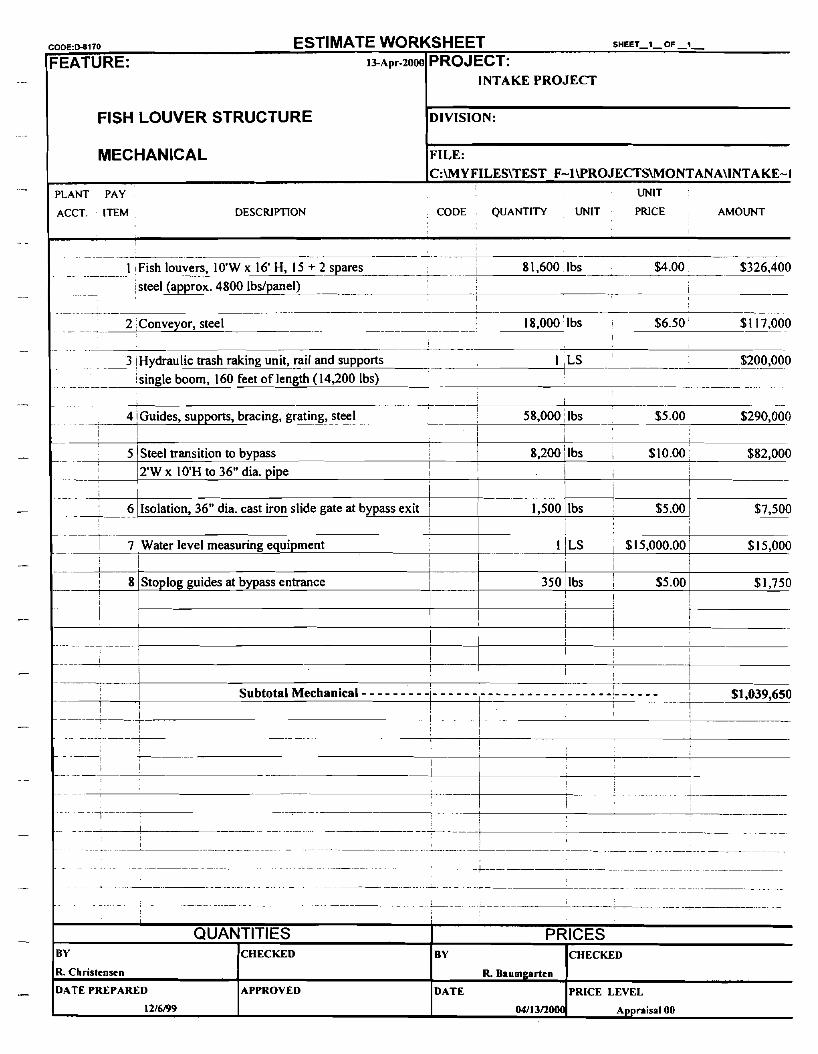
A fish protection structure based on a louver concept was developed for the Main Canal followingthe above listed general design criteria. The concept design ofa louver is shown in figure 14. Thelayout ofthe louver is similar to the screen concept. Fish are guided along the louver to thedownstream end where they enter a fish bypass that returns them to the river. The louver structureis 265 ft long and 55 ft wide. The louver is set at a 19.9 degree angle to the canal bank. Designingthe louver for an approach velocity of 1.0 ftJs compared to the 0.5 ftJs for the screen concept resultsin the shorter structure length and greater attack angle to the flow. The louver panels anddownstream straightening vanes are shown in figure 14, detail B. Straightening vanes redirect flowto a downstream direction, which serves to reduce the energy loss as flow passes through thelouver. The louver is designed with removable 10 ft long x 10 high steel panels set in verticalguides. The panels are set on top of a 6 inch high concrete sill. The sill reduces sedimentdeposition on the seat area of the panels and provides improved guidance to the fish bypass forsmall fish that move close to the bottom.
Louvers are often designed without automated cleaning devices when trashracks are upstream. Atthe Main Canal Diversion, there are no trashracks covering the inlet tubes. Recent fish nettingstudies conducted by Heibert (2000) have shown significant amounts of medium size debris passthrough the inlet gates into the canal. This debris would impinge on the louver and requireremoval. During spring flows when large debris loads are present in the river the louver panelswould likely require daily cleaning. Therefore, an automated trashrack rake is proposed for thelouver. The rake would clean the upstream louver face by vertically raking over the louver andonto a conveyor belt. The conveyor moves the material to a dump site at to the canal bank.
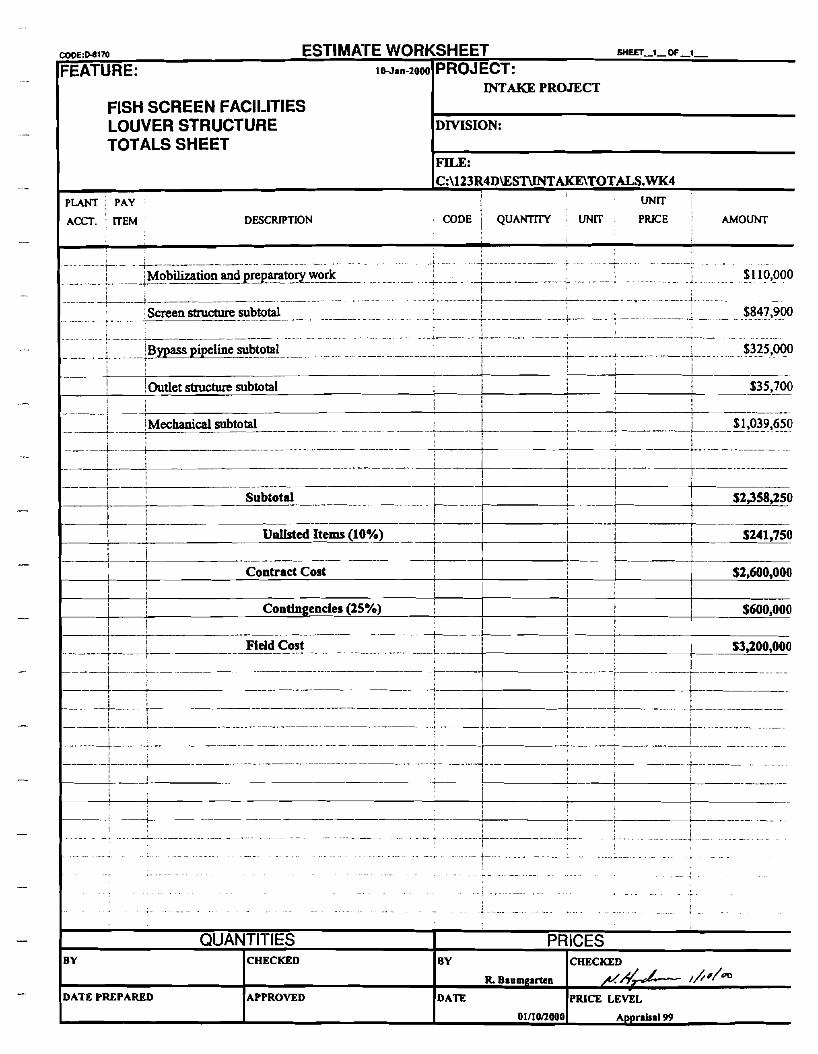
The louver concept is estimated to cost 3.2 million dollars. An itemized list of componentquantities and costs for the louver facility are given in tables B4-B6. Similar to the screen option,
14
the louver structure cost could be reduced if additional geology data supports constructing less thana full concrete flume. Iffuture geology exploration show the material is sufficiently stable, the floorof the concrete flume could be reduced to a 13 ft wide by 180 ft long concrete pad lying under thelouver. The flume walls could be shortened to about120 ft long abutments on each side. For thisscenario, concrete quantities can be reduced by about 50 percent and construction costs reduced toabout 2.8 million dollars for the louver structure.
Fish Passage Fishway Concepts
Three fishway concepts were considered for Intake Dam; a flume andbaftle fishway, a riprapchannel fishway and a long low gradient channel. The flume and baftle fishway and riprap channelfishway concepts are similar in that they are located on the south abutment of Intake dam withslopes of4 percent and 2 percent respectively. The low gradient fishway channel concept isdiscussed in the Lower Yellowstone River Fish Passage and Protection Study report (Mefford,January, 1999). This concept would construct a new channel from the toe of Intake Dam in asouth westerly direction and join the high flow channel. The resulting fishway would be a 3.6 milelong channel with a slope of about 0.04 percent.
Only the first two fishway concepts are presented herein with concept level designs and costestimates. To develop a concept level design for the low gradient channel will require additionalsurvey and geological data.
In conjunction with constructing a fishway, it is recommended that the dam crest near the northbank be raised with riprap to discourage fish passage up the north bank. Fish often hug a river bankto escape high velocity flow. At Intake Dam the riprap downstream of the crest appears to be at aflatter slope near the north bank.. This could cause two problems for fish passage. First, theexisting dam shape may create flow conditions that attract fish to the north bank. ofthe river andaway from a future fishway on the south bank.. Second, fish passage along the north river bankleads the fish directly in front of the Main Canal headworks where entrainment with the canaldiversion flow is likely. Canal entrainment studies by Heibert (January, 2000) support this theory.Heibert's study shows the downstream most gate on the canal headworks entrains the largestpercentage of the fish.
Flume and Baffle Fishway Concept
A fishway concept design using a dual-vertical-slot baftle is shown in Figure 14. The fishway uses aseries ofbaftles to break the drop over the dam into smaller increments. The fishway design isbased on a design river flow range of 5,000 to 40,000 ftl/s. The estimated stage dischargeelevations upstream and downstream of the dam are given in Table AI. The low river conditionresults in a maximum water surface differential across the dam of5.2 ft. The criteria used in thebaflle fishway concept design are:
15
10-0 35-0 25-0 170-0 35-0 30-0
A
o
C
B
FIGURE 14
ALWAYS THINK SAFElYUNITED STATES
DEPARTMENT OF THE INTERIORBUREAU OF REClA/olAnON
INTAKE PROJECTFISH LOWER
CONCEPT DESIGN
NOTES
oI...
~~6--
55-0
55-0
Design flow = 1400 cfs.Removal system for fish louvers not shown.
SECTION D-D
SECTION A-A
4==::::::==="""::::=======::::::::;:::==~-'--
!f
or...
Trosh conveyance system (conveyor shown)
Handrail
SECTION C-C
•
oI
o
Fish louvers ----+--++--"11
Normal woter surface
Trash rake support
18· Riprap on 12- sand and gravel bedding----
Fish t>yposs
-~-----------------+
Bolt on handrail
Louvers -----
SCALE OF FEET
·1
PLAN(TRASH RAKE AND CONVEYOR NOT SHOWN)
o 20 40 60III , I ,
20,
7-0
•flOW
DETAIL 8(TRASH RAKE AND CONVEYOR NOT SHOWN)
,~_--12· Riprop on 6- sand and grovel bedding
,,,,,I,,-:--------------------------------
Louvers
louver gu idesand suPports~,,:_--.,..._f_lIl-_~
I·
Straightening vones
y--y-1X)Qt;::::::-...
1
-----L- - - _1- - ~*--------=::::S:::::::===~=r::::::::;;;;;~=======r===========::;;;::::---~~~~
----r --T -~~-------=:::::;:::::================~~~~:::::--~*~~. ,I
----L __ --L. _
o
A
C
B
5 2
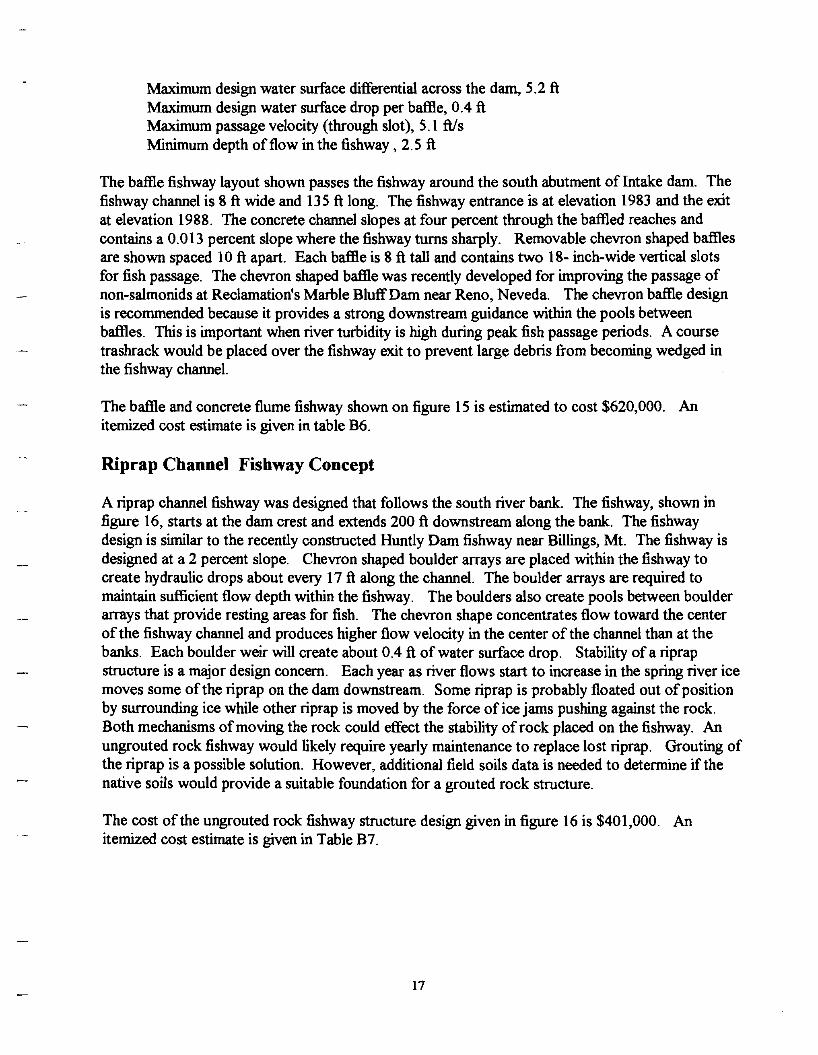
Maximum design water surface differential across the dam, 5.2 ftMaximum design water surface drop per baffie, 0.4 ftMaximum passage velocity (through slot), 5.1 ftlsMinimum depth offlow in the fishway ,2.5 ft
The baffie fishway layout shown passes the fishway around the south abutment of Intake dam. Thefishway channel is 8 ft wide and 135 ft long. The fishway entrance is at elevation 1983 and the exitat elevation 1988. The concrete channel slopes at four percent through the baffied reaches andcontains a 0.013 percent slope where the fishway turns sharply. Removable chevron shaped baffiesare shown spaced 10 ft apart. Each baffie is 8 ft tall and contains two 18- inch-wide vertical slotsfor fish passage. The chevron shaped baffie was recently developed for improving the passage ofnon-salmonids at Reclamation's Marble BluffDam near Reno, Neveda. The chevron baffie designis recommended because it provides a strong downstream guidance witmn the pools betweenbaffies. TlUs is important when river turbidity is mgh during peak fish passage periods. A coursetrashrack would be placed over the fishway exit to prevent large debris from becoming wedged inthe fishway channel.
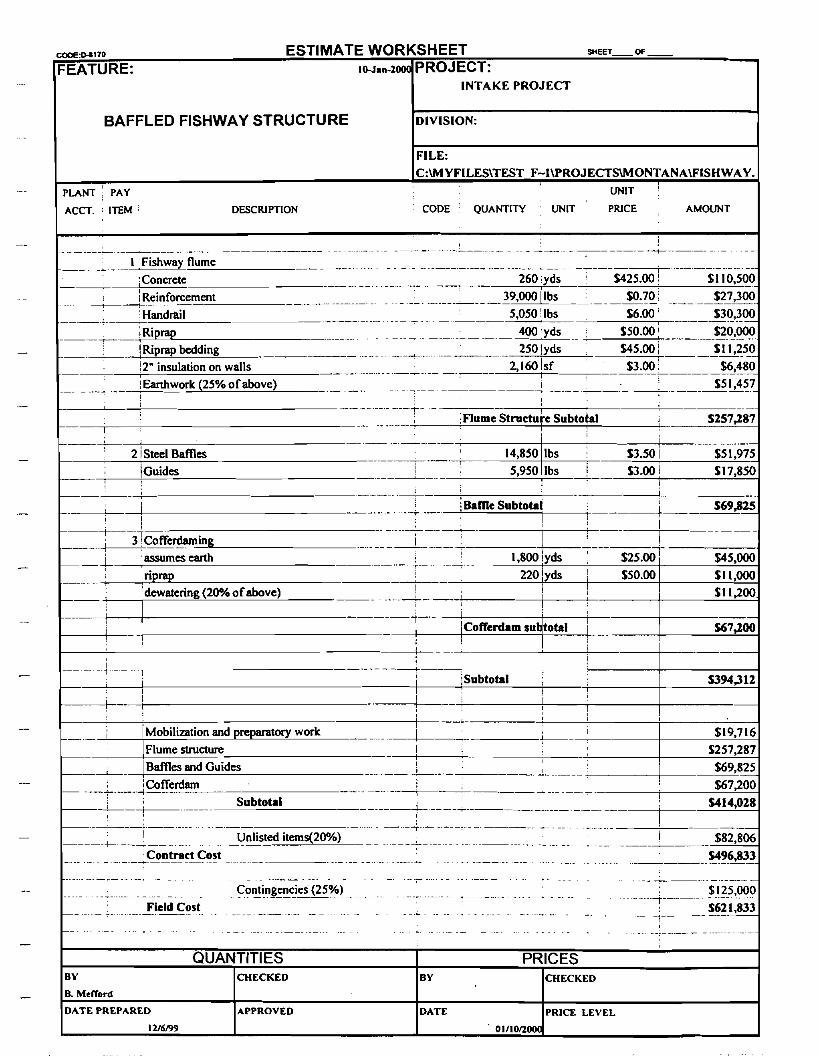
The baffie and concrete flume fishway shown on figure 15 is estimated to cost $620,000. Anitemized cost estimate is given in table B6.
Riprap Channel Fishway Concept
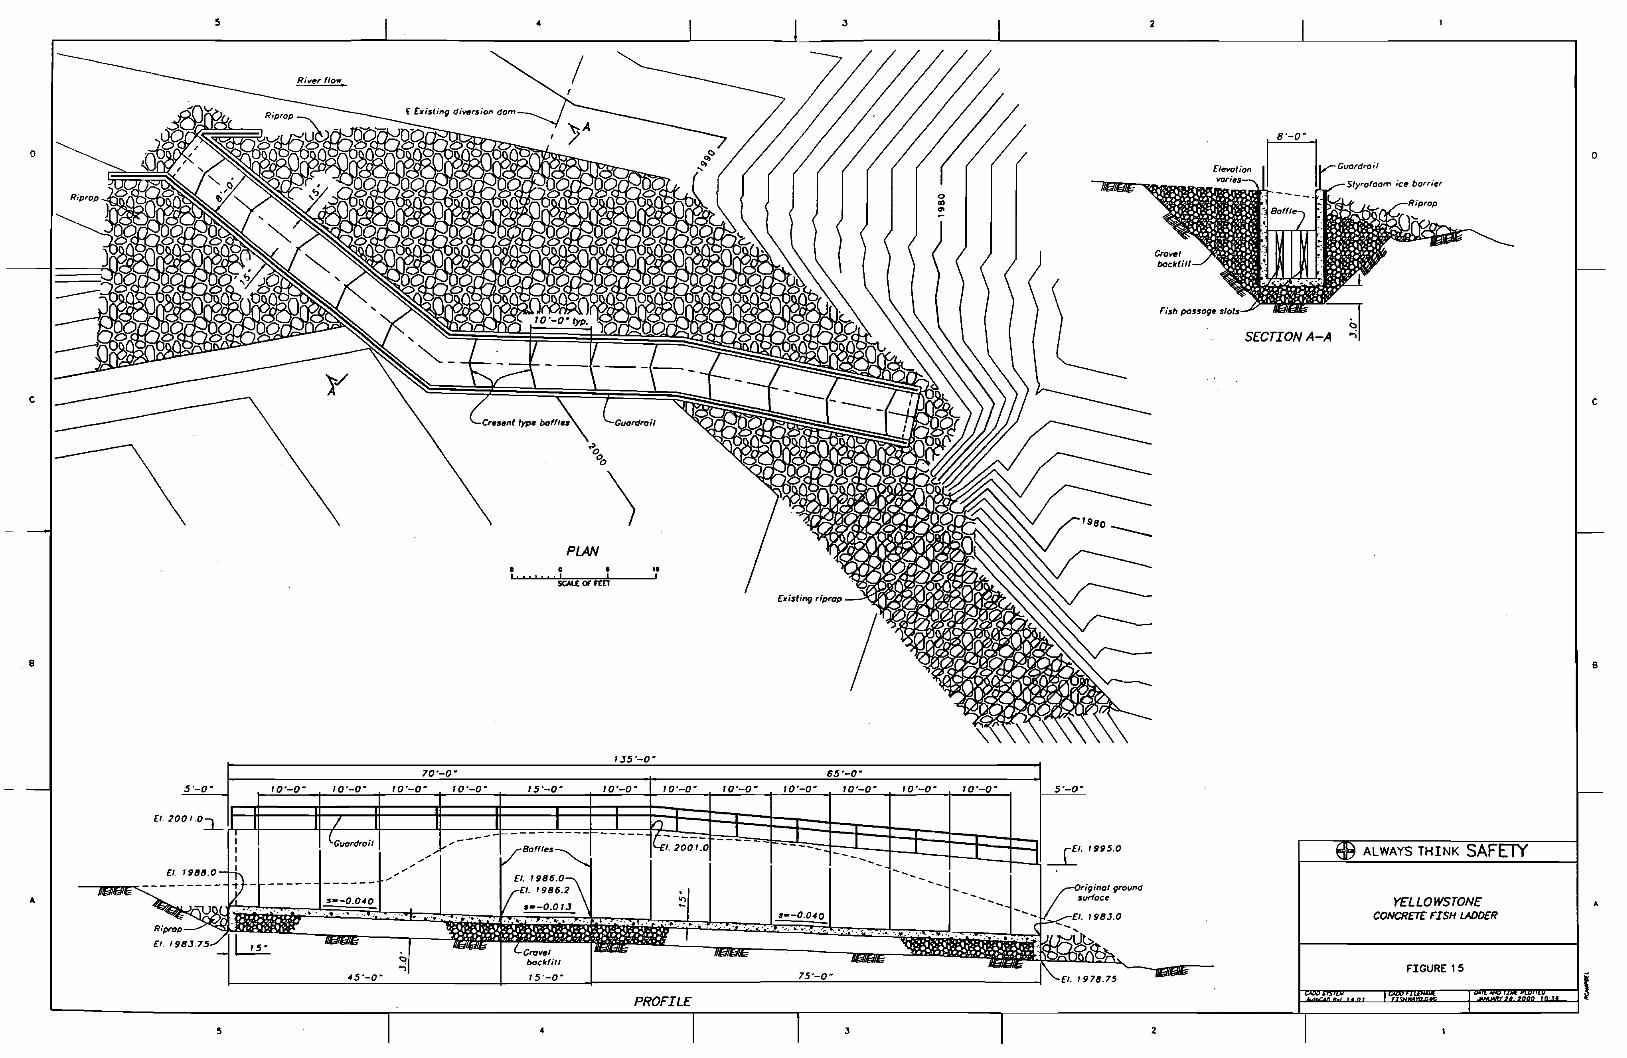
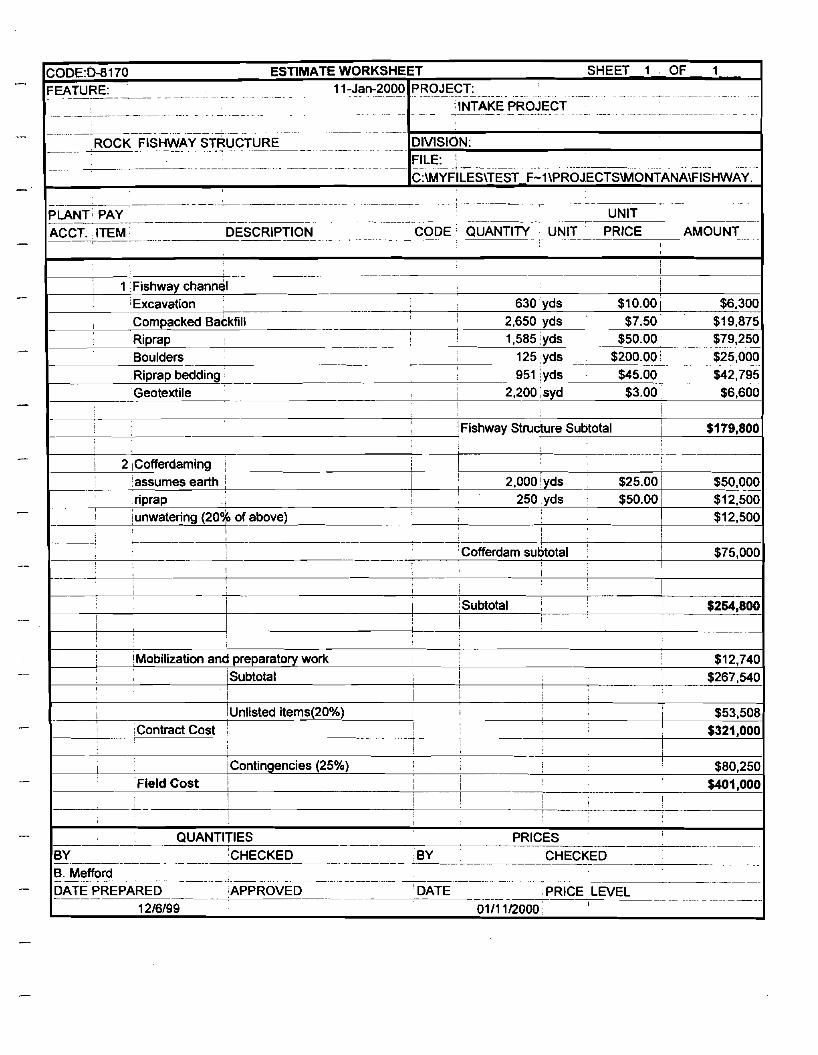
A riprap channel fishway was designed that follows the south river bank. The fishway, shown infigure 16, starts at the dam crest and extends 200 ft downstream along the bank. The fishwaydesign is similar to the recently constructed Huntly Dam fishway near Billings, Mt. The fishway isdesigned at a 2 percent slope. Chevron shaped boulder arrays are placed witmn the fishway tocreate hydraulic drops about every 17 ft along the channel. The boulder arrays are required tomaintain sufficient flow depth witlUn the fishway. The boulders also create pools between boulderarrays that provide resting areas for fish. The chevron shape concentrates flow toward the centerof the fishway channel and produces mgher flow velocity in the center of the channel than at thebanks. Each boulder weir will create about 0.4 ft of water surface drop. Stability of a riprapstructure is a major design concern. Each year as river flows start to increase in the spring river icemoves some of the riprap on the dam downstream. Some riprap is probably floated out ofpositionby surrounding ice wmle other riprap is moved by the force of ice jams pushing against the rock.Both mechanisms ofmoving the rock could effect the stability of rock placed on the fishway. Anungrouted rock fishway would likely require yearly maintenance to replace lost riprap. Grouting ofthe riprap is a possible solution. However, additional field soils data is needed to determine if thenative soils would provide a suitable foundation for a grouted rock structure.
The cost of the ungrouted rock fishway structure design given in figure 16 is $401,000. Anitemized cost estimate is given in Table B7.
17
o
c
B
5
River flo."
70'-0'
\PlAN
a • '1" ! I , ,
SCAlE OF nET
I.J5'-0·
J
65'-0'
2
Fish passage slots ~
SECTION A-A ~I
o
c
B
5'-0' 10'-0' 10'-0' 10'-0' 10'-0' 15 '-0' 10'-0' 10'-0' 10'-0' 10'-0' 10'-0' 10'-0' 10'-0' 5'-0'
A
5
45 '-0· 15'-0'
•
PROFILE
6--0,040••• Ii: • .~~ •• ,,',
75'-0'
J
--
2
ALWAYS THINK SAFETY
YELLOWSTONECONCRrrE FISH LADDER
FIGURE 15
~~==:~~~I
•
.--- --------...l---- 4 --L- J---J
-L2 L _
f
f'r. "
r~lq
~ ~~ ~;:.;.
i~10;-
~ ;:ir<""igittOl froutttI suri,,"
.~ !~C"""",'ocoP", rrop 01 betm _,w..1r-..
I 1"_ \ I I / I ,..S--o.OZ500. y_J_~_I-_..._!._ I .-1--A.1 ... I n\J ... I n I ..l, I n I n ,,<"Z:I
i 2:' , -0 '-'11- 05010 Z4" ~
'-, ~:,
! Dr 00 ,ipn1P,
jI
B
A
1000
1990
~ , 9110
'"~ '970... .
19110
1+00 1+00
PROFILE
~+OO
WEIR DETAIL
ALWAYS THINK SAFETY
YeLLOWSTONERIPRAP FISH~
FIGURE If.
4 J 2

Appendix AWater Surface Model Data
20
c
B
A
PlAN
0t:!, , , ! , , oyo "pO 10"I
ALWAYS THINK SAFETY
YELLOWSTONERIVER TOPOGRAPH't' NEAR INTAKE DAN
FIGURE A1
o
c
B
5 • J 2
Above Dam
11 Expanded view of Hec-Ras crosssection stations located near thediversion darn.
Upper reach
50
River Reach Sta. Reach Length, ft
Above Dam 16 906.4Above Dam 15 1179.8Above Dam 14 1368.7Above Dam 13 1700.1Above Dam 12 1590.0Above Dam 11 2230.5Above Dam 10 484.9Above Dam 9 515.7Above Dam 8 496.9Above Dam 7 100.0Above Dam 6.75 70.0Below Dam 6.6 50.0Below Dam 6.5 135.0
Below Dam 6.25 93.3Below Dam 6 1368.0Below Dam 5 907.7Below Dam 4 2108.2Below Dam 3 2243.4Below Dam 2 1269.0Below Dam 1
Figure A2 - Hec-Ras geometry plan showing cross-section locations within the reach of the Yellowstone River modeled
River =Yellowstone Reach =Above DamIntake Dlverslon Dam
RS= 15 River = Yellowstone Reach = Above DamIntake DiversIon Dam
RS= 14 River = Yellowstone Reach = Above DamIntake Dlverslon Dam
RS = 13
2002
•GnlInl
•BankSta
WS 4OlJOlI(1,4OO cis
WS 3()()()O{14OO cfs•
WS 15000 11400 cfs
WS 5000 I 0 ds
RS= 10
200 400 flOOo-600 -400 -200
Station (Il)
River = Yellowstone Reach = Above DamInlake Dlverslon Dam
2002 Legend
20001---------------~-----..r:=====::::;:"======-11998
1996€15 1994
1'992
1990
1988
1986
1984+-r~,....,..~~r_r_~r;_...,..............~~"T""'"~......;.~.........,-sao
Legend
Gnu1d•BankSta
WS 30000'1400 cis•
•
WS 4000Q(I,400 ds•
WS 15000 11400 ds
WS 5000 10 cfs
RS =11
200 400 600o-«Xl -400 ·200
StalIon (Il)
River = Yellowstone Reach = Above DamIntake DiversIon Dam
1990+-.-~,....,..~~;_._~.....;._,......:1~r"T""'..,......_i__r~.,....;..~......-;
-sao
1994
1992
2000.._-----------------.1
1998g
Legend
•Gnu1d
•BankSta
WS 40000I'1,400 cfs
WS 30000'1400 ds•
WS 15000 11400 ds
WS 5000 I 0 cfs
RS= 12
-«Xl -400 -200 flOO
. station (Il)
River = Yellowstone Reach = Above DamInlake Dlverslon Dam
2004
1998
1992
15 1996
1 1994UJ
.....GnlInl
•BankSta
WS 4OlJOlI(1,4OO cfs,WS 3()()()O{14OO cfs
It
Legend
WS 1500011400 cfs
WS 5000 I 0 cfs
flOO400200o-200-600
2000..---_
1995
1975
1970+--~......~....-j.~................~_;_r~,.......~,....,...,,...,...,-.-.-i-sao
WS 40000I1,400 cfs•
WS 30000'1400cfs
Gnu1d•Bar«Sta
Legend
WS 1500011400 cfs
WS 5000 I 0 cfs•
600400200o
, .
- ! _ ...
-«Xl -400 -200
1988
1986
1984+.-~,-r..~......;-~........;.~........,.........~.;.......~_j_,.~..-i-sao
2000 .1998
1996
•Gnu1d•
Bar«Sta
WS 40000I'1,400 cfs,WS 30000'1400 cfs
•
LegendII
WS 1500011400 cfs
WS 5000 I 0 cfs
~ ....
400 600200o
2000
1988 . _..,. - _ .
1990 .
1992 .
1998
1998
g1994
I
station (Il)
River = Yellowstone Reach = Above.DamInlake Divenllon Dam
RS=9
StalIon (II)
River = Yellowstone Reach =Above Dam .' RS =8Intake DiYer&lon Dam
station (Il)
River =Yellowstone Reach = Above DamInlake 0I\wsI0n Dam
RS=7
•
WS 4OlJOlI(1,4OO cfs•
WS 3()()()0{14OO cfs
GnlInl•
BankSta
II
WS 15000 11400 cfs
WS 5000 I 0 cfs
flOO400200-200 0
Station (Il)
-600 -400
2010
2015
2llO5
1990
1985
1960-t-.-~...._~..,..;~:')!!:"I~~~...,........~~~-sao
•Gnu1d•
Bank Sla
LegendIt
••
WS 30000'1400cfs
WS 40000I1,400 cfs
WS 15000 11400 cfs
WS 5000 I 0 cfs
flOO400200-200 0
SIaIion (Il)
-600 -400
1960
1985
2llO5
1995g
Gnu1d•
BankSla
WS 1500011400 cfs
WS 5000 I 0 cfs•
WS 40000I1,400 cfs
WS 30000'1400 cfs
LegendH
flOO400200-200 0
Station (Il)
1970+-~.....,.~~.........~.....,.~ ..........,.....~......,. ...................,.....~-...,-BOO -«Xl -400
1975
1995
2000_---,-to-.
1990g
Figure A3 - Hec-Ras model output of Yellowstone Rivercross-sections upstream of Intake Dam.
River =Yellowstone Reach =Below DamIntake Diversion Dam
RS=6.5 River = Yellowstone Reach =Below DamInlake Iii'/eI'Sion Dam
RS = 6.25 River = Yellowstone Reach = Below DamIntake DNersion Dam
RS=6
•Gnuld
•BankSta
WS 30000f1400 da
WS 4OOOOf1,400 da
WS 1500011400 cfs
WS5OOO/0da
400 eoo200o
2010
2020
1960
1970+--r~...~~-j-,-~-.-+~~..,......~.....~~...,.....~,........,-eoo -«Xl -400 -200
52000
iw 1990
WS 4()()00'1,4OO da
WS 3OOClOf14OO da•
Gnuld•
BankSta
Legend
WS 15OOO/1400da
WS 5OOO/Oda•
200 400 eooo1970+-"~.....~~-;-'~...,....j~~""~"""'""",,,~"";-'~.......,
-BOO -«Xl -400 -200
Legend 2020
WS 4()()00'1,400 da2010•
WS 3OOClOf1400 da
WS 1500011400 cfs g 2000
WS5OOO/0da i•GrluId 1990• w
BankSta
1960
2015
2010
2005
g2000
I 1995w
1990
1985
1960-BOO -«Xl -'lOO -200 0 200 400
StaIIon (It)
River =Yellowstone Reach =Below DamlnllIke DiYersIan Dam
RS=5
StalIon (ft)
River = Yellowstone Reach = Below DamInlake DlwnIion Dam
RS=4
StaIIon (ft)
River =Yellowstone Reach =Below DamIntake DiwrsIon Dam
RS=3
•
•Gnuld•
BankSta
WS 4OOOOf1,400 da
WS 30000f1400 da
WS 1500011400 da
WS5OOO/Oda
200 400 eooo
Gnuld
•BankSta
LegendIt
WS 4()()00'1.4OO da
WS 3OOOCY14OO da•
•
WS 15OOO/14OOda
WS5OOO/Oda
200 400 eooo
.... , . _ : :- .. -
1985
1990
2000 ....
1960
1995
Legend
WS 4()()00'1,400da•
WS 3OOOCY1400 da•
WS 15OOO/14OOda gWS 5000 IOda .§
• 1GrluId• w
BankSta- -
200 400 eooo1960+-,-~..-;-~~;-.,....,~--;-.~.........":;""~-i-r-~";-~"""";
-BOO -BOO -'lOO -200
2000
1985
1995 .
11990 ..
StaIIon (ft)
River =Yellowstone Reach = Below DamInlake DiYersIan Dam
RS=2
StaIIon (II)
River =Yellowstone Reach =Below DamInlake DI¥ersIon Dam
RS=1
StaIIon (It)
Gnuld•BankSta
WS 15OOO/14OOda
WS 5OOO/Oda
WS 40000'1,400 da
WS 3OOClOf14OO da
•
•
It
400200oSlation (It)
': ,-------.-=-=:=:.----,
400
.... :
200
.--'lOO -200 0
Station (It)
~~-----...,.........,.----t .,'-<------------i~-----..__--.J
1975.j-...,..~~......--~.....,.~~....,-~~......~~.,...~........,-«Xl
2000
1960
g::~' ... ""'"\.
Figure A4 - Hec-Ras model output of Yellowstone Rivercross-sections downstream of Intake Dam.
River = Intake canal Reach = Upper reachIntake 0Nersi0n Dam
RS =105 River = Intake Canal Reach = Upper reachIntake DiYerSlon Dam
RS =103 River = Intake Canal Reach =Upper reachIntake Diversion Dam
RS = 100
•
Ground•BankSta
•WS 5000 10 cf1I
Legend
Legend
II
•
•
Ground•Bank Sta
WS 3000Q(14OO cf1I
WS 3000Q(14OO cf1III
WS «XlOQIl,4OO cis
WS 5000 10 cf1I
WS 4OOOOt'1,4OO cf1I
WS 1500011400 cf1I
RS=70
WS 1500011400 cf1I
i
12040;20
.Station (II)
River = Intake Canal Reach = Upper reachIntake Diversion Dam
2020
•
lneff•
Bar* Sta
II
WS 4OOOl)(1,4OO cf1I
WS 5000 10 cfs
WS 1500011400 cfs
WS 3OllOlY14OO cf1I
2020
2010
gc.2 2000
11990
•
•WS 30000I1400 cfs
•
WS «XlOQIl,4OO cfs
WS 5000 10 cfs
WS 1500011400 cfsII
2020
2010
gc
i 2000
1990 ..
1980 1980 1980-20 0 20 40 60 eo 100 120 -20 0 20 40 60 60 100 120 0
Station (II) StaIion (It)
River = Intake canal Reach = Upperreach RS=90 River = Intake Canal Reach = Upper reach RS=80Intake Diwrslon Dam Intake DIverslon Dam
2020 - ....... .. f" ••• -. - •.••••• ~ •• - ••Legend 2030 •...... - _. - ••y" - •• -
Legend 2005;
2015 •WS 1500011400 cf1I
2020 .. ; _... WS 1500011400 cf1I 2000"
2010 ....,WS 3OOOQ(1400 cf1I WS 3OllOlY14OO cf1I
II 1995g 2005 ,. WS 4OOOOt'1,400 cf1I g 2010 WS 4OOOCIt'1,4OO cf1I g
I 2000 . .. --; .. .. .~ j WS 5000 10 cf1I I WS 5000 10 cf1I I 1990• •Ground 2000 ......_.. -- .- . _., Groundw 1995 '-i .. : • W • w
Bar* Sta Bar*Sta1985
19901990 .. -. - ..... . .
19801985 .' ..
1980 1980 19750 50 100 150 2llO 250 0 50 100 150 2llO 250 300 -20
StalIon(1I)
River = Intake canal Reach = Upper reachIntake Diversion Dam
RS=60
StaIion (It)
River = Intake Canal Reach = Upper reach RS =50Irake DIverslon Dam
StalIon (II)
2015 .
2010 .
2005
g2000t 1995
w
1990
1985
19800 20
• .- !"
40 60
Station (II)
eo 100 120
Legend
•WS 1500011400 cf1I
WS 3OllOlYl4OO cfsn
WS «XlOQIl,4OO cf1I
WS 5000 10 cfs•
Ground•
Bar* Sta1990
1985
20 40 60
Station (II)
eo 100 120
Legend
•WS 1500011400 cf1I
WS 3OllOlYl4OO cf1III
WS 4OOOCIt'1,4OO cf1I
WS 5000 10 cf1I•
GnltnI•
Bar*Sta
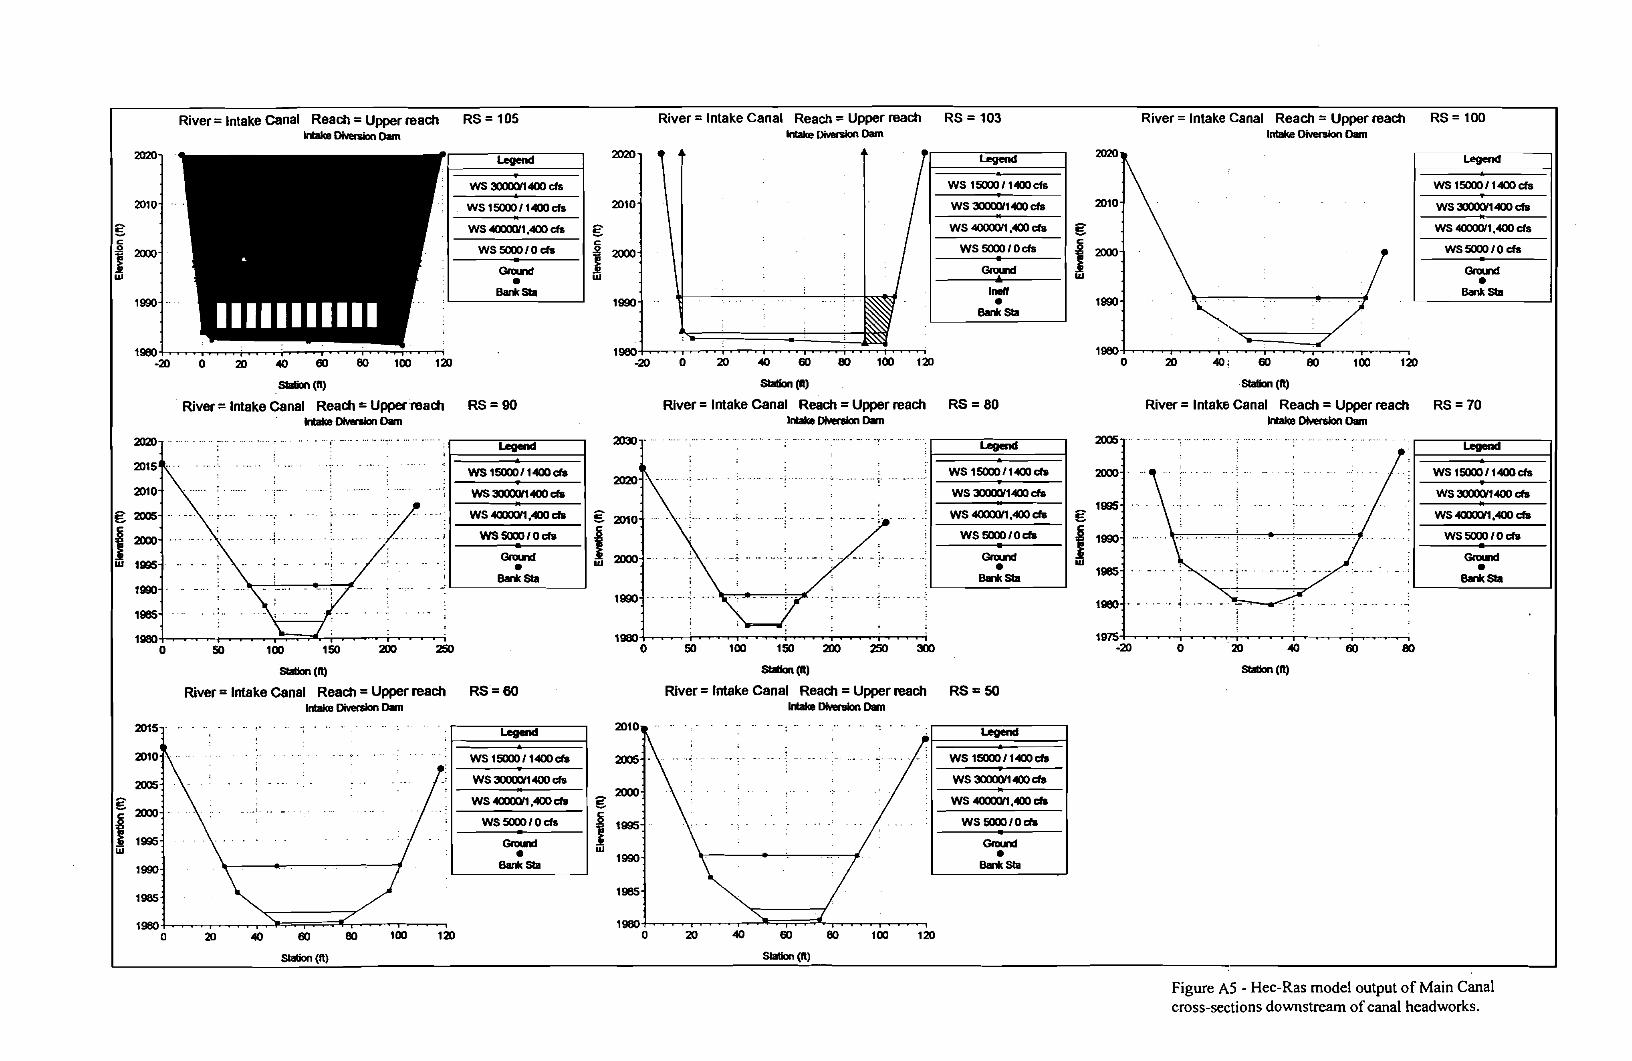
Figure AS - Hec-Ras model output of Main Canalcross-sections downstream of canal headworks.
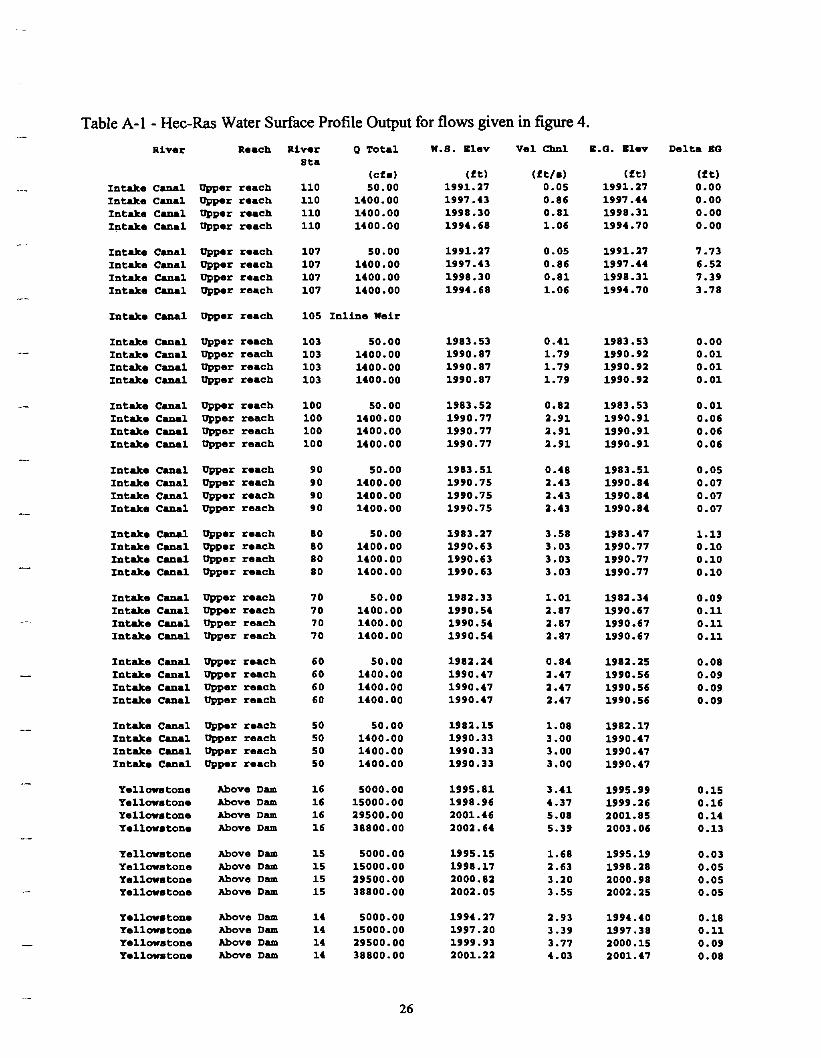
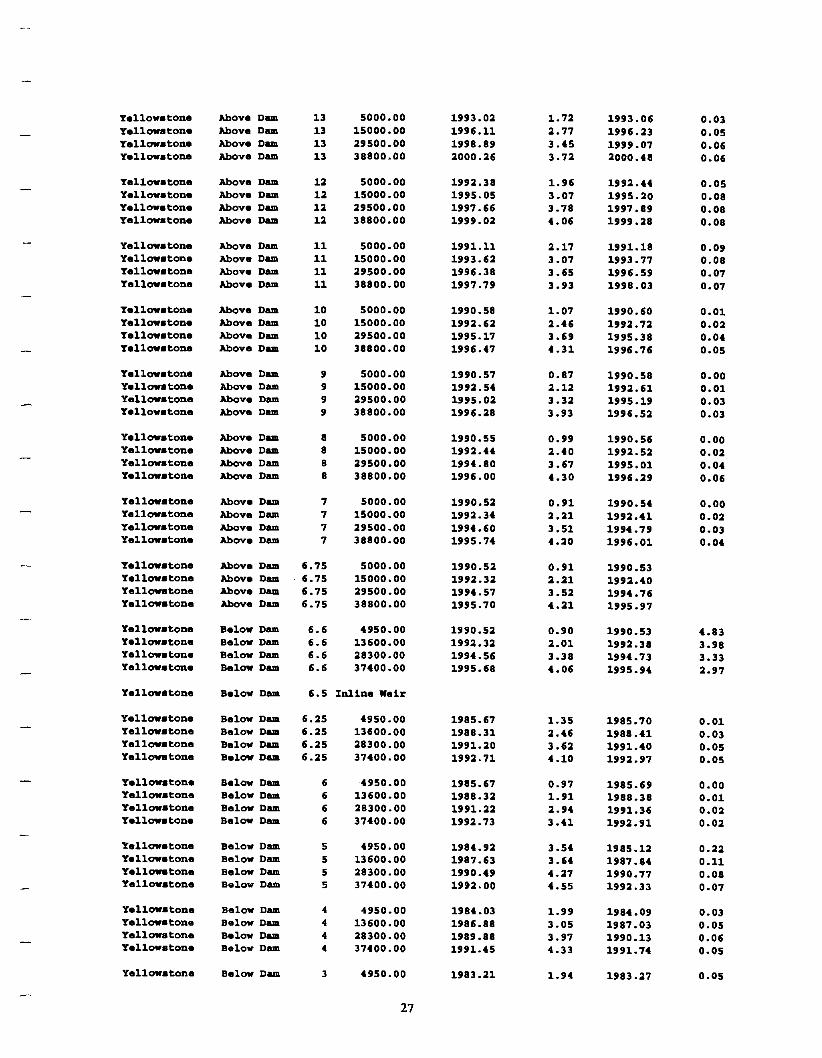
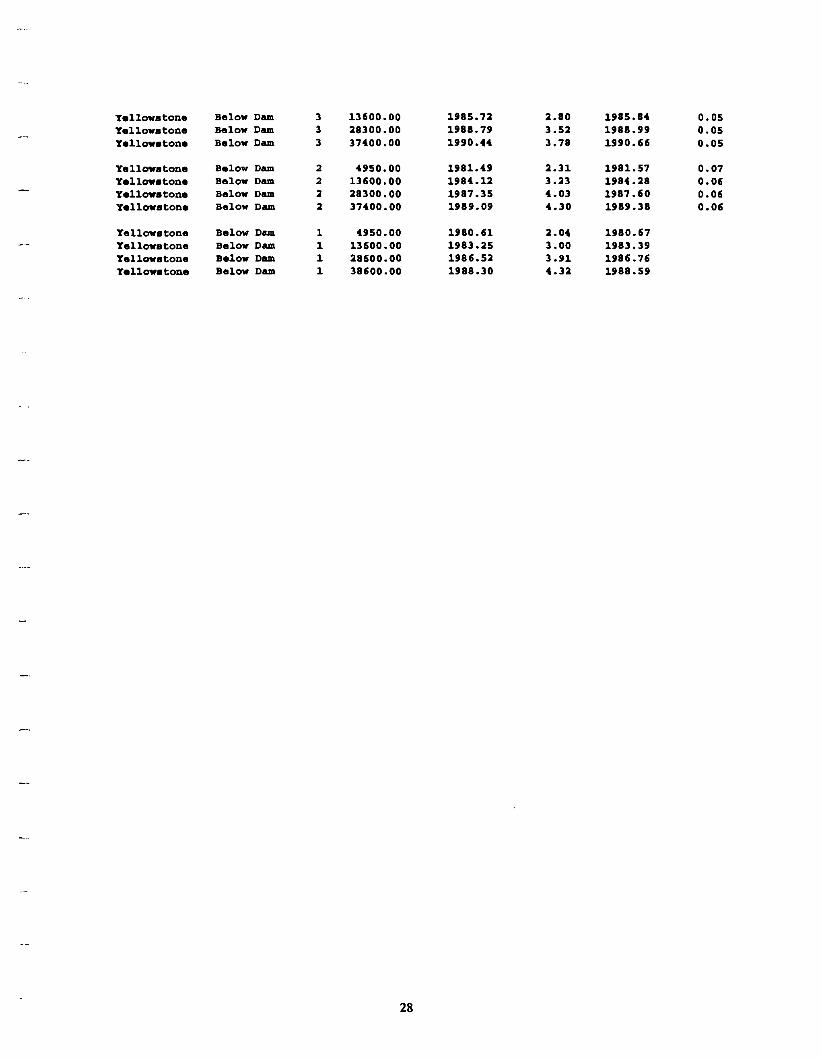
Table A-I - Hec-Ras Water Surface Profile Output for flows given in figure 4.
River Reach River Q Total w.s. Blev Vel CbDl B.G. Blav Delta BGSta
(eta) (ft) (ft/s) (ft) (ft)Intake C....l Upper reach 110 50.00 lUl.27 0.05 1991.27 0.00Intake Canal Upper reach 110 1400.00 lU7.43 0.86 1997."'1 0.00Intake C....l Upper reach 110 1400.00 1998.30 0.81 lU8.31 0.00Intake Canal Upper reach 110 1400.00 199'1.68 1.06 lU".70 0.00
Intake Canal Upper reach 107 50.00 lU1.27 0.05 lU1.27 7.73Intake Canal Upper reach 107 1400.00 lU7.43 0.86 lU7.U 6.52Intake Canal Upper reach 107 1400.00 lU8.30 0.81 lU8.31 7.39Intake Canal Upper reach 107 1400.00 199'1.68 1.06 199'1.70 3.78
Intake Canal Upper reach 105 Inline Weir
Intake Canal Upper reach 103 50.00 1983.53 0.-11 1983 .53 0.00Intake Canal Upper reach 103 1400.00 19'0.87 1.79 lUO.92 0.01Intake C....l Upper reach 103 1400.00 lUO.87 1.79 lUO.92 0.01Intake Canal Upper reach 103 1400.00 lUO.87 1.79 lUO.92 0.01
Intake Canal Upper reach 100 50.00 1983.52 0.82 1983.53 0.01Intake C....l Upper reach 100 1400.00 lUO.77 2.91 lUO.91 0.06Intake C....l Upper reach 100 1400.00 lUO.77 2.91 lUO.91 0.06Intake C....l Upper reach 100 1400.00 lUO.77 2.91 lUO.91 0.06
Intake Canal Upper reach '0 50.00 1983.51 O.te 1983.51 0.05Intake Canal Upper reach '0 1400.00 lUO.75 2.43 lUO.at 0.07Intake C....l Upper reach '0 1400.00 lUO.75 2.43 lUO.at 0.07Intake Canal Upper reach '0 1400.00 lUO.75 2.43 lUO.at 0.07
Intake Canal Upper reach 80 50.00 1983.27 3.58 1983.-17 1.13Intake C....l Upper reach 80 1400.00 lUO.63 3.03 lUO.77 0.10Intake Canal Upper reach 80 1400.00 1990.63 3.03 lUO.77 0.10Intake Canal Upper reach 80 1400.00 lUO.63 3.03 lUO.77 0.10
Intake C....l Upper reach 70 50.00 1982.33 1.01 1982.3-1 0.0'Intake Canal Upper reach 70 1400.00 lUO.5.. 2.87 lUO.67 0.11Intake Canal Upper reach 70 1400.00 lUO.5.. 2.87 lUO.67 0.11Intake C....l Upper reach 70 1400.00 lUO.5.. 2.87 lUO.67 0.11
Intake Canal Upper reach 60 50.00 1982.2" O.at 1982.25 0.08Intake Canal Upper reach 60 1400.00 lUO.-17 2.-17 lUO.56 0.0'Intake Canal Upper reach 60 1400.00 19'0.-17 2.-17 lUO.56 0.0'.Intake Canal Upper reach 60 1400.00 19'0.-17 2.-17 lUO.56 0.0'
Intake C....l Upper reach 50 50.00 1982.15 1.08 1982.17Intake Canal Upper reach 50 1400.00 lUO.33 3.00 lUO.-17Intake C....l Upper reach 50 1400.00 19'0.33 3.00 lUO.-17Intake Canal Upper reach 50 1400.00 lUO.33 3.00 lUO.-17
Yellowstone Ahove Dam 16 5000.00 lU5.81 3.U lU5.U 0.15Yellowstone Above Dam 16 15000.00 1998.96 ".37 UU.26 0.16Yellowstone Above Dam 16 29500.00 2001.-16 5.08 2001.85 0.14Yellowstone Ahove Dam 16 38800.00 2002.6" 5.39 2003.06 0.13
Yellowstone Above Dam 15 5000.00 1995.15 1.68 lU5.U 0.03Yellowstone Above Dam 15 15000.00 1998.17 2.63 lU8.28 0.05Yellowstone Above Dam 15 2'500.00 2000.82 3.20 2000.98 0.05Yellowstone Ahove Dam 15 38800.00 2002.05 3.55 2002.25 0.05
Yellowstone Above Dam 14 5000.00 199'1.27 2.'3 19'..... 0 0.18Yellowstone Ahove Dam 14 15000.00 1997.20 3.39 lU7.38 0.11Yellowstone Ahove Dam 14 2'500.00 UU.93 3.77 2000.15 0.0'Yellowstone Above Dam 14 38800.00 2001.22 ... 03 2001.-17 0.08
26
Yellow. tone Ahove Dam 13 5000.00 1993.02 1.72 1993.06 0.03Yellowstone Ahove DlUIl 13 15000.00 1996.11 2.77 19".23 0.05Yellowstone Above DlUIl 13 29500.00 1998.89 3.45 1999.07 0.06Yellow.tone Ahove Dam 13 38800.00 2000.26 3.72 2000.U 0.06
Yellow.tone Above DlUIl 12 5000.00 1992.38 1." 1992 ... 0.05Yellow.tone Above Dam 12 15000.00 1995.05 3.07 1995.20 0.08Yellow. tone Above Dam 12 29500.00 1997.n 3.78 1997.89 0.08Yellowstone Above Dam 12 38800.00 1999.02 4.06 1999.28 0.08
Yellowstone Ahove Dam 11 5000.00 1991.11 2.17 1991.18 0.09Yellowstone Above Dam 11 15000.00 1993.62 3.07 1993.77 0.08Yellowstone Above DlUIl 11 29500.00 1996.38 3.65 19".59 0.07Yellowstone Ahove DlUIl 11 38800.00 1997.79 3.93 1998.03 0.07
Yellowstone Above DlUIl 10 5000.00 1990.58 1.07 1990.60 0.01Yellowstone Above DlUIl 10 15000.00 1992.62 2.U 1992.72 0.02Yellowstone Above Dam 10 29500.00 1995.17 3.69 1995.38 0.04Yellowstone Above DlUIl 10 38800.00 1996.41 4.31 1996.76 0.05
Yellowstone Ahove Dam 9 5000.00 1990.57 0.87 1990.58 0.00Yellowstone Above Dam 9 15000.00 1992.54 2.12 1992.61 0.01Yellowstone Above Dam 9 29500.00 1995.02 3.32 1995.19 0.03Yellow.tone Ahove Dam 9 38800.00 1996.28 3.93 1996.52 0.03
Yellowstone Above DlUIl 8 5000.00 1990.55 0.99 1990.56 0.00Yellow. tone Above DlUIl 8 15000.00 1992." 2.40 1992.52 0.02Yellowstone Above DlUIl 8 29500.00 1994.80 3.67 1995.01 0.04Yellowstone Above DlUIl 8 38800.00 1996.00 4.30 1996.29 0.06
Yellowstone Above Dam 7 5000.00 1990.52 0.91 1990.54 0.00Yellowstone Above DlUIl 7 15000.00 1992.34 2.21 1992.41 0.02Yellowstone Above DlUIl 7 29500.00 1994.60 3.51 1994.79 0.03Yellowstone Above Dam 7 38800.00 1995.14 4.20 1996.01 0.04
Yellowstone Above Dam 6.75 5000.00 1990.52 0.91 1990.53Yellowstone Above Dam 6.75 15000.00 1992.32 2.21 1992.40Yellowstone Above DlUIl 6.75 29500.00 1994.57 3.52 1994.76Yellowstone Above Dam 6.75 38800.00 1995.70 4.21 1995.97
Yellowstone Below Dam 6.6 U50.00 1990.52 0.90 1990.53 4.83Yellowstone Below Dam 6.6 13600.00 1992.32 2.01 1992.38 3.98Yellow. tone Below Dam 6.6 28300.00 1994.56 3.38 1994.73 3.33Yellowstone Below Dam 6.6 31400.00 1995.68 4.06 1995.94 2.97
Yellowstone Below DlUIl 6.5 In1ine Weir
Yellowstone Below DlUIl 6.25 4950.00 1985.67 1.35 1985.70 0.01Yellowstone Below DlUIl 6.25 13600.00 1988.31 2.U 1988.41 0.03Yellowstone Below Dam 6.25 28300.00 1991.20 3.62 1991.40 0.05Yellowstone Below DlUIl 6.25 31400.00 1992.71 4.10 1992.97 0.05
Yellowstone Below DlUIl 6 4950.00 1985.67 0.97 1985.69 0.00Yellow.tone Below DlUIl 6 13600.00 1988.32 1.91 1988.38 0.01Yellowstone Below Dam 6 28300.00 1991.22 2.94 1991.36 0.02Yellowstone Below Dam 6 37400.00 1992.73 3.41 1992.91 0.02
Yellowstone Below Dam 5 4950.00 1984.92 3.54 1985.12 0.22Yellowstone Below Dam 5 13600.00 1987.63 3.U 1987.84 0.11Yellow. tone Below Dam 5 28300.00 1990.49 4.27 1990.77 0.08Yellow.tone Below Dam 5 37400.00 1992.00 4.55 1992.33 0.07
Yellowstone Below Dam 4 4950.00 1984.03 1.99 1984.09 0.03Yellowstone Below Dam 4 13600.00 1986.88 3.05 1987.03 0.05Yellowstone Below DlUIl 4 28300.00 1989.88 3.97 1990.13 0.06Yellowstone Below Dam 4 31400.00 1991.45 4.33 1991.74 0.05
Yellow.tone Below DlUIl 3 4950.00 1983.21 1.94 1983.27 0.05
27
Yellowstone Below Dam 3 13600.00 1985.72 2.80 1985.80& 0.05Yellowstone Below Dam 3 28300.00 1988." 3.52 1988.99 0.05Yellowstone Below Dam 3 31'&00.00 1990.U 3.78 1990.66 0.05
Yellowstone Below Dam 2 U50.00 1981.U 2.31 1981.57 0.07Yellowstone Below Dam 2 13600.00 1980&.12 3.23 1984.28 0.06Yellowstone Below Dam 2 28300.00 1987.35 ".03 1987.60 0.06Yellowstone Below Dam 2 31'&00.00 1989.09 ".30 1989.38 0.06
Yellowstone Below Dam 1 U50.00 1980.61 2.0" 1980.67Yellowstone Below Dam 1 13600.00 1983.25 3.00 1983.39Yellowstone Below Dam 1 28600.00 1986.52 3.91 1986.76Yellowstone Below Dam 1 38600.00 1988.30 ".32 1988.59
28

AppendixBConstruction Cost Estimate Sheets
29
COOE:[).8170
FEATURE:ESTIMATE WORKSHEET
Ilhl.n-l000 PROJECT:SHEET 1 OF 1
FISH SCREEN FACILITIESSCREEN STRUCTURETOTALS SHEET
DMSION:
FILE:
C:\123R4D\EST\lNTAKE\TOTALS.WK4PLANT
Acer.PAY
ITEM DESCRIPTION CODE,
•
QUANTITY UNIT
UNIT
PRICE
J
AMOUNT
•.•••_._- - ••_ •••.• .......;.._ .. _••••_._•••..*._- ... ;....•. --_•••.•. . l.._,
,- ••"._--••- --. -".-"---.__••_••_._._•. _ _ ••._-_._._•. _-_ - .. _--- •••--* ••••. '. • ._._-----
i_.-. - ...__..._.-.- .•.•.,---_._.-..__._.._..... -_ ..._._-_....__...._...
--- ----t---,-----,--,"- -- -----------, ---0-- -- -----"---- ------ -- --.;. -,., - ---,,:M.l?bil~tion.andp~parato~ w0l!_____ ,_ _ L __ ,__"~_ , , m_ --,-L.-----__i- __ , ..l______ __SI90,OQO
I--,------..;.,------- -",- j
Screen stIucture subtotal_.- .~ _-_ _.__._ _._.-_.._._------_..__._-- -•.....,- .._. ----- ,
,
---- --
,----- --,+--
1-- - ---- --,-
____~ L _
'Outlet stIucture subtotal1-----+---- S35,7oo
Contingencies (25%) i 1___ $1,100,000, I i------- +- --+-----------~-----------: -------j--------j---+----+----------
I I Field Cost '_$51~00'000----------,----+-------------=------~ , ,--------j---+!-----+1-,-------'----1------+------------------ ! --l-------i----jr-----C--------
=--.-_=-1-~ ' -~-:-: 1 I-----==-~---------------.' ,-- ---l--- -------,-~----.-- -----------.----t -j-------------.--...-.----- .. --..-+.-.- - - -"-i'" .-- -.-.__ .~.. -----T---·-----i·--- .+--._-- --._-..---.- -.-.- ~.-
.•..- ..--...._. -. . -i-.. .._.__.._._o. .--------..-....--.-....-- . - --"-"'--'---" ··t·-----~--+------!-----.---..--.i---.- ...-..-..-...-.--... -_.- .
---==:=-_~~...:!-fechanical subtotal + , +__ i 1 $2JQ?,_?~O~-----t --.-----t-.-.-.------..-----...-------------···---··--_.----.-..-~- ...-.-.- ~_-- ... --... ~+- i -.l . ~__ ".__
; i ; j l
---~==f_--~=:f----'---------S-II-b-to-t-aI------::--=-=====~+.·=-~=l,•.,·=-=:==~t,.,.•~-=t-,·.:.·---=-_~4il_~~=~~$i~~;~0------t .. ---T--------- .
-_--~_-__t==:-~-4-----------y---nlIst--ed-I-te-ms-(-10-0-V.)--=--- i -=~:i i i ---- j-=~=-S406,OSO.;.--------- ; j I:
_.._---_.~---""_._-+-- -~ +-----_._-----, Contract Cost ! I _~400,000
I I
f---+--
,,-------"------------- ,-- ---------- -..----+----+-----~-_i_--L._ __i_~ ,
~--------------------------- -'-------+-,'- --+_1 -,-,__-,-_-_-__--__ --_-__~----,_'_-__-,-_------t.------------------
1-
QUANTITIES PRICESBY CHECKED BY
R. Boumprten
DATE PREPARED APPROVED DATE PRICE LEVEL
OlnOl1000 Appnol••I99
10-Jan-2000 IPROJECT:ESTIMATE WORKSHEETCOPE:D-3521
!IFEATURE:II
I
INTAKEI
FISH SCREENING FACILITIESSCREEN OPTION DIVISION:
IUNIT:
C:\123R4D\EST\lNTAKE\SCRNEST.WK1I
PLANT I PAY
I
UNIT
ACCT. I ITEM DESCRIPTION CODE QUANTITY UNIT PRICE AMOUNT
SCREEN STRUCTURE
Concrete 2,200 cy 5400.00 5880,000
Reinforcement 264,000 Ibs 50.65 5171,600
Handrail 12,000 Ibs 55.00 $60,000,
Earthwork (15 percent of above) $167,000 '-
riprap 220 ICY 550.00 511,000
beddin2 for riprap 140 cy $45.00 56,300
2" insulation on the wal1s 13,200 sf 53.00 $39,600
Screen Struc:tur Subtot 1I 51,335,500 -
IBYPASS PIPE=L1NE= ti: .)
Carrier pipe: 36 inch dia HDPE 560 ft 5125.00 $70,000 I
Casin2 pipe: 42-inch diameter 500 ft $450.00 5225,000
Iarout between casing and carrier pipe Is $30,000
Bypass Pipeline ~ubtota $325,000 -
OlITLET STRUCTURE
Concrete 15 cy $600.00 $9,000
reinforcement 1,800 Ibs 50.75 $1,350
Earthwork (30 percent ofabove)' $3,100 .
Cofferdam Is 515,000
Riprap 100 cy 550.00 55,000
Bedding for riprap 50 cy $45.00 $2,250
Outlet Struc:tur Subtotll $35,700 .
I
I ,, i
I
I i,
Total this Sheet 51,696,200 i', I
,I L .
,
I! Iil I
I
QUANTITIES PRICES "'i::BY BY CHECKED
IiA.GUckman R. BaaDlprten
iDATE PREPARED APPROVED DATE PRICE LEVEL ii
Appraisal 00,~
SHEET 1 OF 1ESTIMATE WORKSHEET170COOE:O-8
FEATURE: 13-Apr-200m PROJECT:INTAKE PROJECT
FISH SCREEN STRUCTURE DIVISION:
MECHANICAL FILE:
C:\MYFILES\TEST F-l\PROJECTS\MONTANA\lNTAKE-1
PLANT PAYI : UNIT
ACCT. ITEM DESCRIPTION CODE QUANTITY UNIT PRICE AMOUNT,: .
--------~------------ ._-~------~-~----_.__ .._----- .-- --.---
I :Fish screens, 10'W x 10' H, 30 + 4 spares , 68,000 Ibs SS $10.00 : $680,000------------_.--J stainless steel (approx. 2000 Ibs/panel) ---------+------- --
, If-----~------------ -------"--
2 ,Adjustable bames, 10'W x 10'H, 26 + 4 spares 90,000 Ibs $6.00. $540,000--------
f---:steel, (approx. 3000 Ibslpanel) -------- - -_....!. __._._-_. __._-~
r- _.. _- -- -~-·-----r·--
3 Hydraulic trash rakelbrushing unit, rail and supports ILS $300,000---
f--Isingle boom, 310 feet oflength (21,000 Ibs)
--,
4 i Guides, supports, bracing, grating, steel 107,000ilbs ~ $4.50 I $481,500I
I I I5 iStee1transition to bypass 8,200 :lbs
I
, i $10.00 I $82,000,i !2'W x IO'H to 36" dia. pipe i I
I i :: =I -
6 iIsolation, 36" dia. cast iron slide gate at bypass exit , 1,500 ilbs ! $5.00 I $7,500--t
I,
: I : ,
I 7 IWater level measuring equipment,
I iLS ! $15,000.00 I $15,000f---- I , :
1
,, ! I: I I ,
I II
8 !Stoplog guides at bypass entrance--, : 350 iIbs $5.00 I $1,750,
,I !: ,
ii :I I I I
I !I, i
i Subtotal Mechanical- - - - - - - - - L- - - - - ~ - - - - - - - - - - ~ - - - - - ~ - - - - - ~I
52,107,750I I '. i
I!, I
, I • I:- I
,
i --_.-
, I
I I :---I , i
~- , -
r---- L --- ---,--~.,.--- ---, ---------- ,
f----- -__. __ -l.. _____ .. - ----_. -_._--------------._------- -----_.__ ...
_ .. --.------'-. .- -~ -------------- ---- ---- _.- ._--_. -- ---..._--_._- -- ----------+--- '-' '-_-0 -- ---_._-------- - -_..-
r-'-' -- --- - ----- ------ --- -------~._------. ._----- - ---- - -- ---- _. -- - -- ------ -------- --. -- -- - _.._'. - . _..---~_.- .. ...'_.
---_ ..__ . - -- '-- - --- -.---------------- -- -----~--_.- - - - ----- ------- .-.--- --- . __ -0 - -.- --.----
f-- --~--_. - - - -- -.._- -----.~_.__....,_._----- .._- _.. - - ._- .... _-- ---- .'-' - ---. ._---'-'-- -_ .. - -'--.- - ---- ------_.- - .---- -_ ... _- ------ --
QUANTITIES PRICESBY CHECKED BY CHECKED
R. Christensen R.Baumglrten
DATE PREPARED APPROVED DATE PRICE LEVEL
1216199 04/1312000 Appraisal 00
COOE:D-IIl70
FEATURE:ESTIMATE WORKSHEET SHEET 1 OF 1
ID-Jan-2000 PROJECT:INTAKE PROJECT
FISH SCREEN FACILITIESLOUVER STRUCTURETOTALS SHEET
DMSION:
FILE:C:\123R4D\EST\lNTAKE\TOTALS.WK4
PLANT PAY
ACCT. ITEM
,
DESCRIPTION CODE,
QUANTITY UNIT
:
UNIT
PRICE
:-
AMOUNT
- --_..._..-~-.-._~j-_ ...- _. -·t---·----------·-··-·-.··...- ...--.... ---- .. ---.. -.-- ...._-_._. '-, --- _. __ ._--~
, ,L ~~~iza.!ion an~jl~~to!Y_YI'.~r,L __ ,_.-+-
i...-+_..._----_..-_._---;.--._----.--- ,..__...•
;Screen structure subtotal..... -------t-·· ----- .-\----------------..----.-.-- --_.. ,.,
.. . '_ __ _.__.. ~.~-- .._ --._--.-.+------- _....;... - ·---··---··-··-~--···-·-,1
: 1 \ '•.._ _.._ _..t-.._- _._.._--.._.._-~,- -----..-<--.- .. ---. - -'--'-'--"_._-
$35,700!Outlet structure subtotal
••_n t.· -_. __ ._ -..--_._~--- .__._-- -, - .. _ , - ._._-- -,.- -- .. -." - ..-...-- ---- ~ - -.- _-_.- -..-.-..- - .-.-----.-.-.~ ..-~-.- .. -- ---- ---. ~-;.- ..-.-.- --------..--- -
_______ J .l!!ypass pipeline sub~~~ .__________ ___. + ~_+- -;- +_ $}~5!<lQ0
l
! IMecbanical subtotal ; I !: $1,039,650-.- .....---j- ------;--~.-~-~--.-----.-.-----.. -----...-..-.~ ..-----··-t~-T- r -----r---.---.----t---......-.-..- ...-..-.-.-.-.---.- .. -.-t-~ ..----+-- --.-.-.-.----.....----..-..--.--.-----.---+----~.------+ --~-----L.--- __._-.-.-.-....-- ...-.--....-------1- ' ~i----l--~----t------l----------
i I " I----t---+---------S-u--bt~ta1 -.-------~_r_-~ I,! t---i,---+------===-------------t---t--- I I t-- 52,358,250
.---t- . 1------+- I1-__--I' -i-- -=Uc::nlfst==ed=-=It=e=ms=-(lO%) ~=- I-j----- --1----1-. 1~~_~$~2~4~1,~7~50
I ; I; ',.j I-----\---t--------------------------'--.. I -i---+-----f- -----i i ContractCost; . $2,600,000
i Contingencies (25%) I $600,000
I , -Field Cost -------,-. ~; Ii I- 53,200,000.. ----i--~,----~·-------·-···--·-···~··-~----- .. ---- ..··---.--..-----.--.-.-...;..-...--- ,
.! i I------t---~-----~------------ --------- --~---__j --~--~--r-----'------------,·--'-
--:t=. -~=~====-=- =--==~-T--- i=-i=---=t=-==; , ,I ~ -;- ---,'--1---- _-..----:-----:--------------- -,---- ----.--... - -,---.-.---- ----'--"'--1 ..
-------. ·-i---·-·---·--+---'----~--·-------~-_·--··--··~··..----.-..- . - ... ---.-------...--....-+-.....---+:;......----t------...----+--_.....-- ---..-.----------.-.1'------""'-- ---+'-----'-,-----i-------i-------------
I----,--.--+-----,----- ---.-----------;.-.-----i-I-------i-~-,-'_ ___' ._.__.__.
QUANTITIES PRICESBY CHECKED BY CHECKED
R. BaulIIl!.run .I'/.Ai,. /DATE PREPARED APPROVED DAn: PRICE LEVEL
0111011000 ADnral.al 99
SHEET 1 OF 1
10-Jan-2000 IPROJECT:I INTAKE
ESTIMATE WORKSHEET
FISH SCREENING FACILITIESI
II LOUVER OPTION DIVISION: i!'
I i~
UNIT:
C:\123R4D\EST\lNTAKE\LOUVEST2.WK1,
iPLANT PAY UNIT !
ACCT. ITEM DESCRIPTION CODE QUANTITY UNIT PRICE AMOUNT I,I,II,
I SCREEN STRUCI1JRE II
Concrete 1,300 cy 5425.00 5552,500 :Reinforcement 156,000 Ibs 50.70 $109,200 iHandrail 6,600 Ibs 56.00 539,600 I
Earthwork (15 percent ofahove) 5105,000 Iriprap 220 cy 550.00 511,000 Ibedding for riprap 140 cy 545.00 56,30012" insulation on the walls 8,100 sf 53.00 524,300 I
I
Screen Struc:tur Subtot II 5847,900 r
BYPASS PIPEl INI= . 1\
570,000 Icarrier pipe; 36 inch dia , IIDPE 560 ft 5125.00
Casing pipe: 42 inch diameter 500 ft 5450.00 5225,000 IGrout between casinlt and carrier pipe Is 530,000 I
5325,000 fBypass I'lpe1Ine Subtota
OlITLET STR.UCI1JREConcrete 15 cy 5600.00 59,000
reinforcement 1,800 Ibs 50.75 51,350Earthwork (30 percent ofahove) 53,100
Cofferdam Is 515,000Riprap 100 cy 550.00 55,000Beddinlt for riprap 50 cy 545.00 52,250
Outlet Structur Subtotll 535,700
,
I:,i !
I'III' i
I!
,I I:i
,I
I QUANTITIES PRICESIi'I
IBY BY CHECKED
IIA. GU~kmln R. BlumglrtenI'IIDATE PREPARED APPROVED DATE PRICE LEVEL
I Ilhfln-2000 Appraisil 00
COOE:D-3521
I!FEATURE:II
COOE:D-8170
FEATURE:ESTIMATE WORKSHEET
I3-Apr-200~ PROJECT:INTAKE PROJECT
SHEET 1 OF ,
FISH LOUVER STRUCTURE DIVISION:
MECHANICAL FILE:C:\MYFILES\TEST F-I\PROJECTS\MONTANA\lNTAKE-1
$15,000
$117,000
$326,400
AMOUNT
UNIT
PRICE
,
.
$4.00
i,----:
$6.501I
.
.
$5.00
i $10.00·
ii :I
$5.001:
iI $15,000.00 i,
!II $5.00T,
UNIT
81,600 Ibs
QUANTITYCODEDESCRIPTION
PLANT PAY
ACCT. ITEM
7 Water level measuring equipment • I ILS__ : I . i i
II 8 Stoplog guides at bypass entrance 350 Ibs $1,750
--·----+-----=-F=.!2...2==-=~==-==.:..:..:..-----+___-___+---=.::.~~----'---=:::.:..j..---~~
---I
;_..~----------------------~-------~--~---'----'--------------
---~----'--- ----------- -- -----'---------~----~------~I _ _ ), Fish louvers, 10'W x 16' H, 15 +-=2c.:sLP-=:ar:.ce-=:s ----'-__
_________+=is-'--te_e_1(,--a-,--p,--pr_ocx~:...4-=8-=0--'-0-=-lb-=sI'--'pC-'an_el-'-) ~_i_' ~ _. ,
$1,039,650
I II, ,
I ! ,
I , ,
I,
I I,i i
---------:- ----t--------------------- --..-----___ ~ . ~_. . i . _
I~-- ----1------+,-------~-
-~~'----_.._-----_._------- -
- - ----~--+-I ._._ . .. _.__ ...._
I---+! i-I - ;.-'_----'Ii-- -+I--+I----I~--------- -.l~ I I-----+j-----,-----:-----+-1--rn~ . i ;! I-.- : I------s-u-b-t-ot-a-'-M-e-c-ha-n-j-ca-'-.-.-.-.-.-••-.-.+II·-·-·-·-·-.j}· _•• - - •••• 1 1••• _.. I
: ! I : I I----------r- i ! I' :: :
i . !
--.-------,----j-,--------------------+!------j-------------;-----j----~+i------
I I iI I I
..-- ---c-,---:-----------~------------li--__+-------'--_i_------------
- - --+-----------------.__ .. __ .._------- - -----~------
------------------------- --- -_ .._----._._-
.•. ----- .--__ .l-------. __...
QUANTITIES PRICESBY CHECKED BY CHECKED
R. Christensen R. Baum...rtrn
DATE PREPARED
12/6/99
APPROVED DATE PRICE LEVEL
04/131200( Apnraisal 00
COOE:D-&170
FEATURE:ESTIMATE WORKSHEET SHEET OF
lO-J•••l00c PROJECT:INTAKE PROJECT
BAFFLED FISHWAY STRUCTURE DIVISION:
FILE:C:\MYFILES\TEST F-l\PROJECTS\MONTANA\F1SHWAY.
PLANT PAY
ACCT. ' ITEM : DESCRIPTION CODE QUANTITY UNIT
UNIT
PRICE AMOUNT
i-- - ~--- - ----------------_.- ---
,---- ---.~---- ------I-- --.---:.-- .-------.--.-----.-.------ . -- .
I Fishway flume--.--_.._..:"..:...::,=~.==----------- - - -, _.._---~._-- _ .. ---._. -.-~ ._---------j-..__.._._-----_._._... -_.
,Concrete 260 :y\ls $425.00 i 5110,500
~_---T__ifO.R=e=in=forc~ecm--:.:ce,-"n~t ~_~~~_-_~~-_. ~-H~_~-_~.~__ _-=-_l~ 50.~Q.: ~1}00__._.• ---'"H,,,,an==dra,-=-il_ ____ _ _ 5,050 !Ibs 56.00; 53Q.~QQ
---~ i~P:bedding . ------------~---- ~:i~:: -- ~~::i :~~::i2" insulation on walls ~-_~:_._~~:::_u=_~---- 2,160 !sf i3.OOT-----$6~~
1- ::..__-'-I=Eanh=.:..:w:..:o-:;rk::...>::(2:::5..::0/0:...:o:..:f..:::a:::bo:::.v:..:e:L)_____ _.. _.~ -.------i--.-.__. ! ~~1,4~~
S257).87
5394,312
S69~~
: ----.-----u--r-- ,Flume Structu~e Subtotal1-------,---_---------------- ------....!-. I.,1-------"----+----------------_._- .-.--.-.----;........----+--~-----_+_--------__ 2 iSteel Sames 14,850 Ibs 53.50 551,975
I. Guides ---- --:---. 5,950 Ibs 53.00 517,850f---,--~==------------·-----'------'------=--'=F---:----~:=..;-----=:..:..:.!.=-l
I_._-.---:--------------- .i !Bame Subtotal-----.L-----J!--------------- -._+ .1.:,=====-t-!--'T
-·--·-+i--+------------------ -·---+------+------It----+---; 3iCofferdam.::in"'g"-- ._.. ._._~1 , _f--'-'+ iassumes earth _---:__-i--__......:.I~,8:::.00::.,ijLy~ds~~-.....:!5~25~.00=i1T----'!$4=5,~OOO~
Iriprap __-: ~_____'2""2:::.0¥y-=ds::.......-+----=55~0:::.00~-----'5~1..:..1,~OOO~
f---- ....: _-+'d=ew=al==e::.:ri:.:!ng,,-,(>::2=~:..:o..:::o,,-f=abo=ve~),--__. ._._,_._.-+- -11 ;-1, -+ _=5..:..1I:.!).:::00~
I--------<e--+-~-------------~-----l-·--l-ic-o-n:-e-rd-a-m-s-u'~:to:ta:I==:==~~=====~======~S6~=7)'~·::::OO-=-II-_~ .Li' _+1-- ~ '___ _+-----+_-----
,-------------_._--+---
iSubtotal
!I
__....c.'----1-
1---'--.---;-----
------.+--- ------.;.----_._-.Contract Cost_.. _- --- ---------------_. -- -
iMobilization and preparatory work 519,716I
--+--.-.-----t----~----_+---~~~
__ ,Flume structure 5257,287
__-'--__1Saffles and Guides __~ ..L ._ . 569,_8~
___ j iCofferdam -+-__,_ _ . 567,200
Subtotal _~=~:-=__~-=--~-~=--=-=-=--~-~=~-:~---+- $41~,:Unlisted items(200/0) . --'-- . .__ __ I 582,806
,______~_._._. .. _. ."_ . .___ .. ~2~,83~
1---Field Cost ___ L
.._--'-~_.-_._-----. 5125,000
- _... _.,-_._-_.._------
- -;----~~!~
QUANTITIES PRICESBY CHECKED BY CHECKED
IL Mefford
DATE PREPARED
1216/99
APPROVED DATE PRICE LEVEL
. OlIlOI2()()(
CODE:D-8170 ESTIMATE WORKSHEET SHEET 1 OF 1
FEATURE:-~------- ----- -.---_.~.-
11-Jan-2000 PROJECT:--------- ------ - --------_._--------_.- ._ ... -- .. ----. -._-
INTAKE PROJECT-- _._- ---------._._- -----'--- _.. - - -- ---
__. ------- - - --- -- -- - .-----.-.-----.--- - 11----.......-_---------..,....-----1ROCK FISHWAY STRUCTURE DIVISION:'-------'--~---------~-.. - .-------------- -.- ----F~::.:.:.,;.----..,....-------__l
___------------------ !:ILE: L i .__ ._
C:\MYFILES\TEST F-1\PROJECTS\MONTANA\FISHWAY.
----_.--,----- ---------------_.__._--- - ------~------.------ .---~-- ----------------- ... ----
PLANT PAY UNIT----------_._------- ._------ ---------~--~_.- -------_._=..:..:'-'--------_._----ACCT. ITEM DESCRIPTION CODE' QUANTITY UNIT PRICE AMOUNT_._----------_._------- '-- --------- ---_._-----'--.'-"-'"--=--------=-'-'-=-=..:...:'-'------
. .1-----,--
1 Fishway channel:ExcavationCompacked Backfill
I__----;-__':.Rc"'ip.:...ra:::':p'---- ----;- _Boulders '
1- ._~R:Iip.:...ra:::':p:....:b:....:e:..:d:..:d::.:in~g~---------Geotextile
1-----
,._- I
II
! I630'yds
.._- ,I
2,65O iyds,
------r-: i 1,585!yds'--------
, 125yds------ ,
951 :yds .
I 2,200,syd!
$10.00 !
$7.50'$50.00'
$200.00:$45.00 i
$3.00'
$6,300$19,875$79,250$25,000$42,795$6,600
$80,250
$12,740
$53,508
$75,000
$12,500$12,500
$50,000
$401,000
$321,000
$267,540
II
T
1
$50.001$25.001
i:Fishway Structure Subtotal!
, Ii
1 : 2,OOOlyds1
!i 250iyds i, ,: I ,
i,
, I
'Cofferdam subtotalI : II iI ,I
,
i !Subtotal II
I
! I I
I I,
i: I I
! i ,,
I i,i
I ,I
,,
! ,,
i ,
,i
,
i
ii
!! I-
IContingencies (25%)Field Cost
,Contract Cost :
i
I
iUnlisted items(20%)
21Cofferdaming
, ,_. -->-'------------:'-------------------!----
!
, ISubtotal
:assumes earth i
!Mobilization anq preparatory work
1-__-,'__,:-,ri:.o=p.=rap .I
I iunwatering (20-+ of above)
,
QUANTITIES I PRICESi-----------·.....cc--'--'-'-.:..;-:-=-=----------------,---~----.:...:...:=:=---------~---- _BY CHECKED BY CHECKED--_._------- - -- -----..:='-=-=..:...:=-------------_._-_._----------~_._---=-=---------~--------B. Mefford!?AT~fREPARED' _-=~~APPROVED--- -=-~----~ATE ---:~:_~-:---;PRic-E--L-E-V-E-L---~---__-__:=--==:
12/6/99 i 0111112000 I
References
Stewart, P.A. 1986, 1988, 1990, 1991. Fish Management Surveys. Federal Aid in FishRestoration, Project F-30-R-22, Montana Department ofFish, Wildlife and Parks., Helena.
Hiebert, S., Wydoski, R., Parks, T., January, 2000. Fish Entrainment at the Lower YellowstoneDiversion Dam, Intake Canal, Montana 1996-1998, Bureau of Reclamation Denver Office andMontana Area Office.
Mefford, B., January 1999. Lower Yellowstone River - Water Diversion Inventory, Fish Passageand Protection Study, Bureau of Reclamation Water Resources Research Laboratory andMontana Fish Wildlife, and Parks.
38