Embed Size (px)
Citation preview

Intact Polar Lipids in the Environment
MOG April 21, 2011 Kim Popendorf

Intact Polar Lipids:
• Structure • Diversity • Biogeochemical significance • Lipid analytical methods • Studying microbial lipid sources • Other applications of membrane
lipids
2
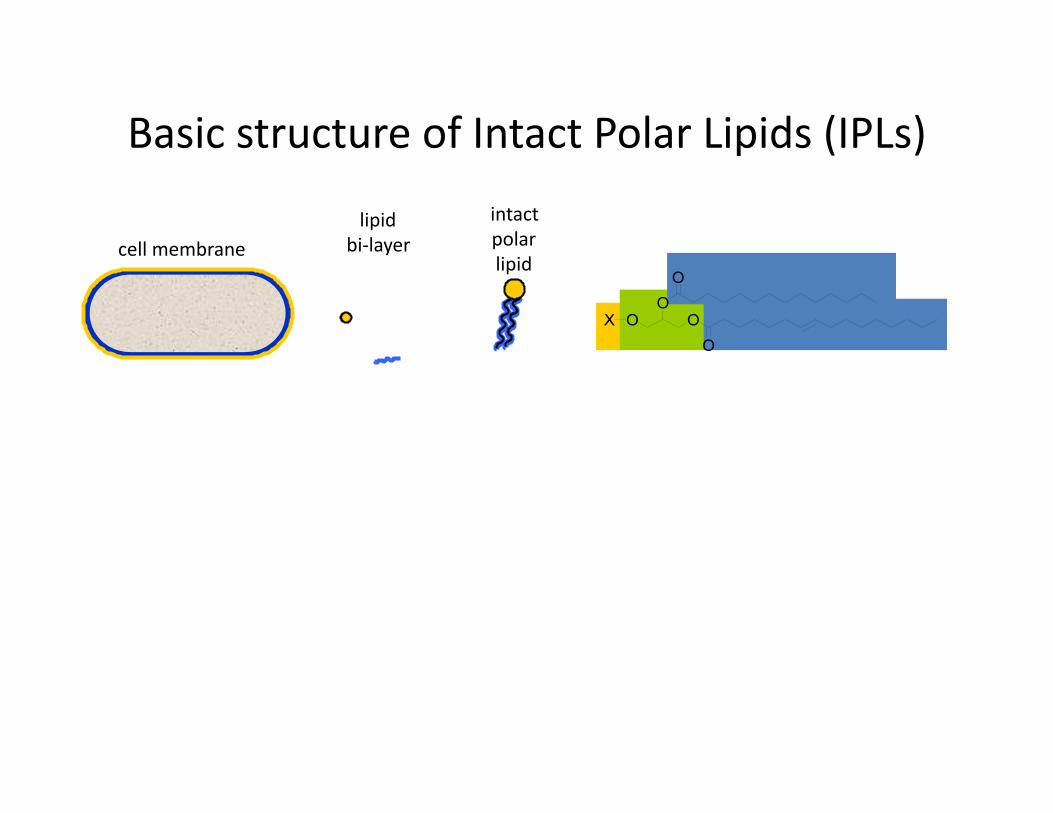
Basic structure of Intact Polar Lipids (IPLs)
intact polar lipid
lipid bi‐layer cell membrane
cell
‘head group’
‘faBy acids’ glycerol
IP‐DAG Made by
prokaryotes & eukaryotes
IP‐AEG IP‐DEG Made by archaea
3

Structure: FaBy acids
• Major defining features: – carbon chain length – unsaturations
• Define the fluidity of membrane – Length and unsaturation varies with
• Microbial source • Temperature • Pressure (ie depth)
• Common range of FAs: – C14 to C24 – Most abundant in ocean are C16 & C18 – Even c#’s dominate (acetogenic) – Odd carbon chains usually from
bacteria • Analysis of FAs by GC-FID, -MS, -IRMS • Specific FAs used as biomarkers for
microbes
Examples of fatty acids:
C18:3
C14:0
Popendorf unpublished data
4

Structure: FaBy acids
Van Mooy & Fredricks, GCA 2010
Diversity of IP-DAGs in the South Pacific euphotic zone
5

Structure: Headgroups
• Intact polar lipids = headgroup+fatty acid • Headgroup bond to glycerol is labile => IPLs represent live cells • Analysis of intact polar lipids (headgroup+fatty acids) by HPLC-MS
Major headgroups for marine microbes:
6

Importance for biogeochemical cycles:
• Membrane lipids compose 11-23% of planktonic carbon (Wakeham et al. DSR 1997)
• Phospholipids can be 1-28% of the cellular phosphate needs (Van Mooy et al. PNAS 2006)
• Substantial and variable cellular nutrient requirement
Contains P Contains C Contains N, no P
7

Idea of membrane lipid substitution: • A lot of cellular demands for nutrients:
• As an adaptation to phosphate stress, microbes can substitute non-phospholipids for phospholipids in their membranes
• Proposed in 1990’s by Christoph Benning, followed up by studies in the environment & cultures by Ben Van Mooy 2000’s
DIP
DIN
Cellular P
Cellular N
Lipids DNA Proteins
DON PON
DOP POP
Phosphate replete: Phosphate deplete:
8
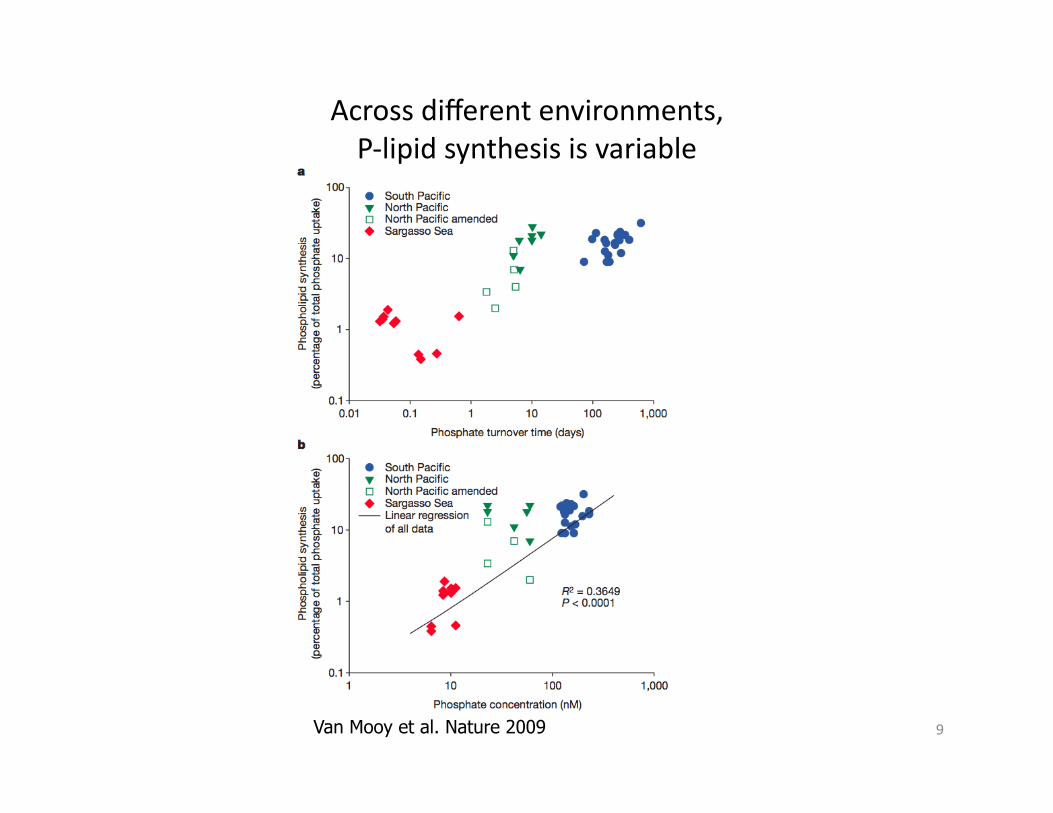
Van Mooy et al. Nature 2009
Across different environments, P‐lipid synthesis is variable
9

SubsZtuZon occurs rapidly in culture Thalassiosira pseudonana
MarZn, Van Mooy, Heithoff, Dyhrman ISME Journal 2010 (modified with colored lines)
10

Van Mooy et al. Nature 2009
When faced with P‐stress, adjust membrane composiZon
Ability (may be) limited to specific groups of microbes! 11
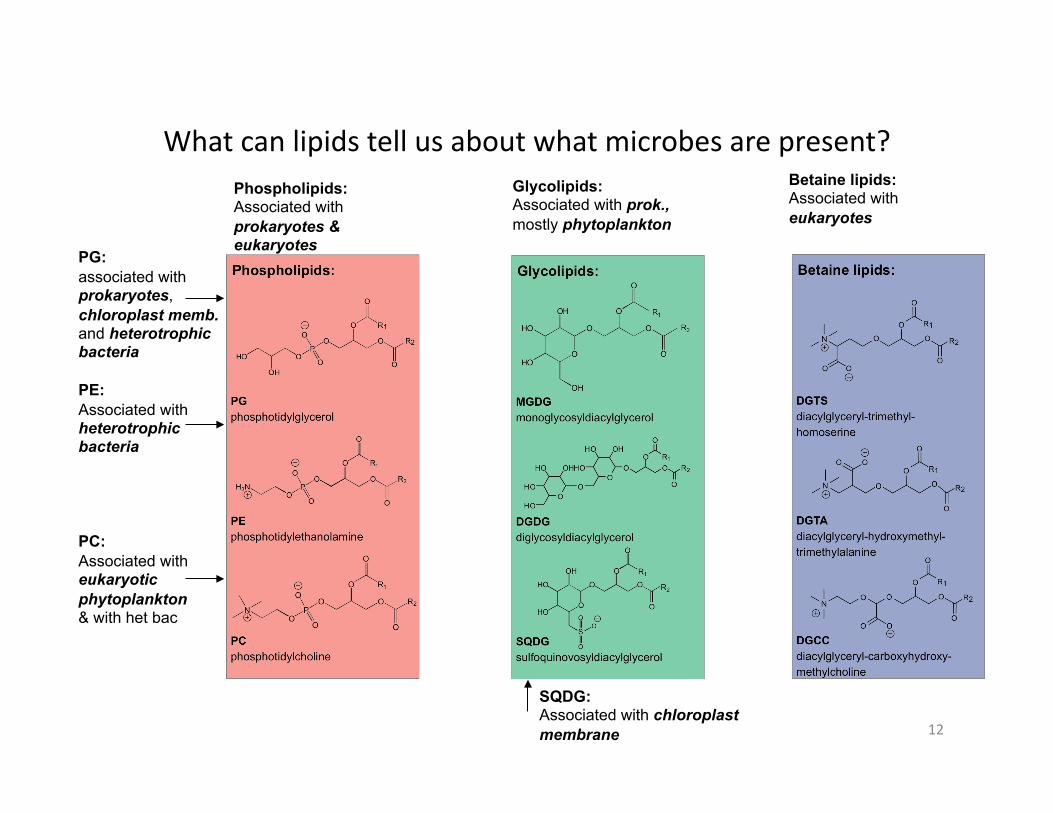
What can lipids tell us about what microbes are present?
PG: associated with prokaryotes, chloroplast memb. and heterotrophic bacteria
PE: Associated with heterotrophic bacteria
PC: Associated with eukaryotic phytoplankton & with het bac
Glycolipids: Associated with prok., mostly phytoplankton
Betaine lipids: Associated with eukaryotes
SQDG: Associated with chloroplast membrane
Phospholipids: Associated with prokaryotes & eukaryotes
12
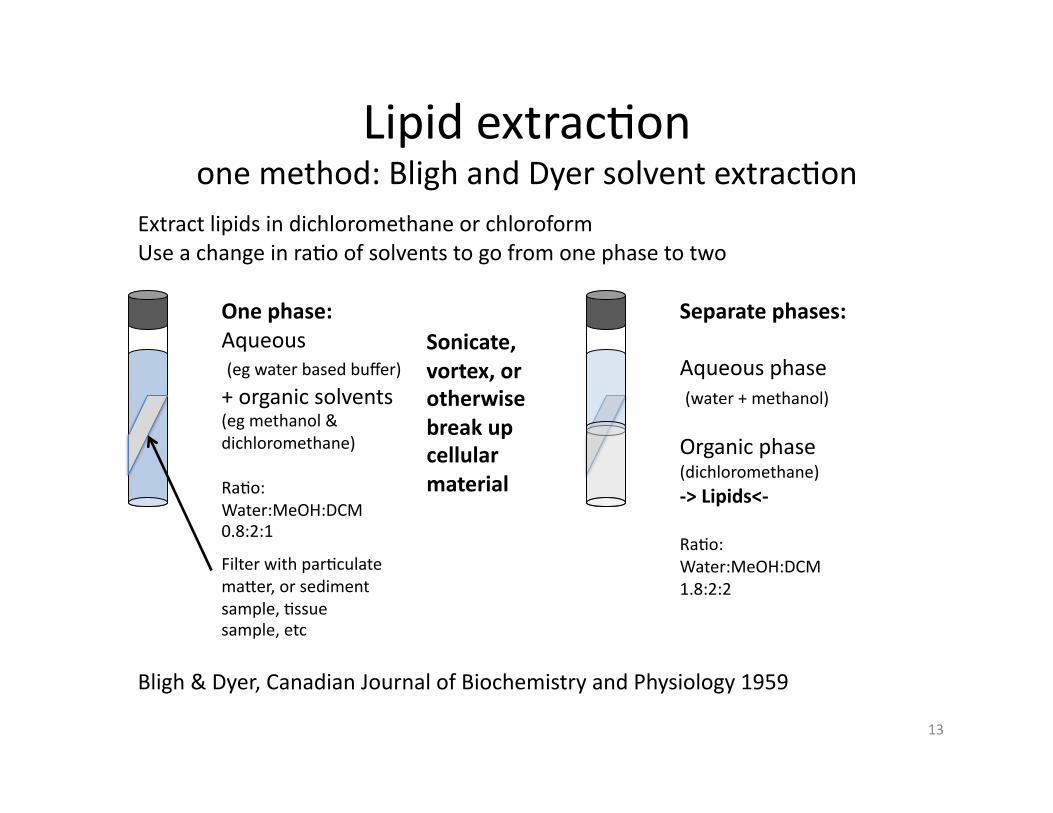
Lipid extracZon one method: Bligh and Dyer solvent extracZon
Bligh & Dyer, Canadian Journal of Biochemistry and Physiology 1959
One phase: Aqueous (eg water based buffer) + organic solvents (eg methanol & dichloromethane)
RaZo: Water:MeOH:DCM 0.8:2:1
Filter with parZculate maBer, or sediment sample, Zssue sample, etc
Sonicate, vortex, or otherwise break up cellular material
Separate phases:
Aqueous phase (water + methanol)
Organic phase (dichloromethane) ‐> Lipids<‐
RaZo: Water:MeOH:DCM 1.8:2:2
Extract lipids in dichloromethane or chloroform Use a change in raZo of solvents to go from one phase to two
13

Lipid analysis:
HPLC- ESI – MS High pressure Electrospray Mass Liquid chromatography Ionization Spectrometry
14
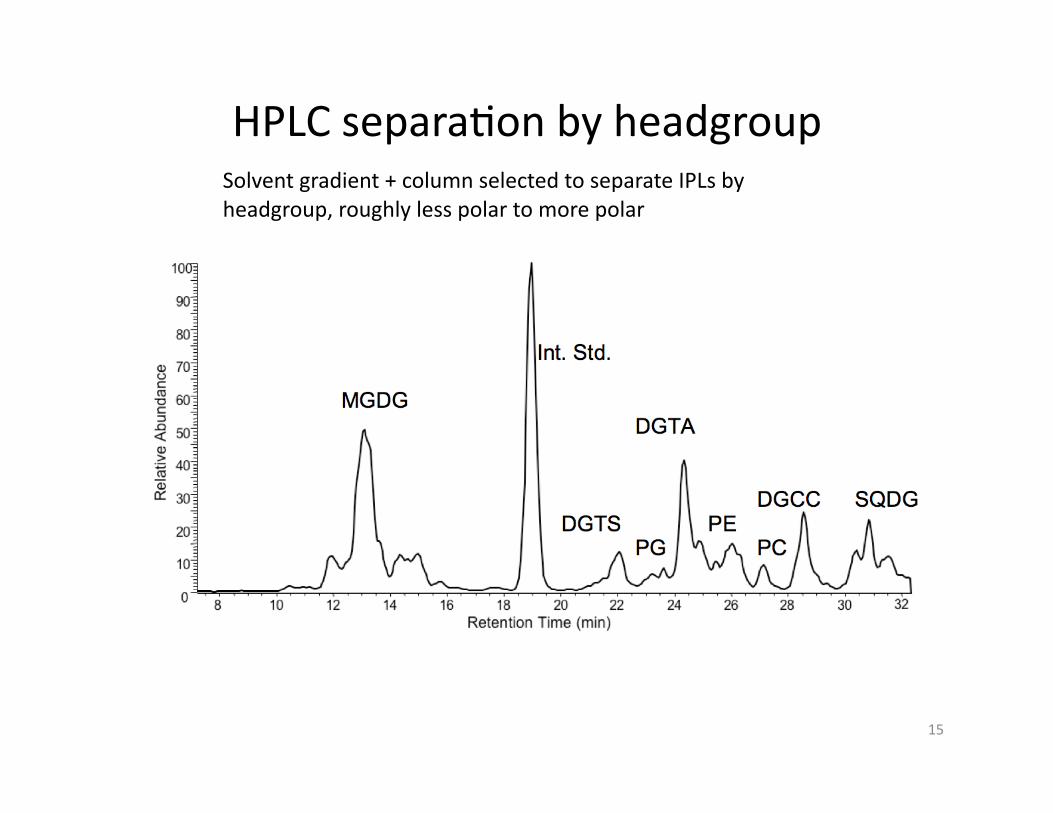
HPLC separaZon by headgroup Solvent gradient + column selected to separate IPLs by headgroup, roughly less polar to more polar
15
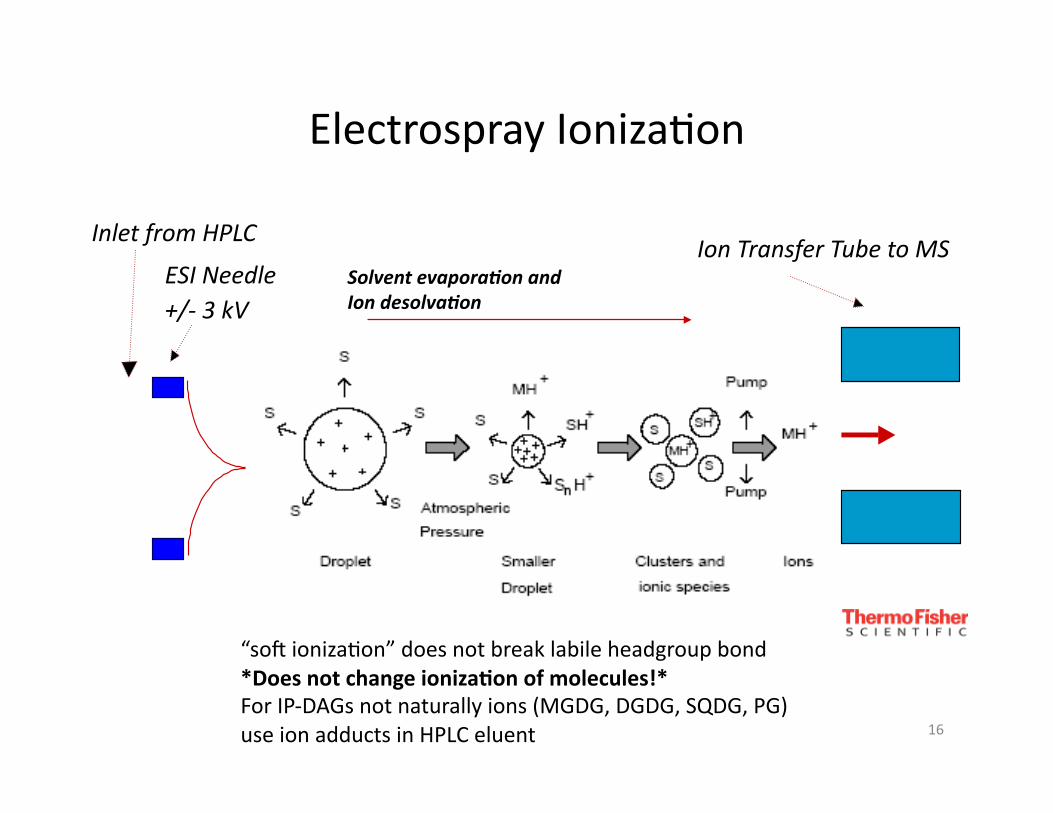
Electrospray IonizaZon
Ion Transfer Tube to MS ESI Needle +/‐ 3 kV
Solvent evapora,on and Ion desolva,on
Inlet from HPLC
“soj ionizaZon” does not break labile headgroup bond *Does not change ionizaBon of molecules!* For IP‐DAGs not naturally ions (MGDG, DGDG, SQDG, PG) use ion adducts in HPLC eluent 16

QOO QO Q1 Hyperquad
Q3 Hyperquad
Q2 Collision Cell
DetecZon System
Ion Source Interface
Ion Transfer Tube Mass Analyzer
Mass Spectrometry example of triple quadropole system
Quadropole 1: detect masses Quadropole 2: fragment ions Quadropole 3: detect fragment masses
17

HPLC‐MS lipid analysis
In environmental samples, a large diversity of molecules exist for each headgroup class
18
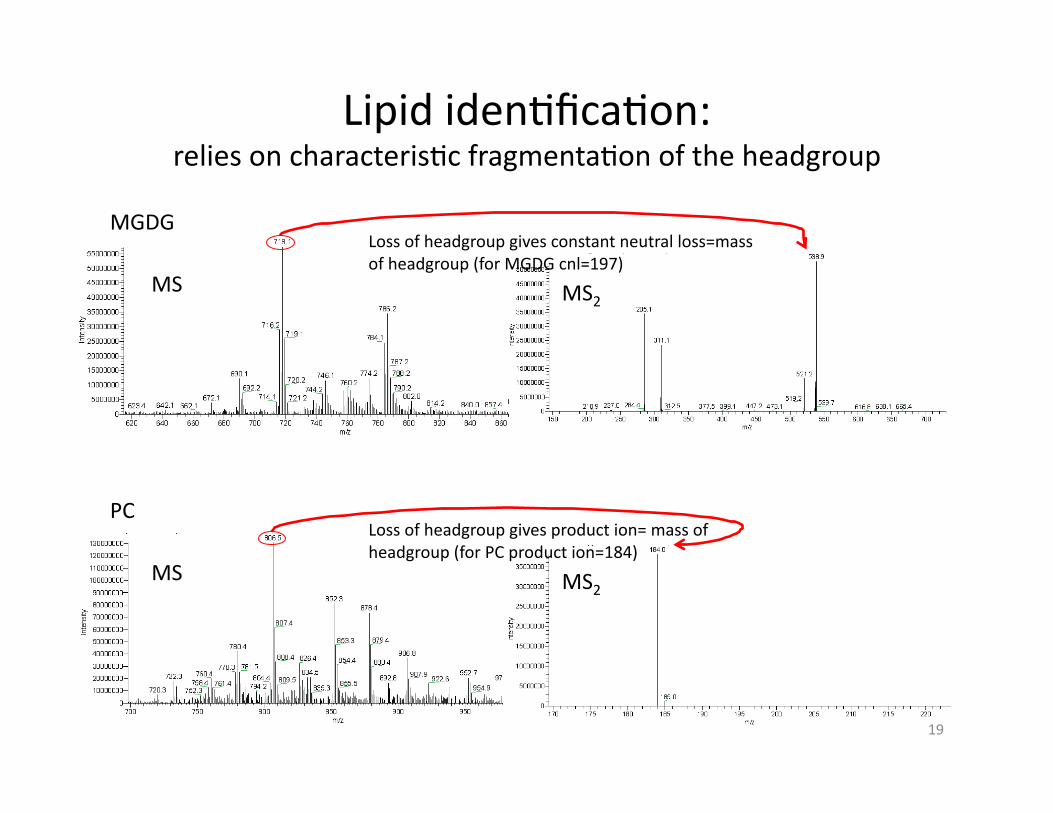
Lipid idenZficaZon: relies on characterisZc fragmentaZon of the headgroup
MGDG Loss of headgroup gives constant neutral loss=mass of headgroup (for MGDG cnl=197)
MS MS2
PC Loss of headgroup gives product ion= mass of headgroup (for PC product ion=184)
MS MS2
19

718
732
690
716
746
285
C14:0
311
C16:1
285
C14:0
309
C16:2
285
C14:0
309
C16:2
285
C14:0
339
C18:1
313
C16:0
Base peak molecular ions for MGDG
ms2 ms2
325
C17:1
257
C12:0
285
C14:0
20

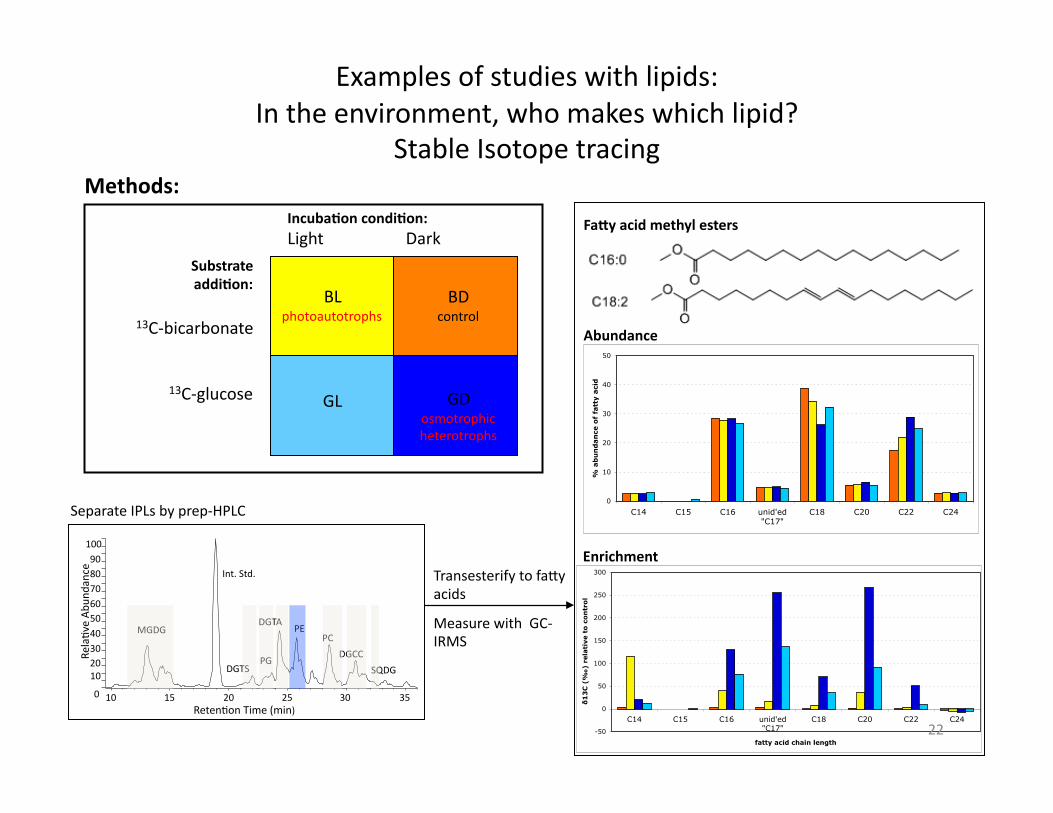
Examples of studies with lipids: In the environment, who makes which lipid?
• Stable isotope tracing
• Cell sorting flow cytometry
• Targeted incubations Filter seawater to remove grazers, incubate in the dark to select for heterotrophs
13C‐labeled bicarbonate
13C‐labeled lipids made by autotrophs
13C‐labeled glucose
13C‐labeled lipids made by heterotrophs
21
10 15 20 25 30 35 RetenZon Time (min)
0
20 30 40 50 60 70 80 90 100
RelaZve Abu
ndance
10
MGDG
Int. Std.
DGTS PG
DGTA PE
PC
DGCC
SQDG
Methods: IncubaBon condiBon: Light Dark
Substrate addiBon:
13C‐bicarbonate
13C‐glucose
BL photoautotrophs
GL
BD control
GD osmotrophic heterotrophs
Separate IPLs by prep‐HPLC
Transesterify to faBy acids
Measure with GC‐IRMS
FaHy acid methyl esters
Abundance
Enrichment
0
10
20
30
40
50
C14 C15 C16 unid'ed
"C17"
C18 C20 C22 C24
% a
bu
nd
an
ce o
f fa
tty a
cid
-50
0
50
100
150
200
250
300
C14 C15 C16 unid'ed
"C17"
C18 C20 C22 C24
fatty acid chain length
!1
3C
(‰
) r
ela
tive t
o c
on
tro
l
Examples of studies with lipids: In the environment, who makes which lipid?
Stable Isotope tracing
22

In the Sargasso Sea: SQDG and DGTS made by photoautotrophs PG made by heterotrophs
Examples of studies with lipids: In the environment, who makes which lipid?
Stable Isotope tracing
Popendorf et al. Org. Geochem. submiBed
23
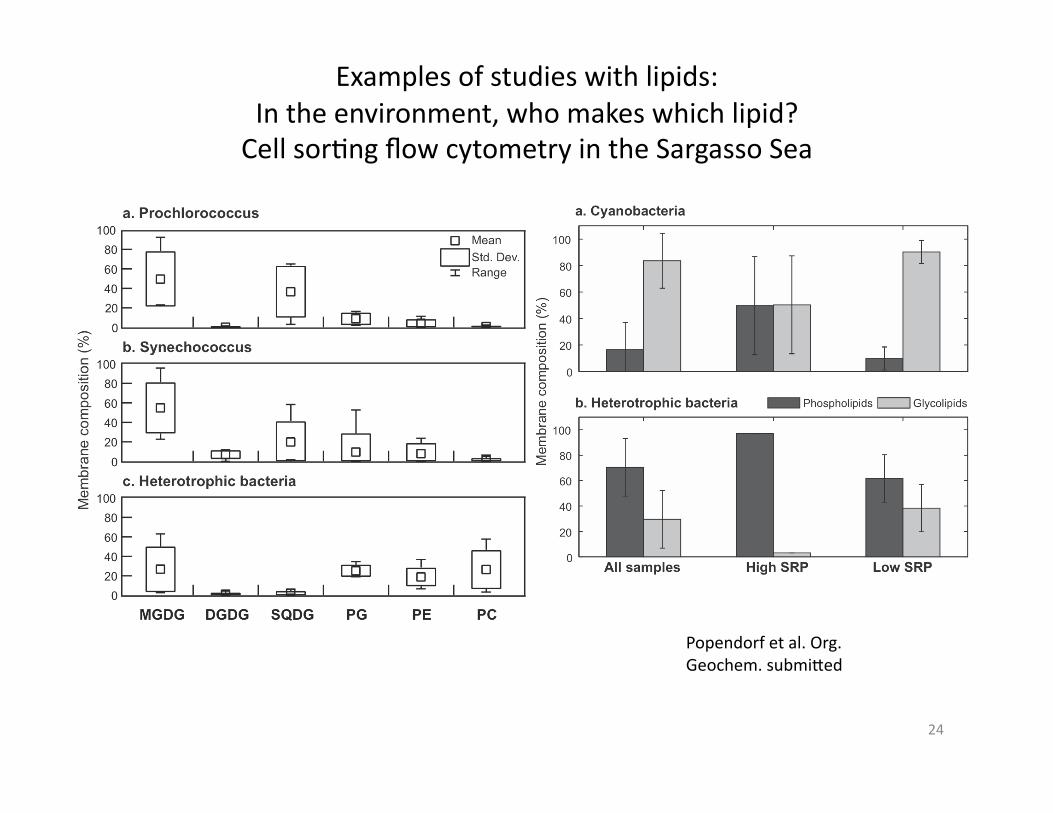
Examples of studies with lipids: In the environment, who makes which lipid? Cell sorZng flow cytometry in the Sargasso Sea
Popendorf et al. Org. Geochem. submiBed
24

Examples of studies with lipids: In the environment, who makes which lipid?
Targeted incubaZons 90% filtered seawater, 10% whole seawater, in the dark
25

ApplicaZons of membrane lipid studies: Phospholipid production as a measure of biomass production • Membrane production is obligate with cell growth
• Use addition of radioactive phosphate (33PO4) to trace production of phospholipids in a timed incubation
References: White L&O 1977 Fuhrman & Azam 1982 Van Mooy BGS 2008
26
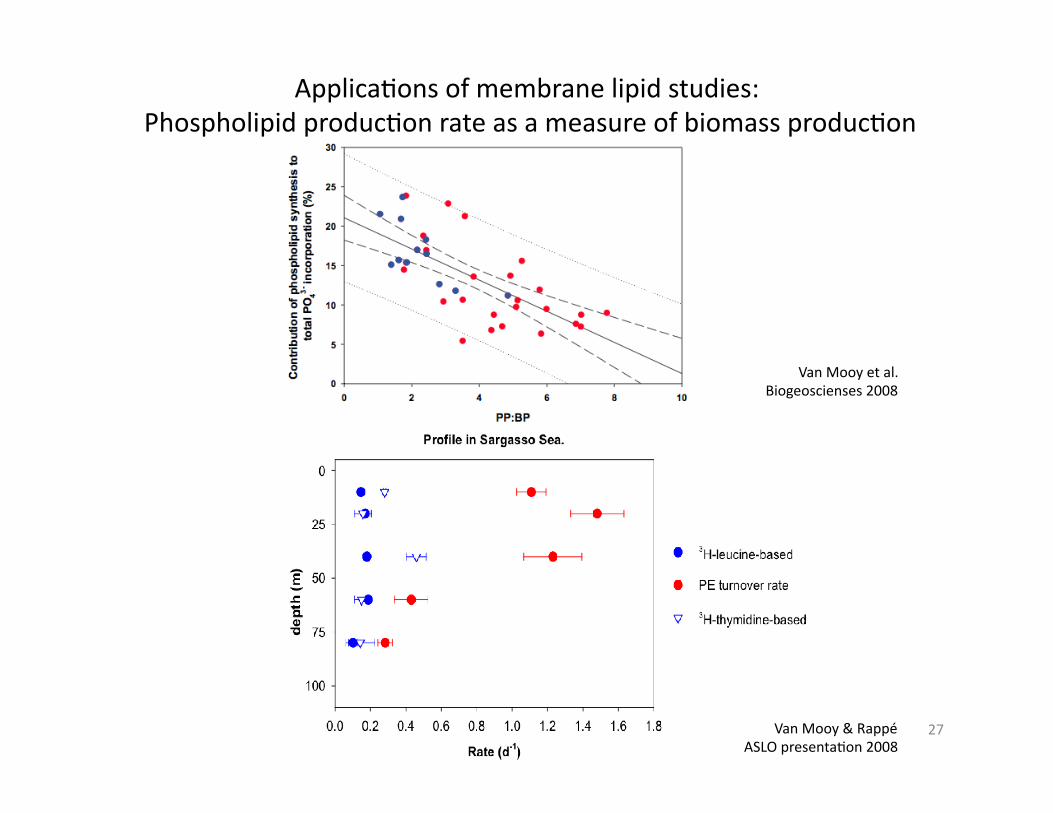
ApplicaZons of membrane lipid studies: Phospholipid producZon rate as a measure of biomass producZon
Van Mooy & Rappé ASLO presentaZon 2008
Van Mooy et al. Biogeoscienses 2008
27

ApplicaZons of membrane lipid studies: Membrane lipids as chemical signals
Vardi et al. Science 2009 A glycosphingolipid can induce programmed cell death in diatoms (E.hux)
Glycosphingolipid producZon is induced by viruses ‐> may play a key role in ending diatom blooms ‐> thus a role in carbon flux
28