Embed Size (px)
Citation preview

28
Sadaf et al. /Int.J.Econ.Environ.Geol.Vol. 8(2) 28-34, 2017
Delineation and Assessment of Hab watershed, Balochistan, Pakistan
through Geo-spatial Technology
Rakhshanda Sadaf1*, Syed Jamil H. Kazmi2, Isma Younes3, Sadia Khaleeq1
1 Department of Geology, Federal Urdu University of Arts, Science and Technology, Karachi, Pakistan 2 Department of Geography, University of Karachi, Pakistan
3 Department of Geography, University of Punjab, Lahore, Pakistan
*Email: [email protected]
Received: 21 October, 2016 Accepted: 20 December, 2016
Abstract: Water is one of the key elements of life and Pakistan is facing acute water shortage. The problem is more
severe in the mega cities like Karachi and nearby areas in which industries and population are growing at a very high
rate. Presently, Karachi is getting only about 55 percent of water against its fast increasing requirements leading to water
crises in Karachi city. The Hab River is one of the main and important water supply sources for Hab industrial estate and
Karachi. Therefore, it is extremely important to study this area with an aim to explore, develop and exploit its water
resources for the current and upcoming requirements of the area. This paper is about the investigation of the potential of
water resources in the Hab watershed through geo-informatics. Hydrological modeling has been done in GIS
environment, which outlines a complete picture of Hab watershed and provides assessment of the potential of the
watershed located in the Balochistan province of Pakistan. Watershed boundaries have been established and its area
has been estimated in GIS environment. Considering the large area, Hab watershed has been categorized as macro
watershed. Drainage characteristics of the watershed have been defined through GIS datasets, which were derived by
performing drainage analysis on a terrain model. Other key contributions of the study include stream network
analysis, flow accumulation and flow pattern analysis of the watershed.
Keywords: Geo-informatics, hydrological modeling, delineation, drainage network, watershed.
Introduction
Water is the basic element of life, without it there is
no concept of life. This vital source is presently
facing grave challenges for its existence on the face
of earth (WHO, 2009). The Hab River is one of the
main water supply sources for Karachi and Hab Estate
(Aftab, 1997). No considerable investment has been
made during last 32 years for exploration, preservation
and development of water resources of the area. This
area therefore, needs focused attention with respect to
exploration, development and exploitation of its water
resources. About 100 million gallons designed water
supply to Karachi from Hab reservoir is intermittent
and protracted for the last four years. Termination of
water supply from this source has added more
difficulties in water crises of Karachi (Daily Express
Tribune, 2016). Hab watershed is considered one of the
vital sources to be explored, developed and exploited
for the present and future needs of the region (Sadaf,
2014).
This paper investigates the potential of water resources
in Hab catchment through Geo-informatics. Main
objective of this study is characterization of Hab
watershed through hydrological modeling. GIS is
one of the latest technologies, which provide efficient
tools and environment for managing geographical data
in digital format. The key elements include bringing the
data in suitable form, undertaking spatial analysis, and
modeling post processing outcomes (Goodchild, 1993).
Hydrological parameters are very important and most
significant tool for the assessment of water resources.
Drainage analysis helps to analyze the characteristics of
watershed like delineation, modeling, runoff modeling,
suitable site selection for water recharge and discharge
(Sreedevi et al., 2013; Javed et al., 2009; Thomas et
al., 2012). Drainage network analysis provides the vital
information about a basin, includes present and past
geological variation, topographic information and
structural information etc. Drainage analysis technique
in GIS and Remote sensing environment has been
adopted by many scientists and researchers
(Grohmann, 2004; Magesh et al., 2011).
Integrated approach of GIS and Hydrological modeling
has brought revolution in the field of hydrological
analysis. These GIS based techniques and approaches
are very fast and effective as compared to manual
approaches and also give the comprehensive,
reproducible and accurate analytical outputs/results.
Many researchers have discussed in detail about the
potential of GIS application in the field of water
resources (Tribe, 1991; Walsh, 1992; Leipnik et al.,
1993). GIS is very useful in the field of water resource
management and its integration with hydrological
modeling provides efficiently new dimensions for
multi-objective analysis with precision (Band and
Open Access ISSN: 2223-957X
www.econ-environ-geol.org
Copyright © SEGMITE
Int. J. Econ. Environ. Geol. Vol. 8 (2) 28-34, 2017
Journal home page: www.econ-environ-geol.org
Open Access
ISSN: 2223-957X

29
Sadaf et al. /Int.J.Econ.Environ.Geol.Vol. 8(2) 28-34, 2017
Moore, 1995; McDonnell, 1996). GIS is efficient tool
for the mapping of water routing, its patterns,
information about the network of channels,
catchment/drainage area and its characteristics like
divides, slope and other aspects etc (Jenson and
Domingue, 1988; Mark, 1984; Moore et al., 1991;
Martz and Garbrecht, 1992). Drainage network for
watershed derivation from SRTM data is considered very
reliable and important. Arc Hydro tool in GIS
environment very effectively calculates the stream
network of drainage basin.
Any geographical area which contributes water as a
overland flow to rivers, streams, any pond, swamp, or
sea is defined as a watershed. In short, catchment area
which is completely drained by any stream and its
network is known as watershed. It can be divided or
segmented in many small watersheds. One part or
segment of watershed is called sub watershed.
Study Area
The study has been conducted on the Hab River, which
originates from Porali River System in Balochistan,
Pakistan. It is located at the margin of Sindh and
Balochistan provinces. Its geographical location is
24°80" S and 27°62" N, 66°67" W and 67°49" E. (Fig. 1,
2). Hab River originates from the Khuzdar mountain
series approximately 200 miles in the north direction
of Cape Monze and height from sea level is about
6,000 ft. It is surrounded by mountains and is long and
narrow in shape. The flow direction of Hab River is
north south, just around the boundary of two
provinces of Pakistan, Balochistan and Sindh and
finally terminates in to the Arabian Sea (WAPDA,
1993).
The material and methodology used in this study can
be categorized as following.
• Digital Data (Satellite imageries and DEM
data)
• Arc Hydro System
• Hydrological modeling
Landsat Satellite Image
Satellite Remote Sensing (SRS) technology is very
useful for scanning earth's surfaces and provides high
resolution satellite images. In present study, Landsat
images are used to project study area, which was
downloaded through USGS website (http://earthex
plorer.usgs.gov).
Digital Elevation Model (DEM)
Digital Elevation Models (DEM) is defined as grid-
based GIS coverage representing elevation. It is used
to display topographic information (USGS, 2012). 30 m
DEM data have been utilized in this study for the
Hydrological modeling.
Arc Hydro System
Arc Hydro system is used for water based analysis. It
works in GIS environment and has a set of tools,
which facilitate the analyses performed for water
resource management and their hydrological modeling.
For the assessment of a watershed, it is important to
monitor the flow pattern and its effects across the area.
Fig.1 Location map of study area (Hab watershed).
Fig. 2 Large view of study area.

30
Sadaf et al. /Int.J.Econ.Environ.Geol.Vol. 8(2) 28-34, 2017
To understand the flow of water in a watershed,
modeling is a tool, which gives the detailed information.
It has the capacity to estimate many properties of a
watershed like physical components of a basin,
identification of sinks or holes, flow direction and
accumulation, segmentation and stream networks
creation. DEM data is very useful for the hydrological
modeling of any watershed (Fig. 3).
Results and Discussion
Size of Hab Watershed
Boundaries of study area were defined and size was
calculated in ArcGIS environment. The total
estimated watershed area is 14,386 km2 (Sadaf, 2014).
According to standard classification with respect to size,
study area is categorized as a Macro Watershed (US
EPA, 2008). Size of a watershed has direct effects on its
different attributes like its storage characteristics,
morphological and hydrological properties. Well-
developed channel network and high storage are the
main characteristics of a large watershed, which
protects it from the effects of short spells of high
precipitation. Whereas, a short spell of heavy
precipitation has direct effect on small watershed
(Youngbo and Florimond, 2004).
Drainage analysis of Hab watershed
Drainage analysis was done in GIS environment
through a terrain model. As a result, many datasets
were derived, which describe the basin of the Hab
watershed in detail. Derived datasets include flow
direction and accumulation, stream network
segmentation, delineation and segmentation of
watershed. These datasets provide a vector
representation of stream network and catchment area,
which help to develop a geometric network.
Digital elevation model can have errors. If some cells
are in lower positions than others cells on any location
in DEM, then water will move into the lower cells and
will not be able to travel outside. These lower positions
or depressions in elevation model are termed sinks,
Hydrological modeling helps to identify such
depressions or sinks, which are filled to make
depression less elevation model (Fig. 4). Subsequently,
flow direction is derived by this depression less
elevation model.
Fig. 3 Methodological scheme for hydrological modeling (Source, ESRI, 2011).
31
Sadaf et al. /Int.J.Econ.Environ.Geol.Vol. 8(2) 28-34, 2017
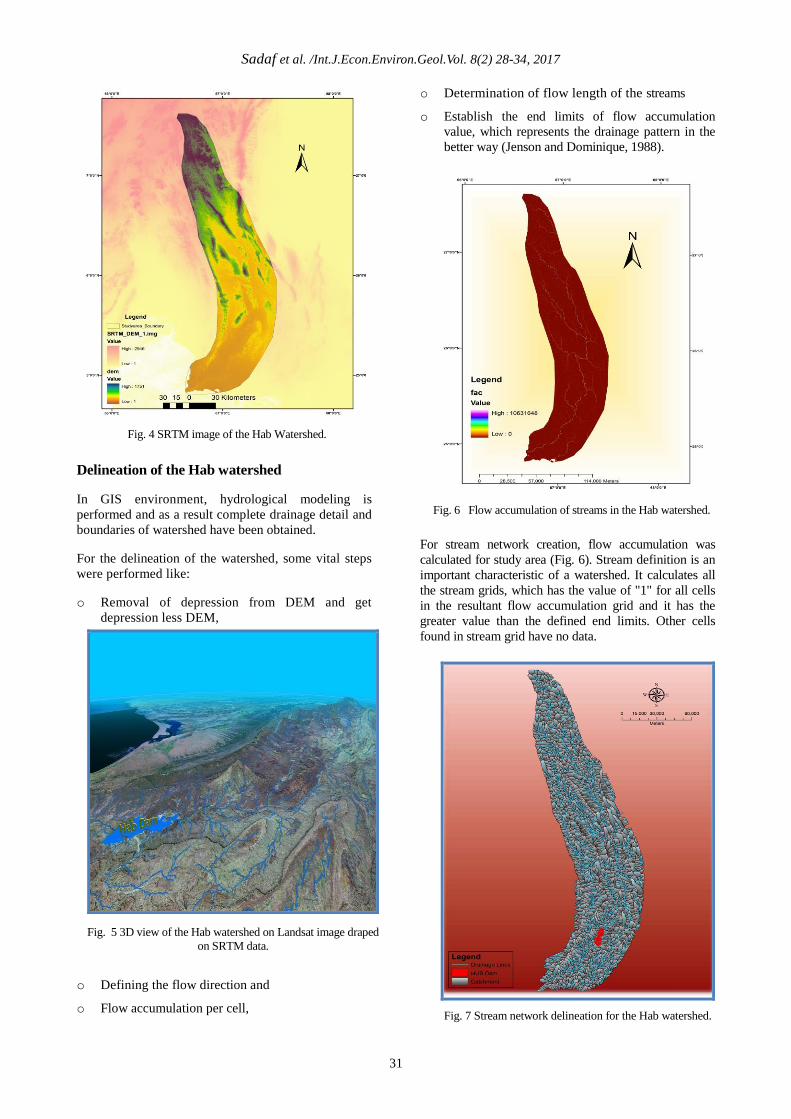
Delineation of the Hab watershed
In GIS environment, hydrological modeling is
performed and as a result complete drainage detail and
boundaries of watershed have been obtained.
For the delineation of the watershed, some vital steps
were performed like:
o Removal of depression from DEM and get
depression less DEM,
o Defining the flow direction and
o Flow accumulation per cell,
o Determination of flow length of the streams
o Establish the end limits of flow accumulation
value, which represents the drainage pattern in the
better way (Jenson and Dominique, 1988).
For stream network creation, flow accumulation was
calculated for study area (Fig. 6). Stream definition is an
important characteristic of a watershed. It calculates all
the stream grids, which has the value of "1" for all cells
in the resultant flow accumulation grid and it has the
greater value than the defined end limits. Other cells
found in stream grid have no data.
Fig. 7 Stream network delineation for the Hab watershed.
Fig. 6 Flow accumulation of streams in the Hab watershed.
Fig. 5 3D view of the Hab watershed on Landsat image draped
on SRTM data.
Fig. 4 SRTM image of the Hab Watershed.

32
Sadaf et al. /Int.J.Econ.Environ.Geol.Vol. 8(2) 28-34, 2017
Selection of threshold value is also an important step
for the delineation of watershed. It depends on the
objective of study. If threshold value is small then it
gives a dense stream network. Standard threshold
value used with the national elevation dataset is 5,000
cells or 4.5 km2 when the cells are 30 meters (Yunker,
2008).
In the present study, a realistic model is prepared with
detailed drainage, which potentially carries surface
water to the reservoir (Fig. 7). Stream segmentation
with unique identification, termed "grid code" was
created. Through these grid codes complete stream
network including main and small streams of the study
area is clearly identified and defined (Fig. 8). All
streams of a stream network have different Hydro IDs,
Grid IDs and lengths, which represents the detailed
picture of the complete drainage network of watershed.
Fig. 8 Stream segmentation of the Hab watershed with specific
grid code.
Fig. 10 Hab catchment delineation and its attribute.
Fig. 11 Stream network of the Hab watershed calculated
through hydrological modeling.
Fig. 12 Map overlay of study area.
Fig. 9 Catchment grid delineation of the Hab watershed.

33
Sadaf et al. /Int.J.Econ.Environ.Geol.Vol. 8(2) 28-34, 2017
Catchment grid delineation
Catchment grid delineation function, created a grid for
each catchment cell (Fig. 9) with a value (grid code).
Catchment area is identified through this grid code and
its value found in stream segment link grid (Fig. 10).
Hydrological modeling of the study area provided
some important findings, which are shown in Table 1.
Detailed stream network till 6th order is calculated
through hydrological modeling (Fig. 11). Map overlay is
shown in Figure 12.
Conclusion
Hab watershed has been delineated through
hydrological modeling and subsequently network
extraction. Conversely manual extraction is a tedious,
time consuming job and susceptible to mistakes. The
results of the hydrological modeling are very
satisfactory, detailed and speedy as compared to
traditional methods.
Quality of analytical results is determined by the
resolution and quality of DEM data. In this study 30 m
DEM data was utilized. Results are reliable and
provide a complete and detailed picture of the Hab
Watershed. Based on size classification, Hab watershed
falls into macro watershed (> 50,000 Hect) category. In
GIS environment, Hab watershed boundaries are
established and its area has been calculated.
Results from drainage analysis provided subsequently
different datasets, which collectively describe the
characteristics of the Hab watershed. Main
characteristics of watershed include catchment
segmentation, catchment delineation, stream network
delineation and stream order etc. Owing to large size
of study area, it would have been uphill task to
calculate its stream order through traditional manual
methods and delineate the basin. GIS provided an
opportunity for calculation of the stream order of the
watershed till 6th order, its distribution in sub-basins
and accurate delineation. It has long catchment,
therefore in rainy season, huge amount of water
contributes the river, which flows from upper
catchment area in south. The results demonstrate high
capacity of ArcHydro for watershed simulation.
Drainage pattern of the Hab River shows that flow of
the river is not smooth and straight from origin to the
Arabian Sea. Characteristics of the watershed acquired
from DEM data set in Table 1 show that the Hab
Macro watershed has an area of 14,386 km2 with 1806
small catchments and 0.4 drainage density, indicating
huge potential of water resources, which need to be
developed for satisfying the requirement of the region.
Acknowledgement
Author acknowledges the Federal Urdu University of
Science and Technology, Karachi for the help and
support during the Ph.D. studies.
References
Aftab, M. (1997). Hydrogeology and groundwater
resources of Balochistan, Pakistan. An Overview.
ACTA Mineralogical Pakistanica, 8, 30-38.
Band, L. E., Moore, I. D. (1995). Landscape attribute
and geographical information Systems. In: Scale
Issues in Hydrological Modeling. Advances in
Hydrological Processes. Willey and Sons,
Chichester, 9, 159-180.
Table 1. Key characteristics of the Hab watershed calculated through hydrological modeling.
Minimum (smallest catchment grid) 0.0009
Maximum (largest catchment grid) 62.8549
Sum (Total catchment grids in the study area) 1,809.0000
Mean 7.5852
Standard deviation 6.3845
Total length of drainage (km) 5,707.6362
Drainage density 0.3967
Total area of watershed (km2) 14,385.9436
Total catchments grid area in Hab watershed (km2) 13,721.6527

34
Sadaf et al. /Int.J.Econ.Environ.Geol.Vol. 8(2) 28-34, 2017
Daily Express. (2016). Water supply to Karachi should
be streamlined. http://tribune.com.pk. Accessed 23
March 2016.
Environment Systems Research Institute, (2011).
ArcGIS Desktop, Release 10. ESRI Press,
Redlands, CA.
Goodchild, M. F. (1993). Data models and data
quality: problems and prospects. In: M. F. Good
child; B. O. Parks and L.T. Steyaert (eds.),
Environmental Modelling with GIS, Oxford
University Press, New York, 8–15.
Grohmann, C. H. (2004). Morphometric analysis in
geographic information systems: applications of free software. Comput. Geosci., 30, 1055–1067.
Javed, A., Khanday, M., Ahmed, R. (2009).
Prioritization of sub-watershed based on
morphometric and land use analysis using remote
sensing and GIS techniques. J. Indian Soc. Remote
Sensing, 37, 261- 274.
Jenson, S. K., Domingue, J. Q. (1988). Extracting
topographic structures from digital elevation data
for geographic information system analysis. J.
Photogrammetric Engineering and Remote
sensing, 54 (11), 1593-1600.
Leipnik, M. R., Kemp, K. K., Loaiciga, H. A. (1993).
Implementation of GIS for water resources
planning and management. J. of Water Resource
Planning and Management, 119 (2), 184–200.
Magesh, N., Chandrasekar, N., Soundranayagam, J.
(2011). Morphometric evaluation of Papanasam
and Manimuthar watersheds, parts of Western
Ghats, Tirunelveli district, Tamil Nadu, India: a
GIS approach. Environ. Earth Sci., 64, 373–381.
Mark, D. M. (1984). Automatic detection of drainage
networks from digital elevation models.
Cartographica, 21,168 -178.
Martz, L.W., Garbrecht, J. (1992). Numerical
definition of drainage network and sub catchment
areas from digital elevation models. Computers
and Geosciences, 18 (6), 747-761.
McDonnell, R. A. (1996). Including the spatial
dimension: Using geographical information systems
in hydrology. Prog. Physical Geography, 20 (2),
159-177.
Moore, I. D., Grayson, R. B., Ladson, A. R. (1991).
Digital terrain modeling: A review of hydrological,
geomorphological and biological applications.
Hydrological Processes, 5 (1), 3-30.
Sadaf, R. (2014). Watershed modeling of Hab River
valley, Baluchistan Pakistan through RS and GIS
Techniques. Unpublished Ph.D. Dissertation.
Department of Geography, University of Karachi.
Sreedevi, P. D., Sreekanth, P. D., Khan, H. H., Ahmed,
S. (2013). Drainage morphometry and its
influence on hydrology in a semi-arid region:
using SRTM data and GIS. Environ Earth Sci., 70,
839-848.
Thomas, J., Joseph, S., Thrivikramji, K., Abe, G.,
Kannan, N. (2012). Morphometrical analysis of
two tropical mountain river basins of contrasting
environmental settings, southern Western Ghats,
India. Environ Earth Sci., 66, 2353-2366.
Tribe, A. (1991). Automated recognition of valley
heads from digital elevation models. Earth surface
processes and Landforms, 16, 33-49.
United States Geological Survey (2014) Landsat
images. http://earthexplorer.usgs.gov [Accessed
13/12/2015].
USGS, (2012). SRTM mission summary. https://lta.cr.
usgs.gov [Accessed 22/12/2012].
United States Environmental Protection Agency
(2008). Handbook for developing watershed plans
to restore and protect our waters. EPA 841-B-08-
002.
Water and Power Development Authority (WAPDA)
Lahore, (1993). Ground water Resources of
Balochistan Province Pakistan.,
Walsh, M. R. (1992). Toward spatial decision support
systems in water resources. Journal of Water.
Resources Planning and Management, 109 (2), 158–
169.
World Health Organization (2009). Guidelines for
drinking-water quality (4th Edition). Library
Cataloguing-in-Publication Data. ISBN 978 92 4
154815 1 (NLM classification: WA 675).
Yongbo, L., Florimond, D. S. (2004). WetSpa
Extension, A GIS-based hydrological Model for
flood prediction and watershed management,
Documentation and User Manual, Department of
Hydrology and Hydraulic Engineering, Vrije
Universiteit Brussel, Belgium.
Yunker, D. (2008). ArcGIS Desktop discussion forums
Esri. http://forums.esri.com/forums.asp?c=93