Embed Size (px)
Citation preview

FINANCIAL SERVICES
Insurance ReportingRound-Up
Survey based on the 2013 year-end results of major European insurers
August 2014
kpmg.de/insurance

1. Summary 3
2. At a Glance 4
3. Key Performance Indicators 6
4. Financial Performance 12
5. Embedded Value (EV) 16
6. Premiums and New Business 20
7. Investments and Intangible Assets 24
8. Capital, Risk and Solvency 30
9. Basis of Preparation 36
Glossary 38
Contents
© 2014 KPMG AG Wirtschaftsprüfungsgesellschaft, a member fi rm of the KPMG network of independent member fi rms affi liated with KPMG International Cooperative (“KPMG International”), a Swiss entity. All rights reserved. The KPMG name, logo and “cutting through complexity” are registered trademarks of KPMG International.

Summary Summary
Profi tability
The aggregate IFRS profi t or loss before tax earned by the 17 surveyed companies increased by 15.1 percent compared to prior year. Results were mixed on an individual company level with the majority of the companies reporting an increase in their IFRS profi t or loss before tax. Lower impairment losses, the disposal of a business part or the improvement of the investment result were mentioned as reasons for increases by different insurers.
Investment returns were affected by negative investment returns in other comprehensive income and therefore decreased for the majority of the companies within the survey. However, it could be observed that the investment income (i.e. income from interest and dividends) has been relatively stable during the last three years.
Considering the development of costs and claims, the average combined ratio amounted to 94.8 percent and thus further declined. In 2012 and 2013 the combined ratios were less impacted by natural catastrophe losses but more infl uenced by cost reduction and cost controlling strategies.
New business
Total net earned premiums for the non-life business increased by 1.9 percent, but growth slowed down considerably com pared to prior year. For a number of the insurers this development derived more from exceptional items such as currency effects or portfolio restructuring than from the market itself.
Concerning the life insurance business, the present value of new business premiums grew by 2.9 percent with mainly positive performances on an individual company level. The companies with the strongest increase mainly operate in the UK and benefi ted from law amendments leading to the requirement that by 2018 every employer must by law automatically enrol workers into a workplace pension scheme.
Balance sheets
In contrast to 2012, the majority of insurers reported a decreasing equity in 2013, largely driven by lower retained earnings and reserves for unrealized gains and losses on
available for sale debt securities. In line with this, the average Solvency I ratio also decreased. Several reasons for this development were stated, among them: Lower unrealized gains on fi xed income, dividend payments, acquisitions and the new IAS 19 methodology affecting the value of the employee benefi ts.
Financial reporting
As in previous years, this publication reveals the diversity in accounting and reporting practices that exists among the insurers in Europe. As is known currently, the lack of consis tency makes it diffi cult for analysts and investors to compare the fi nancial performance of an insurance company with its peers. Although one can assume that with the upcoming implementation of IFRS 4 – Phase II this problem is about to be solved to some extent, we believe that the use of non-GAAP profi t measures with a “company-specifi c” defi nition will continue; not least because of the enormous change the introduction of the fi nal IFRS 4 – Phase II will mean for the insurers.
As presumed last year, the upcoming requirements of Solvency II – with the preparatory phase already started at the beginning of the year 2014 – are refl ected by a further increased use of solvency ratios as one of the most prominent key performance indicators. Two-thirds of the surveyed insurers included at least one solvency measure in their key performance indicators this year and also the number of insurers using economic solvency ratios as key performance indicator rose.
It remains to be seen how different insurers will approach the presentation and disclosure within their new “current value world” of Solvency II and IFRS 4 – Phase II. We believe that, by trend, the insurers will try to align the current value measurement of IFRS 4 – Phase II and the fair value measurement of Solvency II as far as possible and also use some pieces of information required for Solvency purposes in their fi nancial reporting.
Welcome to the latest edition of Insurance Report-ing Round-Up. This edition reviews the 2013 fi nancial information published by Europe’s largest insurers, seeking to identify trends in performance and the way in which performance is reported.
1.
Insurance Reporting Round-Up 2013 | 3
Joachim Kölschbach Frank Van den Wildenberg
© 2014 KPMG AG Wirtschaftsprüfungsgesellschaft, a member fi rm of the KPMG network of independent member fi rms affi liated with KPMG International Cooperative (“KPMG International”), a Swiss entity. All rights reserved. The KPMG name, logo and “cutting through complexity” are registered trademarks of KPMG International.

4 | Insurance Reporting Round-Up 2013
2. At a Glance
Total assets (€m) Total equity (€m) Net earned premiums (€m) Profi t/(Loss) after tax (€m)
Dec 2013 Dec 2012 Dec 2011 Dec 2013 Dec 2012 Dec 2011 Dec 2013 Dec 2012 Dec 2011 Dec 2013 Dec 2012 Dec 2011
AEGON 353,621 364,884 345,576 24,991 28,519 25,734 16,831 15,347 16,114 849 1,582 887
AGEAS 95,736 97,086 90,602 9,422 10,671 8,287 9,087 9,677 8,739 747 929 (674)
Allianz 711,530 694,447 641,472 52,849 52,963 47,253 66,628 66,045 63,668 6,344 5,558 2,804
Aviva 333,990 376,615 374,111 13,194 13,605 18,399 26,041 29,143 35,423 2,533 (3,455) 71
AXA 757,143 761,862 727,204 55,314 55,961 48,784 80,214 80,106 76,598 4,786 4,187 4,380
CNP 365,983 353,216 321,011 15,994 15,588 13,217 27,609 26,388 29,919 1,323 1,258 1,141
Generali 449,656 442,011 423,057 21,405 21,726 18,121 60,796 60,734 62,739 1,582 314 1,153
NN Group (ING Insurance) 301,005 338,604 335,547 14,295 26,640 23,474 9,387 10,565 11,150 (32) (161) 430
Legal & General 434,936 414,740 391,025 6,826 6,563 6,134 6,206 5,800 5,984 1,055 940 853
Mapfre 56,826 56,983 54,856 9,894 10,136 9,727 18,002 18,272 17,093 1,190 963 1,220
Munich Re 254,288 258,416 247,580 26,226 27,439 23,309 49,172 50,499 47,292 3,342 3,204 712
Old Mutual 168,065 176,006 194,477 10,823 11,704 13,004 3,985 4,008 3,838 1,158 1,741 1,139
Prudential 390,346 368,444 323,382 11,558 12,412 10,308 35,147 33,708 29,769 1,585 2,547 1,671
Standard Life 221,088 208,507 191,768 5,461 5,629 5,173 4,752 4,970 3,822 584 817 407
Swiss Re 155,086 160,884 164,077 23,934 24,697 22,725 21,297 18,575 16,043 3,399 3,313 2,107
Talanx 132,863 130,350 115,277 11,211 11,309 8,691 23,113 21,999 19,456 1,282 1,144 892
Zurich 301,465 296,946 281,069 25,228 26,774 24,676 36,382 35,774 32,312 3,208 2,994 2,843
Total 5,483,627 5,500,002 5,222,090 338,626 362,336 327,015 494,651 491,610 479,958 34,188 26,945 22,711
Source: KPMG, 2014
© 2014 KPMG AG Wirtschaftsprüfungsgesellschaft, a member fi rm of the KPMG network of independent member fi rms affi liated with KPMG International Cooperative (“KPMG International”), a Swiss entity. All rights reserved. The KPMG name, logo and “cutting through complexity” are registered trademarks of KPMG International.

Insurance Reporting Round-Up 2013 | 5
Net earned premiums are gross earned premiums less earned reinsurance premiums.All balance sheet amounts are as at 31 December 2013, 2012 and 2011 and all income related amounts are for the year ending on the relevant balance sheet date.
Total assets (€m) Total equity (€m) Net earned premiums (€m) Profi t/(Loss) after tax (€m)
Dec 2013 Dec 2012 Dec 2011 Dec 2013 Dec 2012 Dec 2011 Dec 2013 Dec 2012 Dec 2011 Dec 2013 Dec 2012 Dec 2011
AEGON 353,621 364,884 345,576 24,991 28,519 25,734 16,831 15,347 16,114 849 1,582 887
AGEAS 95,736 97,086 90,602 9,422 10,671 8,287 9,087 9,677 8,739 747 929 (674)
Allianz 711,530 694,447 641,472 52,849 52,963 47,253 66,628 66,045 63,668 6,344 5,558 2,804
Aviva 333,990 376,615 374,111 13,194 13,605 18,399 26,041 29,143 35,423 2,533 (3,455) 71
AXA 757,143 761,862 727,204 55,314 55,961 48,784 80,214 80,106 76,598 4,786 4,187 4,380
CNP 365,983 353,216 321,011 15,994 15,588 13,217 27,609 26,388 29,919 1,323 1,258 1,141
Generali 449,656 442,011 423,057 21,405 21,726 18,121 60,796 60,734 62,739 1,582 314 1,153
NN Group (ING Insurance) 301,005 338,604 335,547 14,295 26,640 23,474 9,387 10,565 11,150 (32) (161) 430
Legal & General 434,936 414,740 391,025 6,826 6,563 6,134 6,206 5,800 5,984 1,055 940 853
Mapfre 56,826 56,983 54,856 9,894 10,136 9,727 18,002 18,272 17,093 1,190 963 1,220
Munich Re 254,288 258,416 247,580 26,226 27,439 23,309 49,172 50,499 47,292 3,342 3,204 712
Old Mutual 168,065 176,006 194,477 10,823 11,704 13,004 3,985 4,008 3,838 1,158 1,741 1,139
Prudential 390,346 368,444 323,382 11,558 12,412 10,308 35,147 33,708 29,769 1,585 2,547 1,671
Standard Life 221,088 208,507 191,768 5,461 5,629 5,173 4,752 4,970 3,822 584 817 407
Swiss Re 155,086 160,884 164,077 23,934 24,697 22,725 21,297 18,575 16,043 3,399 3,313 2,107
Talanx 132,863 130,350 115,277 11,211 11,309 8,691 23,113 21,999 19,456 1,282 1,144 892
Zurich 301,465 296,946 281,069 25,228 26,774 24,676 36,382 35,774 32,312 3,208 2,994 2,843
Total 5,483,627 5,500,002 5,222,090 338,626 362,336 327,015 494,651 491,610 479,958 34,188 26,945 22,711
© 2014 KPMG AG Wirtschaftsprüfungsgesellschaft, a member fi rm of the KPMG network of independent member fi rms affi liated with KPMG International Cooperative (“KPMG International”), a Swiss entity. All rights reserved. The KPMG name, logo and “cutting through complexity” are registered trademarks of KPMG International.

6 | Insurance Reporting Round-Up 2013
3. Key Performance Indicators
As in previous years, we have considered the key fi nancial performance metrics highlighted by the insurers in their presentation to analysts and investors as part of their results announcements.
The idea behind this is to provide an indication of what the insurers in our survey consider to be the most important and useful key fi nancial performance indicators (KPIs) and how they prioritise the KPIs chosen. The comparison of the KPIs used in 2013 to those of the prior year allows us to draw some conclusions about the way insurers’ perception of relevant KPIs has developed over time.
Approach
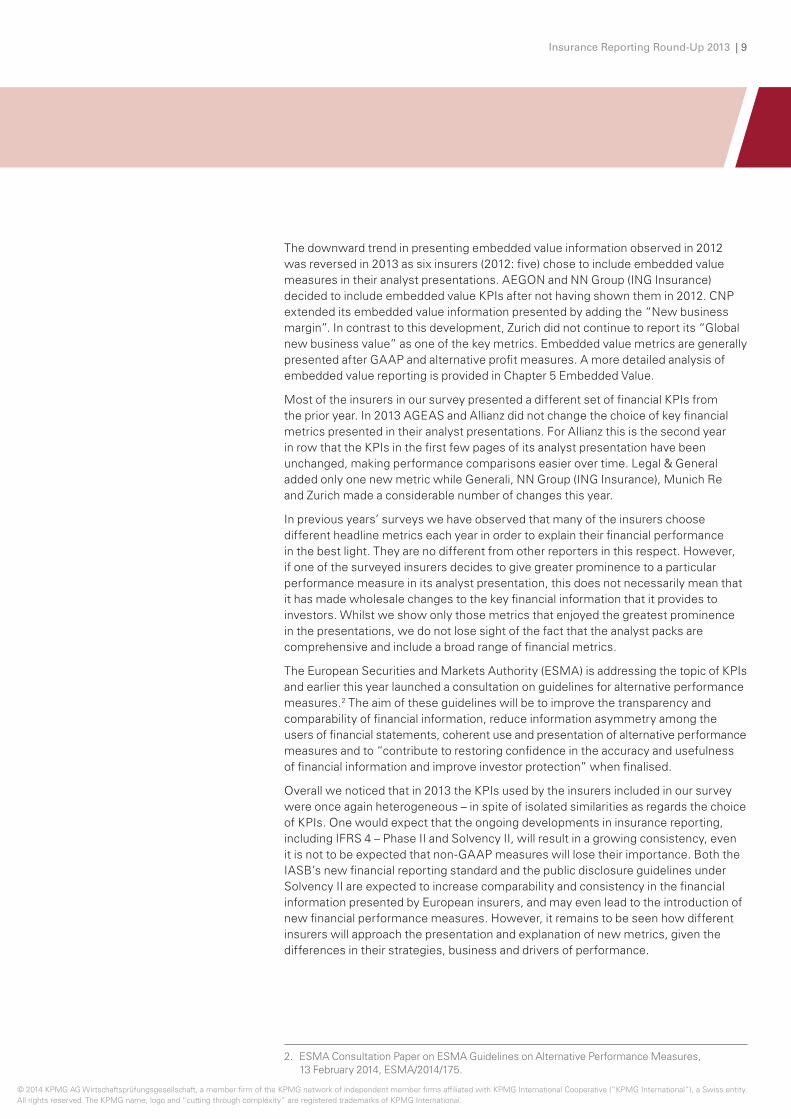
We have summarised these fi nancial KPIs in the table on pages 10 and 11. In general we have used the same terminology as the source; however, in a few instances we have amended the terminology used or grouped some metrics for reasons of clari fi cation. The overriding caveat for the information presented is that it is limited to the fi nancial metrics presented in the fi rst few pages of the fi nancial performance section of the results presentations. The key metrics are presented in the order they appear in the results presentations.
© 2014 KPMG AG Wirtschaftsprüfungsgesellschaft, a member fi rm of the KPMG network of independent member fi rms affi liated with KPMG International Cooperative (“KPMG International”), a Swiss entity. All rights reserved. The KPMG name, logo and “cutting through complexity” are registered trademarks of KPMG International.

Insurance Reporting Round-Up 2013 | 7
Our observations
Before going into the details as regards the types of KPIs chosen, it is worth mentioning that for the majority of the insurers in our survey the number of KPIs presented has increased. For nearly all of the others the number of KPIs presented within the first few pages of the results presentations remained the same as last year. Munich Re was the exception presenting a slightly reduced number of KPIs this year compared to 2012; however, as can be seen in the table on pages 10 and 11, the number of KPIs reported by Munich Re was still relatively high. The underlying trend may be a reflection of the growing complexity of the regulatory environment the companies face.
IFRS (or US GAAP) profit or loss was presented as a key financial metric by 11 (2012: nine) of the insurers. In contrast to last year Aviva, Generali and NN Group (ING Insurance) included “profit after tax”, “net profit” and “result before tax” respectively as one of their key performance measurers. After including “profit after tax” in 2012 Old Mutual decided not to include an IFRS performance measure in its KPIs this year. In contrast Legal & General doubled the number of GAAP measures within their KPIs this year – “profit before tax” and “profit after tax” both are explicitly mentioned – and Talanx presented three GAAP measures (net income, net investment income and operating result) in its analyst presentation.
As regards non-GAAP profit measures, things remained relatively unchanged. Mapfre and Talanx continued not to present a non-GAAP measure whereas all the other insurers in our survey included at least one non-GAAP measure in their KPIs.
The number of the insurers in the survey presenting the combined ratio as a KPI increased slightly (2013: six, 2012: five1). Aviva and Talanx included the combined ratio in 2013 after not presenting it as one of their key metrics in 2012, whereas Zurich decided to omit it this year. Chapter 4 Financial Performance contains an analysis of the combined ratios’ development.
The importance of gross volume information as a KPI decreased slightly; in 2013 eight (2012: nine) of the companies included a gross volume measure as one of their KPIs. Unlike last year Old Mutual and Talanx included a gross volume measure whereas Munich Re, Swiss Re and Zurich did not present gross volume information as one of their key performance measures any more. The remaining companies continued to present one or two gross volume measures. Apart from “gross written premiums” several different volume measures were used in the 2013 analyst presentations ranging from “sales” over “revenues” up to “gross inflows”.
Capital market measures continue to be displayed prominently with an increasing focus on solvency measures
Nearly all of the insurers continue to place emphasise on capital market measures. Apart from NN Group (ING Insurance) that was once more the exception, all of the companies in the survey continued to present at least one such measure as a KPI. While 12 of the companies included two or three capital market measures in their KPIs, Legal & General presented four and Swiss Re included five.
1. AGEAS which is included in our survey for the first time showed the combined ratio in their 2012 and 2013 presentations to analysts.
Non-GAAP profit measures remained very important in 2013.
© 2014 KPMG AG Wirtschaftsprüfungsgesellschaft, a member firm of the KPMG network of independent member firms affiliated with KPMG International Cooperative (“KPMG International”), a Swiss entity. All rights reserved. The KPMG name, logo and “cutting through complexity” are registered trademarks of KPMG International.

8 | Insurance Reporting Round-Up 2013
The most frequently used capital market measure in 2013 was “dividends”, which was reported in the analyst presentations of 14 of the 17 insurers in the survey. The number of companies presenting RoE as a key performance metric remained relatively stable. However, compared to the prior year the composition of the insurers choosing this measure changed in 2013: While Talanx, Munich Re and Aviva decided against presenting RoE as a key metric this year, Old Mutual and AXA presented it as one of their KPIs. AEGON, CNP, Generali, Legal & General, Mapfre, Swiss Re and Zurich continued to report RoE prominently in the fi rst few pages of their analyst presentations. Other capital measures used by the insurers in the survey were earnings per share, net cash and shareholders’ equity.
Solvency measures gained signifi cantly in importance in 2013: More than two thirds of the surveyed insurers (2013: 13, 2012: nine) chose to include at least one solvency measure in their KPIs this year. NN Group (ING Insurance), Mapfre, Swiss Re and Zurich joined AGEAS, Allianz, Aviva, AXA, CNP, Generali, Munich Re, Prudential and Talanx who had included a solvency measure in their KPIs in 2012. Thus, AEGON, Legal & General, Old Mutual and Standard Life are the only companies in the survey that did not show solvency measures as a key metric.
The increasing trend of presenting an economic solvency ratio as a KPI continued this year; seven (2012: fi ve) of the surveyed companies chose to include an economic solvency ratio in their analyst presentations, whereas the number of companies which showed Solvency I ratios did not change (2013: fi ve, 2012: fi ve). Allianz and Prudential presented both a Solvency I ratio and an economic solvency ratio. Generali decided in 2013 against presenting an economic ratio as a KPI and presented only its Solvency I ratio.
More than four-fi fths of the surveyed insurers included dividends as a KPI.
© 2014 KPMG AG Wirtschaftsprüfungsgesellschaft, a member fi rm of the KPMG network of independent member fi rms affi liated with KPMG International Cooperative (“KPMG International”), a Swiss entity. All rights reserved. The KPMG name, logo and “cutting through complexity” are registered trademarks of KPMG International.
Insurance Reporting Round-Up 2013 | 9
The downward trend in presenting embedded value information observed in 2012 was reversed in 2013 as six insurers (2012: five) chose to include embedded value measures in their analyst presentations. AEGON and NN Group (ING Insurance) decided to include embedded value KPIs after not having shown them in 2012. CNP extended its embedded value information presented by adding the “New business margin”. In contrast to this development, Zurich did not continue to report its “Global new business value” as one of the key metrics. Embedded value metrics are generally presented after GAAP and alternative profit measures. A more detailed analysis of embedded value reporting is provided in Chapter 5 Embedded Value.
Most of the insurers in our survey presented a different set of financial KPIs from the prior year. In 2013 AGEAS and Allianz did not change the choice of key financial metrics presented in their analyst presentations. For Allianz this is the second year in row that the KPIs in the first few pages of its analyst presentation have been unchanged, making performance comparisons easier over time. Legal & General added only one new metric while Generali, NN Group (ING Insurance), Munich Re and Zurich made a considerable number of changes this year.
In previous years’ surveys we have observed that many of the insurers choose different headline metrics each year in order to explain their financial performance in the best light. They are no different from other reporters in this respect. However, if one of the surveyed insurers decides to give greater prominence to a particular performance measure in its analyst presentation, this does not necessarily mean that it has made wholesale changes to the key financial information that it provides to investors. Whilst we show only those metrics that enjoyed the greatest prominence in the presentations, we do not lose sight of the fact that the analyst packs are comprehensive and include a broad range of financial metrics.
The European Securities and Markets Authority (ESMA) is addressing the topic of KPIs and earlier this year launched a consultation on guidelines for alternative performance measures.2 The aim of these guidelines will be to improve the transparency and comparability of financial information, reduce information asymmetry among the users of financial statements, coherent use and presentation of alternative performance measures and to “contribute to restoring confidence in the accuracy and usefulness of financial information and improve investor protection” when finalised.
Overall we noticed that in 2013 the KPIs used by the insurers included in our survey were once again heterogeneous – in spite of isolated similarities as regards the choice of KPIs. One would expect that the ongoing developments in insurance reporting, including IFRS 4 – Phase II and Solvency II, will result in a growing consistency, even it is not to be expected that non-GAAP measures will lose their importance. Both the IASB’s new financial reporting standard and the public disclosure guidelines under Solvency II are expected to increase comparability and consistency in the financial information presented by European insurers, and may even lead to the introduction of new financial performance measures. However, it remains to be seen how different insurers will approach the presentation and explanation of new metrics, given the differences in their strategies, business and drivers of performance.
2. ESMA Consultation Paper on ESMA Guidelines on Alternative Performance Measures, 13 February 2014, ESMA/2014/175.
© 2014 KPMG AG Wirtschaftsprüfungsgesellschaft, a member firm of the KPMG network of independent member firms affiliated with KPMG International Cooperative (“KPMG International”), a Swiss entity. All rights reserved. The KPMG name, logo and “cutting through complexity” are registered trademarks of KPMG International.

10 | Insurance Reporting Round-Up 2013
Key fi nancial performance indicators from results presentations
AEGON AGEAS Allianz Aviva AXA CNP Generali NN Group(ING Insurance)
Legal & General Mapfre Munich Re Old Mutual Prudential Standard Life Swiss Re Talanx Zurich
Sales Insurance net profi t
Total revenues
Cash remittances
to group
Underlying earnings
Premium income & net revenue Net profi t
Insurance operating
result
Net cash generation Revenues Net result Gross sales IFRS operating
profi tAssets under
administration RoE Net income Business operating profi t
Market consistent value of new business
(MCVNB)
Gross infl ows Operating profi t
Operating capital
generation
Earnings per share
Administrative expenses
Shareholders’ equity
Solvency I ratio
Net cash dividend cover
Gross written premiums Dividend NCCF: Net client
cash fl owNew business
profi tFee based revenue
Economic solvency ratio
Shareholders’ equity
Business operating profi t (after tax) RoE
Underlying earnings before
tax
Combined ratio Net income Dividend Dividend EBIT Solvency I
ratio IGD ratio Operating profi t
Managed savings
Total shareholder
return
Funds under management
FUM
EEV operating profi t
Underlying performance Dividend Solvency I ratio
Net income attributable to shareholders
DividendLife technical
liabilities (Growth)
Shareholders’ equity
IFRS operating profi t
Economic solvency ratio Net profi t Dividends
per shareResult
before taxProfi t
before taxNon life
combined ratioEconomic
solvency ratiosFree surplus generated
Free surplus generation
Operating profi t before tax
Special dividend Dividends
Net income attributable to
shareholders RoE
Fee-based earnings (as % of underlying
earnings)
Shareholders’ equity
FCD solvency ratio Profi t after tax Debt gearing RoE Operating
profi t Sales (APE) Profi tafter tax RoE Distributable
earnings
IFRS adjusted operating profi t
(AOP)Net remittance
EEV operating capital and cash
generationEPS Gross written
premiumsEconomic
solvency ratios
RoE Solvency I ratio
Economic solvency ratio
Operating expenses Adjusted RoE New business
margin (APE)Target gross
savings
Investment management
operating result
Earnings per share
Solvency margin
Operating result
Earnings per share
Dividend per share Dividend Net income Combined
ratioNet cash
remittances
Normalized operational free
cash fl owsNet cash Proposed
dividendValue of new
businessOperating free
cash fl owsSolvency I
ratio Operating RoE Administrative expenses RoE
Shareholders equity per
shareRun-off result Group RoE IGD surplus Group combined
ratioNet investment
income Dividend
Proposed dividend
Combined operating ratio
MCEV per share Cash fl ow Net result Combined
ratio Dividend Economic capital ratio
Return on investments
Return on investments
Economic solvency ratio
Book value per share
Earnings per share EEV per share Reinsurance
net incomeOperating
result (EBIT)
IFRS NAV Book value per share
MCEV NAV
© 2014 KPMG AG Wirtschaftsprüfungsgesellschaft, a member fi rm of the KPMG network of independent member fi rms affi liated with KPMG International Cooperative (“KPMG International”), a Swiss entity. All rights reserved. The KPMG name, logo and “cutting through complexity” are registered trademarks of KPMG International.
Insurance Reporting Round-Up 2013 | 11
Key financial performance indicators from results presentations
AEGON AGEAS Allianz Aviva AXA CNP Generali NN Group (ING Insurance)
Legal & General Mapfre Munich Re Old Mutual Prudential Standard Life Swiss Re Talanx Zurich
Sales Insurance net profit
Total revenues
Cash remittances
to group
Underlying earnings
Premium income & net revenue Net profit
Insurance operating
result
Net cash generation Revenues Net result Gross sales IFRS operating
profitAssets under
administration RoE Net income Business operating profit
Market consistent value of new business
(MCVNB)
Gross inflows Operating profit
Operating capital
generation
Earnings per share
Administrative expenses
Shareholders’ equity
Solvency I ratio
Net cash dividend cover
Gross written premiums Dividend NCCF: Net client
cash flowNew business
profitFee based revenue
Economic solvency ratio
Shareholders’ equity
Business operating profit (after tax) RoE
Underlying earnings before
tax
Combined ratio Net income Dividend Dividend EBIT Solvency I
ratio IGD ratio Operating profit
Managed savings
Total shareholder
return
Funds under management
FUM
EEV operating profit
Underlying performance Dividend Solvency I ratio
Net income attributable to shareholders
DividendLife technical
liabilities (Growth)
Shareholders’ equity
IFRS operating profit
Economic solvency ratio Net profit Dividends
per shareResult
before taxProfit
before taxNon life
combined ratioEconomic
solvency ratiosFree surplus generated
Free surplus generation
Operating profit before tax
Special dividend Dividends
Net income attributable to
shareholders RoE
Fee-based earnings (as % of underlying
earnings)
Shareholders’ equity
FCD solvency ratio Profit after tax Debt gearing RoE Operating
profit Sales (APE) Profit after tax RoE Distributable
earnings
IFRS adjusted operating profit
(AOP)Net remittance
EEV operating capital and cash
generationEPS Gross written
premiumsEconomic
solvency ratios
RoE Solvency I ratio
Economic solvency ratio
Operating expenses Adjusted RoE New business
margin (APE)Target gross
savings
Investment management
operating result
Earnings per share
Solvency margin
Operating result
Earnings per share
Dividend per share Dividend Net income Combined
ratioNet cash
remittances
Normalized operational free
cash flowsNet cash Proposed
dividendValue of new
businessOperating free
cash flowsSolvency I
ratio Operating RoE Administrative expenses RoE
Shareholders equity per
shareRun-off result Group RoE IGD surplus Group combined
ratioNet investment
income Dividend
Proposed dividend
Combined operating ratio
MCEV per share Cash flow Net result Combined
ratio Dividend Economic capital ratio
Return on investments
Return on investments
Economic solvency ratio
Book value per share
Earnings per share EEV per share Reinsurance
net incomeOperating
result (EBIT)
IFRS NAV Book value per share
MCEV NAV
Volume information (excluding net measures)
Underlying earnings or operating profit
GAAP profit before/after tax
EEV measures
Solvency measures
Capital market measures
Combined ratio
Cash generation
Source: KPMG, 2014
© 2014 KPMG AG Wirtschaftsprüfungsgesellschaft, a member firm of the KPMG network of independent member firms affiliated with KPMG International Cooperative (“KPMG International”), a Swiss entity. All rights reserved. The KPMG name, logo and “cutting through complexity” are registered trademarks of KPMG International.

12 | Insurance Reporting Round-Up 2013
IFRS profi t or loss before tax
IFRS profi t before tax increased this year to € 46.4 billion in total for the groups cov ered in this report (2012: € 40.3 billion, 2011: € 27.2 billion), an increase of 15.1 percent compared to last year.
Except for NN Group (ING Insurance), all of the surveyed insurers reported a positive IFRS profi t before tax in 2013. In line with last year Allianz reported the highest IFRS profi t before tax (€ 9.6 billion) and in 2013 this represented almost 20.8 percent of the total IFRS profi t before tax of the surveyed insurers.
Developments were quite mixed between the surveyed insurers and no general trends could be derived from their reporting. However, in respect to insurance com panies that predominantly are life insurers, it is our impression that IFRS profi t before tax showed dependency to the interest hedging strategies that were applied and the accounting treatment of those hedges. Not all insurers were explicit about the strategy and the effects on IFRS profi t before tax, but for instance AEGON stated that its decrease in IFRS profi t before tax resulted from losses on its hedging programs.
More than half of the surveyed insurers (10 of 17) reported an increase in IFRS profi t before tax. The most signifi cant increase in IFRS profi t before tax was reported by Aviva (€ 6.3 billion, developing from a € 3.0 billion loss in 2012 to a € 3.3 billion profi t in 2013). Signifi cant relative increases were achieved by Generali (+58.2 percent) and AXA (+17.5 percent). The increase in IFRS profi t before tax of Aviva can largely be explained by the fact that in 2012 Aviva booked a € 4.1 billion loss on the disposal of its US business. The increase in IFRS profi t before tax of Generali was mainly caused by lower impairment losses than in the prior year. The increase in IFRS profi t before tax of AXA can, for the major part, be explained by an improvement of the investment result (despite higher losses from derivatives hedging variables annuities).
4. Financial Performance
More than half of the insurers in the survey reported an increase in IFRS profi t before tax.
© 2014 KPMG AG Wirtschaftsprüfungsgesellschaft, a member fi rm of the KPMG network of independent member fi rms affi liated with KPMG International Cooperative (“KPMG International”), a Swiss entity. All rights reserved. The KPMG name, logo and “cutting through complexity” are registered trademarks of KPMG International.

Insurance Reporting Round-Up 2013 | 13
IFRS profit or loss before tax
(4.000)
(2.000)
0
2.000
4.000
6.000
8.000
10.000
12.000
ZurichTalanxSwiss Re
StandardLife
PrudentialOldMutual
MunichRe
MapfreLegal &General
NN Group(ING
Insurance)
GeneraliCNPAXAAvivaAllianzAGEASAEGON
December 2011 December 2012 December 2013
€m
Source: KPMG, 2014
For most insurers that reported a decrease in IFRS profit before tax, the decrease amounted relatively speaking to more than 10.0 percent. The largest relative decreases were reported by AEGON (-49.4 percent) and Prudential (-40.5 percent). The most significant decrease in absolute terms was reported by Prudential (€ 1.3 billion). The decrease in IFRS profit before tax of Prudential was mainly due to the decrease in the investment returns as a result of the increase in market interest rates. The decrease in IFRS profit before tax of AEGON mainly resulted from losses on its hedging programs and long-term economic assumption changes.
Underlying result
As in the previous years, all of the insurance groups surveyed presented an alternative profit measure in their result presentations and/or annual reports. These are mostly referred to as “operating profit”, however, we use the term “underlying result” to describe these measures in this section. Underlying result is a non-GAAP measure and companies have different definitions for this metric. For this reason, underlying results are not directly comparable between companies, but they are helpful when analysing performance, and provide an important insight into the management’s view of results as they develop over time.
Although the different definitions of underlying results do make direct comparisons impossible, we noticed that for most of the insurers in our survey (Allianz, Axa, Gene rali, NN Group (ING Insurance), Legal & General, Mapfre, Munich Re, Standard Life, Swiss Re, Talanx and Zurich) the development of the underlying result showed similarities with the development of the IFRS profit before tax. This was due to the fact that significant changes in IFRS profit before tax also resulted from operational factors like technical results and cost developments.
The aggregate underlying result was € 51.0 billion (2012: € 49.2 billion, 2011: € 39.5 billion), an increase of 3.7 percent on the prior year.
© 2014 KPMG AG Wirtschaftsprüfungsgesellschaft, a member firm of the KPMG network of independent member firms affiliated with KPMG International Cooperative (“KPMG International”), a Swiss entity. All rights reserved. The KPMG name, logo and “cutting through complexity” are registered trademarks of KPMG International.

14 | Insurance Reporting Round-Up 2013
Underlying result
(2.000)
0
2.000
4.000
6.000
8.000
10.000
12.000
ZurichTalanxSwiss Re
StandardLife
PrudentialOldMutual
MunichRe
MapfreLegal &General
NN Group(ING
Insurance)
GeneraliCNPAXAAvivaAllianzAGEASAEGON
€m
December 2011 December 2012 December 2013
Source: KPMG, 2014
As in 2012, all of the surveyed insurers presented a positive underlying result and 13 out of 17 insurers reported an increase in this measure. Only NN Group (ING Insurance) (-61.9 percent), Munich Re (-17.6 percent), Swiss Re (-13.3 percent) and Standard Life (-13.4 percent) reported a decrease in their underlying result with Munich Re (-€ 0.9 billion) and Swiss Re (-€ 0.6 billion) showing the most substantial absolute decreases. The most substantial absolute increases in underlying result were reported by AXA (+€ 0.9 billion, +15.7 percent), Allianz (+€ 0.7 billion, +7.8 percent) and Prudential (+€ 0.5 billion, +17.2 percent). The explanations for the development of the underlying results of AXA, Allianz, Munich Re and Swiss Re are closely related to respective improvement or deterioration of the combined ratio and therefore showed similarity with the development of the IFRS profi t before tax. Prudential excluded the negative fair value development on fi xed income securities to arrive at an increase of the underlying result versus a negative development of IFRS profi t before tax.
Generali reported a signifi cant difference between its IFRS profi t before tax and its underlying result (its underlying result was € 1.9 billion higher than its IFRS profi t before tax). This difference primarily related to non-operating holding expenses like interest expenses on fi nancial liabilities (€ 0.8 billion in total) and other non-operating expenses (€ 1.0 billion) such as amortisation of the value of acquired portfolios, which were excluded from the underlying result.
Combined ratio: non-life insurance business
The average combined ratio across those companies that presented this measure in 2013 was 94.8 percent (2012: 95.6 percent, 2011: 98.9 percent). The relatively high average combined ratio in 2011 can be explained by high natural catastrophe losses in 2011. In 2012 and 2013 the combined ratios were less impacted by natural catastrophe losses and refl ect the impact of cost reduction and cost controlling strategies.
In 2013 combined ratios ranged between 84.0 percent and 104.9 percent.
© 2014 KPMG AG Wirtschaftsprüfungsgesellschaft, a member fi rm of the KPMG network of independent member fi rms affi liated with KPMG International Cooperative (“KPMG International”), a Swiss entity. All rights reserved. The KPMG name, logo and “cutting through complexity” are registered trademarks of KPMG International.

Insurance Reporting Round-Up 2013 | 15
The development of the reported combined ratio compared to last year was mixed across the surveyed insurers. Just over half of the surveyed group (7 of 13) reported an improvement in their combined ratio, whereas the others (6 of 13) reported a higher combined ratio than last year. Most developments compared to last year were within a range of 2.5 percent improvement or deterioration of the combined ratio, except for Legal & General, Old Mutual and Zurich.
The most marked improvement in 2013 was reported by Legal & General reporting a combined ratio of 84.0 percent compared to 95.0 percent in 2012. Legal & General was the company with the lowest combined ratio in 2013. Zurich also reported a signifi cant improvement of its combined ratio reporting a combined ratio of 95.5 percent in 2013 compared with 98.4 percent in 2012. The reasons for the improvements were a lower level of severe catastrophes than in 2012 as well as cost effi ciencies and disciplined underwriting.
For the second consecutive year the only company that reported a combined ratio above 100 percent was Old Mutual. Old Mutual also reported the highest increase of its combined ratio, from 101.7 percent to 104.9 percent. The increase was caused by an increased claims frequency as well as severity due to fl ood and hail damage in South Africa.
The insurer that reported the lowest combined ratio in 2012, Swiss Re, reported an increase in its combined ratio from 83.1 percent to 85.3 percent. The main drivers for this increase were higher natural catastrophe losses and higher man-made losses in its Property & Casualty business.
The combined ratio is the sum of incurred losses and expenses divided by earned premiums in the period. The combined ratios presented are as reported by the companies and have not been recalculated. Munich Re presents separate combined ratios for its primary, reinsurance and health business segments. We have excluded the health business ratios on the basis of materiality for the purposes of this graph.
Source: KPMG, 2014
December 2011 December 2012 December 2013
%Combined ratio
50
60
70
80
90
100
110
120
ZurichTalanxSwiss ReOld Mutual
Munich Re (Reinsurance)
Munich Re (Primary)
MapfreLegal & General
GeneraliAXAAvivaAllianzAGEAS
© 2014 KPMG AG Wirtschaftsprüfungsgesellschaft, a member fi rm of the KPMG network of independent member fi rms affi liated with KPMG International Cooperative (“KPMG International”), a Swiss entity. All rights reserved. The KPMG name, logo and “cutting through complexity” are registered trademarks of KPMG International.

16 | Insurance Reporting Round-Up 2013
As at 31 May 2014, 13 of the insurers included in our survey had published embedded value supplementary information in respect of 2013.
As in previous years, seven of these insurers (Allianz, Aviva, CNP, Munich Re, Old Mutual, Talanx and Zurich) reported full compliance with the MCEV Principles although some of these disclosed minor areas where they do not fully comply with MCEV Guidance. Generali declared full compliance with the MCEV Principles for the fi rst time this year, but stated that its approach was practically not different to its prior approach, which was already market consistent but prepared otherwise in accordance with the EEV Principles. Similarly, AXA, while using market consistent methodology, continued to formally report under the EEV Principles. Legal & General, Prudential, Standard Life, and AGEAS continued to adopt a “real world” approach under the EEV Principles. As in the prior years, Prudential used a market consistent approach to derive an implied risk discount rate for its UK shareholder-backed annuity business.
Solvency II impact
In 2011 the CFO Forum revised its MCEV Principles to refl ect developments in market consistent measurements under Solvency II. Due to delays in the implementation of Solvency II, in September 2012 the CFO Forum decided to permit an optional deferral of its revised MCEV Principles. As in the previous year Aviva, Generali and Munich Re made use of this option.
5. Embedded Value (EV)3
3. EV is an approach to determine the value embedded in an insurance contract based on its cash fl ows or statutory measurement, applying a traditional real world approach (European Embedded Value EEV) or a market-consistent approach (Market-Consistent Embedded Value – MCEV).
The continuing recovery of fi nancial markets contributed to an upward trend in the embedded value of covered business.
© 2014 KPMG AG Wirtschaftsprüfungsgesellschaft, a member fi rm of the KPMG network of independent member fi rms affi liated with KPMG International Cooperative (“KPMG International”), a Swiss entity. All rights reserved. The KPMG name, logo and “cutting through complexity” are registered trademarks of KPMG International.

Insurance Reporting Round-Up 2013 | 17
Embedded value of covered business
In aggregate, the EV of covered business for the 13 reporting companies increased by 8.1 percent. This continued the upward trend in prior years, with the exception of 2011 (2012: increase of 15.4 percent; 2011: decrease of 7.7 percent). For all insurers, except for Old Mutual, the EV reported in 2013 exceeded their EVs in both 2011 and 2012. This general increase reflects the continuing recovery of financial markets. The EV of Old Mutual decreased by 8.1 percent, continuing the trend in the prior years. The EVs of AGEAS and Legal & General remained virtually unchanged.
EV operating earnings
EV operating earnings is a more stable measure than the movement in the EV of covered business because it excludes, inter alia, economic variances (comprising the difference between actual experience during the year and that implied by economic assumptions at the start of the year and the impact of changes in economic assumptions at the end of the year) and the impact of foreign currency translation effects.
EV of covered business
0
10.000
20.000
30.000
40.000
50.000
60.000
ZurichTalanxStandardLife
PrudentialOldMutual
Munich ReLegal &General
GeneraliCNPAXAAvivaAllianzAGEASAEGON
December 2011 December 2012 December 2013
€m
Source: KPMG, 2014
AGEAS and Talanx reported an EV in 2012 for the first time. AGEON stopped to publish EV information in 2012.
© 2014 KPMG AG Wirtschaftsprüfungsgesellschaft, a member firm of the KPMG network of independent member firms affiliated with KPMG International Cooperative (“KPMG International”), a Swiss entity. All rights reserved. The KPMG name, logo and “cutting through complexity” are registered trademarks of KPMG International.

18 | Insurance Reporting Round-Up 2013
EV operating earnings (net of tax)
0
1.000
2.000
3.000
4.000
5.000
6.000
7.000
8.000
ZurichTalanxStandardLife
PrudentialOldMutual
Munich ReLegal &General
GeneraliCNPAXAAvivaAllianzAGEASAEGON
€m
December 2011 December 2012 December 2013
Source: KPMG, 2014
The aggregate EV operating earnings (net of tax) for the EV reporting companies increased by 12.5 percent to € 31.4 billion (2012: 6.7 percent, 2011: 11.4 percent). Seven insurers reported a rising EV operating result (AGEAS, Aviva, Generali, Legal & General, Old Mutual, Prudential and Talanx), driven by increasing interest rates, narrower government bond spreads, stronger equity markets, positive experience variances and positive effects of changes to non-economic assumptions. Generali nearly doubled its EV operating earnings and Talanx reported an increase of 53.9 percent. The increase in Generali’s EV operating earnings is refl ected in the development of the MCEV, which increased by 10.5 percent from 2011 to 2012, but by 22.1 percent from 2012 to 2013. In the same period AXA’s EV operating earnings remained nearly stable.
© 2014 KPMG AG Wirtschaftsprüfungsgesellschaft, a member fi rm of the KPMG network of independent member fi rms affi liated with KPMG International Cooperative (“KPMG International”), a Swiss entity. All rights reserved. The KPMG name, logo and “cutting through complexity” are registered trademarks of KPMG International.

Insurance Reporting Round-Up 2013 | 19
By contrast, Zurich reported a decrease of 50.8 percent in its EV operating earnings in 2013, primarily due to changes in expense methodology, while Allianz and Standard Life reported decreases between 20.0 and 30.0 percent. The decreases were due to various reasons, only partly driven by fi nancial markets. Some are adverse experience and other operating variances, as well as unfavourable assumption changes, specifi cally affecting the value of new business.
© 2014 KPMG AG Wirtschaftsprüfungsgesellschaft, a member fi rm of the KPMG network of independent member fi rms affi liated with KPMG International Cooperative (“KPMG International”), a Swiss entity. All rights reserved. The KPMG name, logo and “cutting through complexity” are registered trademarks of KPMG International.

20 | Insurance Reporting Round-Up 2013
For the 17 surveyed insurers the total amount of net earned premiums increased slightly in 2013 from € 491.6 billion to € 494.7 billion or 0.6 percent (see also Chapter 2 At a Glance). Compared to the 2.4 percent increase in 2012, the development of net earned premiums was again positive, but the rate of increase has slowed.
Brazil was mentioned as an important growth market by eight insurers in our survey. Allianz, Generali, Swiss Re, Talanx and Zurich expect it to provide profi table growth opportunities. Mapfre, CNP and Swiss Re further strengthened their position in this market through acquisitions and strategic alliances. NN Group (ING Insurance) divested a part of its Brazilian subsidiary.
Although the effects of new technology on the development of premiums and new business value cannot be quantifi ed, 13 of the insurers in the survey mentioned its infl uence in various ways, including the following examples:
Zurich: “Signifi cant changes in technology and how individuals and companies use it are altering the way in which customers access insurance, creating new opportunities. These developments have lowered the cost of delivering insurance products and services, and increased price transparency in retail markets. At the same time, we are also re-evaluating how we use technology and rethinking our value proposition in some markets.” (Zurich Annual Report 2013 page 6)
Prudential: “High-quality information technology systems are critical for providing award-winning customer service. We leverage technology to minimise processing errors and reduce the time required to process new business and commissions.” (Prudential Annual Report 2013 page 27)
6. Premiums and New Business
In 2013 the development of net earned premiums of the 17 insurers included in the survey was again positive, but the rate of increase has slowed.
© 2014 KPMG AG Wirtschaftsprüfungsgesellschaft, a member fi rm of the KPMG network of independent member fi rms affi liated with KPMG International Cooperative (“KPMG International”), a Swiss entity. All rights reserved. The KPMG name, logo and “cutting through complexity” are registered trademarks of KPMG International.

Insurance Reporting Round-Up 2013 | 21
Legal & General: “With 73 % of the UK population accessing the internet every day and 61 % having access via mobile devices, people expect to be able to transact busi ness and communicate in a digital fashion. Our vision for the future is for customers to use online devices to buy from us, communicate with us, recommend us and build a diverse product holding with us.” (Legal & General Annual Report 2013 page 28)
Talanx: “Growing digitalisation means that companies are increasingly suffering huge damages as a result of internet cyber attacks. […] For this reason, HDI-Gerling has developed the Cyber+.” (Talanx Annual Report 2013 page 139)
In general it is difficult to obtain an overall view of trends when analysing net earned premiums based on consolidated accounts since products and business models vary, especially between life and non-life insurers. In order to gain a better understanding of the premium development, the following analysis therefore compares results on a segment by segment basis.
While for insurers operating in the non-life business the development of net earned premiums serves as benchmark measure, for life insurance companies the present value of new business premiums (PVNBP) is generally considered to be a more relevant indicator for explaining (new) business development.
Non-life insurance
The aggregate net earned premiums for non-life business amounted to € 200.6 billion in total (2012: € 196.9 billion, 2011: € 185.5 billion) representing an increase of 1.9 percent compared to the prior year. The growth in net earned premiums continued, but slowed down considerably after an increase of 6.1 percent in the prior year.
Among the 14 insurers that reported net earned premiums for non-life and life business separately, results were mainly positive – only NN Group (ING Insurance), Munich Re and Aviva reported a decrease in this measure.
Net earned premiums – Non-life
0
5.000
10.000
15.000
20.000
25.000
30.000
35.000
40.000
45.000
ZurichTalanxSwiss ReOld MutualMunich ReMapfreNN Group (ING Insurance)
GeneraliCNPAXAAvivaAllianzAGEASAEGON
December 2011 December 2012 December 2013
€m
Source: KPMG, 2014
© 2014 KPMG AG Wirtschaftsprüfungsgesellschaft, a member firm of the KPMG network of independent member firms affiliated with KPMG International Cooperative (“KPMG International”), a Swiss entity. All rights reserved. The KPMG name, logo and “cutting through complexity” are registered trademarks of KPMG International.

22 | Insurance Reporting Round-Up 2013
By far the strongest increase in net earned premiums was generated by Swiss Re, followed by Talanx. Further signifi cant increases were achieved by AGEAS in relative terms and by AXA in absolute terms.
The abnormal development of Swiss Re’s net earned premiums (showing a growth of 17.3 percent or € 2.0 billion) can mainly be attributed to the expiry of a major quota share retrocession agreement. New business written in the Americas within its reinsurance segment and organic growth within its Corporate Solution segment were also stated as reasons for the signifi cant growth.
The 4.6 percent increase in Talanx’ net earned premiums was mainly due to previous year’s acquisitions within its Retail International Division – especially in Poland. In addition, Industrial Lines achieved growth in foreign branches and through price increases.
Driven by portfolio growth and tariff increases, especially in Belgium, AGEAS’ net earned premiums increased by 3.3 percent despite an adverse currency impact.
AXA announced an increase in net earned premiums in their non-life business (€ 0.5 billion) that was attributed to tariff increases and higher volumes especially in high growth markets.
NN Group (ING Insurance) suffered under the challenging economic conditions in the Netherlands that especially impacted the Property & Casualty and Disability & Accident business for small and medium-sized enterprises; thus net earned premiums declined by 3.0 percent.
The slight decline in Munich Re’s net earned premiums of 2.2 percent was mainly caused by exchange rate effects in its reinsurance business due to the signifi cance of portfolios written in foreign currencies (86.0 percent especially in US dollars and pounds sterling). Also remedial measures and the sale of its South Korean subsidiary in 2012 within its primary insurance business segment contributed to this development.
The 1.8 percent decline of Aviva’s net earned premiums refl ects the effort of management to optimize the group’s business portfolio in order to focus on more profi table segments. As a result several business units were disposed of in 2013.
The development of net earned premiums in the non-life business in 2013 for the surveyed insurers derived more from exceptional items such as currency effects or portfolio restructuring than from developments in the market itself.
Life insurance
The PVNBP is presented by 15 surveyed insurers mainly within embedded value supplementary information. Only four of the 15 insurers published this measure within their annual report.
The aggregate PVNBP totalled € 373.7 billion (2012: € 363.3 billion, 2011: € 342.4 billion), an increase of 2.9 percent over the previous year. The individual performance was mainly positive; only AGEAS, Aviva and Generali reported a decrease in PVNBP. We observed that annual premium equivalent (APE) movements went in the same direction as PVNBP for those insurers that reported both measures. A decrease in APE indicates that there is a reduction in new business volumes whereas a reduction in PVNBP could also be due to changes in the discount rate.
© 2014 KPMG AG Wirtschaftsprüfungsgesellschaft, a member fi rm of the KPMG network of independent member fi rms affi liated with KPMG International Cooperative (“KPMG International”), a Swiss entity. All rights reserved. The KPMG name, logo and “cutting through complexity” are registered trademarks of KPMG International.

Insurance Reporting Round-Up 2013 | 23
Both Legal & General (24.7 percent increase) and Standard Life (18.7 percent increase) benefi ted from auto-enrolment in pension in the UK, meaning that by 2018 every employer must automatically enrol workers into a workplace pension scheme by law if they meet certain criteria: Legal & General grew organically especially in the non-participating UK Annuity business and Standard Life generated an increase of 73.0 percent in corporate pensions.
Reporting an increase in PVNBP of 15.0 percent, Zurich benefi ted in 2013 from organic growth and from its acquisitions – particularly from the fi rst-time inclusion of Zurich Santander in this measure. Talanx’ increase in PVNBP (16.0 percent) was mainly driven by its reinsurance business.
Aviva reported the strongest decrease in PVNBP of 16.8 percent. Lower sales in the UK, especially in single premiums business, contributed to this development. Generali suffered a decrease in annual premiums, particularly in its saving business in France, although this was due to an abnormal effect in 2012. As a result PVNBP reduced by 3.9 percent.
The decrease in AGEAS’ PVNBP of 14.4 percent can be attributed to a management decision to maintain the guaranteed rate in the AGEAS Belgian Retail Savings business at 1.5 percent to enhance profi tability at the expense of new business volumes.
Present value of new business premiums
0
10.000
20.000
30.000
40.000
50.000
60.000
70.000
ZurichTalanxStandard Life
PrudentialOld MutualMunich Re
MapfreLegal & General
GeneraliCNPAXAAvivaAllianzAGEASAEGON
€m
December 2011 December 2012 December 2013
Source: KPMG, 2014
Talanx did not publish an MCEV report in 2011.
Legal & General and Standard Life reported the highest increase due to legal changes in the UK pension system.
© 2014 KPMG AG Wirtschaftsprüfungsgesellschaft, a member fi rm of the KPMG network of independent member fi rms affi liated with KPMG International Cooperative (“KPMG International”), a Swiss entity. All rights reserved. The KPMG name, logo and “cutting through complexity” are registered trademarks of KPMG International.

24 | Insurance Reporting Round-Up 2013
Investment results
After a challenging year in 2012, the capital markets were easing during 2013. Although Cyprus had to ask the euro rescue fund for support at the beginning of 2013, the economic situation in the so-called “peripheral” European countries, Greece, Spain, Italy, Ireland and Portugal improved during 2013. Ireland and Spain improved their economic situations suffi ciently to enable them to leave the euro rescue fund at the end of 2013. This led to decreasing yields for sovereign debt and lower costs of refi nancing for all the “peripheral” European countries.
The improving economic conditions had a “knock-on” effect on equity markets, which also performed well. This might also have been due to the additional liquidity provided by the central banks. Germany’s DAX and France’s CAC 40 increased by 25.5 percent and 18.0 percent respectively, and in the UK, the FTSE-100 index rose by 14.4 percent. Also, most equity indices experienced a signifi cantly lower volatility than in 2012.
In 2013, as in previous years, the development of interest rates probably had a greater signifi cance for the surveyed insurers than any other factor because of their relatively high asset allocation to fi xed interest securities. Although the European Central Bank lowered its key interest rate from 0.75 percent to 0.5 percent in May 2013 and further down to 0.25 percent in November 2013, the swap rates rose during the year. For example, the 10-year EUR CMS increased from 1.56 percent to 2.15 percent. The yields on 10-year German government bonds rose from 1.44 percent at the start of the year to 1.94 percent, being nearly completely due to the increase in swap rates. All in all, the reduction of the European Central Bank key interest rate did not lead to an increase in swap rates because the swap rates did not decrease and the spreads remained fairly stable.
7. Investments and Intangible Assets
The situation in capital markets eased during 2013.
© 2014 KPMG AG Wirtschaftsprüfungsgesellschaft, a member fi rm of the KPMG network of independent member fi rms affi liated with KPMG International Cooperative (“KPMG International”), a Swiss entity. All rights reserved. The KPMG name, logo and “cutting through complexity” are registered trademarks of KPMG International.

Insurance Reporting Round-Up 2013 | 25
One reason for this development could be that the Federal Reserve Bank (FED) indicated its intention to slow down its quantitative easing programme and cross over to tapering. This process was started in December 2013 when the FED announced a reduction in its quantitative easing programme from $85 billion to $75 billion per month.
Another consequence of the tapering was significant turbulence for many emerging markets currencies. The Brazilian Real lost 16.7 percent, the South African Rand 22.6 percent, the Turkish Lira 20.2 percent and the Russian Rubel 10.6 percent against the Euro. Whereas the development of the Brazilian Real and the South African Rand was mainly due to the FED announcements, the negative development of the Turkish Lira and the Russian Rubel were also caused by diverse social and political problems in these countries during 2013 and the beginning of 2014. These problems will prob ably be one of the major risk factors for the investment returns of insurers in the next few years.
Notwithstanding the bullish equity market conditions with rising interest rates and stable credit spreads, a significant decrease in total investment returns was to be expected this year. In most cases the lower overall investment returns could be attri buted to losses recognised in other comprehensive income. 14 out of the 17 insurance companies in our survey experienced negative investment returns in
Total investment returns
(2)
0
2
4
6
8
10
12
ZurichTalanxSwiss Re
Standard Life
PrudentialOld Mutual
Munich Re
MapfreLegal & General
NN Group (ING
Insurance)
GeneraliCNPAXAAvivaAllianzAGEASAEGON
%
December 2011 December 2012 December 2013
Source: KPMG, 2014
The total investment return ratios represent the total investment result divided by the average year-on-year value of the investment portfolios, as presented in the insurers’ IFRS primary statements. Within the investment result we have included investment income recognised in profit or loss, as well as any movements in fair values taken directly to other comprehensive income. Within the investment returns and portfolios we have included unit-linked funds, with the exception of Allianz which only presents the changes in fair value of unit-linked assets and unit-linked liabilities on a net basis. We do not use the percentage investment returns reported by the insurance groups in our survey because these are not calculated on a consistent basis across the companies surveyed.
© 2014 KPMG AG Wirtschaftsprüfungsgesellschaft, a member firm of the KPMG network of independent member firms affiliated with KPMG International Cooperative (“KPMG International”), a Swiss entity. All rights reserved. The KPMG name, logo and “cutting through complexity” are registered trademarks of KPMG International.

26 | Insurance Reporting Round-Up 2013
other comprehensive income. In the previous year only Old Mutual experienced negative investment returns in other comprehensive income which were mainly due to a depreciation of South African Rand.
The only companies that increased their total investment returns this year (Legal & General, Old Mutual and Standard Life) have a very high proportion of equity securities compared to the other insurers in the survey. These companies’ investment returns refl ect the improved performance of equity markets described above.
The impressive investment return achieved by Mapfre in 2013 was mainly due to the increased valuation of Spanish government bonds.
Falling credit spreads on the sovereign bonds of some of the so-called “peripheral” European countries, in particular Greece, Ireland and Portugal, compensated for the rising swap rates and led to smaller yields on these investments. As described in the Insurance Reporting Round-Up in the prior year, most of the insurers in the survey had taken steps to signifi cantly reduce their exposure to these countries and these developments did not have a signifi cant impact on their reported results.
Overall, the investment income (i.e. income from interest and dividends) by the companies in our survey has been relatively stable during the last three years, although it has fallen slightly due to the low interest rate environment and the lower investment returns achieved when capital is reinvested.
Fair value hierarchy disclosures
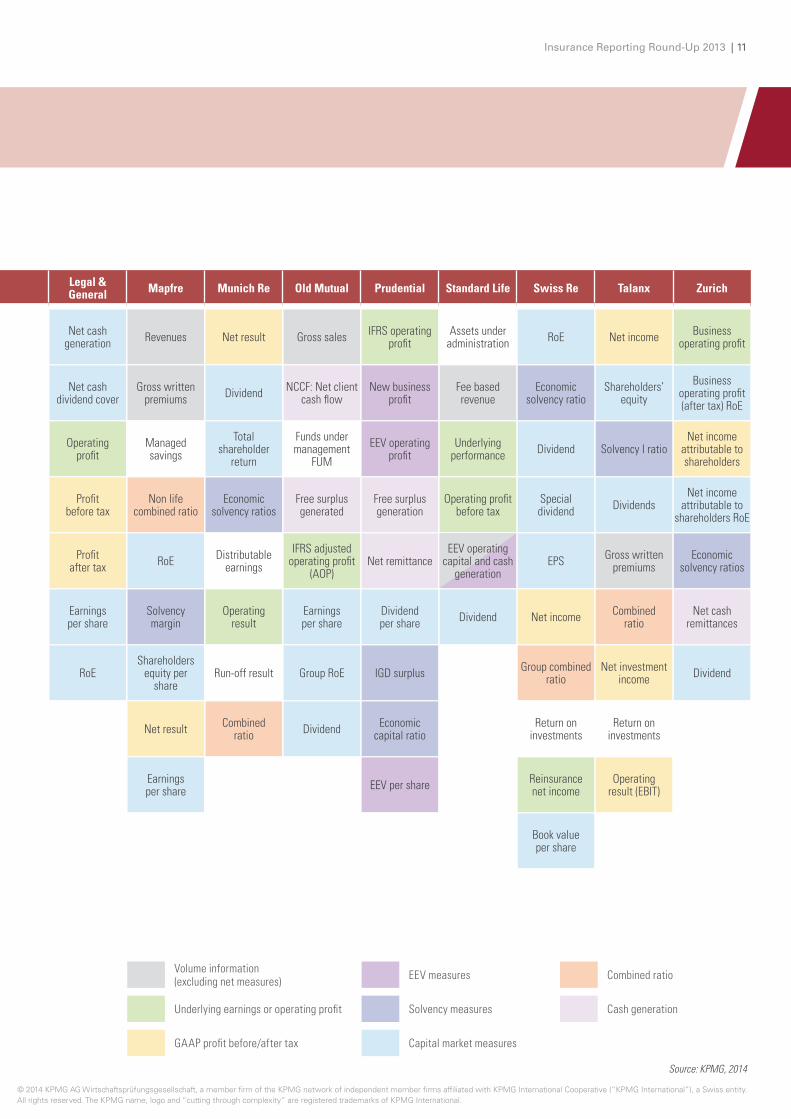
IFRS 13 requires that fi nancial instruments are classifi ed using a fair value hierarchy that refl ects the signifi cance of the inputs used in making the fair value measurements.4 The approach to hierarchy level identifi cation involves the assessment of whether the prices used to measure assets and liabilities measured at fair value are derived directly from quoted prices in an active market, and if not, the signifi cance of any inputs that are not based on observable market data for the overall measurement. IFRS 13 further distinguishes between recurring fair value measurements and non-recurring fair value measurements. Nevertheless, the following analysis will only describe the fair value hierarchy for recurring fair value measurements since the fair value hierarchy for non-recurring fair value measurements is not comparable between the different insurers in this survey.
Compared to the situation observed last year, on average there were signifi cant shifts in the distribution of the fair value hierarchy for investments measured at fair value: The surveyed insurers classifi ed 56.6 percent of their fair valued assets in level 1 (2012: 64.0 percent), 39.6 percent in level 2 (2012: 33.9 percent), and 3.8 percent in level 3 (2012: 2.1 percent).
Total investment returns decreased because of losses recognized in other comprehensive income.
4. The fair value hierarchy has the following levels: Level 1: Financial instruments for which the fair value is determined by using quoted and unadjusted prices in active markets for an identical asset or liability; Level 2: Financial instruments for which the fair value is determined by using valuation methods with signifi cant inputs other than quoted prices that are observable for the assets or liabilities, either directly (i.e. as prices) or indirectly (i.e. derived from prices); and Level 3: Financial instruments for which the fair value is determined by using valuation techniques with signifi cant inputs for the asset or liability that are not based on observable market data.
© 2014 KPMG AG Wirtschaftsprüfungsgesellschaft, a member fi rm of the KPMG network of independent member fi rms affi liated with KPMG International Cooperative (“KPMG International”), a Swiss entity. All rights reserved. The KPMG name, logo and “cutting through complexity” are registered trademarks of KPMG International.
Insurance Reporting Round-Up 2013 | 27
As can be seen from the table above, the described development was driven by fi ve of the insurers in our survey. Allianz, Munich Re, Talanx and Zurich moved assets from level 1 to level 2 of their fair value hierarchy that represented between 24.0 percent and 72.0 percent of their total assets. Furthermore, Aviva reduced its level 1 and level 2 assets and increased its level 3 assets signifi cantly. This development can be attributed to changes as regards the requirements of IFRS 13.
Intangible assets
The fi nancial year 2013 was marked by a decrease in both equity and intangibles, although in both cases the changes were insignifi cant for many of the insurers in our survey. In contrast to 2012, where only two companies reported a decrease in equity, this year the vast majority (15 out of 17) of the companies in the survey announced a decrease, largely driven by lower retained earnings and reserves for unrealized gains and losses on available for sale debt securities. For 12 of the insurers in our survey, the intangibles including deferred acquisition costs (DAC) and deferred tax assets (DTA) also decreased.
As a consequence the ratio of intangibles to equity remained relatively stable. Only Prudential reported a signifi cant increase of this ratio (18.3 percent) to 95.0 percent at the year end, due to a large increase in intangibles and a concurrent decrease in equity.
Source: KPMG, 2014
Recurring fair value measurements
0
20
40
60
80
100
Level 1 Level 2 Level 3
%
Zuric
h 20
13
Zuric
h 20
12
Tala
nx 2
013
Tala
nx 2
012
Swis
s Re
201
3
Swis
s Re
201
2
Stan
dard
Life
201
3
Stan
dard
Life
201
2
Prud
entia
l 201
3
Prud
entia
l 201
2
Old
Mut
ual 2
013
Old
Mut
ual 2
012
Mun
ich
Re 2
013
Mun
ich
Re 2
012
Map
fre 2
013
Map
fre 2
012
Lega
l & G
ener
al 2
013
Lega
l & G
ener
al 2
012
NN
Gro
up (I
NG
Insu
ranc
e) 2
013
NN
Gro
up (I
NG
Insu
ranc
e) 2
012
Gene
rali
2013
Gene
rali
2012
CNP
2013
CNP
2012
AXA
2013
AXA
2012
Aviv
a 20
13
Aviv
a 20
12
Allia
nz 2
013
Allia
nz 2
012
AGEA
S 20
13
AGEA
S 20
12
AEGO
N 2
013
AEGO
N 2
012
© 2014 KPMG AG Wirtschaftsprüfungsgesellschaft, a member fi rm of the KPMG network of independent member fi rms affi liated with KPMG International Cooperative (“KPMG International”), a Swiss entity. All rights reserved. The KPMG name, logo and “cutting through complexity” are registered trademarks of KPMG International.

28 | Insurance Reporting Round-Up 2013
By far the largest decrease in both intangibles and equity (in both relative and abso lute terms) was experienced by NN Group (ING Insurance). Equity decreased by 46.3 percent and intangibles by 68.2 percent (€ 3.8 billion) resulting in a total amount of € 1.8 billion. The reduction of intangibles was mainly caused by a large reduction in deferred acquisition costs (€ 3.2 billion or 70.3 percent) mainly due to changes in the composition of the group.
Of the fi ve companies that announced an increase in their intangibles, Prudential reported the most signifi cant increase of 15.3 percent (€ 1.5 billion) to € 11.0 billion. This rise was driven by a 23.3 percent (€ 1.1 billion) increase in deferred acquisition costs and an increase of 71.1 percent (€ 0.3 billion) in other intangible assets. The latter was largely caused by a purchase of new distribution rights. The largest increase in absolute terms (€ 2.7 billion) was reported by Allianz and was also mainly due to an increase in deferred acquisition costs.
Intangibles in relation to equity 2013
0
10
20
30
40
50
60
70
80
90
100
ZurichTalanxSwiss Re
Standard Life
PrudentialOld Mutual
Munich Re
MapfreLegal & General
NN Group (ING
Insurance)
GeneraliCNPAXAAvivaAllianzAGEASAEGON
%
Goodwill Other intangibles DAC DTA
Source: KPMG, 2014
© 2014 KPMG AG Wirtschaftsprüfungsgesellschaft, a member fi rm of the KPMG network of independent member fi rms affi liated with KPMG International Cooperative (“KPMG International”), a Swiss entity. All rights reserved. The KPMG name, logo and “cutting through complexity” are registered trademarks of KPMG International.

Insurance Reporting Round-Up 2013 | 29
Deferred participation assets
In some European countries a deferred participation asset is recognised when IFRS values of fi nancial assets are lower than the local GAAP values used to determine the participation amounts to be allocated to policyholders, and when, at the same time, local GAAP permits the inclusion of such an asset so long as it is expected to be recovered.
In the three previous years only AXA disclosed a (net) deferred participation asset. After a signifi cant decrease in 2012, AXA’s deferred participation assets decreased further from € 4.0 million to zero in 2013. AXA explained this by reference to a decrease in unrealised losses on assets available for sale.
Development from 2012–2013
(80)
(70)
(60)
(50)
(40)
(30)
(20)
(10)
0
10
20
ZurichTalanxSwiss Re
StandardLife
PrudentialOldMutual
MunichRe
MapfreLegal &General
NN Group(ING
Insurance)
GeneraliCNPAXAAvivaAllianzAGEASAEGON
%
Changes in intangibles Changes in equity
Source: KPMG, 2014
© 2014 KPMG AG Wirtschaftsprüfungsgesellschaft, a member fi rm of the KPMG network of independent member fi rms affi liated with KPMG International Cooperative (“KPMG International”), a Swiss entity. All rights reserved. The KPMG name, logo and “cutting through complexity” are registered trademarks of KPMG International.

30 | Insurance Reporting Round-Up 2013
The capital and solvency disclosures in annual reports of insurers covered in our survey include both measures based on regulatory solvency requirements and on economic solvency ratios which generally are the insurers’ own, self-determined ratios5. The latter are usually derived from internally developed economic capital model. All of the insurers in our survey reported that they intend to use their economic capital models to calculate the Solvency II capital requirement in the future.
All reported economic solvency ratios are calibrated at 99.5 percent confi dence level applying a VaR metric, in line with Solvency II, with the exception of the Swiss insurers. In Switzerland the regulatory solvency requirements comprise Solvency I as well as the Swiss Solvency Test (SST). The latter uses the 99.0 percent TVaR metric.
Solvency disclosures
In 2013, 11 groups (2012: nine, 2011 and 2010: seven) reported their economic solvency ratios. These insurers also compared them with the respective ratios from the previous year. The changes are usually analysed in economic/business changes and model changes.
8. Capital, Risk and Solvency
5. With the exception of the Swiss Solvency Test (SST) ratio the term “economic solvency ratio” does not imply a measure of capital as required by regulators or other third-parties. In general, it is a group’s own assessment of the amount of capital it needs to hold to meet its obligations given its risk appetite. The capital requirement is based on an internal assessment and capital management policies. The calculation of the available capital may vary from one insurer to another, for instance due to differences in assumptions used.
The number of compa-nies reporting economic solvency measures continued to increase as Solvency II is approaching.
© 2014 KPMG AG Wirtschaftsprüfungsgesellschaft, a member fi rm of the KPMG network of independent member fi rms affi liated with KPMG International Cooperative (“KPMG International”), a Swiss entity. All rights reserved. The KPMG name, logo and “cutting through complexity” are registered trademarks of KPMG International.

Insurance Reporting Round-Up 2013 | 31
The growing number of companies disclosing economic solvency measures over the last years reflects the increasing importance of these measures as Solvency II approaches. For an analysis of the significance of economic solvency ratios as a key performance indicator in the insurers’ presentations to analysts and investors see Chapter 3 Key Performance Indicators.
In the graph above, both the reported regulatory and the economic ratios are shown6. As in previous years, overall the regulatory ratios are on average higher than the economic ratios. However, the difference has substantially decreased.
Solvency ratio
0
50
100
150
200
250
300
350
ZurichTalanxSwiss Re
StandardLife
PrudentialOldMutual
Munich Re
MapfreLegal &General
NN Group(ING
Insurance)
GeneraliCNPAXAAvivaAllianzAGEASAEGON
Regulatory solvency ratio – 2012
Economic solvency ratio – 2012 Economic solvency ratio – 2013
Regulatory solvency ratio – 2013 Regulatory solvency ratio average – (2013)
Economic solvency ratio average – (2013)
%
The regulatory solvency ratio is the ratio of available regulatory capital resources to the regulatory required capital at group level. The economic capital ratios are calculated using companies’ internal models and direct comparison between insurers is therefore limited.The economic solvency ratios shown above for Swiss Re and Zurich are the SST ratios. While Zurich published the economic solvency ratios as at 1 July 2013 in its annual report, the respective year-end ratios were published ex post. For the purpose of comparison, the year-end SST ratio is presented.The regulatory solvency ratio presented for Allianz is calculated including off-balance sheet reserves although Allianz has not requested for these to be included in its formal solvency measure.
Source: KPMG, 2014
6. Comparisons between the reported solvency ratios are only possible to the extent that these are based on, for example, the same underlying valuation methods and calibration level.
© 2014 KPMG AG Wirtschaftsprüfungsgesellschaft, a member firm of the KPMG network of independent member firms affiliated with KPMG International Cooperative (“KPMG International”), a Swiss entity. All rights reserved. The KPMG name, logo and “cutting through complexity” are registered trademarks of KPMG International.
32 | Insurance Reporting Round-Up 2013
Somewhat counter-intuitively, the regulatory solvency ratios have decreased over 2013, whereas the economic solvency ratios have increased. This may partly be due to the fact that economic solvency ratios are more sensitive and react differently to changes in economic parameters such as interest rates and risk mitigation than the regulatory ratio. Some insurers reported changes in the methodology which also helps to explain a different behaviour of the solvency ratios.
Regulatory solvency ratios
As in previous years, despite a slight decrease the overall regulatory solvency posi tion of the insurers in our survey remained strong. The average solvency ratio of the 16 in sur ers that reported a precise ratio on a Solvency I basis decreased from 215.0 percent to 207.0 percent. Some insurers provided more background to the movement of their ratio. Among the reasons were: Lower unrealised gains on fi xed income, dividend payments, acquisitions and the new IAS 19 methodology affecting the value of the employee benefi ts.
Most insurers have a substantial amount of capital above the minimum requirements. The only insurers that reported an increase in regulatory solvency requirements were Allianz, CNP, NN Group (ING Insurance) and Old Mutual. NN Group (ING Insurance) benefi ted from a capital injection by ING Group in the light of its intended IPO. Swiss Re is the only group in the survey not disclosing a precise Solvency I ratio, but states that its Solvency I ratio materially exceeds the minimum requirement.
In Switzerland the regulatory solvency requirements comprise Solvency I as well as the SST, which uses economic solvency measures. To adequately refl ect this, the Solvency I ratio is included in this section and shown in the table above, whereas the SST ratios of Swiss Re and Zurich are analysed in more detail in the section “Eco nomic solvency ratios” below.
Economic solvency ratios
The average economic solvency ratio increased from 180.0 percent to 198.0 percent7. All insurers providing this measure reported an improved economic solvency ratio with the exception of Swiss Re (although for Swiss Re the ratio of 229.0 percent8 is in excess of the average).
For Zurich, the solvency ratio based on the SST and an additional economic solvency ratio were shown as at 1 July 2013. The SST ratio increased to 206.0 percent.
In general the companies in our survey have increased the level of detail on economic solvency metrics either in their annual reports and/or the analyst presentations this year. NN Group (ING Insurance) is one of the few companies that provided detailed information in their annual report together with Swiss Re and Zurich on the internal model used to determine the economic solvency ratio. In its annual report it disclosed economic capital for the various risk and sub-risk categories, diversifi cation benefi t and methodological details:
7. Note that an increasing number of insurers are taken into account in calculating the average solvency ratio (2013: 11, 2012: nine, 2011: seven).
8. This fi gure was fi led with FINMA at the end of October 2013 representing the consolidated group view based on a projection for mid-2013 to mid-2014.
The overall regulatory solvency position of the insurers decreased slightly but with Solvency I ratios above 200 percent on average it is still strong.
© 2014 KPMG AG Wirtschaftsprüfungsgesellschaft, a member fi rm of the KPMG network of independent member fi rms affi liated with KPMG International Cooperative (“KPMG International”), a Swiss entity. All rights reserved. The KPMG name, logo and “cutting through complexity” are registered trademarks of KPMG International.

Insurance Reporting Round-Up 2013 | 33
Economic capital by risk category
2013 2012
Insurance risk 1,697 1,918
Business risk 2,128 2,539
Market and credit risk:
– General account 3,211 3,214
– Separate account 964 930
Diversifi cation benefi t between risk categories -2,505 -2,783
Total modelled risk insurance operations 5,495 5,818
Operational risk 531 566
Economic capital of other business; NN Bank, IIM units on local required capital levels and other non-modelled
988 2,335
Total 7,014 8,719
Source: NN Group Annual Report 2013, page 156
Several companies have opted to include details on economic capital numbers only in their analyst presentation. As an example, AXA has provided the following details on sensitivities:
Available capital
In Euro billion
Required capital
Economic solvency ratio
47.3
206%199%206%
206%
219%
190%
210%
202%
204%
22.9
45.6
22.9
50.8
24.7
Economic solvencya including US equivalence
0
10
20
30
40
50
FY13 adjustedcFY12 adjustedbFY12 published
Corporate spreadsd +75 bps
Equity markets -25%
Equity markets +25%
Interest rate -100 bps
Interest rate +100bps
Ratio as of December 31, 2013
Key sensitivities
a. with US equivalenceb. adjusted for FY12 dividend paid in 2013c. adjusted for FY13 dividend to be proposed at the Shareholders’ Annual General Meeting that will be held on April 23, 2014 with payment in 2014d. Net of Liquidity premium as defined in QIS 5
Source: AXA analyst presentation, page 38
© 2014 KPMG AG Wirtschaftsprüfungsgesellschaft, a member fi rm of the KPMG network of independent member fi rms affi liated with KPMG International Cooperative (“KPMG International”), a Swiss entity. All rights reserved. The KPMG name, logo and “cutting through complexity” are registered trademarks of KPMG International.

34 | Insurance Reporting Round-Up 2013
Risk strategy
The insurers in our survey have also disclosed more information on their approach to risk this year. However, in spite of the fact that in many cases a qualitative defi nition of the risk strategy or appetite was given, quantitative information on economic targets and limits are rarely provided.
Three insurers reported an additional calibration level to their internal capital calcu lations which they apply as an internal target level: Munich Re, Zurich and Talanx.
Like in 2012 Munich Re reported an additional internal capital ratio which corresponds to 1.75 times the economic solvency ratio.
Zurich provided information on the group’s risk tolerance based on its internal metric, the entity-specifi c economic solvency ratio at a confi dence level of 99.95 percent (so-called Z-ECM ratio). This ratio has been calibrated to an “AA” fi nancial strength. Zurich defi ned the Z-ECM capital required as being the capital required to protect the group’s policyholders in order to meet all of their claims with a confi dence level of 99.95 percent over a one-year time horizon.
Its risk appetite has been defi ned as follows:
Group’s Risk Tolerance
120 % > 120 % Consider increased risk taking or remedial actions
100 % 100–120 % “AA” Target Range
No action required as within stated objective and equivalent to “AA” rating
90 % 90–100 % Position may be tolerated for a certain time depending on the risk environment
0 % < 90 %Z-ECM ratio below Group risk tolerance level, requiring appropriate remedial actions and implementation of de-risking measures
Z-ECM ratio
Source: Zurich Annual Report 2013, page 172
As of 1 October 2013, the ratio amounted to 120.0 percent.
Talanx internally applies a higher level of security: 99.97 percent. Although Talanx did not report the exact economic solvency numbers resulting from the calculation based on the 99.97 percent calibration, it did include the following information on the risk appetite:
© 2014 KPMG AG Wirtschaftsprüfungsgesellschaft, a member fi rm of the KPMG network of independent member fi rms affi liated with KPMG International Cooperative (“KPMG International”), a Swiss entity. All rights reserved. The KPMG name, logo and “cutting through complexity” are registered trademarks of KPMG International.

Insurance Reporting Round-Up 2013 | 35
“Our primary aim is to ensure compliance with our strategically defi ned risk appetite. This is determined by the following three statements:
• There is a probability of 90.0 percent that we will achieve positive net income in accordance with IFRS.
• The economic capital base must correspond to at least an aggregated 3,000-year shock (probability of ruin).
• The group’s investment risks should be limited to less than 50.0 percent of the total risk capital requirement.”
The anticipated introduction of Solvency II will have a signifi cant impact on the regulatory solvency target levels during the coming years and will bring regulatory and economic measures closer to each other. Although there is more clarity on the treatment of insurance products with long-term guarantees and the interpretation of market consistency under Solvency II than a year ago, the remaining details of the technical standards will play an important role specifi cally on the consolidated solvency levels.
© 2014 KPMG AG Wirtschaftsprüfungsgesellschaft, a member fi rm of the KPMG network of independent member fi rms affi liated with KPMG International Cooperative (“KPMG International”), a Swiss entity. All rights reserved. The KPMG name, logo and “cutting through complexity” are registered trademarks of KPMG International.

36 | Insurance Reporting Round-Up 2013
The companies included in the survey are:
9. Basis of Preparation
Company (also referred to as) General reporting basis
AEGON N.V. (AEGON) IFRS
AGEAS SA/NV (AGEAS) IFRS
Allianz Group (Allianz) IFRS
Assicurazioni Generali S.p.A. (Generali) IFRS
Aviva plc (Aviva) IFRS
AXA SA (AXA) IFRS
CNP Assurances (CNP) IFRS
NN Group (ING Insurance) IFRS
Legal & General Group plc (Legal & General) IFRS
Mapfre S.A. (Mapfre) IFRS
Munich Re Group (Munich Re) IFRS
Old Mutual plc (Old Mutual) IFRS
Prudential plc (Prudential) IFRS
Standard Life plc (Standard Life) IFRS
Swiss Re Group (Swiss Re) US GAAP
Talanx AG (Talanx) IFRS
Zurich Financial Services (Zurich) IFRS
© 2014 KPMG AG Wirtschaftsprüfungsgesellschaft, a member fi rm of the KPMG network of independent member fi rms affi liated with KPMG International Cooperative (“KPMG International”), a Swiss entity. All rights reserved. The KPMG name, logo and “cutting through complexity” are registered trademarks of KPMG International.

Insurance Reporting Round-Up 2013 | 37
This survey summarises the 2013 results of the insurance groups set out in the table opposite. Information has been obtained solely from the published preliminary results announcements, annual reports and results presentations.
Where prior year period results have been adjusted, the restated numbers have been used in our analysis. Where total amounts are presented, it is the total of the 17 insurers in the survey, unless otherwise stated. Similarly, if an average number is presented, it is the average of the 17 insurers in the survey, unless otherwise stated. Where amounts are negative, these are shown in brackets.
The results have been presented in alphabetical order; companies not publishing a specifi c measure (e.g. combined ratio for pure life insurers) in the current year have been omitted from the graphs.
All amounts used in our survey that relate to income are for the year ended on the relevant date (31 December), unless otherwise stated. Balance sheet amounts presented are as at 31 December of each year.
For the purposes of this report, amounts (including prior years’ amounts) reported in currencies other than euro have been converted to euro at the closing rate at 31 December 2013 for balance sheet amounts, and at the average rate for the period from 1 January 2013 to 31 December 2013 for income statement amounts, in order to maintain trends in companies’ presentational currencies.
The exchange rates used are obtained from publicly available information and are as follows:
Balance sheet rate at 31 December 2013
Average rate for the period from 1 January 2013 to 31 December 2013
euro: pound 1.198 1.178
euro: US dollar 0.726 0.753
euro: Swiss franc 0.816 0.813
We present some examples of disclosures from the companies’ annual reports and results presentations. The survey is not intended to serve as an accounting manual for insurance companies, nor should it be assumed that the treatments shown in all the examples are recommended without reservation. Extracts from accounts included in this survey omit note references and, in some cases, corresponding fi gures and other information which is incidental to the purpose of the illustrations.
© 2014 KPMG AG Wirtschaftsprüfungsgesellschaft, a member fi rm of the KPMG network of independent member fi rms affi liated with KPMG International Cooperative (“KPMG International”), a Swiss entity. All rights reserved. The KPMG name, logo and “cutting through complexity” are registered trademarks of KPMG International.

38 | Insurance Reporting Round-Up 2013
Abbreviations usedAPE Annual Premium EquivalentCAC Cotation Assistée en Continu (French Stock Market Index)CFO Forum European Insurance Chief Financial Offi cers ForumCMS Constant Maturity SwapDAC Deferred Acquisition CostsDAX Deutscher Aktienindex (German Stock Market Index)DTA Deferred Tax AssetsEBIT Earnings Before Interest and TaxesEEV European Embedded ValueEPS Earnings per ShareESMA European Securities and Markets AuthorityEV Embedded ValueFCD Financial Conglomerates DirectiveFED Federal Reserve BankFINMA Eidgenössische Finanzmarktaufsicht
(Swiss Financial Market Supervisory Authority)FTSE Financial Times Stock Exchange GAAP Generally Accepted Accounting PrinciplesIASB International Accounting Standards Board IFRS International Financial Reporting StandardsIGD Insurance Groups DirectiveIPO Initial Public OfferingKPI Key Performance IndicatorMCEV Market Consistent Embedded ValueNAV Net Asset ValuePVNBP Present Value of New Business PremiumsRoE Return on EquitySST Swiss Solvency TestTVaR Tail Value at RiskUS GAAP US Generally Accepted Accounting PrinciplesVaR Value at Risk
Glossary
The following people have made signifi cant contributions to this publication:Stefan EngeländerBettina HammersJoachim KölschbachJudith LorenzChristian Seck
Peter SmitPhilipp WerneburgFrank Van den WildenbergJeroen van Wageningen
© 2014 KPMG AG Wirtschaftsprüfungsgesellschaft, a member fi rm of the KPMG network of independent member fi rms affi liated with KPMG International Cooperative (“KPMG International”), a Swiss entity. All rights reserved. The KPMG name, logo and “cutting through complexity” are registered trademarks of KPMG International.

Insurance Reporting Round-Up 2013 | 39
© 2014 KPMG AG Wirtschaftsprüfungsgesellschaft, a member fi rm of the KPMG network of independent member fi rms affi liated with KPMG International Cooperative (“KPMG International”), a Swiss entity. All rights reserved. The KPMG name, logo and “cutting through complexity” are registered trademarks of KPMG International.

The information contained herein is of a general nature and is not intended to address the circumstances of any particular individual or entity. Although we endeavor to provide accurate and timely information, there can be no guarantee that such information is accurate as of the date it is received or that it will continue to be accurate in the future. No one should act on such information without appropriate professional advice after a thorough examination of the particular situation.
© 2014 KPMG AG Wirtschaftsprüfungsgesellschaft, a member fi rm of the KPMG network of independent member fi rms affi liated with KPMG International Cooperative (“KPMG International”), a Swiss entity. All rights reserved. Printed in Germany. The KPMG name, logo and “cutting through complexity” are registered trademarks of KPMG International.
Contact us
KPMG in Germany Frank EllenbürgerJoint Global Insurance Audit LeadPartner, Financial ServicesT +49 89 [email protected]
Frank PfaffenzellerJoint Global Insurance Audit LeadPartner, Financial ServicesT +49 89 [email protected]
KPMG in BelgiumKarel TanghePartner, Financial ServicesT +32 [email protected]
KPMG in FranceViviane Léfl aivePartner, Financial ServicesT +33 155 686227vlefl [email protected]
KPMG in ItalyPaolo ColciagoPartner, Financial ServicesT +39 02 [email protected]
www.kpmg.de/insurance
KPMG in the NetherlandsFrank Van den WildenbergPartner, Financial ServicesT +31 206 [email protected]
KPMG in the UKDanny ClarkPartner, Financial ServicesT +44 20 7311 [email protected]
KPMG in SpainAntonio Lechuga CampilloPartner, Financial ServicesT +34 93 253 [email protected]
KPMG in SwitzerlandHieronymus DormannPartner, Financial ServicesT +41 58 249 [email protected]


![Self-Insurance Electronic Data Reporting System … · PUBLICATION F207-194-000 [02-2008] Self-Insurance Electronic Data Reporting System (SIEDRS) Enrollment Package — Version 2.0](https://img.pdfslide.us/doc/110x75/5b14d9717f8b9ab6778c4f97/self-insurance-electronic-data-reporting-system-publication-f207-194-000-02-2008.jpg)