Embed Size (px)
Citation preview
working paperPolicy Uncertainty and the Market for Wind insUrance
By Daniel Sutter
no. 09-17June 2009
The ideas presented in this research are the author’s and do not represent official positions of the Mercatus Center at George Mason University.
Policy Uncertainty and the Market for Wind Insurance
Daniel Sutter
Mercatus Senior Affiliated Scholar Department of Economics & Finance University of Texas—Pan American
Edinburg, TX 78539-2999

1
1. Introduction
On August 29, 2005, Hurricane Katrina struck the Gulf Coast, resulting in over 1,000
deaths, the most of any hurricane in the United States in over 75 years, and a record $40 billion
in insured losses. In addition, Katrina caused $18 billion in losses to the National Flood
Insurance Program (NFIP), leaving the program bankrupt. In the aftermath of Katrina, many
state residual markets for property insurance have experienced considerable growth. Residual
markets are designed to serve as an insurer of last resort to enable homeowners and businesses to
secure required insurance even during periodic fluctuations in the market. Seven states have
dedicated residual markets for wind insurance, or wind pools, and a number of these state-
supported entities have grown past any role as an insurer of last resort and become a means of
providing subsidized insurance to coastal residents (Pompe and Rinehart 2009). In addition, all
but two Atlantic coast states which do not have wind pools have general residual markets, or Fair
Access to Insurance Requirement (FAIR) plans, which provide coverage for coastal properties,
among others.
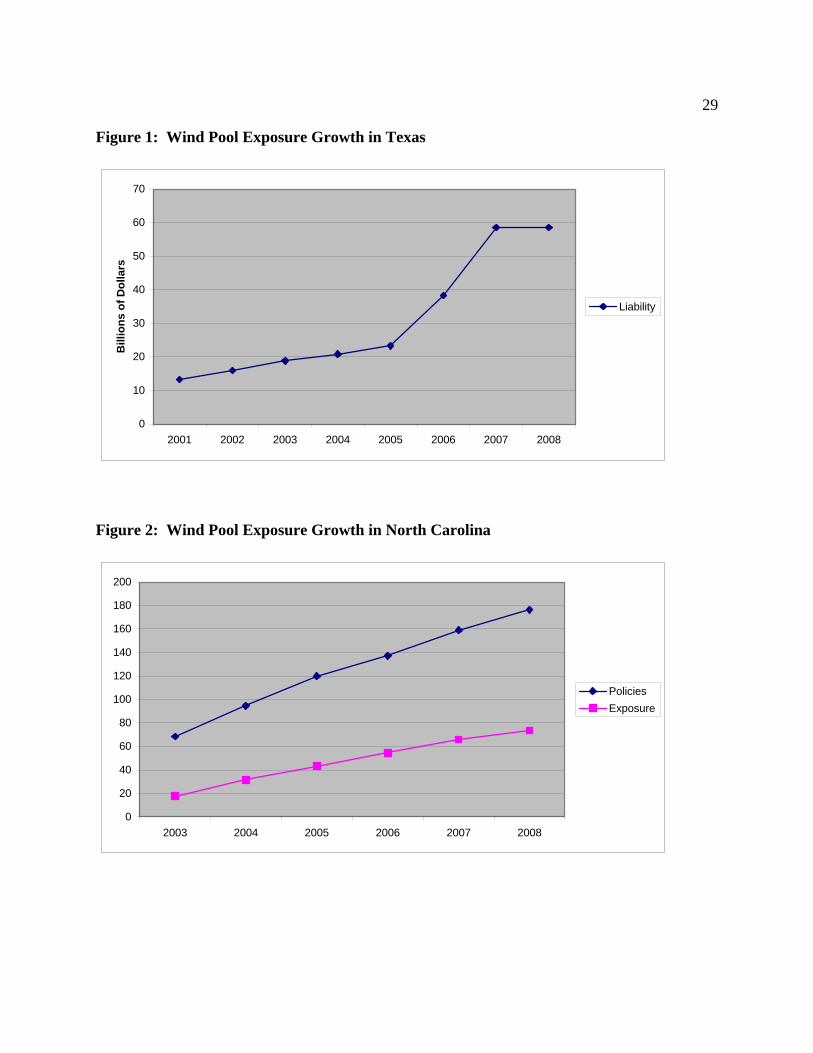
Figures 1 and 2 display the growth experienced by the state wind pools in North Carolina
and Texas since Hurricane Katrina. The Texas Windstorm Insurance Association (TWIA) has
quadrupled in size since 2001, and the growth has been particularly rapid since 2005, with a 151
percent increase in total liability in force between 2005 and 2007. The North Carolina Insurance
Underwriting Association has experience a 157 percent increase in policies in force and a
quadrupling of liability in force between 2003 and the end of 2008. Property-casualty insurance
is subject to a well-recognized cycle, and catastrophic losses tend to lead insurers to write less
new insurance and raise rates for existing policy holders to replenish reserves (Born and Viscusi
2
2006). But the reduction in insurance availability in the Atlantic and Gulf coast is alleged to go
much beyond a cycle, and has been widely described as companies “abandoning” coastal areas
(Taylor 2008). Some observers now question if hurricane risk is even insurable. The announced
exit of State Farm, the nation’s largest insurer, from the Florida homeowner’s market in January
2009 symbolizes this abandoning of the coast. The 110th and 111th Congresses considered
legislation to extend the NFIP to cover wind insurance as well.
The above discussion suggests that the decrease in wind coverage in coastal areas
following Katrina is due to market inefficiency, which some might attribute to excessive concern
by insurance companies about ensuring a sufficiently high profit margin. But at least two
alternative explanations for the increase in state residual market coverage exist. First, insurers
could be writing less insurance in response to new information about expected hurricane losses.
Hurricanes occur infrequently and have the potential to result in extremely large, correlated
losses, which creates the difficulty of insuring against catastrophes. But the infrequency of
major hurricane landfalls also means that actuaries, engineers, and catastrophe-risk modelers
rarely get to learn about the determinants of hurricane losses. By contrast, insurers learn about
losses in auto accidents or hail storms every year. Insurance companies may have revised
upward their expectation of losses in future hurricanes based on storms of 2005, resulting in a
desire to charge higher rates. If regulators refuse to permit rates to rise, the reduced availability
of insurance is simply a price ceiling induced shortage.
Second, the actions of insurance regulators and other policy makers may be generating
policy uncertainty regarding future costs. State insurance commissions regulate rates and
contracts and take actions for a variety of political purposes. Many of these actions increase
costs directly for insurers, but also generate uncertainty regarding future policy decisions, and
3
this policy uncertainty, in the spirit of Robert Higgs’ (1997) regime uncertainty, increases the
potential for even more costly actions in the future. While increase in costs in the first
alternative is largely unavoidable, the costs and uncertainty due to bad policy decisions are in
theory avoidable, if not politically feasible.
This paper is organized as follows. Section 2 discusses the conventional wisdom
regarding the flight of insurance companies from coastal areas and interprets the flight in terms
of economic models of herding. Section 3 discusses the first alternative explanation, that the
hurricanes of 2004–05 increased expected losses from future hurricanes. Specifically, these
seasons highlighted the potential for two major hurricanes to strike population centers along the
U. S. coast in the same season, and the need for insurance companies to prepare for such an
event. Section 4 discusses the concept of policy uncertainty and discusses specific sources of
uncertainty from 2005, including litigation by state regulators against leading insurers. Section 5
examines changes in the premiums written by leading insurance companies in coastal states
between 2005 and 2007 for evidence of herding. The analysis undermines both the abandonment
of the market of coastal states by leading insurers and herding, as changes in underwriting by
insurers across coastal states are basically uncorrelated. By contrast, herding predicts positive
correlation in premiums among herders. Section 6 concludes. The logic of concentrated benefits
and dispersed costs suggests that state policy makers will respond to the demands of coastal
residents following hurricanes, and these time inconsistent actions imply that policy uncertainty
will be pervasive. Federal regulation may be one way to tie the hands of state policy makers and
create a more market-friendly environment for wind insurance.
2. Herding and Inefficient Exit of Insurers
4
Insurance companies from Texas to Cape Cod reduced their exposure in high-risk coastal
areas after Katrina. Insurance companies may want to revise their book of business in the
aftermath of a major hurricane for numerous reasons; an insurer might suffer heavy losses and
temporarily experience loss of capacity or ability to pay claims, or realize they have more
exposure than desired in high-risk coastal areas. The reduction in capacity following a
catastrophe is part of the well-recognized cycle (Born and Viscusi 2006). The market response
following Katrina has been attributed to much more than an adjustment process in which some
companies reduce their exposure while others take advantage of this opportunity to expand their
business. U. S. Representative Gene Taylor (D, Mississippi) describes the situation as follows:
In the aftermath of Hurricane Katrina, the insurance industry has proven beyond all doubt that the private insurance market is not capable of offering adequate coverage in coastal communities. The insurance and reinsurance industries have a well-developed pattern of exploiting the market conditions after a major catastrophe to simultaneously reduce the risk while hiking up their premiums . . . . Insurance companies have blamed Katrina as they have stopped writing new policies and doubled, tripled, or quadrupled premiums on existing policies. They have not confined this price gouging to Mississippi and Louisiana, but have jacked up premiums and reduced coastal risk from the Texas Coast to Long Island and Cape Cod (Taylor 2008, p.788).
The alleged mass exodus of leading insurers from coastal markets has been attributed to greed,
and has led some observers to question if hurricanes may now be uninsurable.1
Inefficient abandonment of coastal markets would be easier to explain if homeowners
insurance markets were highly concentrated. If a handful of companies wrote all of the
insurance, perhaps an insurance cartel could be manipulating the market. But considerable
competition or potential competition exists in homeowners insurance markets of all coastal
1 Insurability refers to the potential for insurers to pool risk and sell coverage at a premium which people would purchase (Kunreuther 1998).

5
states. If companies with a one percent share of premiums in the market are considered
competitors, then the number of competitors in the 18 Atlantic and Gulf Coast states ranged from
13 to 28, with an average of 18.4.2 And other companies write insurance in these states and
could take advantage if leading insurers abandoned a profitable market. The number of potential
competitors, companies with one-tenth of 1 percent of homeowners premiums in 2007, ranged
from 31 to more than 50 with an average of 43.1. In addition, other companies write insurance
for commercial property in these states. Even though commercial property specialists may have
greater expertise in underwriting commercial risks, they possess knowledge of risks in the state
and have agents and adjusters who could facilitate an entry into the residential market if the exit
of other insurers opens up a profitable opportunity.
With so many actual and potential participants, it is unlikely that all insurers would
simply miscalculate the cost of underwriting in the aftermath of the 2005 hurricane season. To
provide a perspective on this, consider the following model. Assume that each insurance
company received private information after Katrina regarding the change in the cost of writing
coastal insurance; let ci be the signal received by firm i, which can be interpreted as the
percentage increase in premiums required (a decrease if negative). The signal reflects the
analysis provided by the firm’s actuaries, underwriters, engineers, and risk modelers. Experts
are not omniscient, and thus the information a firm receives regarding the cost change is noisy,
and can be modeled as probabilistically distributed. Thus if c� is the true cost increase, firm i’s
signal would be ci = c� + ,i, where ,i is the error in firm’s i’s estimate of the cost change.
Although each firm can make a mistake, convention in economic modeling suggests that on
2 The premium data analyzed in this paper was assembled by the Insurance Information
6
average experts are correct, or that the mean of ,i is zero for each firm. The aggregation of the
signals provide society’s best-available estimate of the cost of insurance (the Wisdom of Crowds
argument) and the power of the crowd depends on the independence of each firm’s cost estimate.
If only three of four companies wrote insurance, the probability that each might independently
receive an incorrect signal that the cost of future hurricanes had risen, while not large, certainly
would not be zero. But as established above, at least 18 companies have a 1 percent or greater
share of the market in each state, so the probability that all these insurers receive the same
mistaken information signal that costs had risen dramatically is very small.3
Nonetheless, firms may not act on their private information regarding costs in setting
rates or reducing insurance written in coastal states. Each firm takes a publicly observed action
(requesting a rate increase, not writing new policies) based on its private information and the
observed actions of other firms, which presumably reflects their private information. The
potential exists in models with private information and public actions for asymmetric
information, information cascades, or herding. These possibilities arise because managers know
that their information could be wrong and try to update their assessment based on the
information of others, as revealed through actions. In an information cascade, firms use the
actions of other firms to update their own information (Bikhchandi, Hirshleifer, and Welch 1992,
Banerjee 1992). Actions by others at odds with the firm’s own signal can indicate to managers
Institute and is available at www.iii.org/.
3 The signals received by each insurance company could be correlated, as actuaries at different firms will have received much of the same formal training, will receive some of the same information (building performance assessments), and communicate with each other. If the signals are perfectly correlated, then the independence of the individual assessments required for information aggregation fails to hold. Partial correlation can be introduced by decomposing the information signal of each firm into a common signal received by all and a firm specific
7
that their own signal is erroneous. But when firms discount their own information, early signals
are propagated, and subsequent firms become even less likely to follow their own information
when it differs from the observed actions of others. If the early choosers happen to be wrong, an
inefficient decision by the group results. One possibility is asymmetric information, that some
firms might be recognized to have higher quality information than others, or noise in their signal
,i would have a smaller variance. In models of asymmetric information, the actions (and
information) of the best-informed firms will carry disproportionate weight, potentially canceling
out contradictory information received by other firms. In the instances when the most-informed
firm happens to be wrong, others follow along, although if anyone knew the private information
of all firms, the error would become apparent. Herding can also arise due to managers’
incentives (Scharfsetin and Stein 1990). Mistakes hurt a manager’s reputation, but not all
mistakes are equally costly. When a manager takes an action at odds with other firms which
turns out to be wrong, this will hurt a manager’s reputation. On the other hand, a mistake in
common with others (when following the herd) does much less damage to one’s reputation.
Thus once firms start herding, managers might become very reluctant to follow their private
information even when this differs from the actions of others.
Economic models of asymmetric information, cascades, and herding provide a
framework for inefficient exit of insurers from coastal markets. For one reason or another, a
large insurer chooses to reduce their book of business in coastal states. Even if this decision is
optimal for this firm (if firms are heterogeneous and the same information about costs or risks
could lead firms to respond differently), other insurers interpret this as evidence that coastal
insurance is now too costly or risky to write. Other insurers will ignore their private information
component.
8
and join the exodus. The failure of the private market drives coastal property owners into the
state residual market. State policy counters market inefficiency in two ways: by providing a
much needed insurer of last resort and by stemming inefficient herding by insurers.
3. Changing Circumstances and Regulation
Inefficient herding is not the only possible explanation for a decline in the availability of
insurance after Katrina. Catastrophe insurance differs from ordinary types of insurance in two
ways. First, in contrast with normal types of risks where the probability of loss across policy
holders is independent, hurricane risk is correlated, making wind insurance in coastal areas much
more costly. But the infrequency of major hurricanes or earthquakes also means that insurance
companies only get to learn about these losses infrequently. Major hurricanes can stress the
global insurance market, but also allow engineers and actuaries to learn valuable new
information about losses. Hurricane Andrew in 1992 was the first major hurricane to
significantly impact the United States in about two decades. And the 2004–05 hurricane seasons
were the next major hurricane events for the United States. Major hurricanes provide a learning
experience, and insurers often learn that they have not been properly estimating losses and have
to adjust rates accordingly. That is, firms could all receive signals ci that costs have gone up, and
the signals could be correct.
Hurricane Andrew provides an important example of learning from a hurricane. South
Florida had one of the strictest building codes in the nation in the 1970s and 1980s. This should
not surprise given Florida’s hurricane risk and the historical examples of the Great Miami
Hurricane of 1926 and the Lake Okeechobee hurricane of 1928, the second-deadliest hurricane in
U. S. history. Investigation of damage after Andrew revealed a surprising fact: Newer homes
and subdivisions suffered more damage than older subdivisions, everything else equal (Fronstin

9
and Holtman 1994). Further investigation revealed that communities had been poorly enforcing
the South Florida Building Code, for instance by certifying building materials and techniques as
meeting the code despite their inadequacy, and hiring too few building inspectors. Eventually 25
percent of damage in Andrew was attributed to poor code enforcement (Mileti 1999, pp.).4
Insurers who had been charging rates based on the presumption that construction was to code
learned that their rates were inadequate. If regulators restrict premiums from rising, the normal
effect of a price ceiling will produce a crisis of availability. Thus, new information leading
insurers to want to raise rates combined with rate regulation can result in the reduction in the
availability of insurance as herding.
Katrina provided several lessons which might lead insurers to want to raise rates. The
2004–05 hurricane seasons each involved landfalls of three major hurricanes in the continental
United States.5 As a consequence of this, rating companies determined that insurers needed to
be prepared to meet a higher level of claims than previously anticipated, with the potential for a
hurricane season with $100 billion in insured losses looming on the horizon. This change in
required preparations meant that companies needed to build up additional reserves and purchase
more reinsurance, which created pressure to raise rates or alternatively reduce exposure in
coastal areas (Grace, Klein, and Lin 2006). The requirement certainly seems prudent in the
aftermath of the 2005 hurricane season, when New Orleans and the Mississippi coast were struck
4 Studies after the Northridge Earthquke in 1994 also revealed that a substantial portion of the damage was due to poor building code enforcement (Mileti 1999), demonstrating that insurers could not dismiss the issue of enforcement as isolated.
5 A major hurricane has a rating of 3, 4 or 5 on the Safir-Simpson scale of hurricane intensity. The scale rates hurricanes from 1 to 5. The winds of a category 3 hurricane are 111 mph or greater. For more on the Safir-Simpson scale see
10
by Katrina, Rita approached the Houston-Galveston area as a Category 5 storm, and Wilma
struck South Florida after attaining the lowest barometric pressure ever for a hurricane in the
Western Carribean. While rating agencies are often reviled as the bearers of bad news, they play
an indispensable role in disciplining financial markets and hopefully providing sober analysis
unaffected by the wishful political thinking.
Demand for repair services and building material naturally rises after a major hurricane,
and this increases prices for building supplies and contractors, increasing the cost of repairs
relative to a more even spacing of demand over time. A major hurricane will tax capacity in the
construction industry, so some escalation in cost is inevitable. The cost of repairs can be greater
if not completed quickly, that is, damage from wind, rain and heat continues to mount until
repairs are completed. The cost of claims will rise if a home is uninhabitable and the
policyholder has coverage for alternative living expenses. For reasons which are not yet clear,
demand surge appears to be worsening (Pielke et al. 2008), increasing expected costs in future
hurricanes. Government policy may play a role. States license contractors and this can limit the
flow of out-of-state contractors after a hurricane affected zone.6
The potential for increased hurricane activity in the future is increasing expected costs for
insurers, or at least contributed to growing loss ambiguity. Some leading atmospheric scientists
argued for a possible link between climate change and global warming and increased hurricane
activity and intensity during the 2005 hurricane season, and although the claim is controversial;
at a minimum Atlantic hurricane activity is in the active phase of a decades-long natural
http://www.nhc.noaa.gov/aboutsshs.html.
6 Florida relaxed its restrictions on out-of-state contractors after the 2004 and 2005 hurricanes, without any adverse consequences, as examined by Skarbek (2008).
11
oscillation.7 And even if the global warming turns out unfounded, disagreement among experts
creates ambiguity which increases the rates underwriters charge (Kunreuther et al. 1995). Some
increase in rates today is prudent since insurers would be irresponsible to ignore totally experts
predicting more destructive from hurricanes in the future. The insurance premiums established
during the period of low tropical activity in the Atlantic in the 1970s, 1980s, and 1990s are
inadequate given the recent upswing in hurricane activity.
4. State Actions and Policy Uncertainty
Politicians cannot lower the real resource cost of economic activity. If the expected
damage from hurricanes has increased, insurance rates will have to rise in the absence of
subsidies, a simple point which many observers none the less try to ignore, as Grace et al. (2006)
note. State insurance departments and other state officials, however, took actions in the
aftermath of Katrina and other hurricanes which have unnecessarily increased costs. And
perhaps more significantly, these actions have contributed to policy uncertainty in state property-
casualty insurance markets. Policy uncertainty increases ambiguity and the cost of writing wind
insurance in hurricane-prone states. I use the term policy uncertainty to draw on Higgs’ (1997)
concept of regime uncertainty. Higgs introduced regime uncertainty to explain the failure of
private investment to recover during the New Deal and thus the persistence of The Great
Depression. New Deal policies created “uncertainty among investors about the security of their
property rights in their capital and its prospective returns. This uncertainty arose, especially
7 For scientific papers on the link between recent hurricane activity and global warming see Emanuel (2005, 2008) and Webster et al. (2005). For dissenting views see Pielke et al. (2005), Klotzbach (2006), and Klotzbach and Gray (2006).

12
though not exclusively, from the character of federal government actions . . .” (1997, pp.563–4).
The crucial element of regime uncertainty is the potential for actions which may never occur to
disrupt markets. As Higgs describes,
In retrospect it seems hyperbolic to put much weight on the fears of investors in the latter half of the 1930s that the regime might soon undergo changes that would seriously jeopardize their private property rights—after all, we know quite well that the U. S. economy did not fall into outright fascism, socialism, or some other variant of government takeover . . . . But what seems so obvious to us in retrospect had a quite different appearance to many contemporaries . . . the possibility that the United States might undergo an extreme regime shift seemed to many investors in the late 1930s and early 1940s not only possible but likely (569).
The policy measures discussed below affect the insurance market directly by raising costs and
indirectly by creating the specter of more cost increasing actions in the future. I do not mean to
imply that insurers fear the attenuation of property rights which Higgs considered possible in the
New Deal, and thus I use the more modest term policy uncertainty, but I still wish to emphasize
the prospect of future actions to affect insurer behavior today. Carden (2009) has applied regime
uncertainty to explain the impact of price gouging laws and rhetoric in the aftermath of Katrina.
Perhaps the most-noted insurance policy action after Katrina was the state of
Mississippi’s litigation to force insurance companies to pay for storm surge damage from
Katrina. Storm surge has been an excluded peril under homeowners insurance since before the
advent of the National Flood Insurance Program (NFIP) in 1968. The state’s action was
undoubtedly spurred by the low rate of purchase of flood insurance along the Mississippi coast,
and thus thousands of constituents with wrecked homes and no insurance. The low coverage
limit under the NFIP of $250,000 also contributed to the dilemma as many other coastal homes
were not be fully insured. Mississippi tried to force insurance companies to pay for losses they
had not expected to pay. The attorney general’s argument was more sophisticated and involved
13
wind damage a property might have suffered before the storm surge arrived. Thousands of
homes were completely washed away by the storm surge, making a definite determination of
how much wind damage might have occurred prior to the storm surge impossible. The inability
to prove whether homes were damaged by wind prior to the storm surge provided an opportunity
for politicians to try to provide relief for uninsured or underinsured constituents by shifting costs
to insurers (Binderup 2006).
Mississippi was not the only state to litigate after the 2005 hurricane season. Hurricane
Rita prompted the evacuation of an estimated 1.5 million persons from the Houston area before
striking along the Texas-Louisiana border as a Category 3 storm. The evacuation for Rita was
possibly more costly than the storm itself, given the time of people spent in the massive traffic
jams, the disruption of economic activity during the evacuation, and a bus accident which killed
20 evacuating nursing home patients. Many homeowners’ insurance policies include coverage
for alternative living expenses when storm damage forces residents out of their homes, but this
coverage applies only when the property is damaged. Policyholders who either could not return
to their undamaged homes quickly after Rita or who elected to stay out of their homes due to
power outages filed claims for their living expenses. The Texas Department of Insurance
intervened on behalf of the policyholders, first issuing an injunction to force Allstate to pay the
claims and then suing to force payment of these claims. A state court ruled in Allstate’s favor in
January 2006 (Insurance Journal, 1/26/2006).
Other insurance policy decisions contribute to market uncertainty. State regulators often
limit the ability of insurers to reduce the amount of insurance they write or exit the state market
after a hurricane. The Florida Department of Insurance imposed a moratorium on cancellation,
nonrenewal, and withdrawal from the state for more than a year after Hurricane Andrew and the
14
state legislature extended the restriction through November 1996 (Lecomte and Gahagan 1998).
Both Louisiana and Mississippi restricted the nonrenewal of policies following Katrina. In
Louisiana, Rule #23 enacted restricted cancellation or nonrenewal of policies, and remained in
effect until December 31, 2006. In Mississippi, Commissioner George Dale issued Bulletin
2005-13 restricting cancellation or nonrenewal of policies, which was extended in January 2006.
Restrictions on reducing a company’s book of business contribute to policy uncertainty, because
in the wake of new information demonstrating the need for higher rates and in the face of
regulator opposition to rate increases, writing less insurance becomes the only option available to
insurers. Yet, regulators often foreclose the exit option when needed by companies. An inability
to reduce a company’s book of business makes the initial writing of insurance less attractive
(Lecomte and Gahagan 1998).
Assessments imposed as a consequence of government intervention into the insurance
market contribute to uncertainty as well. State-sponsored residual markets for wind coverage are
the primary form of assessment in costal states. The wind pools offer subsidized coverage for
high-risk properties in coastal areas, and seven states from Texas to North Carolina have
dedicated residual market mechanisms for wind insurance. The inadequacy of rates ensures that
the state wind pools will run deficits when major hurricanes strike. The pools assess member
companies to cover the deficits, and all membership in the pool is a condition of writing
insurance in the state. The assessments function as the economic equivalent of an excise tax on
insurance premiums, except that the tax is only imposed after a hurricane, and for an amount
unspecified in advance. Florida, Louisiana, Mississippi, and Texas all assessed their state
insurers due to the 2005 hurricanes. Wind pools are not the only source of hurricane-related
assessments. All states have guaranty funds for state insurance companies to ensure payment of
15
claims against insolvent insurers. Guaranty funds have a similar ability to assess state insurers in
case of a deficit. The correlated risk of a hurricane creates a danger of failure for insurers and
the potential for guaranty fund assessments. Nine insurers failed in Florida after Andrew
(Lecomte and Gahagan 1998), and the Poe Insurance Group companies failed following the
2004–05 hurricanes. The Florida Guaranty Fund imposed assessments of $225 million due to
the failure of the Poe Group. And the state of Florida has entered the reinsurance business
through the Florida Hurricane Catastrophe Fund, or the Cat Fund, which provides reinsurance to
insurance companies in the state, including Florida Citizens (the state wind pool), at below
market rates. Providing reinsurance at subsidized rates ensures the availability of deficits when a
major hurricane strikes, again covered by assessments on state insurers. The Cat Fund imposed a
1 percent assessment to remedy its shortfall after the 2004–05 hurricanes. Assessments
contribute to policy uncertainty, since they are unspecified in advance and can be potentially
quite large. The Texas Windstorm Insurance Association (TWIA) literally relies on unlimited
assessments after a modes amount of reinsurance coverage; TWIA had already reached its layer
of unlimited assessments after Hurricane Ike.8 States typically allow insurers to recoup
assessments by surcharges on policy holders or by crediting assessments against state insurance
taxes, but neither mechanism offers particularly effective relief. In states like Texas which allow
tax offsets, companies can only get relief up to the maximum taxes paid in a given year, so
assessments from a major hurricane would take years to recoup in tax offsets. And the incidence
of a surcharge on policyholders to pass on assessments depends on the elasticities of supply and
demand, as with any commodity tax. Assessments comprise a threat to the viability of insurers;
8 “Hurricane Ike Fact Sheet” from the Texas Windstorm Insurance Association, available
16
one company in Florida failed due to the assessments from Hurricane Andrew, while insurers in
Texas purchase reinsurance to cover their potentially unlimited assessments from the state wind
pool.
The exclusion of flood losses from homeowners insurance and coverage through the
NFIP is another source of uncertainty. The separation of flood and wind coverage and the
ensuing flood—no flood tango creates considerable uncertainty for policy holders who may have
to wait for coverage or may find out that losses will not be covered if this property is under-
insured for floods (Chamlee-Wright 2007). But the tango also contributes to uncertainty for
companies. Attributing damage to wind or water is at a minimum very costly and is simply
impossible when storm surge totally washes a structure away. Because engineering studies will
prove inconclusive, politics can affect the allocation of losses to flood and wind policies, leaving
insurers unsure what portion of losses they may have to pay in the next hurricane. After Katrina,
the federal government encouraged a speedy payment of claims, and thus the NFIP was
instructed to pay claims without a firm determination that losses were caused by flooding or
storm surge. But after allegations that insurers shifted wind losses to federal taxpayers, insurers
might face a different attitude on the part of federal officials next time. Also, state politicians
have an incentive to help out flood under-insured constituents by forcing insurers to cover these
losses, as Mississippi officials attempted through their litigation after Katrina. State-sponsored
wind pools can also be forced to take on these losses, with the costs passed on to insurers
through larger assessments.
State regulators also take actions which while not directly related to hurricane losses and
wind coverage contribute to policy uncertainty. For example, Connecticut regulators in 2006
at www.tdi.state.tx.us/consumer/storms/documents/windfactsheet.pdf.
17
prevented companies from making the installation of hurricane shutters—metal coverings for
doors and windows to prevent damage from wind-blown debris—a requirement for coverage.
Hurricane shutters reduce wind damage, and insurers may seek to reduce their potential for large
losses by insuring only well-built homes. The mold crisis in Texas also illustrates the potential
for contractual uncertainty. Claims for mold damage to homes skyrocketed after a state court
held in 1999 that mold was a covered peril under the standard Texas homeowners’ policy.
Insurers attempted to substitute language used in other states to exclude mold coverage, but the
Texas Department of Insurance refused for several years to approve the new contract. In the
interim, insurance companies paid out $900 million in mold claims, and the number of
companies writing home owners insurance in the state fell from 137 to 101. The state faced a
crisis of availability of insurance similar to that in coastal areas following Katrina. The mold
crisis ended quickly in 2002, after the state finally approved the new form excluding mold
coverage (Peacock 2008). While not directly on point for hurricanes, actions such as this must
suggest to insurers that policy makers might similarly accommodate an expansion of coverage
after a hurricane. And as mentioned, the Texas Department of Insurance did try to force Allstate
to cover alternative living expenses for policy holders whose homes were not damaged in
Hurricane Rita.
Finally, the role of post-hurricane litigation must be mentioned. Insurance is a
complicated contract, and disputes will inevitably result following a major hurricane, and thus
some litigation is inevitable. But suing insurance companies has become growth area for trial
lawyers, especially in cases where homes have suffered storm-surge damage, creating ambiguity
regarding the source of losses. Hundreds of suits were filed in state and federal courts following

18
Hurricane Katrina.9 If anything, lawyers are becoming more aggressive in recruiting policy
holders, based on comparisons in the aftermath of Hurricanes Rita and Ike on the Texas coast.
Litigation plays an indispensable role in the market process, but hurricane claims appear to be
one area where excessive litigation is negatively affecting society. The costs of litigation and
potentially erroneous jury awards contribute to the uncertainty of insurance against homeowners.
5. Herding or Calculated Exit? Evidence from Coastal Homeowners Insurance Markets
Does inefficient herding by private insurers explain the growth of wind coverage in
residual markets since 2005? To provide evidence on this, I now examine the change in
premiums written by the top 50 insurance companies in the 18 Atlantic and Gulf Coast states
between 2005 and 2007. Premiums written by a company in a year in a state is a measure of
revenue and not the quantity of insurance. Higher rates could increase premiums written even if
fewer policies being written. Premiums could also go up if coverage limits increased or
deductibles decreased on existing policies. To closer approximate a change in quantity between
2005 and 2007, I adjust the company’s 2005 premiums written by the percentage change in total
state homeowners premiums between 2005 and 2007. For example, total premiums written in
Alabama increased by 14.1 percent between 2005 and 2007, from $1.006 billion to $1.147
billion. If the total premiums written by a company in Alabama increase by less than 14.1
percent, the company has reduced its coverage in the state, at least relative to the average
increase in the state. For each company, 2005 premiums were multiplied by this change in state
premiums to create a projected premium written in 2007; Change in Premiums is the percentage
9 For an overview of the highlights of these cases see Binderup (2006).
19
difference between actual 2007 premiums and projected 2007 premiums. A negative value of
Change in Premiums indicates that a company has reduced coverage in a state since Katrina.
Overall premiums written by private insurers in the 18 coastal states increased by 15.8 percent
between 2005 and 2007, with the percentage increases by state ranging from 6.5 percent in
Maryland to 26.6 percent in Florida. Table 1 includes detailed definitions and sources for the
variables employed here.
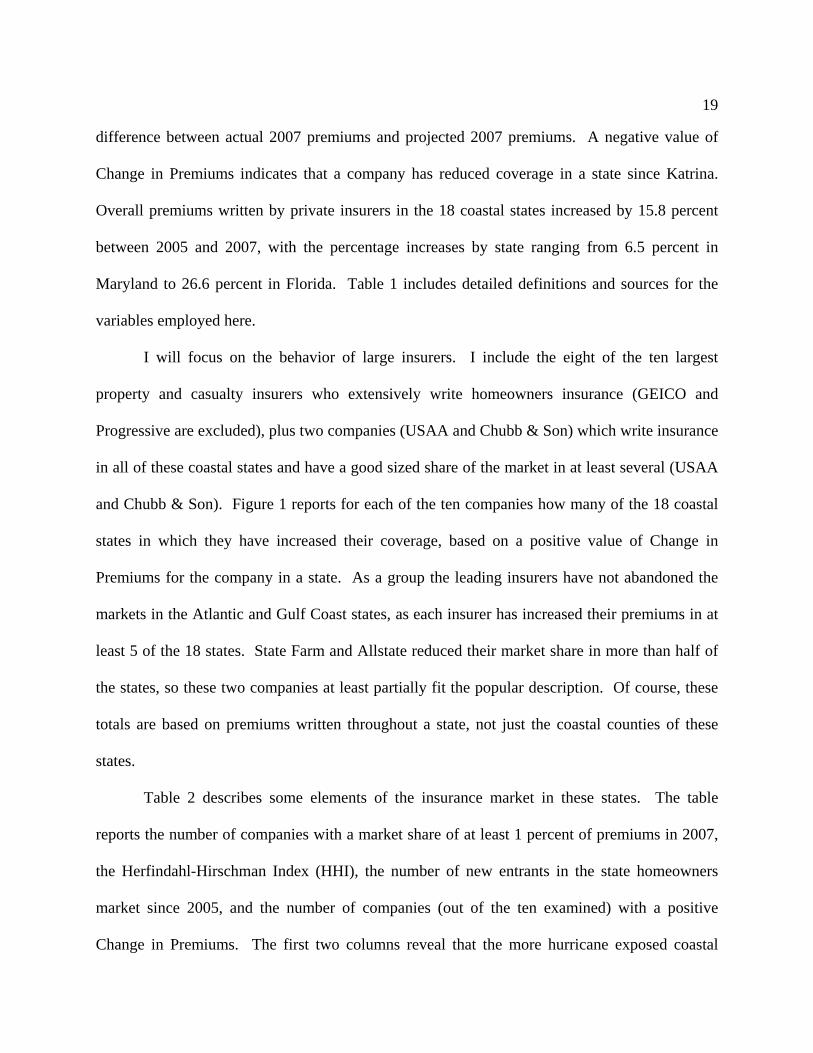
I will focus on the behavior of large insurers. I include the eight of the ten largest
property and casualty insurers who extensively write homeowners insurance (GEICO and
Progressive are excluded), plus two companies (USAA and Chubb & Son) which write insurance
in all of these coastal states and have a good sized share of the market in at least several (USAA
and Chubb & Son). Figure 1 reports for each of the ten companies how many of the 18 coastal
states in which they have increased their coverage, based on a positive value of Change in
Premiums for the company in a state. As a group the leading insurers have not abandoned the
markets in the Atlantic and Gulf Coast states, as each insurer has increased their premiums in at
least 5 of the 18 states. State Farm and Allstate reduced their market share in more than half of
the states, so these two companies at least partially fit the popular description. Of course, these
totals are based on premiums written throughout a state, not just the coastal counties of these
states.
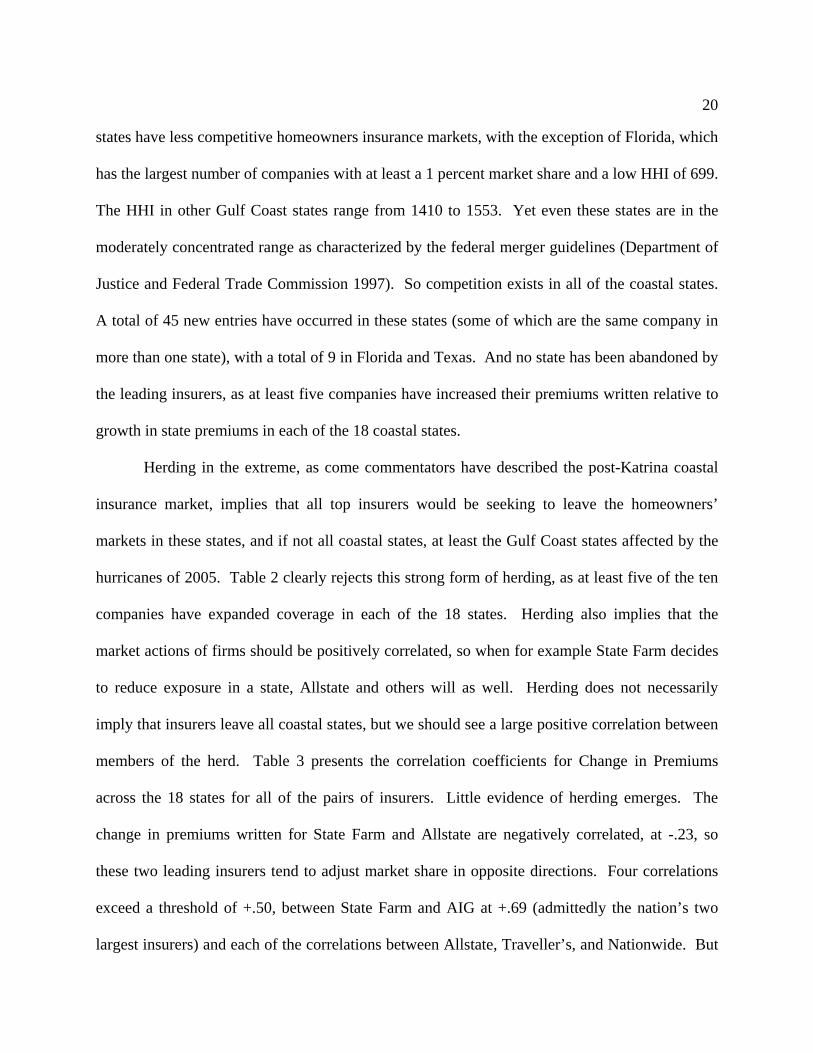
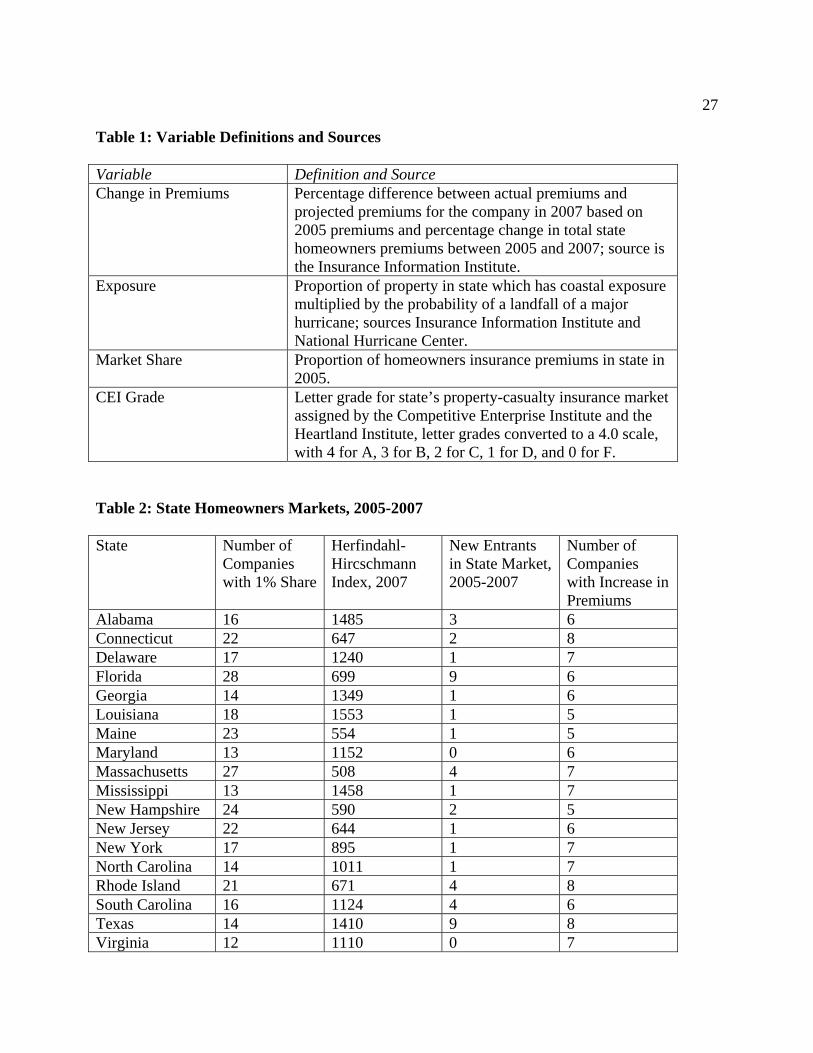
Table 2 describes some elements of the insurance market in these states. The table
reports the number of companies with a market share of at least 1 percent of premiums in 2007,
the Herfindahl-Hirschman Index (HHI), the number of new entrants in the state homeowners
market since 2005, and the number of companies (out of the ten examined) with a positive
Change in Premiums. The first two columns reveal that the more hurricane exposed coastal
20
states have less competitive homeowners insurance markets, with the exception of Florida, which
has the largest number of companies with at least a 1 percent market share and a low HHI of 699.
The HHI in other Gulf Coast states range from 1410 to 1553. Yet even these states are in the
moderately concentrated range as characterized by the federal merger guidelines (Department of
Justice and Federal Trade Commission 1997). So competition exists in all of the coastal states.
A total of 45 new entries have occurred in these states (some of which are the same company in
more than one state), with a total of 9 in Florida and Texas. And no state has been abandoned by
the leading insurers, as at least five companies have increased their premiums written relative to
growth in state premiums in each of the 18 coastal states.
Herding in the extreme, as come commentators have described the post-Katrina coastal
insurance market, implies that all top insurers would be seeking to leave the homeowners’
markets in these states, and if not all coastal states, at least the Gulf Coast states affected by the
hurricanes of 2005. Table 2 clearly rejects this strong form of herding, as at least five of the ten
companies have expanded coverage in each of the 18 states. Herding also implies that the
market actions of firms should be positively correlated, so when for example State Farm decides
to reduce exposure in a state, Allstate and others will as well. Herding does not necessarily
imply that insurers leave all coastal states, but we should see a large positive correlation between
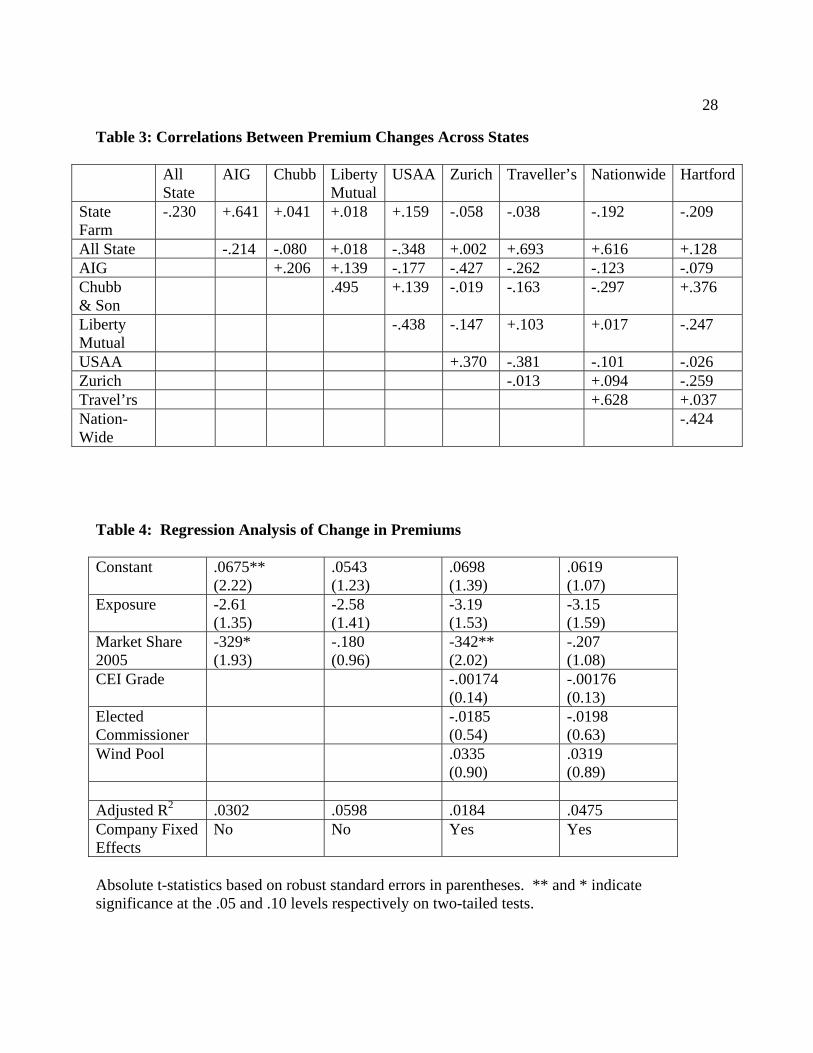
members of the herd. Table 3 presents the correlation coefficients for Change in Premiums
across the 18 states for all of the pairs of insurers. Little evidence of herding emerges. The
change in premiums written for State Farm and Allstate are negatively correlated, at -.23, so
these two leading insurers tend to adjust market share in opposite directions. Four correlations
exceed a threshold of +.50, between State Farm and AIG at +.69 (admittedly the nation’s two
largest insurers) and each of the correlations between Allstate, Traveller’s, and Nationwide. But
21
this appears to be the extent of the herd. State Farm and AIG are negatively correlated with each
of the latter three companies. Overall, only 20 and 44 correlations between pairs of companies
are positive. No clear leader of a herd is apparent, and thus market reactions seem to be largely
based on independent private information regarding firm specific effects of a changing
environment.
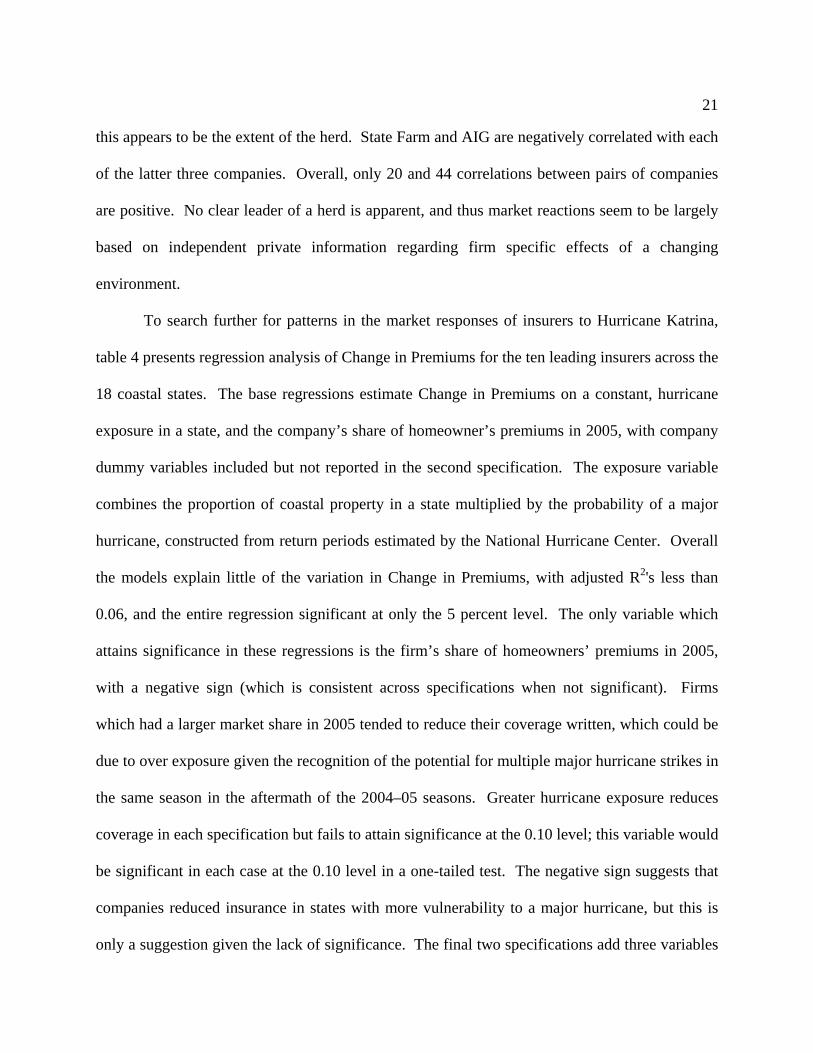
To search further for patterns in the market responses of insurers to Hurricane Katrina,
table 4 presents regression analysis of Change in Premiums for the ten leading insurers across the
18 coastal states. The base regressions estimate Change in Premiums on a constant, hurricane
exposure in a state, and the company’s share of homeowner’s premiums in 2005, with company
dummy variables included but not reported in the second specification. The exposure variable
combines the proportion of coastal property in a state multiplied by the probability of a major
hurricane, constructed from return periods estimated by the National Hurricane Center. Overall
the models explain little of the variation in Change in Premiums, with adjusted R2's less than
0.06, and the entire regression significant at only the 5 percent level. The only variable which
attains significance in these regressions is the firm’s share of homeowners’ premiums in 2005,
with a negative sign (which is consistent across specifications when not significant). Firms
which had a larger market share in 2005 tended to reduce their coverage written, which could be
due to over exposure given the recognition of the potential for multiple major hurricane strikes in
the same season in the aftermath of the 2004–05 seasons. Greater hurricane exposure reduces
coverage in each specification but fails to attain significance at the 0.10 level; this variable would
be significant in each case at the 0.10 level in a one-tailed test. The negative sign suggests that
companies reduced insurance in states with more vulnerability to a major hurricane, but this is
only a suggestion given the lack of significance. The final two specifications add three variables

22
controlling for characteristics of state insurance markets which might affect large insurers’
willingness to write coverage. The variables are the grade assigned to the state’s property-
casualty market regulatory structure by the Competitive Enterprise Institute and Heartland
Foundation (converted to a 4.0 scale with A = 4, B = 3, C = 2, D = 1, and F = 0), a dummy
variable which indicates if a state has an elected insurance commissioner in 2007, and a dummy
variable which equals one if the state has a wind pool or not.10 None of these variables approach
significance and are jointly insignificant as well.
6. Conclusion
Critics have alleged that the nation’s leading insurers are turning their backs on
hurricane-exposed coastal states, unwilling to risk high profit margins to provide coverage
needed by millions of Americans. While some of this criticism can be dismissed as populist
rhetoric, the charge can be given a basis in economic models of herding. The models show that
in some circumstances, parties will ignore their private information and follow the herd, for
several different reasons. Although crowds are generally wise, herding can inefficiently block
the revelation of information insurance companies might possess regarding the costs of writing
coverage in high-risk coastal areas. If insurance markets are prone to frequent, inefficient
herding, policy makers are wise to provide a public insurer of last resort and regulators might be
able to prevent panicked exit by insurers after a hurricane. But inefficient herding is not the only
possible explanation for a shortage of coverage in the private market in the aftermath of
10 The coastal states with elected commissioners are Delaware, Georgia, Louisiana, Mississippi, and North Carolina. Alabama, Florida, Louisiana, Mississippi, North Carolina, South Carolina, and Texas have dedicated wind pools.
23
Hurricane Katrina. Enforcing below-market premiums through regulation can easily result in a
shortage as would any price ceiling. And regulators could contribute to exit from the market
through adverse actions and the resulting policy uncertainty.
Does inefficient herding explain developments in coastal state insurance markets since
Katrina? Although a definitive test is not possible (almost any observed pattern could also
coincide with efficient exit due to higher risk or cost), major insurers have not abandoned the
homeowners’ insurance markets of coastal states. At least five out of ten leading insurers have
increased their premiums in each coastal state. Herding would imply a high positive correlation
between the change in premiums of herding insurers, yet changes in premiums between insurers
across states are basically uncorrelated. I find some evidence that insurers with especially large
market shares have tended to reduce insurance written, but a scaling back by a few over-exposed
companies does not constitute a stampede out of these markets. I have documented a number of
questionable actions by state policy makers which have either unnecessarily increased insurers’
costs and contributed to policy uncertainty, which should reduce the willingness of insurers to
write coverage for fear of regulators’ future blunders.
Many of the policy actions which undermine genuine markets for hurricane insurance
seem almost inevitable politically. The law of concentrated benefits and diffuse costs is one of
the fundamental propositions of public choice. Coastal residents benefit handsomely from
subsidized insurance and other regulatory measures, while the costs are spread out over the much
more numerous insurance policy holders or taxpayers in a state. State politicians seem inevitably
destined to use whatever discretion they possess to benefit coastal constituents, even if these
actions in the long run undermine a tenable market for hurricane insurance. Policy uncertainty
24
seems to be an inevitable consequence of time inconsistent state insurance regulation.11 If this is
so, a solution to the dilemma will be difficult. Shifting regulation to the federal government may
address the problem. One the one hand, the costs of coastal insurance subsidies and other poor
policies will be even more widely dispersed, which might worsen the problem. But federal
regulation might restrict the local discretion; members of Congress from coastal states will try to
shape regulation, but may lack discretionary control over regulatory decisions. It may be easier
to tie the hands of a federal regulator than state regulators.
11 On the political economy of insurance regulation, see Meier (1991).
25
References
Banerjee, Abhijit V. 1992. “A Simple Model of Herd Behavior.” Quarterly Journal of Economics, 107: 797-817. Bikhchandani, Sushil, David Hirshleifer, and Ivo Welch. 1992. “A Theory of Fads, Fashion, Custom, and Cultural Change as Information Cascades.” Journal of Political Economy, 100: 992-1026. Binderup, Kara D. 2006. “Significant Insurance Litigation Post-Hurricane Katrina.” Journal of Insurance Regulation, 26: 109-115. Born, Patricia, and W. Kip Viscusi. 2006. “The Catastrophic Effects of Natural Disasters on Insurance Markets.” Journal of Risk and Uncertainty, 33(1-2): 55.72. Carden, William A. 2009. “Sound and Fury: Rhetoric and Rebound after Katrina.” Journal of Business Valuation and Economic Loss Analysis, Volume 4, Issue 2, Article 2. Chamlee-Wright, Emily. 2007. “The Long Road Back: Signal Noise in the Post Katrina Context.” The Independent Review, 12(2): 235-259. Emanuel, Kerry. 2005. “Increasing Destructiveness of Tropical Cyclones over the Past 30 Years.” Nature, 4 August 2005, pp. 686-88. Emanuel, Kerry. 2008. “The Hurricane-Climate Connection.” Bulletin of the American Meteorological Society, 89(5): ES10-ES20. Fronstin, Paul, and Alphonse Holtman. 1994. “The Determinants of Residential Property Damage Cause by Hurricane Andrew.” Southern Economic Journal, 61:387-397. Grace, Martin F., Robert W. Klein, and Zhiyong Liu. 2006. “Increased Hurricane Risk and Insurance Market Responses.” Journal of Insurance Regulation, 26: 3-32. Higgs, Robert. 1997. “Regime Uncertainty: Why the Great Depression Lasted So Long and Why Prosperity Returned After the War.” The Independent Review, 1(4): 561-590. Klotzbach, Philip J. 2006. “Trends in Global Tropical Cyclone Activity over the Past Twenty Years (1986-2005).” Geophysical Research Letters, 33: 805-808. Klotzbach, Philip J., and William M. Gray. 2006. “Causes of the Unusually Destructive 2004 Atlantic Basin Hurricane Season.” Bulletin of the American Meteorological Society, 87(10): 1325-1333. Kunreuther, Howard. 1998. “Insurability Conditions and the Supply of Coverage.” In Paying the Price, edited by H. Kunreuther and R. J. Roth, pp.17-50. Washington DC: Joseph Henry
26
Press. Kunreuther, Howard, Jacqueline Meszaros, Robin M. Hogarth, and Mark Spranca. 1995. “Ambiguity and Underwriter Decision Processes.” Journal of Economic Behavior and Organization, 26: 337-352. Lecomte, Eugene, and Karen Gahagan. 1998. “Hurricane Insurance Protection in Florida,” in Paying the Price, edited by H. Kunreuther and R. J. Roth, pp.97-123. Washington DC: Joseph Henry Press. Meier, Kenneth J. 1991. “The Politics of Insurance Regulation.” Journal of Risk and Insurance, 58(4): 700-713. Mileti, Dennis S. 1999. Disasters by Design. Washington DC: Joseph Henry Press. Peacock, Bill. 2008. “Unintended Consequences: Regulation of Policy Forms and the Mold Crisis.” Texas Public Policy Foundation Policy Brief, October, Available at: http://www.texaspolicy.com/pdf/2008-10-PB10-moldcrisis-bp.pdf Pielke Jr., R. A., C. Landsea, M. Mayfield, J. Laver, R. Pasch. 2005. “Hurricanes and Global Warming.” Bulletin of American Meteorological Society, 86(11): 571-75. Pompe, Jeffrey J., and James R. Rinehart. 2008. “Property Insurance for Coastal Residents: Government’s ‘Ill-Wind.’” The Independent Review, 13(2): 189-207. Scharfstein, David S., and Jeremy C. Stein. 1990. “Herd Behavior and Investment.” American Economic Review, 80: 465-479. Skarbek, David. 2008. “Occupation Licensing and Asymmetric Information: Post-Hurricane Evidence from Florida.” Cato Journal, 28(1): 73-82. Taylor, Gene. 2008. “Federal Insurance Reform after Katrina.” Mississippi Law Journal, 77: 783-793. Webster, P. J., G. J. Holland, J. A. Curry, and H. R. Change. 2005. “Changes in Tropical Cyclone Number, Duration, and Intensity in a Warming Environment.” Science, 309: 1844-46.
27
Table 1: Variable Definitions and Sources Variable Definition and Source Change in Premiums Percentage difference between actual premiums and
projected premiums for the company in 2007 based on 2005 premiums and percentage change in total state homeowners premiums between 2005 and 2007; source is the Insurance Information Institute.
Exposure Proportion of property in state which has coastal exposure multiplied by the probability of a landfall of a major hurricane; sources Insurance Information Institute and National Hurricane Center.
Market Share Proportion of homeowners insurance premiums in state in 2005.
CEI Grade Letter grade for state’s property-casualty insurance market assigned by the Competitive Enterprise Institute and the Heartland Institute, letter grades converted to a 4.0 scale, with 4 for A, 3 for B, 2 for C, 1 for D, and 0 for F.
Table 2: State Homeowners Markets, 2005-2007 State Number of
Companies with 1% Share
Herfindahl-Hircschmann Index, 2007
New Entrants in State Market, 2005-2007
Number of Companies with Increase in Premiums
Alabama 16 1485 3 6 Connecticut 22 647 2 8 Delaware 17 1240 1 7 Florida 28 699 9 6 Georgia 14 1349 1 6 Louisiana 18 1553 1 5 Maine 23 554 1 5 Maryland 13 1152 0 6 Massachusetts 27 508 4 7 Mississippi 13 1458 1 7 New Hampshire 24 590 2 5 New Jersey 22 644 1 6 New York 17 895 1 7 North Carolina 14 1011 1 7 Rhode Island 21 671 4 8 South Carolina 16 1124 4 6 Texas 14 1410 9 8 Virginia 12 1110 0 7
28
Table 3: Correlations Between Premium Changes Across States
All State
AIG Chubb LibertyMutual
USAA Zurich Traveller’s Nationwide Hartford
State Farm
-.230 +.641 +.041 +.018 +.159 -.058 -.038 -.192 -.209
All State -.214 -.080 +.018 -.348 +.002 +.693 +.616 +.128 AIG +.206 +.139 -.177 -.427 -.262 -.123 -.079 Chubb & Son
.495 +.139 -.019 -.163 -.297 +.376
Liberty Mutual
-.438 -.147 +.103 +.017 -.247
USAA +.370 -.381 -.101 -.026 Zurich -.013 +.094 -.259 Travel’rs +.628 +.037 Nation- Wide
-.424
Table 4: Regression Analysis of Change in Premiums Constant .0675**
(2.22) .0543 (1.23)
.0698 (1.39)
.0619 (1.07)
Exposure -2.61 (1.35)
-2.58 (1.41)
-3.19 (1.53)
-3.15 (1.59)
Market Share 2005
-329* (1.93)
-.180 (0.96)
-342** (2.02)
-.207 (1.08)
CEI Grade -.00174 (0.14)
-.00176 (0.13)
Elected Commissioner
-.0185 (0.54)
-.0198 (0.63)
Wind Pool .0335 (0.90)
.0319 (0.89)
Adjusted R2 .0302 .0598 .0184 .0475 Company Fixed Effects
No No Yes Yes
Absolute t-statistics based on robust standard errors in parentheses. ** and * indicate significance at the .05 and .10 levels respectively on two-tailed tests.
29
Figure 1: Wind Pool Exposure Growth in Texas
0
10
20
30
40
50
60
70
2001 2002 2003 2004 2005 2006 2007 2008
Bill
ions
of D
olla
rs
Liability
Figure 2: Wind Pool Exposure Growth in North Carolina
0
20
40
60
80
100
120
140
160
180
200
2003 2004 2005 2006 2007 2008
PoliciesExposure