Embed Size (px)
Citation preview
Insurance Market Trend 2020
สมาคมประกนวนาศภยไทยThai General Insurance Association
22nd November, 2019
Aetas Lumpini Hotel - Bangkok
กเดช อนนตศรประภาKheedhej Anansiriprapha
ผอ านวยการบรหารExecutive Director
สมาคมประกนวนาศภย
6 เม.ย.2510
บรษทประกนภยไทย
สมาคมประกนวนาศภย
6 เม.ย.2510
บรษทประกนภยไทย
สมาคมประกนวนาศภย
6 เม.ย.2510
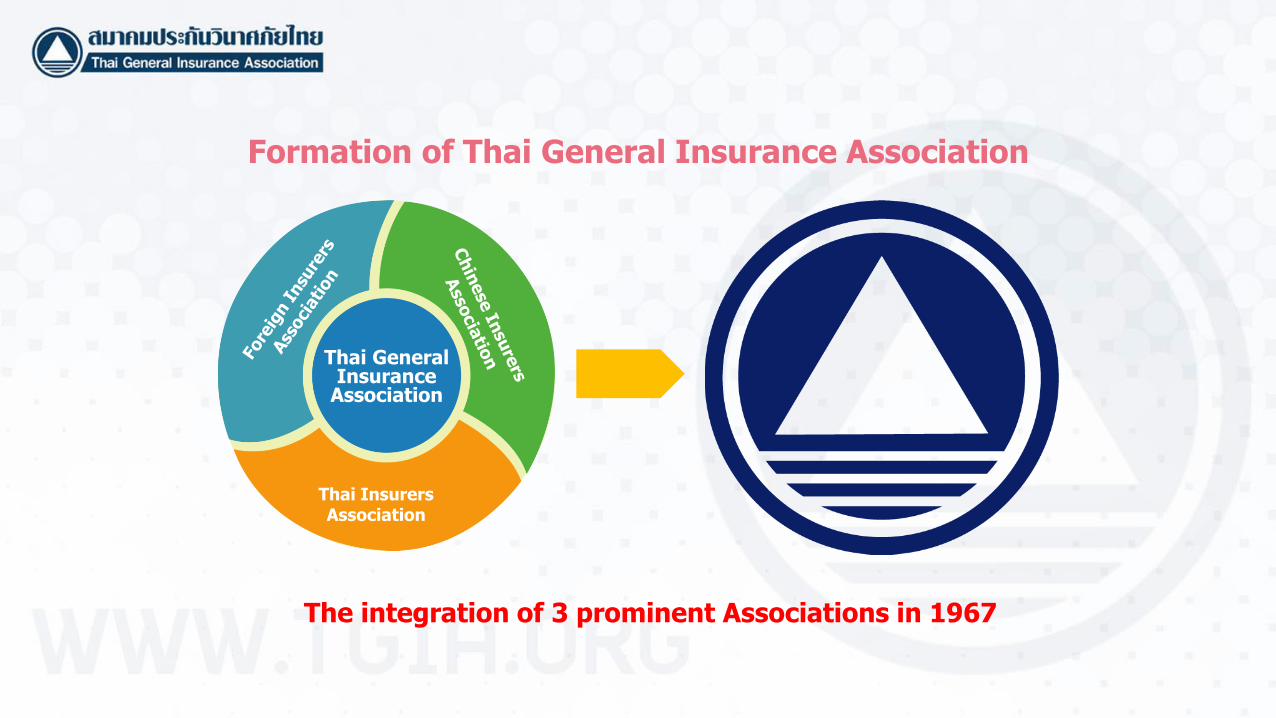
Thai InsurersAssociation
Thai General Insurance
Association
Formation of Thai General Insurance Association
The integration of 3 prominent Associations in 1967
2
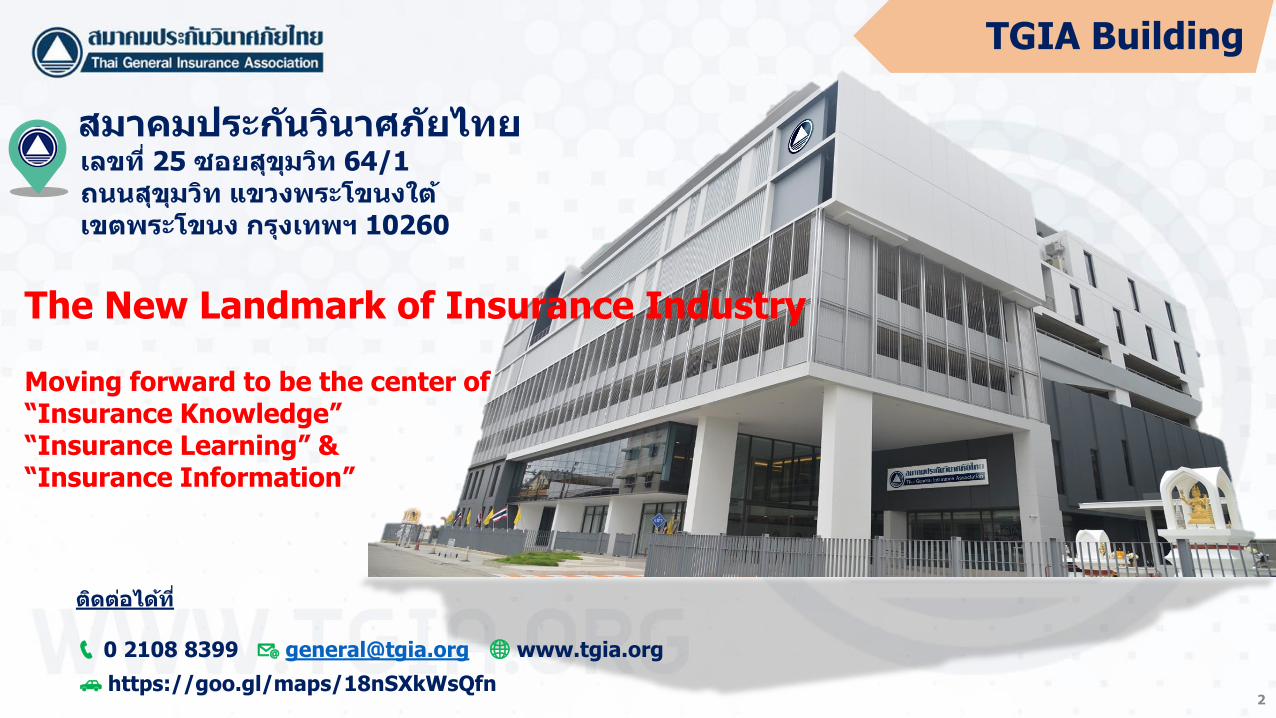
TGIA Building
ตดตอไดท
📞 0 2108 8399 📧 [email protected] 🌐 www.tgia.org
🚗 https://goo.gl/maps/18nSXkWsQfn
เลขท 25 ซอยสขมวท 64/1 ถนนสขมวท แขวงพระโขนงใต เขตพระโขนง กรงเทพฯ 10260
สมาคมประกนวนาศภยไทย
The New Landmark of Insurance Industry
Moving forward to be the center of “Insurance Knowledge” “Insurance Learning” & “Insurance Information”

3
ช น 3-4 พนทจอดรถยนต จ านวน 109 คนช น 1 ดานหลง จอดรถจกรยานยนต จ านวน 50 คน
TGIA Building
4
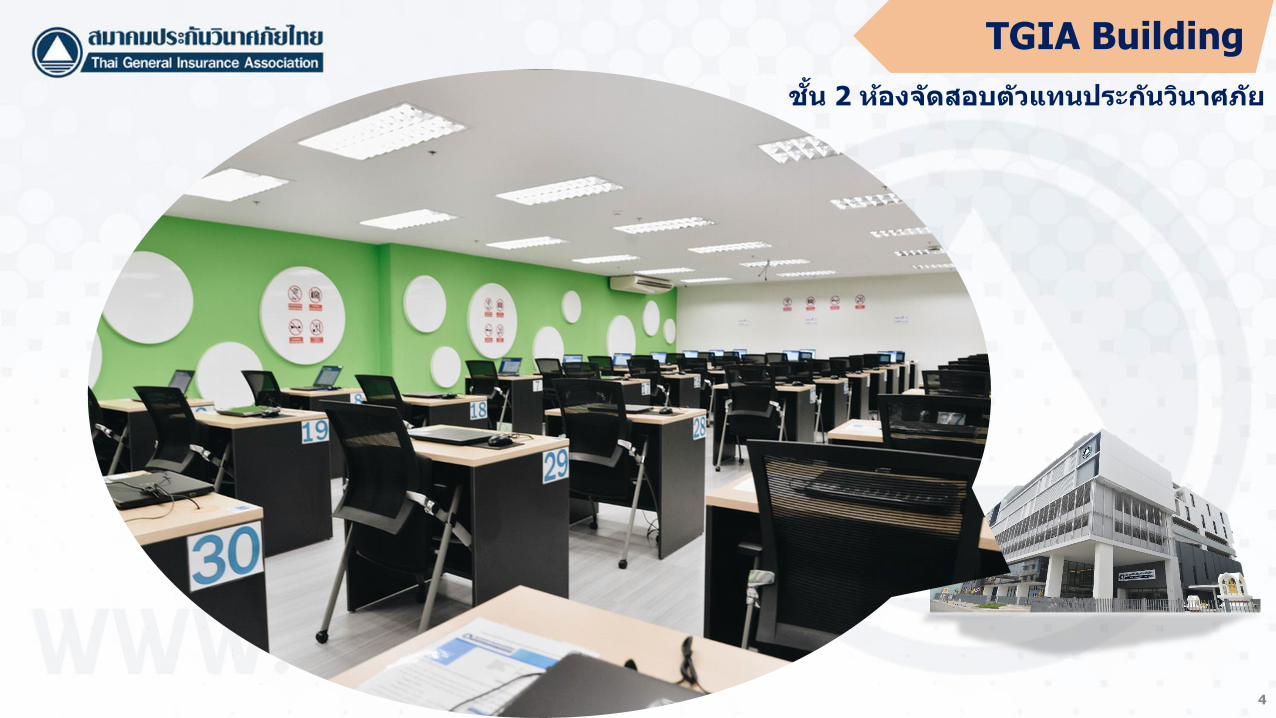
ช น 2 หองจดสอบตวแทนประกนวนาศภย
TGIA Building
5
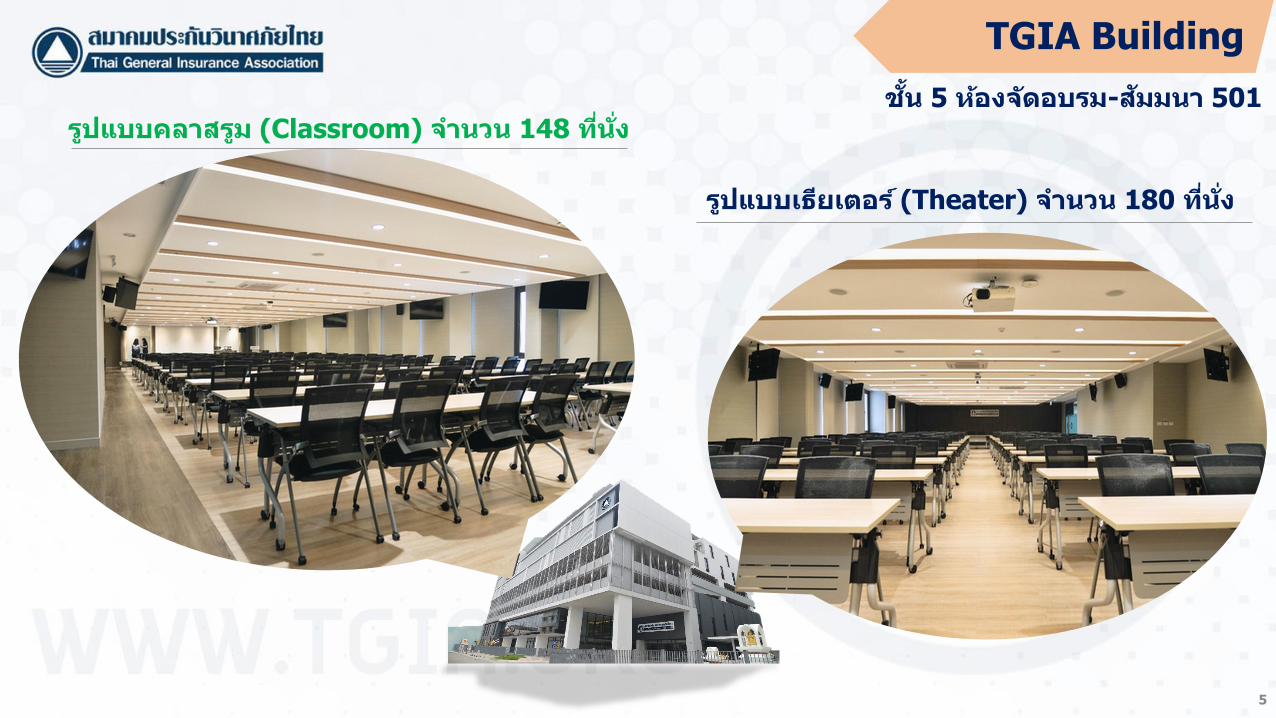
ช น 5 หองจดอบรม-สมมนา 501 รปแบบคลาสรม (Classroom) จ านวน 148 ทน ง
รปแบบเธยเตอร (Theater) จ านวน 180 ทน ง
TGIA Building
6
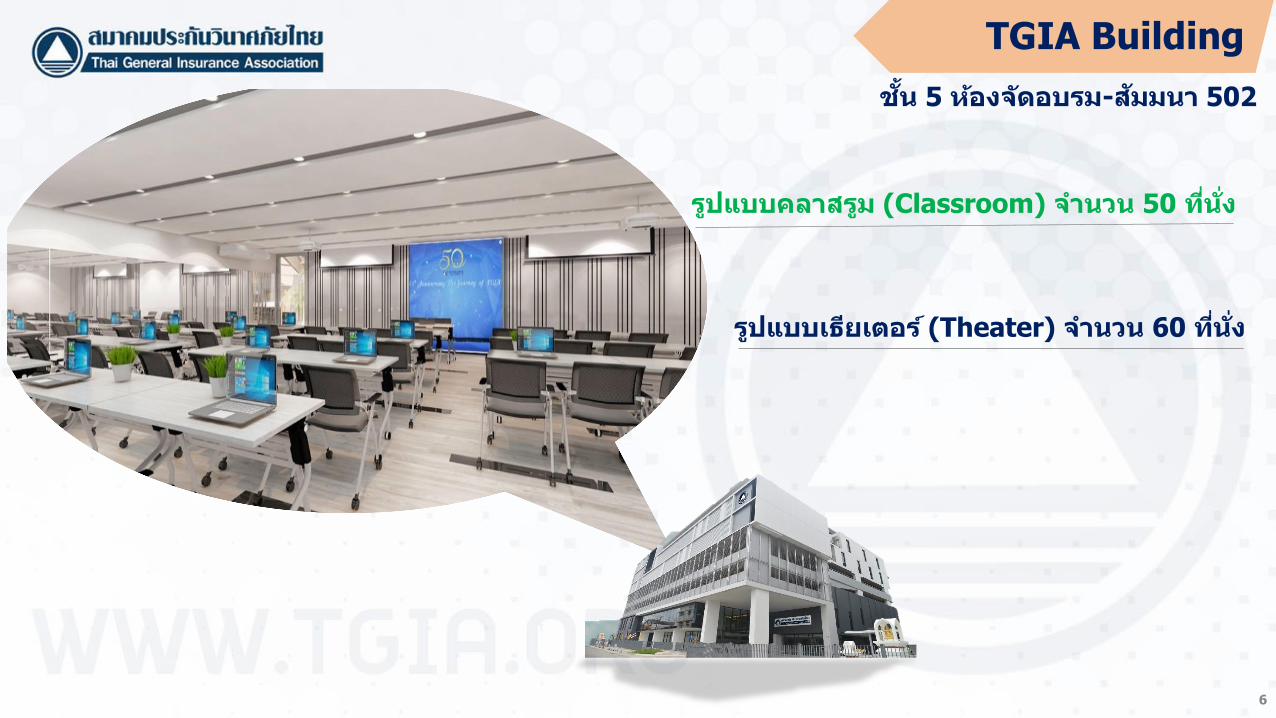
ช น 5 หองจดอบรม-สมมนา 502
รปแบบคลาสรม (Classroom) จ านวน 50 ทน ง
รปแบบเธยเตอร (Theater) จ านวน 60 ทน ง
TGIA Building
7
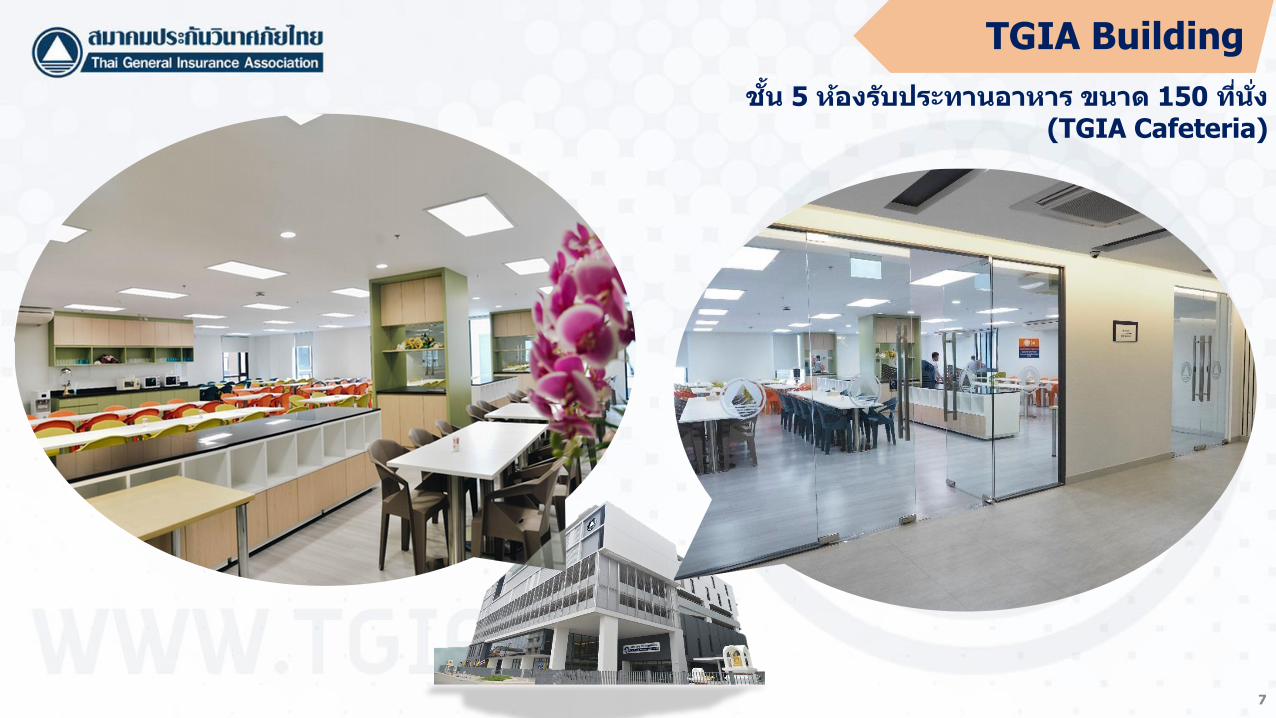
ช น 5 หองรบประทานอาหาร ขนาด 150 ทน ง (TGIA Cafeteria)
TGIA Building
8
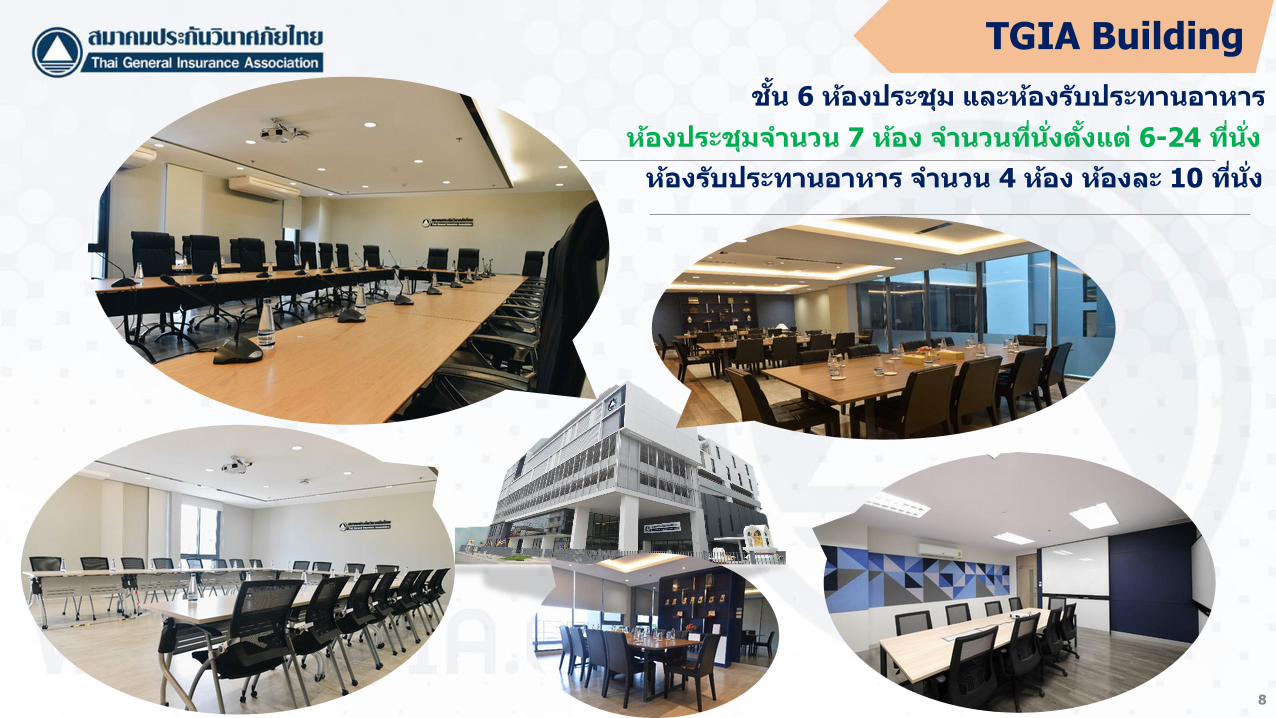
หองประชมจ านวน 7 หอง จ านวนทน งต งแต 6-24 ทน ง
หองรบประทานอาหาร จ านวน 4 หอง หองละ 10 ทน ง
ช น 6 หองประชม และหองรบประทานอาหาร
TGIA Building
9
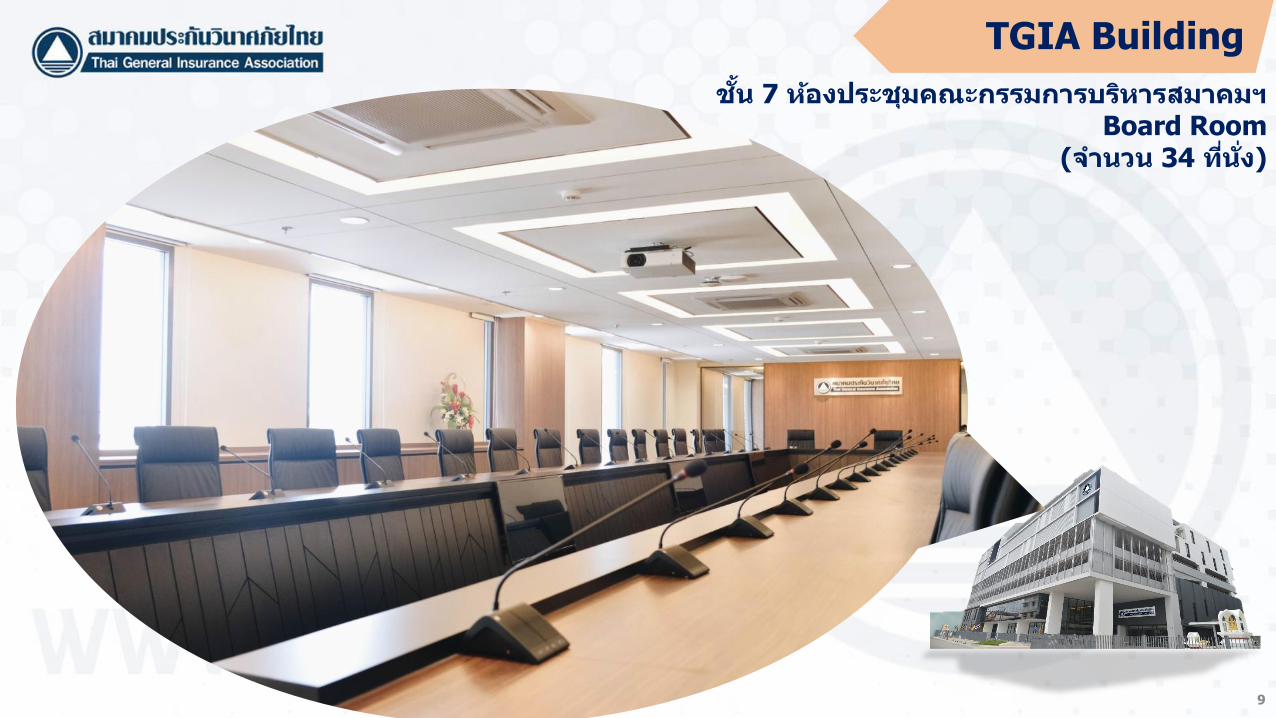
ช น 7 หองประชมคณะกรรมการบรหารสมาคมฯBoard Room
(จ านวน 34 ทน ง)
TGIA Building

“เปนองคกรทสงเสรมและสนบสนนใหธรกจประกนวนาศภยเปนเสาหลกของระบบเศรษฐกจและสงคมของประเทศ”
วสยทศน (Vision)
พนธกจท 1(Mission 1)
พนธกจท 2(Mission 2)
พนธกจท 3(Mission 3)
พนธกจท 4(Mission 4)
ประชาชน1.1 สรางและยกระดบความตระหนกรและความเขาใจในการน าการประกนวนาศภยมาเปนเครองมอในการบรหารความเสยง และสงเสรมสนบสนนใหประกนวนาศภยเปนปจจยท 5 ในการด ารงชวตของประชาชน
1.2 สรางความเชอมนและการเปนทยอมรบของธรกจประกนวนาศภยไทย
1.3 ด าเนนมาตรการเชงรกในการขบเคลอนการปองกนและลดอบตเหตบนทองถนน เพอลดการสญเสยของชวต รางกายและทรพยสน
หนวยงานภาครฐและหนวยงานอนๆ ทเกยวของ
2.1 ยกระดบและเพมบทบาทของธรกจประกนวนาศภยไทยในการเปนผบรหารความเสยงมออาชพใหกบภาครฐ
2.2 ประสานงาน เจรจา และขยายความรวมมอกบภาครฐและหนวยงานอนๆ ทเกยวของ
หนวยงานก ากบดแล3.1 ขยายความรวมมอ
เพมการประสานงานและเสรมสรางความสมพนธอนดกบหนวยงานก ากบดแล
3.2 สงเสรมใหธรกจควบคมดแลกนเอง
บรษทสมาชก4.1 พฒนาคณภาพและมาตรฐานการด าเนนงานอยางมจรรยาบรรณ
4.2 สงเสรมและพฒนาทนมนษย รวมถงการวจยและพฒนาเพอรองรบและตอบสนองตอการเปลยนแปลงในการด าเนนธรกจและการด าเนนชวตในยคดจทล
4.3 เพมศกยภาพและประสทธภาพในการด าเนนธรกจของบรษทประกนภยในทกขนาด (เลก-กลาง-ใหญ)
4.4 สงเสรมความรวมมอ ความสามคค และการแลกเปลยนความคดเหนระหวางบรษทสมาชก
เปาประสงค (Objective): “ธรกจประกนวนาศภยมการเตบโตอยางตอเนองและย งยน”
TGIA Strategic Vision and Mission
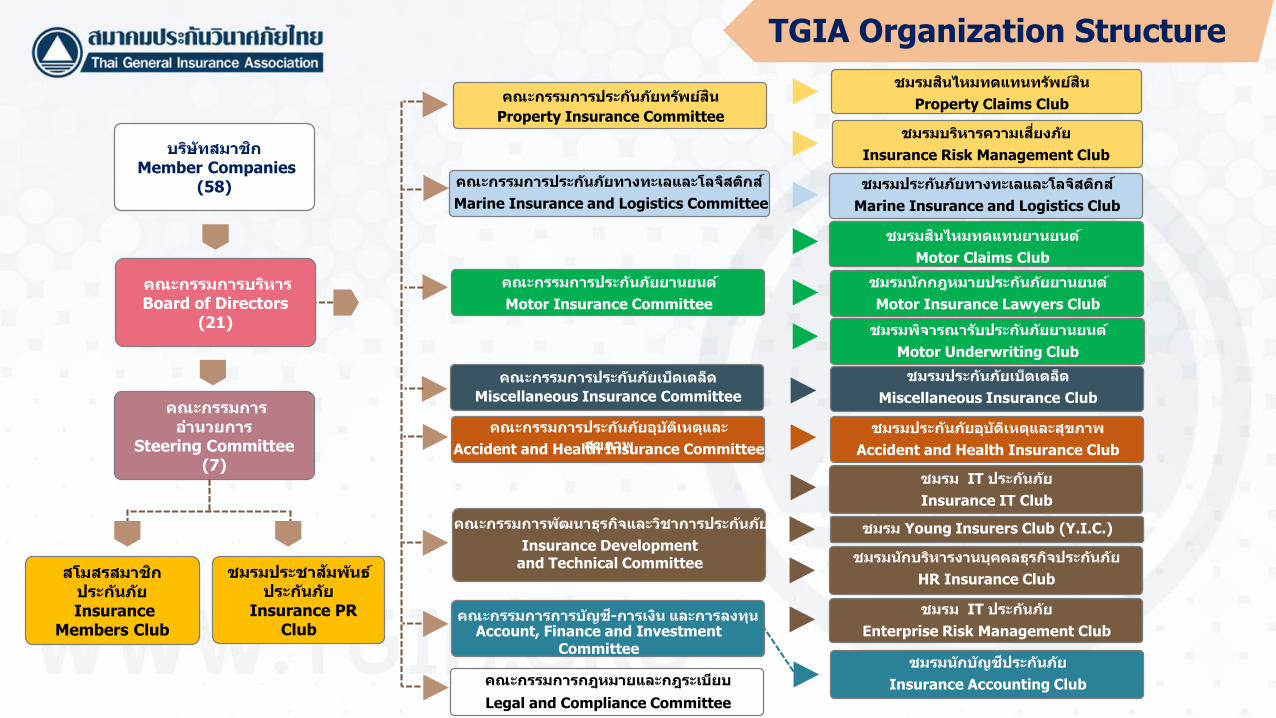
บรษทสมาชกMember Companies
(58)
คณะกรรมการบรหารBoard of Directors
(21)
คณะกรรมการอ านวยการ
Steering Committee(7)
สโมสรสมาชกประกนภยInsurance
Members Club
ชมรมประชาสมพนธประกนภย
Insurance PR Club
คณะกรรมการประกนภยทรพยสน
Property Insurance Committee
ชมรมสนไหมทดแทนทรพยสน
Property Claims Club
ชมรมบรหารความเสยงภย
Insurance Risk Management Club
คณะกรรมการประกนภยทางทะเลและโลจสตกส
Marine Insurance and Logistics Committee
ชมรมประกนภยทางทะเลและโลจสตกส
Marine Insurance and Logistics Club
คณะกรรมการประกนภยยานยนต
Motor Insurance Committee
ชมรมสนไหมทดแทนยานยนต
Motor Claims Club
ชมรมนกกฎหมายประกนภยยานยนต
Motor Insurance Lawyers Club
ชมรมพจารณารบประกนภยยานยนต
Motor Underwriting Club
คณะกรรมการประกนภยเบดเตลด
Miscellaneous Insurance Committee
ชมรมประกนภยเบดเตลด
Miscellaneous Insurance Club
คณะกรรมการประกนภยอบตเหตและสขภาพAccident and Health Insurance Committee
ชมรมประกนภยอบตเหตและสขภาพ
Accident and Health Insurance Club
คณะกรรมการพฒนาธรกจและวชาการประกนภย
Insurance Development and Technical Committee
ชมรม IT ประกนภย
Insurance IT Club
ชมรม Young Insurers Club (Y.I.C.)
ชมรมนกบรหารงานบคคลธรกจประกนภย
HR Insurance Club
ชมรม IT ประกนภย
Enterprise Risk Management Clubคณะกรรมการการบญช-การเงน และการลงทน
Account, Finance and Investment Committee
ชมรมนกบญชประกนภย
Insurance Accounting Clubคณะกรรมการกฎหมายและกฎระเบยบ
Legal and Compliance Committee
TGIA Organization Structure
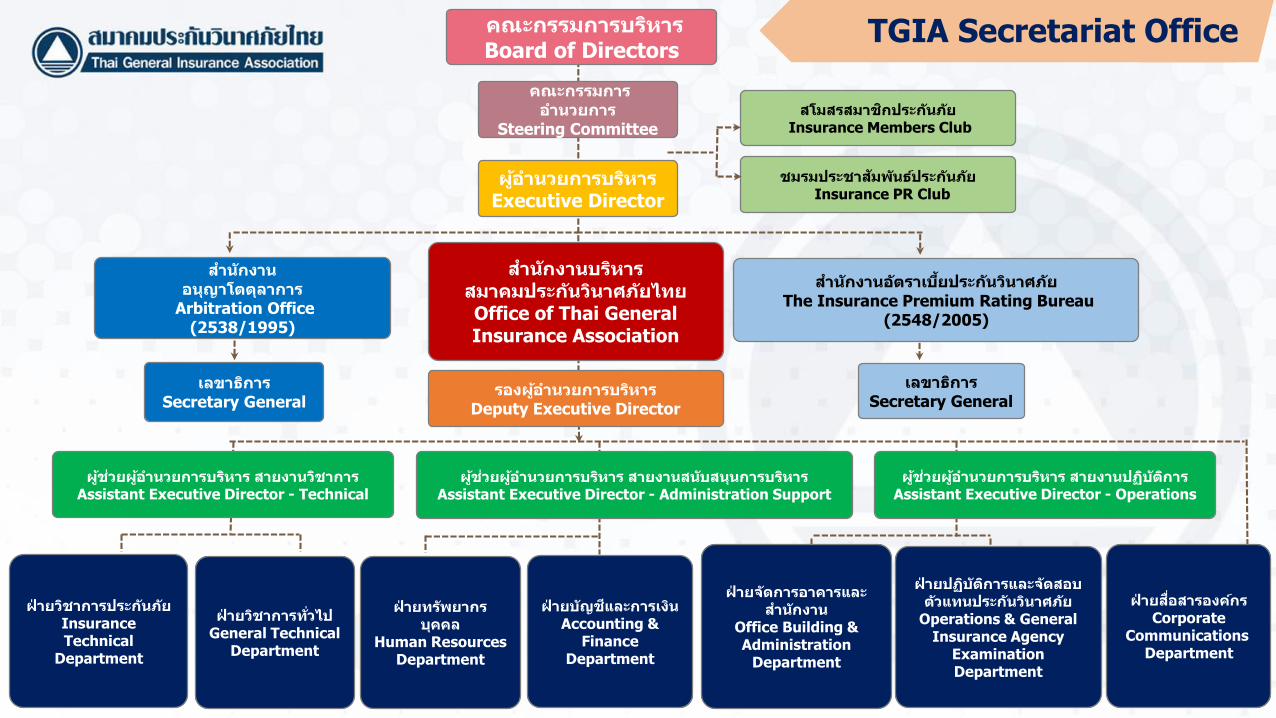
คณะกรรมการบรหารBoard of Directors
คณะกรรมการอ านวยการ
Steering Committee
ผอ านวยการบรหารExecutive Director
สโมสรสมาชกประกนภยInsurance Members Club
ชมรมประชาสมพนธประกนภยInsurance PR Club
ส านกงานอนญาโตตลาการ
Arbitration Office(2538/1995)
เลขาธการSecretary General
ส านกงานบรหาร สมาคมประกนวนาศภยไทยOffice of Thai General Insurance Association
ส านกงานอตราเบยประกนวนาศภยThe Insurance Premium Rating Bureau
(2548/2005)
เลขาธการSecretary General
ผชวยผอ านวยการบรหาร สายงานวชาการAssistant Executive Director - Technical
ผชวยผอ านวยการบรหาร สายงานสนบสนนการบรหารAssistant Executive Director - Administration Support
ฝายวชาการประกนภยInsurance Technical
Department
ฝายวชาการท วไปGeneral Technical
Department
ฝายทรพยากรบคคล
Human Resources Department
ฝายบญชและการเงนAccounting &
FinanceDepartment
ฝายสอสารองคกรCorporate
CommunicationsDepartment
รองผอ านวยการบรหารDeputy Executive Director
ผชวยผอ านวยการบรหาร สายงานปฏบตการAssistant Executive Director - Operations
ฝายจดการอาคารและส านกงาน
Office Building & Administration
Department
ฝายปฏบตการและจดสอบตวแทนประกนวนาศภย
Operations & General Insurance Agency
Examination Department
TGIA Secretariat Office
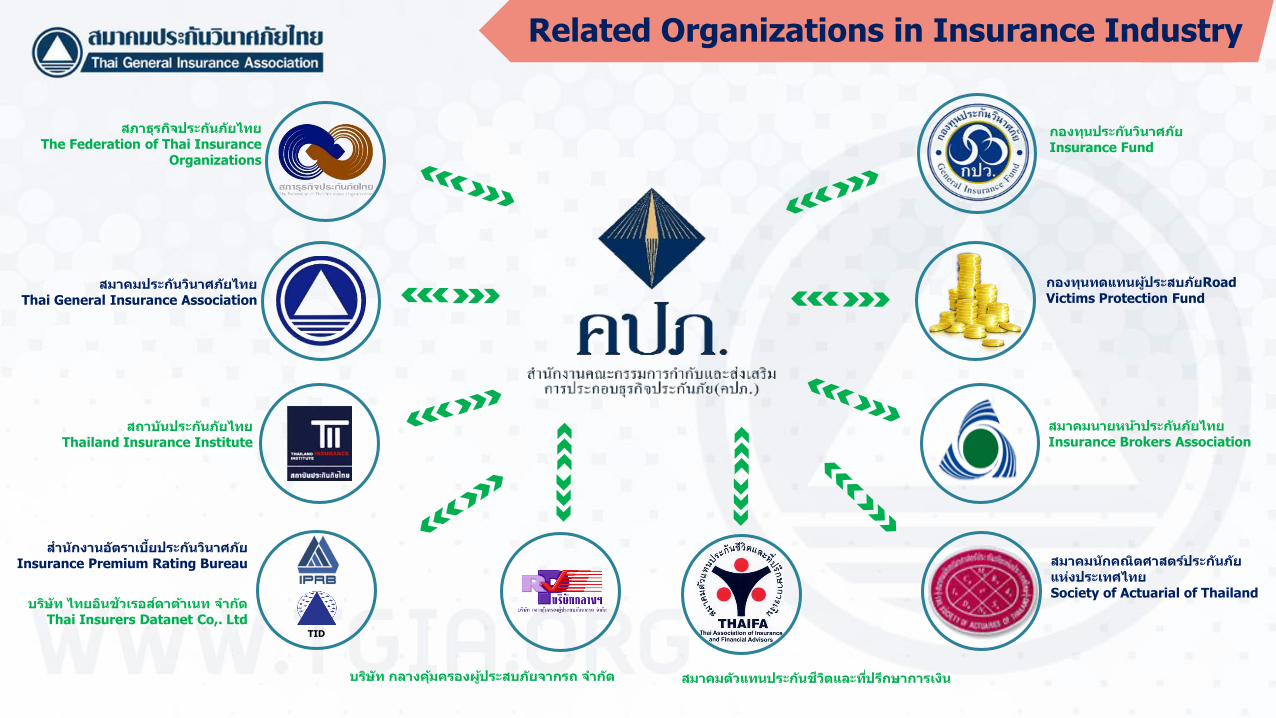
สภาธรกจประกนภยไทยThe Federation of Thai Insurance
Organizations
สมาคมประกนวนาศภยไทยThai General Insurance Association
สถาบนประกนภยไทยThailand Insurance Institute
บรษท กลางคมครองผประสบภยจากรถ จ ากด สมาคมตวแทนประกนชวตและทปรกษาการเงน
สมาคมนกคณตศาสตรประกนภยแหงประเทศไทยSociety of Actuarial of Thailand
สมาคมนายหนาประกนภยไทยInsurance Brokers Association
กองทนทดแทนผประสบภยRoad Victims Protection Fund
กองทนประกนวนาศภยInsurance Fund
TID
ส านกงานอตราเบยประกนวนาศภยInsurance Premium Rating Bureau
บรษท ไทยอนชวเรอสดาตาเนท จ ากดThai Insurers Datanet Co,. Ltd
Related Organizations in Insurance Industry

Type of Business Local Company Foreign Branch Total
Non-Life Insurance 48 5 53
Health Insurance 4 0 4
Reinsurer 1 0 1
Total 58
Members of Thai General Insurance Association (TGIA)
Local Incorporated Direct Companies : 52 Foreign Branches : 5 Professional Reinsurer : 1 Total : 58
Number of Insurance Companies in Thailand(As at 31st October, 2019)
15
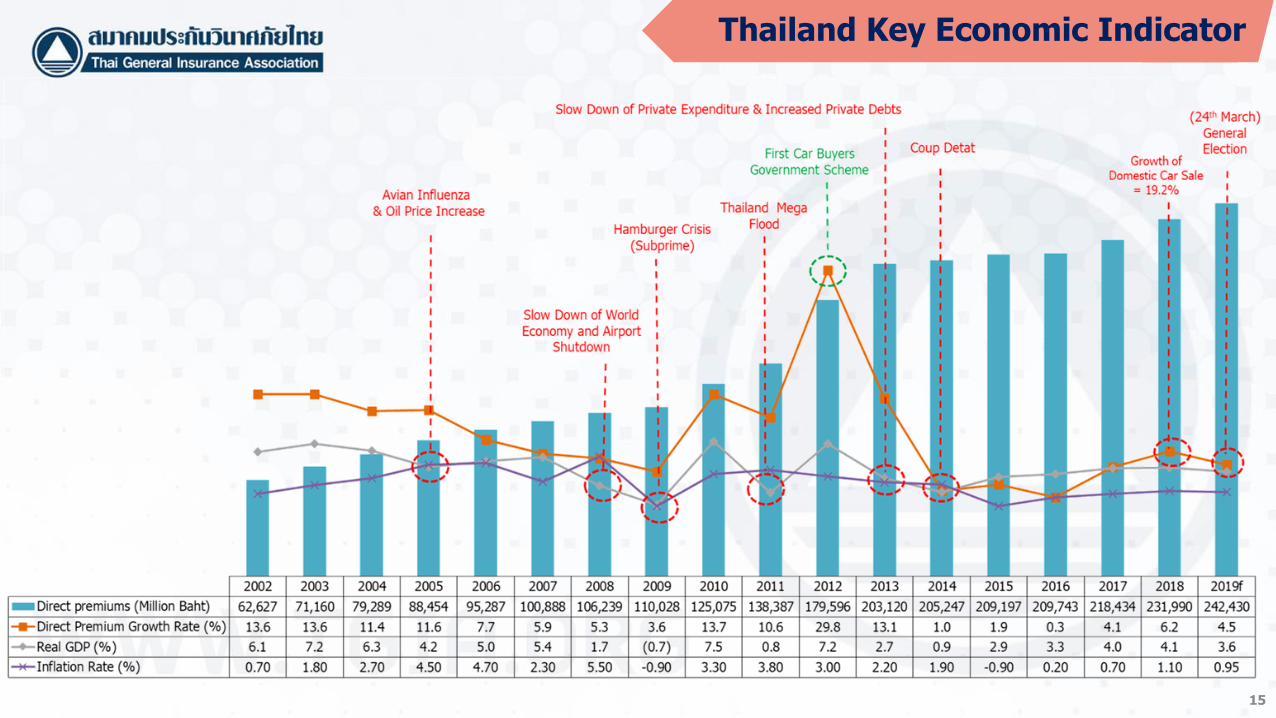
Thailand Key Economic Indicator
16
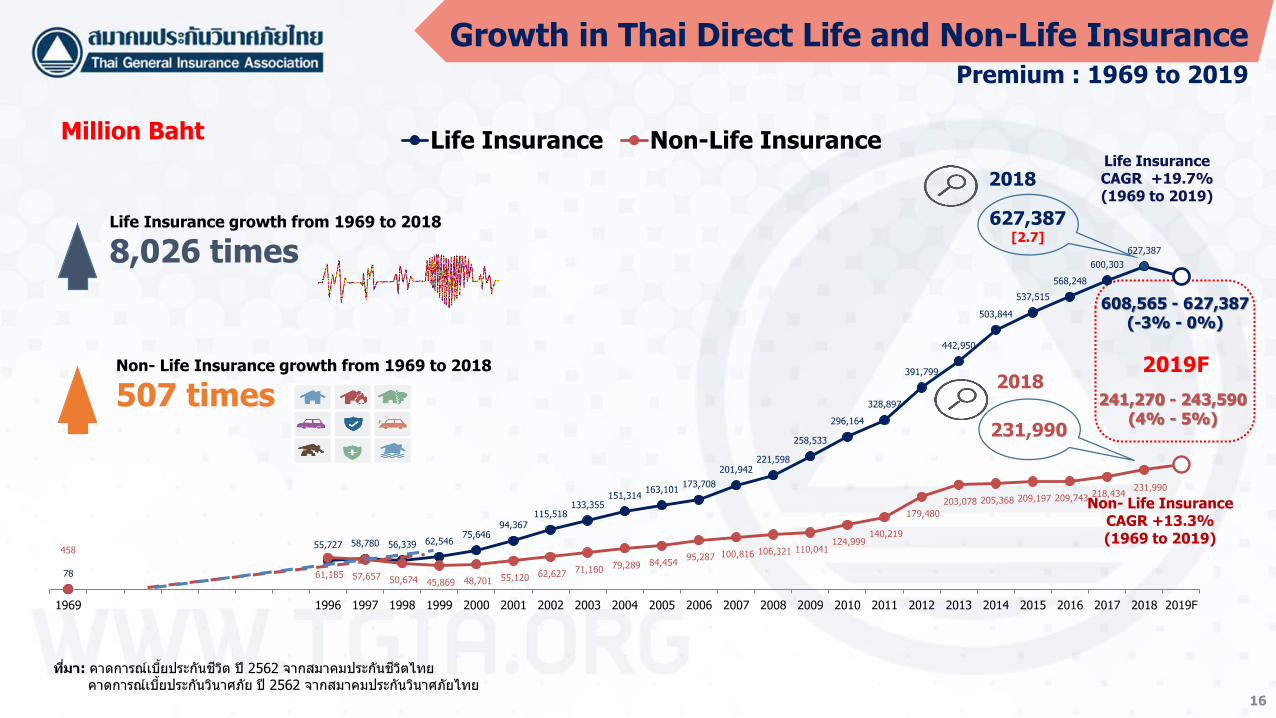
ทมา: คาดการณเบยประกนชวต ป 2562 จากสมาคมประกนชวตไทยคาดการณเบยประกนวนาศภย ป 2562 จากสมาคมประกนวนาศภยไทย
Life Insurance growth from 1969 to 2018
8,026 times
Non- Life Insurance growth from 1969 to 2018
507 times
627,387[2.7]
2018
231,990
2018
Growth in Thai Direct Life and Non-Life Insurance Premium : 1969 to 2019
2019F
608,565 - 627,387(-3% - 0%)
241,270 - 243,590(4% - 5%)
78
55,727 58,780 56,339 62,54675,646
94,367115,518
133,355151,314
163,101173,708
201,942221,598
258,533
296,164
328,897
391,799
442,950
503,844
537,515
568,248
600,303
627,387
458
61,185 57,657 50,674 45,869 48,701 55,120 62,627 71,160 79,289 84,454 95,287 100,816 106,321 110,041
124,999 140,219
179,480
203,078 205,368 209,197 209,743 218,434 231,990
1969 1996 1997 1998 1999 2000 2001 2002 2003 2004 2005 2006 2007 2008 2009 2010 2011 2012 2013 2014 2015 2016 2017 2018 2019F
Million Baht Life Insurance Non-Life InsuranceLife InsuranceCAGR +19.7%(1969 to 2019)
Non- Life InsuranceCAGR +13.3%(1969 to 2019)
Source: Office of Insurance CommissionNational Economic and Social Development Board of Thailand
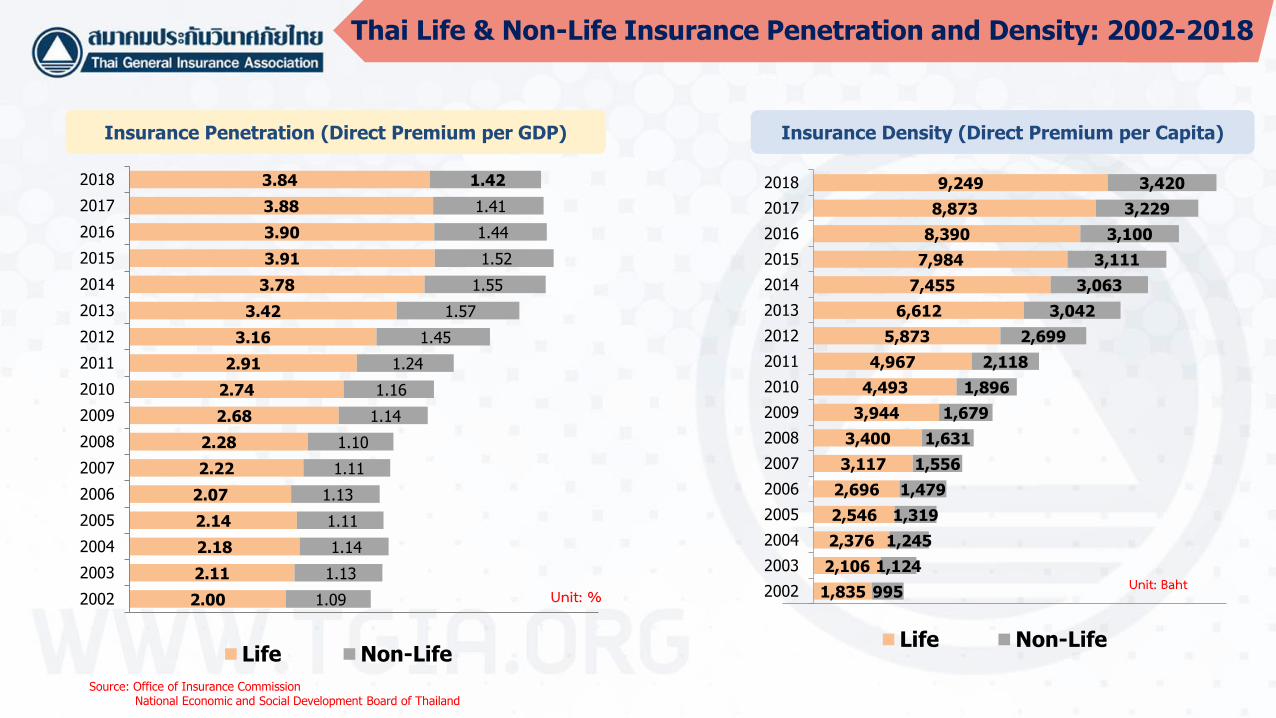
2.00
2.11
2.18
2.14
2.07
2.22
2.28
2.68
2.74
2.91
3.16
3.42
3.78
3.91
3.90
3.88
3.84
1.09
1.13
1.14
1.11
1.13
1.11
1.10
1.14
1.16
1.24
1.45
1.57
1.55
1.52
1.44
1.41
1.42
2002
2003
2004
2005
2006
2007
2008
2009
2010
2011
2012
2013
2014
2015
2016
2017
2018
Life Non-Life
1,835
2,106
2,376
2,546
2,696
3,117
3,400
3,944
4,493
4,967
5,873
6,612
7,455
7,984
8,390
8,873
9,249
995
1,124
1,245
1,319
1,479
1,556
1,631
1,679
1,896
2,118
2,699
3,042
3,063
3,111
3,100
3,229
3,420
2002
2003
2004
2005
2006
2007
2008
2009
2010
2011
2012
2013
2014
2015
2016
2017
2018
Life Non-Life
Unit: %Unit: Baht
Insurance Penetration (Direct Premium per GDP) Insurance Density (Direct Premium per Capita)
Thai Life & Non-Life Insurance Penetration and Density: 2002-2018
Source: Office of Insurance Commission compiled by IPRB
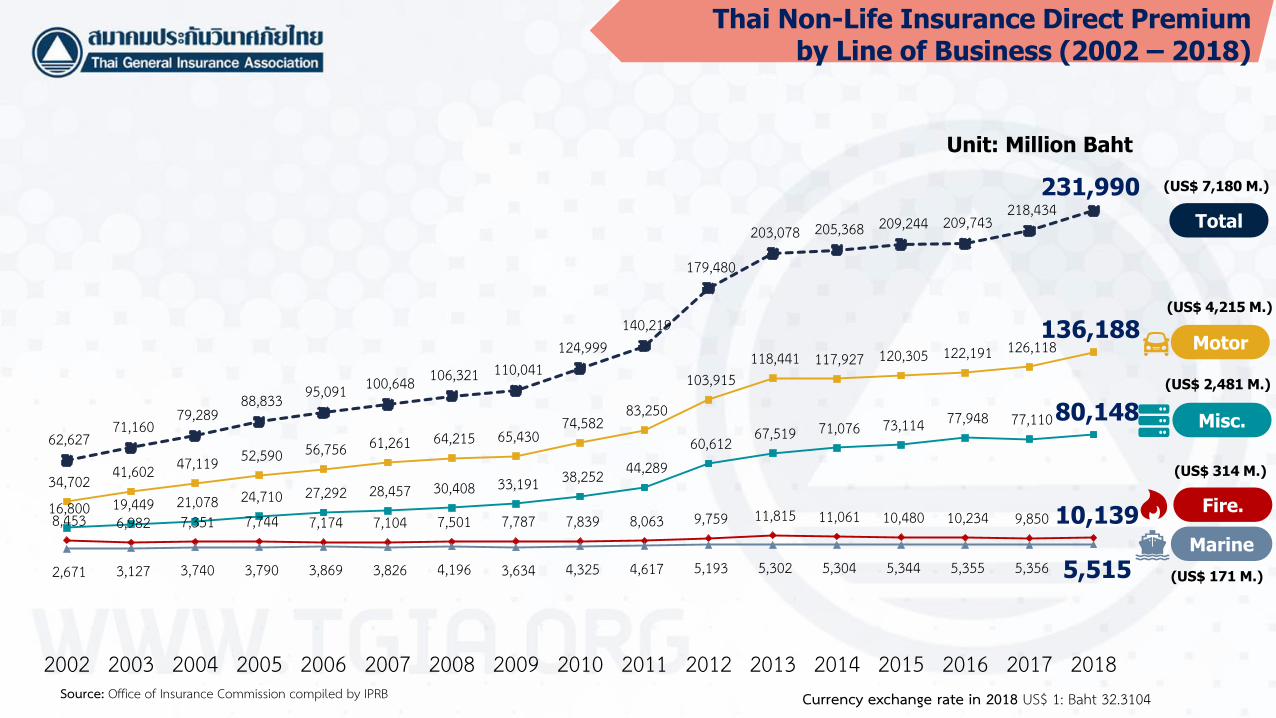
(US$ 7,180 M.)
(US$ 2,481 M.)
(US$ 4,215 M.)
(US$ 314 M.)
(US$ 171 M.)
Currency exchange rate in 2018 US$ 1: Baht 32.3104
8,453 6,982 7,351 7,744 7,174 7,104 7,501 7,787 7,839 8,063 9,759 11,815 11,061 10,480 10,234 9,850 10,139
2,671 3,127 3,740 3,790 3,869 3,826 4,196 3,634 4,325 4,617 5,193 5,302 5,304 5,344 5,355 5,356 5,515
34,702 41,602 47,119 52,590 56,756 61,261 64,215 65,430 74,582
83,250
103,915 118,441 117,927 120,305 122,191 126,118
136,188
16,800 19,449 21,078 24,710 27,292 28,457 30,408 33,191 38,252 44,289 60,612 67,519 71,076 73,114 77,948 77,110 80,148
62,627 71,160
79,289 88,833 95,091 100,648 106,321 110,041
124,999 140,219
179,480
203,078 205,368 209,244 209,743 218,434
231,990
2002 2003 2004 2005 2006 2007 2008 2009 2010 2011 2012 2013 2014 2015 2016 2017 2018
Unit: Million Baht
Total
Motor
Misc.
Fire.
Marine
Thai Non-Life Insurance Direct Premium by Line of Business (2002 – 2018)
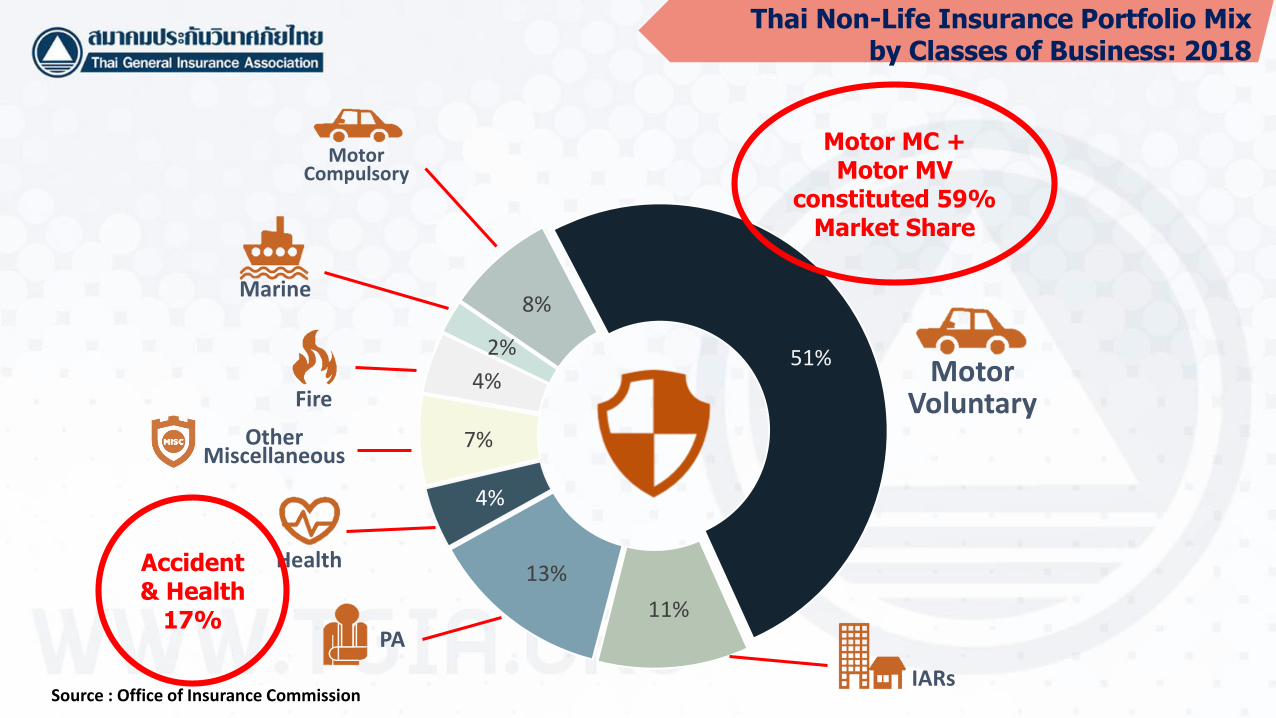
4%
2%
8%
51%
11%
13%
4%
7%
Motor Voluntary
Motor Compulsory
Marine
Fire
Other Miscellaneous
Health
PA
IARsSource : Office of Insurance Commission
Motor MC + Motor MV
constituted 59% Market Share
Thai Non-Life Insurance Portfolio Mix by Classes of Business: 2018
Accident & Health
17%
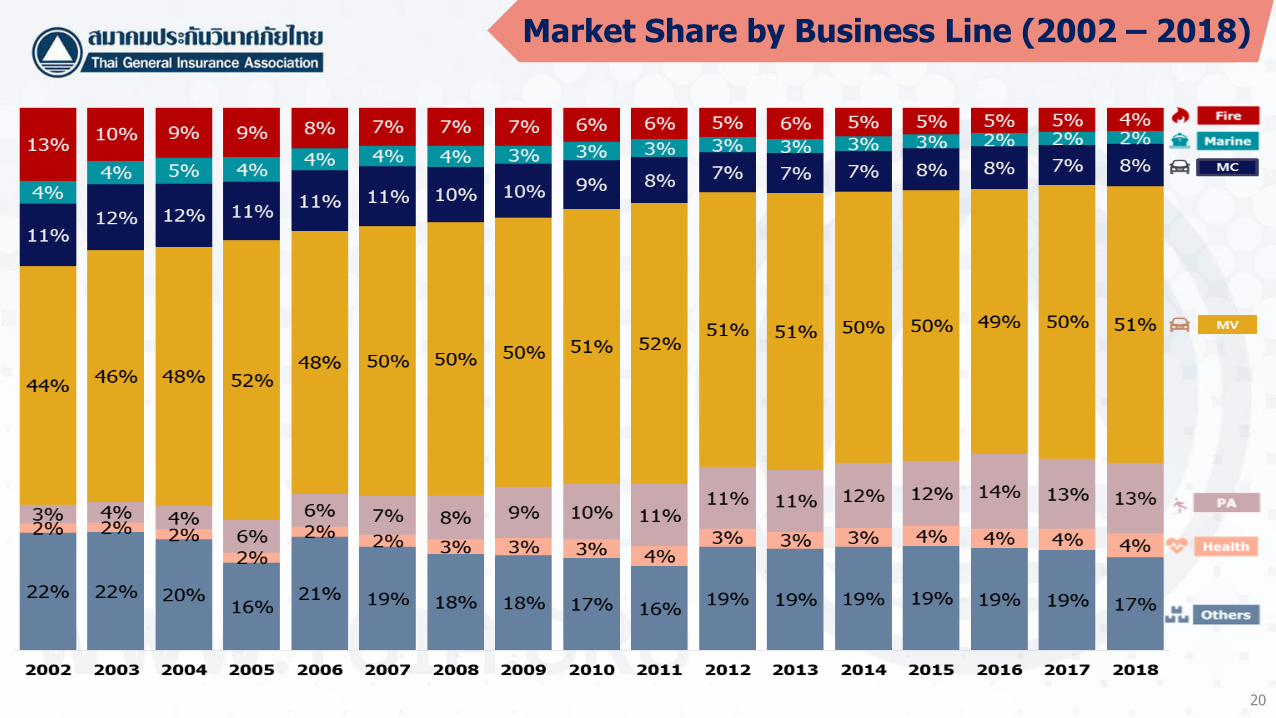
20
Market Share by Business Line (2002 – 2018)
Source: Office of Insurance Commission
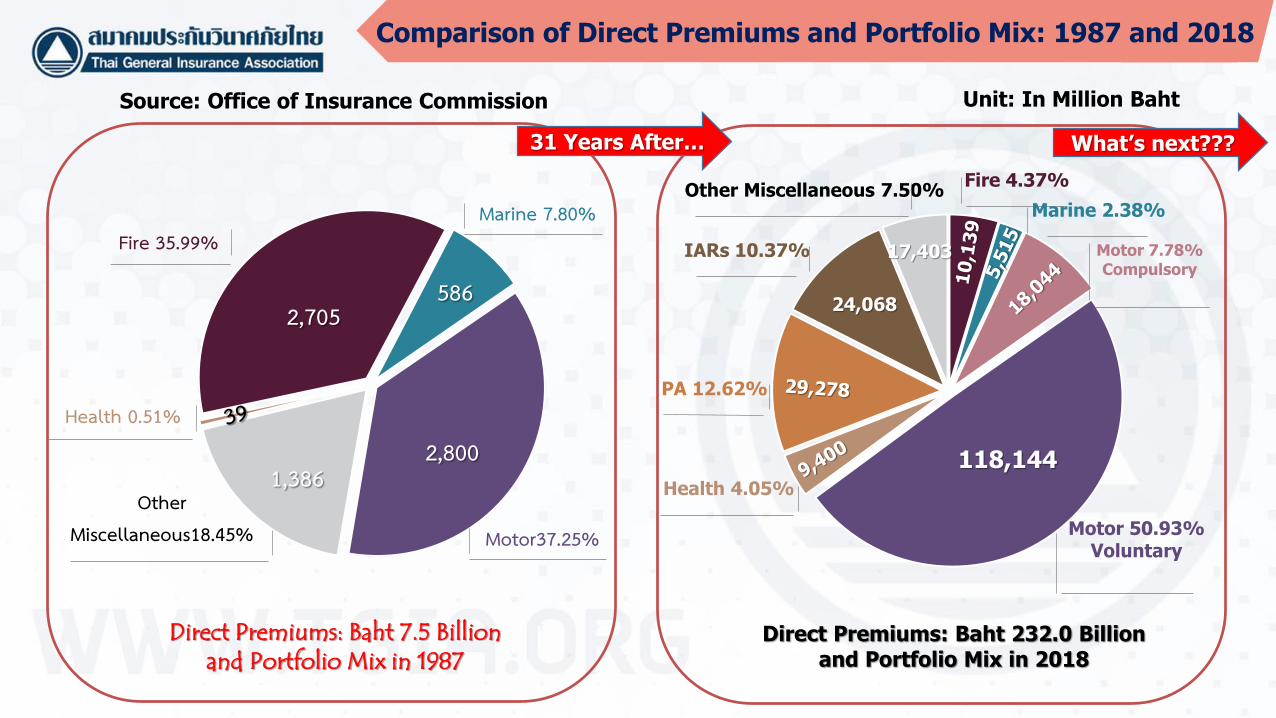
2,800
5862,705
1,386
Direct Premiums: Baht 7.5 Billionand Portfolio Mix in 1987
Unit: In Million Baht
Fire 35.99%
Health 0.51%
Other Miscellaneous18.45% Motor37.25%
Marine 7.80%
17,403
24,068
118,144
Direct Premiums: Baht 232.0 Billionand Portfolio Mix in 2018
31 Years After…
Health 4.05%
PA 12.62%
IARs 10.37%
Other Miscellaneous 7.50%Fire 4.37%
Marine 2.38%
Motor 7.78%Compulsory
Motor 50.93%Voluntary
What’s next???
Comparison of Direct Premiums and Portfolio Mix: 1987 and 2018
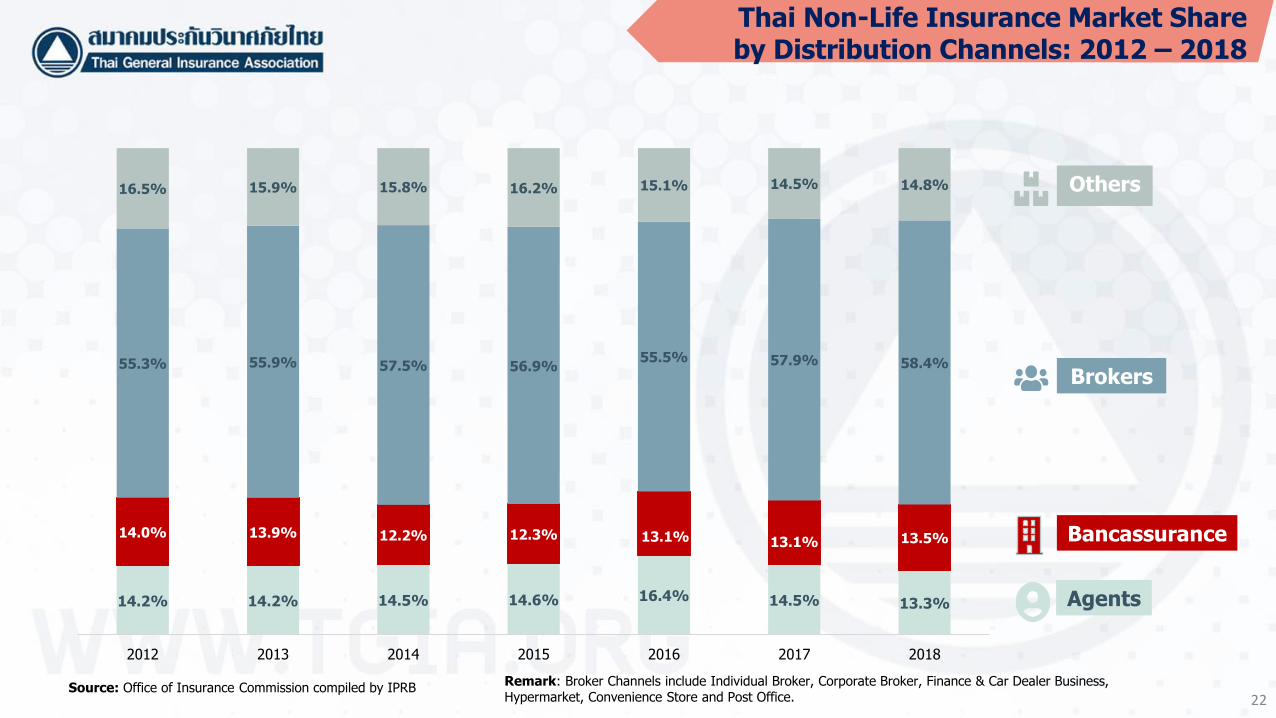
22Source: Office of Insurance Commission compiled by IPRB
Others
Brokers
Agents
Bancassurance
Remark: Broker Channels include Individual Broker, Corporate Broker, Finance & Car Dealer Business, Hypermarket, Convenience Store and Post Office.
14.2% 14.2% 14.5% 14.6% 16.4% 14.5% 13.3%
14.0% 13.9% 12.2% 12.3% 13.1% 13.1% 13.5%
55.3% 55.9% 57.5% 56.9%55.5% 57.9% 58.4%
16.5% 15.9% 15.8% 16.2% 15.1% 14.5% 14.8%
2012 2013 2014 2015 2016 2017 2018
Thai Non-Life Insurance Market Share by Distribution Channels: 2012 – 2018
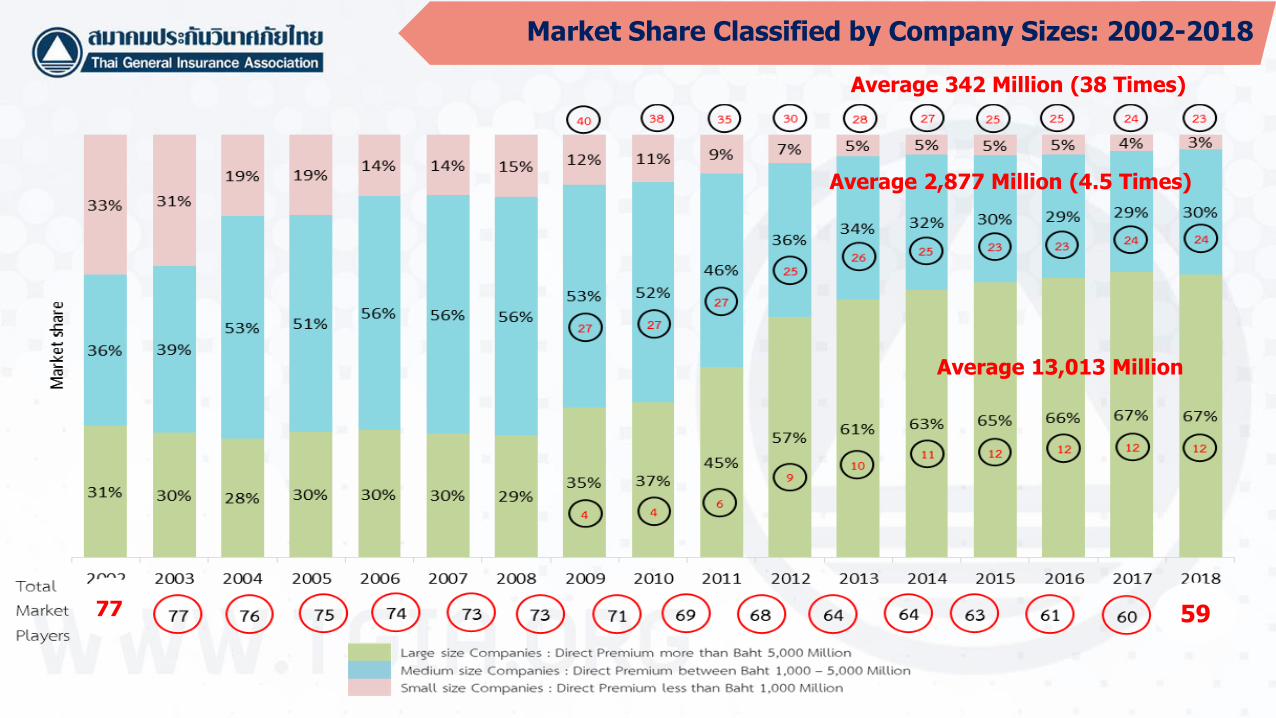
77 59
Market Share Classified by Company Sizes: 2002-2018
Average 13,013 Million
Average 2,877 Million (4.5 Times)
Average 342 Million (38 Times)
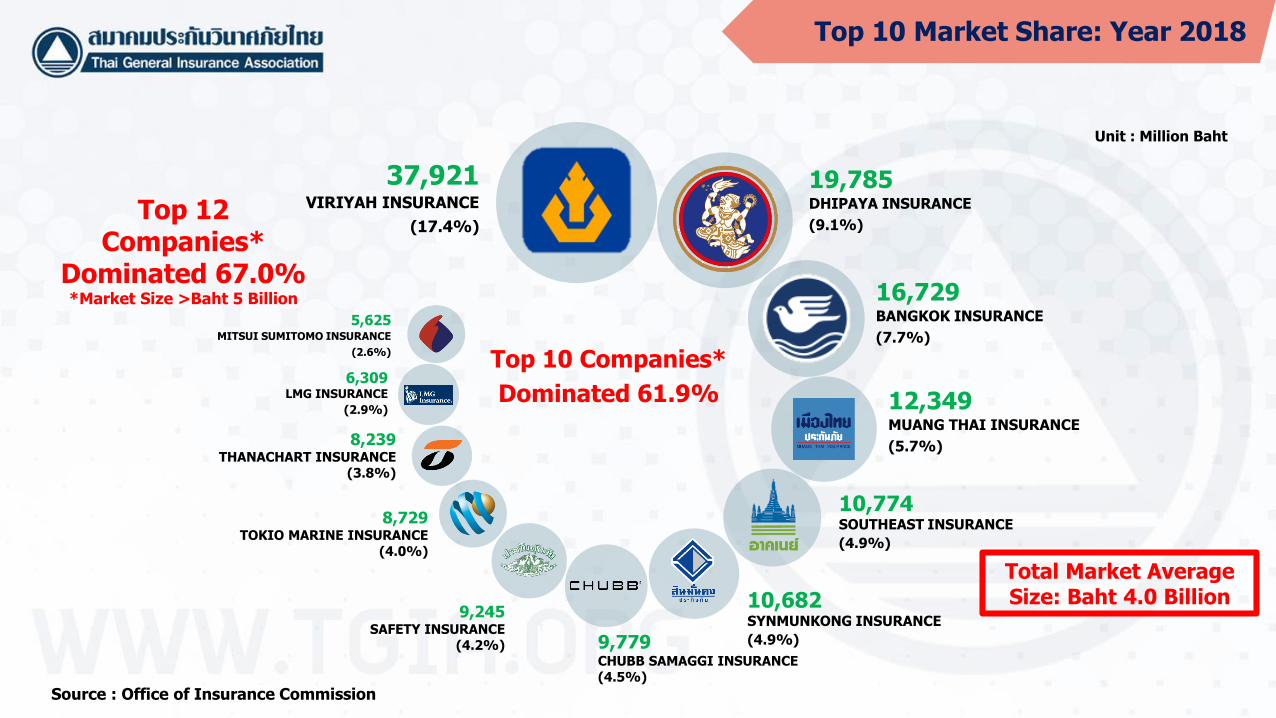
Top 10 Companies*
Dominated 61.9%
37,921 VIRIYAH INSURANCE
(17.4%)
19,785DHIPAYA INSURANCE
(9.1%)
16,729BANGKOK INSURANCE
(7.7%)
12,349 MUANG THAI INSURANCE
(5.7%)
10,774 SOUTHEAST INSURANCE
(4.9%)
10,682 SYNMUNKONG INSURANCE
(4.9%)9,779 CHUBB SAMAGGI INSURANCE(4.5%)
9,245 SAFETY INSURANCE
(4.2%)
8,729 TOKIO MARINE INSURANCE
(4.0%)
8,239 THANACHART INSURANCE
(3.8%)
Top 12 Companies*
Dominated 67.0%*Market Size >Baht 5 Billion
Source : Office of Insurance Commission
Unit : Million Baht
6,309 LMG INSURANCE
(2.9%)
5,625 MITSUI SUMITOMO INSURANCE
(2.6%)
Total Market Average Size: Baht 4.0 Billion
Top 10 Market Share: Year 2018
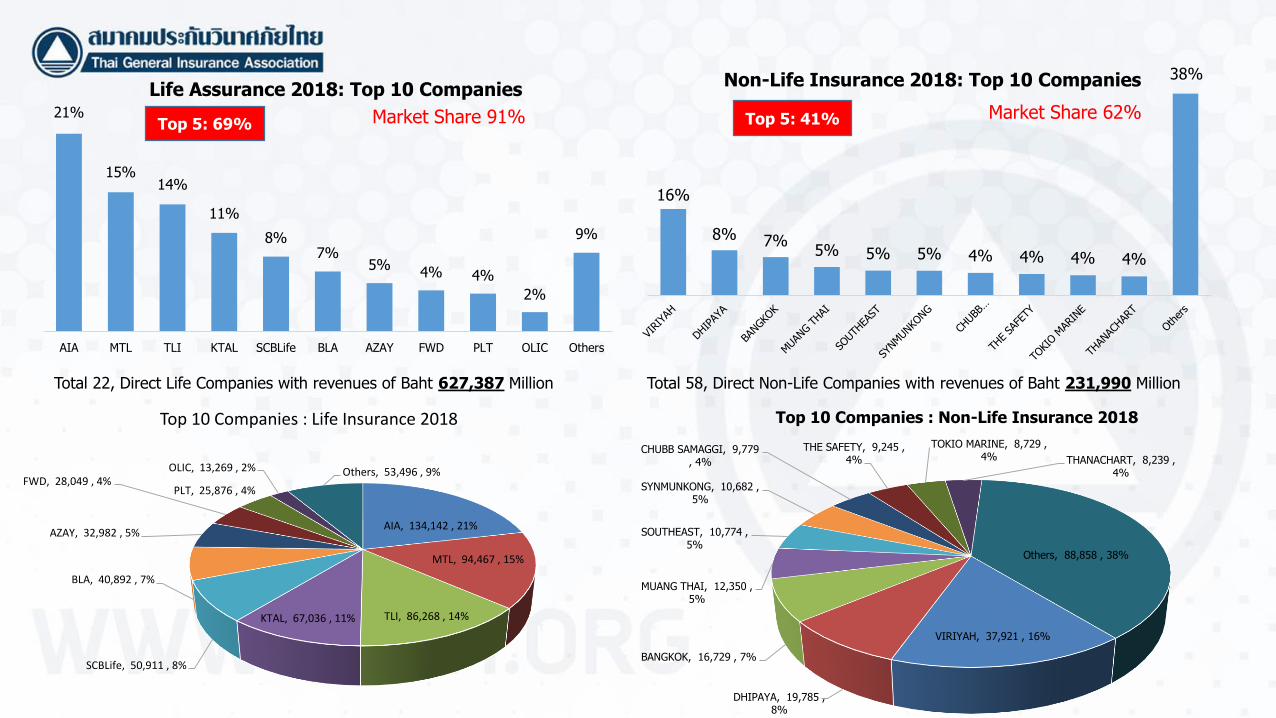
21%
15%14%
11%
8%7%
5%4% 4%
2%
9%
AIA MTL TLI KTAL SCBLife BLA AZAY FWD PLT OLIC Others
Life Assurance 2018: Top 10 Companies
Market Share 91%
16%
8% 7%5% 5% 5% 4% 4% 4% 4%
38%Non-Life Insurance 2018: Top 10 Companies
Total 22, Direct Life Companies with revenues of Baht 627,387 Million Total 58, Direct Non-Life Companies with revenues of Baht 231,990 Million
VIRIYAH, 37,921 , 16%
DHIPAYA, 19,785 , 8%
BANGKOK, 16,729 , 7%
MUANG THAI, 12,350 , 5%
SOUTHEAST, 10,774 , 5%
SYNMUNKONG, 10,682 , 5%
CHUBB SAMAGGI, 9,779 , 4%
THE SAFETY, 9,245 , 4%
TOKIO MARINE, 8,729 , 4% THANACHART, 8,239 ,
4%
Others, 88,858 , 38%
Top 10 Companies : Non-Life Insurance 2018
AIA, 134,142 , 21%
MTL, 94,467 , 15%
TLI, 86,268 , 14%KTAL, 67,036 , 11%
SCBLife, 50,911 , 8%
BLA, 40,892 , 7%
AZAY, 32,982 , 5%
FWD, 28,049 , 4%PLT, 25,876 , 4%
OLIC, 13,269 , 2% Others, 53,496 , 9%
Top 10 Companies : Life Insurance 2018
Market Share 62%Top 5: 69% Top 5: 41%
26Source: Office of Insurance Commission compiled by IPRB
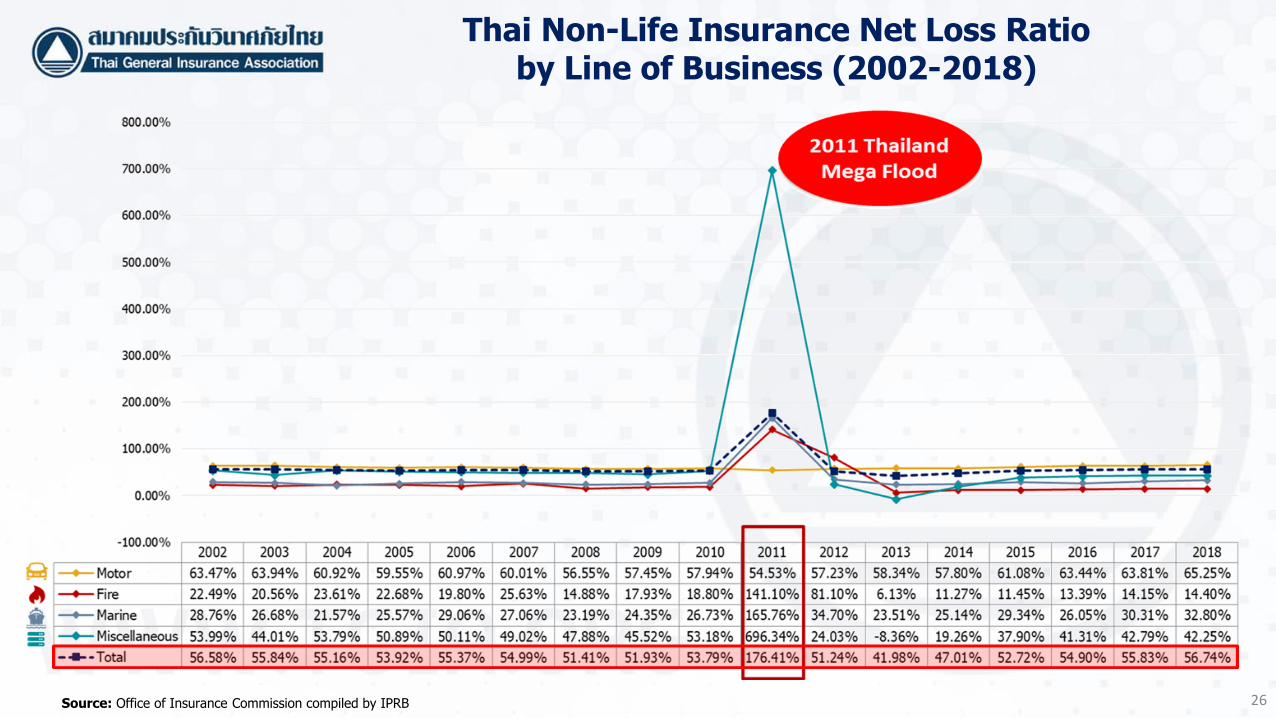
Thai Non-Life Insurance Net Loss Ratio by Line of Business (2002-2018)
27Source : Office of Insurance Commission
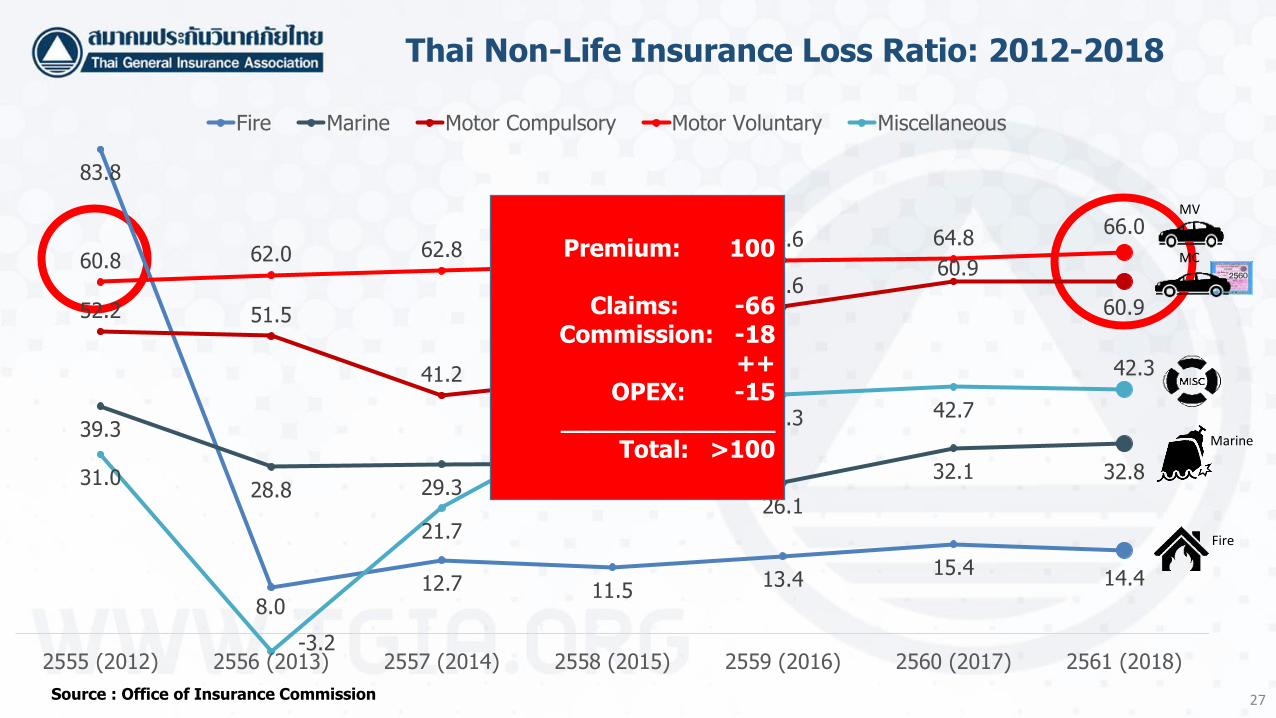
Thai Non-Life Insurance Loss Ratio: 2012-2018
Marine
Fire
MV
MC
83.8
8.012.7 11.5
13.415.4
14.4
39.3
28.8 29.3 29.326.1
32.1 32.8
52.2 51.5
41.244.3
56.660.9
60.9
60.8 62.0 62.8 63.8 64.6 64.866.0
31.0
-3.2
21.7
37.941.3 42.7
42.3
2555 (2012) 2556 (2013) 2557 (2014) 2558 (2015) 2559 (2016) 2560 (2017) 2561 (2018)
Fire Marine Motor Compulsory Motor Voluntary Miscellaneous
Premium: 100
Claims: -66Commission: -18
++ OPEX: -15
______________Total: >100
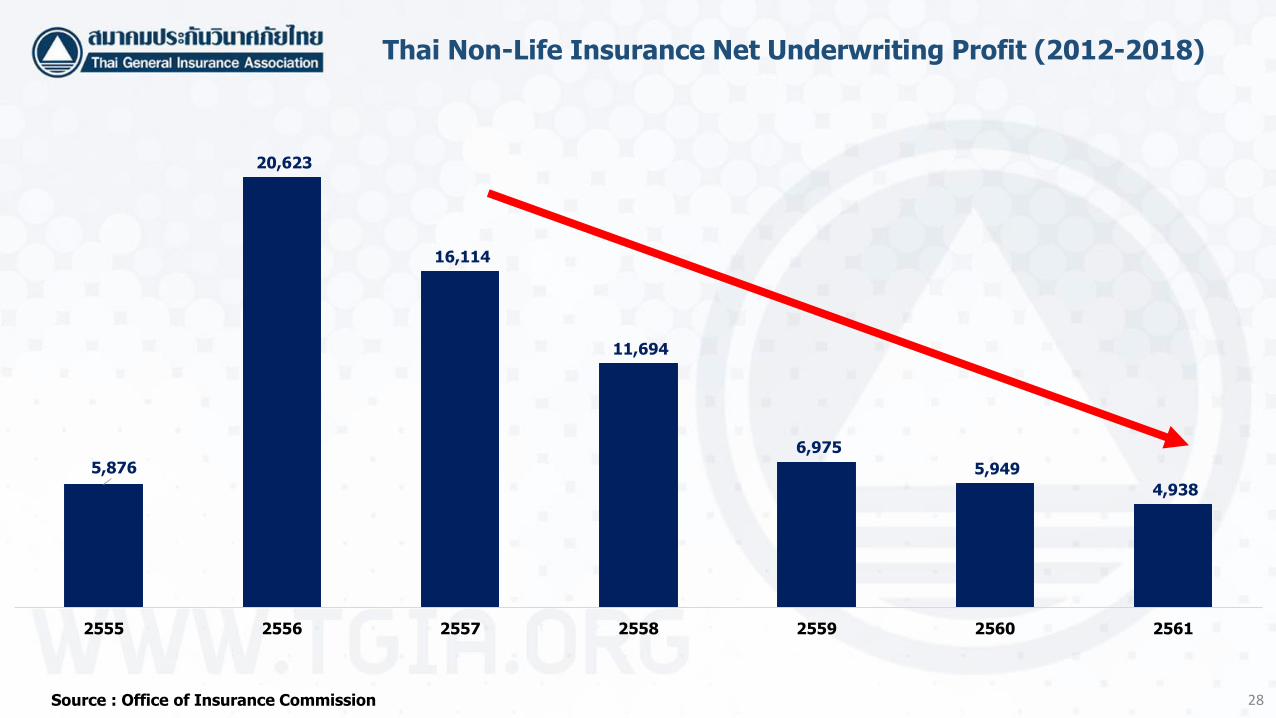
28Source : Office of Insurance Commission
Thai Non-Life Insurance Net Underwriting Profit (2012-2018)
5,876
20,623
16,114
11,694
6,975
5,949
4,938
2555 2556 2557 2558 2559 2560 2561
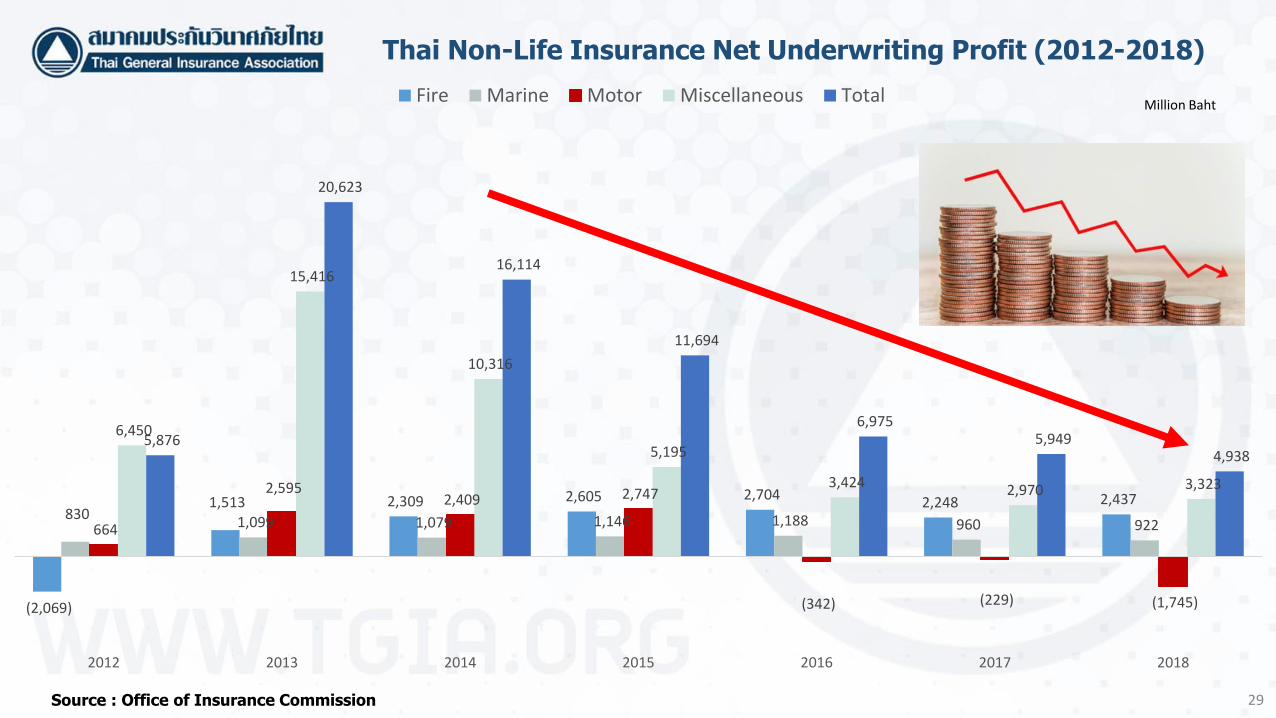
29Source : Office of Insurance Commission
Million Baht
(2,069)
1,513 2,309 2,605 2,704 2,248 2,437 830
1,099 1,079 1,146 1,188 960 922 664
2,595 2,409 2,747
(342) (229) (1,745)
6,450
15,416
10,316
5,195
3,424 2,970 3,323
5,876
20,623
16,114
11,694
6,975 5,949
4,938
2012 2013 2014 2015 2016 2017 2018
Fire Marine Motor Miscellaneous Total
Thai Non-Life Insurance Net Underwriting Profit (2012-2018)
30
2,134
967428
764
2,186
148452
1,103
2,128 2,338
1,527 1,463
4,797
3,5722,938
(2,849)
14,607 14,346
11,429
6,511
4,957 4,8425,423 5,261 5,127
3,302
2,616
3,8243,555
3,1382,568
2,982
3,9244,246 4,139 3,688 4,207
5,347
7,038 7,2497,600 7,768 7,598
7,077 7,112
(155)
(1,923)(1,292)
80
(135)
151429
1,6711,351
995 828
1,769
(2,861)
855
2,120 1,966
6,420
717
3,534
2,5112,073
2,418
59
831
372 355
481
269 303356
772668
713 679
858
449
734
1,033 1,025
1,3921,299
1,498
1,288
1,543
1,754
1,564
1996 1997 1998 1999 2000 2001 2002 2003 2004 2005 2006 2007 2008 2009 2010 2011 2012 2013 2014 2015 2016 2017 2018
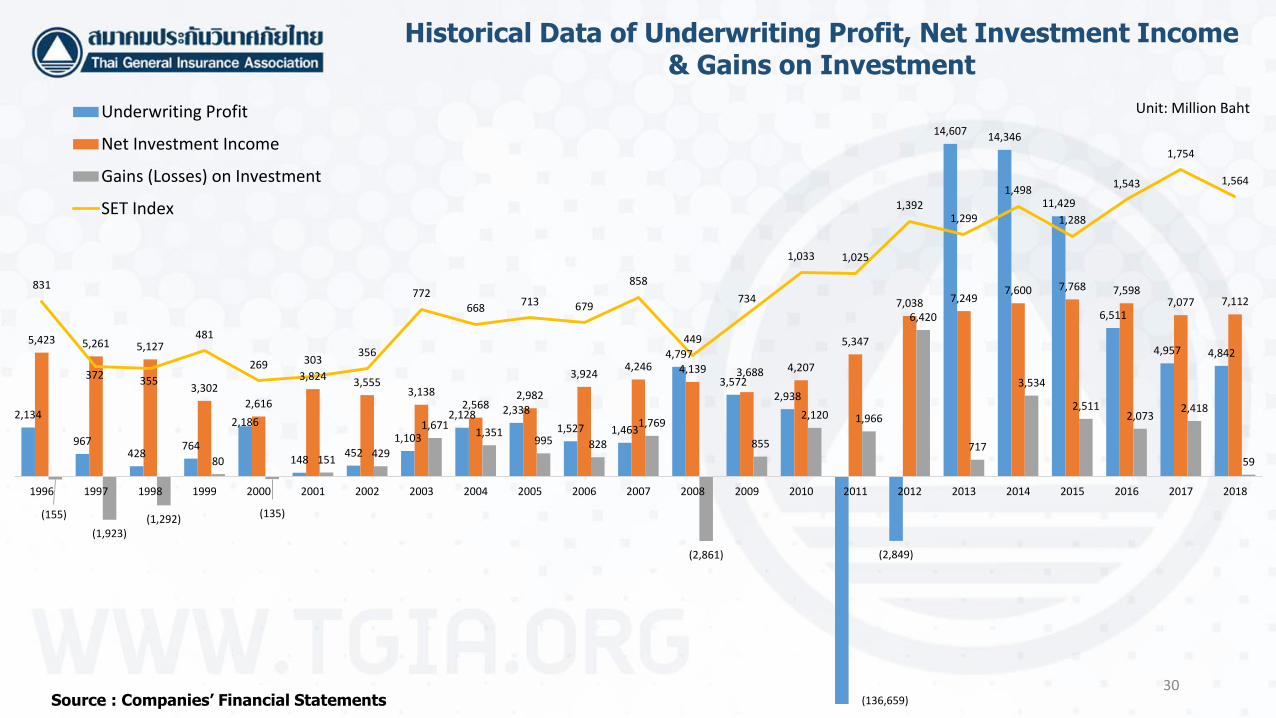
Underwriting Profit
Net Investment Income
Gains (Losses) on Investment
SET Index
(136,659)
Unit: Million Baht
Historical Data of Underwriting Profit, Net Investment Income & Gains on Investment
Source : Companies’ Financial Statements
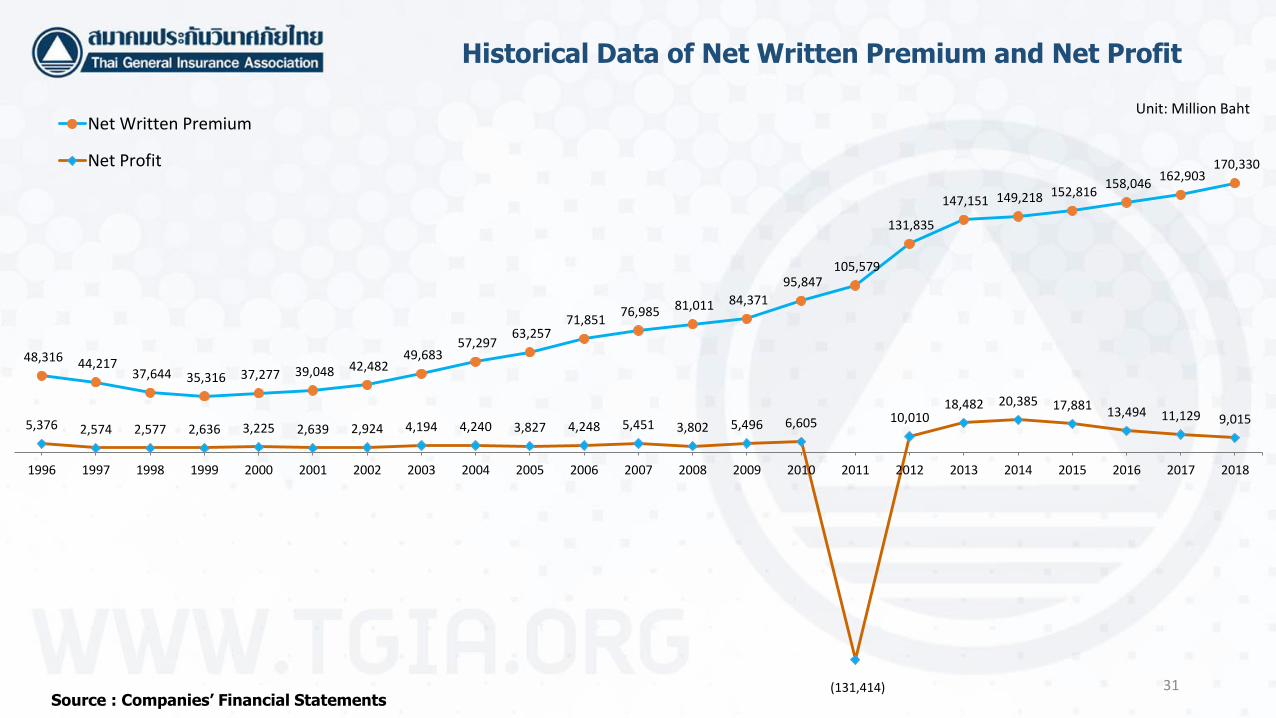
31
48,316 44,217 37,644 35,316 37,277 39,048 42,482
49,683 57,297
63,257 71,851
76,985 81,011 84,371
95,847 105,579
131,835
147,151 149,218 152,816 158,046
162,903 170,330
5,376 2,574 2,577 2,636 3,225 2,639 2,924 4,194 4,240 3,827 4,248 5,451 3,802 5,496 6,605
(131,414)
10,01018,482 20,385 17,881 13,494 11,129 9,015
1996 1997 1998 1999 2000 2001 2002 2003 2004 2005 2006 2007 2008 2009 2010 2011 2012 2013 2014 2015 2016 2017 2018
Net Written Premium
Net Profit
Unit: Million Baht
Historical Data of Net Written Premium and Net Profit
Source : Companies’ Financial Statements
32
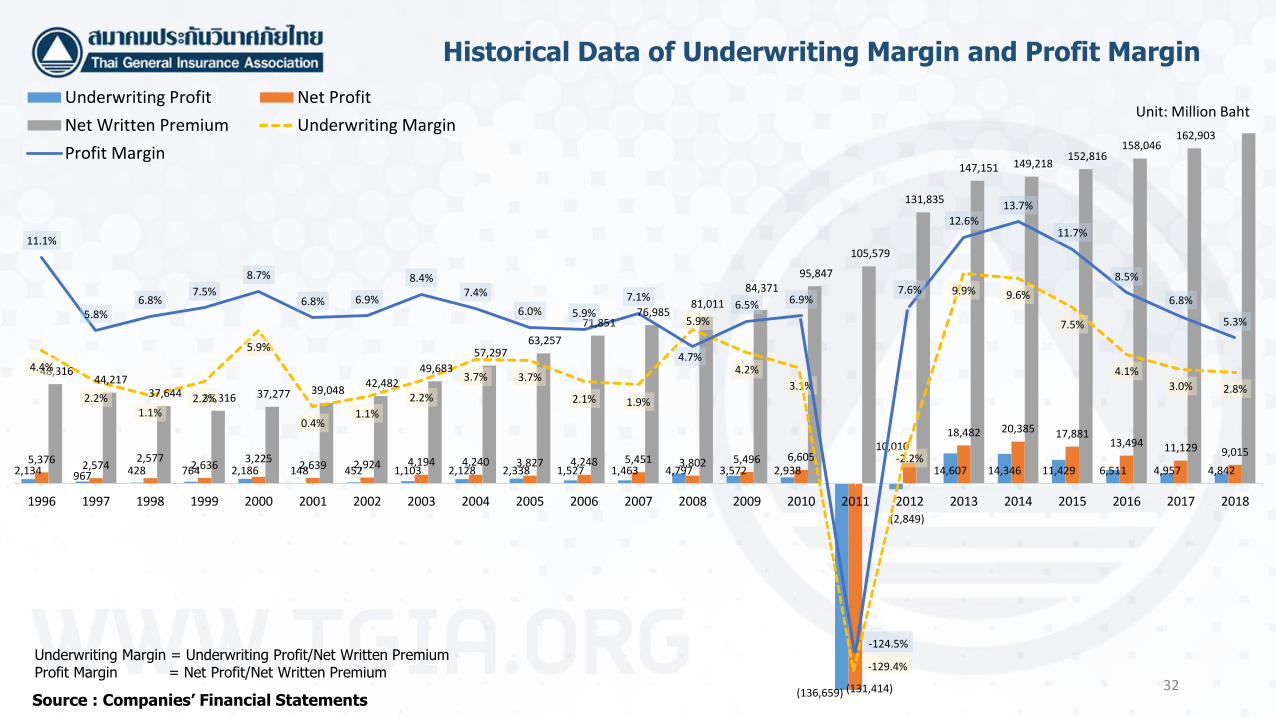
2,134 967 428 764 2,186 148 452 1,103 2,128 2,338 1,527 1,463 4,797 3,572 2,938
(136,659)
(2,849)
14,607 14,346 11,429 6,511 4,957 4,8425,376 2,574
2,5772,636
3,2252,639 2,924 4,194 4,240 3,827 4,248 5,451 3,802 5,496 6,605
10,01018,482 20,385 17,881
13,494 11,129 9,015
48,316 44,217
37,644 35,316 37,277 39,048 42,482
49,683
57,297 63,257
71,851 76,985
81,011
84,371 95,847
105,579
131,835
147,151 149,218 152,816
158,046 162,903
4.4%
2.2%1.1%
2.2%
5.9%
0.4%1.1%
2.2%
3.7% 3.7%
2.1% 1.9%
5.9%
4.2%
3.1%
-2.2%
9.9% 9.6%
7.5%
4.1%3.0% 2.8%
11.1%
5.8%6.8%
7.5%
8.7%
6.8% 6.9%
8.4%7.4%
6.0% 5.9%
7.1%
4.7%
6.5% 6.9%7.6%
12.6%
13.7%
11.7%
8.5%
6.8%
5.3%
1996 1997 1998 1999 2000 2001 2002 2003 2004 2005 2006 2007 2008 2009 2010 2011 2012 2013 2014 2015 2016 2017 2018
Underwriting Profit Net Profit
Net Written Premium Underwriting Margin
Profit Margin
(131,414)
-129.4%
-124.5%
Unit: Million Baht
Underwriting Margin = Underwriting Profit/Net Written PremiumProfit Margin = Net Profit/Net Written Premium
Historical Data of Underwriting Margin and Profit Margin
Source : Companies’ Financial Statements
33
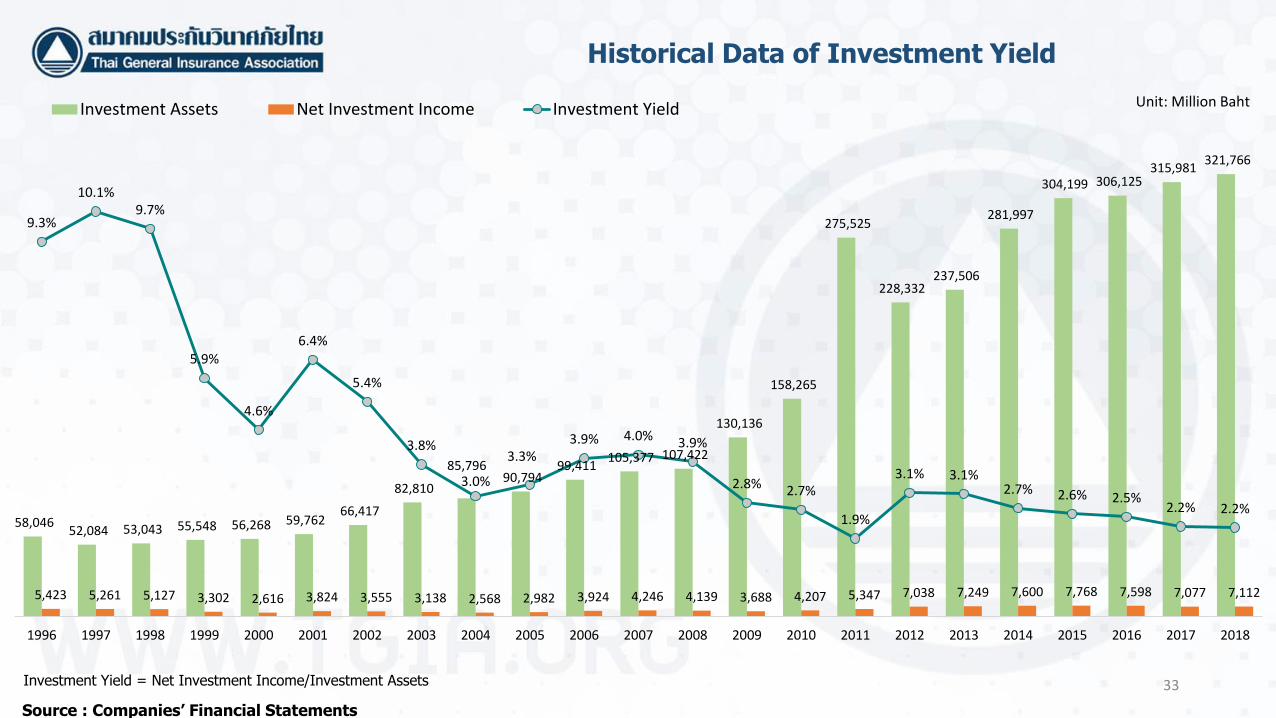
58,046 52,084 53,043 55,548 56,268 59,762
66,417
82,810
85,796 90,794
99,411 105,377 107,422
130,136
158,265
275,525
228,332 237,506
281,997
304,199 306,125 315,981
321,766
5,423 5,261 5,127 3,302 2,616 3,824 3,555 3,138 2,568 2,982 3,924 4,246 4,139 3,688 4,207 5,347 7,038 7,249 7,600 7,768 7,598 7,077 7,112
9.3%
10.1%9.7%
5.9%
4.6%
6.4%
5.4%
3.8%
3.0%
3.3%3.9% 4.0% 3.9%
2.8% 2.7%
1.9%
3.1% 3.1%2.7% 2.6% 2.5%
2.2% 2.2%
1996 1997 1998 1999 2000 2001 2002 2003 2004 2005 2006 2007 2008 2009 2010 2011 2012 2013 2014 2015 2016 2017 2018
Investment Assets Net Investment Income Investment Yield Unit: Million Baht
Investment Yield = Net Investment Income/Investment Assets
Historical Data of Investment Yield
Source : Companies’ Financial Statements
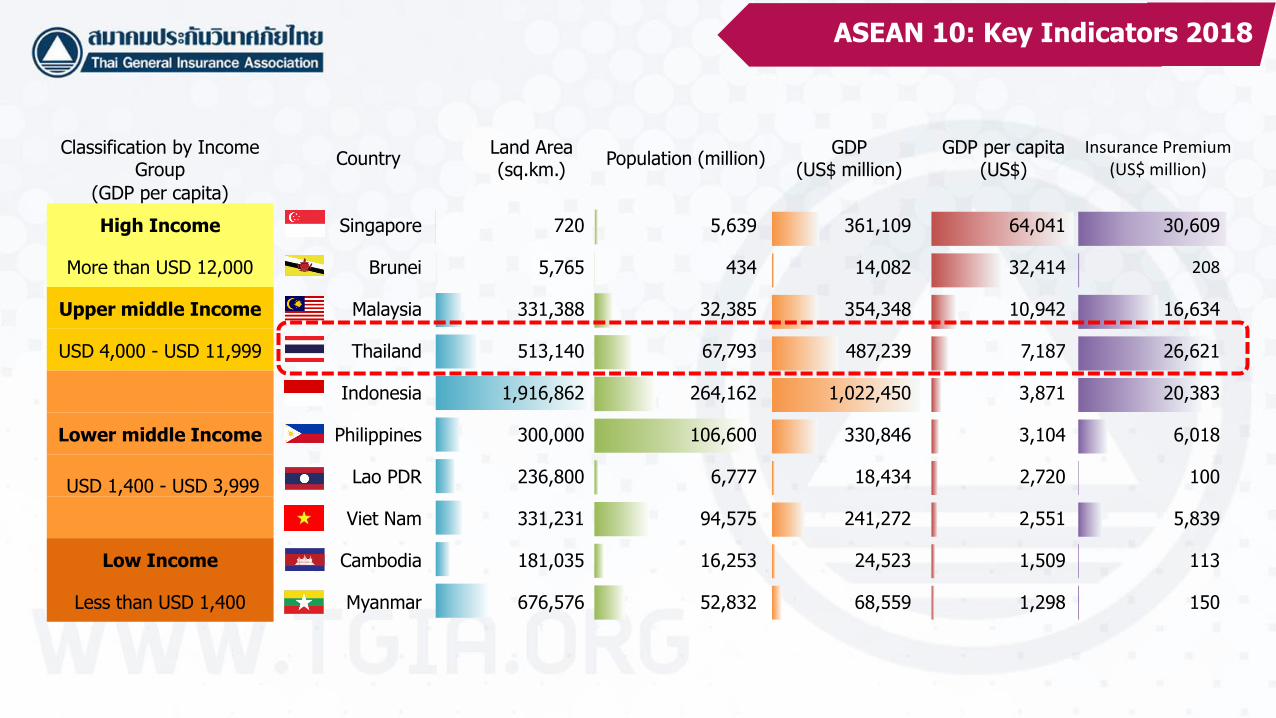
Classification by Income Group
CountryLand Area (sq.km.)
Population (million)GDP
(US$ million)GDP per capita
(US$)
Insurance Premium (US$ million)
(GDP per capita)
High Income Singapore 720 5,639 361,109 64,041 30,609
More than USD 12,000 Brunei 5,765 434 14,082 32,414 208
Upper middle Income Malaysia 331,388 32,385 354,348 10,942 16,634
USD 4,000 - USD 11,999 Thailand 513,140 67,793 487,239 7,187 26,621
Indonesia 1,916,862 264,162 1,022,450 3,871 20,383
Lower middle Income Philippines 300,000 106,600 330,846 3,104 6,018
USD 1,400 - USD 3,999Lao PDR 236,800 6,777 18,434 2,720 100
Viet Nam 331,231 94,575 241,272 2,551 5,839
Low Income Cambodia 181,035 16,253 24,523 1,509 113
Less than USD 1,400 Myanmar 676,576 52,832 68,559 1,298 150
ASEAN 10: Key Indicators 2018
35Source: Swiss Re, Sigma No.3/2019 and AIC 2018 ASEAN Insurance Statistical Report
*by estimation
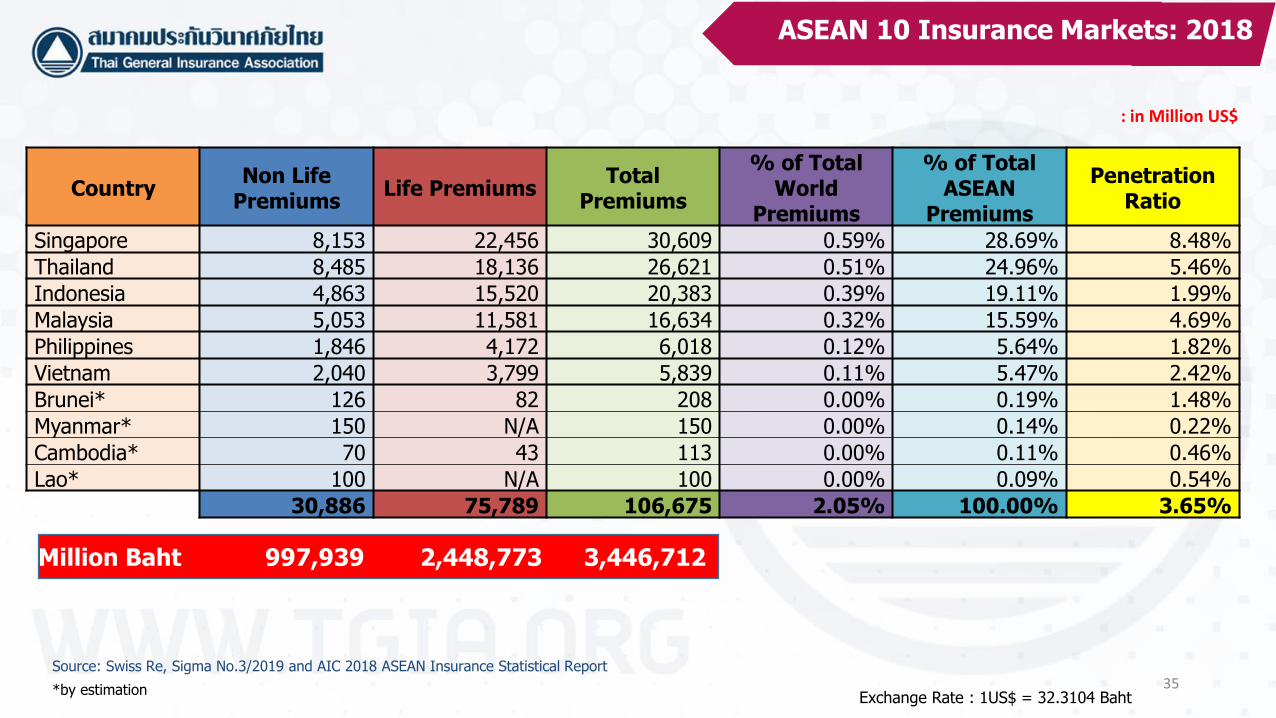
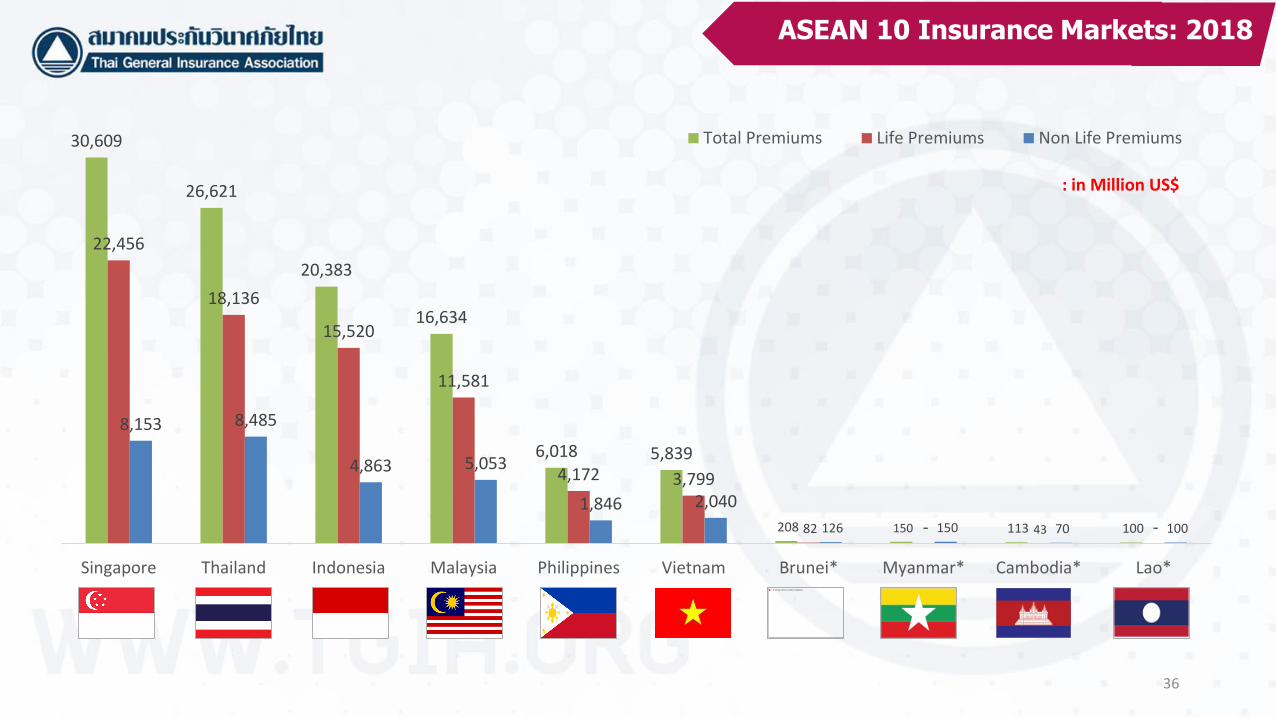
: in Million US$
CountryNon Life
PremiumsLife Premiums
Total Premiums
% of Total World
Premiums
% of Total ASEAN
Premiums
Penetration Ratio
Singapore 8,153 22,456 30,609 0.59% 28.69% 8.48%
Thailand 8,485 18,136 26,621 0.51% 24.96% 5.46%
Indonesia 4,863 15,520 20,383 0.39% 19.11% 1.99%
Malaysia 5,053 11,581 16,634 0.32% 15.59% 4.69%
Philippines 1,846 4,172 6,018 0.12% 5.64% 1.82%
Vietnam 2,040 3,799 5,839 0.11% 5.47% 2.42%
Brunei* 126 82 208 0.00% 0.19% 1.48%
Myanmar* 150 N/A 150 0.00% 0.14% 0.22%
Cambodia* 70 43 113 0.00% 0.11% 0.46%
Lao* 100 N/A 100 0.00% 0.09% 0.54%
30,886 75,789 106,675 2.05% 100.00% 3.65%
Million Baht 997,939 2,448,773 3,446,712
Exchange Rate : 1US$ = 32.3104 Baht
ASEAN 10 Insurance Markets: 2018
36
30,609
26,621
20,383
16,634
6,018 5,839
208 150 113 100
22,456
18,136
15,520
11,581
4,172 3,799
82 - 43 -
8,153 8,485
4,863 5,053
1,846 2,040
126 150 70 100
Singapore Thailand Indonesia Malaysia Philippines Vietnam Brunei* Myanmar* Cambodia* Lao*
Total Premiums Life Premiums Non Life Premiums
: in Million US$
ASEAN 10 Insurance Markets: 2018
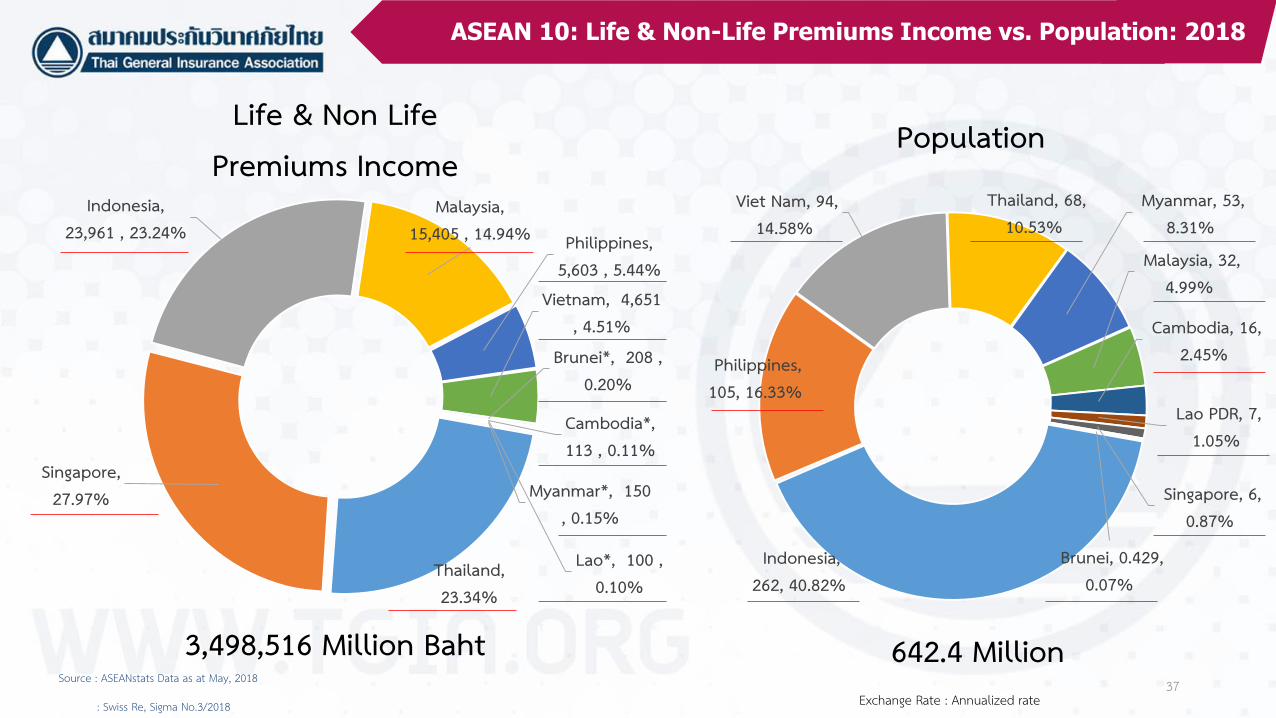
Life & Non LifePremiums Income
Source : ASEANstats Data as at May, 2018
: Swiss Re, Sigma No.3/2018 Exchange Rate : Annualized rate
642.4 Million37
3,498,516 Million Baht
Thailand, 23.34%
Singapore, 27.97%
Indonesia, 23,961 , 23.24%
Malaysia, 15,405 , 14.94% Philippines,
5,603 , 5.44%Vietnam, 4,651
, 4.51%Brunei*, 208 ,
0.20%
Cambodia*, 113 , 0.11%
Lao*, 100 , 0.10%
Myanmar*, 150 , 0.15%
Population
Indonesia, 262, 40.82%
Philippines, 105, 16.33%
Viet Nam, 94, 14.58%
Thailand, 68, 10.53%
Myanmar, 53, 8.31%
Malaysia, 32, 4.99%
Cambodia, 16, 2.45%
Lao PDR, 7, 1.05%
Singapore, 6, 0.87%
Brunei, 0.429, 0.07%
ASEAN 10: Life & Non-Life Premiums Income vs. Population: 2018
38Source: Swiss Re, Sigma No.3/2018
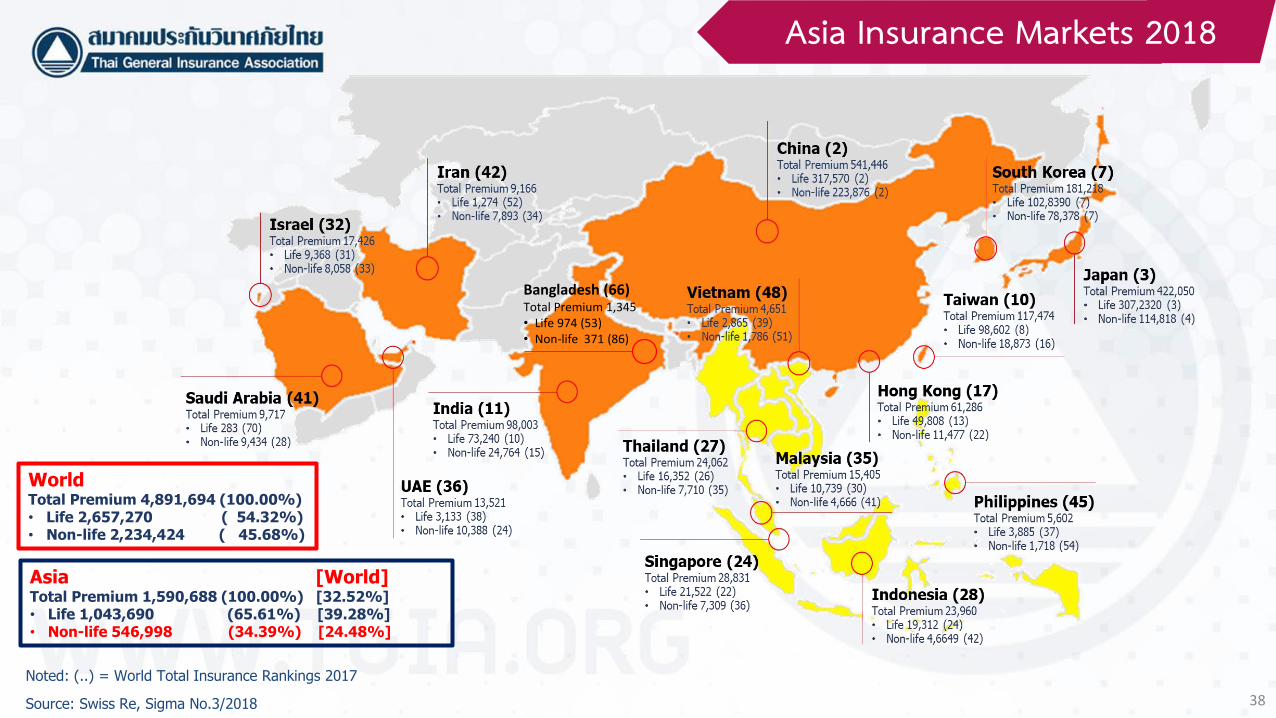
Unit: Million USD
Noted: (..) = World Total Insurance Rankings 2017
WorldTotal Premium 4,891,694 (100.00%)• Life 2,657,270 ( 54.32%)• Non-life 2,234,424 ( 45.68%)
Asia [World] Total Premium 1,590,688 (100.00%) [32.52%] • Life 1,043,690 (65.61%) [39.28%]• Non-life 546,998 (34.39%) [24.48%]
Bangladesh (66)Total Premium 1,345• Life 974 (53)• Non-life 371 (86)
Asia Insurance Markets 2018
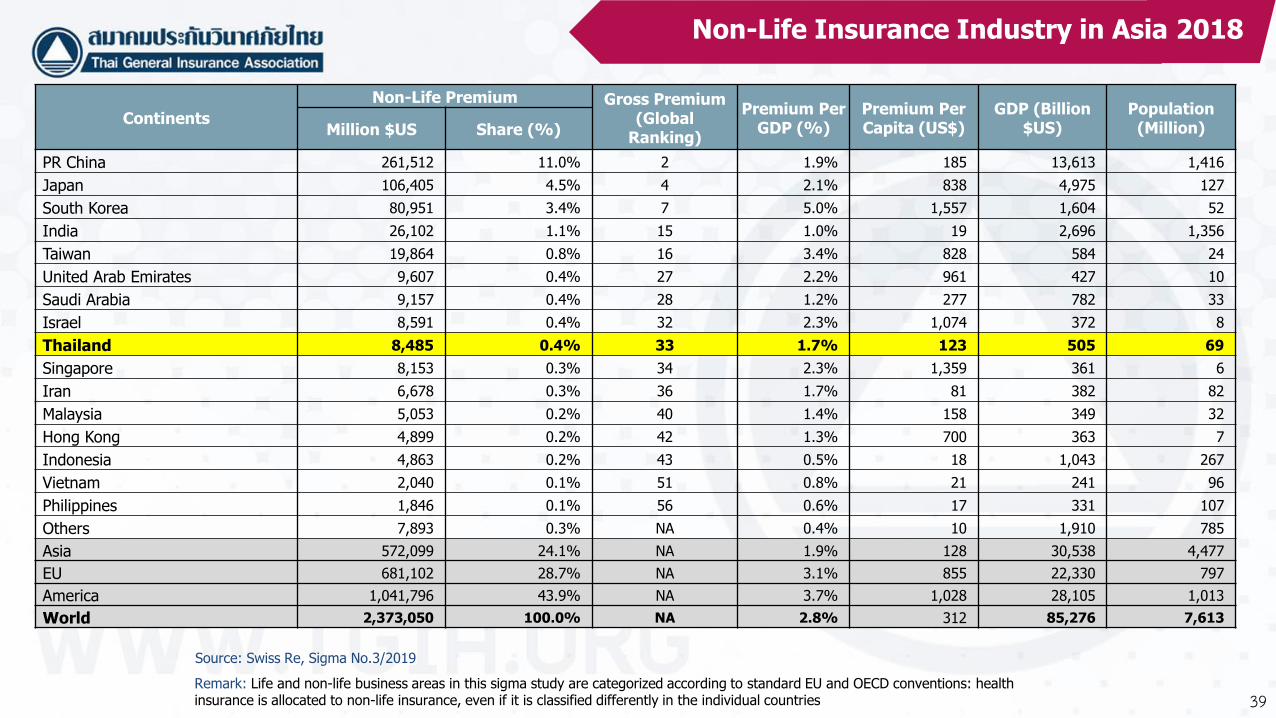
Source: Swiss Re, Sigma No.3/2019
Continents
Non-Life Premium Gross Premium (Global
Ranking)
Premium Per GDP (%)
Premium Per Capita (US$)
GDP (Billion $US)
Population (Million)Million $US Share (%)
PR China 261,512 11.0% 2 1.9% 185 13,613 1,416
Japan 106,405 4.5% 4 2.1% 838 4,975 127
South Korea 80,951 3.4% 7 5.0% 1,557 1,604 52
India 26,102 1.1% 15 1.0% 19 2,696 1,356
Taiwan 19,864 0.8% 16 3.4% 828 584 24
United Arab Emirates 9,607 0.4% 27 2.2% 961 427 10
Saudi Arabia 9,157 0.4% 28 1.2% 277 782 33
Israel 8,591 0.4% 32 2.3% 1,074 372 8
Thailand 8,485 0.4% 33 1.7% 123 505 69
Singapore 8,153 0.3% 34 2.3% 1,359 361 6
Iran 6,678 0.3% 36 1.7% 81 382 82
Malaysia 5,053 0.2% 40 1.4% 158 349 32
Hong Kong 4,899 0.2% 42 1.3% 700 363 7
Indonesia 4,863 0.2% 43 0.5% 18 1,043 267
Vietnam 2,040 0.1% 51 0.8% 21 241 96
Philippines 1,846 0.1% 56 0.6% 17 331 107
Others 7,893 0.3% NA 0.4% 10 1,910 785
Asia 572,099 24.1% NA 1.9% 128 30,538 4,477
EU 681,102 28.7% NA 3.1% 855 22,330 797
America 1,041,796 43.9% NA 3.7% 1,028 28,105 1,013
World 2,373,050 100.0% NA 2.8% 312 85,276 7,613
Remark: Life and non-life business areas in this sigma study are categorized according to standard EU and OECD conventions: health insurance is allocated to non-life insurance, even if it is classified differently in the individual countries 39
Unit: Million USD Non-Life Insurance Industry in Asia 2018
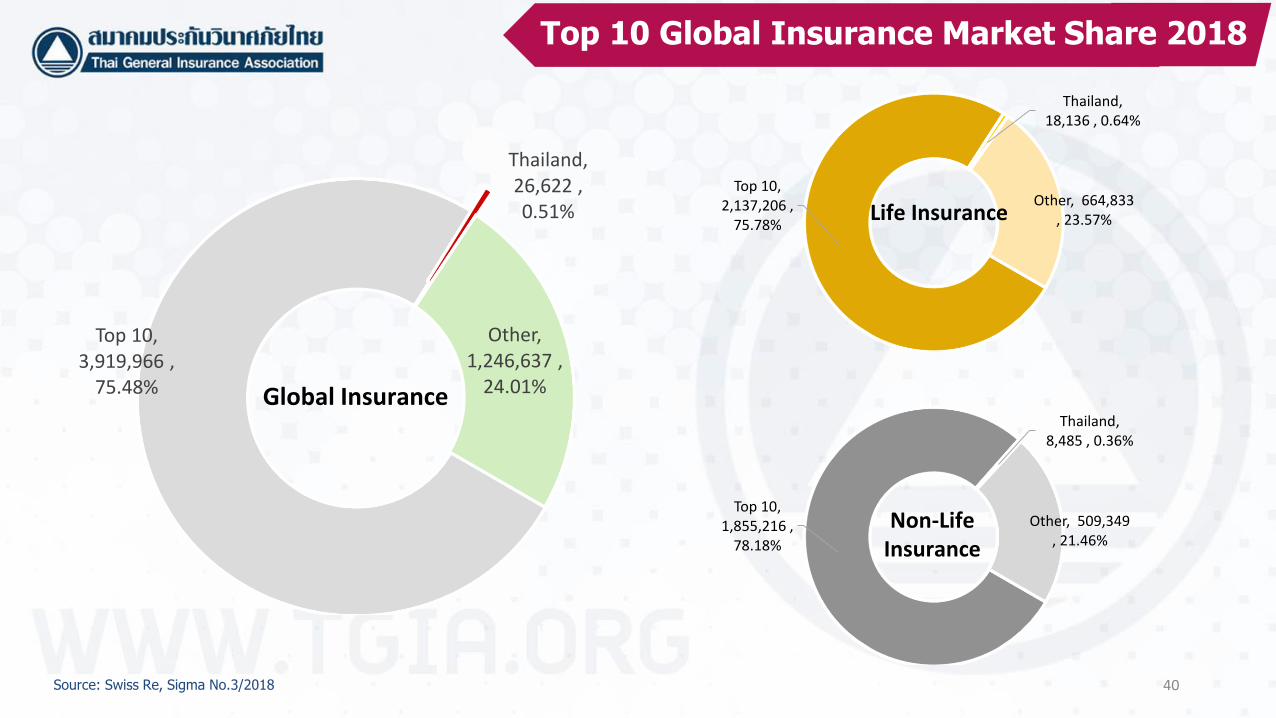
40Source: Swiss Re, Sigma No.3/2018
Top 10, 3,919,966 ,
75.48%
Thailand, 26,622 , 0.51%
Other, 1,246,637 ,
24.01%Global Insurance
Top 10, 2,137,206 ,
75.78%
Thailand, 18,136 , 0.64%
Other, 664,833 , 23.57%Life Insurance
Top 10, 1,855,216 ,
78.18%
Thailand, 8,485 , 0.36%
Other, 509,349 , 21.46%
Non-Life Insurance
Top 10 Global Insurance Market Share 2018
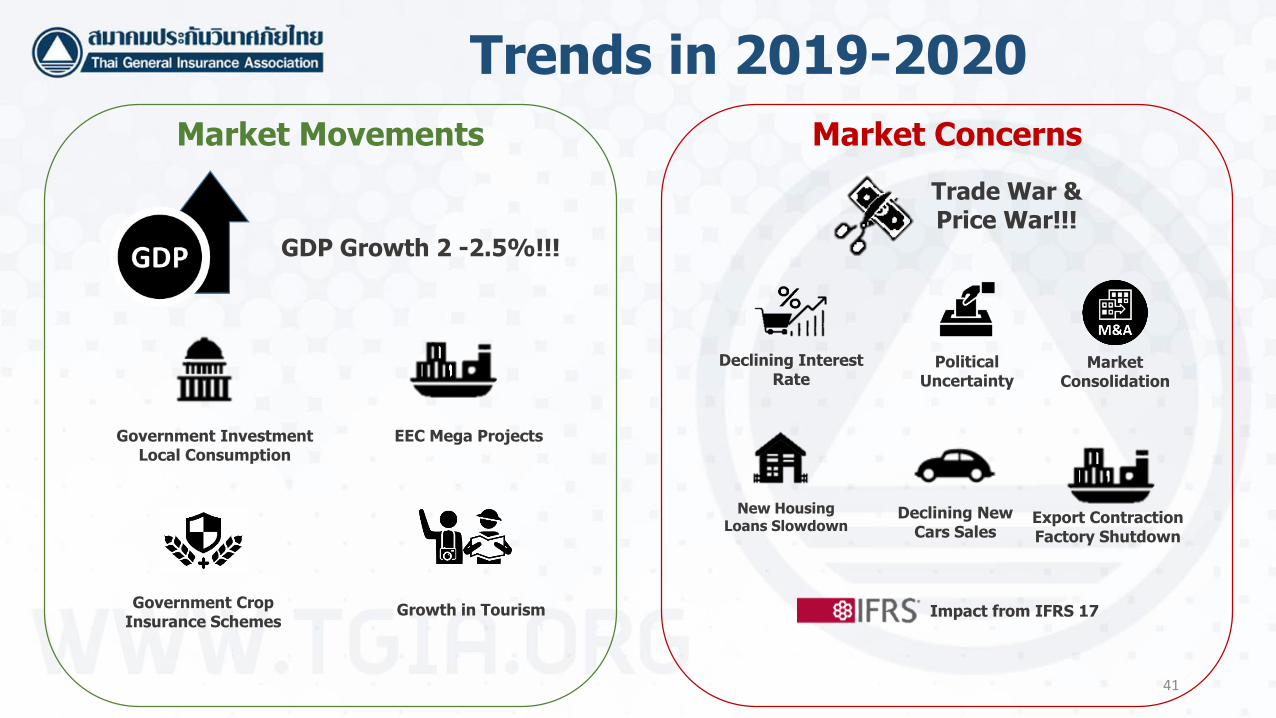
Trends in 2019-2020
Market Movements Market Concerns
EEC Mega Projects
Declining New Cars Sales
Trade War &Price War!!!
Declining Interest Rate
New Housing Loans Slowdown
41
GDP Growth 2 -2.5%!!!
Government InvestmentLocal Consumption
Impact from IFRS 17Government Crop
Insurance Schemes
Political Uncertainty
Market Consolidation
Growth in Tourism
Export ContractionFactory Shutdown
42
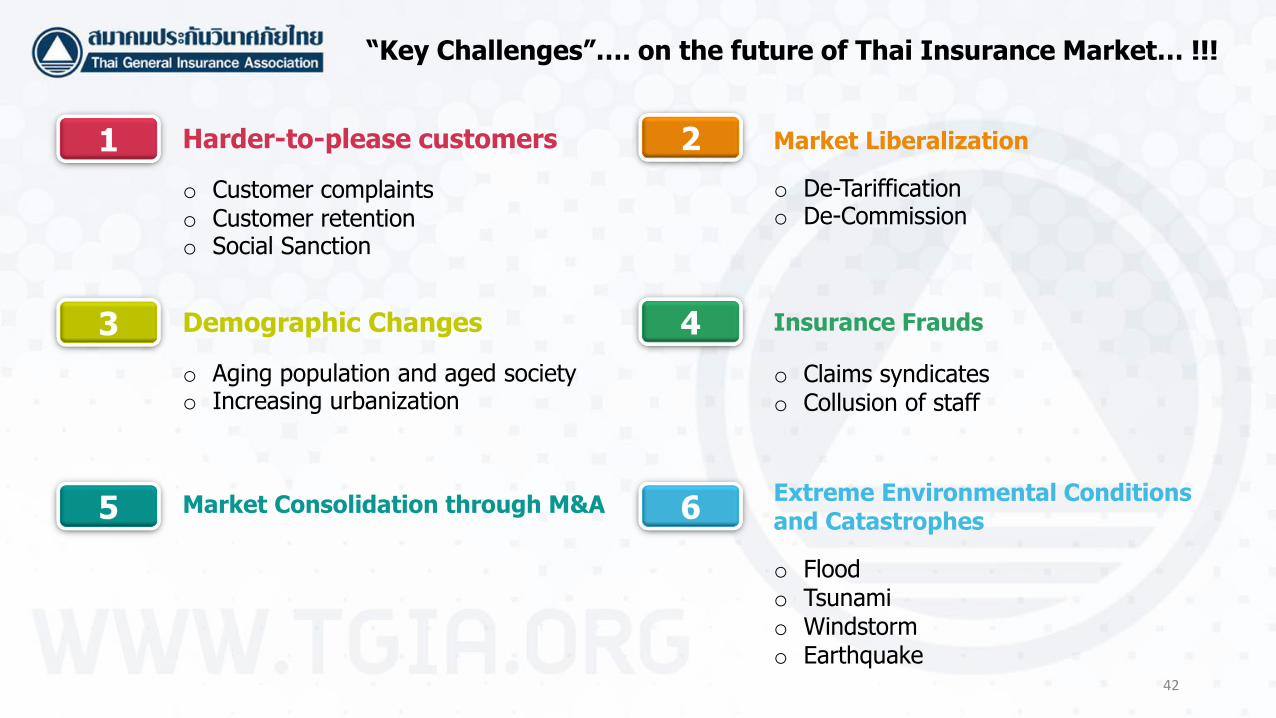
o Flood o Tsunami o Windstormo Earthquake
“Key Challenges”…. on the future of Thai Insurance Market… !!!
1 Harder‐to‐please customers
o Customer complaints o Customer retentiono Social Sanction
3 Demographic Changes
o Aging population and aged societyo Increasing urbanization
2 Market Liberalization
o De-Tarifficationo De-Commission
4 Insurance Frauds
5 Market Consolidation through M&A 6Extreme Environmental Conditions and Catastrophes
o Claims syndicateso Collusion of staff
43
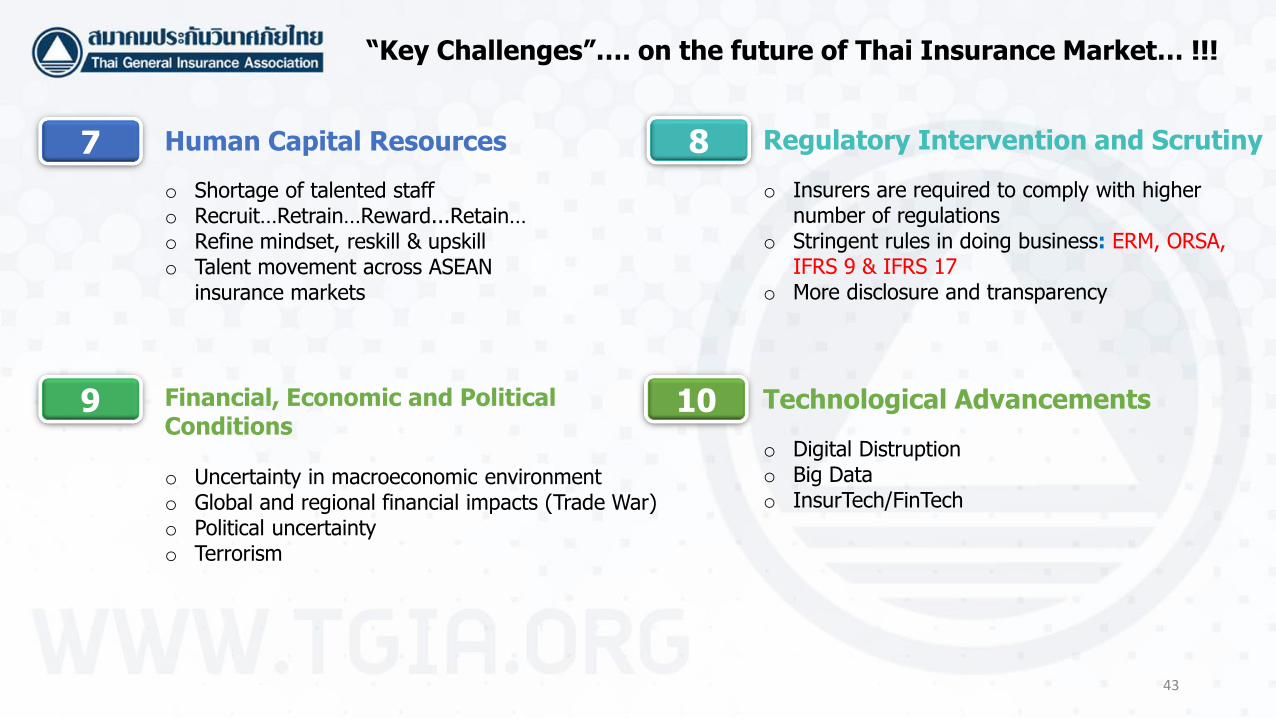
“Key Challenges”…. on the future of Thai Insurance Market… !!!
7 Human Capital Resources
o Shortage of talented staffo Recruit…Retrain…Reward...Retain…o Refine mindset, reskill & upskillo Talent movement across ASEAN
insurance markets
8 Regulatory Intervention and Scrutiny
o Insurers are required to comply with higher number of regulations
o Stringent rules in doing business: ERM, ORSA, IFRS 9 & IFRS 17
o More disclosure and transparency
9 10Financial, Economic and Political Conditions
o Uncertainty in macroeconomic environmento Global and regional financial impacts (Trade War)o Political uncertaintyo Terrorism
Technological Advancements
o Digital Distruptiono Big Datao InsurTech/FinTech

Thank You Very Much
ขอบคณครบ
45