Embed Size (px)
Citation preview
bkdcorporatefinance.com
INSUR ANCE M& A PERSPEC TIVES 2016 & 2017 OUTLOOK
33; 7%
42; 8%
415; 85%
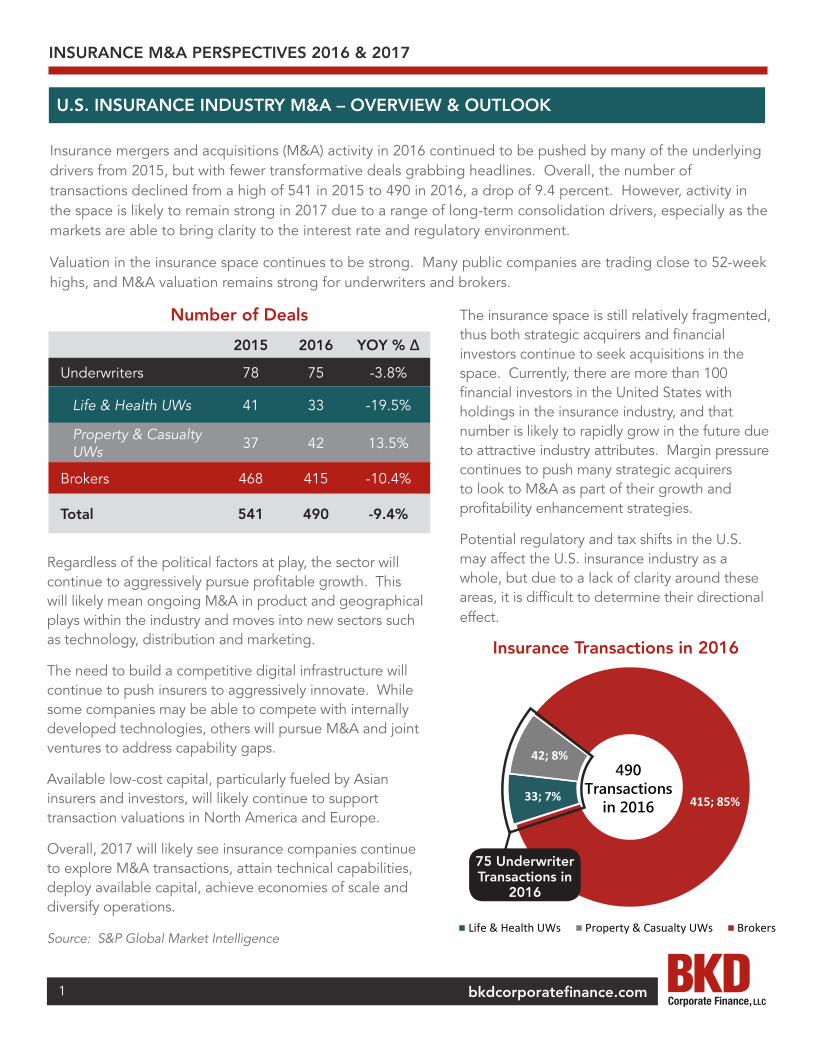
Insurance Transactions in 2016
Life & Health UWs Property & Casualty UWs Brokers
490 Transactions
in 2016
Insurance mergers and acquisitions (M&A) activity in 2016 continued to be pushed by many of the underlying drivers from 2015, but with fewer transformative deals grabbing headlines. Overall, the number of transactions declined from a high of 541 in 2015 to 490 in 2016, a drop of 9.4 percent. However, activity in the space is likely to remain strong in 2017 due to a range of long-term consolidation drivers, especially as the markets are able to bring clarity to the interest rate and regulatory environment.
Valuation in the insurance space continues to be strong. Many public companies are trading close to 52-week highs, and M&A valuation remains strong for underwriters and brokers.
bkdcorporatefinance.com
Number of Deals
2015 2016 YOY % ∆
Underwriters 78 75 -3.8%
Life & Health UWs 41 33 -19.5%
Property & Casualty UWs 37 42 13.5%
Brokers 468 415 -10.4%
Total 541 490 -9.4%
Regardless of the political factors at play, the sector will continue to aggressively pursue profitable growth. This will likely mean ongoing M&A in product and geographical plays within the industry and moves into new sectors such as technology, distribution and marketing.
The need to build a competitive digital infrastructure will continue to push insurers to aggressively innovate. While some companies may be able to compete with internally developed technologies, others will pursue M&A and joint ventures to address capability gaps.
Available low-cost capital, particularly fueled by Asian insurers and investors, will likely continue to support transaction valuations in North America and Europe.
Overall, 2017 will likely see insurance companies continue to explore M&A transactions, attain technical capabilities, deploy available capital, achieve economies of scale and diversify operations.
Source: S&P Global Market Intelligence
The insurance space is still relatively fragmented, thus both strategic acquirers and financial investors continue to seek acquisitions in the space. Currently, there are more than 100 financial investors in the United States with holdings in the insurance industry, and that number is likely to rapidly grow in the future due to attractive industry attributes. Margin pressure continues to push many strategic acquirers to look to M&A as part of their growth and profitability enhancement strategies.
Potential regulatory and tax shifts in the U.S. may affect the U.S. insurance industry as a whole, but due to a lack of clarity around these areas, it is difficult to determine their directional effect.
75 Underwriter Transactions in
2016
Insurance Transactions in 2016
1
INSURANCE M&A PERSPECTIVES 2016 & 2017
U.S. INSURANCE INDUSTRY M&A – OVERVIEW & OUTLOOK
33; 7%
42; 8%
415; 85%
Insurance Transactions in 2016
Life & Health UWs Property & Casualty UWs Brokers
490 Transactions
in 2016
INSURANCE M&A PERSPECTIVES 2016 & 2017
bkdcorporatefinance.com
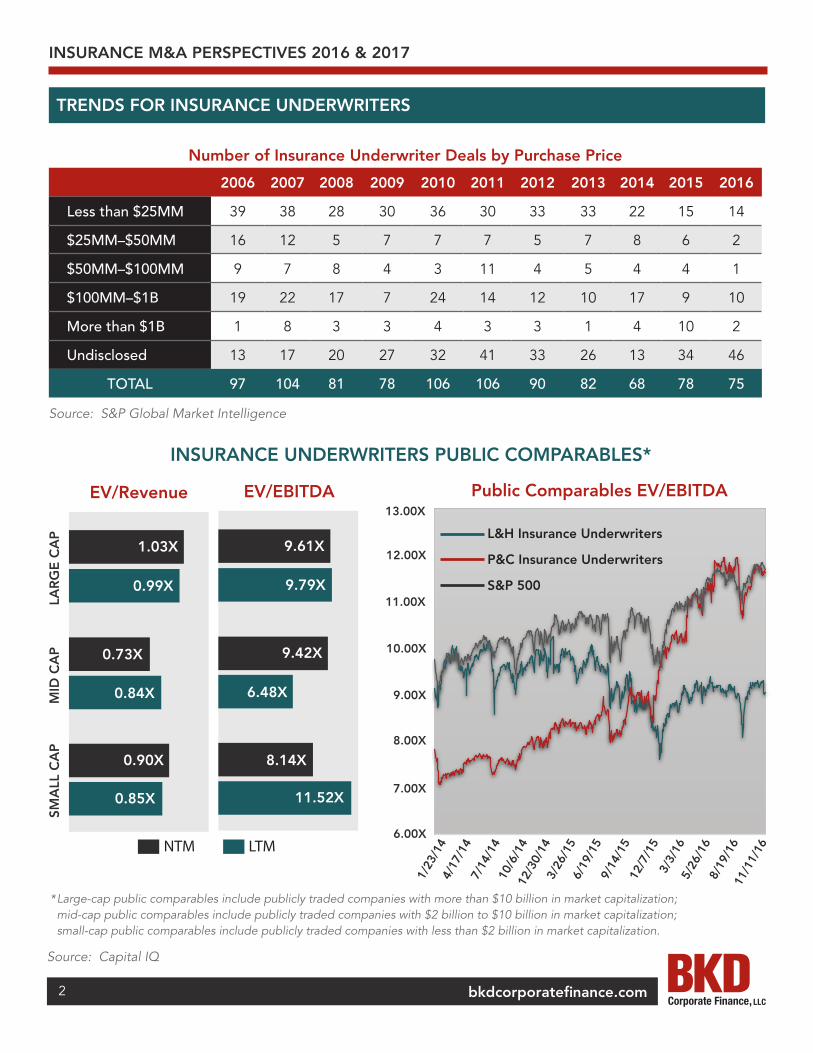
Number of Insurance Underwriter Deals by Purchase Price
2006 2007 2008 2009 2010 2011 2012 2013 2014 2015 2016
Less than $25MM 39 38 28 30 36 30 33 33 22 15 14
$25MM–$50MM 16 12 5 7 7 7 5 7 8 6 2
$50MM–$100MM 9 7 8 4 3 11 4 5 4 4 1
$100MM–$1B 19 22 17 7 24 14 12 10 17 9 10
More than $1B 1 8 3 3 4 3 3 1 4 10 2
Undisclosed 13 17 20 27 32 41 33 26 13 34 46
TOTAL 97 104 81 78 106 106 90 82 68 78 75
Source: S&P Global Market Intelligence
INSURANCE UNDERWRITERS PUBLIC COMPARABLES*
6.00x
7.00x
8.00x
9.00x
10.00x
11.00x
12.00x
13.00x
Public Comparables EV/EBITDAPublic Comparables EV/EBITDA
L&H Insurance Underwriters
P&C Insurance Underwriters
S&P 500
13.00X
12.00X
11.00X
10.00X
9.00X
8.00X
7.00X
6.00X
1/23
/14
4/17
/14
7/14
/14
10/6
/14
12/3
0/14
3/26
/15
6/19
/15
9/14
/15
12/7
/15
3/3/
165/
26/1
68/
19/1
611
/11/
16
EV/EBITDAEV/Revenue
LAR
GE
CA
PM
ID C
AP
SMA
LL C
AP
1.03X
0.99X
0.73X
0.84X
0.90X
0.85X
9.61X
9.79X
9.42X
6.48X
8.14X
11.52X
* Large-cap public comparables include publicly traded companies with more than $10 billion in market capitalization; mid-cap public comparables include publicly traded companies with $2 billion to $10 billion in market capitalization; small-cap public comparables include publicly traded companies with less than $2 billion in market capitalization.
Source: Capital IQ
2
TRENDS FOR INSURANCE UNDERWRITERS
NTM LTM
bkdcorporatefinance.com
TRENDS FOR INSURANCE UNDERWRITERS
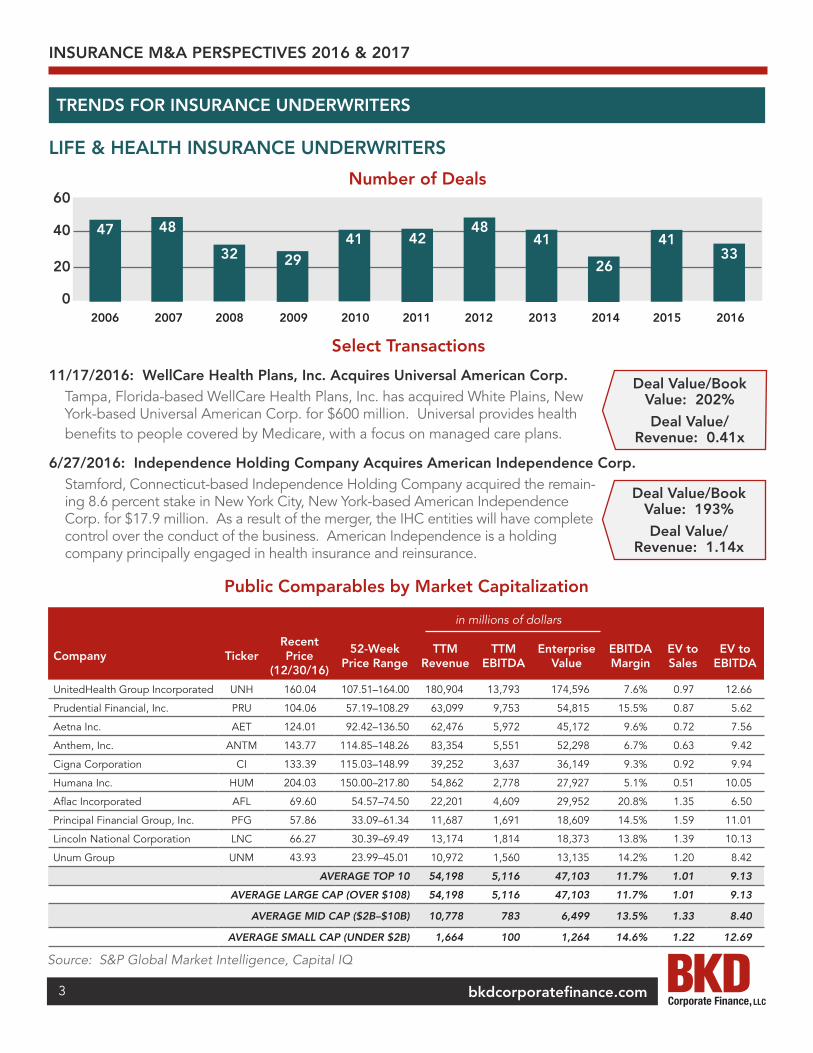
LIFE & HEALTH INSURANCE UNDERWRITERS
3341
26
4148
42412932
4847
2006 2007 2008 2009 2010 2011 2012 2013 2014 2015 2016
60
40
20
0
Number of Deals
11/17/2016: WellCare Health Plans, Inc. Acquires Universal American Corp.Tampa, Florida-based WellCare Health Plans, Inc. has acquired White Plains, New York-based Universal American Corp. for $600 million. Universal provides health benefits to people covered by Medicare, with a focus on managed care plans.
6/27/2016: Independence Holding Company Acquires American Independence Corp.Stamford, Connecticut-based Independence Holding Company acquired the remain-ing 8.6 percent stake in New York City, New York-based American Independence Corp. for $17.9 million. As a result of the merger, the IHC entities will have complete control over the conduct of the business. American Independence is a holding company principally engaged in health insurance and reinsurance.
Select Transactions
Deal Value/Book Value: 202%
Deal Value/Revenue: 0.41x
Deal Value/Book Value: 193%
Deal Value/Revenue: 1.14x
in millions of dollars
Company TickerRecent Price
(12/30/16)
52-Week Price Range
TTM Revenue
TTM EBITDA
Enterprise Value
EBITDA Margin
EV to Sales
EV to EBITDA
UnitedHealth Group Incorporated UNH 160.04 107.51–164.00 180,904 13,793 174,596 7.6% 0.97 12.66
Prudential Financial, Inc. PRU 104.06 57.19–108.29 63,099 9,753 54,815 15.5% 0.87 5.62
Aetna Inc. AET 124.01 92.42–136.50 62,476 5,972 45,172 9.6% 0.72 7.56
Anthem, Inc. ANTM 143.77 114.85–148.26 83,354 5,551 52,298 6.7% 0.63 9.42
Cigna Corporation CI 133.39 115.03–148.99 39,252 3,637 36,149 9.3% 0.92 9.94
Humana Inc. HUM 204.03 150.00–217.80 54,862 2,778 27,927 5.1% 0.51 10.05
Aflac Incorporated AFL 69.60 54.57–74.50 22,201 4,609 29,952 20.8% 1.35 6.50
Principal Financial Group, Inc. PFG 57.86 33.09–61.34 11,687 1,691 18,609 14.5% 1.59 11.01
Lincoln National Corporation LNC 66.27 30.39–69.49 13,174 1,814 18,373 13.8% 1.39 10.13
Unum Group UNM 43.93 23.99–45.01 10,972 1,560 13,135 14.2% 1.20 8.42
AVERAGE TOP 10 54,198 5,116 47,103 11.7% 1.01 9.13
AVERAGE LARGE CAP (OVER $108) 54,198 5,116 47,103 11.7% 1.01 9.13
AVERAGE MID CAP ($2B–$10B) 10,778 783 6,499 13.5% 1.33 8.40
AVERAGE SMALL CAP (UNDER $2B) 1,664 100 1,264 14.6% 1.22 12.69
Public Comparables by Market Capitalization
3
Source: S&P Global Market Intelligence, Capital IQ
INSURANCE M&A PERSPECTIVES 2016 & 2017
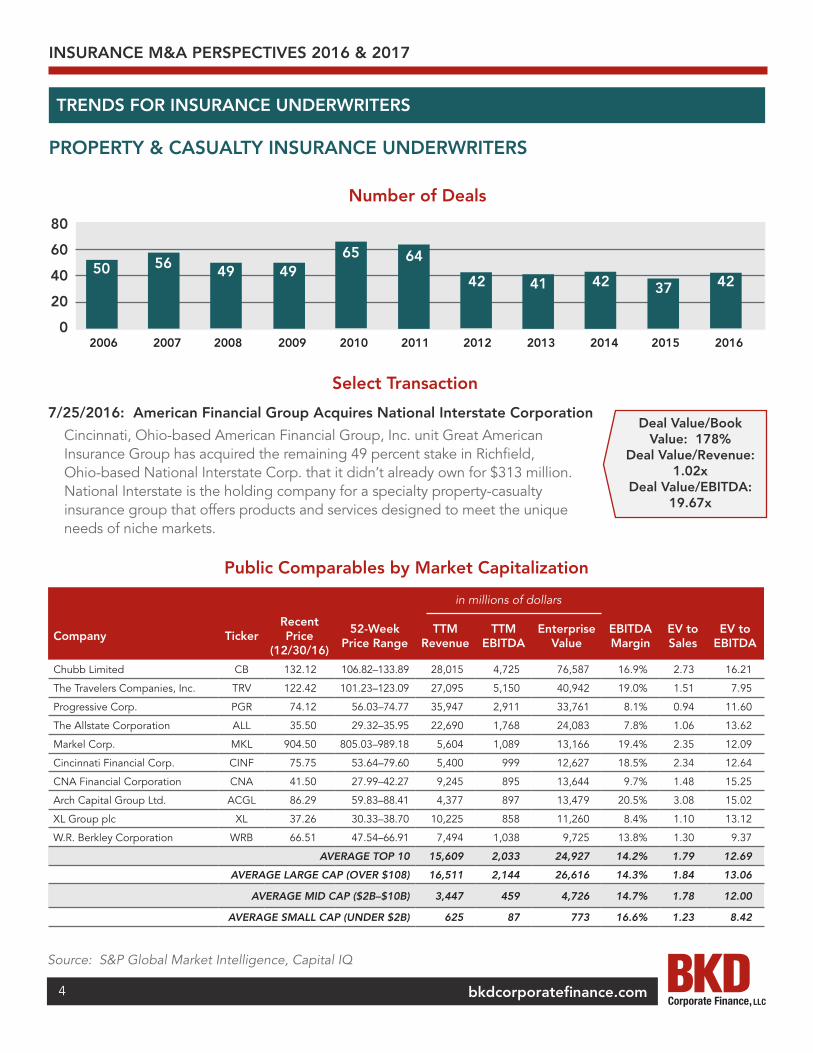
PROPERTY & CASUALTY INSURANCE UNDERWRITERS
bkdcorporatefinance.com
TRENDS FOR INSURANCE UNDERWRITERS
Number of Deals
7/25/2016: American Financial Group Acquires National Interstate Corporation
Cincinnati, Ohio-based American Financial Group, Inc. unit Great American Insurance Group has acquired the remaining 49 percent stake in Richfield, Ohio-based National Interstate Corp. that it didn’t already own for $313 million. National Interstate is the holding company for a specialty property-casualty insurance group that offers products and services designed to meet the unique needs of niche markets.
Select Transaction
Deal Value/Book Value: 178%
Deal Value/Revenue: 1.02x
Deal Value/EBITDA: 19.67x
in millions of dollars
Company TickerRecent Price
(12/30/16)
52-Week Price Range
TTM Revenue
TTM EBITDA
Enterprise Value
EBITDA Margin
EV to Sales
EV to EBITDA
Chubb Limited CB 132.12 106.82–133.89 28,015 4,725 76,587 16.9% 2.73 16.21
The Travelers Companies, Inc. TRV 122.42 101.23–123.09 27,095 5,150 40,942 19.0% 1.51 7.95
Progressive Corp. PGR 74.12 56.03–74.77 35,947 2,911 33,761 8.1% 0.94 11.60
The Allstate Corporation ALL 35.50 29.32–35.95 22,690 1,768 24,083 7.8% 1.06 13.62
Markel Corp. MKL 904.50 805.03–989.18 5,604 1,089 13,166 19.4% 2.35 12.09
Cincinnati Financial Corp. CINF 75.75 53.64–79.60 5,400 999 12,627 18.5% 2.34 12.64
CNA Financial Corporation CNA 41.50 27.99–42.27 9,245 895 13,644 9.7% 1.48 15.25
Arch Capital Group Ltd. ACGL 86.29 59.83–88.41 4,377 897 13,479 20.5% 3.08 15.02
XL Group plc XL 37.26 30.33–38.70 10,225 858 11,260 8.4% 1.10 13.12
W.R. Berkley Corporation WRB 66.51 47.54–66.91 7,494 1,038 9,725 13.8% 1.30 9.37
AVERAGE TOP 10 15,609 2,033 24,927 14.2% 1.79 12.69
AVERAGE LARGE CAP (OVER $108) 16,511 2,144 26,616 14.3% 1.84 13.06
AVERAGE MID CAP ($2B–$10B) 3,447 459 4,726 14.7% 1.78 12.00
AVERAGE SMALL CAP (UNDER $2B) 625 87 773 16.6% 1.23 8.42
Public Comparables by Market Capitalization
4
Source: S&P Global Market Intelligence, Capital IQ
2006 2007 2008 2009 2010 2011 2012 2013 2014 2015 2016
80
60
40
204237424142
646549495650
0
INSURANCE M&A PERSPECTIVES 2016 & 2017
bkdcorporatefinance.com5
Source: S&P Global Market Intelligence
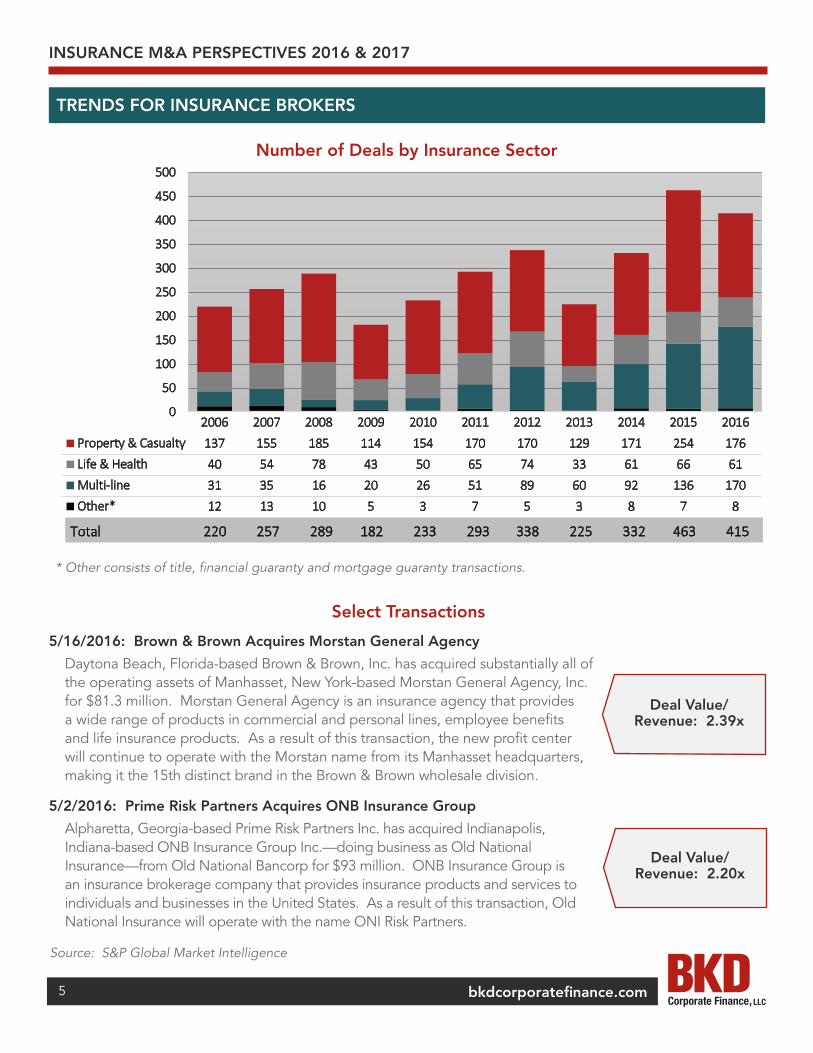
Number of Deals by Insurance Sector
* Other consists of title, financial guaranty and mortgage guaranty transactions.
5/16/2016: Brown & Brown Acquires Morstan General Agency
Daytona Beach, Florida-based Brown & Brown, Inc. has acquired substantially all of the operating assets of Manhasset, New York-based Morstan General Agency, Inc. for $81.3 million. Morstan General Agency is an insurance agency that provides a wide range of products in commercial and personal lines, employee benefits and life insurance products. As a result of this transaction, the new profit center will continue to operate with the Morstan name from its Manhasset headquarters, making it the 15th distinct brand in the Brown & Brown wholesale division.
5/2/2016: Prime Risk Partners Acquires ONB Insurance Group
Alpharetta, Georgia-based Prime Risk Partners Inc. has acquired Indianapolis, Indiana-based ONB Insurance Group Inc.—doing business as Old National Insurance—from Old National Bancorp for $93 million. ONB Insurance Group is an insurance brokerage company that provides insurance products and services to individuals and businesses in the United States. As a result of this transaction, Old National Insurance will operate with the name ONI Risk Partners.
Select Transactions
Deal Value/Revenue: 2.39x
Deal Value/Revenue: 2.20x
INSURANCE M&A PERSPECTIVES 2016 & 2017
TRENDS FOR INSURANCE BROKERS
0
50
100
150
200
250
300
350
400
450
500
2006 2007 2008 2009 2010 2011 2012 2013 2014 2015 2016Property & Casualty 137 155 185 114 154 170 170 129 171 254 176Life & Health 40 54 78 43 50 65 74 33 61 66 61Multi-line 31 35 16 20 26 51 89 60 92 136 170Other* 12 13 10 5 3 7 5 3 8 7 8
Number of Deals by Insurance Sector
220Total 257 289 182 233 293 338 225 332 463 415
9.00x
10.00x
11.00x
12.00x
13.00x
14.00x
15.00x
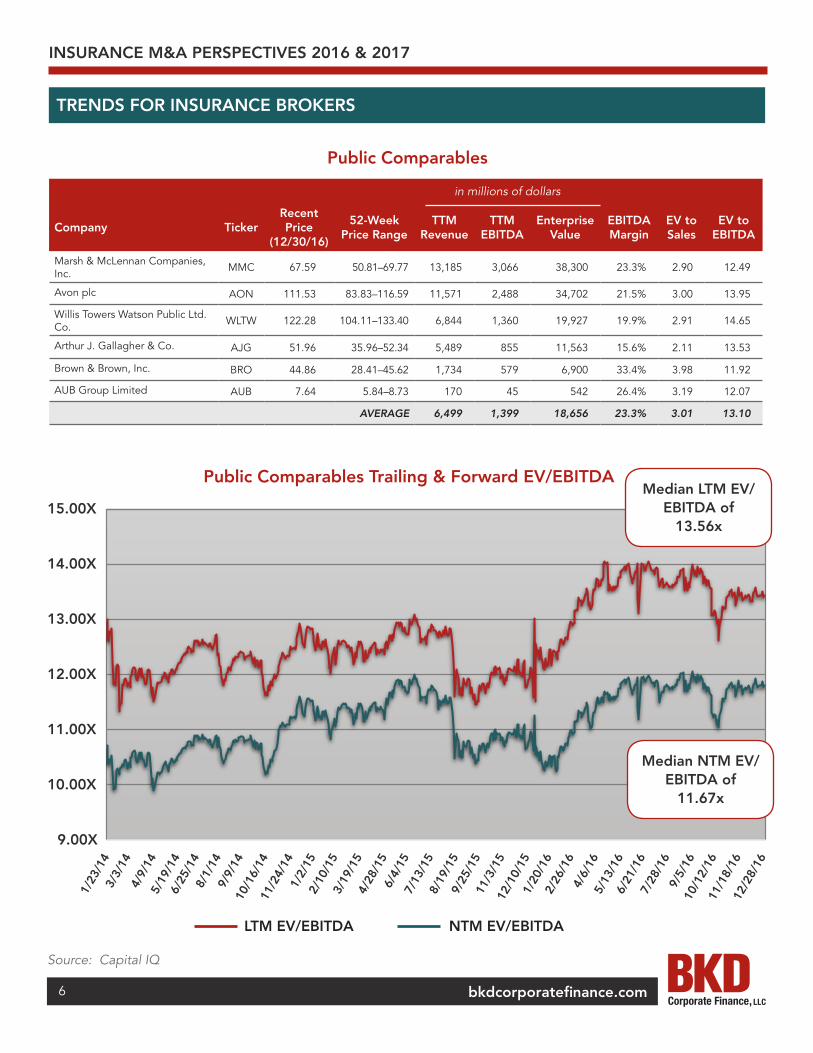
Public Comparables Trailing & Forward EV/EBITDA
LTM EV/EBITDA NTM EV/EBITDA
bkdcorporatefinance.com
in millions of dollars
Company TickerRecent Price
(12/30/16)
52-Week Price Range
TTM Revenue
TTM EBITDA
Enterprise Value
EBITDA Margin
EV to Sales
EV to EBITDA
Marsh & McLennan Companies, Inc. MMC 67.59 50.81–69.77 13,185 3,066 38,300 23.3% 2.90 12.49
Avon plc AON 111.53 83.83–116.59 11,571 2,488 34,702 21.5% 3.00 13.95
Willis Towers Watson Public Ltd. Co. WLTW 122.28 104.11–133.40 6,844 1,360 19,927 19.9% 2.91 14.65
Arthur J. Gallagher & Co. AJG 51.96 35.96–52.34 5,489 855 11,563 15.6% 2.11 13.53
Brown & Brown, Inc. BRO 44.86 28.41–45.62 1,734 579 6,900 33.4% 3.98 11.92
AUB Group Limited AUB 7.64 5.84–8.73 170 45 542 26.4% 3.19 12.07
AVERAGE 6,499 1,399 18,656 23.3% 3.01 13.10
Public Comparables
6
Source: Capital IQ
Public Comparables Trailing & Forward EV/EBITDA
LTM EV/EBITDA NTM EV/EBITDA
15.00X
14.00X
13.00X
12.00X
11.00X
10.00X
9.00X
1/23
/14
3/3/
144/
9/14
5/19
/14
6/25
/14
8/1/
149/
9/14
10/1
6/14
11/2
4/14
1/2/
152/
10/1
53/
19/1
54/
28/1
56/
4/15
7/13
/15
8/19
/15
9/25
/15
11/3
/15
12/1
0/15
1/20
/16
2/26
/16
4/6/
165/
13/1
66/
21/1
67/
28/1
69/
5/16
10/1
2/16
11/1
8/16
12/2
8/16
Median LTM EV/EBITDA of
13.56x
Median NTM EV/EBITDA of
11.67x
INSURANCE M&A PERSPECTIVES 2016 & 2017
TRENDS FOR INSURANCE BROKERS
bkdcorporatefinance.com7
A recapitalization transaction can be attractive to owners who wish to sell an equity stake in their business while retaining some ownership and operating control. It also can appeal to those seeking additional capital to accelerate growth. This allows an owner to:
• Sell a majority or minority stake to a financial partner and retain an equity stake
• Identify improvements or changes to potentially increase market value
• Diversify personal wealth by investing sale proceeds while still leading and growing the company
• Mitigate exposure to financial risks and liabilities of ownership
• Benefit from company growth and profitability
• Gain a strong and experienced financial partner to help chart and finance the strategic path for the business
INSURANCE M&A PERSPECTIVES 2016 & 2017
BKD CORPORATE FINANCE INSURANCE EXPERIENCE
The undersigned acted as financial advisor to Integrity Marketing Group LLC
in this transaction
has received an equity growth investment from
SERVICE OFFERING HIGHLIGHT: PRIVATE EQUITY RECAPITALIZATIONS
The BKDCF team was instrumental in helping us
prepare for and execute this transformational and rewarding
transaction. Finding the right investor that checked all of
the boxes for our rapidly growing company seemed a very
daunting task but the trusting relationship that we built with
BKDCF while exploring our strategic options ensured that
we were working with the right team that always had our
best interests in mind. BKDCF had an excellent
understanding of our business model … I would strongly
recommend the BKDCF team for any business owner
exploring their liquidity or growth capital options.
Integrity Marketing GroupManaging Partner
Bryan Adams
bkdcorporatefinance.com8
Tony GiordanoPresident & Managing DirectorDenver, [email protected]
Jason CorsonSenior Vice PresidentSpringfield, [email protected]
Wyatt JenkinsVice PresidentSpringfield, [email protected]
BKD CORPORATE FINANCE – FULL-SERVICE, MIDDLE-MARKET INVESTMENT BANK
The professionals of BKD Corporate Finance, LLC have more than 100 years of combined experience helping company owners plan for and execute their growth and exit strategies. From managing a company sale to negotiating the acquisition of a competitor or raising debt and equity capital to improve financial and operational flexibility, BKD Corporate Finance can help you develop a course of action for achieving your goals.
BKDCF Offices
ABOUT BKD CORPORATE FINANCE
BKD Corporate Finance, LLC, a wholly owned subsidiary of BKD, LLP, helps companies and stockholders go beyond their numbers by creating value through corporate finance solutions that include mergers, acquisitions, sales, recapitalizations, management buyouts and financings.
Founded in 1994, BKD Corporate Finance is staffed with experienced corporate finance specialists, investment bankers and financial analysts. In addition, the firm draws on the resources of BKD with its network of accountants, auditors, tax professionals, business consultants and industry-specific consultants.
BKD Corporate Finance is a member of the Financial Industry Regulatory Authority and the Securities Investor Protection Corporation.
INDUSTRY FOCUS
Financial Services
Health Care
Manufacturing & Distribution
Business Services
Construction & Engineering
Consumer Services & Products
Energy & Natural Resources
Technology
INSURANCE M&A PERSPECTIVES 2016 & 2017
CONTACT US – INSURANCE TEAM
© 2017 BKD, LLP 4/17