Embed Size (px)
Citation preview

INSURANCE , ADMINISTRATION
2013 Report on the Effect of Competitive Rating on the Insurance
Markets in Maryland
. October 15, 2013
Maryland Insurance Administration
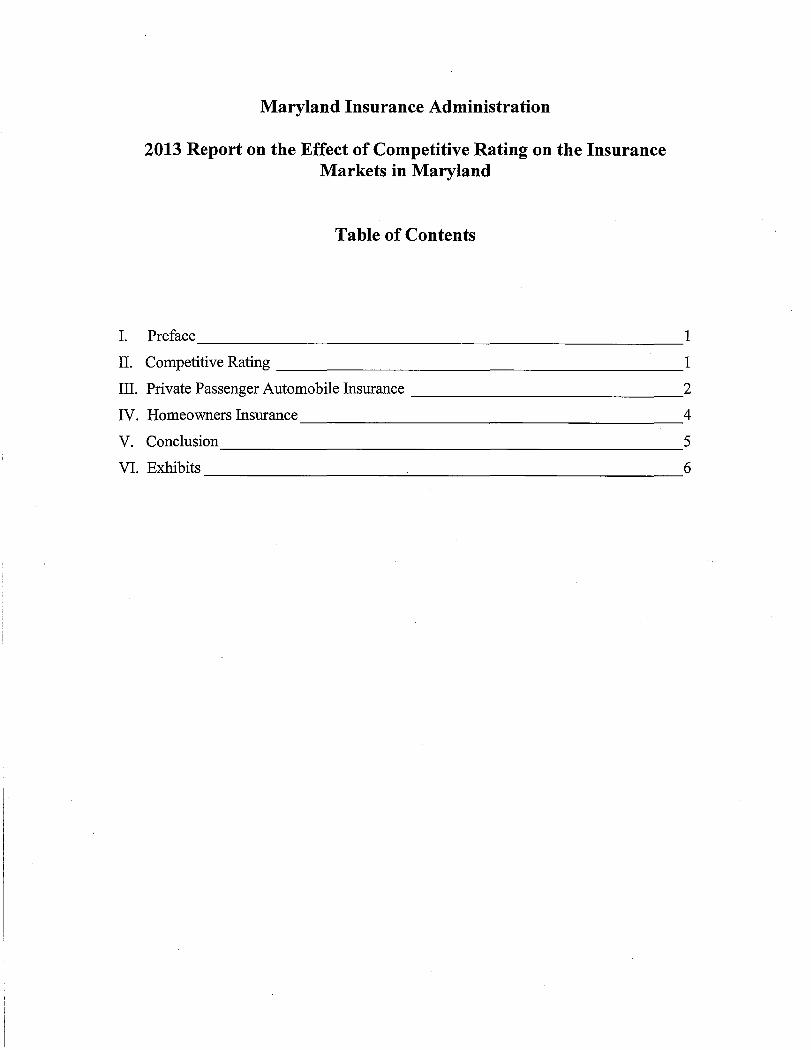
2013 Report on the Effect of Competitive Rating on the Insurance Markets in Maryland
Table of Contents
I. Prefuce ___________________________________________________ l
II. Competitive Rating 1
III. Private Passenger Automobile Insurance 2
IV. Homeowners Insurance 4
V. Conclusion 5
VI. Exhibits ________________________ 6

I. Preface
Each year, the Maryland Insurance Commissioner ("Commissioner") is required to report
to the Governor and the General Assembly on the effect of competitive rating on the insurance
markets in the State. (See Ins. Art. §11-338) This report summarizes Maryland's competitive
rating law and provides information on competitiveness in two of the most important insurance
markets for consumers, private passenger automobile insurance and homeowners insurance, for
calendar year 2012.
II. Competitive Rating
The InsuranceReform Act of 1995 (BB 923, Competitive Rating) authorized insurers to
use rates for certain lines of property and casualty insurance without the prior approval of the
Commissioner. Each authorized insurer and each rating organization designated by an insurer
for the filing of rates must file with the Commissioner all rates and supplementary rate
information as well as any changes to rates or supplementary rate information on or before the
date they become effective. (See Ins. Art. § 11-307) Rates may not be excessive, inadequate, or
unfairly discriminatory. (Ins. Art. § 11-306(b)(1)) Under competitive rating, the Commissioner
may not find a rate to be excessive unless it is unreasonably high for the insurance provided and
the Commissioner has issued a ruling that a reasonable degree of competition does not exist in a
market to which the rate is applicable. (Ins'. Art. § 11-306)
States moved from prior approval of rates to competitive rating to allow insurers to react
quickly to business cycles. When claims experience is favorable, it is anticipated that insurers
generally will act to decrease rates andlor relax underwriting restrictions to increase their market
1
share. When claims experience deteriorates, it is anticipated that insurers generally will act to
increase rates andlor tighten their underwriting standards to accept less risk. Proponents of
competitive rating maintain that competition between insurers prevents excessive rates even
during a downturn in the underwriting business cycle because insurers are not willing to raise
rates to the point where they will lose significant market share to one or more competitors.
Moreover, competition encourages insurers to accept more risks, making insurance widely
available to consumers. Factors relevant to market competitiveness include, among other things,
the number of insurers providing coverage in the market; the market share concentration of those
insurers; and changes in market share of the insurers.
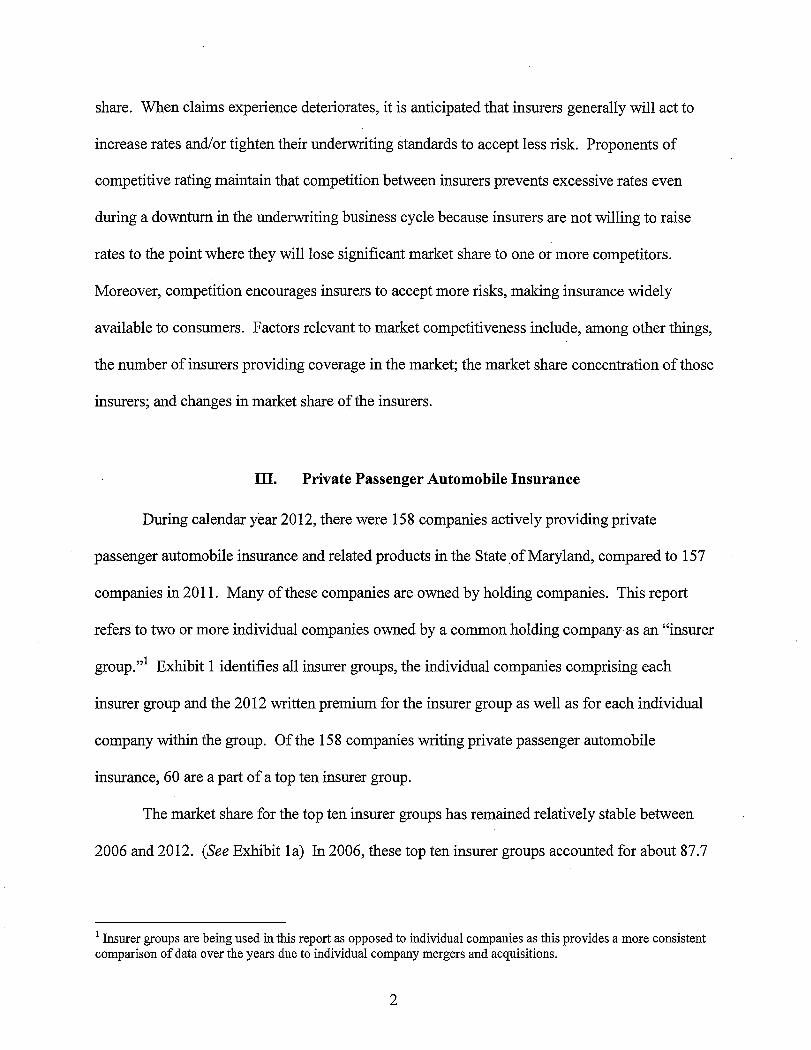
III. Private Passenger Automobile Insurance
During calendar year 2012, there were 158 companies actively providing private
passenger automobile insurance and related products in the State.of Maryland, compared to 157
companies in 2011. Many of these companies are owned by holding companies. This report
refers to two or more individual companies owned by a common holding company as an "insurer
groUp."l Exhibit 1 identifies all insurer groups, the individual companies comprising each
insurer group and the 2012 written premium for the insurer group as well as for each individual
company within the group. Ofthe 158 companies writing private passenger automobile
insurance, 60 are a part of a top ten insurer group.
The market share for the top ten insurer groups has remained relatively stable between
2006 and 2012. (See Exhibit la) In 2006, these top ten insurer groups accounted for about 87.7
1 Insurer groups are being used in this report as opposed to individual companies as this provides a more consistent comparison of data over the years due to individual company mergers and acquisitions.
2

percent of the private passenger automobile insurance market, increasing to about 90.4vercent in
2012.
A commonly accepted measure of market concentration is the Herfindahl-Hirschman
Index (HHI).2 Markets in which the HHI is between 1000 and 1800 points are considered to be
moderately concentrated and those in which the HHI is in excess of 1800 points are considered
to be concentrated. The following chart reflects the number of insurers offering private
passenger automobile insurance in Maryland for the five-year period from 2008 through 2011, as
well as the HHI for each year.
2008 2009 2010 2011 2012
Number 148 151 159 157 158 OfPPA Insurers
HHI 1188 1193 1189 1226 1248
The change in HHI from 2011 to 2012 may be attributable to a one half of one percent
increase in market share for the top three underwriters. Although there has been a modest
change in market concentration, an HHI of 1248 is indicative of a market that remains
moderately concentrated.
In the private passenger automobile insurance market, individuals with risk
characteristics that private passenger automobile insurers are unwilling to accept are able to
obtain coverage from the Maryland Automobile Insurance Fund (MAIF). Another indicator of
the competitiveness of the private passenger automobile insurance market is the market share
2 This is calculated by squaring the market share of each fIrm competing in the market and then summing the resulting numbers. The HHI takes into account the relative size and distribution ofthe fIrms in a market and approaches zero when a market consists of a large number of fIrms of relatively equal size. The HHI increases both as the number of fIrms in the market decreases and as the disparity in size between those fInns increases.
3

held by MAIF. Over the seven-year period from 2006 to 2012, MAIF's market share declined
from approximately 3.7 percent to approximately 1.8 percent. During that same period, market
share for the top insurer groups excluding MAIF increased from approximately 84.1 percent in
2006 to approximately 88.6 percent in 2012. These figures suggest that private passenger
automobile insurers have competed for greater market share by accepting more risk.
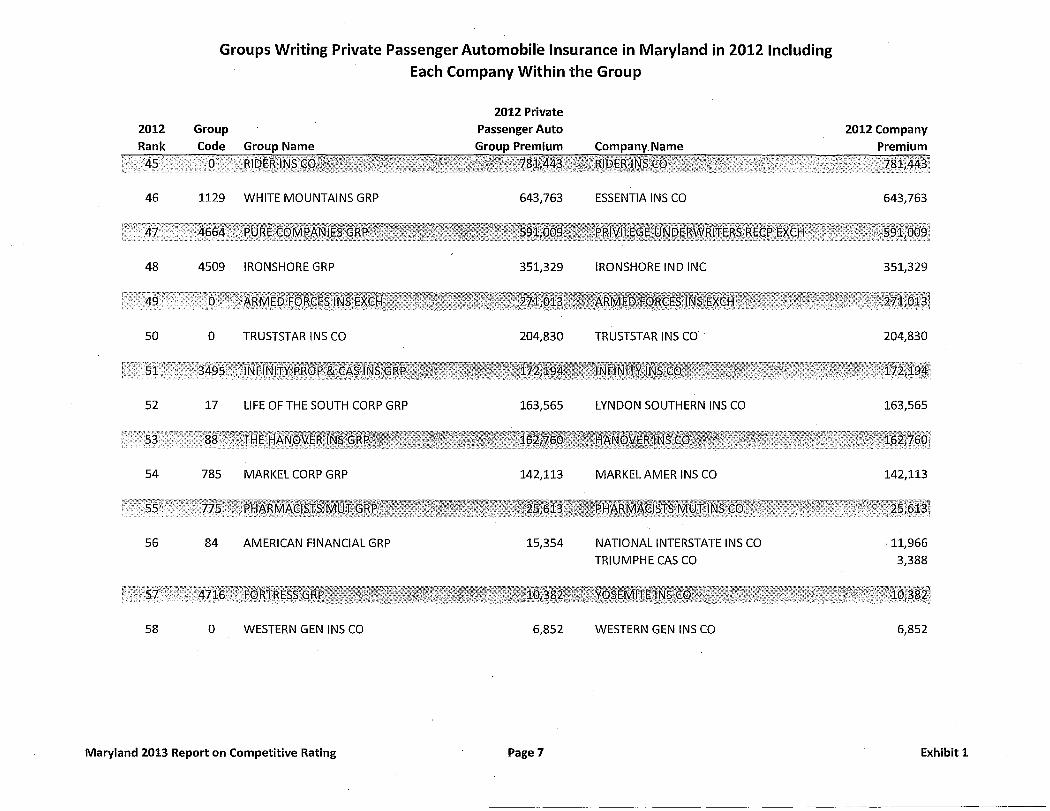
IV. Homeowners Insurance
During calendar year 2012, there were 124 companies actively providing homeowners
insurance in Maryland, c<;>mpared to 119 in 2011. Of the 124 companies actively writing
homeowners insurance, 46 belong to top ten insurer groups. Exhibit 2 identifies all insurer
groups, the individual companies comprising each insurer group and the 2012 written premium
for the insurer group as well as for each individual company within the group.
The market share for the top ten insurer groups remained essentially stable from 2006 (85
percent)3 to 2012 (85.7 percent). (See Exhibit 2a) The following chart reflects the number of
insurers offering homeowners insurance in Maryland for the five-year period from 2008 through
2012, as well as the HHI for each year.4
2008 2009 2010 2011 2012
Number of 117 129 129 119 124 Homeowner Insurers
BBI 1149 1135 1118 1107 1067
3 The top ten insurers have changed since 2006. Most notably, Allianz Insurance Group has fallen to number 11 and Alleghany Group has entered the top 10; therefore, if adding the 2006 market shares of the top ten in Exhibit 2a, the total will be less than 85%. 4 The HHI values for 2008 through 2011 differ slightly from prior years' reports. The HHI values for 2008 and 2009 only reflected the top ten insurers. In 2010 and 2011, one insurer did not report its data properly. The values have been corrected in this report and are accurately reflected in Exhibit 5.
4

An HHI of 1067 indicates the homeowners insurance market in Maryland remains moderately
concentrated.
Another indicator of competition is the percentage of business held by the Joint Insurance
Association ("JIA"), the State's residual property insurer. In 2012, JIA's market share was 0.10
percent, representing an approximately 55 percent reduction from its 2006 market share of 0.22
percent. These figures suggest that homeowners insurers have competed for greater market share
by accepting more risk.
v. Conclusion
When healthy competition exists in the private passenger automobile insurance and
homeowners insurance markets, Maryland insurance consumers have a variety of choices with
respect to insurers, products and pricing. In evaluating the competitiveness of the marketplace,
the MIA takes into consideration the number of insurers in the marketplace, the concentration of
the market shares of those insurers, and the changes in market share that occur over time.
The market share information for 2012 indicates that Maryland's private passenger
automobile insurance and homeowners insurance markets are moderately concentrated. For
private passenger automobile insurance, the number of competitors in the market and a declining
market share for MAIF suggest that this moderately concentrated market is competitive.
Likewise, for homeowners insurance, the number of competitors and small market share for the
residual market are indicators of a competitive market. The MIA will continue to monitor both
markets for changes in market concentration, competitiveness and availability.
5

VI. Exhibits
Exhibit 1: Groups Writing Private Passenger Automobile Insurance in Maryland in 2012
Including Each Company Within the Group
Exhibit la: Comparison of Market Share of the Top Ten Insurer Groups for Private Passenger
Automobile Insurance from 2006 to 2012
Exhibit 2: Groups Writing Homeowners Insurance in Maryland in 2012 Including Each
Company Within the Group
Exhibit 2a: Comparison of Market Share ofthe Top Ten Insurer Groups for Homeowners
Insurance from 2006 to 2012
Exhibit 3a: Maryland Private Passenger Automobile Insurance Written Premium and Market
Share by Insurer Group for 2012
Exhibit 3b: Maryland Homeowners Insurance Written Premium and Market Share by Insurer
Group for 2012
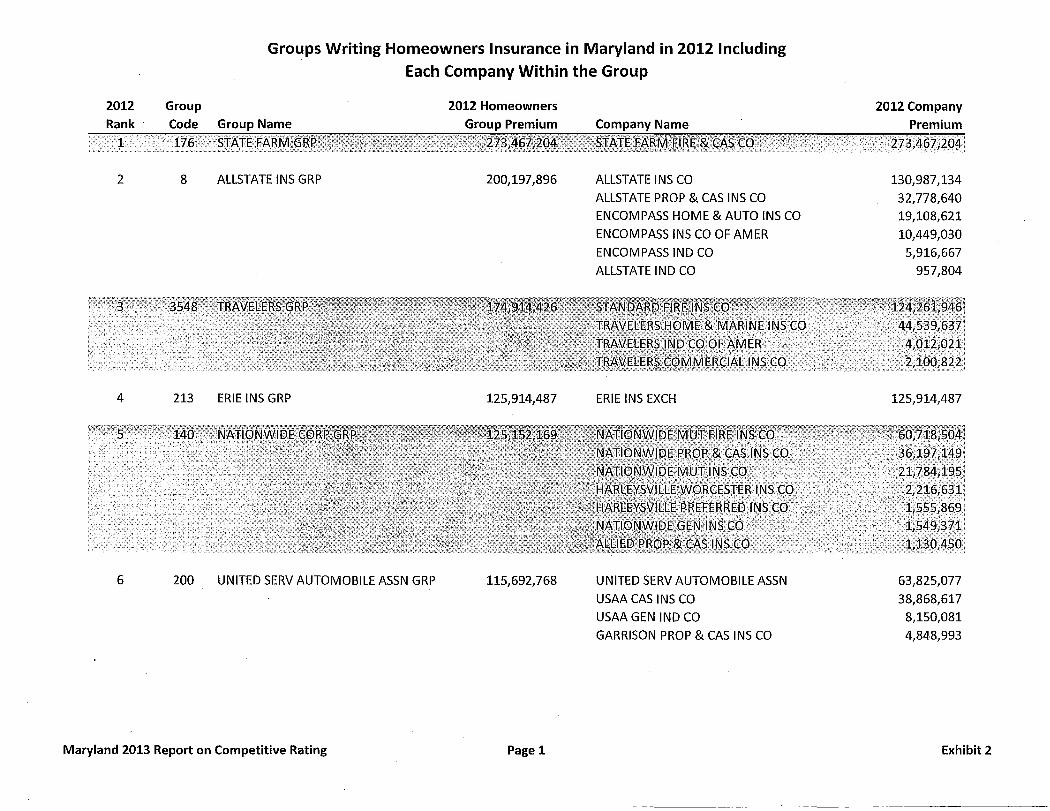
Exhibit 3c: Maryland Homeowners and Private Passenger Automobile Insurance Premium
Written by Insurer Group
Exhibit 3d: Private Passenger Automobile and Homeowners Insurance Written Premium by
Group as a Percentage of Total Written Premium for All Lines
Exhibit 4a: Homeowners, Private Passenger Automobile and All Other Lines ofP & C
Insurance as a Percentage of Total Written Premium from 2003 through 2012
Exhibit 4b: Growth in Written Premium of Homeowners, Private Passenger Automobile, All
Other Lines and Entire P & C Insurance Market from 1999 to 2012
Exhibit 5: HHI Values for Homeowners and Private Passenger Automobile Insurance from 2003
to 2012
6

i Groups Writing Private Passenger Automobile Insurance in Maryland in 2012 Including
2012
2 176 STATE FARM GRP
4 140 NATIONWIDE CORP GRP
Maryland 2013 Report on Competitive Rating
Each Company Within the Group
2012 Private
Passenger Auto
754,830,184
348,784,562
Page 1
STATE FARM MUT AUTO INS CO
STATE FARM FIRE & CAS CO '--
NATIONWIDE MUT INS CO
NATIONWIDE GEN INS CO
NATIONWIDE MUT FIRE INS CO
NATIONWIDE AFFINITY CO OF AMER
TITAN IND CO
AMCO INSCO
NATIONWIDE INS CO OF AMER
HARLEYSVILLE PREFERRED INS CO
VICTORIA FIRE & CAS CO
ALLIED PROP & CAS INS CO
NATIONWIDE PROP & CAS INS CO
NATIONWIDE ASSUR CO
DEPOSITORS INS CO
2012 Company
673,024,118
81,806,066
.. 5;O.3?i046' ··i,8~i,O~·31
117,937,784-
102,700,421
52,261,524-
50,858,140
10,640,895
4,780,698
4,304,217
2,255,946
1,575,067
654,594
502,263
276,777
36,236
Exhibit 1

6
8
Groups Writing Private Passenger Automobile Insurance in Maryland in 2012 Including
Each Company Within the Group
, • < ':::\/:'~F'~~>~ ;<." ~',
...... ,., ~':;;~;<
213 ERIE INS GRP
111 LIBERTY MUT GRP
2012 Private
Passenger Auto
267,418,458
191,574,841
ERIE INS EXCH
ERIE INS CO
LIBERTY MUT FIRE INS CO AMERICAN STATES PREFERRED INS CO
LM GEN INS CO
FIRST LIBERTY INS CORP
SAFECO INS CO OF IL OHIO CAS INS CO MONTGOMERY MUT INS CO
SAFECO INS CO OF AMER
LM INS CORP
LIBERTY INS CORP
WEST AMER INS CO
FIRST NATL INS CO OF AMER
Maryland 2013 Report on Competitive Rating Page 2
2012 Company
Premium
262,815,344
4,603,114
41,876;951: ; 23;483)657: 16;P,4P,~7ij 15,214;990j
.. 1,2521627!
, .... ~oi~41~:i
82,807,779
39,360,570
32,712,801
9,076,558
5,978,650
5,247,304
4,982,584
4,500,454-
4,104,432
1,431,651
1,235,023
137,035
Exhibit 1

2012 Rank
10
12
Groups Writing Private Passenger Automobile Insurance in Maryland in 2012 Including
Each Company Within the Group
2012 Private Group Passenger Auto Code Group Name Group Premium Company Name
3548 TRAVELERS GRP 62,774,829
212 ZURICH INS GRP 27,078,598
TRAVELERS HOME & MARINE INS CO
TRAVELERS IN D CO
TRAVELERS COMMERCIAL INS CO
TRAVELERS IND CO OF AMER
STANDARD FIRE INS CO
TRAVCO INS CO
FOREMOST INS CO GRAND RAPIDS MI
21ST CENTURY CENTENNIAL INS CO
21ST CENTURY N AMER INS CO
FARMERS NEW CENTURY INS CO
21ST CENTURY PREMIER INS CO
TRUCK INS EXCH
MID CENTURY INS CO
21ST CENTURY IND INS CO
FOREMOST PROP & CAS INS CO
Maryland 2013 Report on Competitive Rating Page 3
----------
2012 Company Premium
40,029,190
7,891,545
7,688,152
3,764,258
2,782,870
618,814
... ·.,;1;067,005:
• ···:55.?)o4q;j :i93)553:
7,223,361
6,187,468
5,268,269
3,733,067
2,049,939
1,446,538
774,976
232,774
162,206
Exhibit 1

Groups Writing Private Passenger Automobile Insurance in Maryland in 2012 Including
Each Company Within the Group
2012
Rank
14
16
Group
Code
1278
Group Name
CALIFORNIA STATE AUTO GRP
250 DONEGAL GRP
18 215 KEMPER CORP GRP
20 o BRETHREN MUT INS CO
Maryland 2013 Report on Competitive Rating
2012 Private
Passenger Auto
Group Premium
24,789,714
23,117,985
21,195,464
14,913,497
Page 4
Company Name
KEYSTONE INS CO
AAA MID ATLANTIC INS CO
STATE AUTO PROP & CAS INS CO
PENINSULA INS CO
DONEGAL MUT INS CO
ATLANTIC STATES INS CO
UNITRIN AUTO & HOME INS CO
KEMPER INDEPENDENCE INS CO
UNITRIN DIRECT INS CO
UNITRIN DIRECT PROP & CAS CO
RESPONSE WORLDWIDE INS CO
WARNER INS CO
MERASTAR INS CO
RESPONSE INS CO
BRETHREN MUT INS CO
2012 Company
Premium
23,538,111
1,251,603
11,441,603
17,878,644
2,951,839
2,287,502
14,090,824
3,554,274
1,407,900
873,339
477,418
327,729
292,217
171,763
14,913,497
Exhibit 1

2012
Rank
22
24
26
28
30
32
Groups Writing Private Passenger Automobile Insurance in Maryland in 2012 Including
Each Company Within the Group
Group
Code
271
Group Name
PENNSYLVANIA NATL INS GRP
o PARAMOUNT INS CO
640 MUTUAL BENEFIT GRP
169 SENTRY INS GRP
761 ALLlANZ INS GRP
2538 AMTRUST GMACI MAIDEN GRP
2012 Private
Passenger Auto
Group Premium
11,874,871
9,208,178
8,897,488
6,315,670
4,760,669
3,828,283
Company Name
PENNSYLVANIA NATL MUT CAS INS CO
2012 Company 'Premium
11,874,871
:~~~~lff\ir{1K~.r .. A\~~"''PE1S~;1;f~'~s}€iit,0j11T':;;;1ii;~0tt~,~gS0A';11:rO;S79;7081 Jq'E1V~~INSc()·6FfHES(jufHEAst,·.:/~ j,1;+§t;Q741
PARAMOUNT INS CO
MUTUAL BENEFIT INS CO
DAIRYLAND INS CO
FIREMANS FUND INS CO
NATIONAL SURETY CORP
AMERICAN AUTOMOBILE INS CO
NATIONAL GEN ASSUR CO
NATIONAL GEN INS CO
9,208,178
8,897,488
6,315,670
3,597,214 1,163,477
-22
3,768,978 59,305
Maryland 2013 Report on Competitive Rating PageS Exhibit 1

2012
Rank
'33.
34
36
38
40
42
44
Groups Writing Private Passenger Automobile Insurance in Maryland in 2012 Including
Each Company Within the Group
Group.
Code Group Name
300 HORACE MANN GRP
3478 HALLMARK FIN SERV GRP
408 AMERICAN NATL FIN GRP
54 CUMBERLAND GRP
3098 TOKIO MARINE HOLDINGS INC GRP
361 MUNICH RE GRP
2012 Private
Passenger Auto .
3,496,488
2,652,939
2,100,085
1,878,257
1,340,585
977,454
2012 Company
Premium
..',:,<' '."',726,1324j
?D~~~5<·.i;; ... . •. ', ...................•. ' ...........•...•............. ·.··.·.5 ... 9. 9 ..... , .. ·.~.·. 8 .. ·.3 .• · .• '.·.;,· .. : '.~.' ~:;.'.' ... ::.:: ::~. :" ...•.. ;": .~::.~':: .. ~'C:','" ...
TEACHERS INS CO
HORACE MANN PROP & CAS INS CO
HORACE MANN INS CO
HALLMARK NATL INS CO.
NATIONAL UNION FIRE INS CO OF Pins
UNITED FARM FAMILY INS CO
CUMBERLAND INS CO INC
PHILADELPHIA IND INS CO
AMERICAN MODERN HOME INS CO
AMERICAN FAMILY HOME INS CO
2,054,508
1,354,644-
87,336
2,652,939
1,560
2,100,085
1,878,257
1,340,585
828,625
148,829
Maryland 2013 Report on Competitive Rating Page 6 Exhibit 1
2012
Rank
46
48
50
52
54
56
58
Groups Writing Private Passenger Automobile Insurance in Maryland in 2012 Including
Each Company Within the Group
2012 Private
Group Passenger Auto
Code Group Name Group Premium Company. Name
1129 WHITE MOUNTAINS GRP
4509 IRONSHORE GRP
o TRUSTSTAR INS CO
17 LIFE OF THE SOUTH CORP GRP
785 MARKEL CORP GRP
84 AMERICAN FINANCIAL GRP
o WESTERN GEN INS CO
643,763
351,329
204,830
163,565
142,113
15,354
6,852
ESSENTIA INS CO
IRONSHORE IND INC
TRUSTSTAR INS CO
LYNDON SOUTHERN INS CO
MARKEL AMER INS CO
NATIONAL INTERSTATE INS CO
TRIUMPHE CAS CO
WESTERN GEN INS CO
Maryland 2013 Report on Competitive Rating Page 7
2012 Company
Premium
643,763
351,329
204,830
163,565
142,113
-11,966
3,388
6,852
Exhibit 1

Groups Writing Private Passenger Automobile Insurance in Maryland in 2012 Including
Each Company Within the Group
2012 Private 2012 Group Passenger Auto
Rank Code Group Name Group Premium Company Name
60 313 AEGIS GRP 408 AEGIS SECURITY INS CO
INDUSTRY TOTALS 3,903,685,400
Maryland 2013 Report on Competitive Rating Page 8
2012 Company
Premium
408
Exhibit 1

Comparison of Market Share of the Top Ten Insurer Groups for Private
Passenger Automobile Insurance from 2006 to 2012
25.00% ,--------------------------------------------------------------------------------------------
II'IIGEICO
I!IISTATE FARM
10.07% 9.14% 8.93%
5.28% 6.75% 7.14%
6.06% 6.68% 6.85%
6.06% 5.71% 5.42%
2.92% 4.17% 4.91%
3.10%
!ill TRAVELERS 7% 2.07% 1.91% 1.84% 1.77% 1.61%
Maryland 2013 Report on Competitive Rating Exhibit la
Groups Writing Homeowners Insurance in Maryland in 2012 Including
Each Company Within the Group
2012 Group 2012 Homeowners 2012 Company Rank' Code Group Name Group Premium Company Name Premium
--~~~~~~~~~~~~~~~~~~~~~~~~~~~~~~~~~~~~~~~~~~~~~~ . '1 176." . stATEFARKIi~~RR~;;':';::: ">'H):~;!t~:·~>~,;;.",:;,,;, .. '·.:?:'f:i?7~J4§7:~g.~4 ::;·;;";,~r~Jg'f~~N?lEI~'g';§e;q~X'~C:OX.i;.;" ..... ., \ ····21'3 ,4(:,1 j~04!
2 8 ALLSTATE INS GRP
4 213 ERIE INS GRP 125,914,487
6 200 UNITED SERV AUTOMOBILE ASSN GRP 115,692,768
Maryland 2013 Report on Competitive Rating Page 1
ALLSTATE INS CO
ALLSTATE PROP & CAS INS CO
ENCOMPASS HOME & AUTO INS CO
ENCOMPASS INS CO OF AMER
ENCOMPASS IND CO
ALLSTATE IND CO
ERIE INS EXCH
UNITED SERV AUTOMOBILE ASSN
USAA CAS INS CO
USAA GEN IND CO
GARRISON PROP & CAS INS CO
130,987,134
32,778,640
19,108,621
10,449,030
5,916,667
957,804
125,914,487
63,825,077
38,868,617
8,150,081
4,848,993
Exhibit 2

8 38
10 91
Groups Writing Homeowners Insurance in Maryland in 2012 Including
Each Company Within the Group
CHUBB INC GRP 25,818,568
HARTFORD FIRE & CAS GRP 19,786,522
GREAT NORTHERN INS CO
FEDERAL INS CO
VIGILANT INS CO
PACIFIC IND CO
CHUBB NATL INS CO
HARTFORD INS CO OF THE MIDWEST
SENTINEL INS CO LTD
TWIN CITY FIRE INS CO CO
TRUMBULL INS CO
HARTFORD ACCIDENT & IND CO
HARTFORD CAS INS CO
HARTFORD UNDERWRITERS INS CO
HARTFORD FIRE IN CO
PROPERTY & CAS INS CO OF HARTFORD
Maryland 2013 Report on Competitive Rating Page 2
11,426,784
5,387,548
5,159,445 3,409,569
435,222
13,266,382
2,200,679
1,912,362
1,665,399
329,649 272,358
89,822
47,030
2,841
Exhibit 2

Groups Writing Homeowners Insurance in Maryland in 2012 Including
Each Company Within the Group
2012 Group 2012 Homeowners Rank Code Group Name Group Premium Company Name
12 o BRETHREN MUT INS CO .
14 241 METROPOLITAN GRP
16 175 STATE AUTO MUT GRP
Maryland 2013 Report on Competitive Rating
15,772,341
12,495,027
10,492,795
Page 3
BRETHREN MUT INS CO
METROPOLITAN PROP & CAS INS CO
METROPOLITAN GRP PROP & CAS INS CO
ECONOMY PREMIER ASSUR CO
STATE AUTO PROP & CAS INS CO
2012 Company Premium
·····10,01£)';2141 ·5223773: I. .j "', /:
....... 2,185,3881
........• ;;~::c~.*~~!~l 15,772,341
6,887,785 4,555,850 1,051,392
10,492,795
Exhibit 2

2012
Rank
18
20
22
24
26
28
Groups Writing Homeowners Insurance in Maryland in 2012 Including
Each Company Within the Group
Group
Code
28
242
19
Group Name
AMICA MUT GRP
SELECTIVE INS GRP
ASSURANT INC GRP
640 MUTUAL BENEFIT GRP
271 PENNSYLVANIA NATL INS GRP
4765 WBL GRP
2012 Homeowners
Group Premium
9,192,878
6,886,682
5,779,794
5,591,302
5,106,435
4,485,936
Company Name
AMICA MUT INS CO
SELECTIVE INS CO OF THE SOUTHEAST
SELECTIVE INS CO OF SC
SELECTIVE INS CO OF AMER
AMERICAN BANKERS INS CO OF FL
AMERICAN SECURITY INS CO
STANDARD GUAR INS CO
AMERICAN RELIABLE INS CO
MUTUAL BENEFIT INS CO
PENNSYLVANIA NATL MUT CAS INS CO
FIDELITY NATL PROP & CAS INS CO
Maryland 2013 Report on Competitive Rating Page 4
2012 Company
Premium
9,192,878
3,756,286
3,071,980
58,416
4,594,646
1,034,829
146,242
4,077
5,591,302
5,106,435
4,485,936
Exhibit 2

2012
Rank
30
32
34
36
38
40
42
Groups Writing Homeowners Insurance in Maryland in 2012 Including
Each Company Within the Group
Group
Code
361
Group Name
MUNICH RE GRP
244 CINCINNATI FIN GRP
796 QBE INS GRP
70 FIRST AMER TITLE GRP
o ARMED FORCES INS EXCH
408 AMERICAN NATL FIN GRP
1344 ARX HOLDING CORP GRP
2012 Homeowners
Group Premium
4,029,542
3,202,391
2,779,205
1,991,151
1,516,101
1,399,504
1,031,269
Company Name
AMERICAN MODERN HOME INS CO
AMERICAN FAMILY HOME INS CO
CINCINNATI INS CO
PRAETORIAN INS CO
QBE INS CORP
FIRST AMER PROP & CAS INS CO
HORACE MANN INS CO
ARMED FORCES INS EXCH
UNITED FARM FAMILY INS CO
AMERICAN STRATEGIC INS CORP
Maryland 2013 Report on Competitive Rating Page 5
2012 Company
Premium
3,129,158
900,384
3,202,391
1,945,901
833,304
1,991,151
870,435
1,516,101
1,399,504
1,031,269
Exhibit 2
-------~---~-~ -----------~~~-

Group
Groups Writing Homeowners Insurance in Maryland in 2012 Including
Each Company Within the Group
2012 Homeowners 2012 Company 2012 Rank Code Group Name Group Premium Company Name Premium
44 447 HARFORD GRP 912,964 HARFORD MUT INS CO 912,964
46 71 UNIVERSAL INS CO GRP 654,561 UNIVERSAL N AMER INS CO 654,561
48 o FARMERS MUT FIRE INS CO OF SALEM ( 455,367 FARMERS MUT FIRE INS CO OF SALEM CN 455,367
50 313 AEGIS GRP 300,275 AEGIS SECURITY INS CO 300,275"
52 o WESTMINSTER AMER INS CO 260,603 WESTMINSTER AMER INS CO 260,603
54 o GOODVILLE MUT CAS CO 117,088 GOODVILLE MUT CAS CO 117,088
50 313 AEGIS GRP 300,275 . AEGIS SECURITY INS CO 300,275
Maryland 2013 Report on Competitive Rating Page 6 Exhibit 2

2012
Rank
i' 57'
58
60
Groups Writing Homeowners Insurance in Maryland in 2012 Including
Each Company Within the Group
Group 2012 Homeowners
Code Group Name Group Premium Company Name
65 FM GLOBAL GRP 2,005 AFFILIATED FM INS CO
o CHURCH MUT INS CO 716 CHURCH MUT INS CO
INDUSTRY TOTALS 1,382,143,710
Maryland 2013 Report on Competitive Rating Page 7
2012 Company
Premium
2,005
716
Exhibit 2
------------~ ... -- . __ ...

25.0%
20.0%
15.0%
10.0%
5.0%
0.0%
!III ALLSTATE INS CO
l\1IITRAVELERS
II1II ERIE INS EXCH
I!lI NATIONWIDE
l\1II HARTFORD FIRE & CAS GRP
lmJIA
Comparison of Market Share of the Top Ten Insurer Groups for
Homeowners Insurance from 2006 to 2012
2.4% 2.2% 2.0%
0.4% 0.5% 0.7% 1.0%
1.4% 1.5% 1.5% 1.6%
0.2% 0.1% 0.1%
Maryland 2013 Report on Competitive Rating Page 1 Exhibit 2a
----------------- - - ---

2012
Rank
1
2
3 4
5
6
7 8
9
10
i1 12
13
14
15
16
17
18
19
20
21 22
23 24
25
Maryland Private Passenger Autombile Insurance Written Premium
and Market Share by Insurer Group for 2012
2012
Group
Code
31
176
8
Group Name
BERKSHIRE HATHAWAY GRP
STATE FARM GRP . ALLSTATEINSGRP
140 NATIONWIDE CORP GRP
200 ". UNiTED SERV'AtlfQI\i1QSfLEASSNGRP 213 ERIE INS GRP 155······· PROGRESslvr(jRP··'Fr"';""~i':"· 111 LIBERTY MUT GRP
......... ·······o···I\I1AiF
3548
91
212
o
TRAVELERS GRP HARTFORD FlifE:8rEASGRP·'~x".:
ZURICH INS GRP
AGENCY INscOoFMb
1278 CALIFORNIA STATE AUTO GRP 175 . sf A TEAtJfH"M iJT;Gf{p:T'{~f:;' . 250 DONEGALGRP 241 METROpoHfAN'ciilp'it"iY£' "i"······· ·.·i,·.· .. ···
215 KEMPER CORP GRP . 28AMkA I\I1UT~'RP ','<,T",·,));;"'i:!""
o 4
BRETHREN MUT INS CO AMERiPRISE·FJN'GRP·i:;j:j~·j;i··.
271 PENNSYLVANIA NATL INS GRP 242 .... SELECTI'/EjNS .. · .. ···i,·'·' .. ,·.·,· .. · .. •• o o
PARAMOUNT INS CO E L.EPHANT·fNS:eQi'j .. :::>t;'
2012 Private
Passenger Auto Group
Premium
".847;126,674
754,830,184 ·4Q5:969::2~lti<· •. 348,784,562
'278;9isrO·33········· 267,418,458
·,··c·.,,,,'··"" •• ··,.,.·
191,574,841
2012 Market
Share
21.7%
19.3%
8.9%
7;1%
4.9% . .... ..;>:;>? <69;;~fs8i;65·4~ii;P(fT:. "f?'~::" .•.• 1. 8%
62,774,829 1.6% 1:2%' 0.7%
...•. i .. ·26,4JJ;860·":;;;';·ij;~>7'· '0:7%
24,789,714 0.6% ; ;~;~:~::~:'V "/24j161~553',';,'",
14,913,497 i.iii·i,',! .• ,'>i" •. 'i2~;3ibi71..~,!.'
,~1,481~~~~.0i;~ · 9,208,178
, ......... ,~.~' .. '
0.6% :0.6% .
0.5%
.... ····0;3%
0.3%
'm~3% 0.2%
0.2%'
Maryland 2013 Competitive Rating Report
2012 Cumulative
Market Share
21.7%
41.0% "53.7%1
62.7%
69.8%
76.7%
82:1%:
87.0% . 88:8%1
90.4%
91.6%
92.3%
92.9%1
93.6% 94;2%.
94.8%
95.4%;
95.9% ....... 96.4%'
96.8%
97.4%
97.:7%: 97.9% 98.2%:
Exhibit 3a, Page 1

2012
Rank
26
27 28
29
30
31
32
33
34
35
36
37
38
39
40
41
42
43 44
45 46
47
48
49
50
Maryland Private Passenger Autombile Insurance Written Premium
and Market Share by Insurer Group for 2012
2012
Group
Code
640
38 169
33
761
Group Name
MUTUAL BENEFIT GRP
CHUBB INC
SENTRY INS GRP CALIFORNIACAS'M<3MT
ALLlANZ INS GRP , ........................... ~., .......... .
626 ACE LTD GRP
2538 AMTRUST GMACI MAIDEN GRP 311 MAIN STREI:T AMERIGRP.· '··'·'··"·C""·""·'··
300 244
3478
12
408
HORACE MANN GRP CINONNATiFIN'G'RP" .•
HALLMARK FIN SERV GRP ,. AMERICANINTLGRP
AMERICAN NATL FIN GRP o .. "IFA INsc:c)' 54 CUMBERLAND GRP 57 ... ,. E lECTR k:: TNS'G'R p' ·"';:'·'7·';·:;''f.;lf!\~>:;(:1'"
3098 TOKIO MARINE HOLDINGS INC GRP
19 361 MUNICH RE GRP
o "RIDERINS CO,:.,:;,:' , .................... .
1129 WHITE MOUNTAINS GRP 4664 ... PLj'RECOM'p)\f\rrES:GWp:ft!;'~;tlf;::: , ..:~:~:;>:i}'>:O 4509
o o
IRONSHORE GRP
. ARMED FORCES INS EXCH
TRUsTSTAR INS CO
2012 Private
Passenger Auto Group
Premium
8,897A88 ....... ,; ;"i;584}83S;f':
6,315,670
.··· .. ·.5,728;$35 4,760,669
2012 Market
Share
0.1%
3,828,283 0.1% . 3,597)'814 ••••• W~Gl~}\~~lF;i'···· '0]% 3A96A88
2,652,939
1,878,257 ;;<\.'1; 597;7t~ :;C'}")iPiCti1'j1;7.·'·'
1,340,585 ., ··7;rS~t~'l;'o26j875',.,.
977A54
643,763
204,830
0.1%
;"'0 .. 1% 0.1%
0.0% n'O··:·::O·O%'·'· ..... : . 0
0.0%
0.0%
0.0%
Maryland 2013 Competitive Rating Report
2012 Cumulative
Market Share
98.4% 98,6%]
98.8% 98.9%
99.0%
99;1%.
99.2% 99.3%'
99.4% ...................••.. ,','V
99,5%'
99.6% 99:6%: 99.7%
99.7%
,99.8%
99.8%'
99.9%
99.9%
99.9% 99.9%:
99.9%
10b.O%·'
100.0% ""'100.0%':
100.0%
Exhibit 3a, Page 2

2012
2012 Group Rank Code
51 3495
52 17
53 88
54 785
55 775
56 84
57 ······4716> 58 0
59 ···········289~f
60 313 ..
6i 3678
Maryland Private Passenger Autombile Insurance Written Premium'
and Market Share by Insurer Group for 2012
Group Name INFINITY PROP & CAS INSGRP .
UFEOFTHESOUTHCORPGRP THE HAN 6VER'INS"GRP'''s"",' MARKEL CORP GRP
PHARMACIsTS MU,.:GRP, AMERICAN FINANCIAL GRP . F() RTR E!;K(fFfp'''7;r;':~,;;':;i;iI~;:':~.··
·::::·;'.:i<> ,.' " .•. ... , .. '.s .. · ..... :,
WESTERN GEN INS CO WESTERKrSEffV(ON'fRP;~T:GRP7:';;f .• ···; AEGIS GRP
INDUSTRY TOTALS
2012 Private Passenger Auto Group 2012 Market
Premium Share
163,565
142,113
15,354
408
3,903,685,400
0.0%
0.0%
0.0% r"O,O%'
0.0%
0.0%
Maryland 2013 Competitive Rating Report
2012 Cumulative Market Share
100.0%
100.0% 1()0.0%:
100.0% . 10'0.0%' 100.0% 166:0%1 100.0%
"'100.0%
100.0% 160.0%:
Exhibit 3a, Page 3

2012
2 3 ....
Group
Code
8
·.3548
Group Name
STATE FARM'GRpi
ALLSTATE INS GRP
Maryland Homeowners Insurance Written Premium
and Market Share by Insurer Group for 2012
2012 Homeowners Group Premium
6 200 UNITED SERV AUTOMOBILE ASSN GRP
7111 8 38
12 o BRETHREN MUT INS CO 15,772,341
AMICA MUT GRP 9,192,878
i9 20 242 SELECTIVE INS GRP
21
22 ASSURANT INC GRP 5,779,794
24 640 MUTUAL BENEFIT GRP 5,591,302
26 271 PENNSYLVANIA NATL INS GRP 5,106,435
28 4765 WBLGRP 4,485,936
Maryland 2013 Competitive Rating Report
2012 Market 2012 Cumulative
1.1%
0.7%
0.4%
0.4%
0.4%
0.3%
Market Share ...... '19.8%.
34.3%
73.5% '···'»8O.8%'!
82.6%
85.5%
"'g6:'?%1 87.9%
92.9%
94.0%
94.9%
96.5%
97.1%
Exhibit 3b Page 1

2012
Rank 29···· .
30 ·31'.,·
..
32
33
34 ..... , 35 36
44
48 ···49·
50 r·:;····
51
52
54
Group
Code
4
70
447
313
0
0
MUNICH RE GRP
QBE INS GRP
FIRST AMER TITLE GRP
HARFORD GRP
Maryland Homeowners Insurance Written Premium
and Market Share by Insurer Group for 2012
2012 Homeowners Group
Premium
1,991,151
912,964
FARMERS MUT FIRE INS CO OF SALEM CN 455,367
AEGIS GRP 300,275
WESTMINSTER AMER INS CO 260,603
GOODVILLE MUT CAS CO 117,088
Maryland 2013 Competitive Rating Report
2012 Market 2012 Cumulative
Share
0.1%
0.1%
0.0%
0.0%
0.0%
0.0%
Market Share
97.4%:
97.7%
99.0%
99.7%
99.9% ;99.9%1
99.9%
100.0%
100.0%
Exhibit 3b Page 2

2012
Rank
5S 56 57 58 59
60 ·61·
Group
Code
4663
Group Name
INDUSTRY TOTALS
Maryland 2013 Competitive Rating Report
Maryland Homeowners Insurance Written Premium
and Market Share by Insurer Group for 2012
2012 Homeowners Group
Premium
1,381,859,062
2012 Market 2012 Cumulative
Share Market Share
100.0%:
Exhibit 3b Page 3

Maryland Homeowners and Private Passenger Automobile Insurance Premium Written by Insurer Group
Combined Percent 2012 Homeowners and 2012 Private Private
Combined Group Private Passenger 2012 Homeowners Percent Passenger Auto Passenger
Rank Code Group Name Auto Premium Group Premium Homeowners Group Premium Auto <'~' "- '". : .
2 31 BERKSHIRE HATHAWAY GRP 847,126,674 0 0.0% 847,126,674 100.0%
4 140 NATIONWIDE CORP GRP 473,936,731 125,152,169 26.4% 348,784,562 73.6%
10 o MAIF 69,258,654 o 0.0% 69,258,654 100.0%
12 212 ZURICH INS GRP 42,410,216 15,331,618 36.2% 27,078,598 63.8%
Maryland 2013 Report on Competitive Rating Exhibit 3c, Page 1
---------~--- -----~~--------
Maryland Homeowners and Private Passenger Automobile Insurance Premium Written by Insurer Group
2012
Combined
Rank
26
42
46
48
50
Group
Code
4
4774 CLOISTER MUT & WINDSOR MOUNT JOY (
796 QBE INS GRP
57 ELECTRIC INS GRP
70 FIRST AMER TITLE GRP
Maryland 2013 Report on Competitive Rating
Combined
Homeowners and
Private Passenger
Auto Premium
3,844,111
2,779,205
2,144,354
1,991,151
2012 Homeowners Percent
Group Premium Homeowners
3,844,111 100.0%
2,779,205 100.0%
546,635 25.5%
1,991,151 100.0%
2012 Private
Percent
Private
Passenger Auto Passenger
Auto
o 0.0%
o 0.0%
1,597,719 74.5%
o 0.0%
Exhibit 3c, Page 2

Maryland Homeowners and Private Passenger Automobile Insurance Premium Written by Insurer Group
2012
Combined
Rank
58
60
Group
Code Group Name
o FARMERS & MECHANICS MUT INS ASSN C
1129 WHITE MOUNTAINS GRP
Maryland 2013 Report on Competitive Rating
Combined
Homeowners and
Private Passenger
Auto Premium
2012 Homeowners Percent
Group Premium Homeowners
Percent
2012 Private Private
Passenger Auto Passenger
Auto
Exhibit 3c, Page 3

Maryland Homeowners and Private Passenger Automobile Insurance Premium Written by Insurer Group
2012
Combined Group
Rank Code
76 0
Group Name
WESTERN GEN INS CO
INDUSTRY TOTALS
NUMBER OF GROUPS WITH PREMIUM
Number of Groups That Write Both
Number of Groups That Write Only One
Maryland 2013 Report on Competitive Rating
Combined
Homeowners and
Private Passenger
Auto Premium
6,852
5,285,544,462
83
39
Percent
2012 Private Private
2012 Homeowners Percent Passenger Auto Passenger
Group Premium Homeowners Group Premium Auto
0 0.0% 6,852 100.0%
1,381,859,062 26.1% 3,903,685,400 73.9%
61 61
22 22
Exhibit 3c, Page 4

2012 Combined
Rank
30
Group
Private Passenger Automobile and Homeowners Insurance Written Premium by Group
as a Percentage of Total Written Premium for All Lines
Code Group Name
All Lines Written
Premium
Percent of Business That
is Homeowners and
Private Passenger Auto
84 AMERICAN FINANCIAL GRP 34,730,069 0.0%
Maryland 2013 Report on Competitive Rating
Auto only
Exhibit 3d, Page 1

2012
Combined
Rank
60
Private Passenger Automobile and Homeowners Insurance Written Premium by Group
as a Percentage of Total Written Premium for All lines
Group
Code Group Name
313 AEGIS GRP
All Lines Written
Premium
2,385,034
Percent of Business That
is Homeowners and
Private Passenger Auto
12.6%
Maryland 2013 Report on Competitive Rating
Both
Exhibit 3d, Page 2

2012
Combined
Rank
Group
Private Passenger Automobile and Homeowners Insurance Written Premium by Group
as a Percentage of Total Written Premium for All Lines
Percent of Business That
is Homeowners and
Code Group Name
All Lines Written
Premium Private Passenger Auto
~~~
INDUSTRY TOTALS FOR CARRIERS THAT
WRITE AT LEAST ONE OF HOMEOWNERS
OR PRIVATE PASSENGER AUTO
Maryland 2013 Report on Competitive Rating
8,045,983,508 65.7%
Exhibit 3d, Page 3

Homeowners, Private Passenger Automobile and All Other Lines of P & C Insurance as a Percentage of Total Written Premium
from 2003 to 2012
--------_ ... _._ .. _--_._._ ....... -.. __ .. __ ... _-----_ .. _----._._---------_. __ ._ ... _._ ... _-_ .... _-._ .... _._-_ ... _------_ .... _ .. _ .. __ .. _--_ .. _----_._--_. __ ._----_._._.
50.0% ,-------------------------------------------------.---
45.0% -f---·---·...,----·-·---···---·-------··-····--···------·---
40.0%
35.0%
30.0%
25.0%
. 20.0%
15.0%
10.0%
5.0%
0.0%
!Il'lI Homeowners
tmlPPA
II Other Lines
Maryland 2013 Report on Competitive Rating Exhibit 4a
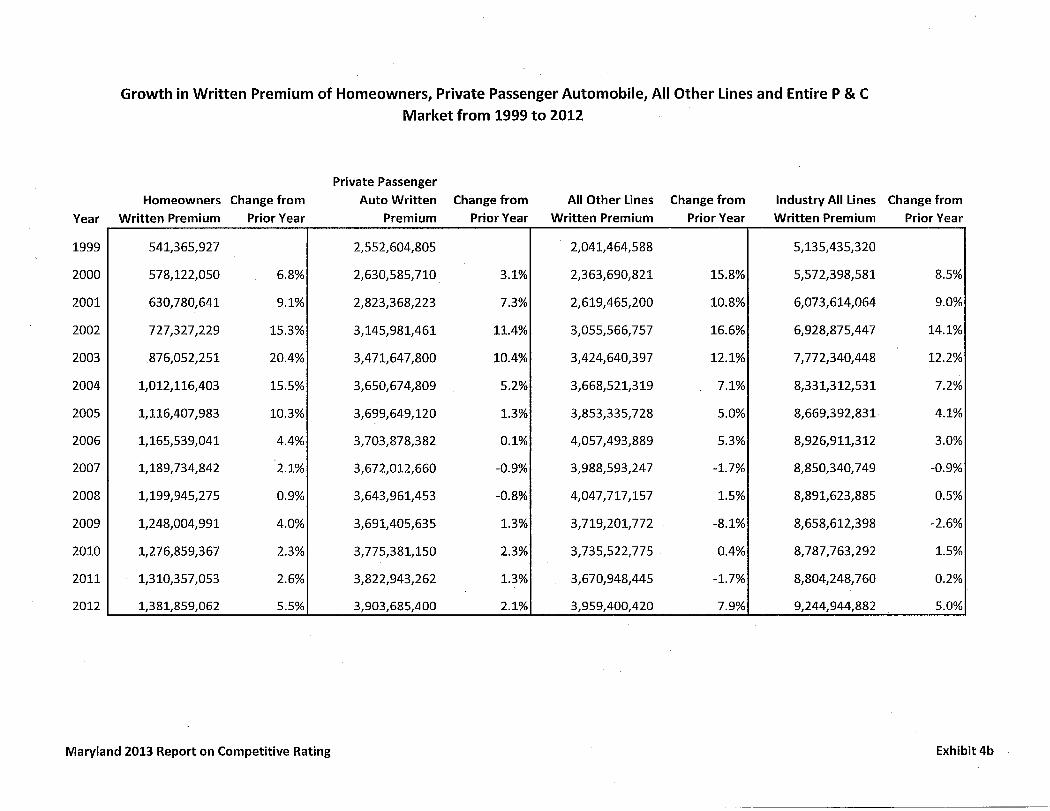
Growth in Written Premium of Homeowners, Private Passenger Automobile, All Other lines and Entire P & C
Market from 1999 to 2012
Private Passenger
Homeowners Change from Auto Written Change from All Other lines Change from Industry All lines Change from
Year Written Premium
1999
2000
2001
2002
2003
2004
2005
2006
2007
2008
2009
2010
2011
2012
541,365,927
578,122,050
630,780,641
727,327,229
876,052,251
1,012,116,403
1,116,407,983
1,165,539,041
1,189,734,842
1,199,945,275
1,248,004,991
1,276,859,367
1,310,357,053
1,381,859,062
Prior Year
6.8%
9.1%
15.3%
20.4%
15.5%
10.3%
4.4%
2.1%
0.9%
4.0%
2.3%
2.6%
5.5%
Maryland 2013 Report on Competitive Rating
Premium
2,552,604,805
2,630,585,710
2,823,368,223
3,145,981,461
3,471,647,800
3,650,674,809
3,699,649,120
3,703,878,382
3,672,012,660
3,643,961,453
3,691,405,635
3,775,381,150
3,822,943,262
3,903,685,400
Prior Year Written Premium Prior Year Written Premium Prior Year
2,041,464,588 5,135,435,320
3.1% 2,363,690,821 15.8% 5,572,398,581 8.5%
7.3% 2,619,465,200 10.8% 6,073,614,064 9.0%
11.4% 3,055,566,757 16.6% 6,928,875,447 14.1%
10.4% 3,424,640,397 12.1% 7,772,340,448 12.2%
5.2% 3,668,521,319 7.1% 8,331,312,531 7.2%
1.3% 3,853,335,728 5.0% 8,669,392,831 4.1%
0.1% 4,057,493,889 5.3% 8,926,911,312 3.0%
-0.9% 3,988,593,247 -1.7% 8,850,340,749 -0.9%
-0.8% 4,047,717,157 1.5% 8,891,623,885 0.5%
1.3% 3,719,201,772 -8.1% 8,658,612,398 -2.6%
2.3% 3,735,522,775 0.4% 8,787,763,292 1.5%
1.3% 3,670,948,445 -1.7% 8,804,248,760 0.2%
2.1% 3,959,400,420 7.9% 9,244,944,882 5.0%
Exhibit 4b

._._._----_._------_ .. _._----_._ ..... _ ...... _ .... _._ ......... _ .. _ ... _ .. _--_ .. _. __ ._----_. __ ._-_._ .. _--------... __ ._._._._--_._ ............ _ .. _ .. _._._._ .. _._ .. _-----------_._---_._------_ .. _-.. -.-.... _ ........ _._ .. _.-... __ .]
HHI Values For Homeowners and Private Passenger Auto From 2003 to I
2012 I
1300 -r-------------------------------------------------------------------------------.--
1250 +---------------------------------------------------------------------
I 1200 +----------------------------------------------------------------------- I'
!
1150 +-- .. --.---.. --....... -..... -.-.---.. --.-.. ----........... -........ --.--.. --.-
1100
1050
1000
950
1101 1098 1162
1053 1084 1168 1180
Maryland 2013 Report on Competitive Rating Exhibit 5