Embed Size (px)
Citation preview
199
ORIGINAL ARTICLE
Acta Medica Indonesiana - The Indonesian Journal of Internal Medicine
Insulin Resistance as One of Indicators for Metabolic Syndrome and Its Associated Factors in Indonesian Elderly
Arya G. Roosheroe, Siti Setiati, Rahmi IstantiDepartment of Internal Medicine, Faculty of Medicine, University of Indonesia – Cipto Mangunkusumo Hospital. Jl. Diponegoro no. 71, Jakarta Pusat 10430, Indonesia. Correspondence mail: [email protected]
ABSTRAK Tujuan: mendapatkan faktor-faktor yang berhubungan dengan resistensi insulin pada usia lanjut di Indonesia.
Metode: penelitian dengan disain cross sectional dilakukan di Poliklinik Usia Lanjut RSCM Jakarta dengan jumlah sampel 172 usia lanjut. Data yang dikumpulkan meliputi karakteristik subyek (usia, jenis kelamin), indeks massa tubuh, lemak tubuh total, lemak subkutan perifer, lemak subkutan trunkal, lingkar pinggang, asupan karbohidrat dan serat, aktivitas fisik, dan konsentrasi 25(OH)D. Besar sampel dihitung dengan rumus besar sample untuk uji hipotesis beda 2 proporsi dan untuk uji hipotesis beda rerata pada 2 kelompok independent. Tingkat kepercayaan yang digunakan 95% dan kekuatan uji 80%. Analisis chisquare dan t-test independent digunakan sebagai analisis bivariat. Analisis statistik regresi logistik digunakan untuk melihat variabel yang paling mempengaruhi resistensi insulin. Batas kemaknaan yang digunakan adalah p<0,05. Hasil: prevalensi resistensi insulin pada penelitian ini didapatkan sebesar 25%. Analisis bivariat mendapatkan adanya hubungan yang bermakna antara usia dan indeks massa tubuh dengan resistensi insulin. Didapatkan pula beda rerata yang bermakna untuk nilai massa lemak, persen massa lemak, lingkar pinggang, lemak subkutan perifer, dan lemak subkutan trunkal. Hasil analisis multivariat mendapatkan hanya lemak subkutan perifer (OR 1,09; 95% CI 1,05-1,15) dan lemak subkutan trunkal (OR 0,93; 95% CI 0,87-0,99) yang berhubungan dengan resistensi insulin pada usia lanjut. Kesimpulan: lemak subkutan perifer dan trunkal berhubungan dengan resistensi insulin pada usia lanjut.
Kata kunci: resistensi insulin, usia lanjut, lemak tubuh.
ABSTRACT Aim: to obtain factors that are associated with insulin resistance in Indonesian elderly. Methods: a cross
sectional study was conducted at the Geriatric Outpatient Clinic of Cipto Mangunkusumo Hopital in 172 elderly patients. Data on subject characteristics (age and sex), body mass index, total body fat, peripheral subcutaneous fat, trunk subcutaneous fat, waist circumference, carbohydrate and fiber intake, physical activity, and 25(OH)D concentration were collected. Sample size was calculated in accordance with the formula of sample size on hypothesis testing for difference of two proportions and hypothesis testing for difference of mean of two independent groups. Significance level of 95% and power of 80% were used. Chi-square analysis and independent t-test were performed. Logistic regression analysis was conducted to recognize the most affecting variables for insulin resistance. P<0.05 was considered as the significance level. Results: we found that the prevalence of insulin resistance among elderly in our study was 25%. Bivariate analysis showed that there was a significant association of age and body mass index with insulin resistance in elderly. There were also significant differences of mean on fat mass, fat mass (%), waist circumference, peripheral subcutaneous fat, trunk subcutaneous fat, which were significantly higher in insulin-resistance group compared to the non-insulin resistance group. Results of multivariate analysis demonstrated that only several factors were correlated to insulin resistance in elderly, that were peripheral subcutaneous fat (OR 1.09; 95% CI 1.05-1.15) and trunk subcutaneous fat (OR 0.93; 95% CI 0.87-0.99). Conclusion: peripheral subcutaneous fat and trunk subcutaneous fat are associated with insulin resistance in elderly.
Key words: insulin resistance, elderly, body fat.
Arya G. Roosheroe Acta Med Indones-Indones J Intern Med
200
INTRODUCTIONAs the number of elderly population in
Indonesia is increasing, various health problems related to the age group will also be increasing. The common elderly health problems are chronic degenerative diseases such as diabetes mellitus, hypertension, dyslipidemia, obesity, and cardiovascular disease. The existence of insulin resistance in elderly is associated with the development of those diseases.1
Insulin resistance is a condition when a normal concentration of insulin inadequately produces normal insulin biological response in lipid, muscle and liver cells. Prevalence of insulin resistance in elderly is approximately 40%.2 Factors suspected to cause insulin resistance in elderly are anthropometric changes, especially decrease of muscle mass accompanied with the increase of body fat (particularly the visceral fat), the decrease of physical activity, hormonal changes, high carbohydrates and low fat intake.3 Vitamin D deficiency is also suspected to be correlated to the condition of insulin resistance.4 The prevalence of vitamin D deficiency in elderly is relatively high. A study conducted by Setiati in Indonesian elderly women found that the prevalence of vitamin D deficiency is 35.1%.5
Metabolic syndrome is a condition in which there are three or more risk factors (low HDL cholesterol, hypertriglyceridemia, obesity, hypertension, and hyperglycemia). Insulin resistance is associated with the condition of metabolic syndrome. Body mass index as the indicator of obesity was found to be correlated to insulin resistance events.6 In elderly, changes in intra-abdominal fat or visceral adipose tissue and liver fat tissue are significantly correlated to the development of insulin resistance.3
Correlation between high carbohydrate intake and the incidence of insulin resistance is still vague; some data suggest that high carbohydrate intake has no effect to the incidence of insulin resistance compared to high fat intake.7 In elderly, there is an overall reduced food intake, which is accompanied with higher carbohydrate intake. It has been demonstrated that calorie restriction has a good effect on preventing altered insulin performance in elderly. It may occur due to reduced accumulation of visceral fat and lower concentration of free fatty acid.8
Physical exercise increases glucose metabolism and prevents the development
of insulin resistance in elderly; however, the mechanism has not been known. Studies on obesity in elderly have revealed that visceral fat is reduced after performing physical exercise and glucose metabolism is increased and it is correlated to prevention of insulin resistance.9
Studies about insulin resistance in elderly are quite rare in Indonesia. There are differences on body fat changes and body mass index in Indonesian elderly compared to the elderly of other countries. Moreover, the food composition in Indonesian elderly has higher carbohydrates intake compared to the fiber intake and there is also a relatively high prevalence of vitamin D deficiency in Indonesian elderly, which encouraged us to conduct a study to find out which factors that may affect insulin resistance in Indonesian elderly.
METHODSA cross sectional study was conducted at
the Geriatric Outpatient Clinic, Department of Internal Medicine, Faculty of Medicine, University of Indonesia, Cipto Mangunkusumo hospital between August 2009 and May 2010. The study population included all elderly patients who had their treatment at the study site. The inclusion criteria were elderly patients aged 60 years or more, and willing to participate in the study. Subjects with chronic kidney disease, liver chronic disease, and pre-existing medication of dyslipidemia, corticosteroid, beta-blocker and thiazide were excluded. Sample size was calculated in accordance with the formula of sample size on hypothesis testing for difference of two proportions and hypothesis testing for difference of mean of two independent groups. Significance level of 95% and 80% power were used. Data collected including subjects characteristics (age, sex), anthropometric characteristics (BMI, total body fat, peripheral subcutaneous fat, trunk subcutaneous fat, and waist circumference), carbohydrate and fiber intake, physical activity, and 25(OH)D concentration.
Measurement MethodsBody weight was measured using the
standing weight scale. Subjects were measured in standing position with minimal clothes, emptied pocket and bare-footed. The measurement was read on the weight scale with precision up to 0.1
Vol 44 • Number 3 • July 2012 Insulin Resistance as One of Indicators for Metabolic Syndrome
201
kg. Knee height was measured with knee-height measurement tool. Subjects were measured in supine position, of the left leg, with tibia and femur angled to 90o, the tool was positioned between heels and until the proximal part to patella bone. Waist circumference was measured using caliper on abdominal area across midline of lowest inferior costae and iliac bone. The measuring tape is positioned as appropriately as possible in a horizontal plane. Subjects were measured in standing position with both feet 20-25 cm apart. Total body fat was measured using Bioelectrical Impedance Analysis (BIA) tool. Subjects were measured in supine position, without pillow, normal clothing and without wearing any metal objects. Four electrodes would be attached to subjects, one in each wrist and dorsum of right hand, ankle and dorsum of right foot. The obtained results were body fat percentage (%) and fat mass (kg).
Peripheral and trunk subcutaneous fat were obtained by measuring 5 regions, i.e. peripheral subcutaneous fat was measured in triceps and thigh region; while trunk subcutaneous fat was measured in subscapular, suprailiac and abdominal region. Insulin resistance was calculated based on HOMA-IR formula. Carbohydrate and fiber intake were collected by taking interview on nutritional history using 24-hour food recall method. The interview results were processed further using the Nutrisurvey program to obtain the values of carbohydrate and fiber intake. Physical activity was measured using the six minute walking test.
Data Analysis Data were analyzed with stata program
version 10.0. Bivariate analysis was performed to evaluate the correlation between independent and dependent variables. Analysis using Chi-Square statistical test was conducted for ordinal scale data and independent t-test was used for ratio-scale data. Multivariate analysis was performed to evaluate which independent variables have the most significant effects on dependent variables. The analysis was conducted using logistic regression statistical test. Significance level of p < 0.05 was applied.
RESULTS There were 172 elderly subjects participating
in the study, with mean age of 71 years, ranging
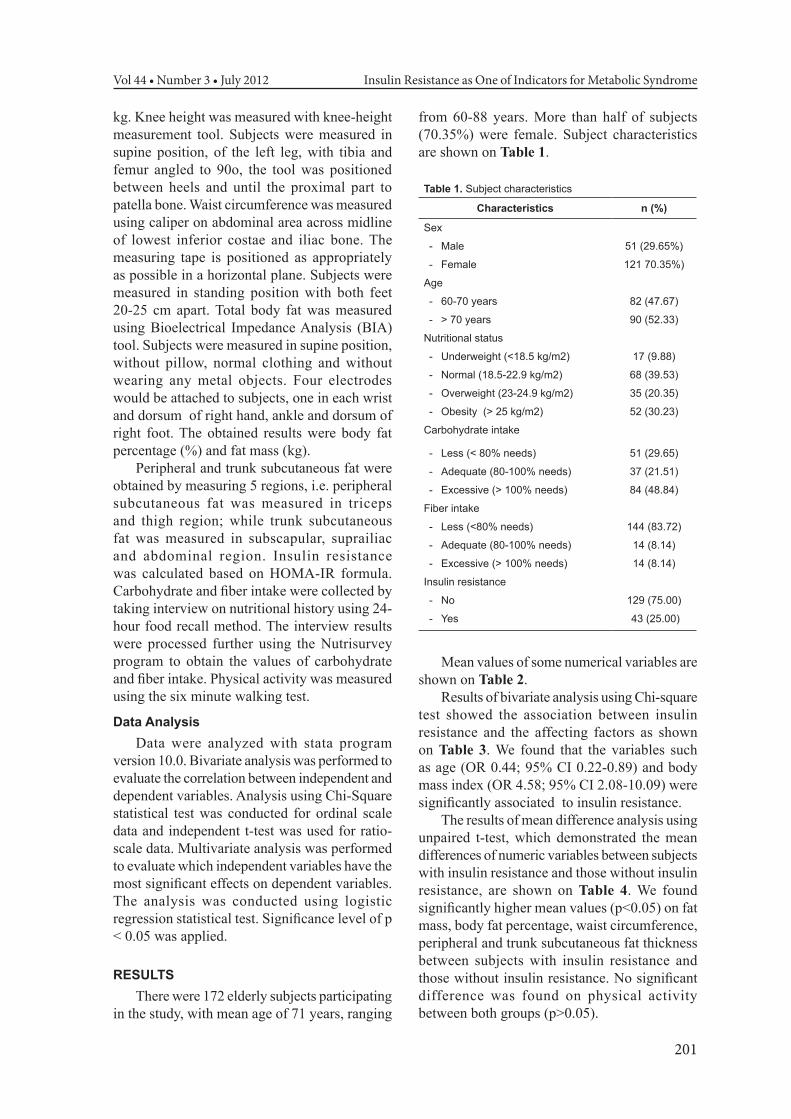
from 60-88 years. More than half of subjects (70.35%) were female. Subject characteristics are shown on Table 1.
Table 1. Subject characteristics
Characteristics n (%)
Sex
- Male 51 (29.65%)
- Female 121 70.35%)
Age
- 60-70 years 82 (47.67)
- > 70 years 90 (52.33)
Nutritional status
- Underweight (<18.5 kg/m2) 17 (9.88)
- Normal (18.5-22.9 kg/m2) 68 (39.53)
- Overweight (23-24.9 kg/m2) 35 (20.35)
- Obesity (> 25 kg/m2) 52 (30.23)
Carbohydrate intake
- Less (< 80% needs) 51 (29.65)
- Adequate (80-100% needs) 37 (21.51)
- Excessive (> 100% needs) 84 (48.84)
Fiber intake
- Less (<80% needs) 144 (83.72)
- Adequate (80-100% needs) 14 (8.14)
- Excessive (> 100% needs) 14 (8.14)
Insulin resistance
- No 129 (75.00)
- Yes 43 (25.00)
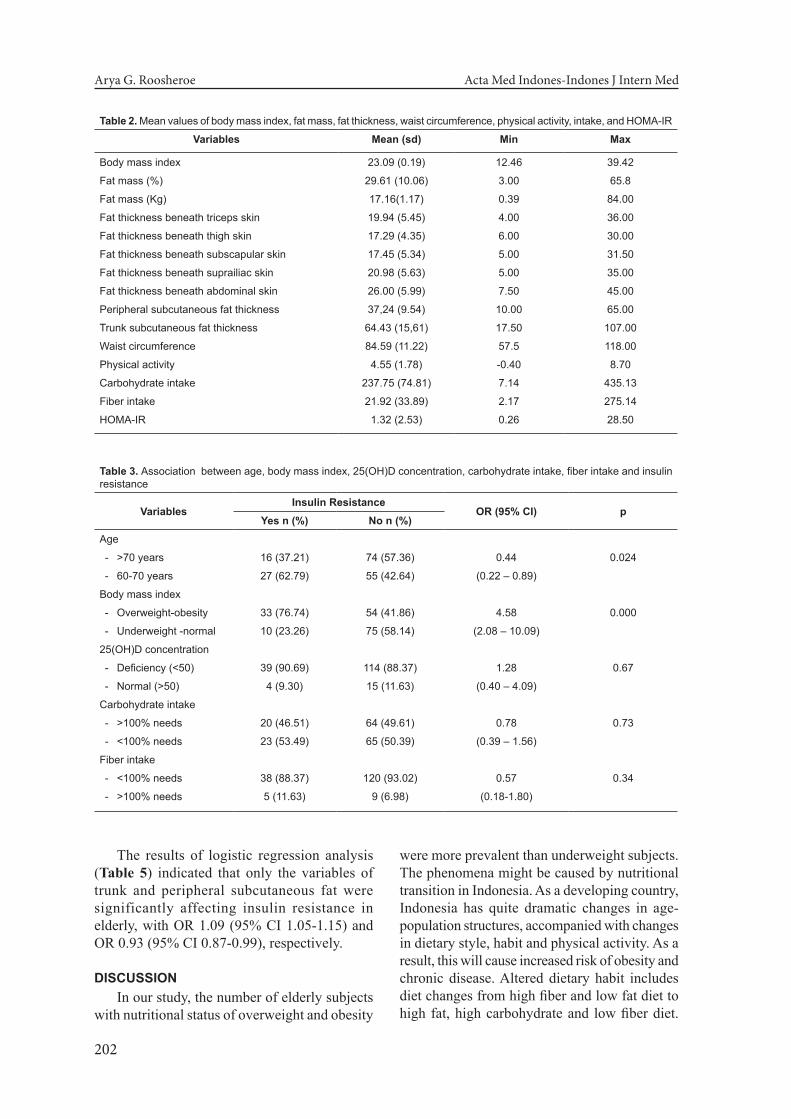
Mean values of some numerical variables are shown on Table 2.
Results of bivariate analysis using Chi-square test showed the association between insulin resistance and the affecting factors as shown on Table 3. We found that the variables such as age (OR 0.44; 95% CI 0.22-0.89) and body mass index (OR 4.58; 95% CI 2.08-10.09) were significantly associated to insulin resistance.
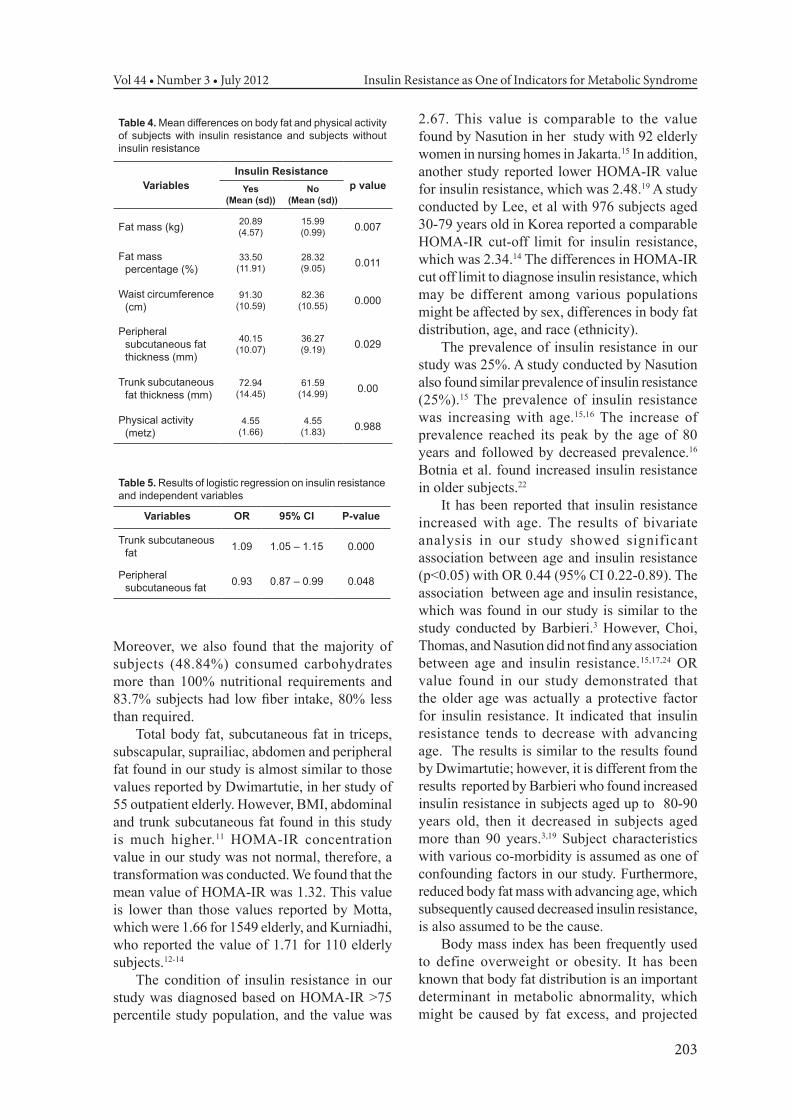
The results of mean difference analysis using unpaired t-test, which demonstrated the mean differences of numeric variables between subjects with insulin resistance and those without insulin resistance, are shown on Table 4. We found significantly higher mean values (p<0.05) on fat mass, body fat percentage, waist circumference, peripheral and trunk subcutaneous fat thickness between subjects with insulin resistance and those without insulin resistance. No significant difference was found on physical activity between both groups (p>0.05).
Arya G. Roosheroe Acta Med Indones-Indones J Intern Med
202
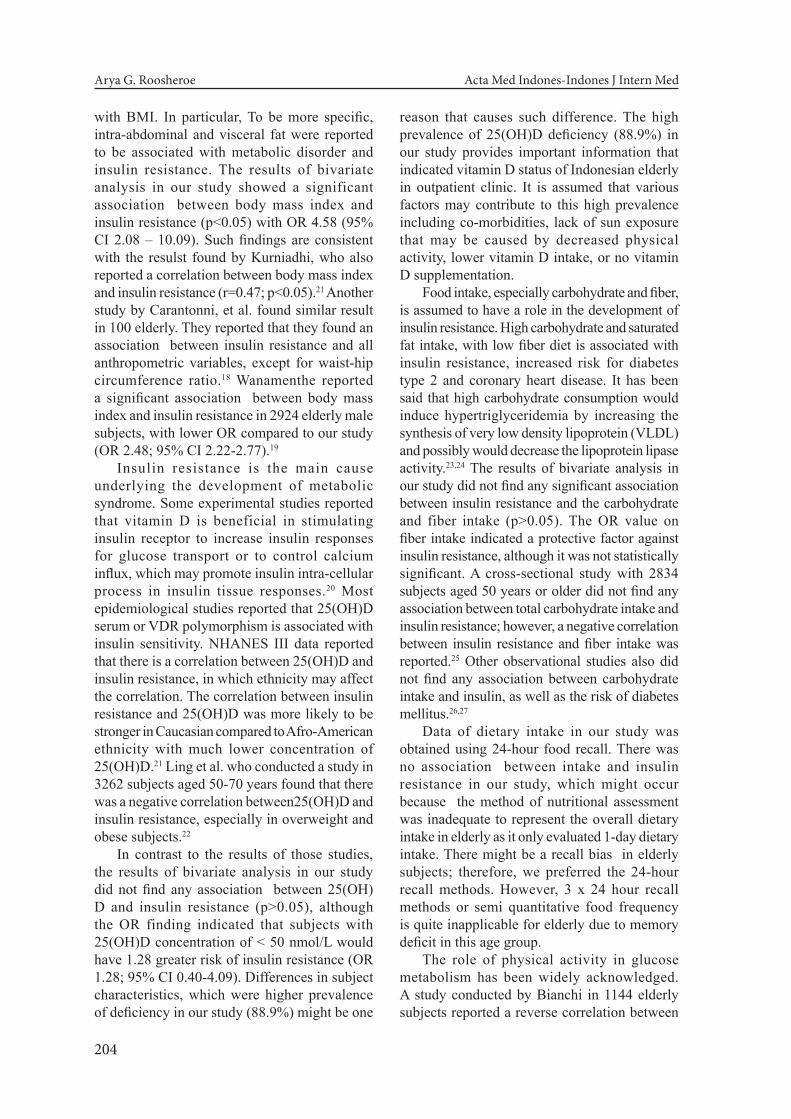
The results of logistic regression analysis (Table 5) indicated that only the variables of trunk and peripheral subcutaneous fat were significantly affecting insulin resistance in elderly, with OR 1.09 (95% CI 1.05-1.15) and OR 0.93 (95% CI 0.87-0.99), respectively.
DISCUSSIONIn our study, the number of elderly subjects
with nutritional status of overweight and obesity
were more prevalent than underweight subjects. The phenomena might be caused by nutritional transition in Indonesia. As a developing country, Indonesia has quite dramatic changes in age-population structures, accompanied with changes in dietary style, habit and physical activity. As a result, this will cause increased risk of obesity and chronic disease. Altered dietary habit includes diet changes from high fiber and low fat diet to high fat, high carbohydrate and low fiber diet.
Table 2. Mean values of body mass index, fat mass, fat thickness, waist circumference, physical activity, intake, and HOMA-IR
Variables Mean (sd) Min Max
Body mass index 23.09 (0.19) 12.46 39.42
Fat mass (%) 29.61 (10.06) 3.00 65.8
Fat mass (Kg) 17.16(1.17) 0.39 84.00
Fat thickness beneath triceps skin 19.94 (5.45) 4.00 36.00
Fat thickness beneath thigh skin 17.29 (4.35) 6.00 30.00
Fat thickness beneath subscapular skin 17.45 (5.34) 5.00 31.50
Fat thickness beneath suprailiac skin 20.98 (5.63) 5.00 35.00
Fat thickness beneath abdominal skin 26.00 (5.99) 7.50 45.00
Peripheral subcutaneous fat thickness 37,24 (9.54) 10.00 65.00
Trunk subcutaneous fat thickness 64.43 (15,61) 17.50 107.00
Waist circumference 84.59 (11.22) 57.5 118.00
Physical activity 4.55 (1.78) -0.40 8.70
Carbohydrate intake 237.75 (74.81) 7.14 435.13
Fiber intake 21.92 (33.89) 2.17 275.14
HOMA-IR 1.32 (2.53) 0.26 28.50
Table 3. Association between age, body mass index, 25(OH)D concentration, carbohydrate intake, fiber intake and insulin resistance
VariablesInsulin Resistance
OR (95% CI) pYes n (%) No n (%)
Age
- >70 years 16 (37.21) 74 (57.36) 0.44 0.024
- 60-70 years 27 (62.79) 55 (42.64) (0.22 – 0.89)
Body mass index
- Overweight-obesity 33 (76.74) 54 (41.86) 4.58 0.000
- Underweight -normal 10 (23.26) 75 (58.14) (2.08 – 10.09)
25(OH)D concentration
- Deficiency (<50) 39 (90.69) 114 (88.37) 1.28 0.67
- Normal (>50) 4 (9.30) 15 (11.63) (0.40 – 4.09)
Carbohydrate intake
- >100% needs 20 (46.51) 64 (49.61) 0.78 0.73
- <100% needs 23 (53.49) 65 (50.39) (0.39 – 1.56)
Fiber intake
- <100% needs 38 (88.37) 120 (93.02) 0.57 0.34
- >100% needs 5 (11.63) 9 (6.98) (0.18-1.80)
Vol 44 • Number 3 • July 2012 Insulin Resistance as One of Indicators for Metabolic Syndrome
203
Moreover, we also found that the majority of subjects (48.84%) consumed carbohydrates more than 100% nutritional requirements and 83.7% subjects had low fiber intake, 80% less than required.
Total body fat, subcutaneous fat in triceps, subscapular, suprailiac, abdomen and peripheral fat found in our study is almost similar to those values reported by Dwimartutie, in her study of 55 outpatient elderly. However, BMI, abdominal and trunk subcutaneous fat found in this study is much higher.11 HOMA-IR concentration value in our study was not normal, therefore, a transformation was conducted. We found that the mean value of HOMA-IR was 1.32. This value is lower than those values reported by Motta, which were 1.66 for 1549 elderly, and Kurniadhi, who reported the value of 1.71 for 110 elderly subjects.12-14
The condition of insulin resistance in our study was diagnosed based on HOMA-IR >75 percentile study population, and the value was
2.67. This value is comparable to the value found by Nasution in her study with 92 elderly women in nursing homes in Jakarta.15 In addition, another study reported lower HOMA-IR value for insulin resistance, which was 2.48.19 A study conducted by Lee, et al with 976 subjects aged 30-79 years old in Korea reported a comparable HOMA-IR cut-off limit for insulin resistance, which was 2.34.14 The differences in HOMA-IR cut off limit to diagnose insulin resistance, which may be different among various populations might be affected by sex, differences in body fat distribution, age, and race (ethnicity).
The prevalence of insulin resistance in our study was 25%. A study conducted by Nasution also found similar prevalence of insulin resistance (25%).15 The prevalence of insulin resistance was increasing with age.15,16 The increase of prevalence reached its peak by the age of 80 years and followed by decreased prevalence.16 Botnia et al. found increased insulin resistance in older subjects.22
It has been reported that insulin resistance increased with age. The results of bivariate analysis in our study showed significant association between age and insulin resistance (p<0.05) with OR 0.44 (95% CI 0.22-0.89). The association between age and insulin resistance, which was found in our study is similar to the study conducted by Barbieri.3 However, Choi, Thomas, and Nasution did not find any association between age and insulin resistance.15,17,24 OR value found in our study demonstrated that the older age was actually a protective factor for insulin resistance. It indicated that insulin resistance tends to decrease with advancing age. The results is similar to the results found by Dwimartutie; however, it is different from the results reported by Barbieri who found increased insulin resistance in subjects aged up to 80-90 years old, then it decreased in subjects aged more than 90 years.3,19 Subject characteristics with various co-morbidity is assumed as one of confounding factors in our study. Furthermore, reduced body fat mass with advancing age, which subsequently caused decreased insulin resistance, is also assumed to be the cause.
Body mass index has been frequently used to define overweight or obesity. It has been known that body fat distribution is an important determinant in metabolic abnormality, which might be caused by fat excess, and projected
Table 5. Results of logistic regression on insulin resistance and independent variables
Variables OR 95% CI P-value
Trunk subcutaneous fat 1.09 1.05 – 1.15 0.000
Peripheral subcutaneous fat 0.93 0.87 – 0.99 0.048
Table 4. Mean differences on body fat and physical activity of subjects with insulin resistance and subjects without insulin resistance
VariablesInsulin Resistance
p valueYes (Mean (sd))
No (Mean (sd))
Fat mass (kg) 20.89 (4.57)
15.99 (0.99) 0.007
Fat mass percentage (%)
33.50 (11.91)
28.32 (9.05) 0.011
Waist circumference (cm)
91.30 (10.59)
82.36 (10.55) 0.000
Peripheral subcutaneous fat thickness (mm)
40.15 (10.07)
36.27 (9.19) 0.029
Trunk subcutaneous fat thickness (mm)
72.94 (14.45)
61.59 (14.99) 0.00
Physical activity (metz)
4.55 (1.66)
4.55 (1.83) 0.988
Arya G. Roosheroe Acta Med Indones-Indones J Intern Med
204
with BMI. In particular, To be more specific, intra-abdominal and visceral fat were reported to be associated with metabolic disorder and insulin resistance. The results of bivariate analysis in our study showed a significant association between body mass index and insulin resistance (p<0.05) with OR 4.58 (95% CI 2.08 – 10.09). Such findings are consistent with the resulst found by Kurniadhi, who also reported a correlation between body mass index and insulin resistance (r=0.47; p<0.05).21 Another study by Carantonni, et al. found similar result in 100 elderly. They reported that they found an association between insulin resistance and all anthropometric variables, except for waist-hip circumference ratio.18 Wanamenthe reported a significant association between body mass index and insulin resistance in 2924 elderly male subjects, with lower OR compared to our study (OR 2.48; 95% CI 2.22-2.77).19
Insulin resistance is the main cause underlying the development of metabolic syndrome. Some experimental studies reported that vitamin D is beneficial in stimulating insulin receptor to increase insulin responses for glucose transport or to control calcium influx, which may promote insulin intra-cellular process in insulin tissue responses.20 Most epidemiological studies reported that 25(OH)D serum or VDR polymorphism is associated with insulin sensitivity. NHANES III data reported that there is a correlation between 25(OH)D and insulin resistance, in which ethnicity may affect the correlation. The correlation between insulin resistance and 25(OH)D was more likely to be stronger in Caucasian compared to Afro-American ethnicity with much lower concentration of 25(OH)D.21 Ling et al. who conducted a study in 3262 subjects aged 50-70 years found that there was a negative correlation between25(OH)D and insulin resistance, especially in overweight and obese subjects.22
In contrast to the results of those studies, the results of bivariate analysis in our study did not find any association between 25(OH)D and insulin resistance (p>0.05), although the OR finding indicated that subjects with 25(OH)D concentration of < 50 nmol/L would have 1.28 greater risk of insulin resistance (OR 1.28; 95% CI 0.40-4.09). Differences in subject characteristics, which were higher prevalence of deficiency in our study (88.9%) might be one
reason that causes such difference. The high prevalence of 25(OH)D deficiency (88.9%) in our study provides important information that indicated vitamin D status of Indonesian elderly in outpatient clinic. It is assumed that various factors may contribute to this high prevalence including co-morbidities, lack of sun exposure that may be caused by decreased physical activity, lower vitamin D intake, or no vitamin D supplementation.
Food intake, especially carbohydrate and fiber, is assumed to have a role in the development of insulin resistance. High carbohydrate and saturated fat intake, with low fiber diet is associated with insulin resistance, increased risk for diabetes type 2 and coronary heart disease. It has been said that high carbohydrate consumption would induce hypertriglyceridemia by increasing the synthesis of very low density lipoprotein (VLDL) and possibly would decrease the lipoprotein lipase activity.23,24 The results of bivariate analysis in our study did not find any significant association between insulin resistance and the carbohydrate and fiber intake (p>0.05). The OR value on fiber intake indicated a protective factor against insulin resistance, although it was not statistically significant. A cross-sectional study with 2834 subjects aged 50 years or older did not find any association between total carbohydrate intake and insulin resistance; however, a negative correlation between insulin resistance and fiber intake was reported.25 Other observational studies also did not find any association between carbohydrate intake and insulin, as well as the risk of diabetes mellitus.26,27
Data of dietary intake in our study was obtained using 24-hour food recall. There was no association between intake and insulin resistance in our study, which might occur because the method of nutritional assessment was inadequate to represent the overall dietary intake in elderly as it only evaluated 1-day dietary intake. There might be a recall bias in elderly subjects; therefore, we preferred the 24-hour recall methods. However, 3 x 24 hour recall methods or semi quantitative food frequency is quite inapplicable for elderly due to memory deficit in this age group.
The role of physical activity in glucose metabolism has been widely acknowledged. A study conducted by Bianchi in 1144 elderly subjects reported a reverse correlation between
Vol 44 • Number 3 • July 2012 Insulin Resistance as One of Indicators for Metabolic Syndrome
205
physical activity and insulin resistance.28 Another study reported a protective effect of physical activity against insulin resistance. Resistance exercise will increase muscle mass, increase glucose intake per muscle mass unit, and significantly increase insulin activity in skeletal muscle.29
In our study, physical activity was measured using six minute walking test. The results of bivariate analysis did not show significant difference regarding mean physical activity score in metz between subjects with insulin resistance and those without insulin resistance (p>0.05). The absent of such difference may occur since the measurement method, six minute walking test, may not represent the actual activity of elderly.
Exercise in elderly will increase glucose metabolism and prevents insulin resistance; however, the mechanism is still unclear. In elderly, aerobic exercise has been known to increase functional capacity and decrease diabetes risk. In addition, elderly individuals are able to adapt to exercise increment, which may lead to improved insulin performance.3
It has been said that the risk of diabetes and insulin resistance increased with higher body fat, which is calculated by using the body mass index. Although the correlation is associated with the measurement of total body fat tissue, which is measured by BMI, but some studies also show that not all fat tissue contributes equally in increased diabetes risk. Central fat depot, i.e. intra-abdominal or visceral fat, including mesenteric and intra-abdominal omentum, has greater association with insulin resistance compared to peripheral fat depot, such as gluteal or subcutaneous fat or total body fat.30 The results of bivariate analysis found that there were significant mean differences in all body fat variable (p<0.05). In subjects with insulin resistance, we found higher fat mass, fat mass percentage, greater waist circumference, and peripheral and trunk subcutaneous fat thickness compared to those without insulin resistance. The result of multivariate analysis with logistic regression on independent variable with bivariate analysis results of p<0.25 revealed that only peripheral and trunk subcutaneous thickness that significantly affected insulin resistance (Table 5).
With advancing age, body fat is deposited more in abdominal area, therefore body mass index is not a good indicator to represent
abdominal fat and overall body fat. Waist circumference has been recommended as a better indicator for abdominal visceral fat. Several studies in younger subjects and adults demonstrated that waist circumference is a better anthropometric measure to define risk factor for metabolic status than BMI.31,32 Wannamenthe reported that waist circumference is correlated with insulin resistance in elderly subjects.27 Nilson also found similar results in his study, which revealed a correlation between waist circumference and insulin resistance.33
Our study found a significantly different mean value of fat mass and fat mass percentage between subjects with insulin resistance and those without. Other studies found a positive correlation between insulin resistance and total body fat percentage and fat mass.27,34 The existence of such correlation may occur because fat tissue as an endocrine organ has a function to affect insulin performance through free fatty acid release and protein secretion. Insulin resistance will increase since there are increased level of free fatty acid and pro-inflammation protein.
Several studies found a correlation between peripheral and trunk subcutaneous fat and insulin resistance.19,35,36 In our study, multivariate analysis showed that only peripheral and trunk subcutaneous fat affected insulin resistance (p< 0.05). Trunk subcutaneous fat has higher level of free fatty acid or non-esterified fatty acid compared to gluteo-femoral region. The non-esterified fatty acid will cause increased fatty acid in muscle and inhibit glucose oxidation.
CONCLUSION Our study shows that insulin resistance in
elderly is associated with peripheral (0.93; 95% CI 0.87-0.99) and trunk subcutaneous fat (OR 1.09 ; 95% CI 1.05-1.15).
REFERENCES1. Wallace TM, Matthews DR. The assessment of insulin
resistance in man. Diab Med. 2002;19:527-34.2. Ezenwaka CE, Akanji AO, Akanji BO, Unwin NC,
AdehuwonCA. The prevalence of insulin resistance and other cardiovascular disease risk factors in healthy elderly southwestern Nigerians. Atherosclerosis. 1997;128:201-11.
3. Barbieri M, zRizzo MR, Manzella D, Paolisso G. Age related insulin resistance : is it an obligatory finding? The lesson from healthy centenarians. Diab Met Res Rev. 2001;17:29-6.
Arya G. Roosheroe Acta Med Indones-Indones J Intern Med
206
4. Chiu KC, Chu A, Go VL, Saad MF. Hypovitaminosis D is associated with insulin resistance and beta cell dysfunction. Am J Clin Nutr. 2004;79(5):820-5.
5. Setiati S, Oemardi M, Sutrisna B, Supartondo. The role of ultraviolet-B from sun exposure on 25(OH)D & parathyroid hormone level in elderly women in Indonesia. Asian J Gerontol Geriatr. 2007;2:126-32.
6. Bertoni AG, Wong ND, Shea S, Liu Kiang, et al. Insulin resistance, metabolic syndrome, and subclinical atherosclerosis. Diab care. 2007;30(11):2951-6.
7. Bessesen DH. The role of carbohydrate in insulin resistance. J Nutr. 2001;131:2782S-2786S
8. FinkRI, Kolterman OG, Griffin J, Olefsky J. Mechanism of insulin resistance in aging. J Clin Invest. 1983;71:1523-35.
9. O’Leary VB, Marchetti CM, Khrisna RK, Stetzer BP, Gonzalez F, Kirwan JP. Exercise-induced reversal of insulin resistance in obese elderly is associated with reduced visceral fat. J Appl Physiol. 2006;100:1584-9.
10. Yan LL. BMI and health related quality of life in adults 65 years and older. Obes Res. 2004;12:69-76.
11. Dwimartutie N, Setiati S, Oemardi M. The correlation between body fat distribution and insulin resistance in elderly. Acta Med Indones. 2010;42(2):66-73.
12. Massimo Motta, Ettore Bennati, Laura Ferlito, Michela Passamonte, Mariano Malaguarnera. Insulin resistance in older. Arch Gerontol & Geriatr. 2008;46(2):203-9.
13. Kurniadhi D. Gambaran toleransi glukosa pada usia lanjut dan faktor-faktor yang mempengaruhinya. Tesis.PPDS FKUI. 2008.
14. Sihoon Lee, Sunghee Choi, Sae Jin Kim, Yoon-Sok Chung, Kwan Woo Lee, Hyun Chul Lee, Kap Bum Huh, Dae Jung Kim. Cut-off values of surrogate measures of insulin resistance for metabolic syndrome in Korean non-diabetic adults. Korean Med Sci. 2006;21:695-700.
15. Isomaa B, Almgren P, Tuomi T, Forsen B, Latiti K, Nissen M, et al. Cardiovascular morbidity and mortality associated with the metabolic syndrome. Diab Care. 2001;24:683-9.
16. Choi KM, Lee J, Kim YH, Kim KB, Kim DL, Kim SG, et al. Relation between insulin resistance and hematological parameters in elderly Koreans-Southwest Seoul (SWS) study. Diab Res & Clin Pract. 2003;60:205-12.
17. Thomas GN, Critchley JAJH, Tomlinson B, Anderson PJ, Lee Z Sk, Chan J CN. Obesity, independent of insulin resistance, is a major determinant of blood pressure in normoglycemic Hongkong Chinese. Metabolism. 2000;49(12):1523-8.
18. Carantoni M, Zuliani G, Volpato S, Palmieri E, Mezetti A, Vergnani L, et al. Relationship between fasting plasma insulin, anthropometrics, and metabolic parameters in very old healthy population. Metabolism. 1998;47:535-40.
19. Wannamethee SG, Shaper AG, Morris RW, Whincup PH. Measures of adiposity in the identification of metabolic abnormalities in elderly men. Am J Clin Nutr. 2005;81:1313-21.
20. Pittas AG, Lau J, Hu FB. Dason-Hughes B. The role of vitamin D and calcium in type 2 diabetes: a systematic review and meta-analysis. J Clin Endocrinol Metab. 2007;92:2017-29.
21. Scragg R, Sowers M, Bell C. Serum 25 hydroxyvitamin D, diabetes, and ethnicity in the Third National Health and Nutrition Examination Survey. Diab Care. 2004;27:2813-8.
22. Ling Lu, Zhijie Yu, An Pan, Frank B Hu, Oscar H Franco, Huaixing Li, Xiaoying Li, Xilin Yang, Yan Chen, Xu Lin. Plasma 25-hydroxyvitamin D concentration and metabolic syndrome among middle-aged and elderly Chinese individuals. Diab Care. 2009;32:1278-83.
23. Liu S. Intake of roods in realtion to risk of type 2 diabetes mellitus and coronary heart disease. J Am coll Nut. 2002;21:298-306.
24. McAuley K, Mann J. Thematic review series: patient-oriented research. Nutritional determinant in insulin resistance. J Lipid Res. 2006;47:1668-76.
25. McKeownNM, Meigs JB, Liu S, Saltzman E, Wilson PWF, Jacques PF. Carbohydrate nutrition, insulin resistance, and the prevalence of the metabolic syndrome in the Framingharm offspring cohort. Diab Care. 2004;27:538-46.
26. Ludwig DS, Pereira MA, Kroenke CH, HIlner JE, Van Horn L, Slattery ML, Jacobs DR Jr. Dietary fiber, weight gain, and cardiovascular disease risk factors in young adults. JAMA. 1999;282:1539-46.
27. Meyer KA, Kushi LH, Jacobs DRjr, Slavin J, Sellers TA, Folsom AR. Carbohydrates, dietary fiber, and incident type 2 diabetes in older women. Am J Clin Nutr. 2000;71:921-30.
28. Bianchi G, Rossi V, Muscari A, Magalotti D, Zoli M, and the Pianorostudy group. Physical activity is negatively associated with the metabolic syndrome in the elderly. Q J Med. 2008;101:713-21.
29. Andersen JL, Scherfing LL, Delta F. Resistance training and insulin action in humans: effects of detraining. J Physiol. 2003;551:1049-58.
30. Collins S, Ahima RS, Kahn B. Biology of adipose tissue. In: Kahn R, King G, Moses A, Weir G, Jacobson A, Smith R, eds. Joslin’s diabetes mellitus. 14th ed. USA: Lippincott Williams & Wilkins; 2005. p. 207-26.
31. Zhu S, Wang Z, Heskha S, Heo M, Faith MS, Heymsfield SB. Waist circumference and obesity-associated risk factors among whites in the third National Health and Nutrition Examination Survey: clinical action thresholds. Am J Clin Nutr. 2002;76:743-9.
32. Jannsen I, Katzmarzyk PT, Ross R. Waist circumference and not body mass index explains obesity-related health risk. Am J Clin Nutr. 2004;79:379-84.
33. Nilsson G, Hedberg P, Lonnberg I, Tenerz A, Forberg R, Ohvrik J. Waist circumference alone predicts insulin resistance as good as the metabolic syndrome in elderly women. Eur J Intern Med. 2008;19(7):520-6.
34. Feng Y, Hong X, Li Z, Zhang W, Jin D, Liu X, et al. Prevalence of metabolic syndrome and its relation to body composisition in a chinese rural population. Obesity. 2006;14:2089-98.
35. Sieveniper JL, Jenkins D, Jose RG, Leiter LA, Vuksan V. Simple skinfold-thickness measurements complement conventional anthropometric assessments in predicting glucose tolerance. Am J Clin Nutr. 2001;73:567-73.
36. Abate N, Abimanyu G, Pescok RM. Relationship of generalized and regional adiposity to insulin sensitivity in men. J Clin Invest. 1995;96:88-98.