Embed Size (px)
Citation preview
Insufficient Effort Responding: Examining an Insidious Confoundin Survey Data
Jason L. Huang and Mengqiao LiuWayne State University
Nathan A. BowlingWright State University
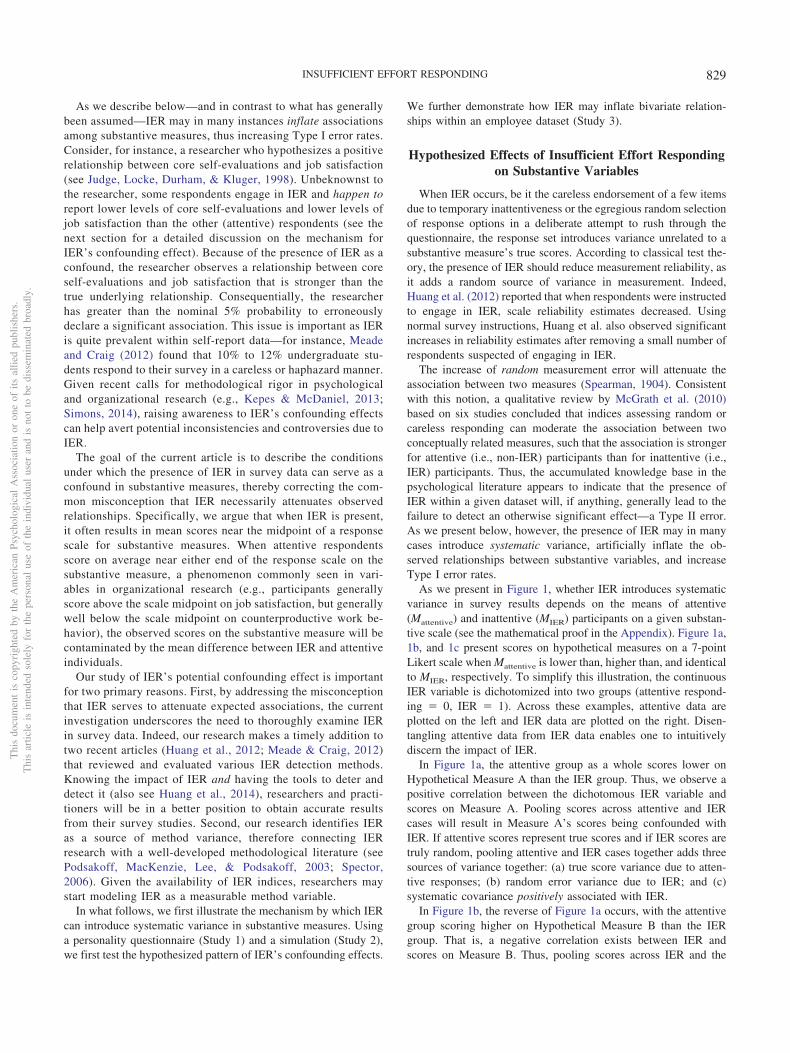
Insufficient effort responding (IER; Huang, Curran, Keeney, Poposki, & DeShon, 2012) to surveys haslargely been assumed to be a source of random measurement error that attenuates associations betweensubstantive measures. The current article, however, illustrates how and when the presence of IER canproduce a systematic bias that inflates observed correlations between substantive measures. Noting thatinattentive responses as a whole generally congregate around the midpoint of a Likert scale, we proposethat Mattentive, defined as the mean score of attentive respondents on a substantive measure, will benegatively related to IER’s confounding effect on substantive measures (i.e., correlations between IERand a given substantive measure will become less positive [or more negative] as Mattentive increases).Results from a personality questionnaire (Study 1) and a simulation (Study 2) consistently support thehypothesized confounding influence of IER. Using an employee sample (Study 3), we demonstrated howIER can confound bivariate relationships between substantive measures. Together, these studies indicatethat IER can inflate the strength of observed relationships when scale means depart from the scalemidpoints, resulting in an inflated Type I error rate. This challenges the traditional view that IERattenuates observed bivariate correlations. These findings highlight situations where IER may be amethodological nuisance, while underscoring the need for survey administrators and researchers to deterand detect IER in surveys. The current article serves as a wake-up call for researchers and practitionersto more closely examine IER in their data.
Keywords: insufficient effort responding, careless responding, random responding, data screening andcleaning, response effort
It ain’t what you don’t know that gets you into trouble. It’s what youknow for sure that just ain’t so.
—Mark Twain
Survey measures are commonly used in organizational re-search to assess a variety of variables, including perceptions ofthe work environment, job attitudes, and employee personality(Spector, 1994). The use of questionnaires assumes that respon-dents carefully follow instructions and remain attentivethroughout the survey. Insufficient effort responding (IER),
which subsumes both occasional careless (Schmitt & Stults,1985) and intentional random responding (Buechley & Ball,1952), refers to a survey response set in which a person re-sponds to items without sufficient regard to the content of theitems and/or survey instructions (Huang, Curran, Keeney,Poposki, & DeShon, 2012; also see Meade & Craig, 2012).Researchers have entertained the general notion of IER invarious research contexts such as personality testing (Hough,Eaton, Dunnette, Kamp, & McCloy, 1990), job analysis (Green& Stutzman, 1986), needs assessment ratings (Calsyn & Winter,1999), and online survey research (Behrend, Sharek, Meade, &Wiebe, 2011). Recent advances in IER research have identifiedmethods that enable effective detection of IER (Huang, Bowl-ing, Liu, & Li, 2014; Huang et al., 2012; Meade & Craig, 2012).
Much of the current understanding of IER’s impact focuseson scales’ measurement properties. Regarded as a source ofrandom measurement error, IER can reduce scale reliability(Huang et al., 2012). Furthermore, the presence of IER candisturb the factor structure of measures that include both pos-itively and negatively worded items. As shown in simulationstudies (Schmitt & Stults, 1985; Woods, 2006), the inclusion ofas little of 10% careless responses can introduce a nuisancefactor consisting of negatively worded items. Taken as a whole,the view of IER as a source of random measurement error hasperpetuated the assumption that IER necessarily attenuatesobserved relationships between substantive variables (McGrath,Mitchell, Kim, & Hough, 2010).
This article was published Online First December 15, 2014.Jason L. Huang and Mengqiao Liu, Department of Psychology, Wayne
State University; Nathan A. Bowling, Department of Psychology, WrightState University.
An earlier version of this article was presented at the annual conferenceof the Society for Industrial and Organizational Psychology in Honolulu,Hawaii in 2014. We thank Larry Williams, Boris Baltes, Bob Vandenberg,and Amy Fan for valuable suggestions at various stages of this research.We appreciate guidance from Deidra Schleicher and two anonymousreviewers on the structure of the article. We also thank Ben Biermeier-Hanson, Ariel Lelchook, and Caleb Bragg for sharing their data for thepilot studies and Terry A. Beehr, Connie P. Watson, Amy McGinnis, KimPorter, Shannon Rodriguez, and Srikrishnan Sundaresan for their effort indata collection in Study 3.
Correspondence concerning this article should be addressed to Jason L.Huang, Department of Psychology, Wayne State University, 5057 Wood-ward Ave., Detroit, MI 48202. E-mail: [email protected]
Thi
sdo
cum
ent
isco
pyri
ghte
dby
the
Am
eric
anPs
ycho
logi
cal
Ass
ocia
tion
oron
eof
itsal
lied
publ
ishe
rs.
Thi
sar
ticle
isin
tend
edso
lely
for
the
pers
onal
use
ofth
ein
divi
dual
user
and
isno
tto
bedi
ssem
inat
edbr
oadl
y.
Journal of Applied Psychology © 2014 American Psychological Association2015, Vol. 100, No. 3, 828–845 0021-9010/15/$12.00 http://dx.doi.org/10.1037/a0038510
828
As we describe below—and in contrast to what has generallybeen assumed—IER may in many instances inflate associationsamong substantive measures, thus increasing Type I error rates.Consider, for instance, a researcher who hypothesizes a positiverelationship between core self-evaluations and job satisfaction(see Judge, Locke, Durham, & Kluger, 1998). Unbeknownst tothe researcher, some respondents engage in IER and happen toreport lower levels of core self-evaluations and lower levels ofjob satisfaction than the other (attentive) respondents (see thenext section for a detailed discussion on the mechanism forIER’s confounding effect). Because of the presence of IER as aconfound, the researcher observes a relationship between coreself-evaluations and job satisfaction that is stronger than thetrue underlying relationship. Consequentially, the researcherhas greater than the nominal 5% probability to erroneouslydeclare a significant association. This issue is important as IERis quite prevalent within self-report data—for instance, Meadeand Craig (2012) found that 10% to 12% undergraduate stu-dents respond to their survey in a careless or haphazard manner.Given recent calls for methodological rigor in psychologicaland organizational research (e.g., Kepes & McDaniel, 2013;Simons, 2014), raising awareness to IER’s confounding effectscan help avert potential inconsistencies and controversies due toIER.
The goal of the current article is to describe the conditionsunder which the presence of IER in survey data can serve as aconfound in substantive measures, thereby correcting the com-mon misconception that IER necessarily attenuates observedrelationships. Specifically, we argue that when IER is present,it often results in mean scores near the midpoint of a responsescale for substantive measures. When attentive respondentsscore on average near either end of the response scale on thesubstantive measure, a phenomenon commonly seen in vari-ables in organizational research (e.g., participants generallyscore above the scale midpoint on job satisfaction, but generallywell below the scale midpoint on counterproductive work be-havior), the observed scores on the substantive measure will becontaminated by the mean difference between IER and attentiveindividuals.
Our study of IER’s potential confounding effect is importantfor two primary reasons. First, by addressing the misconceptionthat IER serves to attenuate expected associations, the currentinvestigation underscores the need to thoroughly examine IERin survey data. Indeed, our research makes a timely addition totwo recent articles (Huang et al., 2012; Meade & Craig, 2012)that reviewed and evaluated various IER detection methods.Knowing the impact of IER and having the tools to deter anddetect it (also see Huang et al., 2014), researchers and practi-tioners will be in a better position to obtain accurate resultsfrom their survey studies. Second, our research identifies IERas a source of method variance, therefore connecting IERresearch with a well-developed methodological literature (seePodsakoff, MacKenzie, Lee, & Podsakoff, 2003; Spector,2006). Given the availability of IER indices, researchers maystart modeling IER as a measurable method variable.
In what follows, we first illustrate the mechanism by which IERcan introduce systematic variance in substantive measures. Usinga personality questionnaire (Study 1) and a simulation (Study 2),we first test the hypothesized pattern of IER’s confounding effects.
We further demonstrate how IER may inflate bivariate relation-ships within an employee dataset (Study 3).
Hypothesized Effects of Insufficient Effort Respondingon Substantive Variables
When IER occurs, be it the careless endorsement of a few itemsdue to temporary inattentiveness or the egregious random selectionof response options in a deliberate attempt to rush through thequestionnaire, the response set introduces variance unrelated to asubstantive measure’s true scores. According to classical test the-ory, the presence of IER should reduce measurement reliability, asit adds a random source of variance in measurement. Indeed,Huang et al. (2012) reported that when respondents were instructedto engage in IER, scale reliability estimates decreased. Usingnormal survey instructions, Huang et al. also observed significantincreases in reliability estimates after removing a small number ofrespondents suspected of engaging in IER.
The increase of random measurement error will attenuate theassociation between two measures (Spearman, 1904). Consistentwith this notion, a qualitative review by McGrath et al. (2010)based on six studies concluded that indices assessing random orcareless responding can moderate the association between twoconceptually related measures, such that the association is strongerfor attentive (i.e., non-IER) participants than for inattentive (i.e.,IER) participants. Thus, the accumulated knowledge base in thepsychological literature appears to indicate that the presence ofIER within a given dataset will, if anything, generally lead to thefailure to detect an otherwise significant effect—a Type II error.As we present below, however, the presence of IER may in manycases introduce systematic variance, artificially inflate the ob-served relationships between substantive variables, and increaseType I error rates.
As we present in Figure 1, whether IER introduces systematicvariance in survey results depends on the means of attentive(Mattentive) and inattentive (MIER) participants on a given substan-tive scale (see the mathematical proof in the Appendix). Figure 1a,1b, and 1c present scores on hypothetical measures on a 7-pointLikert scale when Mattentive is lower than, higher than, and identicalto MIER, respectively. To simplify this illustration, the continuousIER variable is dichotomized into two groups (attentive respond-ing � 0, IER � 1). Across these examples, attentive data areplotted on the left and IER data are plotted on the right. Disen-tangling attentive data from IER data enables one to intuitivelydiscern the impact of IER.
In Figure 1a, the attentive group as a whole scores lower onHypothetical Measure A than the IER group. Thus, we observe apositive correlation between the dichotomous IER variable andscores on Measure A. Pooling scores across attentive and IERcases will result in Measure A’s scores being confounded withIER. If attentive scores represent true scores and if IER scores aretruly random, pooling attentive and IER cases together adds threesources of variance together: (a) true score variance due to atten-tive responses; (b) random error variance due to IER; and (c)systematic covariance positively associated with IER.
In Figure 1b, the reverse of Figure 1a occurs, with the attentivegroup scoring higher on Hypothetical Measure B than the IERgroup. That is, a negative correlation exists between IER andscores on Measure B. Thus, pooling scores across IER and the
Thi
sdo
cum
ent
isco
pyri
ghte
dby
the
Am
eric
anPs
ycho
logi
cal
Ass
ocia
tion
oron
eof
itsal
lied
publ
ishe
rs.
Thi
sar
ticle
isin
tend
edso
lely
for
the
pers
onal
use
ofth
ein
divi
dual
user
and
isno
tto
bedi
ssem
inat
edbr
oadl
y.
829INSUFFICIENT EFFORT RESPONDING
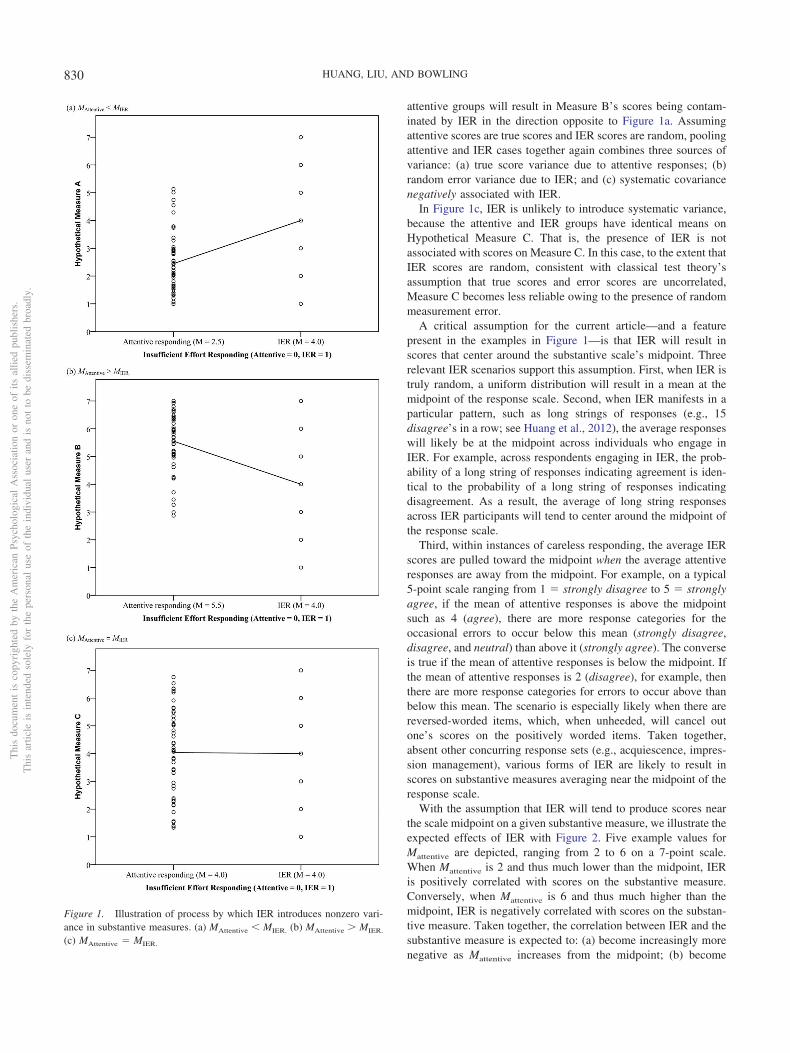
attentive groups will result in Measure B’s scores being contam-inated by IER in the direction opposite to Figure 1a. Assumingattentive scores are true scores and IER scores are random, poolingattentive and IER cases together again combines three sources ofvariance: (a) true score variance due to attentive responses; (b)random error variance due to IER; and (c) systematic covariancenegatively associated with IER.
In Figure 1c, IER is unlikely to introduce systematic variance,because the attentive and IER groups have identical means onHypothetical Measure C. That is, the presence of IER is notassociated with scores on Measure C. In this case, to the extent thatIER scores are random, consistent with classical test theory’sassumption that true scores and error scores are uncorrelated,Measure C becomes less reliable owing to the presence of randommeasurement error.
A critical assumption for the current article—and a featurepresent in the examples in Figure 1—is that IER will result inscores that center around the substantive scale’s midpoint. Threerelevant IER scenarios support this assumption. First, when IER istruly random, a uniform distribution will result in a mean at themidpoint of the response scale. Second, when IER manifests in aparticular pattern, such as long strings of responses (e.g., 15disagree’s in a row; see Huang et al., 2012), the average responseswill likely be at the midpoint across individuals who engage inIER. For example, across respondents engaging in IER, the prob-ability of a long string of responses indicating agreement is iden-tical to the probability of a long string of responses indicatingdisagreement. As a result, the average of long string responsesacross IER participants will tend to center around the midpoint ofthe response scale.
Third, within instances of careless responding, the average IERscores are pulled toward the midpoint when the average attentiveresponses are away from the midpoint. For example, on a typical5-point scale ranging from 1 � strongly disagree to 5 � stronglyagree, if the mean of attentive responses is above the midpointsuch as 4 (agree), there are more response categories for theoccasional errors to occur below this mean (strongly disagree,disagree, and neutral) than above it (strongly agree). The converseis true if the mean of attentive responses is below the midpoint. Ifthe mean of attentive responses is 2 (disagree), for example, thenthere are more response categories for errors to occur above thanbelow this mean. The scenario is especially likely when there arereversed-worded items, which, when unheeded, will cancel outone’s scores on the positively worded items. Taken together,absent other concurring response sets (e.g., acquiescence, impres-sion management), various forms of IER are likely to result inscores on substantive measures averaging near the midpoint of theresponse scale.
With the assumption that IER will tend to produce scores nearthe scale midpoint on a given substantive measure, we illustrate theexpected effects of IER with Figure 2. Five example values forMattentive are depicted, ranging from 2 to 6 on a 7-point scale.When Mattentive is 2 and thus much lower than the midpoint, IERis positively correlated with scores on the substantive measure.Conversely, when Mattentive is 6 and thus much higher than themidpoint, IER is negatively correlated with scores on the substan-tive measure. Taken together, the correlation between IER and thesubstantive measure is expected to: (a) become increasingly morenegative as Mattentive increases from the midpoint; (b) become
Figure 1. Illustration of process by which IER introduces nonzero vari-ance in substantive measures. (a) MAttentive � MIER. (b) MAttentive � MIER.
(c) MAttentive � MIER.
Thi
sdo
cum
ent
isco
pyri
ghte
dby
the
Am
eric
anPs
ycho
logi
cal
Ass
ocia
tion
oron
eof
itsal
lied
publ
ishe
rs.
Thi
sar
ticle
isin
tend
edso
lely
for
the
pers
onal
use
ofth
ein
divi
dual
user
and
isno
tto
bedi
ssem
inat
edbr
oadl
y.
830 HUANG, LIU, AND BOWLING
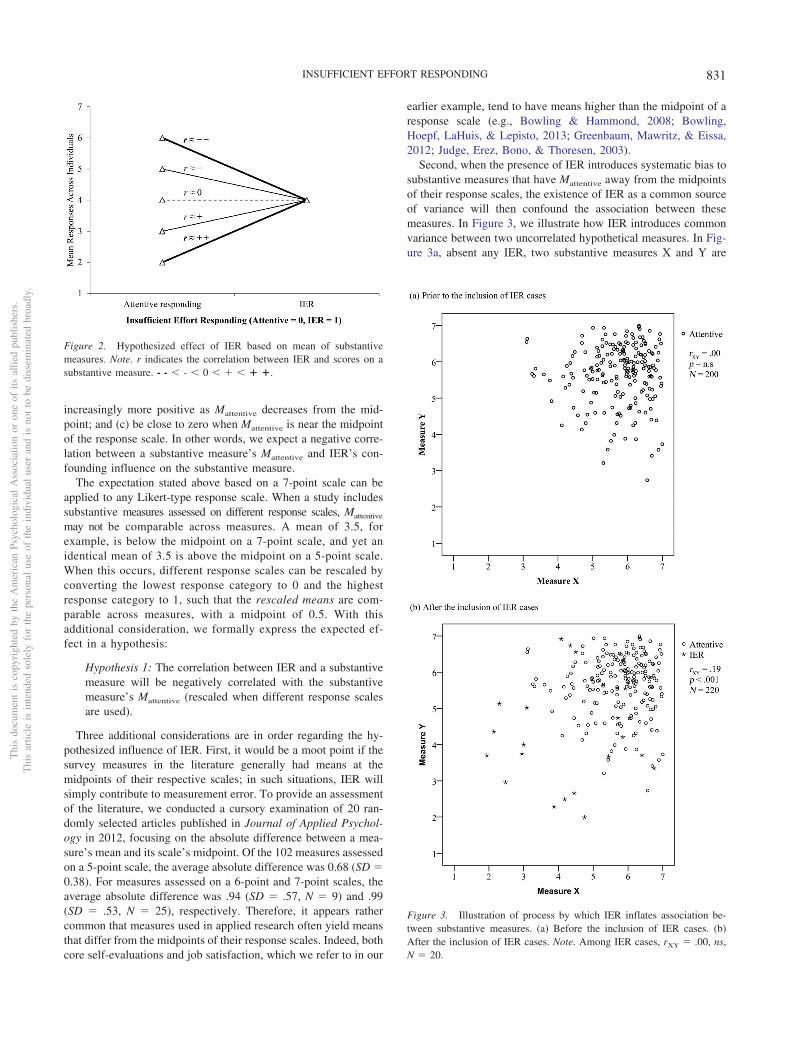
increasingly more positive as Mattentive decreases from the mid-point; and (c) be close to zero when Mattentive is near the midpointof the response scale. In other words, we expect a negative corre-lation between a substantive measure’s Mattentive and IER’s con-founding influence on the substantive measure.
The expectation stated above based on a 7-point scale can beapplied to any Likert-type response scale. When a study includessubstantive measures assessed on different response scales, Mattentive
may not be comparable across measures. A mean of 3.5, forexample, is below the midpoint on a 7-point scale, and yet anidentical mean of 3.5 is above the midpoint on a 5-point scale.When this occurs, different response scales can be rescaled byconverting the lowest response category to 0 and the highestresponse category to 1, such that the rescaled means are com-parable across measures, with a midpoint of 0.5. With thisadditional consideration, we formally express the expected ef-fect in a hypothesis:
Hypothesis 1: The correlation between IER and a substantivemeasure will be negatively correlated with the substantivemeasure’s Mattentive (rescaled when different response scalesare used).
Three additional considerations are in order regarding the hy-pothesized influence of IER. First, it would be a moot point if thesurvey measures in the literature generally had means at themidpoints of their respective scales; in such situations, IER willsimply contribute to measurement error. To provide an assessmentof the literature, we conducted a cursory examination of 20 ran-domly selected articles published in Journal of Applied Psychol-ogy in 2012, focusing on the absolute difference between a mea-sure’s mean and its scale’s midpoint. Of the 102 measures assessedon a 5-point scale, the average absolute difference was 0.68 (SD �0.38). For measures assessed on a 6-point and 7-point scales, theaverage absolute difference was .94 (SD � .57, N � 9) and .99(SD � .53, N � 25), respectively. Therefore, it appears rathercommon that measures used in applied research often yield meansthat differ from the midpoints of their response scales. Indeed, bothcore self-evaluations and job satisfaction, which we refer to in our
earlier example, tend to have means higher than the midpoint of aresponse scale (e.g., Bowling & Hammond, 2008; Bowling,Hoepf, LaHuis, & Lepisto, 2013; Greenbaum, Mawritz, & Eissa,2012; Judge, Erez, Bono, & Thoresen, 2003).
Second, when the presence of IER introduces systematic bias tosubstantive measures that have Mattentive away from the midpointsof their response scales, the existence of IER as a common sourceof variance will then confound the association between thesemeasures. In Figure 3, we illustrate how IER introduces commonvariance between two uncorrelated hypothetical measures. In Fig-ure 3a, absent any IER, two substantive measures X and Y are
Figure 3. Illustration of process by which IER inflates association be-tween substantive measures. (a) Before the inclusion of IER cases. (b)After the inclusion of IER cases. Note. Among IER cases, rXY � .00, ns,N � 20.
Figure 2. Hypothesized effect of IER based on mean of substantivemeasures. Note. r indicates the correlation between IER and scores on asubstantive measure. - - � - � 0 � � � � �.
Thi
sdo
cum
ent
isco
pyri
ghte
dby
the
Am
eric
anPs
ycho
logi
cal
Ass
ocia
tion
oron
eof
itsal
lied
publ
ishe
rs.
Thi
sar
ticle
isin
tend
edso
lely
for
the
pers
onal
use
ofth
ein
divi
dual
user
and
isno
tto
bedi
ssem
inat
edbr
oadl
y.
831INSUFFICIENT EFFORT RESPONDING
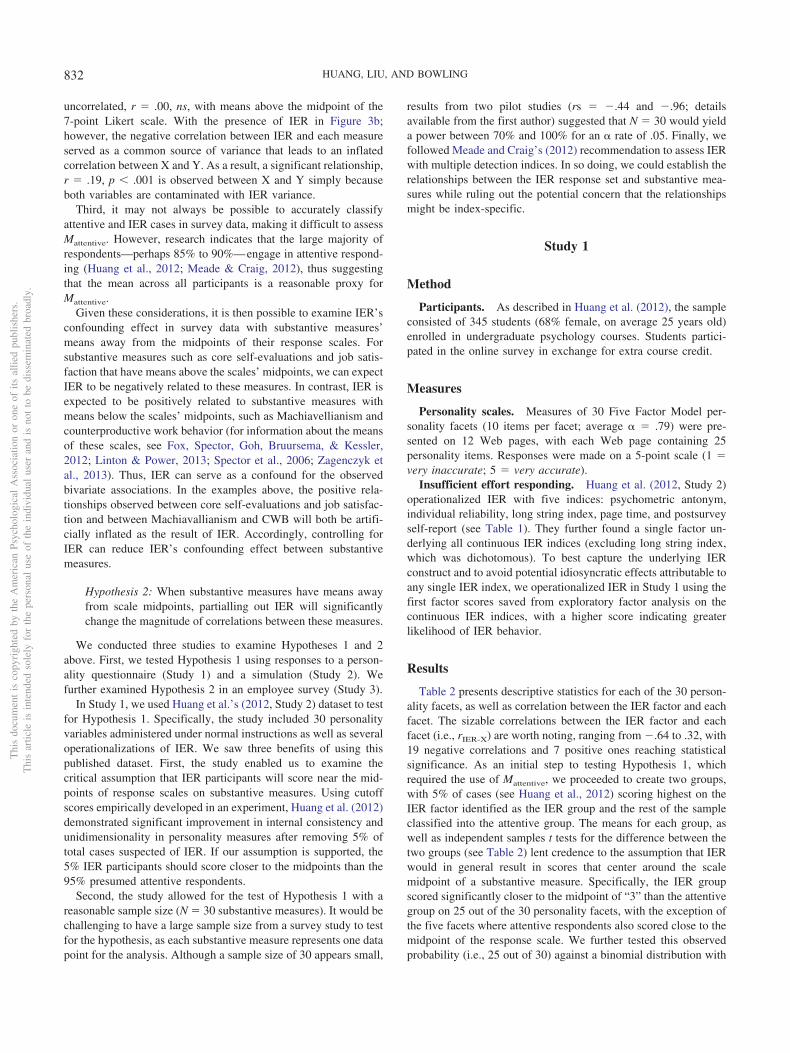
uncorrelated, r � .00, ns, with means above the midpoint of the7-point Likert scale. With the presence of IER in Figure 3b;however, the negative correlation between IER and each measureserved as a common source of variance that leads to an inflatedcorrelation between X and Y. As a result, a significant relationship,r � .19, p � .001 is observed between X and Y simply becauseboth variables are contaminated with IER variance.
Third, it may not always be possible to accurately classifyattentive and IER cases in survey data, making it difficult to assessMattentive. However, research indicates that the large majority ofrespondents—perhaps 85% to 90%—engage in attentive respond-ing (Huang et al., 2012; Meade & Craig, 2012), thus suggestingthat the mean across all participants is a reasonable proxy forMattentive.
Given these considerations, it is then possible to examine IER’sconfounding effect in survey data with substantive measures’means away from the midpoints of their response scales. Forsubstantive measures such as core self-evaluations and job satis-faction that have means above the scales’ midpoints, we can expectIER to be negatively related to these measures. In contrast, IER isexpected to be positively related to substantive measures withmeans below the scales’ midpoints, such as Machiavellianism andcounterproductive work behavior (for information about the meansof these scales, see Fox, Spector, Goh, Bruursema, & Kessler,2012; Linton & Power, 2013; Spector et al., 2006; Zagenczyk etal., 2013). Thus, IER can serve as a confound for the observedbivariate associations. In the examples above, the positive rela-tionships observed between core self-evaluations and job satisfac-tion and between Machiavallianism and CWB will both be artifi-cially inflated as the result of IER. Accordingly, controlling forIER can reduce IER’s confounding effect between substantivemeasures.
Hypothesis 2: When substantive measures have means awayfrom scale midpoints, partialling out IER will significantlychange the magnitude of correlations between these measures.
We conducted three studies to examine Hypotheses 1 and 2above. First, we tested Hypothesis 1 using responses to a person-ality questionnaire (Study 1) and a simulation (Study 2). Wefurther examined Hypothesis 2 in an employee survey (Study 3).
In Study 1, we used Huang et al.’s (2012, Study 2) dataset to testfor Hypothesis 1. Specifically, the study included 30 personalityvariables administered under normal instructions as well as severaloperationalizations of IER. We saw three benefits of using thispublished dataset. First, the study enabled us to examine thecritical assumption that IER participants will score near the mid-points of response scales on substantive measures. Using cutoffscores empirically developed in an experiment, Huang et al. (2012)demonstrated significant improvement in internal consistency andunidimensionality in personality measures after removing 5% oftotal cases suspected of IER. If our assumption is supported, the5% IER participants should score closer to the midpoints than the95% presumed attentive respondents.
Second, the study allowed for the test of Hypothesis 1 with areasonable sample size (N � 30 substantive measures). It would bechallenging to have a large sample size from a survey study to testfor the hypothesis, as each substantive measure represents one datapoint for the analysis. Although a sample size of 30 appears small,
results from two pilot studies (rs � �.44 and �.96; detailsavailable from the first author) suggested that N � 30 would yielda power between 70% and 100% for an � rate of .05. Finally, wefollowed Meade and Craig’s (2012) recommendation to assess IERwith multiple detection indices. In so doing, we could establish therelationships between the IER response set and substantive mea-sures while ruling out the potential concern that the relationshipsmight be index-specific.
Study 1
Method
Participants. As described in Huang et al. (2012), the sampleconsisted of 345 students (68% female, on average 25 years old)enrolled in undergraduate psychology courses. Students partici-pated in the online survey in exchange for extra course credit.
Measures
Personality scales. Measures of 30 Five Factor Model per-sonality facets (10 items per facet; average � � .79) were pre-sented on 12 Web pages, with each Web page containing 25personality items. Responses were made on a 5-point scale (1 �very inaccurate; 5 � very accurate).
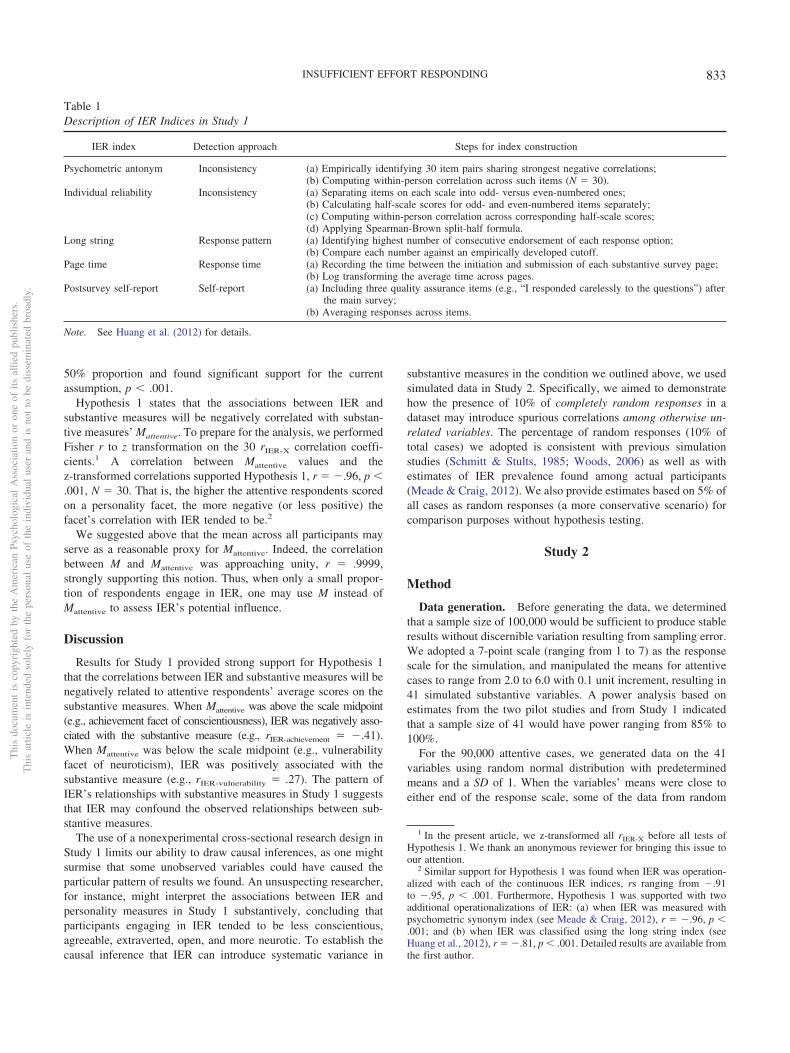
Insufficient effort responding. Huang et al. (2012, Study 2)operationalized IER with five indices: psychometric antonym,individual reliability, long string index, page time, and postsurveyself-report (see Table 1). They further found a single factor un-derlying all continuous IER indices (excluding long string index,which was dichotomous). To best capture the underlying IERconstruct and to avoid potential idiosyncratic effects attributable toany single IER index, we operationalized IER in Study 1 using thefirst factor scores saved from exploratory factor analysis on thecontinuous IER indices, with a higher score indicating greaterlikelihood of IER behavior.
Results
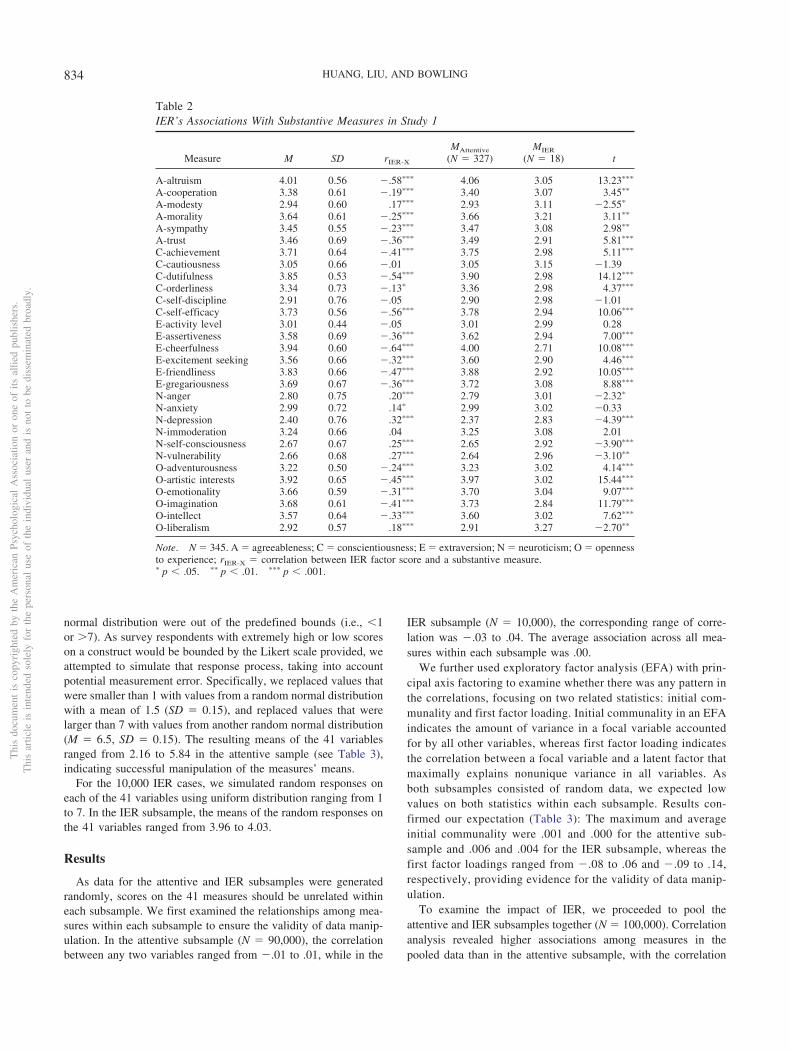
Table 2 presents descriptive statistics for each of the 30 person-ality facets, as well as correlation between the IER factor and eachfacet. The sizable correlations between the IER factor and eachfacet (i.e., rIER-X) are worth noting, ranging from �.64 to .32, with19 negative correlations and 7 positive ones reaching statisticalsignificance. As an initial step to testing Hypothesis 1, whichrequired the use of Mattentive, we proceeded to create two groups,with 5% of cases (see Huang et al., 2012) scoring highest on theIER factor identified as the IER group and the rest of the sampleclassified into the attentive group. The means for each group, aswell as independent samples t tests for the difference between thetwo groups (see Table 2) lent credence to the assumption that IERwould in general result in scores that center around the scalemidpoint of a substantive measure. Specifically, the IER groupscored significantly closer to the midpoint of “3” than the attentivegroup on 25 out of the 30 personality facets, with the exception ofthe five facets where attentive respondents also scored close to themidpoint of the response scale. We further tested this observedprobability (i.e., 25 out of 30) against a binomial distribution with
Thi
sdo
cum
ent
isco
pyri
ghte
dby
the
Am
eric
anPs
ycho
logi
cal
Ass
ocia
tion
oron
eof
itsal
lied
publ
ishe
rs.
Thi
sar
ticle
isin
tend
edso
lely
for
the
pers
onal
use
ofth
ein
divi
dual
user
and
isno
tto
bedi
ssem
inat
edbr
oadl
y.
832 HUANG, LIU, AND BOWLING
50% proportion and found significant support for the currentassumption, p � .001.
Hypothesis 1 states that the associations between IER andsubstantive measures will be negatively correlated with substan-tive measures’ Mattentive. To prepare for the analysis, we performedFisher r to z transformation on the 30 rIER-X correlation coeffi-cients.1 A correlation between Mattentive values and thez-transformed correlations supported Hypothesis 1, r � �.96, p �.001, N � 30. That is, the higher the attentive respondents scoredon a personality facet, the more negative (or less positive) thefacet’s correlation with IER tended to be.2
We suggested above that the mean across all participants mayserve as a reasonable proxy for Mattentive. Indeed, the correlationbetween M and Mattentive was approaching unity, r � .9999,strongly supporting this notion. Thus, when only a small propor-tion of respondents engage in IER, one may use M instead ofMattentive to assess IER’s potential influence.
Discussion
Results for Study 1 provided strong support for Hypothesis 1that the correlations between IER and substantive measures will benegatively related to attentive respondents’ average scores on thesubstantive measures. When Mattentive was above the scale midpoint(e.g., achievement facet of conscientiousness), IER was negatively asso-ciated with the substantive measure (e.g., rIER-achievement � �.41).When Mattentive was below the scale midpoint (e.g., vulnerabilityfacet of neuroticism), IER was positively associated with thesubstantive measure (e.g., rIER-vulnerability � .27). The pattern ofIER’s relationships with substantive measures in Study 1 suggeststhat IER may confound the observed relationships between sub-stantive measures.
The use of a nonexperimental cross-sectional research design inStudy 1 limits our ability to draw causal inferences, as one mightsurmise that some unobserved variables could have caused theparticular pattern of results we found. An unsuspecting researcher,for instance, might interpret the associations between IER andpersonality measures in Study 1 substantively, concluding thatparticipants engaging in IER tended to be less conscientious,agreeable, extraverted, open, and more neurotic. To establish thecausal inference that IER can introduce systematic variance in
substantive measures in the condition we outlined above, we usedsimulated data in Study 2. Specifically, we aimed to demonstratehow the presence of 10% of completely random responses in adataset may introduce spurious correlations among otherwise un-related variables. The percentage of random responses (10% oftotal cases) we adopted is consistent with previous simulationstudies (Schmitt & Stults, 1985; Woods, 2006) as well as withestimates of IER prevalence found among actual participants(Meade & Craig, 2012). We also provide estimates based on 5% ofall cases as random responses (a more conservative scenario) forcomparison purposes without hypothesis testing.
Study 2
Method
Data generation. Before generating the data, we determinedthat a sample size of 100,000 would be sufficient to produce stableresults without discernible variation resulting from sampling error.We adopted a 7-point scale (ranging from 1 to 7) as the responsescale for the simulation, and manipulated the means for attentivecases to range from 2.0 to 6.0 with 0.1 unit increment, resulting in41 simulated substantive variables. A power analysis based onestimates from the two pilot studies and from Study 1 indicatedthat a sample size of 41 would have power ranging from 85% to100%.
For the 90,000 attentive cases, we generated data on the 41variables using random normal distribution with predeterminedmeans and a SD of 1. When the variables’ means were close toeither end of the response scale, some of the data from random
1 In the present article, we z-transformed all rIER-X before all tests ofHypothesis 1. We thank an anonymous reviewer for bringing this issue toour attention.
2 Similar support for Hypothesis 1 was found when IER was operation-alized with each of the continuous IER indices, rs ranging from �.91to �.95, p � .001. Furthermore, Hypothesis 1 was supported with twoadditional operationalizations of IER: (a) when IER was measured withpsychometric synonym index (see Meade & Craig, 2012), r � �.96, p �.001; and (b) when IER was classified using the long string index (seeHuang et al., 2012), r � �.81, p � .001. Detailed results are available fromthe first author.
Table 1Description of IER Indices in Study 1
IER index Detection approach Steps for index construction
Psychometric antonym Inconsistency (a) Empirically identifying 30 item pairs sharing strongest negative correlations;(b) Computing within-person correlation across such items (N � 30).
Individual reliability Inconsistency (a) Separating items on each scale into odd- versus even-numbered ones;(b) Calculating half-scale scores for odd- and even-numbered items separately;(c) Computing within-person correlation across corresponding half-scale scores;(d) Applying Spearman-Brown split-half formula.
Long string Response pattern (a) Identifying highest number of consecutive endorsement of each response option;(b) Compare each number against an empirically developed cutoff.
Page time Response time (a) Recording the time between the initiation and submission of each substantive survey page;(b) Log transforming the average time across pages.
Postsurvey self-report Self-report (a) Including three quality assurance items (e.g., “I responded carelessly to the questions”) afterthe main survey;
(b) Averaging responses across items.
Note. See Huang et al. (2012) for details.
Thi
sdo
cum
ent
isco
pyri
ghte
dby
the
Am
eric
anPs
ycho
logi
cal
Ass
ocia
tion
oron
eof
itsal
lied
publ
ishe
rs.
Thi
sar
ticle
isin
tend
edso
lely
for
the
pers
onal
use
ofth
ein
divi
dual
user
and
isno
tto
bedi
ssem
inat
edbr
oadl
y.
833INSUFFICIENT EFFORT RESPONDING
normal distribution were out of the predefined bounds (i.e., �1or �7). As survey respondents with extremely high or low scoreson a construct would be bounded by the Likert scale provided, weattempted to simulate that response process, taking into accountpotential measurement error. Specifically, we replaced values thatwere smaller than 1 with values from a random normal distributionwith a mean of 1.5 (SD � 0.15), and replaced values that werelarger than 7 with values from another random normal distribution(M � 6.5, SD � 0.15). The resulting means of the 41 variablesranged from 2.16 to 5.84 in the attentive sample (see Table 3),indicating successful manipulation of the measures’ means.
For the 10,000 IER cases, we simulated random responses oneach of the 41 variables using uniform distribution ranging from 1to 7. In the IER subsample, the means of the random responses onthe 41 variables ranged from 3.96 to 4.03.
Results
As data for the attentive and IER subsamples were generatedrandomly, scores on the 41 measures should be unrelated withineach subsample. We first examined the relationships among mea-sures within each subsample to ensure the validity of data manip-ulation. In the attentive subsample (N � 90,000), the correlationbetween any two variables ranged from �.01 to .01, while in the
IER subsample (N � 10,000), the corresponding range of corre-lation was �.03 to .04. The average association across all mea-sures within each subsample was .00.
We further used exploratory factor analysis (EFA) with prin-cipal axis factoring to examine whether there was any pattern inthe correlations, focusing on two related statistics: initial com-munality and first factor loading. Initial communality in an EFAindicates the amount of variance in a focal variable accountedfor by all other variables, whereas first factor loading indicatesthe correlation between a focal variable and a latent factor thatmaximally explains nonunique variance in all variables. Asboth subsamples consisted of random data, we expected lowvalues on both statistics within each subsample. Results con-firmed our expectation (Table 3): The maximum and averageinitial communality were .001 and .000 for the attentive sub-sample and .006 and .004 for the IER subsample, whereas thefirst factor loadings ranged from �.08 to .06 and �.09 to .14,respectively, providing evidence for the validity of data manip-ulation.
To examine the impact of IER, we proceeded to pool theattentive and IER subsamples together (N � 100,000). Correlationanalysis revealed higher associations among measures in thepooled data than in the attentive subsample, with the correlation
Table 2IER’s Associations With Substantive Measures in Study 1
Measure M SD rIER-X
MAttentive MIER
t(N � 327) (N � 18)
A-altruism 4.01 0.56 �.58��� 4.06 3.05 13.23���
A-cooperation 3.38 0.61 �.19��� 3.40 3.07 3.45��
A-modesty 2.94 0.60 .17��� 2.93 3.11 �2.55�
A-morality 3.64 0.61 �.25��� 3.66 3.21 3.11��
A-sympathy 3.45 0.55 �.23��� 3.47 3.08 2.98��
A-trust 3.46 0.69 �.36��� 3.49 2.91 5.81���
C-achievement 3.71 0.64 �.41��� 3.75 2.98 5.11���
C-cautiousness 3.05 0.66 �.01 3.05 3.15 �1.39C-dutifulness 3.85 0.53 �.54��� 3.90 2.98 14.12���
C-orderliness 3.34 0.73 �.13� 3.36 2.98 4.37���
C-self-discipline 2.91 0.76 �.05 2.90 2.98 �1.01C-self-efficacy 3.73 0.56 �.56��� 3.78 2.94 10.06���
E-activity level 3.01 0.44 �.05 3.01 2.99 0.28E-assertiveness 3.58 0.69 �.36��� 3.62 2.94 7.00���
E-cheerfulness 3.94 0.60 �.64��� 4.00 2.71 10.08���
E-excitement seeking 3.56 0.66 �.32��� 3.60 2.90 4.46���
E-friendliness 3.83 0.66 �.47��� 3.88 2.92 10.05���
E-gregariousness 3.69 0.67 �.36��� 3.72 3.08 8.88���
N-anger 2.80 0.75 .20��� 2.79 3.01 �2.32�
N-anxiety 2.99 0.72 .14� 2.99 3.02 �0.33N-depression 2.40 0.76 .32��� 2.37 2.83 �4.39���
N-immoderation 3.24 0.66 .04 3.25 3.08 2.01N-self-consciousness 2.67 0.67 .25��� 2.65 2.92 �3.90���
N-vulnerability 2.66 0.68 .27��� 2.64 2.96 �3.10��
O-adventurousness 3.22 0.50 �.24��� 3.23 3.02 4.14���
O-artistic interests 3.92 0.65 �.45��� 3.97 3.02 15.44���
O-emotionality 3.66 0.59 �.31��� 3.70 3.04 9.07���
O-imagination 3.68 0.61 �.41��� 3.73 2.84 11.79���
O-intellect 3.57 0.64 �.33��� 3.60 3.02 7.62���
O-liberalism 2.92 0.57 .18��� 2.91 3.27 �2.70��
Note. N � 345. A � agreeableness; C � conscientiousness; E � extraversion; N � neuroticism; O � opennessto experience; rIER-X � correlation between IER factor score and a substantive measure.� p � .05. �� p � .01. ��� p � .001.
Thi
sdo
cum
ent
isco
pyri
ghte
dby
the
Am
eric
anPs
ycho
logi
cal
Ass
ocia
tion
oron
eof
itsal
lied
publ
ishe
rs.
Thi
sar
ticle
isin
tend
edso
lely
for
the
pers
onal
use
ofth
ein
divi
dual
user
and
isno
tto
bedi
ssem
inat
edbr
oadl
y.
834 HUANG, LIU, AND BOWLING
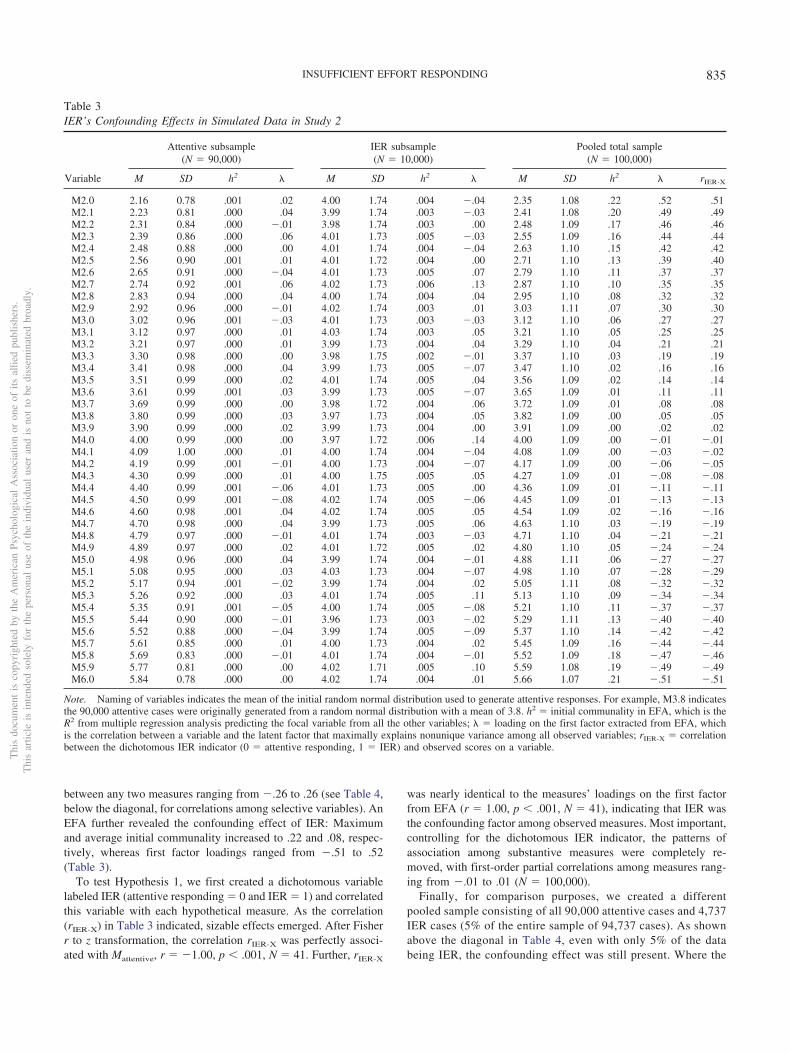
between any two measures ranging from �.26 to .26 (see Table 4,below the diagonal, for correlations among selective variables). AnEFA further revealed the confounding effect of IER: Maximumand average initial communality increased to .22 and .08, respec-tively, whereas first factor loadings ranged from �.51 to .52(Table 3).
To test Hypothesis 1, we first created a dichotomous variablelabeled IER (attentive responding � 0 and IER � 1) and correlatedthis variable with each hypothetical measure. As the correlation(rIER-X) in Table 3 indicated, sizable effects emerged. After Fisherr to z transformation, the correlation rIER-X was perfectly associ-ated with Mattentive, r � �1.00, p � .001, N � 41. Further, rIER-X
was nearly identical to the measures’ loadings on the first factorfrom EFA (r � 1.00, p � .001, N � 41), indicating that IER wasthe confounding factor among observed measures. Most important,controlling for the dichotomous IER indicator, the patterns ofassociation among substantive measures were completely re-moved, with first-order partial correlations among measures rang-ing from �.01 to .01 (N � 100,000).
Finally, for comparison purposes, we created a differentpooled sample consisting of all 90,000 attentive cases and 4,737IER cases (5% of the entire sample of 94,737 cases). As shownabove the diagonal in Table 4, even with only 5% of the databeing IER, the confounding effect was still present. Where the
Table 3IER’s Confounding Effects in Simulated Data in Study 2
Variable
Attentive subsample IER subsample Pooled total sample(N � 90,000) (N � 10,000) (N � 100,000)
M SD h2 � M SD h2 � M SD h2 � rIER-X
M2.0 2.16 0.78 .001 .02 4.00 1.74 .004 �.04 2.35 1.08 .22 .52 .51M2.1 2.23 0.81 .000 .04 3.99 1.74 .003 �.03 2.41 1.08 .20 .49 .49M2.2 2.31 0.84 .000 �.01 3.98 1.74 .003 .00 2.48 1.09 .17 .46 .46M2.3 2.39 0.86 .000 .06 4.01 1.73 .005 �.03 2.55 1.09 .16 .44 .44M2.4 2.48 0.88 .000 .00 4.01 1.74 .004 �.04 2.63 1.10 .15 .42 .42M2.5 2.56 0.90 .001 .01 4.01 1.72 .004 .00 2.71 1.10 .13 .39 .40M2.6 2.65 0.91 .000 �.04 4.01 1.73 .005 .07 2.79 1.10 .11 .37 .37M2.7 2.74 0.92 .001 .06 4.02 1.73 .006 .13 2.87 1.10 .10 .35 .35M2.8 2.83 0.94 .000 .04 4.00 1.74 .004 .04 2.95 1.10 .08 .32 .32M2.9 2.92 0.96 .000 �.01 4.02 1.74 .003 .01 3.03 1.11 .07 .30 .30M3.0 3.02 0.96 .001 �.03 4.01 1.73 .003 �.03 3.12 1.10 .06 .27 .27M3.1 3.12 0.97 .000 .01 4.03 1.74 .003 .05 3.21 1.10 .05 .25 .25M3.2 3.21 0.97 .000 .01 3.99 1.73 .004 .04 3.29 1.10 .04 .21 .21M3.3 3.30 0.98 .000 .00 3.98 1.75 .002 �.01 3.37 1.10 .03 .19 .19M3.4 3.41 0.98 .000 .04 3.99 1.73 .005 �.07 3.47 1.10 .02 .16 .16M3.5 3.51 0.99 .000 .02 4.01 1.74 .005 .04 3.56 1.09 .02 .14 .14M3.6 3.61 0.99 .001 .03 3.99 1.73 .005 �.07 3.65 1.09 .01 .11 .11M3.7 3.69 0.99 .000 .00 3.98 1.72 .004 .06 3.72 1.09 .01 .08 .08M3.8 3.80 0.99 .000 .03 3.97 1.73 .004 .05 3.82 1.09 .00 .05 .05M3.9 3.90 0.99 .000 .02 3.99 1.73 .004 .00 3.91 1.09 .00 .02 .02M4.0 4.00 0.99 .000 .00 3.97 1.72 .006 .14 4.00 1.09 .00 �.01 �.01M4.1 4.09 1.00 .000 .01 4.00 1.74 .004 �.04 4.08 1.09 .00 �.03 �.02M4.2 4.19 0.99 .001 �.01 4.00 1.73 .004 �.07 4.17 1.09 .00 �.06 �.05M4.3 4.30 0.99 .000 .01 4.00 1.75 .005 .05 4.27 1.09 .01 �.08 �.08M4.4 4.40 0.99 .001 �.06 4.01 1.73 .005 .00 4.36 1.09 .01 �.11 �.11M4.5 4.50 0.99 .001 �.08 4.02 1.74 .005 �.06 4.45 1.09 .01 �.13 �.13M4.6 4.60 0.98 .001 .04 4.02 1.74 .005 .05 4.54 1.09 .02 �.16 �.16M4.7 4.70 0.98 .000 .04 3.99 1.73 .005 .06 4.63 1.10 .03 �.19 �.19M4.8 4.79 0.97 .000 �.01 4.01 1.74 .003 �.03 4.71 1.10 .04 �.21 �.21M4.9 4.89 0.97 .000 .02 4.01 1.72 .005 .02 4.80 1.10 .05 �.24 �.24M5.0 4.98 0.96 .000 .04 3.99 1.74 .004 �.01 4.88 1.11 .06 �.27 �.27M5.1 5.08 0.95 .000 .03 4.03 1.73 .004 �.07 4.98 1.10 .07 �.28 �.29M5.2 5.17 0.94 .001 �.02 3.99 1.74 .004 .02 5.05 1.11 .08 �.32 �.32M5.3 5.26 0.92 .000 .03 4.01 1.74 .005 .11 5.13 1.10 .09 �.34 �.34M5.4 5.35 0.91 .001 �.05 4.00 1.74 .005 �.08 5.21 1.10 .11 �.37 �.37M5.5 5.44 0.90 .000 �.01 3.96 1.73 .003 �.02 5.29 1.11 .13 �.40 �.40M5.6 5.52 0.88 .000 �.04 3.99 1.74 .005 �.09 5.37 1.10 .14 �.42 �.42M5.7 5.61 0.85 .000 .01 4.00 1.73 .004 .02 5.45 1.09 .16 �.44 �.44M5.8 5.69 0.83 .000 �.01 4.01 1.74 .004 �.01 5.52 1.09 .18 �.47 �.46M5.9 5.77 0.81 .000 .00 4.02 1.71 .005 .10 5.59 1.08 .19 �.49 �.49M6.0 5.84 0.78 .000 .00 4.02 1.74 .004 .01 5.66 1.07 .21 �.51 �.51
Note. Naming of variables indicates the mean of the initial random normal distribution used to generate attentive responses. For example, M3.8 indicatesthe 90,000 attentive cases were originally generated from a random normal distribution with a mean of 3.8. h2 � initial communality in EFA, which is theR2 from multiple regression analysis predicting the focal variable from all the other variables; � � loading on the first factor extracted from EFA, whichis the correlation between a variable and the latent factor that maximally explains nonunique variance among all observed variables; rIER-X � correlationbetween the dichotomous IER indicator (0 � attentive responding, 1 � IER) and observed scores on a variable.
Thi
sdo
cum
ent
isco
pyri
ghte
dby
the
Am
eric
anPs
ycho
logi
cal
Ass
ocia
tion
oron
eof
itsal
lied
publ
ishe
rs.
Thi
sar
ticle
isin
tend
edso
lely
for
the
pers
onal
use
ofth
ein
divi
dual
user
and
isno
tto
bedi
ssem
inat
edbr
oadl
y.
835INSUFFICIENT EFFORT RESPONDING
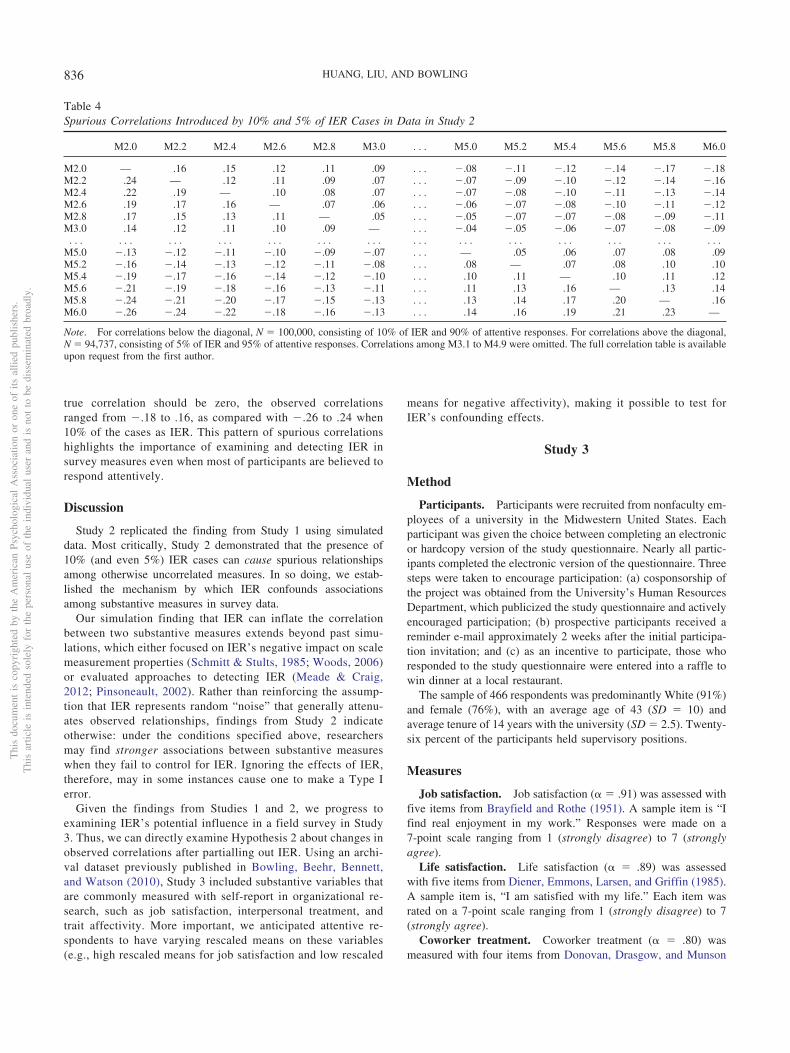
true correlation should be zero, the observed correlationsranged from �.18 to .16, as compared with �.26 to .24 when10% of the cases as IER. This pattern of spurious correlationshighlights the importance of examining and detecting IER insurvey measures even when most of participants are believed torespond attentively.
Discussion
Study 2 replicated the finding from Study 1 using simulateddata. Most critically, Study 2 demonstrated that the presence of10% (and even 5%) IER cases can cause spurious relationshipsamong otherwise uncorrelated measures. In so doing, we estab-lished the mechanism by which IER confounds associationsamong substantive measures in survey data.
Our simulation finding that IER can inflate the correlationbetween two substantive measures extends beyond past simu-lations, which either focused on IER’s negative impact on scalemeasurement properties (Schmitt & Stults, 1985; Woods, 2006)or evaluated approaches to detecting IER (Meade & Craig,2012; Pinsoneault, 2002). Rather than reinforcing the assump-tion that IER represents random “noise” that generally attenu-ates observed relationships, findings from Study 2 indicateotherwise: under the conditions specified above, researchersmay find stronger associations between substantive measureswhen they fail to control for IER. Ignoring the effects of IER,therefore, may in some instances cause one to make a Type Ierror.
Given the findings from Studies 1 and 2, we progress toexamining IER’s potential influence in a field survey in Study3. Thus, we can directly examine Hypothesis 2 about changes inobserved correlations after partialling out IER. Using an archi-val dataset previously published in Bowling, Beehr, Bennett,and Watson (2010), Study 3 included substantive variables thatare commonly measured with self-report in organizational re-search, such as job satisfaction, interpersonal treatment, andtrait affectivity. More important, we anticipated attentive re-spondents to have varying rescaled means on these variables(e.g., high rescaled means for job satisfaction and low rescaled
means for negative affectivity), making it possible to test forIER’s confounding effects.
Study 3
Method
Participants. Participants were recruited from nonfaculty em-ployees of a university in the Midwestern United States. Eachparticipant was given the choice between completing an electronicor hardcopy version of the study questionnaire. Nearly all partic-ipants completed the electronic version of the questionnaire. Threesteps were taken to encourage participation: (a) cosponsorship ofthe project was obtained from the University’s Human ResourcesDepartment, which publicized the study questionnaire and activelyencouraged participation; (b) prospective participants received areminder e-mail approximately 2 weeks after the initial participa-tion invitation; and (c) as an incentive to participate, those whoresponded to the study questionnaire were entered into a raffle towin dinner at a local restaurant.
The sample of 466 respondents was predominantly White (91%)and female (76%), with an average age of 43 (SD � 10) andaverage tenure of 14 years with the university (SD � 2.5). Twenty-six percent of the participants held supervisory positions.
Measures
Job satisfaction. Job satisfaction (� � .91) was assessed withfive items from Brayfield and Rothe (1951). A sample item is “Ifind real enjoyment in my work.” Responses were made on a7-point scale ranging from 1 (strongly disagree) to 7 (stronglyagree).
Life satisfaction. Life satisfaction (� � .89) was assessedwith five items from Diener, Emmons, Larsen, and Griffin (1985).A sample item is, “I am satisfied with my life.” Each item wasrated on a 7-point scale ranging from 1 (strongly disagree) to 7(strongly agree).
Coworker treatment. Coworker treatment (� � .80) wasmeasured with four items from Donovan, Drasgow, and Munson
Table 4Spurious Correlations Introduced by 10% and 5% of IER Cases in Data in Study 2
M2.0 M2.2 M2.4 M2.6 M2.8 M3.0 . . . M5.0 M5.2 M5.4 M5.6 M5.8 M6.0
M2.0 — .16 .15 .12 .11 .09 . . . �.08 �.11 �.12 �.14 �.17 �.18M2.2 .24 — .12 .11 .09 .07 . . . �.07 �.09 �.10 �.12 �.14 �.16M2.4 .22 .19 — .10 .08 .07 . . . �.07 �.08 �.10 �.11 �.13 �.14M2.6 .19 .17 .16 — .07 .06 . . . �.06 �.07 �.08 �.10 �.11 �.12M2.8 .17 .15 .13 .11 — .05 . . . �.05 �.07 �.07 �.08 �.09 �.11M3.0 .14 .12 .11 .10 .09 — . . . �.04 �.05 �.06 �.07 �.08 �.09
. . . . . . . . . . . . . . . . . . . . . . . . . . . . . . . . . . . . . . . . . .M5.0 �.13 �.12 �.11 �.10 �.09 �.07 . . . — .05 .06 .07 .08 .09M5.2 �.16 �.14 �.13 �.12 �.11 �.08 . . . .08 — .07 .08 .10 .10M5.4 �.19 �.17 �.16 �.14 �.12 �.10 . . . .10 .11 — .10 .11 .12M5.6 �.21 �.19 �.18 �.16 �.13 �.11 . . . .11 .13 .16 — .13 .14M5.8 �.24 �.21 �.20 �.17 �.15 �.13 . . . .13 .14 .17 .20 — .16M6.0 �.26 �.24 �.22 �.18 �.16 �.13 . . . .14 .16 .19 .21 .23 —
Note. For correlations below the diagonal, N � 100,000, consisting of 10% of IER and 90% of attentive responses. For correlations above the diagonal,N � 94,737, consisting of 5% of IER and 95% of attentive responses. Correlations among M3.1 to M4.9 were omitted. The full correlation table is availableupon request from the first author.
Thi
sdo
cum
ent
isco
pyri
ghte
dby
the
Am
eric
anPs
ycho
logi
cal
Ass
ocia
tion
oron
eof
itsal
lied
publ
ishe
rs.
Thi
sar
ticle
isin
tend
edso
lely
for
the
pers
onal
use
ofth
ein
divi
dual
user
and
isno
tto
bedi
ssem
inat
edbr
oadl
y.
836 HUANG, LIU, AND BOWLING
(1998). A sample item is “Coworkers treat me with respect.”Ratings were made on a 7-point scale ranging from 1 (stronglydisagree) to 7 (strongly agree).
Supervisor treatment. The supervisor treatment measure(� � .90) consisted of four items written to parallel the Donovanet al.’s (1998) coworker treatment items. A sample item is “Mysupervisor treats me with respect.” Each item was rated on a7-point scale ranging from 1 (strongly disagree) to 7 (stronglyagree).
Work centrality. Work centrality (� � .85) was measuredwith 12 items from Paullay, Alliger, and Stone-Romero (1994). Asample item is “Work should be considered central to life.” Re-sponses were made on a 7-point scale from 1 (strongly disagree)to 7 (strongly agree).
Core self-evaluations. Core self-evaluations (� � .82) wasassessed with 12 items from Judge et al. (2003). A sample item is“I am confident I get the success I deserve in life.” Each item wasrated on a 7-point scale ranging from 1 (strongly disagree) to 7(strongly agree).
Positive and negative affectivity. Positive affectivity (PA)and negative affectivity (NA; �s � .91 and .86) were assessed with10 items each from Watson, Clark, and Tellegen (1988). Each itemasked participants to describe how they generally feel. Sampleitems include “Excited” (PA) and “Upset” (NA). The items wererated on a 5-point scale from 1 (very slightly or not at all) to 5(extremely).
Insufficient effort responding. We assessed IER with anindividual reliability index (Jackson, 1976, as cited in Johnson,2005), which outperformed other IER measures in Meade andCraig’s (2012) simulation study (they referred to it as the“Even-Odd Consistency” index). Specifically, we calculatedhalf-measure scores using the odd-numbered and even-numbered items from each measure. Individual reliability wasbased on the within-person correlation between the odd andeven half-measures of the eight substantive measures (largervalues on the individual reliability index indicate higher within-person consistency and presumably lower levels of IER; seeHuang et al., 2012). So that higher scores on the IER indexwould indicate a greater degree of IER, we rescored the indi-
vidual reliability index by multiplying it by �1 (see Huang etal., 2014).
Results
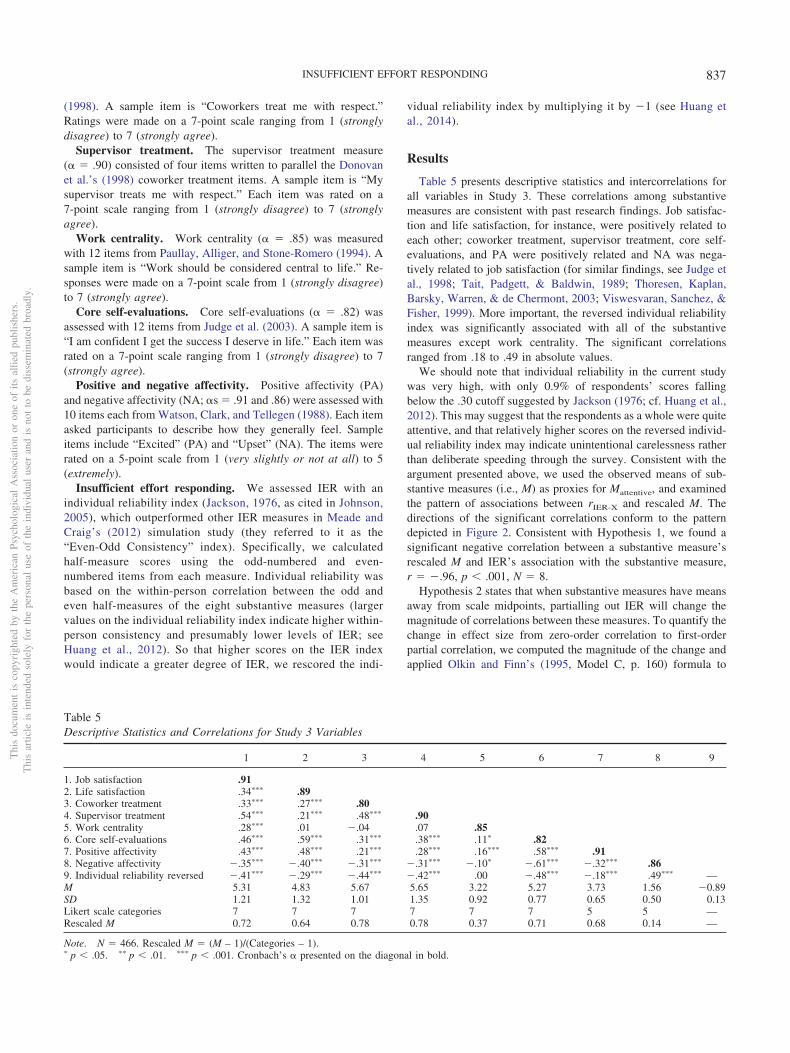
Table 5 presents descriptive statistics and intercorrelations forall variables in Study 3. These correlations among substantivemeasures are consistent with past research findings. Job satisfac-tion and life satisfaction, for instance, were positively related toeach other; coworker treatment, supervisor treatment, core self-evaluations, and PA were positively related and NA was nega-tively related to job satisfaction (for similar findings, see Judge etal., 1998; Tait, Padgett, & Baldwin, 1989; Thoresen, Kaplan,Barsky, Warren, & de Chermont, 2003; Viswesvaran, Sanchez, &Fisher, 1999). More important, the reversed individual reliabilityindex was significantly associated with all of the substantivemeasures except work centrality. The significant correlationsranged from .18 to .49 in absolute values.
We should note that individual reliability in the current studywas very high, with only 0.9% of respondents’ scores fallingbelow the .30 cutoff suggested by Jackson (1976; cf. Huang et al.,2012). This may suggest that the respondents as a whole were quiteattentive, and that relatively higher scores on the reversed individ-ual reliability index may indicate unintentional carelessness ratherthan deliberate speeding through the survey. Consistent with theargument presented above, we used the observed means of sub-stantive measures (i.e., M) as proxies for Mattentive, and examinedthe pattern of associations between rIER-X and rescaled M. Thedirections of the significant correlations conform to the patterndepicted in Figure 2. Consistent with Hypothesis 1, we found asignificant negative correlation between a substantive measure’srescaled M and IER’s association with the substantive measure,r � �.96, p � .001, N � 8.
Hypothesis 2 states that when substantive measures have meansaway from scale midpoints, partialling out IER will change themagnitude of correlations between these measures. To quantify thechange in effect size from zero-order correlation to first-orderpartial correlation, we computed the magnitude of the change andapplied Olkin and Finn’s (1995, Model C, p. 160) formula to
Table 5Descriptive Statistics and Correlations for Study 3 Variables
1 2 3 4 5 6 7 8 9
1. Job satisfaction .912. Life satisfaction .34��� .893. Coworker treatment .33��� .27��� .804. Supervisor treatment .54��� .21��� .48��� .905. Work centrality .28��� .01 �.04 .07 .856. Core self-evaluations .46��� .59��� .31��� .38��� .11� .827. Positive affectivity .43��� .48��� .21��� .28��� .16��� .58��� .918. Negative affectivity �.35��� �.40��� �.31��� �.31��� �.10� �.61��� �.32��� .869. Individual reliability reversed �.41��� �.29��� �.44��� �.42��� .00 �.48��� �.18��� .49��� —M 5.31 4.83 5.67 5.65 3.22 5.27 3.73 1.56 �0.89SD 1.21 1.32 1.01 1.35 0.92 0.77 0.65 0.50 0.13Likert scale categories 7 7 7 7 7 7 5 5 —Rescaled M 0.72 0.64 0.78 0.78 0.37 0.71 0.68 0.14 —
Note. N � 466. Rescaled M � (M – 1)/(Categories – 1).� p � .05. �� p � .01. ��� p � .001. Cronbach’s � presented on the diagonal in bold.
Thi
sdo
cum
ent
isco
pyri
ghte
dby
the
Am
eric
anPs
ycho
logi
cal
Ass
ocia
tion
oron
eof
itsal
lied
publ
ishe
rs.
Thi
sar
ticle
isin
tend
edso
lely
for
the
pers
onal
use
ofth
ein
divi
dual
user
and
isno
tto
bedi
ssem
inat
edbr
oadl
y.
837INSUFFICIENT EFFORT RESPONDING
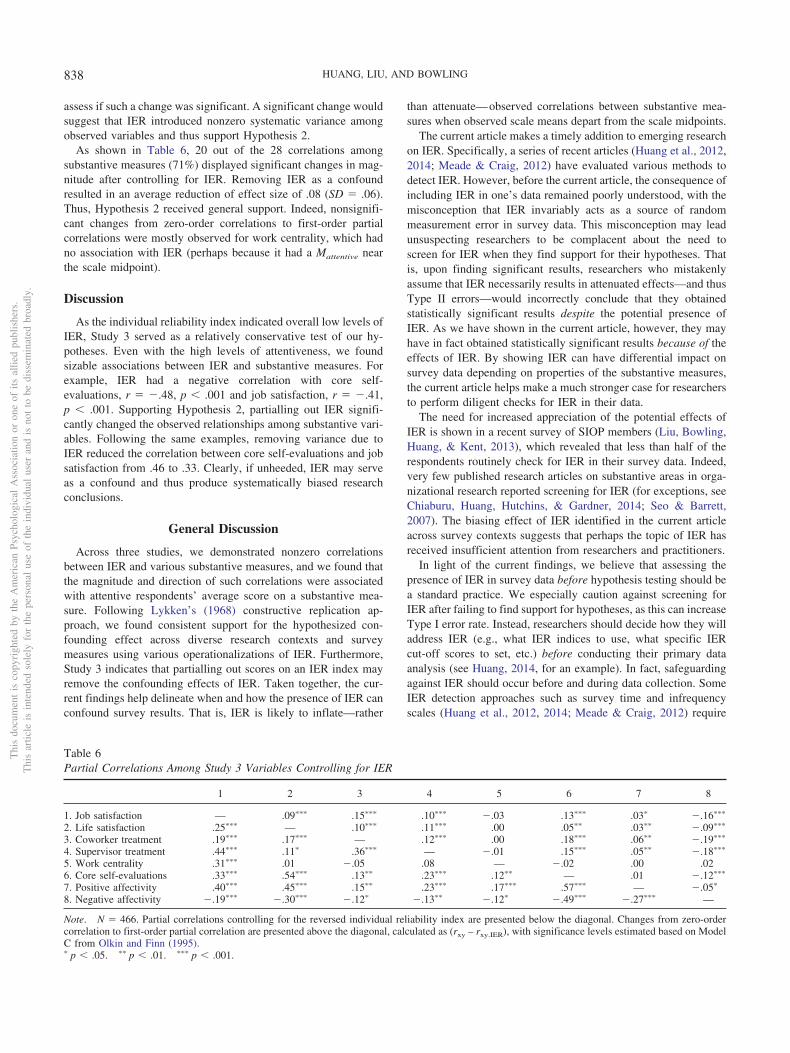
assess if such a change was significant. A significant change wouldsuggest that IER introduced nonzero systematic variance amongobserved variables and thus support Hypothesis 2.
As shown in Table 6, 20 out of the 28 correlations amongsubstantive measures (71%) displayed significant changes in mag-nitude after controlling for IER. Removing IER as a confoundresulted in an average reduction of effect size of .08 (SD � .06).Thus, Hypothesis 2 received general support. Indeed, nonsignifi-cant changes from zero-order correlations to first-order partialcorrelations were mostly observed for work centrality, which hadno association with IER (perhaps because it had a Mattentive nearthe scale midpoint).
Discussion
As the individual reliability index indicated overall low levels ofIER, Study 3 served as a relatively conservative test of our hy-potheses. Even with the high levels of attentiveness, we foundsizable associations between IER and substantive measures. Forexample, IER had a negative correlation with core self-evaluations, r � �.48, p � .001 and job satisfaction, r � �.41,p � .001. Supporting Hypothesis 2, partialling out IER signifi-cantly changed the observed relationships among substantive vari-ables. Following the same examples, removing variance due toIER reduced the correlation between core self-evaluations and jobsatisfaction from .46 to .33. Clearly, if unheeded, IER may serveas a confound and thus produce systematically biased researchconclusions.
General Discussion
Across three studies, we demonstrated nonzero correlationsbetween IER and various substantive measures, and we found thatthe magnitude and direction of such correlations were associatedwith attentive respondents’ average score on a substantive mea-sure. Following Lykken’s (1968) constructive replication ap-proach, we found consistent support for the hypothesized con-founding effect across diverse research contexts and surveymeasures using various operationalizations of IER. Furthermore,Study 3 indicates that partialling out scores on an IER index mayremove the confounding effects of IER. Taken together, the cur-rent findings help delineate when and how the presence of IER canconfound survey results. That is, IER is likely to inflate—rather
than attenuate—observed correlations between substantive mea-sures when observed scale means depart from the scale midpoints.
The current article makes a timely addition to emerging researchon IER. Specifically, a series of recent articles (Huang et al., 2012,2014; Meade & Craig, 2012) have evaluated various methods todetect IER. However, before the current article, the consequence ofincluding IER in one’s data remained poorly understood, with themisconception that IER invariably acts as a source of randommeasurement error in survey data. This misconception may leadunsuspecting researchers to be complacent about the need toscreen for IER when they find support for their hypotheses. Thatis, upon finding significant results, researchers who mistakenlyassume that IER necessarily results in attenuated effects—and thusType II errors—would incorrectly conclude that they obtainedstatistically significant results despite the potential presence ofIER. As we have shown in the current article, however, they mayhave in fact obtained statistically significant results because of theeffects of IER. By showing IER can have differential impact onsurvey data depending on properties of the substantive measures,the current article helps make a much stronger case for researchersto perform diligent checks for IER in their data.
The need for increased appreciation of the potential effects ofIER is shown in a recent survey of SIOP members (Liu, Bowling,Huang, & Kent, 2013), which revealed that less than half of therespondents routinely check for IER in their survey data. Indeed,very few published research articles on substantive areas in orga-nizational research reported screening for IER (for exceptions, seeChiaburu, Huang, Hutchins, & Gardner, 2014; Seo & Barrett,2007). The biasing effect of IER identified in the current articleacross survey contexts suggests that perhaps the topic of IER hasreceived insufficient attention from researchers and practitioners.
In light of the current findings, we believe that assessing thepresence of IER in survey data before hypothesis testing should bea standard practice. We especially caution against screening forIER after failing to find support for hypotheses, as this can increaseType I error rate. Instead, researchers should decide how they willaddress IER (e.g., what IER indices to use, what specific IERcut-off scores to set, etc.) before conducting their primary dataanalysis (see Huang, 2014, for an example). In fact, safeguardingagainst IER should occur before and during data collection. SomeIER detection approaches such as survey time and infrequencyscales (Huang et al., 2012, 2014; Meade & Craig, 2012) require
Table 6Partial Correlations Among Study 3 Variables Controlling for IER
1 2 3 4 5 6 7 8
1. Job satisfaction — .09��� .15��� .10��� �.03 .13��� .03� �.16���
2. Life satisfaction .25��� — .10��� .11��� .00 .05�� .03�� �.09���
3. Coworker treatment .19��� .17��� — .12��� .00 .18��� .06�� �.19���
4. Supervisor treatment .44��� .11� .36��� — �.01 .15��� .05�� �.18���
5. Work centrality .31��� .01 �.05 .08 — �.02 .00 .026. Core self-evaluations .33��� .54��� .13�� .23��� .12�� — .01 �.12���
7. Positive affectivity .40��� .45��� .15�� .23��� .17��� .57��� — �.05�
8. Negative affectivity �.19��� �.30��� �.12� �.13�� �.12� �.49��� �.27��� —
Note. N � 466. Partial correlations controlling for the reversed individual reliability index are presented below the diagonal. Changes from zero-ordercorrelation to first-order partial correlation are presented above the diagonal, calculated as (rxy – rxy.IER), with significance levels estimated based on ModelC from Olkin and Finn (1995).� p � .05. �� p � .01. ��� p � .001.
Thi
sdo
cum
ent
isco
pyri
ghte
dby
the
Am
eric
anPs
ycho
logi
cal
Ass
ocia
tion
oron
eof
itsal
lied
publ
ishe
rs.
Thi
sar
ticle
isin
tend
edso
lely
for
the
pers
onal
use
ofth
ein
divi
dual
user
and
isno
tto
bedi
ssem
inat
edbr
oadl
y.
838 HUANG, LIU, AND BOWLING
planning before survey administration. Furthermore, the surveyadministrator should strive to properly motivate respondents toprovide quality data (e.g., by issuing a benign warning about datascreening; Huang et al., 2014).
Implications for Future Research
By challenging the prevailing assumption that IER is always asource of random measurement error, the current research providescompelling evidence that IER can inflate the strength of observedrelationships by introducing common method variance. In thatregard, our finding echoes Williams and Brown (1994) in that theuse of a common method (i.e., self-report survey) can introducesizable correlations when there is indeed no underlying relation-ship. However, unlike the other sources of common method vari-ance (see Podsakoff et al., 2003 for a summary), the mechanismsthrough which IER produces systematic error variance depends onthe means of attentive respondents on the substantive measures.Thus, our finding confirmed Spector’s (2006) observation thatreliance on self-report does not automatically inflate observedcorrelations because of the common method. Instead, the presenceof a small percentage of IER (e.g., as little as 5% of the totalsample), combined with an Mattentive near either end of the re-sponse scale, can inflate observed correlations and should beconsidered as a special case of method bias. With the availabilityof multiple IER detection approaches (Huang et al., 2012, 2014;Meade & Craig, 2012), survey researchers may now model IER asa specific unique method factor (see Williams, Hartman, & Cava-zotte, 2010).
The current finding that NA was contaminated by IER (r � .49in Study 3) points to an interesting direction for common methodvariance research, as NA has often been examined as a biasingfactor (Spector, 2006). If agreement to NA items is in part taintedby high IER behavior, controlling for scores on NA may inadver-tently control for IER. Thus, the current findings suggest thatprevious studies regarding the biasing effects of NA should bere-examined to first rule out potential influence of IER.
A notable limitation of the current article is the focus on IER’sinfluence in self-report survey data measured at a single time point.In that regard, our article simply offers additional evidence to thecommonly shared notion that empirical findings based on cross-sectional self-report data warrant great scrutiny (see Kozlowski,2009). Nevertheless, by raising attention to IER, our article laysthe groundwork for a better understanding of IER’s influence inother types of research designs. We highlight three areas for futureresearch. First, researchers may examine IER in conjunction withnonself-report variables. For example, when employees reportpersonality variables and supervisors rate their job performance,one may expect IER in personality measures to generally act asmeasurement error and attenuate expected associations betweenpersonality traits and job performance (see McGrath et al., 2010).Second, researchers may start to investigate the stability of IERbehavior across surveys. That is, a few respondents may engage inIER behavior repeatedly in different waves of a longitudinal study.How such consistent IER behavior may affect survey results needsfurther examination. Finally, the spurious relationships betweenIER and substantive variables prevented us from identifying indi-vidual characteristics that give rise to IER behavior. Future re-
search can use observer-reported personality (e.g., Oh, Wang, &Mount, 2011) as predictors of IER in self-report surveys.
The current research points to the need to better understandsurvey contexts. Specifically, we call for researchers to movebeyond the type of samples (e.g., undergraduates, employees; Liuet al., 2013) and to consider contextual features that may influenceIER behavior. One such contextual feature is the perceived obli-gation to complete the survey. Undergraduate students may par-ticipate in surveys to earn extra credit or fulfill course obligation(Meade & Craig, 2012), whereas employees may perceive pressurefrom supervisors to complete a workplace questionnaire. It isconceivable that under such circumstances, IER may occur be-cause respondents are motivated to complete the survey withoutclear incentive for data quality.
A second contextual feature worth exploring is survey payment.Paid participants may range from community or organizationalsamples responding to surveys in exchange for monetary rewards,to crowdsourcing survey respondents such as Amazon’s MTurk(Mechanical Turk). Of interest to the authors, mixed results werereported regarding data quality from MTurk, with some studiessupporting its use (e.g., Buhrmester, Kwang, & Gosling, 2011),whereas others suggesting higher rates of IER within MTurksamples (e.g., Goodman, Cryder, & Cheema, 2013). One mightconjecture that IER will occur less frequently when survey pay-ment is somewhat contingent on data quality.
Another area in need of future research is the intersectionbetween IER and other response sets, such as socially desirableresponding and acquiescence (Huang et al., 2014). For instance, inorganizational surveys where employees doubt the anonymity ofsurvey results, IER behavior may result in acquiescence, that is,agreeing to positive attributes without reflecting on one’s trueperception. The extent to which IER coupled with other responsesets will result in the same pattern of biasing effects remains to beinvestigated.
Practical Implications
The current article highlights the importance of screening forIER, even in situations where survey respondents are believed tobe generally motivated and attentive. For organizational surveys,such as test validation, needs assessment, and multisource feed-back, the presence of IER can exert unexpected effects for theunprepared survey administrator. The consequences of having IERin applied data can pose costly issues for organizations, such asfalsely adopting an invalid selection test (or not adopting a validtest). Given the prevalence of self-reports in organizational set-tings, practitioners should be cognizant of the issues surroundingIER in survey administration/analysis.
In practice, one can use different operationalizations of IERdepending on the context (see Huang et al., 2012, 2014; Meade &Craig, 2012). With an effective IER measure, applied surveyadministrators can first examine if IER is related to substantivemeasures with Ms away from the midpoints of response scales.When evidence of biasing effect is found, practitioners can eithercontrol for the IER scores in subsequent analyses, or developcutoffs rationally or empirically (Huang et al., 2012) to screen outextreme forms of IER.
Thi
sdo
cum
ent
isco
pyri
ghte
dby
the
Am
eric
anPs
ycho
logi
cal
Ass
ocia
tion
oron
eof
itsal
lied
publ
ishe
rs.
Thi
sar
ticle
isin
tend
edso
lely
for
the
pers
onal
use
ofth
ein
divi
dual
user
and
isno
tto
bedi
ssem
inat
edbr
oadl
y.
839INSUFFICIENT EFFORT RESPONDING
Conclusion
We demonstrated that IER can serve as a source of commonvariance that confounds relationships between substantive mea-sures. Contrary to the traditional view that IER necessarily atten-uates observed bivariate relationships (e.g., McGrath et al., 2010),the current article showed that the presence of IER can inflate themagnitude of observed correlations between substantive measureswhen scale means depart from the scale midpoints. By showingthat the systematic effects of IER are contingent upon the mean ofattentive respondents on a substantive measure, we illuminated anadditional mechanism through which IER can pose a threat onsurvey data quality.
References
Behrend, T. S., Sharek, D. J., Meade, A. W., & Wiebe, E. N. (2011). Theviability of crowdsourcing for survey research. Behavior ResearchMethods, 43, 800–813. http://dx.doi.org/10.3758/s13428-011-0081-0
Bliese, P. D., & Hanges, P. J. (2004). Being both too liberal and tooconservative: The perils of treating grouped data as though they wereindependent. Organizational Research Methods, 7, 400–417. http://dx.doi.org/10.1177/1094428104268542
Bowling, N. A., Beehr, T. A., Bennett, M. M., & Watson, C. P. (2010).Target personality and workplace victimization: A prospective analysis.Work & Stress, 24, 140–158. http://dx.doi.org/10.1080/02678373.2010.489635
Bowling, N. A., & Hammond, G. D. (2008). A meta-analytic examinationof the construct validity of the Michigan Organizational AssessmentQuestionnaire Job Satisfaction Subscale. Journal of Vocational Behav-ior, 73, 63–77. http://dx.doi.org/10.1016/j.jvb.2008.01.004
Bowling, N. A., Hoepf, M. R., LaHuis, D. M., & Lepisto, L. R. (2013).Mean job satisfaction levels over time: Are things bad and gettingworse? The Industrial-Organizational psychologist, 50, 57–64.
Brayfield, A. H., & Rothe, H. F. (1951). An index of job satisfaction.Journal of Applied Psychology, 35, 307–311. http://dx.doi.org/10.1037/h0055617
Buechley, R., & Ball, H. (1952). A new test of validity for the groupMMPI. Journal of Consulting Psychology, 16, 299–301. http://dx.doi.org/10.1037/h0053897
Buhrmester, M., Kwang, T., & Gosling, S. D. (2011). Amazon’s Mechan-ical Turk a new source of inexpensive, yet high-quality, data? Perspec-tives on Psychological Science, 6, 3–5. http://dx.doi.org/10.1177/1745691610393980
Calsyn, R. J., & Winter, J. P. (1999). Understanding and controllingresponse bias in needs assessment studies. Evaluation Review, 23, 399–417. http://dx.doi.org/10.1177/0193841X9902300403
Chiaburu, D. S., Huang, J. L., Hutchins, H. M., & Gardner, R. G. (2014).Trainees’ perceived knowledge gain unrelated to the training domain:The joint action of impression management and motives. InternationalJournal of Training and Development, 18, 37–52. http://dx.doi.org/10.1111/ijtd.12021
Diener, E., Emmons, R. A., Larsen, R. J., & Griffin, S. (1985). TheSatisfaction With Life Scale. Journal of Personality Assessment, 49,71–75. http://dx.doi.org/10.1207/s15327752jpa4901_13
Donovan, M. A., Drasgow, F., & Munson, L. J. (1998). The Perceptions ofFair Interpersonal Treatment Scale: Development and validation of ameasure of interpersonal treatment in the workplace. Journal of AppliedPsychology, 83, 683– 692. http://dx.doi.org/10.1037/0021-9010.83.5.683
Fox, S., Spector, P. E., Goh, A., Bruursema, K., & Kessler, S. R. (2012).The deviant citizen: Measuring potential positive relations betweencounterproductive work behaviour and organizational citizenship behav-
iour. Journal of Occupational and Organizational Psychology, 85, 199–220. http://dx.doi.org/10.1111/j.2044-8325.2011.02032.x
Goodman, J. K., Cryder, C. E., & Cheema, A. (2013). Data collection in aflat world: The strengths and weaknesses of Mechanical Turk samples.Journal of Behavioral Decision Making, 26, 213–224. http://dx.doi.org/10.1002/bdm.1753
Green, S. B., & Stutzman, T. (1986). An evaluation of methods to selectrespondents to structured job-analysis questionnaires. Personnel Psy-chology, 39, 543–564. http://dx.doi.org/10.1111/j.1744-6570.1986.tb00952.x
Greenbaum, R. L., Mawritz, M. B., & Eissa, G. (2012). Bottom-linementality as an antecedent of social undermining and the moderatingroles of core self-evaluations and conscientiousness. Journal of AppliedPsychology, 97, 343–359. http://dx.doi.org/10.1037/a0025217
Hough, L. M., Eaton, N. K., Dunnette, M. D., Kamp, J. D., & McCloy,R. A. (1990). Criterion-related validities of personality constructs andthe effect of response distortion on those validities. Journal of AppliedPsychology, 75, 581–595. http://dx.doi.org/10.1037/0021-9010.75.5.581
Huang, J. L. (2014). Does cleanliness influence moral judgments? Re-sponse effort moderates the effect of cleanliness priming on moraljudgment. Frontiers in Psychology, 5, 1–8. http://dx.doi.org/10.3389/fpsyg.2014.01276
Huang, J. L., Bowling, N. A., Liu, M., & Li, Y. (2014). Detectinginsufficient effort responding with an infrequency scale: Evaluatingvalidity and participant reactions. [Advance online publication]. Journalof Business and Psychology. Advance online publication. http://dx.doi.org/10.1007/s10869-014-9357-6
Huang, J. L., Curran, P. G., Keeney, J., Poposki, E. M., & DeShon, R. P.(2012). Detecting and deterring insufficient effort respond to surveys.Journal of Business and Psychology, 27, 99–114. http://dx.doi.org/10.1007/s10869-011-9231-8
Jackson, D. N. (1976). The appraisal of personal reliability. Paper pre-sented at the meetings of the Society of Multivariate ExperimentalPsychology, University Park, PA.
Johnson, J. A. (2005). Ascertaining the validity of individual protocolsfrom Web-based personality inventories. Journal of Research in Per-sonality, 39, 103–129. http://dx.doi.org/10.1016/j.jrp.2004.09.009
Judge, T. A., Erez, A., Bono, J. E., & Thoresen, C. J. (2003). The coreself-evaluations scale: Development of a measure. Personnel Psychol-ogy, 56, 303–331. http://dx.doi.org/10.1111/j.1744-6570.2003.tb00152.x
Judge, T. A., Locke, E. A., Durham, C. C., & Kluger, A. N. (1998).Dispositional effects on job and life satisfaction: The role of coreevaluations. Journal of Applied Psychology, 83, 17–34. http://dx.doi.org/10.1037/0021-9010.83.1.17
Kenny, D. A., & Judd, C. M. (1986). Consequences of violating theindependence assumption in analysis of variance. Psychological Bulle-tin, 99, 422–431. http://dx.doi.org/10.1037/0033-2909.99.3.422
Kepes, S., & McDaniel, M. A. (2013). How trustworthy is the scientificliterature in industrial and organizational psychology? Industrial andOrganizational Psychology: Perspectives on Science and Practice, 6,252–268. http://dx.doi.org/10.1111/iops.12045
Kozlowski, S. W. J. (2009). Editorial. Journal of Applied Psychology, 94,1–4. http://dx.doi.org/10.1037/a0014990
Linton, D. K., & Power, J. L. (2013). The personality traits of workplacebullies are often shared by their victims: Is there a dark side to victims?Personality and Individual Differences, 54, 738–743. http://dx.doi.org/10.1016/j.paid.2012.11.026
Liu, M., Bowling, N. A., Huang, J. L., & Kent, T. (2013). Insufficienteffort responding to surveys as a threat to validity: The perceptions andpractices of SIOP members. The Industrial-Organizational psychologist,51, 32–38.
Thi
sdo
cum
ent
isco
pyri
ghte
dby
the
Am
eric
anPs
ycho
logi
cal
Ass
ocia
tion
oron
eof
itsal
lied
publ
ishe
rs.
Thi
sar
ticle
isin
tend
edso
lely
for
the
pers
onal
use
ofth
ein
divi
dual
user
and
isno
tto
bedi
ssem
inat
edbr
oadl
y.
840 HUANG, LIU, AND BOWLING
Lykken, D. T. (1968). Statistical significance in psychological research.Psychological Bulletin, 70, 151–159. http://dx.doi.org/10.1037/h0026141
McGrath, R. E., Mitchell, M., Kim, B. H., & Hough, L. (2010). Evidencefor response bias as a source of error variance in applied assessment.Psychological Bulletin, 136, 450 – 470. http://dx.doi.org/10.1037/a0019216
Meade, A. W., & Craig, S. B. (2012). Identifying careless responses insurvey data. Psychological Methods, 17, 437–455. http://dx.doi.org/10.1037/a0028085
Oh, I. S., Wang, G., & Mount, M. K. (2011). Validity of observer ratingsof the five-factor model of personality traits: A meta-analysis. Journal ofApplied Psychology, 96, 762–773. http://dx.doi.org/10.1037/a0021832
Olkin, I., & Finn, J. D. (1995). Correlations redux. Psychological Bulletin,118, 155–164. http://dx.doi.org/10.1037/0033-2909.118.1.155
Paullay, I. M., Alliger, G. M., & Stone-Romero, E. F. (1994). Constructvalidation of two instruments designed to measure job involvement andwork centrality. Journal of Applied Psychology, 79, 224–228. http://dx.doi.org/10.1037/0021-9010.79.2.224
Pinsoneault, T. B. (2002). A variable response inconsistency scale and atrue response inconsistency scale for the Millon Adolescent ClinicalInventory. Psychological Assessment, 14, 320–330. http://dx.doi.org/10.1037/1040-3590.14.3.320
Podsakoff, P. M., MacKenzie, S. B., Lee, J. Y., & Podsakoff, N. P. (2003).Common method biases in behavioral research: A critical review of theliterature and recommended remedies. Journal of Applied Psychology,88, 879–903. http://dx.doi.org/10.1037/0021-9010.88.5.879
Schmitt, N., & Stults, D. M. (1985). Factors defined by negatively keyeditems: The result of careless respondents? Applied Psychological Mea-surement, 9, 367–373. http://dx.doi.org/10.1177/014662168500900405
Seo, M. G., & Barrett, L. F. (2007). Being emotional during decisionmaking, good or bad? An empirical investigation. Academy of Manage-ment Journal, 50, 923–940. http://dx.doi.org/10.5465/AMJ.2007.26279217
Simons, D. J. (2014). The value of direct replication. Perspectives onPsychological Science, 9, 76 – 80. http://dx.doi.org/10.1177/1745691613514755
Spearman, C. (1904). The proof and measurement of association betweentwo things. The American Journal of Psychology, 15, 72–101. http://dx.doi.org/10.2307/1412159
Spector, P. E. (1994). Using self-report questionnaires in OB research: Acomment on the use of a controversial method. Journal of Organiza-tional Behavior, 15, 385–392. http://dx.doi.org/10.1002/job.4030150503
Spector, P. E. (2006). Method variance in organizational research: Truth orurban legend? Organizational Research Methods, 9, 221–232. http://dx.doi.org/10.1177/1094428105284955
Spector, P. E., Fox, S., Penney, L. M., Bruursema, K., Goh, A., & Kessler,S. (2006). The dimensionality of counterproductivity: Are all counter-productive behaviors created equal? Journal of Vocational Behavior, 68,446–460. http://dx.doi.org/10.1016/j.jvb.2005.10.005
Tait, M., Padgett, M. Y., & Baldwin, T. T. (1989). Job and life satisfaction:A reevaluation of the strength of the relationship and gender effects asa function of the date of the study. Journal of Applied Psychology, 74,502–507. http://dx.doi.org/10.1037/0021-9010.74.3.502
Thoresen, C. J., Kaplan, S. A., Barsky, A. P., Warren, C. R., & deChermont, K. (2003). The affective underpinnings of job perceptionsand attitudes: A meta-analytic review and integration. PsychologicalBulletin, 129, 914 –945. http://dx.doi.org/10.1037/0033-2909.129.6.914
Viswesvaran, C., Sanchez, J. I., & Fisher, J. (1999). The role of socialsupport in the process of work stress: A meta-analysis. Journal ofVocational Behavior, 54, 314–334. http://dx.doi.org/10.1006/jvbe.1998.1661
Watson, D., Clark, L. A., & Tellegen, A. (1988). Development and vali-dation of brief measures of positive and negative affect: The PANASscales. Journal of Personality and Social Psychology, 54, 1063–1070.http://dx.doi.org/10.1037/0022-3514.54.6.1063
Williams, L. J., & Brown, B. K. (1994). Method variance in organizationalbehavior and human resources research: Effects on correlations, pathcoefficients, and hypothesis testing. Organizational Behavior and Hu-man Decision Processes, 57, 185–209. http://dx.doi.org/10.1006/obhd.1994.1011
Williams, L. J., Hartman, N., & Cavazotte, F. (2010). Method variance andmarker variables: A review and comprehensive CFA marker technique.Organizational Research Methods, 13, 477–514. http://dx.doi.org/10.1177/1094428110366036
Woods, C. M. (2006). Careless responding to reverse-worded items: Im-plications for confirmatory factor analysis. Journal of Psychopathologyand Behavioral Assessment, 28, 186–191. http://dx.doi.org/10.1007/s10862-005-9004-7
Zagenczyk, T., Cruz, K., Woodard, A., Walker, J. J., Few, W. W., Kiazad,K., & Raja, M. (2013). The moderating effect of Machiavellianism onthe psychological contract breach-organizational identification/disidentification relationships. Journal of Business and Psychology, 28,287–299. http://dx.doi.org/10.1007/s10869-012-9278-1
(Appendix follows)
Thi
sdo
cum
ent
isco
pyri
ghte
dby
the
Am
eric
anPs
ycho
logi
cal
Ass
ocia
tion
oron
eof
itsal
lied
publ
ishe
rs.
Thi
sar
ticle
isin
tend
edso
lely
for
the
pers
onal
use
ofth
ein
divi
dual
user
and
isno
tto
bedi
ssem
inat
edbr
oadl
y.
841INSUFFICIENT EFFORT RESPONDING
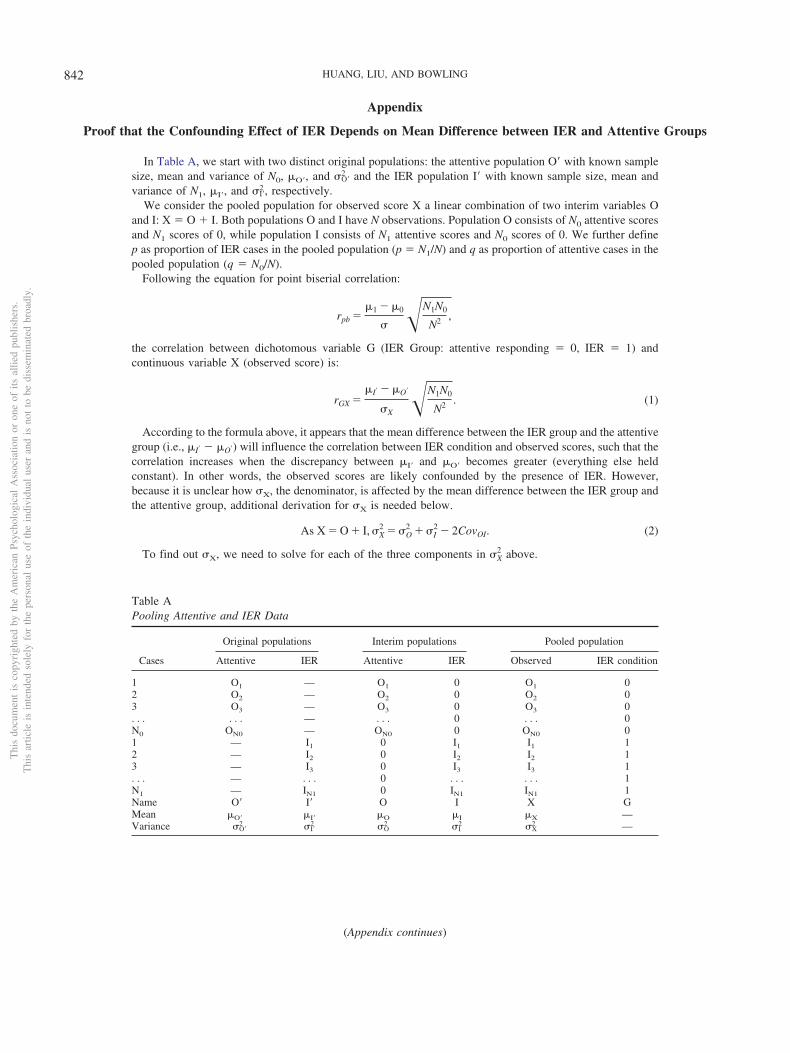
Appendix
Proof that the Confounding Effect of IER Depends on Mean Difference between IER and Attentive Groups
In Table A, we start with two distinct original populations: the attentive population O= with known samplesize, mean and variance of N0, O=, and O=
2 and the IER population I= with known sample size, mean andvariance of N1, I=, and I=
2 , respectively.We consider the pooled population for observed score X a linear combination of two interim variables O
and I: X � O � I. Both populations O and I have N observations. Population O consists of N0 attentive scoresand N1 scores of 0, while population I consists of N1 attentive scores and N0 scores of 0. We further definep as proportion of IER cases in the pooled population (p � N1/N) and q as proportion of attentive cases in thepooled population (q � N0/N).
Following the equation for point biserial correlation:
rpb ��1 � �0
� �N1N0
N2 ,
the correlation between dichotomous variable G (IER Group: attentive responding � 0, IER � 1) andcontinuous variable X (observed score) is:
rGX ��I� � �O�
�X�N1N0
N2 . (1)
According to the formula above, it appears that the mean difference between the IER group and the attentivegroup (i.e., �I� � �O�) will influence the correlation between IER condition and observed scores, such that thecorrelation increases when the discrepancy between I= and O= becomes greater (everything else heldconstant). In other words, the observed scores are likely confounded by the presence of IER. However,because it is unclear how X, the denominator, is affected by the mean difference between the IER group andthe attentive group, additional derivation for X is needed below.
As X � O � I, �X2 � �O
2 � �I2 � 2CovOI. (2)
To find out X, we need to solve for each of the three components in �X2 above.
Table APooling Attentive and IER Data
Cases
Original populations Interim populations Pooled population
Attentive IER Attentive IER Observed IER condition
1 O1 — O1 0 O1 02 O2 — O2 0 O2 03 O3 — O3 0 O3 0. . . . . . — . . . 0 . . . 0N0 ON0 — ON0 0 ON0 01 — I1 0 I1 I1 12 — I2 0 I2 I2 13 — I3 0 I3 I3 1. . . — . . . 0 . . . . . . 1N1 — IN1 0 IN1 IN1 1Name O= I= O I X GMean O= I= O I X —Variance O=
2 I=2 O
2 I2 X
2 —
(Appendix continues)
Thi
sdo
cum
ent
isco
pyri
ghte
dby
the
Am
eric
anPs
ycho
logi
cal
Ass
ocia
tion
oron
eof
itsal
lied
publ
ishe
rs.
Thi
sar
ticle
isin
tend
edso
lely
for
the
pers
onal
use
ofth
ein
divi
dual
user
and
isno
tto
bedi
ssem
inat
edbr
oadl
y.
842 HUANG, LIU, AND BOWLING

Following the computational formula for variance:
�2 �
� X2 ��� X�2
N
N,
variance of the interim variable O is:
�O2 �
� O2 ��� O�2
N
N. (3)
As
�O�2
�
� O2 ��� O�2
N0
N0�
� O2 ��� O�2
qN
qN
and
�O� �� O
N0�
� O
qN
(where q � N0/N), we can rearrange the equations and express �O2 and �O in the following two equations:
� O2 � qN · �O�2
��� O�2
qN, (4)
and
� O � qN · �O�. (5)
Thus, we can rewrite Equation 3 by substituting �O2 and �O from Equations 4 and 5:
�O2 �
qN · �O�2
��� O�2
qN�
�� O�2
N
N�
qN · �O�2
��qN · �O��2
qN�
�qN · �O��2
N
N
� q · �O�2
� q · �O�2
� q2 · �O�2
(6)
Similarly,
�I2 � p · �I�
2� p · �I�
2� p2 · �I�
2 (7)
In addition, following the computational formula for covariance
CovXY �
� XY �� X� Y
N
N,
(Appendix continues)
Thi
sdo
cum
ent
isco
pyri
ghte
dby
the
Am
eric
anPs
ycho
logi
cal
Ass
ocia
tion
oron
eof
itsal
lied
publ
ishe
rs.
Thi
sar
ticle
isin
tend
edso
lely
for
the
pers
onal
use
ofth
ein
divi
dual
user
and
isno
tto
bedi
ssem
inat
edbr
oadl
y.
843INSUFFICIENT EFFORT RESPONDING
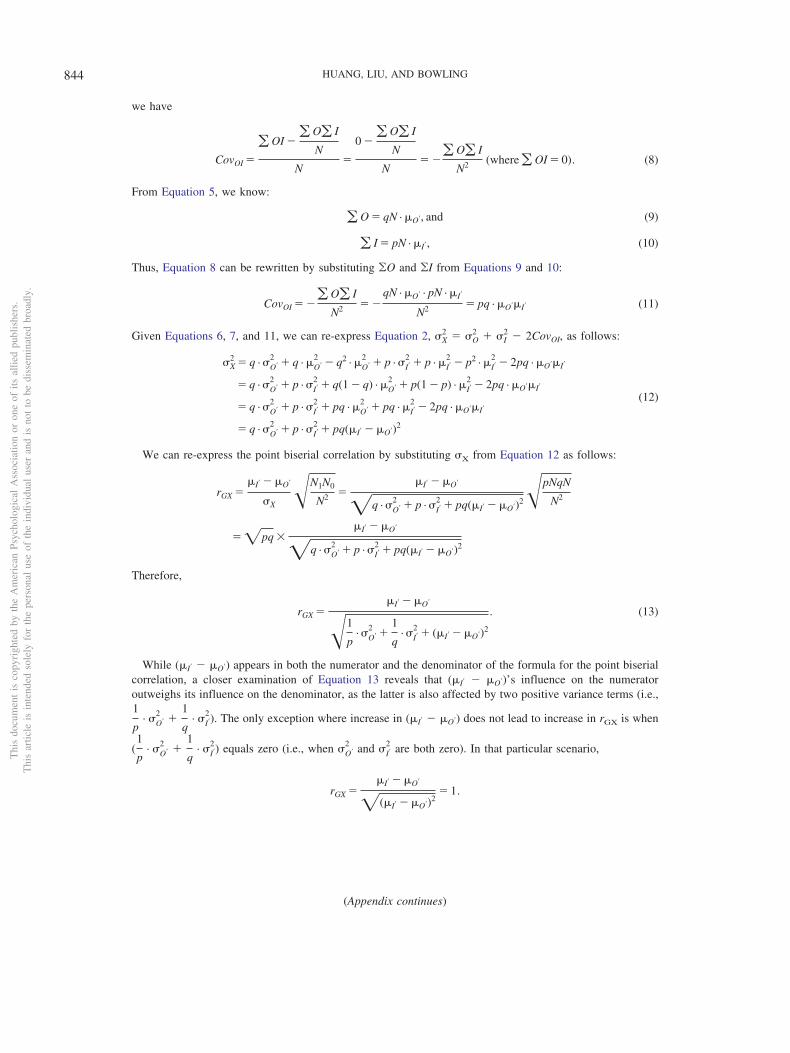
we have
CovOI �
� OI �� O� I
N
N�
0 �� O� I
N
N� �
� O� I
N2 (where � OI � 0). (8)
From Equation 5, we know:
� O � qN · �O�, and (9)
� I � pN · �I�, (10)
Thus, Equation 8 can be rewritten by substituting �O and �I from Equations 9 and 10:
CovOI � �� O� I
N2 � �qN · �O� · pN · �I�
N2 � pq · �O��I� (11)
Given Equations 6, 7, and 11, we can re-express Equation 2, �X2 � �O
2 � �I2 � 2CovOI, as follows:
�X2 � q · �O�
2� q · �O�
2� q2 · �O�
2� p · �I�
2� p · �I�
2� p2 · �I�
2� 2pq · �O��I�
� q · �O�2
� p · �I�2
� q(1 � q) · �O�2
� p(1 � p) · �I�2
� 2pq · �O��I�
� q · �O�2
� p · �I�2
� pq · �O�2
� pq · �I�2
� 2pq · �O��I�
� q · �O�2
� p · �I�2
� pq(�I� � �O�)2
(12)
We can re-express the point biserial correlation by substituting X from Equation 12 as follows:
rGX ��I� � �O�
�X�N1N0
N2 ��I� � �O�
�q · �O�2
� p · �I�2
� pq(�I� � �O�)2�pNqN
N2
� �pq ��I� � �O�
�q · �O�2
� p · �I�2
� pq(�I� � �O�)2
Therefore,
rGX ��I� � �O�
�1
p· �O�
2�
1
q· �I�
2� (�I� � �O�)2
. (13)
While (�I� � �O�) appears in both the numerator and the denominator of the formula for the point biserialcorrelation, a closer examination of Equation 13 reveals that (�I� � �O�)’s influence on the numeratoroutweighs its influence on the denominator, as the latter is also affected by two positive variance terms (i.e.,1
p· �O�
2�
1
q· �I�
2). The only exception where increase in (�I� � �O�) does not lead to increase in rGX is when
(1
p· �O�
2�
1
q· �I�
2) equals zero (i.e., when �O�2 and �I�
2 are both zero). In that particular scenario,
rGX ��I� � �O�
�(�I� � �O�)2� 1.
(Appendix continues)
Thi
sdo
cum
ent
isco
pyri
ghte
dby
the
Am
eric
anPs
ycho
logi
cal
Ass
ocia
tion
oron
eof
itsal
lied
publ
ishe
rs.
Thi
sar
ticle
isin
tend
edso
lely
for
the
pers
onal
use
ofth
ein
divi
dual
user
and
isno
tto
bedi
ssem
inat
edbr
oadl
y.
844 HUANG, LIU, AND BOWLING
As long as attentive and IER responses vary within each condition (i.e.,1
p· �O�
2�
1
q· �I�
2� 0), the higher
the mean difference on scores between IER and attentive groups, the greater the correlation between thedichotomous variable IER condition and observed scores, and the more confounded observed scores are bythe presence of IER.
It should be noted that the presence of IER in survey data can be viewed as a special case of nonindepen-dence of observations (Kenny & Judd, 1986). That is, common statistical techniques such as ordinary leastsquare regression and ANOVA assume that responses are drawn from the same population, with observationsindependent from each other (Bliese & Hanges, 2004). Violation of the independence assumption can affectthe Type I and Type II error rates in hypothesis testing (Bliese & Hanges, 2004). The critical condition ofMattentive � MIER determines that IER and attentive data will have different means, resulting in two clusterson the survey data. The between-group variance stemming from the mean difference between the IER andattentive data thus confounds the true effect one is interested in testing.
Received August 28, 2013Revision received October 16, 2014
Accepted November 11, 2014 �
Thi
sdo
cum
ent
isco
pyri
ghte
dby
the
Am
eric
anPs
ycho
logi
cal
Ass
ocia
tion
oron
eof
itsal
lied
publ
ishe
rs.
Thi
sar
ticle
isin
tend
edso
lely
for
the
pers
onal
use
ofth
ein
divi
dual
user
and
isno
tto
bedi
ssem
inat
edbr
oadl
y.
845INSUFFICIENT EFFORT RESPONDING