Embed Size (px)
Citation preview

Instrumenting Flexible Substrates for
Clinical Diagnosis and Monitoring
by
Amy Liao
A dissertation submitted in partial satisfaction of the requirements for the degree of
Joint Doctor of Philosophy
With the University of California, San Francisco
in
Bioengineering
in the
Graduate Division
of the
University of California, Berkeley
Committee in Charge:
Professor Michel M. Maharbiz, Chair
Professor Ana C. Arias
Professor Shuvo Roy
Spring 2018

1
Abstract Instrumenting Flexible Substrates for Clinical Diagnosis and Monitoring
by
Amy Liao
Joint Doctor of Philosophy
With the University of California, San Francisco in Bioengineering
University of California, Berkeley
Professor Michel M. Maharbiz, Chair
Over the past decade, there has been rapidly growing interest in wearable and implantable
devices for a wide range of biomedical applications. For many applications involving prolonged
contact with the body, devices that are compliant and can comfortably conform to and move with
the patient are highly preferred. These flexible substrates (i.e. clothing, bandages, meshes,
catheters, etc) can be instrumented to measure various physiological markers, such as temperature,
pH, and oxygenation levels, to better inform clinical care. In this dissertation, I will discuss two
examples of sensors designed to interact with flexible substrates for clinical monitoring and
diagnosis applications.
I will first present the development of an electronic bandage to objectively monitor the
progression of wound healing in pressure ulcers and other chronic wounds. Chronic skin wounds
affect millions of people each year and take billions of dollars to treat. Pressure ulcers are a type
of chronic skin wound that can be especially painful for patients and are tricky to treat because
current monitoring solutions are subjective. We have developed an impedance sensing tool to
objectively monitor tissue health in wounds. An electrode array is printed onto a flexible,
polymeric substrate to form a “smart” bandage. With this sensor array, we can measure impedance
of the underlying tissue and extract information on tissue health (i.e. size of wounds and tissue
types) to inform the clinical course of treatment.
In the second half of the dissertation, I will discuss methods for instrumenting hernia mesh
prosthetics to provide quantitative guidance to surgeons during hernia repair surgeries. Abdominal
wall hernias are typically treated by suturing in a surgical mesh to cover and overlap the hernia
defect. However, in 10-20% of patients, the hernia repair fails, resulting in recurrence of the hernia.
18% of these recurrences are attributed to mechanical failure of the mesh, often due to unequal
stress distribution across the mesh surface resulting in high stress concentrations at the tissue-mesh
interface. Strain across the mesh can be used as an indicator for how evenly stress is distributed
across the surface of the mesh. I will discuss two methods, based on optical approach and
magnetoelastic approaches, for instrumenting the hernia mesh prosthetic to measure the stress
distribution during the surgical repair process and the postoperative healing period.

i
Acknowledgements
Throughout my PhD, I was fortunate to have the guidance and support from numerous mentors,
collaborators, colleagues, friends, and family:
- Professor Michel Maharbiz - Over the past 5 years, you played a crucial role in shaping me
into a scientist and engineer by offering me the freedom to explore projects in vastly
different fields.
- Professor Dorian Liepmann – You were the first mentor I worked with at Berkeley and
helped me settle into Berkeley during the first few confusing months. You not only advised
me on research, but also introduced me to many valuable resources, helped me select
classes, and provided general career advice throughout my PhD. Thank you!
- Professor Amy Herr – You were a great rotation mentor and female role model. Thank you
for your help and support building the Point-of-Care Diagnostics seminars.
- I’d also like to thank Professors Dorian Liepmann, Ana Arias, Shuvo Roy, and Chris
Diederich for serving on my qualifying exam committee/thesis committee and providing
valuable feedback from different points of view.
- Dr. David Young and Dr. Hobart Harris – Thank you for your invaluable insight into the
“real” medical needs and clinical use cases.
- Sarah Swisher – thank you for guiding me through my first year of PhD working together
on the pressure ulcer project. You always had the time to patiently explain foreign concepts
in electrical engineering and were a role model in experimental design and analysis.
- To all my collaborators in and out of the lab – I had the honor of working with Sarah,
Monica, Yasser, Felipe, Elisabeth, Claire, Lauren, and many others on the pressure ulcer
project. It was amazing to see people from so many disciplines come together to work on
a project. Prof. Judy Sakanari and Monica worked me on the onchocerciasis project, where
I learned what the grant writing is like. I also had the pleasure of working with many
talented undergrads, including Josh, Kaylee, Reia, David, Eleane, and others, who each
brought unique insights and skills to the table.
- To the entire Maharbiz lab – You guys were amazing to work with. I couldn’t have done
this without all the helpful conversations and assistance debugging various experiments.
Special shout-outs to: Monica, who started with me in the same year and has worked
closely with me on many projects; Travis, who always time to help with debugging; Camilo,
Konlin, and Bochao for helping me with fabrication steps in the cleanroom.
- To all my friends – I’m grateful for your support throughout the entire PhD process. Many
of you have helped me both in the lab and outside of the lab.
- Funding Sources - The work presented in this thesis would not have been possible without
funding from the National Science Foundation, Berkeley Sensor and Actuary Center,
Swarm Lab, and the Chan Zuckerberg Initiative. I was also funded by the NSF Graduate
Research Fellowships Program.
- Most importantly, I’d like to thank my family, including my parents Nelson and Lily,
siblings Angela and Allen, and my fiancée Shidong for their support and encouragement
throughout my entire life.

ii
Table of Contents Abstract ........................................................................................................................................... 1
Acknowledgements .......................................................................................................................... i
Table of Contents ............................................................................................................................ ii
List of Tables ................................................................................................................................. vi
List of Figures ............................................................................................................................... vii
List of Equations ............................................................................................................................ ix
Chapter 1: Introduction ................................................................................................................... 1
1.1 The Rise of Flexible Electronics for Health Monitoring Applications ............................ 1
1.1.1 Shifting the Healthcare Paradigm from Treatment to Prevention ............................ 1
1.1.2 Wearable Sensors for Health Monitoring Applications ............................................ 1
1.1.3 Design of Wearable Devices ..................................................................................... 2
1.2 Dissertation Outline .......................................................................................................... 3
Chapter 2: Impedance Sensing Device for the Detection and Monitoring of Pressure Ulcers ....... 4
2.1 The Need for Pressure Ulcer Prevention and Monitoring ................................................ 4
2.1.1 The Cost of Pressure Ulcers and Other Chronic Wounds ......................................... 4
2.1.2 Causes of Pressure Ulcers ......................................................................................... 5
2.1.3 Pressure Ulcers: Current Prevention, Diagnosis, and Monitoring Techniques ........ 7
2.2 Impedance Spectroscopy for Monitoring of Tissue Conditions ....................................... 8
2.2.1 Theory of Impedance Spectroscopy .......................................................................... 8
2.2.2 Review of Previous Works in Tissue Impedance ..................................................... 9
2.3 Design of a Flexible Electronic Bandage ....................................................................... 10
2.3.1 Smart Bandage: System Overview ......................................................................... 10
2.3.2 Design and Fabrication of an Electrode Array for Impedance Mapping ................ 11
2.3.3 Flexible Array Characterization .............................................................................. 14
2.3.4 Design of the Control Board ................................................................................... 17
2.3.5 Software Control and Analysis Algorithm ............................................................. 17
2.4 Experimental Design for an Impedance-Based Assessment of Tissue Damage in an In
Vivo Rat Model .......................................................................................................................... 18
2.4.1 Inducing pressure injury in a rat model .................................................................. 18
2.4.2 Taking impedance measurements on the rat model ................................................ 19
2.4.3 Fluorescence Angiography ..................................................................................... 21
2.4.4 Histology of skin samples............................................................................................. 21

iii
2.5 Results ................................................................................................................................. 21
2.5.1 Confirming pressure injury using fluorescence angiography and histology .......... 21
2.5.2 Impedance spectrum correlates to tissue health ...................................................... 23
2.5.3 Determining a damage threshold to predict tissue damage .................................... 24
2.5.4 Spatial maps enable easy visualization of the wound border ................................. 25
2.6 Conclusion ........................................................................................................................... 28
Chapter 3: Impedance Sensing Device for Detecting Clinically Relevant Tissue Types in Human
Patients .......................................................................................................................................... 29
3.1 Device Optimization for Clinical Use ............................................................................ 29
3.1.1 Control Board Optimization ......................................................................................... 29
3.1.2 Flexible Array Optimization ................................................................................... 30
3.1.3 GUI Optimization ................................................................................................... 31
3.2 Clinical Trial Design ...................................................................................................... 32
3.2.1 Patient Selection: Inclusion and Exclusion Criteria ................................................ 32
3.2.2 Methods for taking impedance measurements ........................................................ 32
3.3 Results ............................................................................................................................ 34
3.3.1 Electrode Spacing and Tissue Impedance ............................................................... 34
3.3.2 Correlating Impedance with Tissue Type ..................................................................... 36
3.3.3 Determining a Damage Threshold ................................................................................ 37
3.4 Conclusion ...................................................................................................................... 38
3.4.1 Applications beyond pressure ulcers ...................................................................... 39
Chapter 4: Strain Maps for Guiding Hernia Repairs ................................................................... 43
4.1 Formation and Repair of Abdominal Wall Hernias ....................................................... 43
4.1.1 Prevalence of Abdominal Wall Hernias ................................................................. 43
4.1.2 Causes of Hernia Formation ................................................................................... 44
4.1.3 Current Repair Techniques ..................................................................................... 45
4.1.4 Recurrence rate ....................................................................................................... 47
4.2 Current State of Strain Measurement Techniques .......................................................... 47
4.2.1 Relationship Between Stress and Strain ................................................................. 47
4.2.2 Contact Measurement Methods .............................................................................. 48
4.2.3 Non-contact Measurement Methods ....................................................................... 48
4.3 Theory on Optical Strain Measurements ........................................................................ 49
4.3.1 In-plane Optical Strain Measurement Techniques: DIC vs Grid Method .............. 49

iv
4.3.2 Out-of-plane Detection Techniques: Stereoscopic vs PIV ..................................... 51
4.4 Overview of System Design ........................................................................................... 52
4.4.1 Setting Up the Imaging System .............................................................................. 53
4.4.2 Patterning Optical Markers onto Polypropylene Meshes ....................................... 54
4.4.3 In-plane Strain Sensing ........................................................................................... 54
4.5 Characterization of the Optical Sensing Method ........................................................... 55
4.5.1 In-plane Strain Sensing ........................................................................................... 55
4.5.2 Out-of-plane Displacement Calibration .................................................................. 56
4.6 Conclusion ...................................................................................................................... 57
4.6.1 Future Works .......................................................................................................... 57
Chapter 5: A Magneto-elastic Strain Sensor for Non-Invasive Monitoring of Hernia Prosthetics
....................................................................................................................................................... 62
5.1 Magneto-elastic Sensors for Measuring Biological Parameters .................................... 62
5.1.1 Magneto-elastic Strain Sensors ............................................................................... 63
5.2 Design of Magneto-elastic Resonant Sensors ................................................................ 64
5.2.1 A DC Biasing Field is Required for High Signal Amplitude ................................. 64
5.2.2 Magneto-elastic Resonant Sensors: The ΔE Effect ................................................ 66
5.3 Experimental Design: Materials and Methods ............................................................... 67
5.3.1 Design and Construction of the Interrogation System ............................................ 67
5.3.2 Resonance Frequency Detection and Analysis ....................................................... 67
5.3.3 Fabrication of the Resonator and Transducer Elements ......................................... 68
5.3.4 Assembly of the Coupled Strain Sensor ................................................................. 69
5.3.5 Strain Measurement Setup ...................................................................................... 73
5.4 System Characterization ................................................................................................. 74
5.4.1 In vivo Interrogation Challenges ............................................................................. 74
5.4.2 The dynamic range and sensitivity of strain measurements are tunable through
adjustments in the spring geometry ....................................................................................... 76
5.4.3 Sensors are Stable Over Hundreds of Strain Cycles ............................................... 77
5.4.4 Multiplexed Strain Measurements are Possible through Adjustments in Resonator
Geometry ............................................................................................................................... 78
5.5 Limitations and Future Works ........................................................................................ 79
5.5.1 An Inert Coating is Required to Enhance Biocompatibility ................................... 79
5.5.2 Magneto-elastic Sensors are Not Compatible with MRI Diagnostics .................... 80

v
5.5.3 Magneto-elastic Sensors can be Extended for Use in Monitoring Other Flexible
Implants 80
5.5.4 Alternative Approach: The patterned sensors can be used directly as the resonator
elements 81
5.6 Conclusion ...................................................................................................................... 82
Chapter 6: Conclusions and Future Outlook ................................................................................. 84
Bibliography ................................................................................................................................. 85

vi
List of Tables
Table 1. Stages of Pressure Ulcer ................................................................................................... 6
Table 2. Characteristics of the Inkjet-Printed Flex Array vs the Rigid PCB Array ...................... 12
Table 3. Damage Threshold .......................................................................................................... 24
Table 4. Incidence of Abdominal Wall Hernia Repairs in the United States in 2003 .................. 43
Table 5. Comparison of Common Hernia Mesh Substrates ......................................................... 46
Table 6. Acoustic Impedance of Select Tissues and Other Materials ........................................... 60
Table 7. Metglas 2826MB Properties ........................................................................................... 63
Table 8. Interrogation Coil Parameters ......................................................................................... 67
Table 9. Sensor Parameters ........................................................................................................... 69
Table 10. Comparison of Assembly Approaches for Encasing the Resonator ............................. 73

vii
List of Figures
Figure 1. Stages of Pressure Ulcer Progression (Nanoxyde, 2008) ................................................ 6
Figure 2. Simplified Circuit Model Representation of Tissue ........................................................ 8
Figure 3. Current Path through Healthy vs Damaged Tissue ......................................................... 9
Figure 4. Overview of Impedance Measurement System ............................................................. 10
Figure 5. The Impedance Measurement Experimental Setup ....................................................... 11
Figure 6. Rigid Electrode Array .................................................................................................... 13
Figure 7. Fabrication Process of the Flexible Impedance Sensor ................................................. 14
Figure 8. Reproducibility of the Inkjet Printing Process .............................................................. 15
Figure 9. Electrodes Remain Robust Over 100's of Cycles .......................................................... 15
Figure 10. Schematic of the Control Board .................................................................................. 16
Figure 11. Analysis Algorithm for Damage Detection ................................................................. 18
Figure 12. Rat Model for Pressure-Induced Damage ................................................................... 19
Figure 13. Mounting the Sensor Array to the Wound .................................................................. 20
Figure 14. Real-time Fluorescent Angiography of Pressure Damaged Tissue ............................. 22
Figure 15. Histological Examination of Pressure-Induced Wounds ............................................. 23
Figure 16. Impedance Spectrums for "Pressure" and "No Pressure" Locations ........................... 24
Figure 17. Impedance Spectrum of "Damaged" vs "Non-Damaged" Tissue ............................... 25
Figure 18. Spatial Impedance maps for the 3-hr pressure group .................................................. 26
Figure 19. Spatial impedance Maps for the 1-hr Pressure Group ................................................. 27
Figure 20. Early Detection of Pressure-Induced damage ............................................................. 28
Figure 21. Control board ............................................................................................................... 30
Figure 22. Layout of the 0.7 in and 2 in Flexible Arrays .............................................................. 31
Figure 23. Polyimide Array Boards .............................................................................................. 31
Figure 24. Placement of Electrode Array Over the Ulcer Border ................................................. 33
Figure 25. Tissue types commonly present in ulcers .................................................................... 33
Figure 26. Penetration Depth of Current ....................................................................................... 34
Figure 27. Penetration Depth as a Function of Electrode Spacing ............................................... 35
Figure 28. Tissue Impedance as a Function of Electrode Spacing ............................................... 35
Figure 29. Impedance Spectrums of Tissue Types Present in Wounds ........................................ 37
Figure 30. Ulcer Detection on Human Subjects ........................................................................... 38
Figure 31. Impedance Maps of Excisional Wounds ..................................................................... 40
Figure 32. Onchocerciasis Diagnosis Probe ................................................................................. 41
Figure 33. Onchocercoma Nodules are Detectable with Impedance Spectroscopy ..................... 42
Figure 34. Grid Method ................................................................................................................ 50
Figure 35. Validating the Grid Method Algorithm ....................................................................... 51
Figure 36. Defocussed Imaging for Out-of-Plane Strain Measurements ...................................... 52
Figure 37. Overview of the Strain Mapping System .................................................................... 53
Figure 38. Aperture Mask Positioned on the Camera ................................................................... 53
Figure 39. Patterned Lightweight Polypropylene Mesh ............................................................... 54
Figure 40. Tensile Testing Setup .................................................................................................. 55

viii
Figure 41. In-Plane Strain Measurement ...................................................................................... 56
Figure 42. Out-of-Plane Displacement using Defocused Imaging ............................................... 57
Figure 43. Proposed Ultrasound-Based Strain System Design ..................................................... 58
Figure 44. Ultrasound as a noninvasive measurement modality .................................................. 59
Figure 45. Capturing 3D Info from a 2D Ultrasound Image ........................................................ 59
Figure 46. Ultrasound Image of Titanium Wire and Polypropylene Mesh .................................. 61
Figure 47. Mesh Pattern of a Lightweight Polypropylene Mesh .................................................. 61
Figure 48. Overview of an Implanted Magnetoelastic Sensor Array ........................................... 64
Figure 49. Magnetostriction Curve ............................................................................................... 65
Figure 50. Representative Resonance Peak .................................................................................. 68
Figure 51. Transducer and Resonator Designs ............................................................................. 69
Figure 52. Assembly Process Based on Hot-embossing ............................................................... 71
Figure 53. Assembly Process Based on Thermal Bonding ........................................................... 72
Figure 54. Tradeoff Between Resonator Size and Signal Amplitude ........................................... 74
Figure 55. Signal Amplitude with Respect to Coil Alignment ..................................................... 75
Figure 56. Damping Effects on Signal Amplitude........................................................................ 76
Figure 57. Resonance Frequency and SNR vs Strain ................................................................... 77
Figure 58. Resonance Frequency Across 1000 Cycles ................................................................. 78
Figure 59. Magnetoelastic Strain Sensor Array ............................................................................ 79
Figure 60. Proof-of-Concept Demonstration on a Stent ............................................................... 81
Figure 61. Patterned Resonator Can Be Used to Measure Strain ................................................. 81
Figure 62. Signal Amplitude for Patterned Resonator Shapes ..................................................... 82

ix
List of Equations
Equation 1. Impedance Spectroscopy ............................................................................................. 8
Equation 2. Definition of Stress .................................................................................................... 48
Equation 3. Relationship between Stress and Strain ..................................................................... 48
Equation 4. Definition of Strain .................................................................................................... 48
Equation 5. Displacement ............................................................................................................. 49
Equation 6. Phase .......................................................................................................................... 49
Equation 7. Strain.......................................................................................................................... 50
Equation 8. Phase Shift ................................................................................................................. 50
Equation 9. Z-axis Displacement .................................................................................................. 52
Equation 10. X-Axis Displacement Correction Factor ................................................................. 52
Equation 11. Y-Axis Displacement Correction Factor ................................................................. 52
Equation 12. Limit of Detection ................................................................................................... 55
Equation 13. Ultrasound Reflectance ........................................................................................... 60
Equation 14. Linearized Small Signal Response of Magnetoelastic Materials ............................ 65
Equation 15. Resonance Frequency .............................................................................................. 66
Equation 16. The “ΔE Effect” ....................................................................................................... 66

1
Chapter 1: Introduction
1.1 The Rise of Flexible Electronics for Health Monitoring Applications
1.1.1 Shifting the Healthcare Paradigm from Treatment to Prevention
Given the exponential rise of healthcare costs in the United States, there has been growing
emphasis on disease prevention and health monitoring. U.S. healthcare spending reached $3.3
trillion in 2016, averaging $10,328 per person and accounted for almost 20% of the overall GDP
in the United States (Center for Medicare & Medicaid Services, 2018). Healthcare costs in the
United States will continue to rise as the baby boomer generation gets older and reaches an age
where more medical services are required (Ginsburg et al., 2009).
Despite spending far more in healthcare than other high income countries, Americans
scored lower in overall health outcomes, particularly among older adults (Murray & Frenk, 2010;
Squires & Anderson, 2015). Approximately 45% of Americans suffer from one or more chonic
medical condition, such as diabetes, cancer, cardiovascular diseases, and chronic respiratory
diseases. Treatment and management of these chronic diseases account for over 75% of healthcare
costs in the U.S (Ginsburg et al., 2009).
Prevention of chronic diseases is key to controlling the rising healthcare costs (Ginsburg
et al., 2009; WHO, 2008). It’s been estimated that around 25% of U.S. healthcare costs are related
to helath risks that are preventable through lifestyle changes (Anderson et al., 2000; Danaei et al.,
2009; Ginsburg et al., 2009). Furthermore, patient outcomes are greatly improved with earlier
diagnosis. The World Health Organization recommends shifting the focus from treatment to
prevention and early diagnosis as the most cost-effective method of reducing the burden of chronic
diseases (Ginsburg et al., 2009; WHO, 2008).
1.1.2 Wearable Sensors for Health Monitoring Applications
Wearable sensors are transforming the healthcare industry by placing the power of tracking
and monitoring fitness and health into the hands of patients directly. Fitness trackers integrated
into consumer electronics, such as smartphones and smartwatches, enable consumers to track
physical movement as well as other physiological parameters, including heart rate, blood
oxygenation, and temperature, on a continuous, real-time basis. These sensors educate users on
understanding their own health and encourages users to engage in lifestyle changes that help
improve overall health and reduce likelihood of developing certain chronic diseases.
In addition, development of wearable medical technologies enable physicians to monitor
changes in patient health over time. The continuous data collected from wearable devices paint a
holistic picture of baseline levels and trends in patient health over time that is unable to be captured
during traditional checkups, thus improving accuracy of diagnosis and personalization of treatment.

2
Real-time measurements also allow for earlier diagnosis of critical health conditions and enable
timely intervention for patients.
Over the past decade, technological advances in flexible and miniaturized electronics has
rapidly expanded the scope of physiological parameters that can be measured and tracked
accurately. Sensors have been developed to measure skin modulus, electroencephalography (EEG),
electromyography (EMG), electrocardiography (ECG), temperature, bioimpedance, tissue health,
glucose level, and blood pressure (Bandodkar & Wang, 2014; Harris, Elias, & Chung, 2016; Yuhao
Liu, Pharr, & Salvatore, 2017; Tricoli, Nasiri, & De, 2017; Windmiller & Wang, 2013). The
mechanism of sensing also varies widely, spanning mechanical, electrochemical, optical, and
electrical systems that analyze tissue and other bodily fluids (e.g. tears, saliva, perspiration, and
breath) (Tricoli et al., 2017; Windmiller & Wang, 2013). Flexible sensors have been developed for
a wide range of applications, including glaucoma, oral health, glucose monitoring, cancer detection,
and cardiac health (R. Liu, Wang, Li, Tang, & Mao, n.d.; Tricoli et al., 2017) These devices enable
earlier diagnosis of diseases as well as allow for continuous monitoring of disease progression to
direct personalized patient care.
1.1.3 Design of Wearable Devices
The WHO recommends that diagnostic devices should be designed with the ASSURED
criteria in mind: affordable, sensitive, specific, user-friendly, rapid and robust, equipment-free,
and deliverable (Kosack, Page, & Klatser, 2017). However, these criteria is insufficient for clinical
applications involving prolonged contact of the sensor with the body. The human body is
inherently a compliant system that is flexible and malleable. Mismatches in the physical properties
of sensor and skin create an uncomfortable user experience and can hinder natural movment of the
body (Yuhao Liu et al., 2017; Nathan et al., 2012). In addition to the ASSURED critera, wearable
devices should also be compliant, flexible, and malleable (Yan Liu et al., 2018). Flexible and
miniaturized devices that can comfortably conform to and move with the patient are highly
preferred over traditional, rigid sensors. These sensors must be able to withstand repeated cycles
of bending and stretching to accommodate normal day-to-day activity. Flexible substrates, such as
certain textiles and polymers, are an ideal platform for interfacing with the human body, where
comfort and durability are highly valued. These flexible substrates, in the form of clothing and
bandages, can be instrumented to measure a wide range of physiological markers (Windmiller &
Wang, 2013).
Recently, techniques have been developed to screenprint flexible electrodes directly onto
various flexible substrates, including directly onto the skin itself as a tattoo-like sensor
(Windmiller & Wang, 2013). In addition, many strategies have been developed to improve the
conformability and stretchability of sensors by selective patterning of sensor geometry and
manipulation of material properties directly (Yan Liu et al., 2018). Efforts are also underway to
miniaturize sensors into the micro- and millimeter ranges to further reduce the impact of these
wearable sensors.

3
1.2 Dissertation Outline
In this thesis, we present two examples of how flexible substrates can be instrumented to
guide and inform patient care.
In Chapters 2 and 3, we demonstrate the use of an electronic bandage to predict and monitor
tissue damage for pressure ulcer management. Chronic skin wounds affect millions of people each
year and require billions of dollars to treat. Pressure ulcers are a type of chronic skin wound that
can be especially painful for patients and are tricky to treat because current monitoring solutions
are subjective. We have developed an impedance sensing tool to objectively monitor tissue health
in wounds. An electrode array is printed onto a flexible, polymeric substrate to form a “smart”
bandage. With this sensor array, we can measure impedance of the underlying tissue and extract
information on tissue health (i.e. size of wounds and tissue types) to inform the clinical course of
treatment.
In the second half of the dissertation, I will discuss methods for instrumenting hernia mesh
prosthetics to provide quantitative guidance to surgeons during hernia repair surgeries. Abdominal
wall hernias are typically treated by suturing in a surgical mesh to cover and overlap the hernia
defect. However, in 10-20% of patients, the hernia repair fails, resulting in recurrence of the hernia.
18% of these recurrences are attributed to mechanical failure of the mesh, often due to unequal
stress distribution across the mesh surface resulting in high stress concentrations at the tissue-mesh
interface. Strain across the mesh can be used as an indicator for how evenly stress is distributed
across the surface of the mesh. In Chapter 4, we apply an optical strain mapping technique to
monitor stress distributions across a flexible hernia prosthetic in an effort to reduce the hernia
recurrence rate. Chapter 5 presents an alternative approach to non-invasive strain measurements
based on implantable magnetoelastic strain sensors.

4
Chapter 2: Impedance Sensing Device for the Detection and Monitoring
of Pressure Ulcers
This chapter is based in part on the work presented in:
1. S. L. Swisher, et al., Impedance sensing device enables early detection of pressure ulcers
in vivo, Nature Communications, vol. 6, 2015. (Swisher et al., 2015)
2. Y. Khan, F. Pavinatto, et al., "Inkjet-Printed Flexible Gold Electrode Arrays for
Bioelectronic Interfaces," Advanced Functional Materials, vol. 26, 2016. (Khan et al., 2016)
This work was done in collaboration with Sarah L. Swisher, Monica C. Lin, Elisabeth J. Leeflang,
Lauren C. Ritz, Claire Graves, Yasser Khan, Felippe J. Pavinatto, Kaylee Mann, Agne Naujokas,
David Young, Shuvo Roy, Michael R. Harrison, Ana C. Arias, Vivek Subramanian, and Michel
M. Maharbiz.
Flexible substrates that interact with the human skin, such as clothing and other wearable
accessories, can be instrumented to provide a host of information on human health and activity. In
particular, the advent of flexible electronics in the past decade has enabled low cost, lightweight,
and conformable sensors to be integrated into various cloth-like substrates to measure parameters
ranging from body temperature, heart rate, body movement, breathing, and other fitness
parameters. In this chapter, we demonstrate one specific application: instrumenting flexible
bandages with an impedance-based sensor to detect pressure-induced tissue damage and inform
the course of treatment.
2.1 The Need for Pressure Ulcer Prevention and Monitoring
2.1.1 The Cost of Pressure Ulcers and Other Chronic Wounds
In the United States, over $25 billion is spent treating chronic wounds on 6.5 million
patients each year, placing a substantial burden on the American health care system (Sen et al.,
2009). Chronic wounds, also known as the “silent epidemic”, are wounds that do not progress
through the normal healing process, often taking weeks to months to heal (Frykberg & Banks,
2015). Pressure ulcers are a particularly painful category of chronic wounds, affecting 2.5 million
patients each year, with average heal-times of 155 days for Stage IV ulcers (Bruin Biometrics,
2013). It’s been estimated that it costs around $70,000 to manage a single, full-thickness pressure
ulcer (Sen et al., 2009). On top of the greatly reduced quality of life suffered by patients (due to
the pain suffered and the necessity of weekly physician visits), pressure ulcers also increases
patient mortality rate by ~7% due to an increased risk of complications such as infections and
compromised immune systems, leading to 60,000 deaths each year (Bruin Biometrics, 2013; Sen
et al., 2009).
5
According to the National Pressure Ulcer Advisory Panel (NPUAP), 82% of physicians
agree that most pressure ulcers are avoidable with proper care (Bruin Biometrics, 2013; Sen et al.,
2009). In 2008, the Center for Medicare and Medicaid Services (CMS) designated hospital-
acquired pressure ulcers as a “never event”, which means an event that should never occur in a
hospital setting, and, as such, no longer reimburses for treatment of hospital-acquired Stage III and
Stage IV pressure ulcers (Bruin Biometrics, 2013; Sen et al., 2009). Thus, hospitals have high
incentive to prevent the formation of new ulcers and detect the presence of pre-existing tissue
damage upon admittance of a patient. Despite the preventable nature of most pressure ulcers, it’s
been estimated that 22% of patients in critical care settings, 15% in acute care facilities, and 29%
of patients in long-term care facilities suffer from pressure ulcers (Bruin Biometrics, 2013; Sen et
al., 2009).
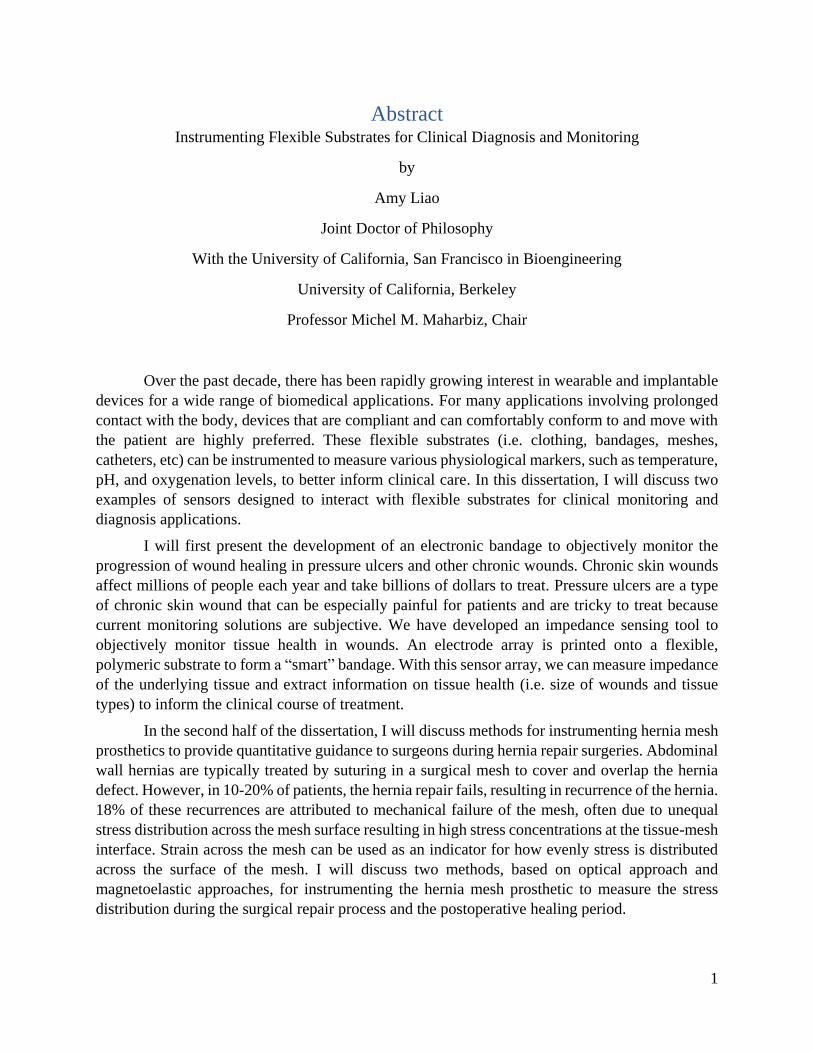
2.1.2 Causes of Pressure Ulcers
Pressure ulcers are caused by prolonged loss of blood flow to tissue, due to an excess
application of pressure often in combination with friction, which results in a breakdown of the skin.
To further complicate the situation, studies have shown that reperfusion of blood into ischemic
tissue can further exacerbate tissue damage due to additional oxidative stresses caused by the
reaction of incoming oxygen with the buildup of reactive oxygen species.
Pressure ulcers are localized injuries that typically develop over a bony prominence on the
body, such as the sacrum, hips, heels, and elbows and disproportionately affect patients who are
elderly, diabetic, or obese. Pressure ulcers usually form when patient mobility is limited, such as
those who are bed- or wheelchair-bound, and can form simply from sitting or lying down in the
same position for the duration of a longer surgical procedure. For comparison, most healthy people
will shift positions 2-4 times per hour each night to relieve pressure (De Koninck, Lorrain, &
Gagnon, 1992). Ulcers can also form due to excessive rubbing or irritation, edema, or
compromised immune system. As the U.S. population ages, the at-risk population also grows,
highlighting the need for more effective prevention techniques.
Pressure ulcers are scored on a scale of I-IV based on the degree of tissue damage (Black
et al., 2007; National Pressure Ulcer Advisory Panel, European Pressure Ulcer Advisory Panel, &
Pan Pacific Pressure Injury Alliance, 2014; NPUAP (National Pressure Ulcer Advisory Panel),
2016). Table 1 and figure 1 summarizes the characteristics of each stage of pressure ulcer (NPUAP
(National Pressure Ulcer Advisory Panel), 2016).

6
Table 1. Stages of Pressure Ulcer
Stage Description
Stage I: Non-Blanchable
Erythema
- Intact skin
- Localized areas of non-blanchable tissue (exhibits
redness)
- Skin may be warmer/cooler or more tender than
surrounding areas
Stage II: Partial Thickness Skin
Loss
- Loss of dermis, resulting in a shallow open wound
- Presents as a red, pink wound bed, without the
presence of slough
Stage III: Full Thickness Skin
Loss
- Full-thickness tissue loss down to the subcutaneous
fat layer
- Slough may be present
Stage IV: Full Thickness Tissue
Loss
- Full-thickness tissue loss
- Bone, tendon, or muscle may be exposed
- Slough or eschar may be present
Figure 1. Stages of Pressure Ulcer Progression (Nanoxyde, 2008)
As ulcers develop to higher stages, reversing the tissue damage becomes increasingly
difficult; 70% of stage II ulcers versus 50% of stage III ulcers and only 30% of stage IV ulcers
heal within 6 months (Bluestein & Javaheri, 2008). During the healing process, the pressure ulcer
is replaced by granulation tissue, composed of endothelial cells, fibroblasts, collagen, and
extracellular matrix, rather than a full recovery of the normal tissue (muscle, subcutaneous fat, and
dermis).
By the time an ulcer reaches the Stage I classification, there is often already substantial
subcutaneous tissue damage. Since 42% of stage I ulcers eventually progress to a higher ulceration
stage (Bruin Biometrics, 2013), early detection of tissue damage at “Stage 0” is critical to ulcer
prevention. Unfortunately, the amount of time and pressure that results in pressure ulcer formation
varies drastically between patients, depending on patient risk factors (age, diabetes, etc), ulcer
location, and the baseline skin integrity, making it difficult to predict the degree of damage at
earlier stages, particularly at the early stages when the tissue damage is not readily apparent to the
naked eye.

7
2.1.3 Pressure Ulcers: Current Prevention, Diagnosis, and Monitoring Techniques
Pressure ulcers are prevented through a combination of pressure relief and pressure re-
distribution. Healthy people are constantly shifting positions, even when unconscious during sleep
(De Koninck et al., 1992). For immobilized patients, the most commonly used pressure ulcer
prevention strategy involves manually turning the patient to restore blood flow before tissue
damage occurs. The Wound Healing Society Guidelines recommends turning the patient every 2
hours (Ayello & Lyder, 2008; Reddy, Gill, & Rochon, 2006; Wong, 2011). While this method is
effective at reducing pressure ulcer prevalence, it places a significant burden on the nursing staff
or other primary caretaker in terms of labor, as well as interrupts patient’s normal activities,
including sleep. Based on the individual patient’s skin condition and other risk factors, the 2 hour
frequency of turning may not be ideal for preventing pressure ulcers, being either too frequent and
disruptive or too infrequent resulting in tissue damage. Further, mild tissue damage is often not
easily detected using visual indicators alone. By the time signs of damage is apparent, pressure
ulcers are often already at stage I or II. A direct measurement of tissue health can enable
personalization of the pressure ulcer prevention protocol.
Patient turning is frequently used in conjunction with other preventative strategies to
reduce the amount of pressure placed on high risk areas. There exists a huge variety of products,
ranging from special cushions and paddings to air/water mattresses that assist with distributing the
patient’s weight from high risk areas.
Recently, the development of pressure sensitive beds provides physicians with additional
information on the pressure distribution across the mattress, allowing caretakers to more reliably
position patients and minimize pressure concentrators. In addition, some of these beds also
incorporate motors to automatically shift the patient when a particular pressure threshold is reached
or according to a preset schedule. These motorized beds can reduce the burden on caretakers, but
still suffer from problems, such as patient slippage on the mattress. These high-tech pressure
sensitive beds are also extremely expensive, running on the order of tens of thousands of dollars
per bed, making it impractical for widespread use or as an outpatient preventative strategy.
Additionally, these beds or mats only provide an indirect measure of pressure, which does not
directly correlate with tissue health. There is currently no clinically relevant method to detect tissue
damage directly to warn against early stage pressure ulcer development.
Pressure ulcers are primarily diagnosed through a visual and tactile inspection, which is
highly subjective and dependent on physician experience. For early stage pressure ulcers,
physicians will examine the skin for non-blanchable erythema, redness in the skin that doesn’t
blanch when pressed. Diagnosis at early stages is particularly difficult for patients with dark skin
tones, where erythema is not always observable. Pressure ulcers are diagnosed in stage II 4 times
more often than in stage I for dark skin patients, compared to approximately equally at stages I
and II in light skinned patients (VanGilder, Macfarlane, & Meyer, 2008)
Risk assessment tools, such as the Braden Scale, Norton Scale, and the Waterglow Scale,
enable physicians to make semi-quantitative diagnosis by scoring the patient on several risk factors,
including skin moisture level, patient mobility, nutrition, and friction and shearing (Pancorbo-

8
Hidalgo, Garcia-Fernandez, Lopez-Medina, & Alvarez-Nieto, 2006). However, even these semi-
quantitative methods are highly subjective and demonstrate poor sensitivity and specificity, mostly
in the 50-60% range (Bluestein & Javaheri, 2008; Bruin Biometrics, 2013).
Once diagnosed, pressure ulcers are treated with a combination of bandages, dressings, and
debridement. Physicians must monitor the progression of healing each week and adjust the
treatment plan according to the patient’s wound condition. This assessment typically includes an
estimation of wound size (as measured using a ruler or digital planimetry) and a qualitative report
of the wound state, types of tissues present in the wound bed, and the wound moisture level. These
assessments can also be very subjective and dependent on the clinician’s experience level. Thus,
an objective measure of tissue health and wound state can help inform patient care.
2.2 Impedance Spectroscopy for Monitoring of Tissue Conditions
2.2.1 Theory of Impedance Spectroscopy
Tissue can be represented electrically as a combination of resistances and capacitances
(figure 2). The cytoplasm inside cells and the extracellular matrix surrounding cells are filled with
ion-rich fluids that can be modelled as resistors that permit current flow. The cell membrane, on
the other hand, impedes the free flow of fluids and can be modeled as a capacitor. The combination
of the resistive and capacitive components is termed impedance (equation 1).
𝑍 = 𝑅𝑒𝑎𝑙 + 𝑗(𝐼𝑚) = 𝑍𝑅 + (𝑍𝐿 + 𝑍𝐶) = |𝑍|𝑒𝑗𝛳
𝑍𝑅 = 𝑅
𝑍𝐿 = 𝑗𝜔𝐿
𝑍𝐶 =1
𝑗𝜔𝐶
Equation 1. Impedance Spectroscopy
Figure 2. Simplified Circuit Model Representation of Tissue
The dielectric response of cell suspensions and tissues have been studied for over a century
(Markx & Davey, 1999). Since the capacitance of tissue is a function of frequency, impedance
spectroscopy, which involves measuring impedance across a range of frequencies, provides a more
holistic picture of the tissue’s electrical properties than single-frequency impedance measurements.

9
Distinct dispersions, step changes in the complex permittivity of the material, across frequency are
associated with particular molecular-level processes in biological materials: α-dispersions
correspond to the flow of ions across the cellular membrane (~1E2-1E4 Hz), β-dispersions
represent the build-up of charge at the cell membrane as governed by the Maxwell-Wagner effect
(~1E5-1E7 Hz), δ-dispersions are caused by rotations of large macromolecules and proteins
(~1E8-1E9 Hz), and γ-dispersions result from the dipolar rotations of small molecules such as
water (~1E9-1E11 Hz) (Markx & Davey, 1999). In this study, we primarily examined shifts in the
α-dispersion as an indicator of tissue health.
Figure 3. Current Path through Healthy vs Damaged Tissue
At low frequencies, the capacitive effect is strong and current will tend to move around the
cells in the extracellular matrix, whereas, at higher frequencies, current can more easily penetrate
through the cell membranes (figure 3). Different tissue types will have distinct characteristic
impedance profiles, based on the composition and structure of the tissue. When tissue is damaged,
the cell membrane structure is compromised, permitting more current, even at lower frequencies,
to pass through the cells more easily. The capacitive component is decreased and the phase angle
shifts towards zero (tissue is more resistive). Thus, shifts in the characteristic impedance profiles
can be used to detect subtle changes in tissue type and tissue health, enabling objective assessment
on the condition of a wound (Dean, Ramanathan, Machado, & Sundarajan, 2008; H C Lukaski,
2013; Henry C Lukaski & Moore, 2012)
2.2.2 Review of Previous Works in Tissue Impedance
Impedance spectroscopy has been used to study tissue states since the 1950’s (Gabriel, Lau,
& Gabriel, 1996; Pethig & Kell, 1987; Schwan, 1959). Numerous studies have demonstrated that

10
a correlation exists between cell/tissue types and their electrical properties, both in vitro and on
human patients (B. Kell, Markx, Davey, & Todd, 1990a; Grimnes & Martinsen, 2008; H C Lukaski,
2013; Patel & Markx, 2008a; Rigaud, Morucci, & Chauveau, 1996). Impedance measurements
have been demonstrated in a wide range of applications, including quantifying cell growth and
cell-drug interactions (Rahman, Register, Vuppala, & Bhansali, 2008), tracking cell migration in
vitro (Linderholm et al., 2006), and detecting biomass in suspensions (B. Kell, Markx, Davey, &
Todd, 1990b; Dabros et al., 2009).
There have also been several clinical studies examining the correlation between a patient’s
bioimpedance profiles and the types of tissues prevalent in wounds (Bruin Biometrics, 2013;
Henry C Lukaski & Moore, 2012; Moore, Dobson, Castelllino, & Kapp, 2011; Weber, Gehin,
Moddy, Jossinet, & McAdams, 2008; Weber, Vonhoff, Owens, Byrne, & McAdams, 2009).
2.3 Design of a Flexible Electronic Bandage
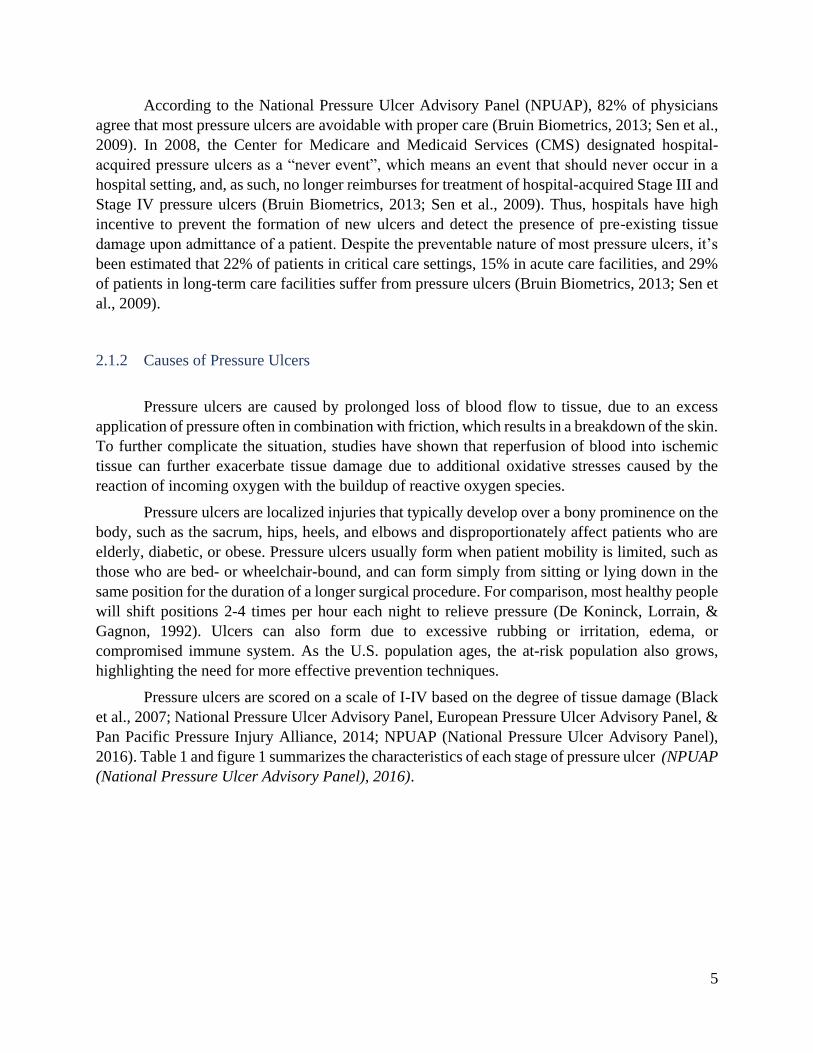
2.3.1 Smart Bandage: System Overview
Here, we propose an electronic bandage that can non-invasively detect tissue health using
impedance spectroscopy measurements. The impedance sensing system is composed of four major
components: 1.) a flexible “bandage” with an integrated electrode array that interacts with the skin,
2.) a control board that selects selects electrode pairs from which to take measurements, 3.) an
LCR meter to measure impedance, and 4.) a laptop to control the impedance system and conduct
analysis of data. Figure 4 shows a schematic of the major roles of each of these four components
and how they interface with each other to measure tissue impedance. An image of the experimental
setup is shown in figure 5.
Figure 4. Overview of Impedance Measurement System
11
Figure 5. The Impedance Measurement Experimental Setup
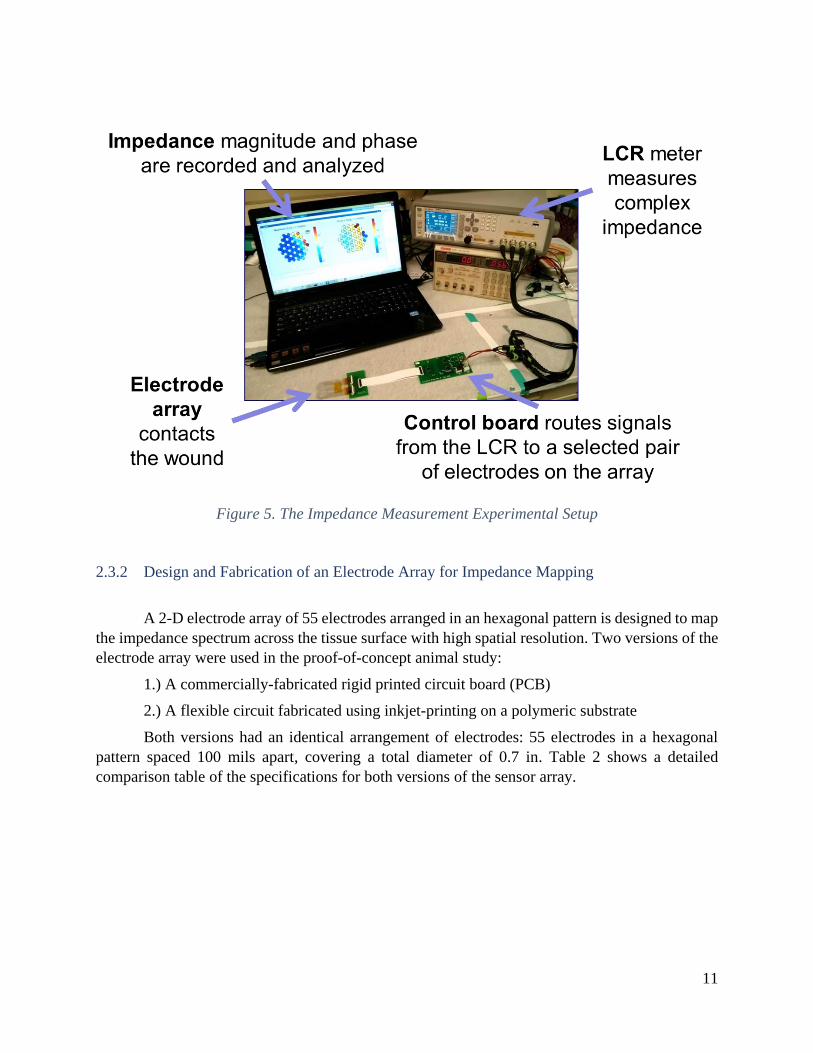
2.3.2 Design and Fabrication of an Electrode Array for Impedance Mapping
A 2-D electrode array of 55 electrodes arranged in an hexagonal pattern is designed to map
the impedance spectrum across the tissue surface with high spatial resolution. Two versions of the
electrode array were used in the proof-of-concept animal study:
1.) A commercially-fabricated rigid printed circuit board (PCB)
2.) A flexible circuit fabricated using inkjet-printing on a polymeric substrate
Both versions had an identical arrangement of electrodes: 55 electrodes in a hexagonal
pattern spaced 100 mils apart, covering a total diameter of 0.7 in. Table 2 shows a detailed
comparison table of the specifications for both versions of the sensor array.

12
Table 2. Characteristics of the Inkjet-Printed Flex Array vs the Rigid PCB Array
The rigid PCB version of the board (figure 6) acted as a robust calibration platform, able
to withstand harsher handling conditions and repeated cycles of sterilization and measurements.
The rigid board also served as a control to verify the impedance measurements taken on the more

13
fragile flexible array in the initial in vivo animal study, while development of the flexible version
was in progress. The rigid array was fabricated by Advanced Circuits using standard PCB
fabrication techniques. It is composed of three layers of FR4 with copper routings on the inner
layer and exposed electrodes on the surface layers. The electrodes were plated with immersion
gold to provide a biocompatible, inert surface that would not react with the tissue.
Figure 6. Rigid Electrode Array
While the rigid array served an important function in developing the impedance sensing
tool, a flexible array is critical for the ultimate goal of pressure ulcer monitoring on human patients.
A flexible, bandage-like substrate can provide a more conformal contact with the body, thus
improving impedance mapping on wounds with varied topography without applying excess
pressure, that could cause further damage. A flexible version of the array was fabricated in house
by collaborators in the Arias lab using inkjet printing of gold nanoparticle ink (Harima, Model:
NPG-J) onto a flexible 35 µm polyethylene naphthalate (PEN) substrate obtained from DuPont
(figure 7). The gold nanoparticle ink contains ~7 nm nanoparticles suspended in a solvent mixture
(53% metal before sintering). The electrode array pattern was printed using a Dimatix Materials
Printer (DMP-2800) with 30 µm drop spacing. An annealing step at 230oC is required to remove
excess solvent and fuse the gold nanoparticles into a conductive metal trace (slow ramp from 30-
230oC at a rate of 0.7oC per minute, constant temperature back at 230oC for 60 minutes). The entire
printed array was encapsulated by a non-conductive amorphous fluoropolymer (Cytop) via spin
coating (1,200 rpm for a 100-nm thick film). Oxygen plasma etching with a shadow mask
selectively opened up vias above each electrode to expose the conductive gold layer below the
Cytop. This inkjet printing process allowed us to rapidly prototype devices and experiment with
various electrode configurations.
To minimize contact impedance with tissue and stray capacitance effects, a highly
conductive electrode gel (SignaGel, Parker Laboratories, Inc) was applied to the electrodes
through a stenciling process. A patterned HT-6240 silicone rubber sheet was used as a stenciling
mask to selectively blade-coat the gel over each individual electrode to form patterned hydrogel
“bumps” (figure 7). Hydrogel stenciling was used with both versions of the electrode array boards
to ensure high quality, reliable impedance measurements.

14
Figure 7. Fabrication Process of the Flexible Impedance Sensor
2.3.3 Flexible Array Characterization
Minimizing variability in the fabrication process is essential for being able to compare data
collected from different copies of the printed electrode arrays. During the animal testing, several
flex boards with identical designs were rotated between for data collection to allow for cleaning
and hydrogel stenciling between measurements.
To characterize the reproducibility of the fabrication process, five array boards were
analyzed to determine variability in the conductivity of the printed electrode array using a four-
point probe measurement (figure 8). Low batch-to-batch variation was observed between the five
arrays, with a standard deviation of the mean sheet resistance of σµ,Rs = 0.01 Ω/sq. The printed
lines had a conductivity of 7.0 x 10⁴ S/cm (~20% of the bulk conductivity of gold), which is
consistent with conductivity values reported in literature for other printed electronic devices (Cui
et al., 2010).
Mechanical stability of the flex boards is also crucial for devices used clinically, since the
arrays would be subjected to high degrees of bending and torsion during the experimental process
(placement of arrays on the skin, patient movement during the measurement, and the cleaning
process post-data collection). When subjected to cycling tests, where the array was subjected to

15
cycles of 30o twisting, no significant alteration in electrode resistance was observed even after
1000 cycles (figure 9).
Figure 8. Reproducibility of the Inkjet Printing Process
Figure 9. Electrodes Remain Robust Over 100's of Cycles
Because repeated use and cleaning of the flex arrays causes gradual wear and tear on the
printed flexible arrays, the flex arrays were tested after every few uses to identify any potential
damage. Impedance measurements between each pair of electrodes on an array submerged in a
saltwater solution (100 g/L NaCl) was measured to identify any “shorts” or “opens”. “Shorts” (due
to failure of the Cytop insulator) was defined as any electrode pair with impedance <100Ω, while
“opens” (due to breakage in the conductive traces) was defined as impedance magnitude >50kΩ
(approximately 2x the impedance magnitude of saltwater). All data collected from failed electrodes
were rejected prior to data analysis.

16
Figure 10. Schematic of the Control Board

17
2.3.4 Design of the Control Board
The impedance spectrum was measured using a Keysight Technologies E4980AL
precision LCR meter across each neighboring pair of electrodes. The LCR meter outputted a
constant 100 mV sinusoidal signal with a frequency range of 100 Hz to 1 MHz. The control board
allows for independent selection of each pair of electrodes on the 55-electrode array using a
microcontroller (ATtiny828-MU-ND, 8-bit AVR Microcontroller) combined with five 32-channel
multiplexors (Analog Devices, ADG732BCPZ-ND). A Pololu USB AVR Programmer is used for
serial communication between the mirocontroller and controll software on the computer. The
entire system is powered with four AA batteries, regulated by a dual +/- low noise LDO (Linear
Technologies, LT3032EDE#PBF-ND). An adaptor board (fabricated on standard FR4 by Bay Area
Circuites) is used to connect the electrode array to the control board to allow for easy switching
between different electrode board designs. Figure 10 shows a schematic of the control board.
2.3.5 Software Control and Analysis Algorithm
For each subject, impedance spectrums and spatial impedance maps were measured on
healthy skin to serve as a baseline reference measurement, as well as on damaged skin over the
pressure ulcer. Spatial impedence maps contain impedance measurements across each of the 72
nearest-neighbor elctrode pairs at four frequencies (1, 15, 50, and 100 kHz). Impedance
measurements were also collected for 11 select pairs on the array at 12 frequencies ranging from
100 Hz to 1 Mhz for better understanding on the impedance spectrum across frequency. A GUI
was developed in Python to enable easy interfacing with the impedance meter and control board
for data collection.
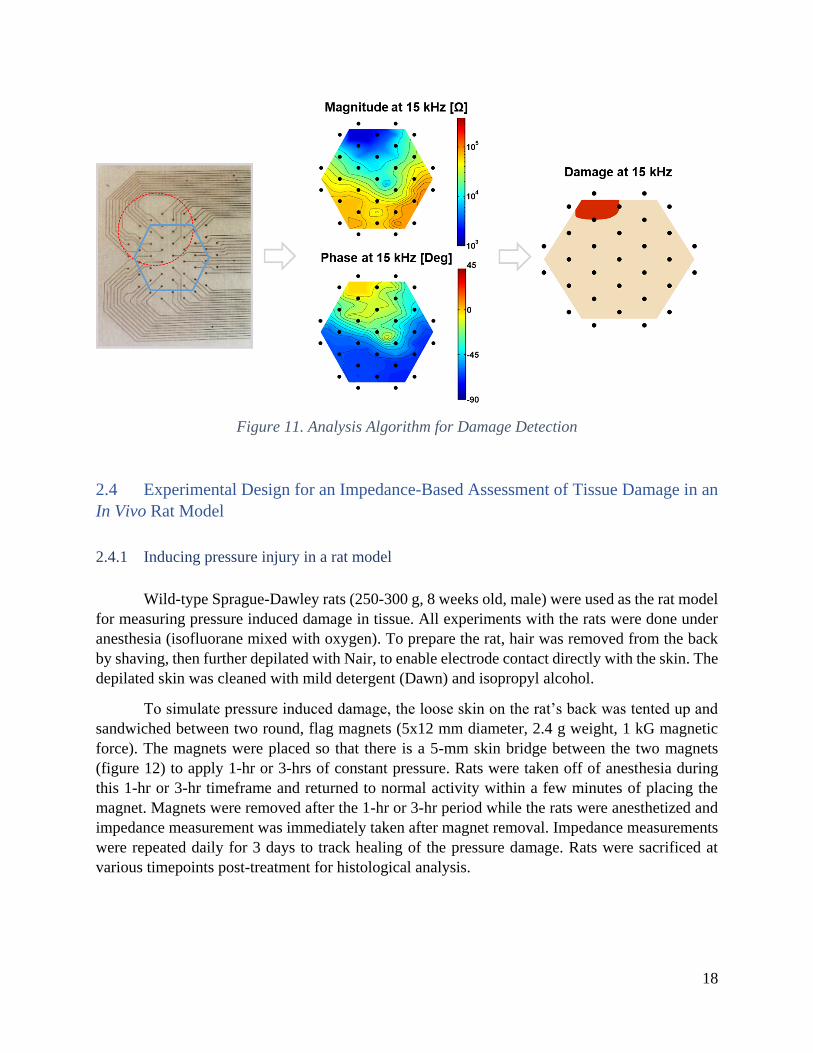
For data analysis, a number of cutom MATLAB scripts (along with the Statistics, system
Identification, and Control System Toolboxes) were used to analyze the impedance data (Figure
11). The raw spatial map data is filtered, averaged, and then interpolated to create visually intuitive
color maps of the impedance distribution across the damaged tissue (both magnitude and phase)
Further post-processing is done to extract more frequency-dependent information from the data.
Transfer functions are fit to the Bode plots to enable comparison between the different types of
tissue present in and around an ulcer. A contrast optimization process identified 15 kHz as the
frequency at which the largest spread in impedance existed between healthy tissue and ulcerous
tissue.
A damage threshhold is identified based on comparison of impedance measurements on
“healthy” and “damaged” tissues across all subjects, using a contrast optimization process. The
damage threshhold includes both a magnitude and phase component for more robust damage
detection. The same damage threshold was used for all wounds on all animals.
18
Figure 11. Analysis Algorithm for Damage Detection
2.4 Experimental Design for an Impedance-Based Assessment of Tissue Damage in an
In Vivo Rat Model
2.4.1 Inducing pressure injury in a rat model
Wild-type Sprague-Dawley rats (250-300 g, 8 weeks old, male) were used as the rat model
for measuring pressure induced damage in tissue. All experiments with the rats were done under
anesthesia (isofluorane mixed with oxygen). To prepare the rat, hair was removed from the back
by shaving, then further depilated with Nair, to enable electrode contact directly with the skin. The
depilated skin was cleaned with mild detergent (Dawn) and isopropyl alcohol.
To simulate pressure induced damage, the loose skin on the rat’s back was tented up and
sandwiched between two round, flag magnets (5x12 mm diameter, 2.4 g weight, 1 kG magnetic
force). The magnets were placed so that there is a 5-mm skin bridge between the two magnets
(figure 12) to apply 1-hr or 3-hrs of constant pressure. Rats were taken off of anesthesia during
this 1-hr or 3-hr timeframe and returned to normal activity within a few minutes of placing the
magnet. Magnets were removed after the 1-hr or 3-hr period while the rats were anesthetized and
impedance measurement was immediately taken after magnet removal. Impedance measurements
were repeated daily for 3 days to track healing of the pressure damage. Rats were sacrificed at
various timepoints post-treatment for histological analysis.

19
Figure 12. Rat Model for Pressure-Induced Damage
All animal procedures were reviewed and approved by the University of California San
Francisco’s Institutional Animal Care and Use Committee (IACUC, approval number AN100403-
01C). Sample size was chosen in consultation with a professional statistician at UCSF to minimize
number of animals needed while providing statistically significant results. In this study, 11 of the
12 animals received the 1-hr procedure, and 9 of the 12 animals received the 3-hr procedure (most
animals received both the 1-hr and 3-hr pressure treatment on different areas of the back on
different days).
2.4.2 Taking impedance measurements on the rat model
Impedance measurements were taken before placing the magnet, at the 1 or 3-hr timepoint
immediately after magnet removal, 1 or 3-hrs after magnet removal, and on days 1, 2, 3, and 9
after the magnet placement procedure. Impedance magnitude and phase were measured using an
Agilent E4980AL impedance meter and the control and electrode arrays described in the previous
sections.
To mount the electrode array onto the wound surface, hydrogel is first applied to the array
using a stenciling process. The array is aligned to the border of the pressure ulcer, such that half
of the array is covering the wound area and half the array is covering the surrounding healthy skin.
Light pressure is applied to the array to ensure constant contact with the tissue. Care must be taken
to avoid moving the electrode array relative to the underlying skin in order to prevent the hydrogel
from smearing, which would, in effect, create a “short circuit” between neighboring electrodes.
When neighboring electrodes are shorted with hydrogel, current will preferentially travel through
the hydrogel, rather than the underlying tissue, thus giving inaccurate impedance measurements.
Impedance measurements should also be taken soon after application of the hydrogel, since contact

20
impedance will worsen once the hydrogel dries out. Once placed, the electrode array is secured to
the skin using a transparent Tegaderm bandage and other adhesives. Coban self-adherent wrap is
wrapped around the rat’s torso to apply even pressure across the array surface and ensure constant
connection with the rat skin (figure 13).
Figure 13. Mounting the Sensor Array to the Wound
For each wound, two sets of impedance measurements were taken:
1. Impedance spectrums: Impedance measured for 12 frequencies between 100 Hz and 1 MHz
at 11 select electrode pairs distributed across the array
2. Spatial impedance maps: Impedance measured at 1, 15, 50, and 100 kHz across all nearest
neighbor electrode pairs

21
2.4.3 Fluorescence Angiography
Fluorescence angiography was used to detect blood flow in the damaged area immediately
after removal of the magnets. Indocyanine green (ICG), a fluorescent dye is injected into the tail
vein of the rat prior to magnet removal and the damaged area was imaged using a Novadaq SPY
near-infrared imaging system. ICG briefly binds to plasma proteins in the blood stream to enable
visualization of blood flow through tissue. Tissue with increased perfusion appears bright in the
NIR image, while tissue with low perfusion appears as a dark spot. Fluorescent angiography was
also performed on days 2, 3, and 9 to identify any changes in tissue perfusion as the tissue heals
over time.
2.4.4 Histology of skin samples
Skin samples from both the 1 and 3 hr ischemia groups were collected for histological
analysis on days 1, 2, 3, and 9 to identify alterations of cell membranes and tissue structure that
could alter impedance measurements. Full thickness skin samples around the damaged area were
excised and immediately fixed in 10% neutral-buffered formalin in flat cassettes for 24-72 hrs.
Tissue was then transferred to 70% ethanol and stored for up to 1 week before being embedded in
paraffin wax and sectioned at 5 microns. Samples were stained with haematoxylin and eosin and
examined under the microscope at 100x magnification.
2.5 Results
2.5.1 Confirming pressure injury using fluorescence angiography and histology
Fluorescence angiography was used to track tissue perfusion immediately after a pressure
event. In both the 1-hr and 3-hr pressure groups, reactive hyperemia (increased perfusion following
a brief period of ischemia) (Herrman, Knapp, Donofrio, & Salcido, 1999; Wong, 2011), was
observed as a bright spot where the magnet was located (marked by dotted circle) (figure 14).
During this reperfusion period, tissue is further damaged by the presence of toxic oxygen free
radicals, inflammation and recruitment of neutrophils and macrophages, and capillary plugging by
leukocytes (Peirce, Skalak, & Rodeheaver, 2000; Saito et al., 2008). Hyperemia lasted a few hours
after the initial damage event.
For the 1-hr group, no difference in tissue perfusion was observed past day 2 between the
pressure-treated region and the surrounding tissue. For the 3-hr group, however, starting 3-hours
after magnet removal, decreased perfusion was observed in the central parts of the pressure-treated
region with a ring of hyperemia at the borders of the injury. The decreased perfusion in the
pressure-damaged region continued past days 2 and corresponded with the onset of visible tissue
injury (dark bruising of skin).

22
Figure 14. Real-time Fluorescent Angiography of Pressure Damaged Tissue
Tissue was also examined histologically at various timepoints throughout the study (Figure
15). For the 1-hr pressure group, only slight damage to the tissue was observed: mostly normal
epidermis (1), with mild orthokeratosis (2), hyperkeratosis (3), or hypergranulosis observed in
some animals.
In the 3-hr group, significant pressure damage was observed that persisted for more than a
week. On day 1, many animals had disruptions in the epidermis (4), suggesting an early stage
pressure ulcer. The pressure ulcer progresses during the following week, with tissue exhibiting
loss of epidermis (5), necroinflammatory debis (scab, 6), and signs of inflammation (neutrophils
and lymphocytes, 7) in the deeper dermis layer.
Results from the fluorescence angiography and the histological analysis suggest that the 1-
hr pressure treatment results in reversible, mild damage that quickly heals within a few days, while
the 3-hr pressure treatment causes irreversible tissue damage that progresses to a stage I pressure
ulcer.

23
Figure 15. Histological Examination of Pressure-Induced Wounds
2.5.2 Impedance spectrum correlates to tissue health
A clear shift in the impedance spectrum was observed when comparing the impedance
magnitude and phase of tissues that received pressure treatment (under the magnet) vs did not
(outside the magnet) (Figure 16). Figure 13 shows the mean data value at each frequency, with the
error bars representing the standard error of the mean. Np is the number of electrode pairs averaged
and NA is the number of animals. For this analysis, electrode pairs were classified as “pressure” or
“no pressure” by examining placement of the electrode array in comparison with the placement of
the magnet (“pressure” = under magnet, “no pressure” = outside magnet border). “Border”
electrode pairs spanning both “pressure” and “no pressure” regions were omitted.
Tissue undergoing pressure treatment had lower impedance magnitude and a phase angle
closer to zero, which is consistent with literature reported effects of cell membrane breakdown in
damaged tissue (Patel & Markx, 2008b). This effect was particularly evident in the 3-hr group,
where pressure was applied for a longer period of time, but still evident although to a lesser extent
in the 1-hr group. Similar results were observed in data collected with both the rigid arrays and the
flexible arrays, suggesting that both versions of the array can be used to collect impedance data.

24
Figure 16. Impedance Spectrums for "Pressure" and "No Pressure" Locations
2.5.3 Determining a damage threshold to predict tissue damage
A “damage threshold” was determined using a contrast optimization process looking at
impedance data collected from 14 wounds on 8 rats (table 3). The greatest difference between
damaged and non-damaged tissue was observed at 15 kHz. A damage threshold that considers both
the impedance magnitude and phase was identified to predict tissue damage, while minimizing
false-positive predictions. The phase requirement improves the robustness of the damage
parameter by reducing impact of animal-to-animal variation on impedance (e.g. skin thickness,
skin hydration).
Table 3. Damage Threshold
Magnitude Threshold Phase Threshold
Rigid Electrode Array |Z| <5 kΩ -5o < θ < 10o
Flexible Electrode Array |Z| < 6 kΩ -35o < θ < -10o
The damage thresholds are slightly different for the rigid and flexible arrays due to differences in
materials, assembly process, and number of connectors. The flexible array had slightly higher line
resistance from the inkjet printing process and also had an additional capacitive contribution from
an extra connector between the array and control board. The same threshold was applied to all
wounds to predict location of tissue damage. Any impedance measurement meeting both the
impedance and phase thresholds were classified as “damaged” tissue.

25
Figure 17 shows the mean impedance spectra of electrode pairs classified as “damaged” vs
“not damaged” following the 1-hr or 3-hr pressure event. Measurements were fitted with an
estimated transfer function (95% confidence interval is shown by the shaded region).
Figure 17. Impedance Spectrum of "Damaged" vs "Non-Damaged" Tissue
2.5.4 Spatial maps enable easy visualization of the wound border
Impedance data were also plotted spatially for easy visualization of the wound area. Figures
18 shows the spatial impedance and damage maps for the 3-hr pressure group at various timepoints
following magnet removal. In row 1, the orange hexagon depicts the area where impedance was
measured with the electrode array. The blue dotted circle indicates where the magnet was placed
during the pressure treatment period. From day 2 onwards, the impedance sensor was able to
identify the location of the tissue damage using the pre-identified damage threshold (shown in red).
Results shown in figure 18 were for a single rat, but similar results were observed across other
animals in the study.

26
Figure 18. Spatial Impedance maps for the 3-hr pressure group
The 1-hr pressure group revealed a more nuanced result after the mild, reversible pressure
damage was induced (figure 19). For all rats, skin appeared slightly white during the reperfusion
period, but quickly returned to normal after a few hours, with no visibly detectable pressure ulcers.
However, for around half the group, similar impedance results were observed as the 3-hr group,
where damage was detectable using the damage threshold on day 2. Thus, impedance spectroscopy
is able to detect mild tissue damage, prior to ulcer formation. By day 3, the damage has mostly
healed, with only a small portion of the tissue still registering as damaged.

27
Figure 19. Spatial impedance Maps for the 1-hr Pressure Group
In the other half of the 1-hr group, no damage is detected visually or through impedance
spectroscopy. Divergence in pressure ulcer progression can be explained by animal-to-animal
variation in skin thickness and inflammatory response, as well as slight variability in placement of
magnets for different animals.

28
Figure 20. Early Detection of Pressure-Induced damage
Closer histological examination of the 1-hr pressure group confirms that in approximately
half the cases, mild pressure damage is observed in the form of hyperkeratosis (B) and
hypergranulosis (C) (figure 20). In the other half, the histological sample is comparable to normal
undamaged tissue, with only focal hyperkeratosis (D) observed in a few spots. These results
support the conclusion that measuring pressure alone is not sufficient to accurately predict tissue
damage, since there’s high variability in the amount of pressure that an animal can tolerate before
developing a pressure ulcer.
2.6 Conclusion
To summarize, in this chapter, we demonstrated a non-invasive electrical bandage that uses
impedance spectroscopy to detect pressure-induced tissue damage in a rat model at early stages.
Of note, impedance spectroscopy can be used to detect mild, reversible damage before the damage
is visually apparent. If pressure damage is detected early enough, such as in the case of the 1hr
pressure damage group, pressure ulcer formation could potentially be prevented entirely, greatly
improving patient outcomes as well as the associated treatment costs.
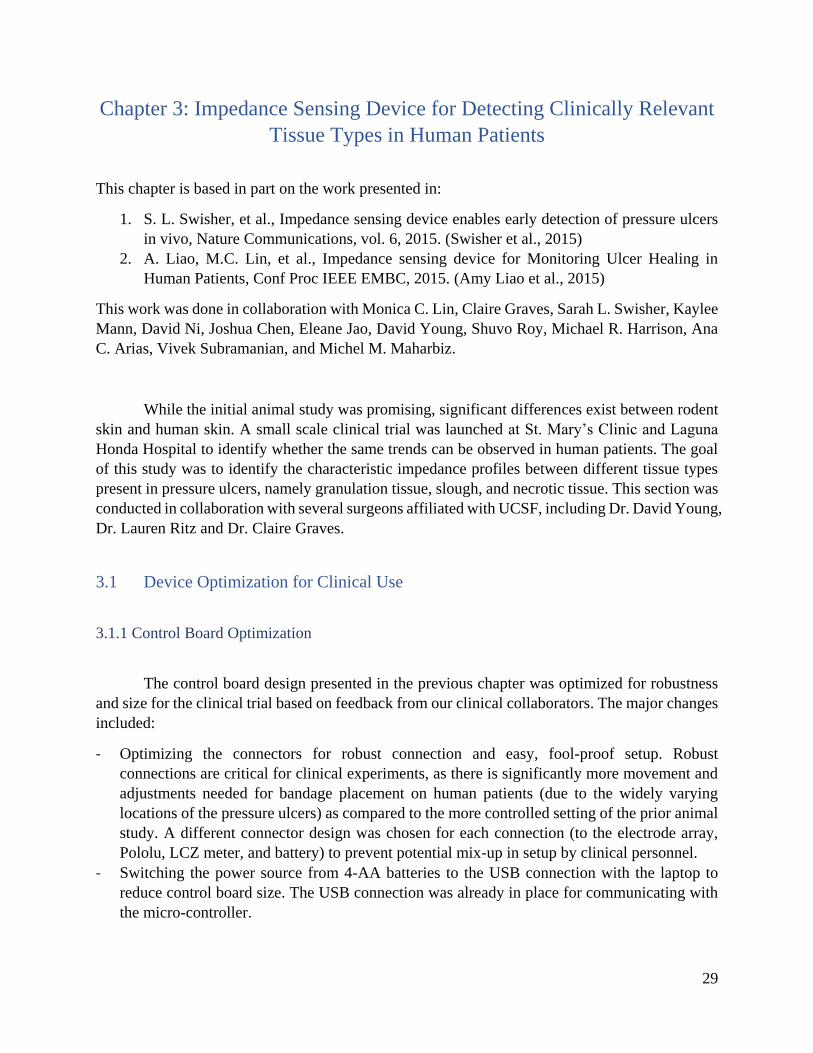
29
Chapter 3: Impedance Sensing Device for Detecting Clinically Relevant
Tissue Types in Human Patients
This chapter is based in part on the work presented in:
1. S. L. Swisher, et al., Impedance sensing device enables early detection of pressure ulcers
in vivo, Nature Communications, vol. 6, 2015. (Swisher et al., 2015)
2. A. Liao, M.C. Lin, et al., Impedance sensing device for Monitoring Ulcer Healing in
Human Patients, Conf Proc IEEE EMBC, 2015. (Amy Liao et al., 2015)
This work was done in collaboration with Monica C. Lin, Claire Graves, Sarah L. Swisher, Kaylee
Mann, David Ni, Joshua Chen, Eleane Jao, David Young, Shuvo Roy, Michael R. Harrison, Ana
C. Arias, Vivek Subramanian, and Michel M. Maharbiz.
While the initial animal study was promising, significant differences exist between rodent
skin and human skin. A small scale clinical trial was launched at St. Mary’s Clinic and Laguna
Honda Hospital to identify whether the same trends can be observed in human patients. The goal
of this study was to identify the characteristic impedance profiles between different tissue types
present in pressure ulcers, namely granulation tissue, slough, and necrotic tissue. This section was
conducted in collaboration with several surgeons affiliated with UCSF, including Dr. David Young,
Dr. Lauren Ritz and Dr. Claire Graves.
3.1 Device Optimization for Clinical Use
3.1.1 Control Board Optimization
The control board design presented in the previous chapter was optimized for robustness
and size for the clinical trial based on feedback from our clinical collaborators. The major changes
included:
- Optimizing the connectors for robust connection and easy, fool-proof setup. Robust
connections are critical for clinical experiments, as there is significantly more movement and
adjustments needed for bandage placement on human patients (due to the widely varying
locations of the pressure ulcers) as compared to the more controlled setting of the prior animal
study. A different connector design was chosen for each connection (to the electrode array,
Pololu, LCZ meter, and battery) to prevent potential mix-up in setup by clinical personnel.
- Switching the power source from 4-AA batteries to the USB connection with the laptop to
reduce control board size. The USB connection was already in place for communicating with
the micro-controller.

30
The new control board measured ~2x2 inches across and was able to select between any
combination of the 55 electrodes on the electrode array (figure 21).
Figure 21. Control board
3.1.2 Flexible Array Optimization
A commercially-fabricated version of the flexible array was purchased in mass from
Tramonto Circuits for the clinical study (figure 23). Two sizes of the array was fabricated (0.7-
inch array and 2-inch array) to accommodate different sized wounds on patients. Slits
streategically placed in the polyimide of the 2-in board further improves coformability of the
bandages (figure 22). These arrays were fabricated with copper traces on a polyimide substrate,
with the exposed electrodes plated in nickel immersion gold. In addition to the electrode array
configuration used in the previously discussed animal study (0.7 inch array, 300 µm pads spaced
2.54 mm apart), an additional larger 2-inch array (635 µm pads spaced 7.333 mm apart) was also
fabricated to accommodate patients with larger injuries. The array used was determined by the size
and anatomical location of the ulcers on each patient.
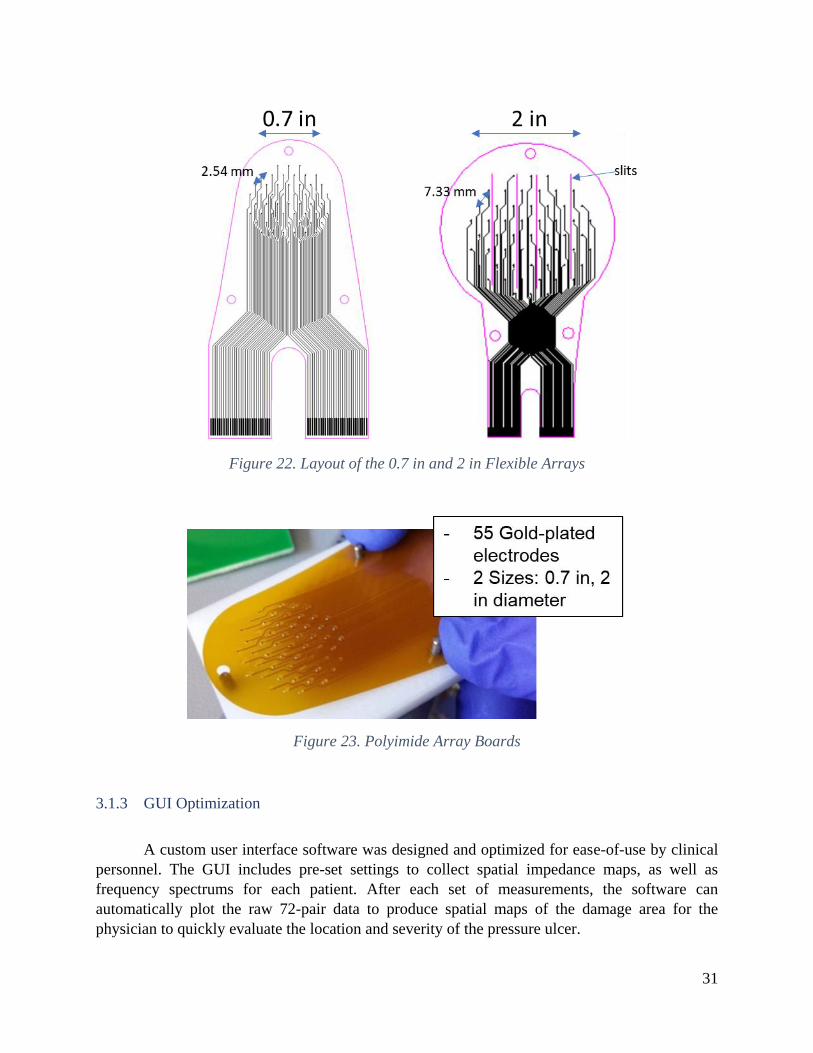
31
Figure 22. Layout of the 0.7 in and 2 in Flexible Arrays
Figure 23. Polyimide Array Boards
3.1.3 GUI Optimization
A custom user interface software was designed and optimized for ease-of-use by clinical
personnel. The GUI includes pre-set settings to collect spatial impedance maps, as well as
frequency spectrums for each patient. After each set of measurements, the software can
automatically plot the raw 72-pair data to produce spatial maps of the damage area for the
physician to quickly evaluate the location and severity of the pressure ulcer.

32
3.2 Clinical Trial Design
3.2.1 Patient Selection: Inclusion and Exclusion Criteria
The clinical trial was conducted on patients seeking treatment for an ulcer at St. Mary’s
Clinic or Laguna Honda Hospital. Inclusion criteria for the clinical trial population include:
- Male or female patient between the ages of 18 and 80 years old
- Patient must require weekly wound assessment by a physician or registered nurse
- The ulcer is between stages I and III as defined by the National Pressure Ulcer Advisory Panel
(NPUAP) classification system (NPUAP (National Pressure Ulcer Advisory Panel), 2016).
Patients with stage IV pressure ulcers were excluded due to anticipated difficulty of placing
the bandage on ulcers with extreme topography. Stable electrical contact is necessary for
accurate impedance measurements of the underlying tissue.
- The ulcer is located on a common pressure point (e.g. sacrum, ischium, trochanter, heel, and
elbow). While the back of the head is also at high risk for developing a pressure ulcer,
measuring wounds in this location was impractical as it would require shaving the head. Thus,
the head and any other area that has excessive body hair was excluded from this study.
- The ulcer is located in a location with minimal hair to enable easy access to the wound area
The five patients presented in the preliminary study had ulcers ranging from stage I to stage
III on their leg, foot, or sacrum, and shaving was not necessary on any patient. Patients included
two males and three females of ages 57-70.
3.2.2 Methods for taking impedance measurements
For each patient and wound, the appropriate electrode array size was selected. Hydrogel
was selectively patterned onto each electrode to ensure good electrode contact with skin. The
flexible array board was positioned over the border of the ulcer and was adhered to the patient
using VersatelTM contact layer wound dressings, which caused no irritation to the patient (figure
24).

33
Figure 24. Placement of Electrode Array Over the Ulcer Border
For each patient, two sets of impedance measurements were taken on healthy skin to serve
as a baseline and on the border of the ulcer:
1. Impedance spectrums: 12 frequencies ranging from 100 Hz to 1 MHz measured on 11 select
pairs on the array
2. Spatial maps: 4 frequencies (1, 15, 50, and 100 kHz) measured across every nearest neighbor
electrode pairs
After each measurement, the board outline was marked on the skin and a photograph taken,
so that the electrode placement can be correlated with the underlying tissue for further analysis.
The type of tissue under each electrode pair was classified as granulation tissue, slough, necrotic
tissue, or normal skin by a surgical fellow from the images of the wound with the array outline
overlaid over it (figure 25). Damaged tissue that did not fit into one of these categories were
lumped into a general “ulcer” category.
Figure 25. Tissue types commonly present in ulcers
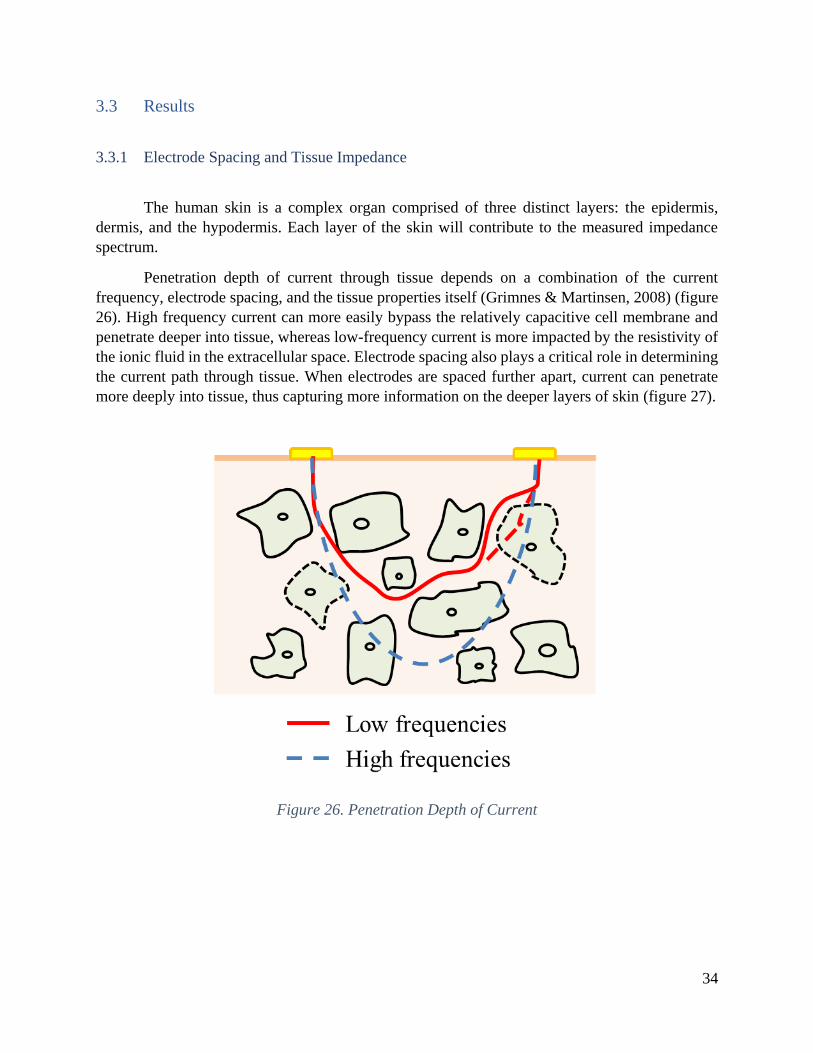
34
3.3 Results
3.3.1 Electrode Spacing and Tissue Impedance
The human skin is a complex organ comprised of three distinct layers: the epidermis,
dermis, and the hypodermis. Each layer of the skin will contribute to the measured impedance
spectrum.
Penetration depth of current through tissue depends on a combination of the current
frequency, electrode spacing, and the tissue properties itself (Grimnes & Martinsen, 2008) (figure
26). High frequency current can more easily bypass the relatively capacitive cell membrane and
penetrate deeper into tissue, whereas low-frequency current is more impacted by the resistivity of
the ionic fluid in the extracellular space. Electrode spacing also plays a critical role in determining
the current path through tissue. When electrodes are spaced further apart, current can penetrate
more deeply into tissue, thus capturing more information on the deeper layers of skin (figure 27).
Figure 26. Penetration Depth of Current
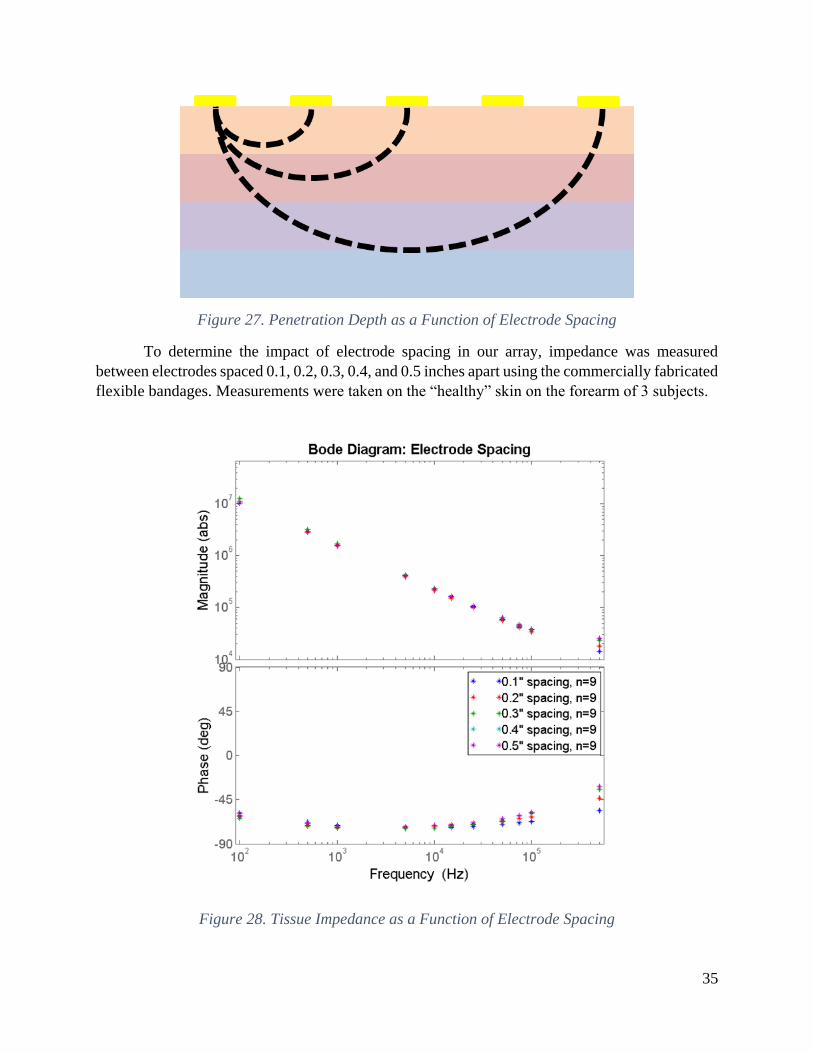
35
Figure 27. Penetration Depth as a Function of Electrode Spacing
To determine the impact of electrode spacing in our array, impedance was measured
between electrodes spaced 0.1, 0.2, 0.3, 0.4, and 0.5 inches apart using the commercially fabricated
flexible bandages. Measurements were taken on the “healthy” skin on the forearm of 3 subjects.
Figure 28. Tissue Impedance as a Function of Electrode Spacing

36
If tissue were a homogenous material, tissue impedance would increase linearly with
electrode spacing. However, as seen in figure 28, tissue impedance does not change significantly
with respect to electrode spacing, suggesting that the upper layers of skin and the contact
impedance between skin and electrode contribute more substantially to the measured impedance
than the underlying tissue. Literature reports that the layers of skin (epidermis, dermis, and fatty
subcutaneous tissue) has significantly higher impedance than the underlying muscle layer (Gabriel
et al., 1996), and therefore is expected to have a greater impact on the impedance measurements.
In the event that tissue is damaged, the relative impedances of skin and muscle may shift, causing
electrode spacing to have a higher impact on measured impedance. In addition to tissue effect,
contact impedance between skin and electrode can also play a large role in the measured
impedance, particularly if the electrodes are not able to maintain good, stable contact with skin.
3.3.2 Correlating Impedance with Tissue Type
Tissue impedance was measured between 102 and 106 Hz across every nearest neighbor pair
in the electrode array using a 100-mVRMS constant voltage test signal generated by the Keysight
Technologies LCR meter. For each patient, two measurements were taken: 1.) on “healthy” skin
in an area adjacent to the ulcer and 2.) at the border of the ulcer. Wounded tissue in the ulcer was
categorized as granulation tissue, slough, or necrotic tissue. Damaged tissue that did not fit into
one of those 3 types were lumped into a general “ulcer” category. Granulation tissue, which forms
on the surface of wounds, is a highly vascularized tissue that appears moist and bumpy. Across all
5 patients studied, the impedance of the granulation tissue in the ulcer is consistently lower in
magnitude and less capacitive than the corresponding impedance of healthy tissue on the same
patient, which is consistent with compromised cell membrane of the damaged tissue and the
increase in ionic fluids introduced by the new vasculature. Slough is a thick, fibrous tissue,
consisting of fibrin, pus, and other proteinaceous materials that need to be removed in order for
the wound to heal properly. The impedance magnitude of slough is also lower than that of normal
non-ulcerous tissue. Necrotic tissue, which typically appears as a red to dark brown scab-like tissue,
consists of dead cells and debris and has low moisture levels, resulting in a high impedance
magnitude similar to or slightly higher than that of normal healthy tissue. Bode plots depicting
these differences between tissue types are shown in Fig. 29.

37
Figure 29. Impedance Spectrums of Tissue Types Present in Wounds
3.3.3 Determining a Damage Threshold
The spread in impedance magnitude and phase between the different tissue types was most apparent at the 15 kHz frequency. A magnitude and phase threshold are used to effectively identify “damaged tissue”:
Threshold: |Z| < 100 kΩ, -30o < θ < 10o
The same thresholds were applied to all impedance measurements. Pairs falling within the threshold range are labeled as “damaged tissue”. The damage parameter indicates where the algorithm predicts tissue damage, including granulation tissue and slough (there were not enough data points to identify a separate threshold for necrotic tissue). The damage parameter is chosen to minimize the number of false positives, while still identifying the majority of damaged tissue regions. The damage threshold uses both the impedance magnitude and phase to identify “damaged tissue” to reduce the impact of the natural variation between patient skins and to make the threshold more reliable. The spatial map of the damage parameter will enable physicians to quickly assess wound size, as shown in Fig. 30.
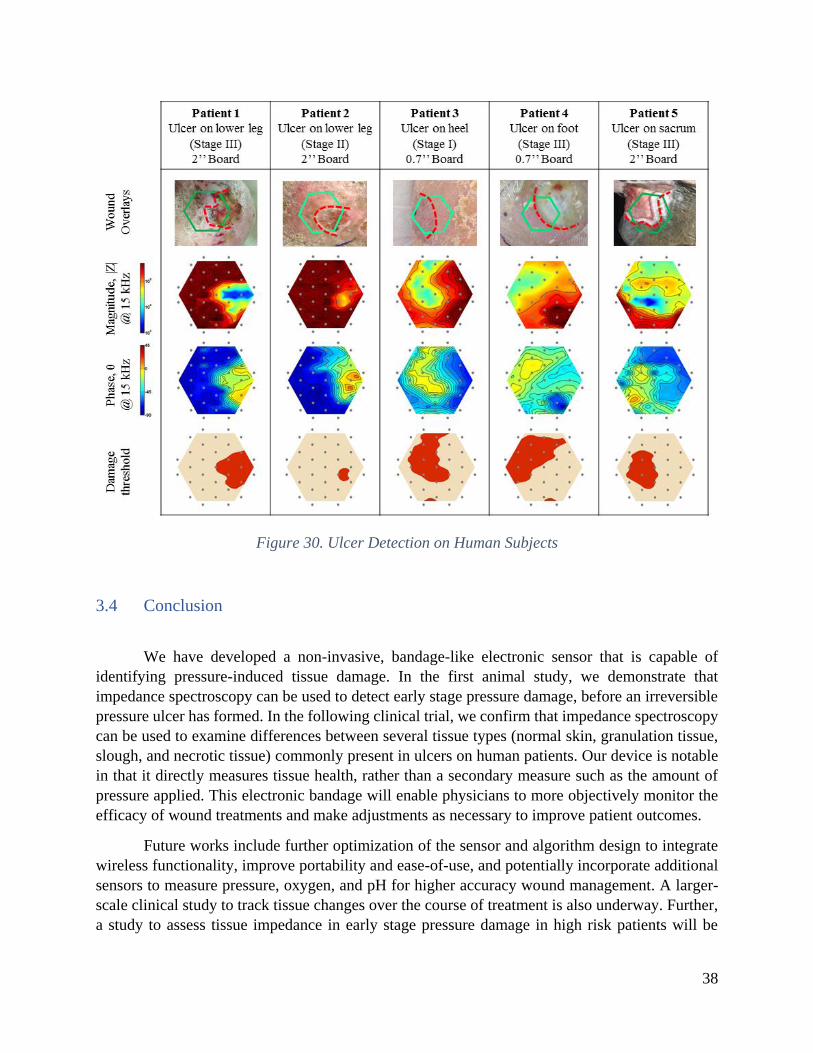
38
Figure 30. Ulcer Detection on Human Subjects
3.4 Conclusion
We have developed a non-invasive, bandage-like electronic sensor that is capable of
identifying pressure-induced tissue damage. In the first animal study, we demonstrate that
impedance spectroscopy can be used to detect early stage pressure damage, before an irreversible
pressure ulcer has formed. In the following clinical trial, we confirm that impedance spectroscopy
can be used to examine differences between several tissue types (normal skin, granulation tissue,
slough, and necrotic tissue) commonly present in ulcers on human patients. Our device is notable
in that it directly measures tissue health, rather than a secondary measure such as the amount of
pressure applied. This electronic bandage will enable physicians to more objectively monitor the
efficacy of wound treatments and make adjustments as necessary to improve patient outcomes.
Future works include further optimization of the sensor and algorithm design to integrate
wireless functionality, improve portability and ease-of-use, and potentially incorporate additional
sensors to measure pressure, oxygen, and pH for higher accuracy wound management. A larger-
scale clinical study to track tissue changes over the course of treatment is also underway. Further,
a study to assess tissue impedance in early stage pressure damage in high risk patients will be

39
essential for validating this tool as a preventative device to prevent progression of mild pressure
damage into full-fledged pressure ulcers.
3.4.1 Applications beyond pressure ulcers
Apart from early detection of pressure ulcers, this technology can also be extended for use
in numerous other applications involving diagnosis of differences in tissue types. Potential
applications include post-operative tracking of the healing of surgical wounds, accurate detection
of burn wounds, and diagnosis of skin cancers.
3.4.1.1 Open, excisional wounds
In addition to pressure ulcers, we showed that our device can also track changes in tissue
impedance in open skin wounds, such as abrasions, open sores, and lacerations. To demonstrate
this, an open, excisional wound was created on a rat model (n=1) by surgically removing a small
portion of skin (figure 31). On day 1, immediately after the wound was created, impedance in the
wound bed was significantly lower than surrounding tissue, due to the presence of conductive
wound exudate present. By day 3, the wound has started to heal with the formation of a hard, dry
scab covering the wound bed, resulting in much higher impedance magnitude and more capacitive
phase angle. The scabbed area is characterized by a decrease in ionic fluids and the presence of
high resistance fibrin plugs.
With slight change in instrumentation, our device can also be used to measure voltage maps
across a wound surface with respect to a common reference electrode or to apply electrical
stimulation. Electric fields have been reported in the wound bed and is hypothesized to play a
crucial role in wound healing. Cell migration is directly affected by applied electrical fields. During
the healing process, electrical fields within the wound assist in migration of neutrophils and other
cells into the wound bed during the normal course of healing. Our device can be used to study
whether application of an electric stimulus could expedite the wound healing process.

40
Figure 31. Impedance Maps of Excisional Wounds
3.4.1.2 Non-Invasive Onchocerciasis Diagnosis
Another application that we examined in more detail is onchocerciasis diagnosis through
differentiation between onchocercoma worm nodules and other benign tissues types. This proposal
was developed in collaboration with Dr. Judy Sakanari (UCSF), Christina Bulman (UCSF), and
Fidelis Cho-Ngwa (University of Beau, Cameroon)
Onchocerciasis is caused by the filarial worm Onchocerca volvulus which causes severe
itchiness, skin rashes and eye disease. There are an estimated 25 million cases of onchocerciasis
(river blindness) worldwide, leading to 1.1 million cases of vision impairment (Edwards, 2018;
“Parasites - Onchocerciasis (also known as River Blindness),” 2013). During the lifecycle of the
worm, adult worms will reside in small cocoon-like nodules under the skin, varying from 1-5 cm.
However, these nodules are often difficult to differentiate from benign subcutaneous lumps, such
as fat pads and lipomas, which do not require surgical removal. Diagnosis of onchocercomas
require relatively expensive technology, such as ultrasound, or a painful skin biopsy to identify the
worm larvae (Faris, Hussain, Setouhy, Ramzy, & Weil, 1998; Mand et al., 2005).

41
Efforts to control the disease depend solely on mass drug administration (MDA) of
ivermectin, which kills the young larvae or microfilariae (mf) but does not kill adult worms
(macrofilariae). While ivermectin can reduce transmission of mf to the blackfly vector, adult
worms, which can live 10-14 years, continue to produce mf and perpetuate the cycle of infection
(Hopkins, 2005). Finding a drug that can kill the adult worms is essential to eliminating
onchocerciasis, and a major campaign is underway to identify new macrofilaricides to treat this
disease.
Currently, there are no biomarkers or accurate means to evaluate drug efficacy to determine
if adult worms are killed by the macrofilaricide. Hence there is critical need for a non-invasive tool
to distinguish between live, moribund and dead worms inside skin nodules after a patient is
administered the drug. Worm death is currently assessed by histological examination of nodules
after nodules are surgically removed (Hoerauf et al. 2008; Hoerauf et al. 2009) but avoiding any
surgery or invasive procedure is paramount. Ultrasonography is also used to image worms in skin
nodules as well as scrotal tissues for lymphatic filariasis (Faris et al. 1998; Mand et al. 2005) but
it is expensive, and when worms are not actively moving, this method lacks the sensitivity
necessary to detect moribund worms.
We propose that impedance spectroscopy can be used to detect the worm nodules under
the skin and differentiate it from other benign subcutaneous lumps, such as fat pads and lipomas.
Depending on the depth of the worm nodules, worm viability could potentially also be determined,
though experiments would need to be conducted to determine the sensitivity of impedance
measurements to worm viability. Since spatial mapping is not critical for either of these
applications, a change in form factor to a pen-like probe could improve faster, more portable
onchocerciasis diagnosis (figure 32).
Figure 32. Onchocerciasis Diagnosis Probe
In a preliminary proof-of-concept experiment (conducted by Monica Lin and Christina
Bulman at the Univ. of Buea in Cameroon in Dr. Fidelis Cho-Ngwa’s lab), we found that
onchocercoma nodules in cow hide could be detected using impedance (figure 33). Since
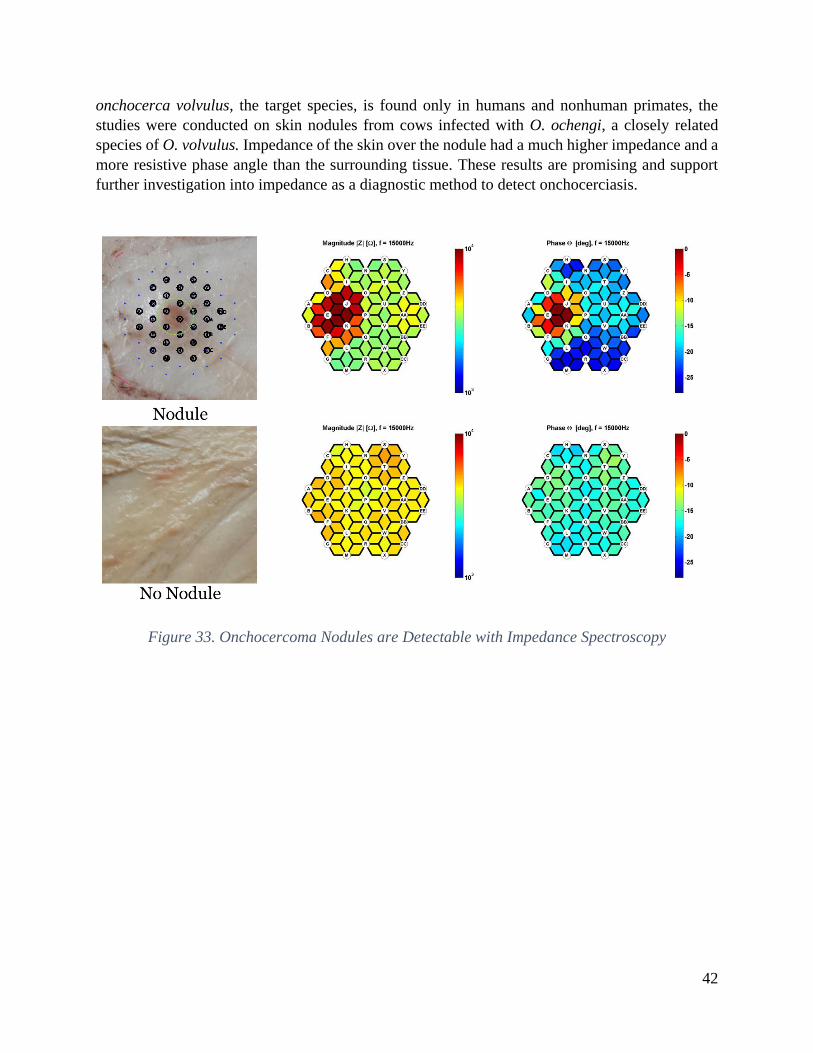
42
onchocerca volvulus, the target species, is found only in humans and nonhuman primates, the
studies were conducted on skin nodules from cows infected with O. ochengi, a closely related
species of O. volvulus. Impedance of the skin over the nodule had a much higher impedance and a
more resistive phase angle than the surrounding tissue. These results are promising and support
further investigation into impedance as a diagnostic method to detect onchocerciasis.
Figure 33. Onchocercoma Nodules are Detectable with Impedance Spectroscopy

43
Chapter 4: Strain Maps for Guiding Hernia Repairs
This chapter is based in part on the work presented in:
1. A. Liao, et al., “Towards a Full-Field Strain Sensor for Guiding Hernia Repairs,” Conf Proc
IEEE EMBC, 2015. (A. Liao, Harris, & Maharbiz, 2015)
This work was completed under the guidance of Michel Maharbiz and Hobart Harris, who
provided advice on the technical and clinical considerations respectively.
While many flexible wearables, including smart bandages, can be instrumented for non-
invasive diagnosis and monitoring, flexible sensors can also be implanted in the body to provide a
more comprehensive picture of overall health as well as to target monitoring of specific organs of
interest. In this chapter, we demonstrate an implantable strain sensor integrated onto a flexible
mesh prosthetic to guide hernia repair surgeries.
4.1 Formation and Repair of Abdominal Wall Hernias
4.1.1 Prevalence of Abdominal Wall Hernias
A hernia is defined as a protrusion of an internal organ through a tear in the tissues that
normally contain it. Abdominal wall hernia repairs are among the most commonly performed
surgical procedures in the world, with an estimated 20 million cases worldwide per year
(Kingsnorth & Leblanc, 2003) . In the United States, approximately 400,000 ventral hernia repairs
are performed annually, resulting in a total cost of $3.2 billion per year in treatment and
postoperative expenses (Poulose et al., 2012).
Table 4. Incidence of Abdominal Wall Hernia Repairs in the United States in 2003
Hernia Type Total Number of Repairs (%)
Groin Hernias:
Inguinal 770,000 (66.4%)
Femoral 30,000 (2.6%)
Ventral Hernias:
Umbilical 175,000 (15.1%)
Incisional 105,000 (9.1%)
Other (Spigelian, Hiatal, or Epigastric) 80,000 (6.9%)

44
Certain sections of the human abdominal wall are weaker and more prone to herniation
than the surrounding tissues. Hernias are classified based on the location of the defect (table 4).
Inguinal hernias are by far the most prevalent type; 27% of men and 3% of women will develop a
groin hernia during their lifetime (Fitzgibbons & Forse, 2015). Table 4 summarizes the prevalence
of various abdominal wall hernia repairs in the United States (Rutkow, 2003).
4.1.2 Causes of Hernia Formation
Abdominal wall hernias are caused by a weakness in the load-bearing muscle, tendon, and
fascial layer combined with an increased abdominal pressure (Elango, Perumalsamy, Tech, &
Vadodaria, 2017; Franz, 2009).
Loss of structural integrity in the abdominal wall can be attributed to anatomical defects,
connective tissue disorders, or surgical wound failure. Hernias due to anatomical defects are
usually congenital, arising from failure of the abdominal wall to fully close around the internal
organs during fetal development (Murphy, O’Connor, & Maher, 2014).
Tissue weakness can also result from a number of connective tissue disorders, many of
which are linked to genetic predispositions. Collagen is the most abundant structural protein that
forms the scaffold of connective tissue and provides mechanical strength and elasticity to tissue.
Type I collagen is a mature collagen that provides superior tensile strength compared to the thinner
strands of the relatively more immature Type III collagen. Abnormal collagen metabolism alters
the quantity and ratio of Type I/III collagen, thus affecting the tensile strength and mechanical
stability of the connective tissue (Elango et al., 2017). Recent studies show that over expression
of destructive enzymes (matrix metallo-proteinases, MMPs) or the lack of MMP inhibitors (Tissue
Inhibitors of Metalloproteinases, TIMPS) can alter the Type I/III ratio of collagen and has been
reported in patients with inguinal and incisional hernias (Elango et al., 2017).
Hernias are also common among patients with prior surgeries (incisional hernias) due to
impaired wound healing and loss of tissue integrity at the surgical site. After a surgery, the surgical
wound passes through four overlapping stages of healing: hemostasis, inflammation,
proliferation/repair, and remodeling (Morton & Phillips, 2016). The first phase, hemostasis, occurs
immediately after injury occurs, causing the blood vessels to constrict and a platelet plug to form
to restrict blood loss. Over the next 3-5 days, the body will initiate the inflammatory response, and
recruit essential white blood cells, antibodies, growth factors, enzymes, and other inflammatory
factors to the wound site to initiate healing (Morton & Phillips, 2016). Mechanical disruption
during the inflammatory phase or “lag phase” of the wound healing cycle can cause healing to stall
and prevent new tissue formation in the early stages of wound healing (Franz, 2009). During the
proliferation phase, new granulation tissue starts to form within the wound site as new collagen
and extracellular matrix is deposited and angiogenesis of new blood vessels develop. The final
stage of remodeling/maturation can take weeks to years as the collagen fibers are reorganized and
matured from Type III to Type I collagen. However, wounded tissue is never again as strong as
the original undamaged tissue; collagen reaches ~20% of its original tensile strength three weeks
after injury and plateaus at ~ 80% strength after a full year of healing, making the surgical incision
45
site more prone to herniation (Morton & Phillips, 2016). Wound healing can also fail at later stages
due to scar tissue breakdown (Franz, 2009).
Excess pressure placed on weakened tissue walls causes the tissue to rupture and a hernia
defect to form. There is typically 2-20 mm Hg positive pressure within the abdominal cavity. The
abdominal pressure is increased with movement, including during normal daily functions, such as
respiration, defecation, and micturition. Sharp, forceful movements, such as coughing, vomiting,
or jumping can increase the internal pressure up to 170 mm Hg, placing further stress on the
abdominal walls. Prolonged loads (i.e. due to obesity, pregnancy, or chronic constipation) or
repetitive mechanical strains (i.e. due to chronic cough or weight lifting) can also cause damage to
the load-bearing tissue (Brown & Finch, 2010; Elango et al., 2017; Murphy et al., 2014).
4.1.3 Current Repair Techniques
Large ventral hernias (defects in the abdominal wall) can be repaired either by primary
closure or tension-free repair (Burger, Halm, Wijsmuller, Raa, & Jeekel, 2006). Until 1958, all
abdominal hernias were repaired using the primary closure approach, where the hernia defect is
directly sutured shut. In 1958, Usher introduced the use of a polypropylene mesh to help bridge
the hernia defect and reduce the tension in the repair. This technique was later optimized and
popularized for most abdominal hernia repairs Lichtenstein repair (Brown & Finch, 2010).
Today, primary closure is only recommended for small hernias, typically <2-3 cm in
diameter. The majority of hernia repairs use the tension-free repair method, where a surgical mesh
prosthetic provides additional support to the damaged tissue surrounding the hernia. Currently,
about 1 million hernia mesh prosthetics are used annually worldwide (Brown & Finch, 2010).
4.1.3.1 Mesh Selection
Since the first introduction of the tension-free repair, hernia mesh prosthetics have evolved
in both design and material. When first introduced, hernia meshes were made of strong
polypropylene material, knitted or woven into a net-like pattern to be able to withstand high forces
and to encourage integration with tissue. Unfortunately, these heavy-weight meshes also tended to
induce more fibrotic response, ultimately resulting in more scar tissue formation, greater pain, and
restricted movement (Brown & Finch, 2010). Lightweight meshes, introduced in 1998, were
designed to have larger pores (~3-5 mm) to improve flexibility and elasticity. These meshes had
less surface area and also shrink less, thus evoking less fibrotic response in tissue (Bringman et al.,
2010; Brown & Finch, 2010). Despite the improvements from adjusting the mesh patterning,
polypropylene meshes still suffer from complications, including hernia recurrence, infection, and
adhesion. Over the years, a wide array of meshes made of different polymers have emerged,
including polypropylene, polyester, ePTFE (Goretex). These meshes varied in knit or weave
pattern, pore size, density, elasticity, tensile strength, and other parameters. Biological meshes
have also been introduced, consisting of an acellularized collagen matrix derived from human,
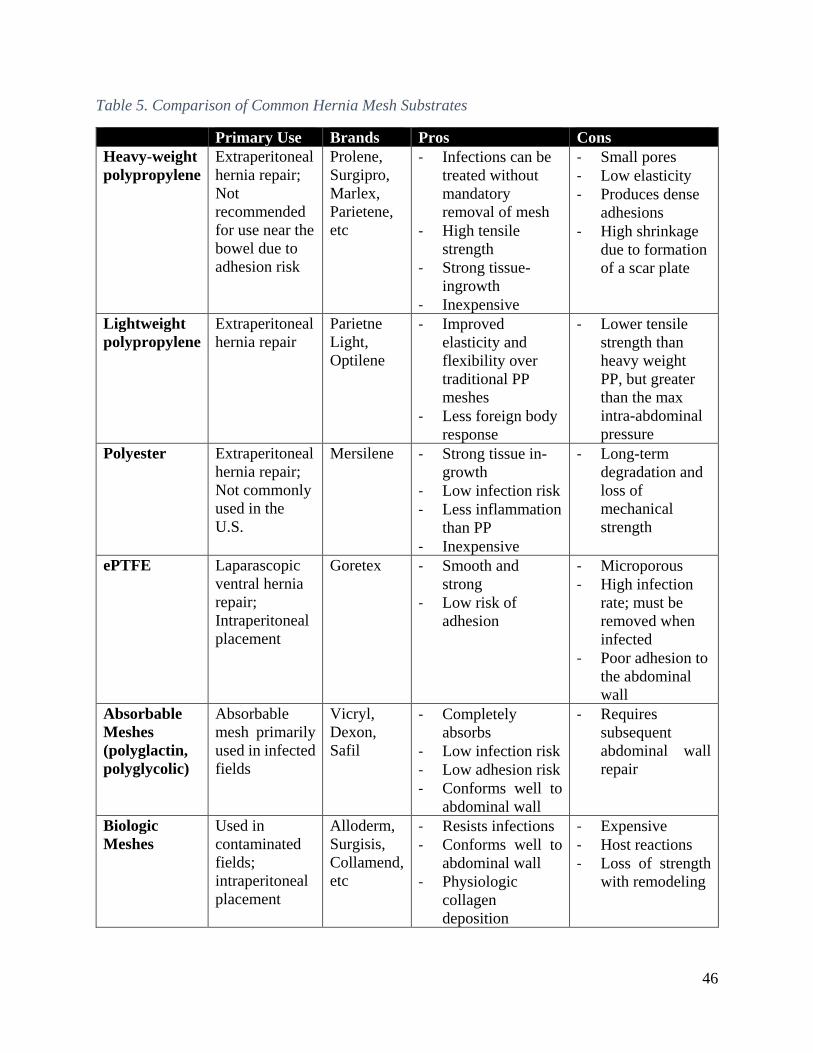
46
Table 5. Comparison of Common Hernia Mesh Substrates
Primary Use Brands Pros Cons
Heavy-weight
polypropylene
Extraperitoneal
hernia repair;
Not
recommended
for use near the
bowel due to
adhesion risk
Prolene,
Surgipro,
Marlex,
Parietene,
etc
- Infections can be
treated without
mandatory
removal of mesh
- High tensile
strength
- Strong tissue-
ingrowth
- Inexpensive
- Small pores
- Low elasticity
- Produces dense
adhesions
- High shrinkage
due to formation
of a scar plate
Lightweight
polypropylene
Extraperitoneal
hernia repair
Parietne
Light,
Optilene
- Improved
elasticity and
flexibility over
traditional PP
meshes
- Less foreign body
response
- Lower tensile
strength than
heavy weight
PP, but greater
than the max
intra-abdominal
pressure
Polyester Extraperitoneal
hernia repair;
Not commonly
used in the
U.S.
Mersilene - Strong tissue in-
growth
- Low infection risk
- Less inflammation
than PP
- Inexpensive
- Long-term
degradation and
loss of
mechanical
strength
ePTFE Laparascopic
ventral hernia
repair;
Intraperitoneal
placement
Goretex - Smooth and
strong
- Low risk of
adhesion
- Microporous
- High infection
rate; must be
removed when
infected
- Poor adhesion to
the abdominal
wall
Absorbable
Meshes
(polyglactin,
polyglycolic)
Absorbable
mesh primarily
used in infected
fields
Vicryl,
Dexon,
Safil
- Completely
absorbs
- Low infection risk
- Low adhesion risk
- Conforms well to
abdominal wall
- Requires
subsequent
abdominal wall
repair
Biologic
Meshes
Used in
contaminated
fields;
intraperitoneal
placement
Alloderm,
Surgisis,
Collamend,
etc
- Resists infections
- Conforms well to
abdominal wall
- Physiologic
collagen
deposition
- Expensive
- Host reactions
- Loss of strength
with remodeling

47
porcine, or bovine tissue. Each type of mesh has its own benefits and drawbacks, thus mesh choice
must be carefully selected to fit the patient needs (Bringman et al., 2010; Brown & Finch, 2010).
Table 5 summarizes the pros and cons of some of the more commonly used mesh materials (Brown
& Finch, 2010; Robinson, Clarke, Schoen, & Walsh, 2005).
4.1.4 Recurrence rate
Repair of ventral hernias involves reinforcement of the weakened abdominal wall muscles
with prosthetic mesh; the use of mesh has been shown to reduce the recurrence rate by around 50%
(Gillian, Geis, & Grover, 2002; Kingsnorth & Leblanc, 2003; Luijendijk et al., 2000; Robinson et
al., 2005). Despite the use of mesh, ventral hernia repairs frequently fail, with an increasing rate
of recurrence over post-surgery time, suggesting a fundamental flaw in the therapeutic approach
(Flum, Horvath, & Koepsell, 2003). Over time the mesh is pulled away from the abdominal wall
at the high stress concentrations and the hernia defect recurs. The median time to failure is 26
months, with 2/3 of recurrences occurring within the first three years after surgery (Brown & Finch,
2010). Beyond the benefits of improving patient outcomes and patient quality of life, it has been
estimated that a cost savings of $32 million can be achieved for each 1% reduction in recurrence
rate (Poulose et al., 2012). High stress gradients across the mesh due to improper mesh alignment
during the surgical repair is postulated to be a major cause of hernia recurrence. High tension at
the mesh-tissue interface can result in failure of the prosthetic, with mechanical failure accounting
for 18% of all recurrent hernias (Robinson et al., 2005).
Currently, there is no method for measuring stress across the mesh during a hernia repair
procedure. A device that can provide quantitative stress measurements would provide valuable
information for guiding ventral hernia repairs by enabling surgeons to make real-time adjustments
to relieve possible stress concentrators. Further, the ability to non-invasively track the stress
distribution following the surgical repair would enable patients and physicians to monitor the status
of the mesh as well as enable further research into the causes of hernia recurrence.
4.2 Current State of Strain Measurement Techniques
4.2.1 Relationship Between Stress and Strain
Stress is the internal resistance of a material in response to external forces. In a hernia
repair, these external forces would be caused by the suturing process to fix the mesh to the
underlying tissue as well as from normal movements of the abdominal wall. Stress is a function of
the external forces and the cross-sectional area the force is acting upon (equation 2). Since a suture
is a point source with small area, there is frequently high stress concentrators surrounding the
suture, particularly if the mesh and tissue are not well aligned.

48
𝜎 = 𝐹
𝐴
Equation 2. Definition of Stress
For a given material, stress and strain are related through the material’s Young’s Modulus
(equation 3). Strain is a measure of the physical deformation per length of a material due to an
applied stress (equation 4) and is a unitless number. While stress is difficult to measure directly,
strain is more easily measured by examining the physical changes in geometry, including both
elongation and compression of the material directly.
𝐸 = 𝜎
𝜀
Equation 3. Relationship between Stress and Strain
𝜀 = ∆𝐿
𝐿
Equation 4. Definition of Strain
4.2.2 Contact Measurement Methods
Traditionally, strain is measured using metallic strain gauges, devices whose electrical
properties vary proportionally with applied strain. (Amjadi, Kyung, Park, & Sitti, 2016). Resistive
strain gauges typically contain an electrically conductive alloy patterned in a serpentine shape to
increase sensitivity of the strain gauge while maintaining a small footprint. When strained, the
resistance of the metal foil shifts along with the geometry and can be measured to indicate strain.
Capacitive strain gauges rely on a highly compliant dielectric layer sandwiched between a pair of
sensing electrodes. When stretched, the sensing electrodes are brought closer to each other,
resulting in a measurable change in capacitance (Amjadi et al., 2016).
However, most of these sensors require power and interface circuitry, rendering
integration into meshes somewhat difficult especially when arrays of strain gauges are desired
(Amjadi et al., 2016). Further, the necessary electronics prevent easy customization of the mesh
size to match the patient’s specific wound geometry, a critical step to reducing hernia recurrence
rate (Ko, 2012).
4.2.3 Non-contact Measurement Methods
Optical techniques, such as digital image correlation and moire interferometry, can be used
to provide non-contact, full–field strain measurements (Kersey, 1996; Pankow, Justusson, & Waas,

49
2010). Full-field strain measurements using optical techniques has been well studied in the field
of mechanical engineering for studying material properties as well as monitoring stress
concentrations in safety critical systems. The optical method of measuring strain has an advantage
over using traditional strain gauges, particularly for biomedical applications, because it reduces
the need for complex circuitry implanted long-term in the body as well as achieves much higher
spatial resolution. Furthermore, the optical method allows the mesh size to be customized to fit
individual patient needs. However, this method depends on the ability to take a clear image of the
mesh surface and requires more complex image processing techniques. Although full-field strain
sensing techniques, such as digital image correlation, are now commonly used for material
characterization, these techniques have not been applied for monitoring strain in in vivo scenarios.
In this chapter, we developed and characterized a full-field strain sensor based on a
combination of the grid method and defocused particle image velocimetery for guiding surgical
procedures in vivo.
4.3 Theory on Optical Strain Measurements
4.3.1 In-plane Optical Strain Measurement Techniques: DIC vs Grid Method
The grid method is a non-contact, full-field measurement technique that can be used to
calculate displacement and in-plane strain in a hernia mesh with a periodic grid pattern (Badulescu,
Grédiac, & Mathias, 2009; Notbohm, Rosakis, Kumagai, Xia, & Ravichandran, 2013). The grid
method is chosen over other optical strain measurement techniques, such as digital image
correlation (DIC), because the analysis of the regular grid pattern yields less noisy data than that
produced by the speckle patterns for DIC (Badulescu et al., 2009; Notbohm et al., 2013).
Furthermore, direct computation of strain from the phase derivatives obviates the need for
numerical differentiation, which can further contribute to noise and unwanted phase jumping
(Badulescu et al., 2009; Notbohm et al., 2013).
To calculate displacement and in-plane strain using the grid method, the algorithm requires
two images: an unstrained reference image and the current image of interest (figure 34). The phase
difference between the reference image and the image of interest can be used to calculate the
displacement (equations 5 and 6). In-plane strain can then be calculated directly through
computation of the phase derivatives, without requiring numerical differentiation (equations 7 and
8).
𝑢 = −𝑝
2𝜋(𝜑𝑥,𝑐𝑢𝑟𝑟 − 𝜑𝑥,𝑟𝑒𝑓)
Equation 5. Displacement
𝜑𝑥 = 𝑎𝑟𝑐𝑡𝑎𝑛 (𝐼𝑚(𝐹𝑥)
𝑅𝑒(𝐹𝑥))
Equation 6. Phase

50
𝜀𝑥𝑥 =𝑑𝑢
𝑑𝑥= −
𝑝
2𝜋(
𝑑𝜑𝑥,𝑐𝑢𝑟𝑟
𝑑𝑥−
𝑑𝜑𝑥,𝑟𝑒𝑓
𝑑𝑥)
Equation 7. Strain
𝑑𝜑𝑥,
𝑑𝑥= 𝐼𝑚 (
𝑑𝐹𝑥/𝑑𝑥
𝐹𝑥)
Equation 8. Phase Shift
Figure 34 shows the outputs from each step of the algorithm when comparing a grid with
10% strain to the reference image. First, the phase difference is determined by conducting a Fourier
transform on both images. Then, the displacement and strain are calculated using equations 5-8
above. The result shows a gradient displacement across the grid surface along the axis of strain.
The jump in measured displacement (red to blue) is caused by phase wrapping for large
displacements but does not affect the final strain measurement.
Figure 34. Grid Method

51
To confirm accuracy of the technique, we printed grids of dots with a range of known
pitches and displacements as compared to a reference image. By applying the algorithm using the
equations above, we were able to accurately detect both the displacement and strain across the grid
surface in both the x- and y- directions (figure 35).
Figure 35. Validating the Grid Method Algorithm
4.3.2 Out-of-plane Detection Techniques: Stereoscopic vs PIV
In addition to in-plane strain measurements, out-of-plane deformation caused by wrinkling
of the hernia mesh must also be measured. Two stereo views of the mesh can be used to calculate
the out-of-plane displacement of the mesh. The stereo views can be acquired through a variety of
methods, including using multiple cameras, mirrors, or a diffraction grating (Notbohm et al., 2013;
Pankow et al., 2010; Xia, Gdoutou, & Ravichandran, 2012). However, this method requires grid
line matching between the two stereo images and may incorporate additional error if the images
are captured at an angle to the camera sensor. An alternative option involves using a technique
similar to defocused particle image velocimetry (DPIV) to determine the out-of-plane
displacement by looking at the degree of blurring of an object in the image plane. The DPIV
method has the benefit of only requiring one camera, which simplifies the system complexity, as
well as enables direct calculation of displacement based on the degree of blurring (Gharib &
Willert, 1992; Pereira & Gharib, 2002). A mask placed over the lens can shift two or more
apertures away from the centerline to create multiple images from each object, which can be used
to measure the out-of-plane displacement (Gharib & Willert, 1992; Pereira & Gharib, 2002) (figure
36).

52
Figure 36. Defocussed Imaging for Out-of-Plane Strain Measurements
Out-of-plane deformation is calculated using equation 9, which is derived from the thin
lens formula. Let M be the geometrical magnification, d the distance between the apertures, L the
distance from the aperture plane to the reference plane, and b the distance between the defocused
corners of the triangle (Gharib & Willert, 1992).
𝑍 =1
1𝐿
+ 𝐾𝑏, 𝑤ℎ𝑒𝑟𝑒 𝐾 =
1
𝑀𝑑𝐿
Equation 9. Z-axis Displacement
Once the out-of-plane displacement has been calculated, the x and y coordinates of each dot can
be corrected for using equations 10 and 11.
X =−𝑥𝑜𝑍(𝐿 − 𝑓)
𝑓𝐿
Equation 10. X-Axis Displacement Correction Factor
Y =−𝑦𝑜𝑍(𝐿 − 𝑓)
𝑓𝐿
Equation 11. Y-Axis Displacement Correction Factor
4.4 Overview of System Design
Figure 36 shows a schematic of the proposed system design. A camera with an aperture
mask is used to continuously image a hernia mesh prosthetic patterned with a grid of dots. The
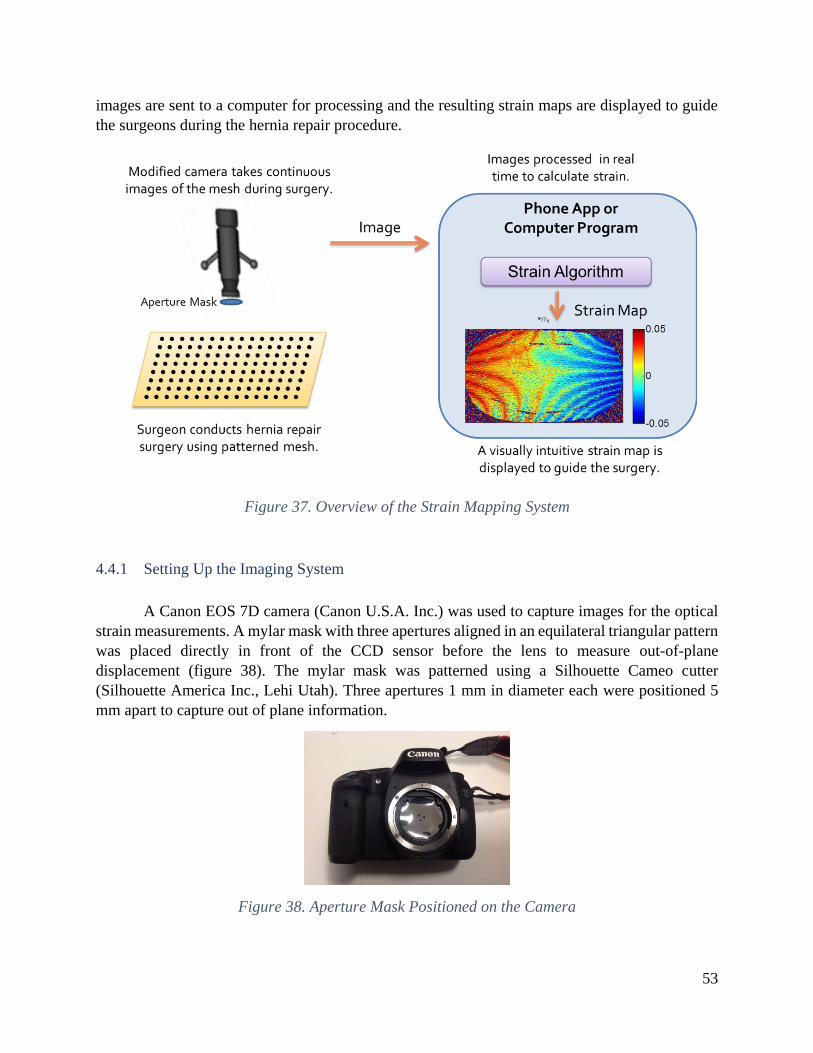
53
images are sent to a computer for processing and the resulting strain maps are displayed to guide
the surgeons during the hernia repair procedure.
Figure 37. Overview of the Strain Mapping System
4.4.1 Setting Up the Imaging System
A Canon EOS 7D camera (Canon U.S.A. Inc.) was used to capture images for the optical
strain measurements. A mylar mask with three apertures aligned in an equilateral triangular pattern
was placed directly in front of the CCD sensor before the lens to measure out-of-plane
displacement (figure 38). The mylar mask was patterned using a Silhouette Cameo cutter
(Silhouette America Inc., Lehi Utah). Three apertures 1 mm in diameter each were positioned 5
mm apart to capture out of plane information.
Figure 38. Aperture Mask Positioned on the Camera

54
4.4.2 Patterning Optical Markers onto Polypropylene Meshes
To minimize potential adverse risk to patients and facilitate the FDA approval process, our
goal is to make minimal modifications to the currently used surgical meshes. While the mesh
pattern itself can be used as a marker directly, colored markers provide greater contrast and thus
require less image processing to achieve accurate strain measurements. A grid of dots can be
patterned on the polypropylene mesh by aligning a laser-cut stencil with the native mesh fibers
and spray-painting a colored marker directly onto the mesh or marking with a colored Sharpie
(figure 39).
Figure 39. Patterned Lightweight Polypropylene Mesh
4.4.3 In-plane Strain Sensing
Tensile testing was conducted to assess the accuracy of the in-plane strain measurements
(figure 40). Patterned fabric or mesh samples were cut to approximately 1x2cm. The ends of the
fabric were embedded in a casting resin. The Bose Electroforce Mechanical System (Bose
Corporation, Eden Prairie, Minnesota) was used to accurately produce known displacements on
one end of the fabric. Applied strain is calculated by dividing the applied displacement by the
original unstrained length of the fabric.

55
Figure 40. Tensile Testing Setup
4.5 Characterization of the Optical Sensing Method
4.5.1 In-plane Strain Sensing
Tensile testing was conducted to assess the accuracy of the in-plane strain measurements
using a Bose electroforce mechanical system. A grid of 0.1 mm diameter dots spaced 1 mm apart
was spray painted onto a fabric polyester substrate using a laser cut stencil mask. Five images of
the grid were taken at each displacement and averaged to reduce the effect of noise using a Canon
EOS 7D camera (Canon U.S.A. Inc.). The grid method algorithm was used to process and analyze
the images to estimate displacement and strain. The algorithm is capable of detecting down to a
0.4% strain with less than 10% error (figure 41).
To determine the limit of detection of the system, six images of the unstrained fabric were
taken and compared to the reference image. Using equation 12, we determined that the system has
a limit of detection of 0.0095% strain, which is more than sufficient to detect the relevant strain
ranges as reported in literature (figure 37).
𝐿𝑂𝐷 = 𝜀𝑧𝑒𝑟𝑜 + 3𝑠𝑡𝑑 𝑑𝑒𝑣𝑧𝑒𝑟𝑜
Equation 12. Limit of Detection

56
Figure 41. In-Plane Strain Measurement
4.5.2 Out-of-plane Displacement Calibration
Out-of-plane displacement was characterized by manually displacing a 1 mm diameter dot
marker across a range of 0 to 50 cm away from the camera lens (figure 42). Images of the displaced
dot were taken using the Canon EOS 7D at a focal length of 35 mm and 50 mm. Using a focal
length of 35 and 50 mm, the reference plane was located 42 cm and 50 cm from the edge of the
camera lens respectively. A correction factor of 4.25*10-6 and 3.50*10-6 respectively was applied
to correct for the additional effects on the focal length of the other lenses in the camera. The strain
algorithm detects and measures the spread in the equilateral triangle pattern.
The profile of the measured and applied displacement is shown in figure 42. The measured
displacement matches closely with < 10% error for displacements between 20 and 35 cm. At low
displacements from the reference plane, it is more difficult for the algorithm to distinguish between
the overlapping points on the equilateral triangle accurately, whereas at high displacements, the
high spread between the triangle corners reduces the density of marker dots possible.
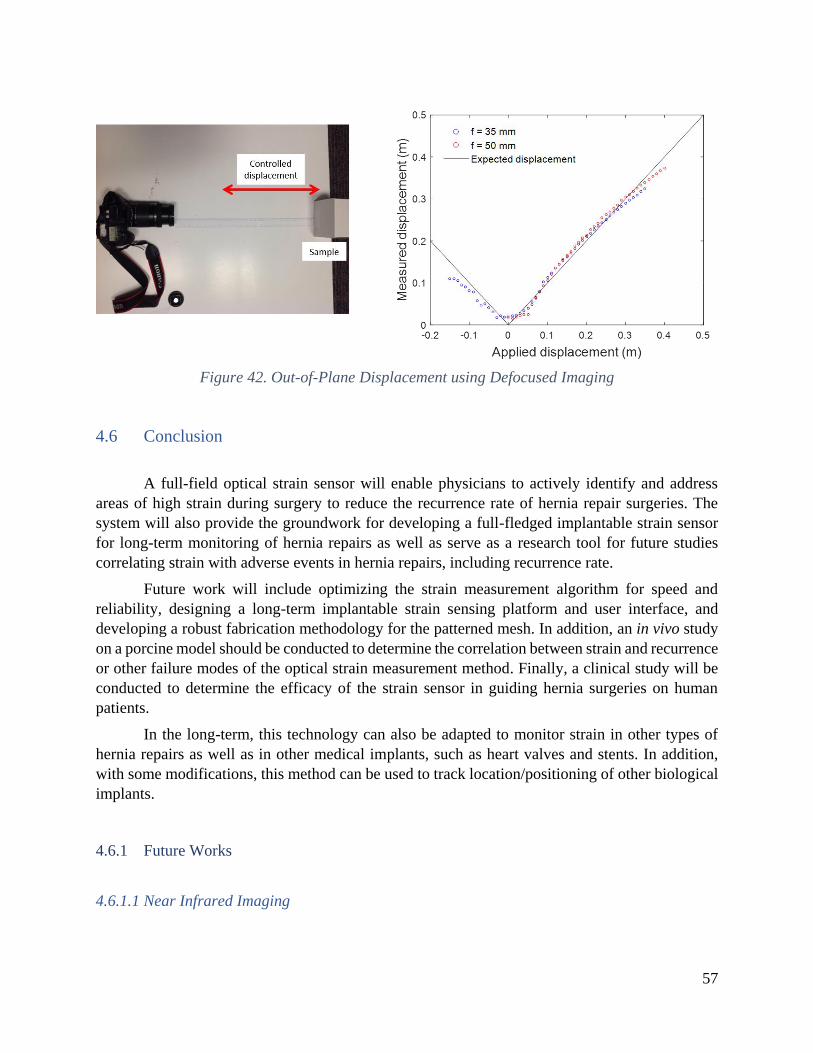
57
Figure 42. Out-of-Plane Displacement using Defocused Imaging
4.6 Conclusion
A full-field optical strain sensor will enable physicians to actively identify and address
areas of high strain during surgery to reduce the recurrence rate of hernia repair surgeries. The
system will also provide the groundwork for developing a full-fledged implantable strain sensor
for long-term monitoring of hernia repairs as well as serve as a research tool for future studies
correlating strain with adverse events in hernia repairs, including recurrence rate.
Future work will include optimizing the strain measurement algorithm for speed and
reliability, designing a long-term implantable strain sensing platform and user interface, and
developing a robust fabrication methodology for the patterned mesh. In addition, an in vivo study
on a porcine model should be conducted to determine the correlation between strain and recurrence
or other failure modes of the optical strain measurement method. Finally, a clinical study will be
conducted to determine the efficacy of the strain sensor in guiding hernia surgeries on human
patients.
In the long-term, this technology can also be adapted to monitor strain in other types of
hernia repairs as well as in other medical implants, such as heart valves and stents. In addition,
with some modifications, this method can be used to track location/positioning of other biological
implants.
4.6.1 Future Works
4.6.1.1 Near Infrared Imaging
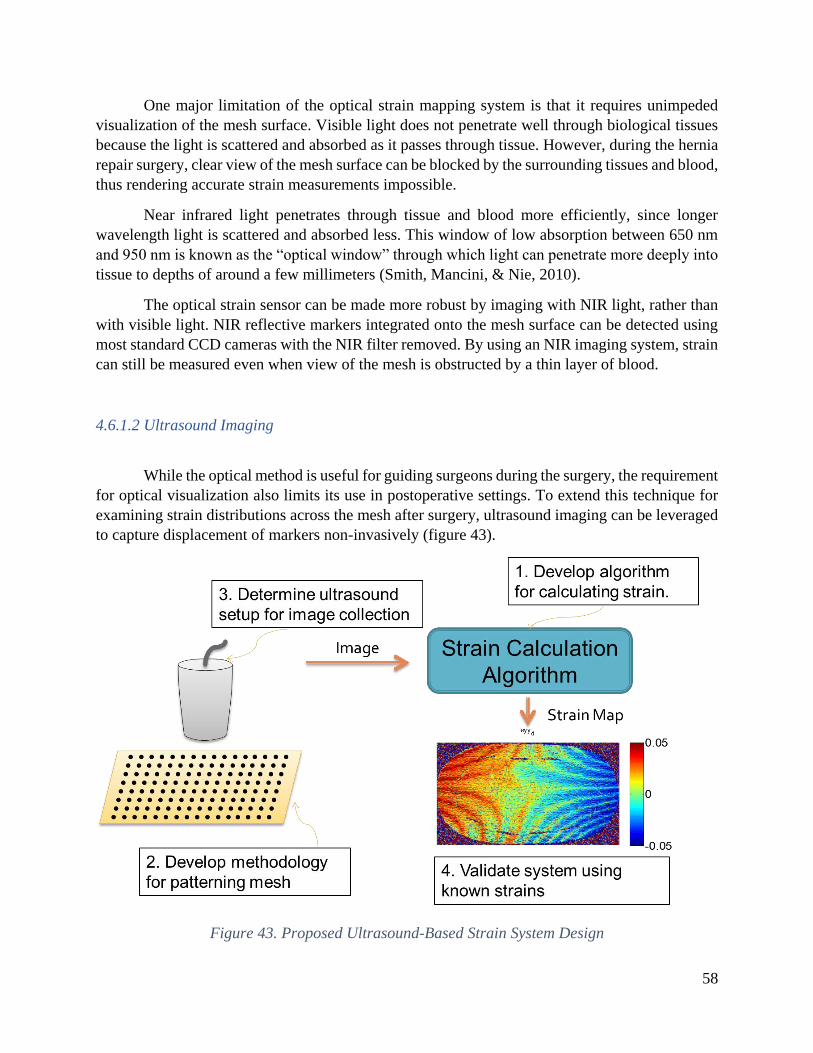
58
One major limitation of the optical strain mapping system is that it requires unimpeded
visualization of the mesh surface. Visible light does not penetrate well through biological tissues
because the light is scattered and absorbed as it passes through tissue. However, during the hernia
repair surgery, clear view of the mesh surface can be blocked by the surrounding tissues and blood,
thus rendering accurate strain measurements impossible.
Near infrared light penetrates through tissue and blood more efficiently, since longer
wavelength light is scattered and absorbed less. This window of low absorption between 650 nm
and 950 nm is known as the “optical window” through which light can penetrate more deeply into
tissue to depths of around a few millimeters (Smith, Mancini, & Nie, 2010).
The optical strain sensor can be made more robust by imaging with NIR light, rather than
with visible light. NIR reflective markers integrated onto the mesh surface can be detected using
most standard CCD cameras with the NIR filter removed. By using an NIR imaging system, strain
can still be measured even when view of the mesh is obstructed by a thin layer of blood.
4.6.1.2 Ultrasound Imaging
While the optical method is useful for guiding surgeons during the surgery, the requirement
for optical visualization also limits its use in postoperative settings. To extend this technique for
examining strain distributions across the mesh after surgery, ultrasound imaging can be leveraged
to capture displacement of markers non-invasively (figure 43).
Figure 43. Proposed Ultrasound-Based Strain System Design

59
Medical ultrasound is used for visualizing internal body structures for diagnostic purposes
or as a guide for surgical procedures (figure 44). Ultrasound images are generated by sending
pulses of high frequency sound waves (typically in the 1-18 MHz range) into the body and
measuring the reflected echoes using an ultrasound transducer. Ultrasound images capture a cross-
sectional view of the mesh surface, so extracting z-axis is straight-forward. However, to generate
a 2D image of the mesh surface, multiple ultrasound image slices need to be stitched together
through image analysis (figure 45). Alternatively, 2 sets of measurements can be taken in the x-
and y-axis to determine strain in the x- and y-directions respectively.
Figure 44. Ultrasound as a noninvasive measurement modality
Figure 45. Capturing 3D Info from a 2D Ultrasound Image
At areas of high acoustic impedance mismatch, a greater percentage of the ultrasound is
reflected. Acoustic reflectance can be calculated using equation 13. Table 6 shows the acoustic
impedance of several tissues and implantable materials (“Accoustic Properties for Metals in Solid
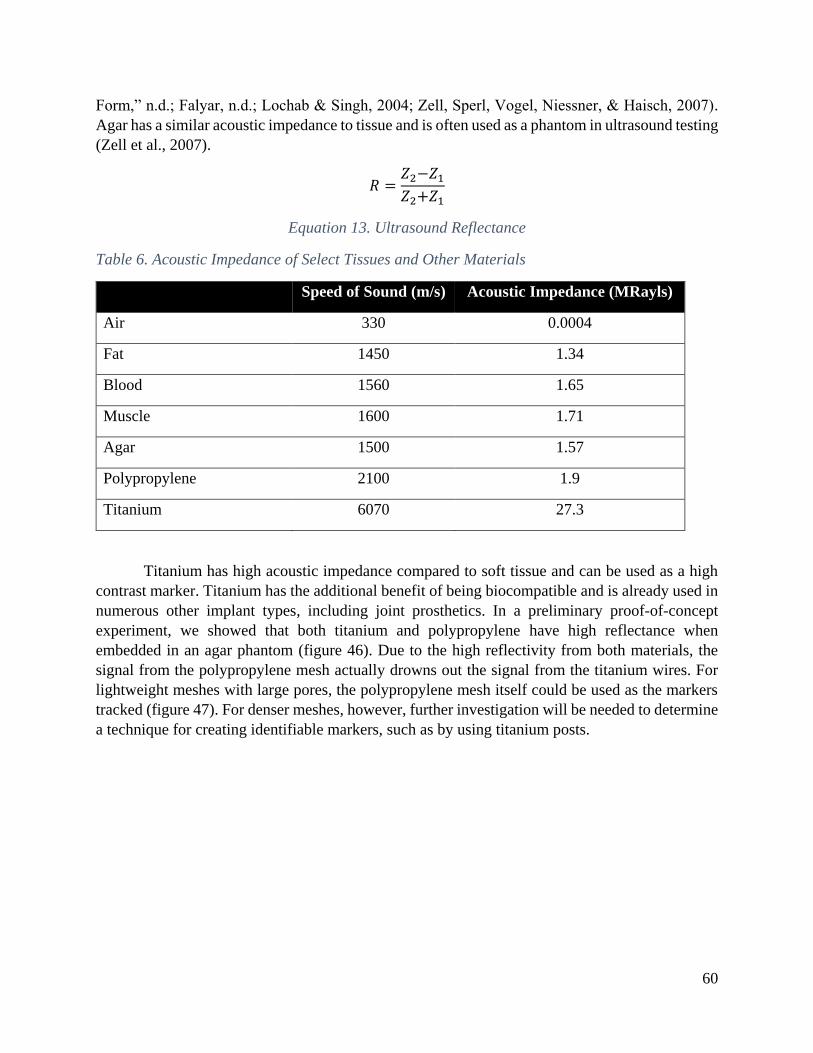
60
Form,” n.d.; Falyar, n.d.; Lochab & Singh, 2004; Zell, Sperl, Vogel, Niessner, & Haisch, 2007).
Agar has a similar acoustic impedance to tissue and is often used as a phantom in ultrasound testing
(Zell et al., 2007).
𝑅 =𝑍2−𝑍1
𝑍2+𝑍1
Equation 13. Ultrasound Reflectance
Table 6. Acoustic Impedance of Select Tissues and Other Materials
Speed of Sound (m/s) Acoustic Impedance (MRayls)
Air 330 0.0004
Fat 1450 1.34
Blood 1560 1.65
Muscle 1600 1.71
Agar 1500 1.57
Polypropylene 2100 1.9
Titanium 6070 27.3
Titanium has high acoustic impedance compared to soft tissue and can be used as a high
contrast marker. Titanium has the additional benefit of being biocompatible and is already used in
numerous other implant types, including joint prosthetics. In a preliminary proof-of-concept
experiment, we showed that both titanium and polypropylene have high reflectance when
embedded in an agar phantom (figure 46). Due to the high reflectivity from both materials, the
signal from the polypropylene mesh actually drowns out the signal from the titanium wires. For
lightweight meshes with large pores, the polypropylene mesh itself could be used as the markers
tracked (figure 47). For denser meshes, however, further investigation will be needed to determine
a technique for creating identifiable markers, such as by using titanium posts.

61
Figure 46. Ultrasound Image of Titanium Wire and Polypropylene Mesh
Figure 47. Mesh Pattern of a Lightweight Polypropylene Mesh
62
Chapter 5: A Magneto-elastic Strain Sensor for Non-Invasive
Monitoring of Hernia Prosthetics
This chapter is based in part on the work presented in:
1. A. Liao, H. W. Harris, and M. M. Maharbiz, “Integrating Coupled Magnetoelastic Sensors
onto a Flexible Hernia Mesh for High Dynamic Range Strain Measurements,” 39th Annu. Int.
Conf. IEEE Eng. Med. Biol. Soc. (EMBC), Seogwipo, pp. 1736–1739, 2017. (Amy Liao, Harris,
& Maharbiz, 2017)
2. A. Liao, H. W. Harris, and M. M. Maharbiz, “A Coupled Magnetoelastic Strain Sensor Array
for Guiding and Monitoring Hernia Repairs,” IEEE Transactions on Biomedical Engineering
(in review).
The optical strain sensing approach presented in chapter 3 provides valuable information
for guiding ventral hernia repairs by enabling surgeons to make real-time adjustments to relieve
possible stress concentrators. Postoperative monitoring of the hernia repair while patient is in
recovery is equally crucial to achieving a successful repair. The ability to non-invasively track
strain following the surgical repair would enable patients and physicians to monitor the status of
the mesh as well as enable further research into the causes of hernia recurrence.
While optical approaches are useful in guiding physicians during the surgical repair process,
these approaches require unobstructed visualization of the mesh surface, which limits its
usefulness for postoperative monitoring of the repair or when view of the mesh is obstructed, such
as by the physician’s hands or other bodily tissues or fluids (e.g. blood). The optical approach
presented in chapter 3 can be adapted for use with alternative imaging modalities that have higher
tissue penetration properties, such as NIR, ultrasound, and x-ray. However, these imaging
modalities either suffer from insufficient penetration depth (e.g. NIR) or high cost and complexity
of equipment (eg. ultrasound, x-ray). Furthermore, while ultrasound technology can potentially be
miniaturized into a form factor suitable for a wearable device, ultrasound imaging requires acoustic
matching between the ultrasonic transducer and the tissue interface using an ultrasound gel, which
is not conducive for integration into a wearable device.
In this chapter, we present an alternative approach to strain monitoring, based on a coupled
magneto-elastic sensor, that is particularly suited to non-invasive postoperative monitoring.
5.1 Magneto-elastic Sensors for Measuring Biological Parameters
Recently, magneto-elastic resonant sensors have been developed for wireless detection of
a wide range of physical parameters, including pH, mass loading, and fluid viscosity (Green &
Gianchandani, 2015; C. a. Grimes et al., 2002; C. A. Grimes, Roy, Rani, & Cai, 2011; Hristoforou
& Ktena, 2007). Magneto-elastic materials are governed by the Villari effect, also known as the
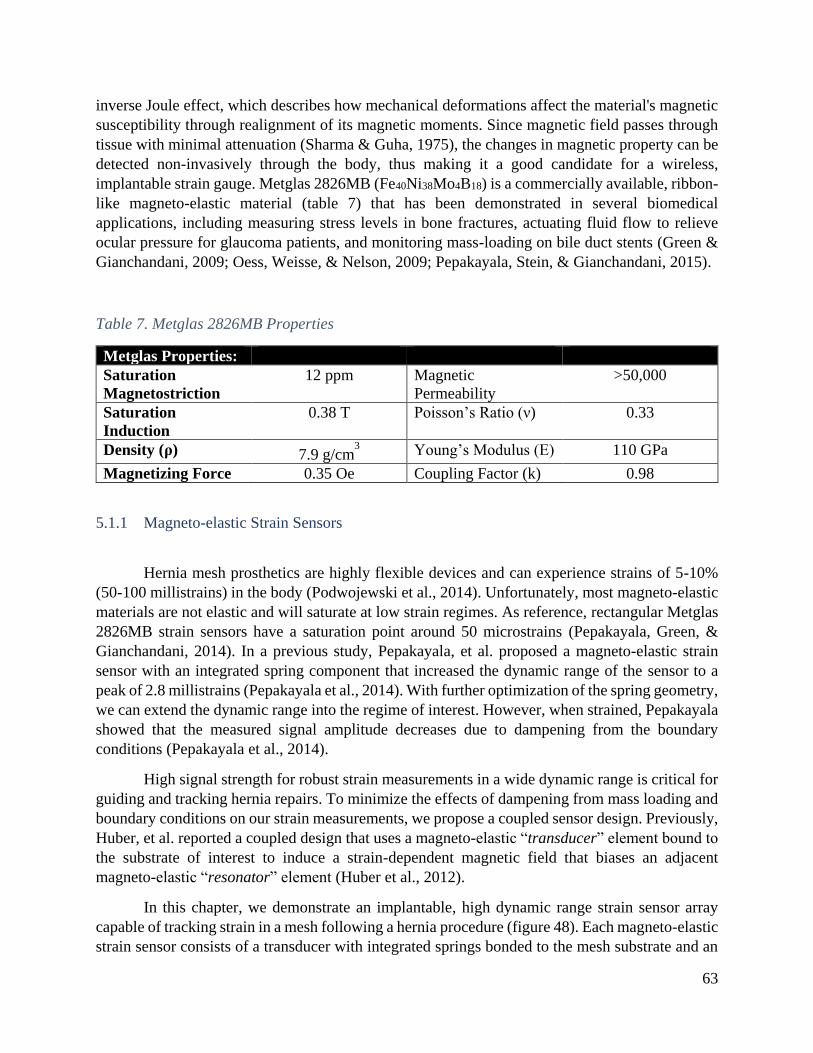
63
inverse Joule effect, which describes how mechanical deformations affect the material's magnetic
susceptibility through realignment of its magnetic moments. Since magnetic field passes through
tissue with minimal attenuation (Sharma & Guha, 1975), the changes in magnetic property can be
detected non-invasively through the body, thus making it a good candidate for a wireless,
implantable strain gauge. Metglas 2826MB (Fe40Ni38Mo4B18) is a commercially available, ribbon-
like magneto-elastic material (table 7) that has been demonstrated in several biomedical
applications, including measuring stress levels in bone fractures, actuating fluid flow to relieve
ocular pressure for glaucoma patients, and monitoring mass-loading on bile duct stents (Green &
Gianchandani, 2009; Oess, Weisse, & Nelson, 2009; Pepakayala, Stein, & Gianchandani, 2015).
Table 7. Metglas 2826MB Properties
Metglas Properties:
Saturation
Magnetostriction 12 ppm Magnetic
Permeability >50,000
Saturation
Induction 0.38 T Poisson’s Ratio (ν) 0.33
Density (ρ) 7.9 g/cm3 Young’s Modulus (E) 110 GPa
Magnetizing Force 0.35 Oe Coupling Factor (k) 0.98
5.1.1 Magneto-elastic Strain Sensors
Hernia mesh prosthetics are highly flexible devices and can experience strains of 5-10%
(50-100 millistrains) in the body (Podwojewski et al., 2014). Unfortunately, most magneto-elastic
materials are not elastic and will saturate at low strain regimes. As reference, rectangular Metglas
2826MB strain sensors have a saturation point around 50 microstrains (Pepakayala, Green, &
Gianchandani, 2014). In a previous study, Pepakayala, et al. proposed a magneto-elastic strain
sensor with an integrated spring component that increased the dynamic range of the sensor to a
peak of 2.8 millistrains (Pepakayala et al., 2014). With further optimization of the spring geometry,
we can extend the dynamic range into the regime of interest. However, when strained, Pepakayala
showed that the measured signal amplitude decreases due to dampening from the boundary
conditions (Pepakayala et al., 2014).
High signal strength for robust strain measurements in a wide dynamic range is critical for
guiding and tracking hernia repairs. To minimize the effects of dampening from mass loading and
boundary conditions on our strain measurements, we propose a coupled sensor design. Previously,
Huber, et al. reported a coupled design that uses a magneto-elastic “transducer” element bound to
the substrate of interest to induce a strain-dependent magnetic field that biases an adjacent
magneto-elastic “resonator” element (Huber et al., 2012).
In this chapter, we demonstrate an implantable, high dynamic range strain sensor array
capable of tracking strain in a mesh following a hernia procedure (figure 48). Each magneto-elastic
strain sensor consists of a transducer with integrated springs bonded to the mesh substrate and an

64
encased resonator for reliable signal detection. A permanent magnet provides a DC magnetic field
to shift the operating range of the sensor to the highest sensitivity regime (figure 49). The strain
imposed on the sensor is correlated with the magnetic permeability of the transducer, which affects
the share of magnetic flux between the resonator and transducer elements. Thus, the transducer
acts like an additional DC bias to shift the resonance frequency of the resonator. Springs are
incorporated onto the transducer to attenuate the strain on the transducer body and extend the
dynamic range of the sensor. The resonator element is encased in a rigid casing to minimize mass
damping from the surrounding tissue and maintain high SNR. Strain maps can be produced by
measuring an array of coupled strain sensors with varying length resonators to provide insight on
the status of the mesh implant.
Figure 48. Overview of an Implanted Magnetoelastic Sensor Array
5.2 Design of Magneto-elastic Resonant Sensors
5.2.1 A DC Biasing Field is Required for High Signal Amplitude
The magnetostriction curve shows the expected mechanical deformation as a function of
the biasing field. Although the magnetostriction curve is non-linear, at small signal amplitudes,
the signal response can be linearized as follows (equation 14):

65
𝐵 =𝜕𝐵
𝜕𝜎|𝐻𝜎 +
𝜕𝐵
𝜕𝐻|𝜎𝐻
Equation 14. Linearized Small Signal Response of Magnetoelastic Materials
where B is the magnetic flux density, H is the magnetic field intensity (at small signals), and σ is
the stress. The partial derivative 𝜕𝐵
𝜕𝐻|𝜎 corresponds to the magnetic permeability of the material at
constant stress. 𝜕𝐵
𝜕𝜎|𝐻 represents the magnetostrictive coefficicent (d), which describes the
sensitivity of the magnetostrictive response to applied stress (Pepakayala et al., 2015).
To achieve high signal amplitudes, a DC biasing field is required to shift the operating
point into the high slope regime of the magnetostriction curve, where sensitivity to the magneto-
elastic effect is the strongest. This regime provides the strongest coupling between the magnetic
and mechanical properties of the material, thus resulting in the greatest amplitude in the resonance
response when a small AC magnetic field is applied. The DC biasing field can be produced by
either using an additional set of biasing coils or by integrating permanent magnets (e.g. Arnokrome
5) placed adjacent to the resonator. Smaller sensors require a larger optimal biasing field due to
greater demagnetization effects (Chen, Pardo, & Sanchez, 2005).
When stress is applied to the strain sensor, the magnetic dipoles within the traducer element
realign, resulting in a shift in the magnetic permeability of the transducer (figure 49) and a stress-
dependent change in the distribution of magnetic flux between the transducer and resonator
elements.
Figure 49. Magnetostriction Curve

66
5.2.2 Magneto-elastic Resonant Sensors: The ΔE Effect
Because the mechanical and magnetic properties of magneto-elastic materials are coupled,
strain induced on a magneto-elastic strain sensor can be deduced by directly measuring the
magnetic permeability of the material (C. A. Grimes et al., 2011; Karl, Powell, Watts, Gibbs, &
Whitehouse, 2000; Kouzoudis & Mouzakis, 2006). However, this method tends to be more prone
to interference from stray magnetic fields in the environment and is more sensitive to the relative
positioning between the sensor and detection coils, making it difficult for use in vivo, where
positioning is imprecise.
Alternatively, strain is also correlated to the resonance frequency of the sensors through
the “ΔE effect”, which describes the dependence of the Young’s Modulus on the magnetic field
and the strain (C. a. Grimes et al., 2002; C. A. Grimes et al., 2011). During operation, when excited
with an external AC magnetic field, the individual strain sensors on the array will mechanically
vibrate at a certain resonance frequency, which is dependent on the material properties and the
sensor geometry (Eq. 2). The resonance frequency for a sensor of rectangular geometry is (equation
15):
𝑓0 =1
2𝐿√
𝐸
𝜌(1 − 𝜐2)
Equation 15. Resonance Frequency
where L is the sensor length, E is the Young’s modulus, ρ is the material density, and υ is the
Poisson’s ratio. The AC magnetic flux induced by the mechanical vibrations can be detected using
an external pickup coil placed outside the body.
The “ΔE effect” (equation 16) states that the total strain on the sensor at a given biasing
field will be a combination of the elastic strain and the magnetization-induced strain, which affects
the Young’s modulus and hence the sensor’s resonance frequency (fo). The Young’s modulus is
defined as:
𝐸|𝐵0=
𝜎
𝜀𝑒𝑙𝑎𝑠𝑡𝑖𝑐 + 𝜀𝑚𝑎𝑔𝑛𝑒𝑡𝑖𝑐
Equation 16. The “ΔE Effect”
where E is the Young’s modulus at a given magnetic field, σ is the stress, and ε is the strain of a
magneto-elastic material. When the resonator is biased by the DC biasing field and the transducer
element, the change in 𝜀𝑚𝑎𝑔𝑛𝑒𝑡𝑖𝑐 of the resonator results in a change in the Young’s modulus and
the resonant frequency.
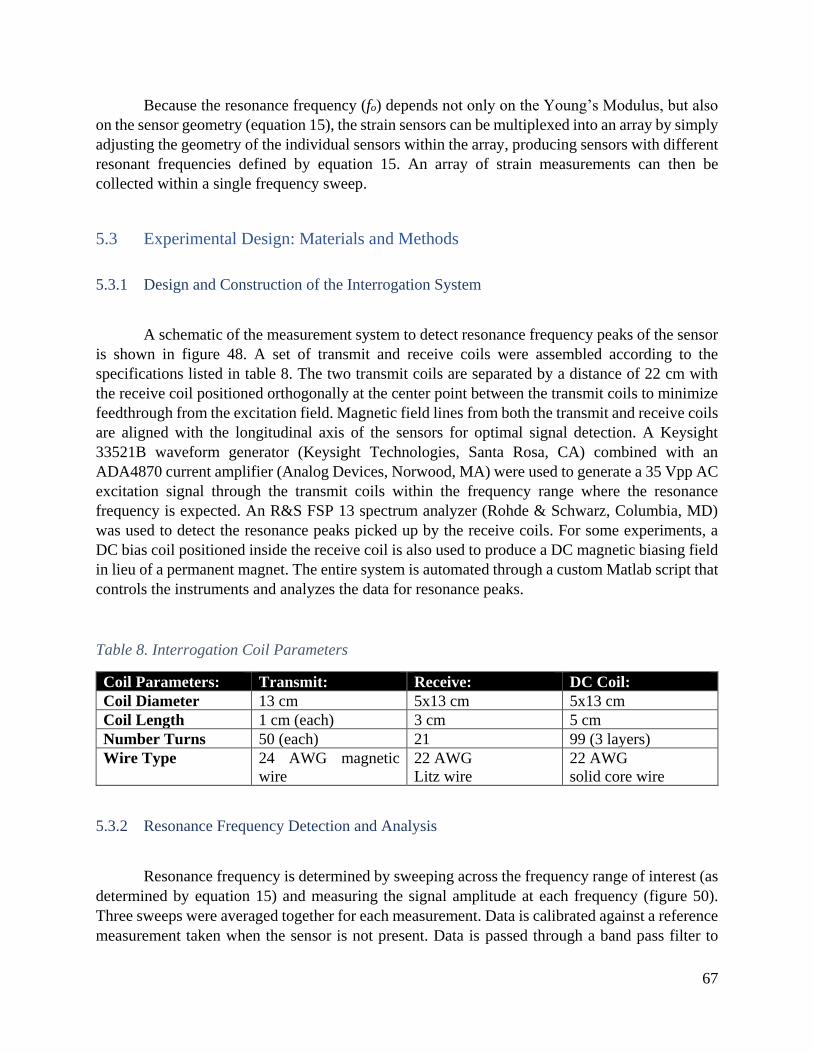
67
Because the resonance frequency (fo) depends not only on the Young’s Modulus, but also
on the sensor geometry (equation 15), the strain sensors can be multiplexed into an array by simply
adjusting the geometry of the individual sensors within the array, producing sensors with different
resonant frequencies defined by equation 15. An array of strain measurements can then be
collected within a single frequency sweep.
5.3 Experimental Design: Materials and Methods
5.3.1 Design and Construction of the Interrogation System
A schematic of the measurement system to detect resonance frequency peaks of the sensor
is shown in figure 48. A set of transmit and receive coils were assembled according to the
specifications listed in table 8. The two transmit coils are separated by a distance of 22 cm with
the receive coil positioned orthogonally at the center point between the transmit coils to minimize
feedthrough from the excitation field. Magnetic field lines from both the transmit and receive coils
are aligned with the longitudinal axis of the sensors for optimal signal detection. A Keysight
33521B waveform generator (Keysight Technologies, Santa Rosa, CA) combined with an
ADA4870 current amplifier (Analog Devices, Norwood, MA) were used to generate a 35 Vpp AC
excitation signal through the transmit coils within the frequency range where the resonance
frequency is expected. An R&S FSP 13 spectrum analyzer (Rohde & Schwarz, Columbia, MD)
was used to detect the resonance peaks picked up by the receive coils. For some experiments, a
DC bias coil positioned inside the receive coil is also used to produce a DC magnetic biasing field
in lieu of a permanent magnet. The entire system is automated through a custom Matlab script that
controls the instruments and analyzes the data for resonance peaks.
Table 8. Interrogation Coil Parameters
Coil Parameters: Transmit: Receive: DC Coil: Coil Diameter 13 cm 5x13 cm 5x13 cm Coil Length 1 cm (each) 3 cm 5 cm Number Turns 50 (each) 21 99 (3 layers) Wire Type 24 AWG magnetic
wire 22 AWG Litz wire
22 AWG solid core wire
5.3.2 Resonance Frequency Detection and Analysis
Resonance frequency is determined by sweeping across the frequency range of interest (as
determined by equation 15) and measuring the signal amplitude at each frequency (figure 50).
Three sweeps were averaged together for each measurement. Data is calibrated against a reference
measurement taken when the sensor is not present. Data is passed through a band pass filter to

68
reduce effects of drift and noise. The resonance frequency is identified as the maximum point of
the frequency sweep measurement. SNR is defined as the signal amplitude of the resonance peak
over the mean amplitude of the reference measurement. SNR greater than 5 is desirable for robust
resonance frequency detection. Resonance frequency is normalized to the resonance frequency at
zero strain (𝑓−𝑓𝑜
𝑓𝑜).
Figure 50. Representative Resonance Peak
5.3.3 Fabrication of the Resonator and Transducer Elements
Metglas 2826MB (Metglas Inc., Conway, SC) is chosen as the magneto-elastic material
because it is readily available in ribbon-form, is easily patternable using large-scale batch
processing, and has a high magnetostriction coefficient (12 ppm) (Metglas, 2011) (table 7). The
magneto-elastic resonator and transducer elements were patterned using photochemical machining
(PCM) by Northwest Etch Technology (Tacoma, WA). Briefly, this process involves patterning a
photoresist onto the Metglas substrate using photolithography, chemically etching the exposed
Metglas material, and finally stripping away the photoresist. PCM is suitable for high-throughput
processing at a wafer scale and can achieve high resolution patterns with features as small as 127
μm. For this paper, four transducer designs were evaluated (figure 51). All transducer designs
consist of a 5-7 mm x 2 mm rectangular “body” with variable spring components on either side
for tuning the dynamic range of the sensor (table 9). The resonator elements varied in length from
4.8 mm – 7.0 mm long, with anchor points located in the center to assist with positioning the
resonators with minimal impact to the mechanical vibrations in the longitudinal direction.

69
Table 9. Sensor Parameters
Resonator: (Metglas 2s826MB)
Transducer: (Metglas 2826MB)
Bias Magnet: (Arnokrome 5)
Length 4 -7 mm 5-7 mm (body) 9 mm
Width 1 mm 2 mm 3 mm
Thickness 28 μm 28 μm 250 μm*
Figure 51. Transducer and Resonator Designs
5.3.4 Assembly of the Coupled Strain Sensor
To maximize utility to surgeons, we designed a strain sensor that can be integrated with
existing hernia mesh prosthetics. Currently, polypropylene-based meshes are the most widely used
type of mesh, with over one million implants used each year (Brown & Finch, 2010; Burger et al.,
2006). Polypropylene prosthetics are woven or knitted into a flexible, mesh-like pattern with a
highly porous structure to encourage mesh integration with tissue and reduce adhesion formation.
Polypropylene material is ideal due to its low cost, biocompatibility, and high tensile strength.
Here, we demonstrate two methods for assembling the coupled strain sensor and integrating it with
a variety of polypropylene meshes. The first approach uses hot embossing to pattern a rigid casing
for the permanent magnet and resonator elements (figure 52). The second approach uses thermal

70
bonding to seal various layers of polypropylene together to form the casing (figure 53). The
fabrication protocol is described in more detail in the following sections.
5.3.4.1 Assembly Process based on Hot Embossing
The Metglas 2826MB resonator and Arnokrome 5 were cut into 7x1 mm and 9x3 mm
ribbons respectively using a DAD3240 Disco automatic dicing saw (Disco Corporation, Tokyo,
Japan). To form a semi-rigid casing around the resonator to permit undampened oscillations, a
polypropylene casing was fabricated by hot embossing a 1/32’’ sheet of polypropylene with a
laser-etched acrylic mold at 50oC and 13 MPa for 10 minutes. For commercial fabrication, a
metallic mold can be machined to increase the embossing temperature for faster, more robust
processing. The patterned Metglas 2826MB transducer and permanent magnet is positioned inside
the polypropylene casing and sealed with 50 µm heat-sealable, bi-axial polypropylene (BOPP)
film (Impex Global, LLC, Houston, TX) by applying 10 kPa pressure at 150oC for 10 seconds
across the casing surface. Low pressure and short seal times are necessary to prevent deformation
of the polypropylene casing. Once sealed, the encased resonator is aligned with the transducer and
attached at the center point. Due to the semi-rigid nature of the resonator casing, it is critical that
the resonator is attached only at the center point to enable the underlying mesh to flex freely. Full
attachment to the transducer would not only restrict movement of the underlying mesh and
transducer, thus preventing strain measurements, but also create additional stress concentrators
within the mesh. The entire stack is parylene coated with 6 µm conformal coating of parylene C
using the SCS Labcoter 2 (Specialty Coating Systems, Indianapolis, Indiana). The parylene coating
serves to a) provide additional mechanical support for the attachment of the resonator casing to
the transducer, and b) encapsulate the Metglas sensor in a biocompatible, inert material. Finally,
the anchor points of the transducer are attached to lightweight polypropylene mesh (BARD Soft
Mesh, Davol Inc., Warwick, RI) with cyanoacrylate glue.
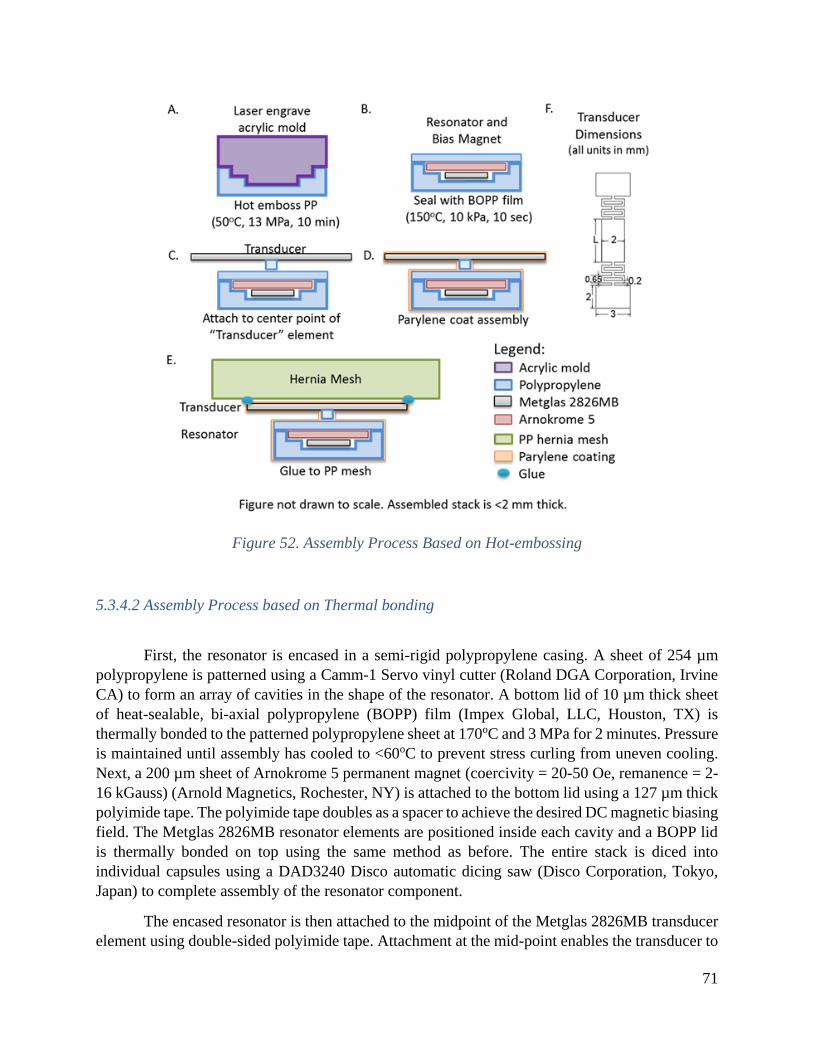
71
Figure 52. Assembly Process Based on Hot-embossing
5.3.4.2 Assembly Process based on Thermal bonding
First, the resonator is encased in a semi-rigid polypropylene casing. A sheet of 254 µm
polypropylene is patterned using a Camm-1 Servo vinyl cutter (Roland DGA Corporation, Irvine
CA) to form an array of cavities in the shape of the resonator. A bottom lid of 10 µm thick sheet
of heat-sealable, bi-axial polypropylene (BOPP) film (Impex Global, LLC, Houston, TX) is
thermally bonded to the patterned polypropylene sheet at 170oC and 3 MPa for 2 minutes. Pressure
is maintained until assembly has cooled to <60oC to prevent stress curling from uneven cooling.
Next, a 200 µm sheet of Arnokrome 5 permanent magnet (coercivity = 20-50 Oe, remanence = 2-
16 kGauss) (Arnold Magnetics, Rochester, NY) is attached to the bottom lid using a 127 µm thick
polyimide tape. The polyimide tape doubles as a spacer to achieve the desired DC magnetic biasing
field. The Metglas 2826MB resonator elements are positioned inside each cavity and a BOPP lid
is thermally bonded on top using the same method as before. The entire stack is diced into
individual capsules using a DAD3240 Disco automatic dicing saw (Disco Corporation, Tokyo,
Japan) to complete assembly of the resonator component.
The encased resonator is then attached to the midpoint of the Metglas 2826MB transducer
element using double-sided polyimide tape. Attachment at the mid-point enables the transducer to

72
be freely strained along with the mesh substrate. The completed sensor is coated in 10 μm of
parylene-C to ensure biocompatibility and improve the mechanical stability of the assembled
sensors. Finally, the anchor points on the transducer element are bonded to a polypropylene mesh
overnight at room temperature using FDA Bond-2 epoxy (Epoxy International, Ft. Lauderdale,
FL), a biocompatible epoxy.
Figure 53. Assembly Process Based on Thermal Bonding

73
5.3.4.3 Comparison of the two assembly approaches
The hot embossing method is more suitable for rapid prototyping of different casing
structures, while the thermal bonding method is more compatible with traditional large-scale
manufacturing methods. Further comparisons are summarized in table 10.
Table 10. Comparison of Assembly Approaches for Encasing the Resonator
` Hot Embossing Thermal Bonding
Assembly Time ~10 minutes for hot
embossing step.
~2 minutes for thermal
bonding step (Can be sealed in
as little as 10 seconds with
optimization).
Assembly Scale Limited to size of hot
embosser stage. Our setup
enables assembly of ~5
devices per run.
Can be adapted for large scale
manufacturing with roll-to-
roll processing. Our current
setup enables assembly of ~50
per run.
Casing Structure At 10 minutes, the hot-
embossed edges are still
slightly rounded. Longer hot
emboss times are needed to
get well-defined features.
Casing boundaries are well
defined. If thermal bonding
pressure or temperature is too
high however, bowing or
melting of the polypropylene
may be observed.
5.3.5 Strain Measurement Setup
Strain measurements were collected using a Velmex 2-axis stepper motor (Velmex, Inc,
Bloomfield, NY) to generate known displacements in the strain sensors. 1.5 cm wide aluminum
paper grips were machined by the Marvel Nanofabrication Laboratory Machine Shop (UC
Berkeley, CA). Aluminum has a similar magnetic permeability to air, which is beneficial for
minimizing impact on the magnetic fields around the sensor.
To measure strain across a sensor array, a test jig was constructed to induce strain along
the y-axis for each row of sensor elements independently. Anchor points for the arrayed sensors
were attached to wooden guide struts that were used to generate strain across the mesh.
Measurements were taken by sweeping the interrogation coil over each row of the array, such that
all data was collected with the sensors positioned over the receive coils (aligned along the coil’s
x-axis). Each row of sensors was measured by a single frequency sweep, with the resonance peak
differentiated by varying the resonator length.

74
5.4 System Characterization
5.4.1 In vivo Interrogation Challenges
There are several challenges when implanting magneto-elastic strain sensors within the
body. To start, there is an inherent tradeoff between signal amplitude and resonator size for an
implanted sensor. A smaller sensor size is beneficial for achieving higher resolution strain maps
by enabling higher density sensor arrays. In addition, smaller implants induce less foreign body
reaction and adhesion formation (unwanted scar tissue), which would hinder patient recovery post-
surgery. However, signal amplitude of the resonant peaks drops off rapidly with decreasing
resonator size, thus limiting the minimum size achievable. Figure 54 depicts the tradeoff between
resonance frequency and signal amplitude versus resonator size for rectangular Metglas 2826MB
sensors. Resonators smaller than 3x1 mm in size were no longer detectable using our interrogator
system.
Figure 54. Tradeoff Between Resonator Size and Signal Amplitude
To measure strain non-invasively, interrogation coils are placed outside the body to detect
the output response of the sensors. However, magnetic field strength is strongly dependent on
alignment of the sensors with the interrogation coil (figure 55). Strongest SNR is achieved when
the sensors are placed within the bounds of the receive coil and aligned with the longitudinal axis
of the sensor parallel to the y-axis. Along the x-axis, SNR drops off linearly but remains detectable
(SNR>5) with at least 8 cm offset from the center point, corresponding to just outside the edge of
the receive coil (SNR = 11.3 at 8 cm offset). Along the y-axis, resonance frequency measurements
are also most robust within the bounds of the receive coil. There is a discontinuity in SNR around
1-2 cm offset, which corresponds to the edge of the receive coil. Magnetic field strength also drops
off with the cube of the distance from the interrogation coils (z-axis) and the resonance frequency
is only detectable (SNR>5) within 4.5 cm from the surface of the interrogation coils (SNR = 6.0
at 4.5 cm offset). Thus, for larger patients, where the interrogation coil must be placed further away
due to thicker layers of fat covering the sensor, low signal amplitude may become a problem.
Based on average abdominal muscle and fat thicknesses, we estimate that a measurement distance
of 4 cm is required to accommodate ~95% of hernia repair patients (assuming a Gaussian
distribution) (Kim, Lim, Lee, & Kim, 2012). SNR is also sensitive to rotational misalignment of
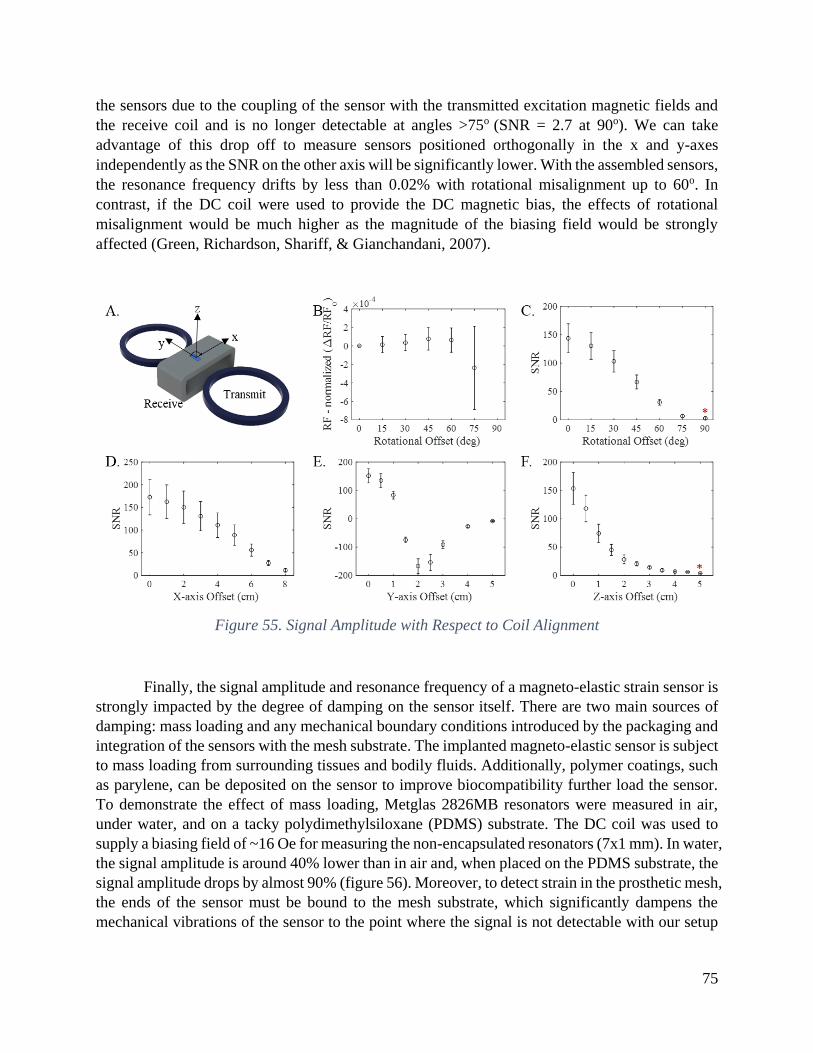
75
the sensors due to the coupling of the sensor with the transmitted excitation magnetic fields and
the receive coil and is no longer detectable at angles >75o (SNR = 2.7 at 90o). We can take
advantage of this drop off to measure sensors positioned orthogonally in the x and y-axes
independently as the SNR on the other axis will be significantly lower. With the assembled sensors,
the resonance frequency drifts by less than 0.02% with rotational misalignment up to 60o. In
contrast, if the DC coil were used to provide the DC magnetic bias, the effects of rotational
misalignment would be much higher as the magnitude of the biasing field would be strongly
affected (Green, Richardson, Shariff, & Gianchandani, 2007).
Figure 55. Signal Amplitude with Respect to Coil Alignment
Finally, the signal amplitude and resonance frequency of a magneto-elastic strain sensor is
strongly impacted by the degree of damping on the sensor itself. There are two main sources of
damping: mass loading and any mechanical boundary conditions introduced by the packaging and
integration of the sensors with the mesh substrate. The implanted magneto-elastic sensor is subject
to mass loading from surrounding tissues and bodily fluids. Additionally, polymer coatings, such
as parylene, can be deposited on the sensor to improve biocompatibility further load the sensor.
To demonstrate the effect of mass loading, Metglas 2826MB resonators were measured in air,
under water, and on a tacky polydimethylsiloxane (PDMS) substrate. The DC coil was used to
supply a biasing field of ~16 Oe for measuring the non-encapsulated resonators (7x1 mm). In water,
the signal amplitude is around 40% lower than in air and, when placed on the PDMS substrate, the
signal amplitude drops by almost 90% (figure 56). Moreover, to detect strain in the prosthetic mesh,
the ends of the sensor must be bound to the mesh substrate, which significantly dampens the
mechanical vibrations of the sensor to the point where the signal is not detectable with our setup
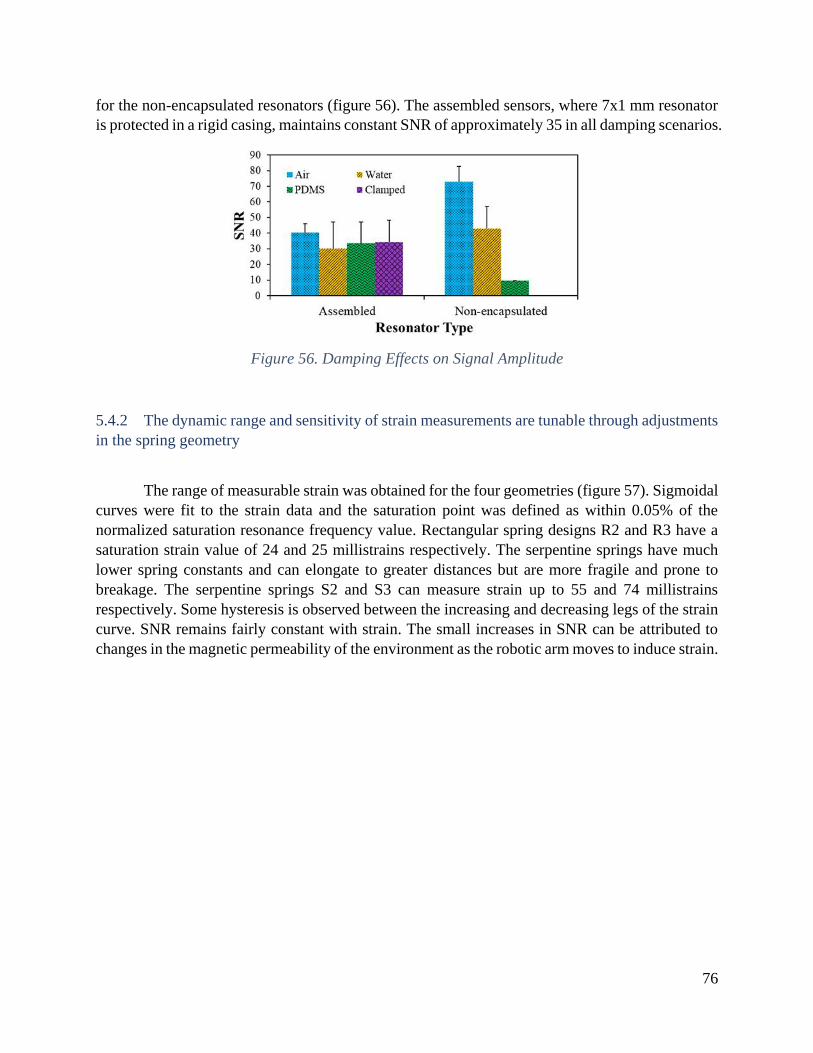
76
for the non-encapsulated resonators (figure 56). The assembled sensors, where 7x1 mm resonator
is protected in a rigid casing, maintains constant SNR of approximately 35 in all damping scenarios.
Figure 56. Damping Effects on Signal Amplitude
5.4.2 The dynamic range and sensitivity of strain measurements are tunable through adjustments
in the spring geometry
The range of measurable strain was obtained for the four geometries (figure 57). Sigmoidal
curves were fit to the strain data and the saturation point was defined as within 0.05% of the
normalized saturation resonance frequency value. Rectangular spring designs R2 and R3 have a
saturation strain value of 24 and 25 millistrains respectively. The serpentine springs have much
lower spring constants and can elongate to greater distances but are more fragile and prone to
breakage. The serpentine springs S2 and S3 can measure strain up to 55 and 74 millistrains
respectively. Some hysteresis is observed between the increasing and decreasing legs of the strain
curve. SNR remains fairly constant with strain. The small increases in SNR can be attributed to
changes in the magnetic permeability of the environment as the robotic arm moves to induce strain.

77
Figure 57. Resonance Frequency and SNR vs Strain
5.4.3 Sensors are Stable Over Hundreds of Strain Cycles
Figure 58 shows the changes in resonance frequency as an assembled S3 sensor is cycled
between 0 and 85 millistrains. Over the course of 1000 measurements, the resonance frequency
remained within 0.02% and 0.13% of the original resonance frequency measurements for the low
and high strain states respectively. The primary failure mode for these sensors is breakage or plastic
deformation at the spring joint when over-extended past the operational range.
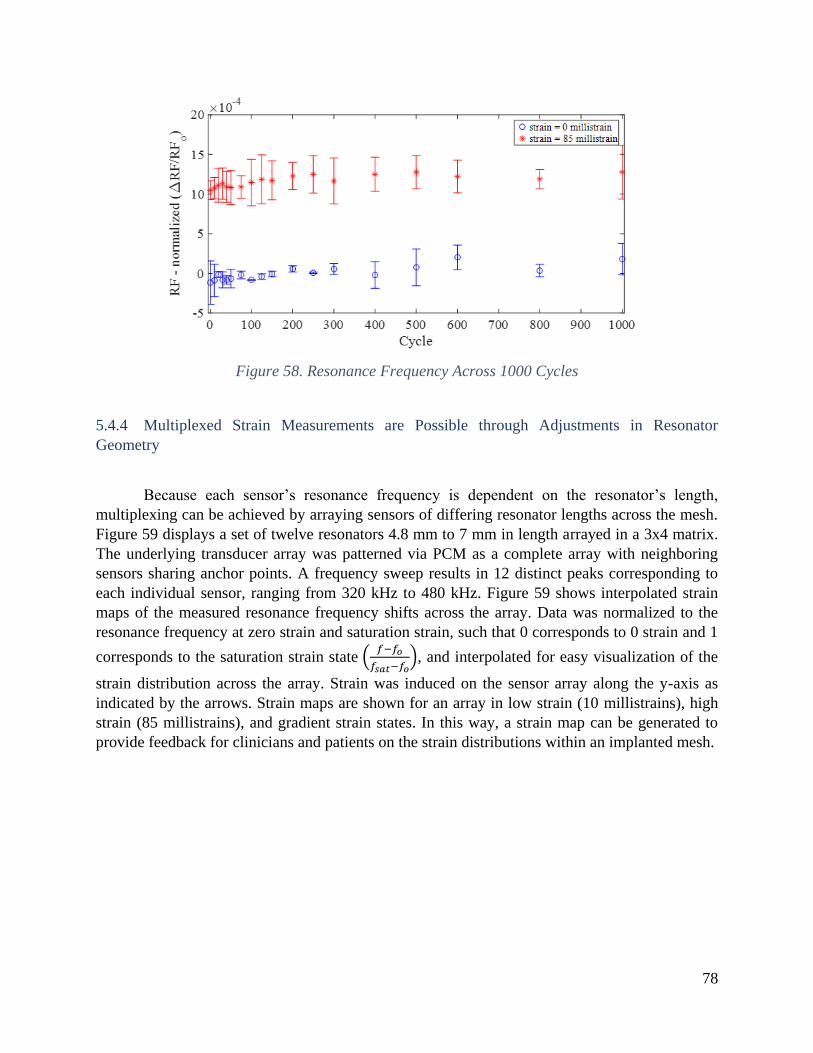
78
Figure 58. Resonance Frequency Across 1000 Cycles
5.4.4 Multiplexed Strain Measurements are Possible through Adjustments in Resonator
Geometry
Because each sensor’s resonance frequency is dependent on the resonator’s length,
multiplexing can be achieved by arraying sensors of differing resonator lengths across the mesh.
Figure 59 displays a set of twelve resonators 4.8 mm to 7 mm in length arrayed in a 3x4 matrix.
The underlying transducer array was patterned via PCM as a complete array with neighboring
sensors sharing anchor points. A frequency sweep results in 12 distinct peaks corresponding to
each individual sensor, ranging from 320 kHz to 480 kHz. Figure 59 shows interpolated strain
maps of the measured resonance frequency shifts across the array. Data was normalized to the
resonance frequency at zero strain and saturation strain, such that 0 corresponds to 0 strain and 1
corresponds to the saturation strain state (𝑓−𝑓𝑜
𝑓𝑠𝑎𝑡−𝑓𝑜), and interpolated for easy visualization of the
strain distribution across the array. Strain was induced on the sensor array along the y-axis as
indicated by the arrows. Strain maps are shown for an array in low strain (10 millistrains), high
strain (85 millistrains), and gradient strain states. In this way, a strain map can be generated to
provide feedback for clinicians and patients on the strain distributions within an implanted mesh.

79
Figure 59. Magnetoelastic Strain Sensor Array
5.5 Limitations and Future Works
5.5.1 An Inert Coating is Required to Enhance Biocompatibility
Because Metglas 2826MB, as well as most other magneto-elastic materials, are not
inherently biocompatible (Holmes et al., 2014), an inert coating, such as parylene, is required to
minimize the foreign body response. Future studies are necessary to assess the performance of
parylene-coated sensors for chronic implantation in in vivo conditions. In addition, sensor size
depends on the sensitivity of the interrogation system, so advances there would enable smaller
implanted sensors, which would further improve biocompatibility. A thin-film process for

80
fabricating the entire assembly (as opposed to the assembly-based approach taken here for proof-
of-concept) is a natural extension of this work.
5.5.2 Magneto-elastic Sensors are Not Compatible with MRI Diagnostics
A major limitation of this system is the incompatibility of magneto-elastic materials with
MRI, an imaging method often used for medical diagnostics. However, MRI is uncommonly used
to evaluate patients for ventral hernias; CT scan is the most common imaging modality used for
this purpose (Murphy et al., 2014). As such, prohibiting patients from getting an MRI would have
little impact on hernia management. For comparison, there are >7 million Americans living with
artificial joints which prohibit them from receiving a MRI (Kremers et al., 2015). Nevertheless,
the issue is an important one and could limit deployment of this technology, particularly for
patients with comorbidities requiring MRI diagnostics.
5.5.3 Magneto-elastic Sensors can be Extended for Use in Monitoring Other Flexible Implants
Magnetoelastic strain sensors are ideal for monitoring strain in the body since they can be
interrogated wirelessly and do not require an implanted power source. Many other flexible medical
devices and implants (i.e. tissue grafts, gastric bands, coronary valves, etc.) could benefit from
non-invasive postoperative monitoring of their strain states. For instance, these magnetoelastic
strain sensors can be adapted for integration with flexible cardiovascular stents to assess stent
deployment. While further work would need to be conducted to miniaturize the coupled strain
sensor and adapt the anchoring method to be compatible with expanding stent technology, figure
60 shows a proof-of-concept demonstration of the change in strain measured with a coupled
magnetoelastic strain sensor as a vascular balloon-expandable stent system (Omnilink Elite,
Abbott, Alameda, CA) is deployed from a fully compressed to a fully inflated state. As the stent
is expanded, the measured resonance frequency shifts by up to 550 Hz in the highest strain state
(position 5) when the stent is partially expanded across the sensor with 1 anchor on the fully
expanded and 1 anchor on the fully compressed regions of the stent. The resonance frequency
decreases as the stent reaches full expansion (defect caused by epoxy leaking onto the underlying
balloon for the right anchor prevented full deployment of the stent, which affected the position 7
measurements).

81
Figure 60. Proof-of-Concept Demonstration on a Stent
5.5.4 Alternative Approach: The patterned sensors can be used directly as the resonator elements
The R2 design can be used as a resonator to directly measure strain up to 90 millistrains
with SNR>5 (figure 61). This approach achieves higher sensitivity (greater change in RF with
respect to strain) than the coupled magneto-elastic approach, so is a good alternative for certain
applications. However, the unpackaged R2 resonators alone still suffers from many of the mass
loading effects present in the body, limiting its use in in vivo applications.
Figure 61. Patterned Resonator Can Be Used to Measure Strain

82
The signal amplitude and resonance frequency of a magneto-elastic strain sensor is strongly
impacted by the degree of damping on the sensor due to: mass loading (from surrounding tissues
as well as any biocompatible coatings) and any mechanical boundary conditions introduced by the
packaging and integration of the sensors with the mesh substrate (figure 62). To demonstrate the
effect of mass loading, Metglas 2826MB sensors were measured in air, under water, and on a tacky
polydimethylsiloxane (PDMS) substrate for 3 different resonator designs: 7x1 mm rectangular
sensors, R2-1 single-sided spring sensors, and R2 double-sided spring sensor. For all 3 designs, in
water, the signal amplitude is around 33% lower than in air and, when placed on the PDMS
substrate, the signal amplitude drops by almost 90%. Moreover, to detect strain in the prosthetic
mesh, the ends of the sensor must be bound to the mesh substrate, which significantly dampens
the mechanical vibrations of the sensor to the point where the signal is not detectable with our
setup for resonators with a single spring element (R2-1). The R2 resonators, however, were not
noticeably dampened by clamping the anchor points as the two symmetric springs diminished the
effects of the anchor point boundary conditions. The assembled sensors, where a 7x1 mm resonator
is protected in a rigid casing, maintains constant SNR of approximately 35 in all damping scenarios.
Thus, while the R2 sensor is useful as a strain sensor in applications experiencing minimal
environmental damping effects, the coupled strain sensor is more suitable for use in in vivo
applications.
Figure 62. Signal Amplitude for Patterned Resonator Shapes
5.6 Conclusion
In this chapter, we have demonstrated a magneto-elastic strain sensor array for guiding and
monitoring the stress profiles on a hernia mesh prosthetic based on a coupled magneto-elastic
approach that combines a transducer with integrated springs with an encased resonator to achieve
high dynamic range with good SNR. The dynamic range and sensitivity of the sensor can be tuned

83
through adjustments in the spring design of the transducers to measure up to 74 millistrains with
the S3 design. In addition, multiplexed measurements are possible within a single measurement
sweep by arraying resonators of varying lengths. Finally, we propose a fabrication and assembly
method suitable for high-throughput integration with many existing mesh prosthetics. This
technology provides surgeons and researchers with a quantitative tool to measure stress
distributions in highly flexible implants in an effort to reduce hernia recurrence rates. While this
work has been demonstrated with hernia repair applications in mind, the coupled strain sensor can
be extended for use in other applications with flexible, implantable devices, such as assessing the
deployment of coronary stents or monitoring the status of cardiac valves.
84
Chapter 6: Conclusions and Future Outlook
Wearable and implantable sensors are poised to change the way the healthcare system
approaches medical diagnostics, monitoring, and treatment. The plethora of new sensors being
developed enable personalization of care at a scale vastly greater than previous decades. Doctors
can now track patient fitness and disease progression through a multitude of sensors worn directly
on the body that measure temperature, heart rate, pH, oxygenation levels, and other clinically
relevant parameters in real time to make diagnoses and inform patient care.
Because many of these sensors are intended to interact with the body for prolonged periods
of time, flexible substrates that can comfortably conform to and move with the patient are highly
preferred as the ideal form factor. Better yet, sensors integrated directly into clothing or other
flexible substrates already utilized by patients are more likely to be adopted and used widely.
In this dissertation, I demonstrated two examples of how flexible substrates can be
instrumented to guide clinical decisions and improve patient care. First, I described an
instrumented bandage that uses impedance spectroscopy to detect mild pressure-induced damage
and demonstrated its efficacy in both an animal and human model. The flexible, electronic bandage
is capable of distinguishing between different types of tissue present in wounds and could detect
pressure-induced damage at pre-clinical stages before the wound could be diagnosed via visible
examination.
Next, I described two methods of instrumenting a hernia mesh prosthetic to measure strain
in an effort to reduce hernia recurrence rate. In the first method, I developed an optical approach
to guide surgeons during the surgical procedure. Markers on the hernia mesh are imaged and
analyzed to determine the strain distribution across the mesh. Surgeons can use this information to
actively adjust their sutures to minimize strain gradients across the mesh and, thus, reduce risk of
mechanical mesh failure. In the second method, an array of magnetoelastic strain sensors were
integrated onto the hernia mesh prosthetic to enable post-operative monitoring of strain through
tissue. This approach enables physicians to non-invasively examine the strain distribution across
the mesh during routine checkups.
The work presented in this thesis can be expanded into other aspects of clinical diagnosis
and monitoring. Tissue impedance measurements is a versatile sensing technique that can be used
to detect tissue changes in many applications, such as detecting skin cancer, classifying burn
wounds, and tracking wound healing after a surgery. Strain measurements are also useful for
understanding bone mechanics in response to various forces, guiding flexible instruments, such as
endoscopes and stents, and monitoring movements of heart valves.

85
Bibliography
Accoustic Properties for Metals in Solid Form. (n.d.). Retrieved from https://www.nde-
ed.org/GeneralResources/MaterialProperties/UT/ut_matlprop_metals.htm
Amjadi, M., Kyung, K., Park, I., & Sitti, M. (2016). Stretchable , Skin-Mountable , and Wearable
Strain Sensors and Their Potential Applications : A Review. Advanced Functional Materials,
26(11), 1678–1698. https://doi.org/10.1002/adfm.201504755
Anderson, D. R., Whitmer, R. W., Goetzel, R. Z., Ozminkowski, R. J., Wasserman, J., Serxner, S.,
& Organization, H. E. R. (2000). The Relationship Between Modifiable Health Risks and
Health Care Expenditures. American Journal of Health Promotion, 15(1), 45–53.
https://doi.org/10.1097/00043764-199810000-00003
Ayello, E. A., & Lyder, C. H. (2008). A new era of pressure ulcer accountability in acute care.
Advances in Skin & Wound Care, 21(3), 134-140; quiz 140-142.
https://doi.org/10.1097/01.ASW.0000305425.48047.a5
B. Kell, D., Markx, G. H., Davey, C. L., & Todd, R. W. (1990a). Real-time monitoring of cellular
biomass: Methods and applications. TrAC Trends in Analytical Chemistry, 9(6), 190–194.
https://doi.org/10.1016/0165-9936(90)87042-K
B. Kell, D., Markx, G. H., Davey, C. L., & Todd, R. W. (1990b). Real-time monitoring of cellular
biomass: Methods and applications. TrAC Trends in Analytical Chemistry.
https://doi.org/10.1016/0165-9936(90)87042-K
Badulescu, C., Grédiac, M., & Mathias, J. D. (2009). Investigation of the grid method for accurate
in-plane strain measurement. Measurement Science and Technology, 20(9), 095102.
https://doi.org/10.1088/0957-0233/20/9/095102
Bandodkar, A. J., & Wang, J. (2014). Non-invasive wearable electrochemical sensors : a review.
Trends in Biotechnology, 32(7), 363–371. https://doi.org/10.1016/j.tibtech.2014.04.005
Black, J., Baharestani, M. M., Cuddigan, J., Dorner, B., Edsberg, L., Langemo, D., … Taler, G.
(2007). From the NPUAP National Pressure Ulcer Advisory Panel ’ s Updated Pressure Ulcer
Staging System From the NPUAP, (May), 269–274.
Bluestein, D., & Javaheri, A. (2008). Pressure ulcers: Prevention, evaluation, and management.
American Family Physician.
Bringman, S., Conze, J., Cuccurullo, D., Deprest, J., Junge, K., Klosterhalfen, B., … Schumpelick,
V. (2010). Hernia repair: the search for ideal meshes. Hernia : The Journal of Hernias and
Abdominal Wall Surgery, 14(1), 81–7. https://doi.org/10.1007/s10029-009-0587-x
Brown, C. N., & Finch, J. G. (2010). Which mesh for hernia repair? Annals of the Royal College
of Surgeons of England, 92(4), 272–8. https://doi.org/10.1308/003588410X12664192076296
Bruin Biometrics. (2013). Pressure Ulcers: An Overview of a Painful Problem.
Burger, J. W. A., Halm, J. A., Wijsmuller, A. R., Raa, S. Ten, & Jeekel, J. (2006). Evaluation of
new prosthetic meshes for ventral hernia repair. Surgical Endoscopy and Other Interventional

86
Techniques, 20, 1320–1325. https://doi.org/10.1007/s00464-005-0706-4
Center for Medicare & Medicaid Services. (2018). National Health Expenditures Data. Retrieved
May 4, 2018, from https://www.cms.gov/Research-Statistics-Data-and-Systems/Statistics-
Trends-and-Reports/NationalHealthExpendData/index.html
Chen, D., Pardo, E., & Sanchez, A. (2005). Demagnetizing Factors for Rectangular Prisms. IEEE
Transactions on Magnetics, 41(6), 2077–2088.
Cui, W., Lu, W., Zhang, Y., Lin, G., Wei, T., & Jiang, L. (2010). Gold nanoparticle ink suitable
for electric-conductive pattern fabrication using in ink-jet printing technology. Colloids and
Surfaces A: Physicochemical and Engineering Aspects, 358(1–3), 35–41.
https://doi.org/10.1016/j.colsurfa.2010.01.023
Dabros, M., Dennewald, D., Currie, D. J., Lee, M. H., Todd, R. W., Marison, I. W., & Von Stockar,
U. (2009). Cole-Cole, linear and multivariate modeling of capacitance data for on-line
monitoring of biomass. Bioprocess and Biosystems Engineering, 32(2), 161–173.
https://doi.org/10.1007/s00449-008-0234-4
Danaei, G., Ding, E. L., Mozaffarian, D., Taylor, B., Rehm, J., Murray, C. J. L., & Ezzati, M.
(2009). The preventable causes of death in the United States: Comparative risk assessment of
dietary, lifestyle, and metabolic risk factors. PLoS Medicine, 6(4).
https://doi.org/10.1371/journal.pmed.1000058
De Koninck, J., Lorrain, D., & Gagnon, P. (1992). Sleep positions and position shifts in five age
groups: An ontogenetic picture. Sleep, 15(2), 143–149.
https://doi.org/10.1093/sleep/15.2.143
Dean, D. A., Ramanathan, T., Machado, D., & Sundarajan, R. (2008). Electrical impedance
spectroscopy stydy of biological tissues. J. Electrostat., 66, 165–177.
https://doi.org/10.1016/j.elstat.2007.11.005.Electrical
Edwards, M. (2018). Onchocerciasis. Retrieved from http://www.who.int/en/news-room/fact-
sheets/detail/onchocerciasis
Elango, S., Perumalsamy, S., Tech, K. R. B., & Vadodaria, K. (2017). Review article Mesh
materials and hernia repair, 7(3), 14–23. https://doi.org/10.1051/bmdcn/2017070316
Falyar, C. R. (n.d.). Tissue Echogenicity. Retrieved from
http://www.vaultrasound.com/educational-resources/ultrasound-physics/tissue-
echogenicity/
Faris, R., Hussain, O., Setouhy, M. E. L., Ramzy, R. M. R., & Weil, G. J. (1998). Bancroftian
filariasis in Egypt: Visualization of adult worms and subclinical lymphatic pathology by
scrotal ultrasound. American Journal of Tropical Medicine and Hygiene, 59(6), 864–867.
Fitzgibbons, R. J., & Forse, R. A. (2015). Groin Hernias in Adults. New England Journal of
Medicine, 372(8), 756–763. https://doi.org/10.1056/NEJMcp1404068
Flum, D. R., Horvath, K., & Koepsell, T. (2003). Have Outcomes of Incisional Hernia Repair
Improved With Time ? A Population-Based Analysis. Annals of Surgery, 237(1), 129–135.
87
Franz, M. G. (2009). The Biology of Hernia Formation, 88(1), 1–16.
Frykberg, R. G., & Banks, J. (2015). Challenges in the Treatment of Chronic Wounds. Advances
in Wound Care, 4(9), 560–582. https://doi.org/10.1089/wound.2015.0635
Gabriel, S., Lau, R. W., & Gabriel, C. (1996). The dielectric properties of biological tissues: II.
Measurements in the frequency range 10 Hz to 20 GHz. Physics in Medicine and Biology,
41(11), 2251–2269. https://doi.org/10.1088/0031-9155/41/11/002
Gharib, M., & Willert, C. E. (1992). Three-dimensional particle imaging with a single camera.
Experiments in Fluids, 12, 353–358. https://doi.org/10.1007/BF00193880
Gillian, G. K., Geis, W. P., & Grover, G. (2002). Laparoscopic incisional and ventral hernia repair
(LIVH): an evolving outpatient technique. JSLS : Journal of the Society of Laparoendoscopic
Surgeons / Society of Laparoendoscopic Surgeons, 6(4), 315–22. Retrieved from
http://www.pubmedcentral.nih.gov/articlerender.fcgi?artid=3043451&tool=pmcentrez&ren
dertype=abstract
Ginsburg, J., Neubauer, R., Bronson, D. L., Centor, R. M., Gluckman, R. A., Holm, R. P., … Yehia,
B. (2009). Controlling health care costs while promoting the best possible health outcomes.
American College of Pshysicians, 8–41.
Green, S. R., & Gianchandani, Y. B. (2009). Wireless magnetoelastic monitoring of biliary stents.
Journal of Microelectromechanical Systems, 18(1), 64–78.
https://doi.org/10.1109/JMEMS.2008.2008568
Green, S. R., & Gianchandani, Y. B. (2015). Microfabricated magnetoelastic sensors and actuators:
Opportunities and challenges. 2015 IEEE SENSORS - Proceedings, 2–5.
https://doi.org/10.1109/ICSENS.2015.7370368
Green, S. R., Richardson, M. T., Shariff, F. A., & Gianchandani, Y. B. (2007). Photochemically
Patterned Biliary Stents with Integrated Permanent Magnets and Deformable Assembly
Features for Wireless Magnetoelastic Tissue Growh Sensing. Transducers 2007 - 2007
International Solid-State Sensors, Actuators, and Microsystems Conference, Lyon, 213–217.
Grimes, C. a., Mungle, C. S., Zeng, K., Jain, M. K., Dreschel, W. R., Paulose, M., & Ong, K. G.
(2002). Wireless Magnetoelastic Resonance Sensors: A Critical Review. Sensors, 2(7), 294–
313. https://doi.org/10.3390/s20700294
Grimes, C. A., Roy, S. C., Rani, S., & Cai, Q. (2011). Theory, instrumentation and applications of
magnetoelastic resonance sensors: A review. Sensors, 11(3), 2809–2844.
https://doi.org/10.3390/s110302809
Grimnes, S., & Martinsen, Ø. G. (2008). Bioimpedance and Bioelectricity Basics. Bioimpedance
and Bioelectricity Basics. https://doi.org/10.1016/B978-0-12-374004-5.00002-7
Harris, K. D., Elias, A. L., & Chung, H. (2016). Flexible electronics under strain : a review of
mechanical characterization and durability enhancement strategies. Journal of Materials
Science, 51(6), 2771–2805. https://doi.org/10.1007/s10853-015-9643-3
Herrman, E. C., Knapp, C. F., Donofrio, J. C., & Salcido, R. (1999). Skin perfusion responses to
surface pressure-induced ischemia: implication for the developing pressure ulcer. Journal of

88
Rehabilitation Research and Development, 36(2), 109–120. https://doi.org/10.1086/250095
Holmes, H. R., DeRouin, A., Wright, S., Riedemann, T. M., Lograsso, T. A., Rajachar, R. M., &
Ghee Ong, K. (2014). Biodegradation and biocompatibility of mechanically active
magnetoelastic materials. Smart Materials and Structures, 23(9), 095036.
https://doi.org/10.1088/0964-1726/23/9/095036
Hopkins, A. D. (2005). Ivermectin and onchocerciasis: Is it all solved? Eye, 19(10), 1057–1066.
https://doi.org/10.1038/sj.eye.6701962
Hristoforou, E., & Ktena, A. (2007). Magnetostriction and magnetostrictive materials for sensing
applications. Journal of Magnetism and Magnetic Materials, 316(2), 372–378.
https://doi.org/10.1016/j.jmmm.2007.03.025
Huber, T., Bergmair, B., Vogler, C., Bruckner, F., Hrkac, G., & Suess, D. (2012). Magnetoelastic
resonance sensor for remote strain measurements. Applied Physics Letters, 101(4), 2012–
2015. https://doi.org/10.1063/1.4735340
Karl, W. J., Powell, A. L., Watts, R., Gibbs, M. R. J., & Whitehouse, C. R. (2000). A
micromachined magnetostrictive pressure sensor using magneto-optical interrogation.
Sensors and Actuators, 81(1–3), 137–141.
Kersey, A. D. (1996). A Review of Recent Developments in Fiber Optic Sensor Technology.
Optical Fiber Technology, 2(3), 291–317. https://doi.org/10.1006/ofte.1996.0036
Khan, Y., Pavinatto, F. J., Lin, M. C., Liao, A., Swisher, S. L., Mann, K., … Arias, A. C. (2016).
Inkjet-Printed Flexible Gold Electrode Arrays for Bioelectronic Interfaces. Advanced
Functional Materials, 26, 1004–1013. https://doi.org/10.1002/adfm.201503316
Kim, J., Lim, H., Lee, S. Il, & Kim, Y. J. (2012). Thickness of rectus abdominis muscle and
abdominal subcutaneous fat tissue in adult women: Correlation with age, pregnancy,
laparotomy, and body mass index. Archives of Plastic Surgery, 39(5), 528–533.
https://doi.org/10.5999/aps.2012.39.5.528
Kingsnorth, A., & Leblanc, K. (2003). Hernias : inguinal and incisional. The Lancet, 362(9395),
1561–1571.
Ko, W. H. (2012). Early History and Challenges of Implantable Electronics. ACM Journal on
Emerging Technologies in Computing Systems, 8(2), 8–25.
https://doi.org/10.1145/2180878.2180880
Kosack, C. S., Page, A.-L., & Klatser, P. R. (2017). A guide to aid the selection of diagnostic tests.
Bulletin of the World Health Organization, 95(9), 639–645.
https://doi.org/10.2471/BLT.16.187468
Kouzoudis, D., & Mouzakis, D. E. (2006). A 2826 MB Metglas ribbon as a strain sensor for remote
and dynamic mechanical measurements. Sensors and Actuators, A: Physical, 127(2), 355–
359. https://doi.org/10.1016/j.sna.2005.12.014
Kremers, H. M., Larson, D. R., Crowson, C. S., Kremers, W. K., Washington, R. E., Steiner, C.
A., … Berry, D. J. (2015). Prevalence of Total Hip and Knee Replacement in the United
States. Journal of Bone and Joint Surgery, 97(17), 1386–1397.

89
Liao, A., Harris, H. W., & Maharbiz, M. M. (2015). Towards a full-field strain sensor for guiding
hernia repairs. In Proceedings of the Annual International Conference of the IEEE
Engineering in Medicine and Biology Society, EMBS (Vol. 2015–Novem).
https://doi.org/10.1109/EMBC.2015.7318592
Liao, A., Harris, H. W., & Maharbiz, M. M. (2017). Integrating Coupled Magnetoelastic Sensors
onto a Flexible Hernia Mesh for High Dynamic Range Strain Measurements. 39th Annual
International Conference of the IEEE Engineering in Medicine and Biology Society (EMBC),
Seogwipo, 1736–1739.
Liao, A., Lin, M. C., Ritz, L. C., Swisher, S. L., Ni, D., Mann, K., … Michel, M. (2015). Impedance
Sensing Device for Monitoring Ulcer Healing in Human Patients. 37th Annual International
Conference of the IEEE Engineering in Medicine and Biology Society (EMBC), Milan, 5130–
5133.
Linderholm, P., Braschler, T., Vannod, J., Barrandon, Y., Brouard, M., & Renaud, P. (2006). Two-
dimensional impedance imaging of cell migration and epithelial stratification. Lab on a Chip,
6(9), 1155–62. https://doi.org/10.1039/b603856e
Liu, R., Wang, H., Li, X., Tang, J., & Mao, S. (n.d.). electroplated in different electrolytes Analysis ,
simulation and fabrication of MEMS springs for a micro-tensile system.
https://doi.org/10.1088/0960-1317/19/1/015027
Liu, Y., Pharr, M., & Salvatore, G. A. (2017). Lab-on-Skin: A Review of Flexible and Stretchable
Electronics for Wearable Health Monitoring. ACS Nano, 11(10), 9614–9635.
https://doi.org/10.1021/acsnano.7b04898
Liu, Y., Wang, H., Zhao, W., Zhang, M., Qin, H., & Xie, Y. (2018). Flexible, stretchable sensors
for wearable health monitoring: Sensing mechanisms, materials, fabrication strategies and
features. Sensors (Switzerland), 18(2). https://doi.org/10.3390/s18020645
Lochab, J., & Singh, V. R. (2004). Acoustic behaviour of plastics for medical applications,
42(August), 595–599.
Luijendijk, R. W., Hop, W. C. J., Petrousjka van den Tol, M., de Lange, D. C. D., Braaksma, M.
M. J., Ijzermans, J. N. M., … Jeekel, J. (2000). A Comparison of Suture Repair with Mesh
Repair for Incisional Hernia. The New England Journal of Medicine, 343, 392–398.
https://doi.org/10.1056/NEJM200008103430603
Lukaski, H. C. (2013). Evolution of bioimpedance: a circuitous journey from estimation of
physiological function to assessment of body composition and a return to clinical research.
European Journal of Clinical Nutrition, 67 Suppl 1(S1), S2-9.
https://doi.org/10.1038/ejcn.2012.149
Lukaski, H. C., & Moore, M. (2012). Bioelectrical impedance assessment of wound healing.
Journal of Diabetes Science and Technology, 6(1), 209–12. Retrieved from
http://www.pubmedcentral.nih.gov/articlerender.fcgi?artid=3320840&tool=pmcentrez&ren
dertype=abstract
Mand, S., Marfo-Debrekyei, Y., Debrah, A., Buettner, M., Batsa, L., Pfarr, K., … Hoerauf, A.
(2005). Frequent detection of worm movements in onchocercal nodules by ultrasonography.

90
Filaria Journal, 4. https://doi.org/10.1186/1475-2883-4-1
Markx, G. H., & Davey, C. L. (1999). The dielectric properties of biological cells at
radiofrequencies: applications in biotechnology. Enzyme and Microbial Technology, 25(3–5),
161–171. https://doi.org/10.1016/S0141-0229(99)00008-3
Metglas. (2011). Metglas 2826MB Iron-Nickel Base Alloy Technical Bulletin. 2826Mb04202011,
3.
Moore, M. F., Dobson, N., Castelllino, L., & Kapp, S. (2011). Phase angle, an alternative
physiological tool to assess wound treatment in chronic nonhealing wounds. Journal of the
American College of Certified Wound Specialists. https://doi.org/10.1016/j.jcws.2011.06.001
Morton, L. M., & Phillips, T. J. (2016). Wound Healing and Treating Wounds: Differntial
Diagnosis and Evaluation of Chronic Wounds. Journal of the American Academy of
Dermatology, 74(4), 589–605.
Murphy, K. P., O’Connor, O. J., & Maher, M. M. (2014). Adult Abdominal Hernias. American
Journal of Roentgenology, 202(6), 506–511.
Murray, C. J. L., & Frenk, J. (2010). Ranking 37th — Measuring the Performance of the U.S.
Health Care System. New England Journal of Medicine, 362(2), 98–99.
https://doi.org/10.1056/NEJMp0910064
Nanoxyde. (2008). Scheme of the Four Bedsore Pressure Ulcer Stages. Retrieved April 15, 2018,
from https://en.wikipedia.org/wiki/Pressure_ulcer#/media/File:Schema_stades_escarres.svg
Nathan, A., Ahnood, A., Cole, M. T., Lee, S., Suzuki, Y., Hiralal, P., … Milne, W. I. (2012).
Flexible electronics: The next ubiquitous platform. Proceedings of the IEEE, 100(SPL
CONTENT), 1486–1517. https://doi.org/10.1109/JPROC.2012.2190168
National Pressure Ulcer Advisory Panel, European Pressure Ulcer Advisory Panel, & Pan Pacific
Pressure Injury Alliance. (2014). Prevention and Treatment of Pressure Ulcers: Quick
Reference Guide.
Notbohm, J., Rosakis, a., Kumagai, S., Xia, S., & Ravichandran, G. (2013). Three-dimensional
Displacement and Shape Measurement with a Diffraction-assisted Grid Method. Strain, n/a-
n/a. https://doi.org/10.1111/str.12046
NPUAP (National Pressure Ulcer Advisory Panel). (2016). NPUAP Pressure Injury Stages.
Retrieved from http://www.npuap.org/resources/educational-and-clinical-resources/npuap-
pressure-injury-stages/
Oess, N. P., Weisse, B., & Nelson, B. J. (2009). Magnetoelastic Strain Sensor for Optimized
Assessment of Bone Fracture Fixation. Ieee Sensors Journal, 9(8), 961–968.
https://doi.org/10.1109/JSEN.2009.2025575
Pancorbo-Hidalgo, P. L., Garcia-Fernandez, F. P., Lopez-Medina, I. M., & Alvarez-Nieto, C.
(2006). Risk assessment scales for pressure ulcer prevention: a systematic review. Journal of
Advanced Nursing, 54(1), 94–110. https://doi.org/10.1111/j.1365-2648.2006.03794.x
Pankow, M., Justusson, B., & Waas, A. M. (2010). Three-dimensional digital image correlation

91
technique using single high-speed camera for measuring large out-of-plane displacements at
high framing rates. Applied Optics, 49(17), 3418–27. Retrieved from
http://www.ncbi.nlm.nih.gov/pubmed/20539362
Parasites - Onchocerciasis (also known as River Blindness). (2013). Retrieved from
https://www.cdc.gov/parasites/onchocerciasis/epi.html
Patel, P., & Markx, G. H. (2008a). Dielectric measurement of cell death. Enzyme and Microbial
Technology, 43(7), 463–470. https://doi.org/10.1016/j.enzmictec.2008.09.005
Patel, P., & Markx, G. H. (2008b). Dielectric measurement of cell death. Enzyme and Microbial
Technology. https://doi.org/10.1016/j.enzmictec.2008.09.005
Peirce, S. M., Skalak, T. C., & Rodeheaver, G. T. (2000). Ischemia-reperfusion injury in chronic
pressure ulcer formation: A skin model in the rat. Wound Repair and Regeneration, 8(1), 68–
76. https://doi.org/10.1046/j.1524-475X.2000.00068.x
Pepakayala, V., Green, S. R., & Gianchandani, Y. B. (2014). Passive wireless strain sensors using
microfabricated magnetoelastic beam elements. Journal of Microelectromechanical Systems,
23(6), 1374–1382. https://doi.org/10.1109/JMEMS.2014.2313809
Pepakayala, V., Stein, J., & Gianchandani, Y. (2015). Resonant magnetoelastic microstructures
for wireless actuation of liquid flow on 3D surfaces and use in glaucoma drainage implants.
Microsystems & Nanoengineering, 0(0), 1–9. https://doi.org/10.1038/micronano.2015.32
Pereira, F., & Gharib, M. (2002). Defocusing digital particle image velocimetry and the three-
dimensional characterization of two-phase flows. Measurement Science and Technology.
https://doi.org/10.1088/0957-0233/13/5/305
Pethig, R., & Kell, D. B. (1987). The passive electrical properties of biological systems: their
significance in physiology. Phys Med Biol, 32(8), 933–970.
Podwojewski, F., Otténio, M., Beillas, P., Guérin, G., Turquier, F., & Mitton, D. (2014).
Mechanical response of human abdominal walls ex vivo: Effect of an incisional hernia and a
mesh repair. Journal of the Mechanical Behavior of Biomedical Materials, 38, 126–33.
https://doi.org/10.1016/j.jmbbm.2014.07.002
Poulose, B. K., Shelton, J., Phillips, S., Moore, D., Nealon, W., Penson, D., … Holzman, M. D.
(2012). Epidemiology and cost of ventral hernia repair: Making the case for hernia research.
Hernia, 16, 179–183. https://doi.org/10.1007/s10029-011-0879-9
Rahman, a R. a, Register, J., Vuppala, G., & Bhansali, S. (2008). Cell culture monitoring by
impedance mapping using a multielectrode scanning impedance spectroscopy system
(CellMap). Physiological Measurement, 29(6), S227-39. https://doi.org/10.1088/0967-
3334/29/6/S20
Reddy, M., Gill, S. S., & Rochon, P. A. (2006). Preventing pressure ulcers: a systematic review.
JAMA : The Journal of the American Medical Association, 296(8), 974–984.
https://doi.org/10.1016/S0093-3619(08)70580-X
Rigaud, B., Morucci, J. P., & Chauveau, N. (1996). Bioelectrical impedance techniques in
medicine. Part I: Bioimpedance measurement. Second section: impedance spectrometry.

92
Critical Reviews in Biomedical Engineering, 24(4–6), 257–351.
Robinson, T. N., Clarke, J. H., Schoen, J., & Walsh, M. D. (2005). Major mesh-related
complications following hernia repair: events reported to the Food and Drug Administration.
Surgical Endoscopy, 19(12), 1556–60. https://doi.org/10.1007/s00464-005-0120-y
Rutkow, I. M. (2003). Demographic and socioeconomic aspects of hernia repair in the United
States in 2003. Surgical Clinics of North America, 83(5), 1045–1051.
https://doi.org/10.1016/S0039-6109(03)00132-4
Saito, Y., Hasegawa, M., Fujimoto, M., Matsushita, T., Horikawa, M., Takenaka, M., … Takehara,
K. (2008). The loss of MCP-1 attenuates cutaneous ischemia-reperfusion injury in a mouse
model of pressure ulcer. Journal of Investigative Dermatology, 128(7), 1838–1851.
https://doi.org/10.1038/sj.jid.5701258
Schwan, H. P. (1959). Alternating Current Spectroscopy of Biological Substances. Proceedings of
the IRE, 47(11), 1841–1855. https://doi.org/10.1109/JRPROC.1959.287155
Sen, C. K., Gordillo, G. M., Roy, S., Kirsner, R., Lambert, L., Hunt, T. K., … Longaker, M. T.
(2009). Human Skin Wounds: A Major Snoballing Threat to Public Health and Economy.
Wound Repair Regen. 2009, 17(6), 763–771. https://doi.org/10.1111/j.1524-
475X.2009.00543.x.Human
Sharma, P. K., & Guha, S. K. (1975). Transmission of Time Varying Magnetic Field Through
Body Tissue. Journal of Biological Physics, 3(2), 95–102.
Smith, A. M., Mancini, M. C., & Nie, S. (2010). Second window for in vivo imaging. National
Institutes of Health, 4(11), 710–711. https://doi.org/10.1038/nnano.2009.326.Second
Squires, D., & Anderson, C. (2015). U.S. Health Care from a Global Perspective. The
Commonwealth Fund.
Swisher, S. L., Lin, M. C., Liao, A., Leeflang, E. J., Khan, Y., Pavinatto, F. J., … Maharbiz, M.
M. (2015). Impedance sensing device enables early detection of pressure ulcers in vivo.
Nature Communications, 6, 1–10. https://doi.org/10.1038/ncomms7575
Tricoli, A., Nasiri, N., & De, S. (2017). Wearable and Miniaturized Sensor Technologies for
Personalized and Preventive Medicine. Advanced Functional Materials, 27(15), 1–19.
https://doi.org/10.1002/adfm.201605271
VanGilder, C., Macfarlane, G. D., & Meyer, S. (2008). Results of nine international pressure ulcer
prevalence surveys: 1989 to 2005. Ostomy/Wound Management, 54(2), 40–54.
https://doi.org/10.1016/j.scijus.2009.06.001
Weber, S. a, Gehin, C., Moddy, G., Jossinet, J., & McAdams, E. T. (2008). Characterisation of a
multi-frequency wound impedance mapping instrument. Conference Proceedings : ... Annual
International Conference of the IEEE Engineering in Medicine and Biology Society. IEEE
Engineering in Medicine and Biology Society. Conference, 2008, 4907–10.
https://doi.org/10.1109/IEMBS.2008.4650314
Weber, S. a, Vonhoff, P. a, Owens, F. J., Byrne, J., & McAdams, E. T. (2009). Development of a
multi--electrode electrical stimulation device to improve chronic wound healing. Conference

93
Proceedings : ... Annual International Conference of the IEEE Engineering in Medicine and
Biology Society. IEEE Engineering in Medicine and Biology Society. Conference, 2009,
2145–8. https://doi.org/10.1109/IEMBS.2009.5333963
WHO. (2008). Action Plan for the Global Strategy for the Prevention and Control of
Noncommunicable Diseases 2008-2013. Geneva: World Health Organization, 35. Retrieved
from http://www.who.int/nmh/Actionplan-PC-NCD-
2008.pdf%5Cnhttp://scholar.google.com/scholar?hl=en&btnG=Search&q=intitle:2008-
2013+Action+Plan+for+the+global+strategy+for+the+prevention+and+control+of+Nonco
mmunicable+Diseases#0%5Cnhttp://scholar.google.com/scho
Windmiller, J. R., & Wang, J. (2013). Wearable Electrochemical Sensors and Biosensors: A
Review. Electroanalysis, 25(1), 29–46. https://doi.org/10.1002/elan.201200349
Wong, V. (2011). Skin Blood Flow Response to 2-Hour Repositioning in Long-term Care
Residents: A Pilot Study. Journal of Wound, Ostomy, and Continence Nursing : Official
Publication of The Wound, Ostomy and Continence Nurses Society / WOCN, 38(5), 529–37.
https://doi.org/10.1097/WON.0b013e31822aceda
Xia, S., Gdoutou, a., & Ravichandran, G. (2012). Diffraction Assisted Image Correlation: A Novel
Method for Measuring Three-Dimensional Deformation using Two-Dimensional Digital
Image Correlation. Experimental Mechanics, 53(5), 755–765.
https://doi.org/10.1007/s11340-012-9687-0
Zell, K., Sperl, J. I., Vogel, M. W., Niessner, R., & Haisch, C. (2007). Acoustical properties of
selected tissue phantom materials for ultrasound imaging. Physics in Medicine and Biology,
52(20), N475-84. https://doi.org/10.1088/0031-9155/52/20/N02