Embed Size (px)
Citation preview
INSTRUMENTATION FORAND GAS SPECIATION
Final Technical Report • July 1998
AEROSOL
Prepared by:
Michael J. CoggiolaMolecular Physics Laboratory
SRI Project 7383MP 98-059
Prepared for:
NASA Ames Research CenterEarth System Science Division, 239-20Moffett Field, CA 94035-1000
Approved by:
David R. Crosley, DirectorMolecular Physics Laboratory
333 Ravenswood Avenue • Menlo Park, CA 94025-3493 • (650) 859-2000
https://ntrs.nasa.gov/search.jsp?R=19990014135 2019-02-11T15:55:03+00:00Z
EXECUTIVE SUMMARY
SRI International, under NASA Grant No. NAG 2-963 (SRI Project 7383), from 1
February, 1995 through 31 January, 1998, designed, fabricated, tested, and deployed a real-time
aerosol speciation instrument in NASA's DC-8 aircraft during the Spring 1996 SUbsonic Aircraft:
Contrail and Cloud Effects Special Study (SUCCESS) mission. Post-mission laboratory
calibrations and data reduction and analysis were also included in the effort.
This new instrument provides real-time chemical analysis of the composition of individual
aerosol particles with diameters greater than approximately 0.3 gm. During the SUCCESS
mission, this instrument chemically characterized more than 25,000 individual aerosol particles
sampled directly from the upper troposphere (UT) during 19 flights. Of these aerosols,
approximately 140 were found to contain interesting chemical species, identified as sulfates,
nitrates, carbonates, and sulfuric acid. The remaining aerosols showed only evidence of water
with no other chemically interesting species present above our detection limit. These represent the
first examples of aerosol particles chemically speciated in real-time from an airborne platform in the
UT.
As a result of a non-optimum external aerosol sampler, we likely oversampled larger
particles. The large amount of water associated with these larger particles and the high ambient
humidity encountered during cloud transits where our spectra were taken resulted in the majority of
particles appearing to contain only water. Despite these limitations, we were able to chemically
characterize many individual aerosol particles. Laboratory studies have largely confirmed the
assignment of these aerosol spectra measured in the UT. The paucity of chemically interesting
experimental results obtained using this new instrument during its first deployment as part of the
SUCCESS mission does not admit making statistically significant observations about the chemical
composition of UT aerosol particles. Straightforward changes to the sampling inlet and the
instrument will permit such upper tropospheric aerosol compositional observations to be made on
future deployments. However, even in its current configuration, this new instrument has
demonstrated the ability to chemically characterize in real-time single aerosol particles sampled
directly from the troposphere.
CONTENTS
SUMMARY ............................................................................................... i
INTRODUCTION ....................................................................................... 1
Chemical Characterization of Aerosols ................................................................ 1
Contribution to Overall Mission Goals ................................................................ 2
PROJECT ACCOMPLISHMENTS ................................................................... 4
Instrument Design ........................................................................................ 4
External Aerosol Inlet .................................................................................... 4
Particle Beam Generator ............................................................................... _. 6
Optical Particle Counter .................................................................................. l0
Aerosol Volatilization .................................................................................... 12
Mass Spectrometry ................................................................................. 13
Electron Impact Ion Source ........................................................................ 14
Time-Of-Flight Mass Spectrometer ............................................................... 16
Data Acquisition System ................................................................................. 17
DC-8 Integration .......................................................................................... 20
SUCCESS Deployment ................................................................................. 20
SUCCESS Results ....................................................................................... 23
Post-Mission Calibration and Analysis ................................................................ 31
CONCLUSIONS ......................................................................................... 35
ACKNOWLEDGEMENTS ............................................................................. 36
REFERENCES ........................................................................................... 37
APPENDIX A ............................................................................................ Aol
APPENDIX B ............................................................................................ B-1
APPENDIX C ............................................................................................ C-1
APPENDIX D ............................................................................................ D-1
ii
FIGURES
Figure 1
Figure 2
Figure 3
Figure 4
Figure 5
Figure 6
Figure 7
Figure 8
Figure 9
Figure 10
Figure 11
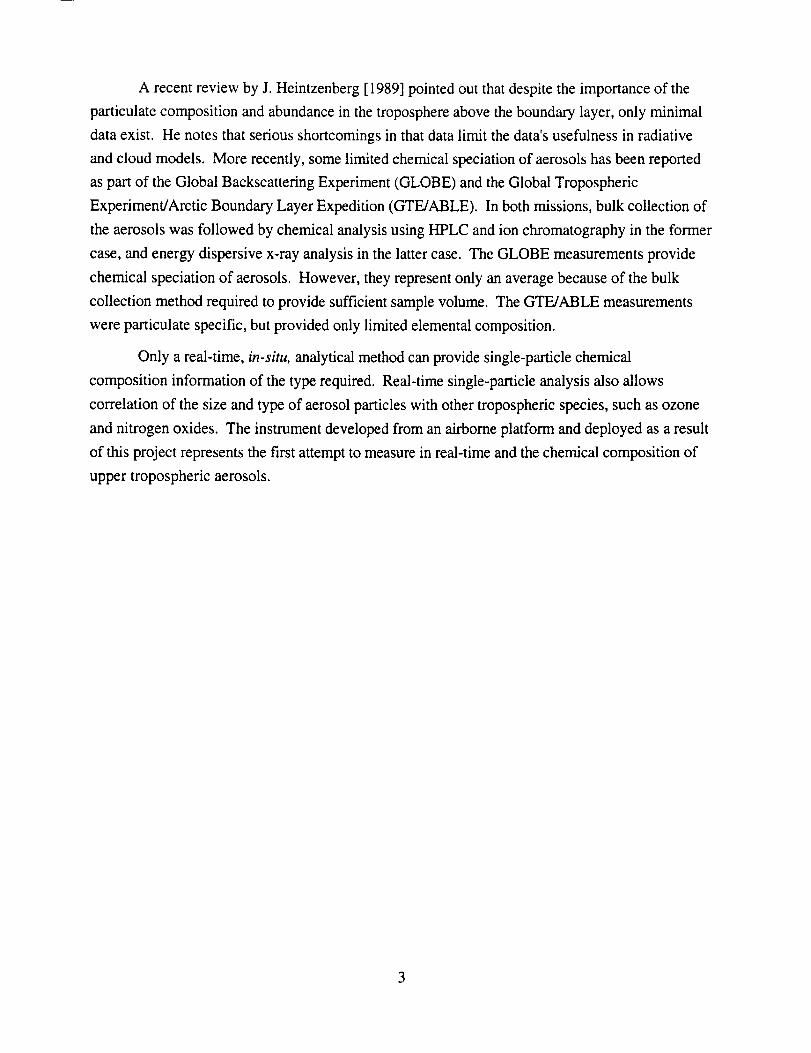
Schematic diagram of the real-time aerosol mass spectrometer instrument ............ 5
SUCCESS mission configuration for sample transfer and vent lines .................. 7
Detailed view of capillary inlet and differential pumping region ........................ 8
Schematic diagram of the sample transfer system and the differentially
pumped aerosol inlet ........................................................................ 9
Cross-sectional view of the source chamber showing the differentially
pumped capillary inlet, the laser-based particle detector, the ion source
with integral thermal vaporization, the ion extraction and focusing lens
elements, and the ion deflectors .......................................................... 11
Cross-sectional view of the electron impact ionization source as modified
to allow aerosol particles to impinge upon the indirectly heated
volatilization surface ......................................................................... 14
Data acquisition sequence triggered by a particle .......................................... 19
Relative position of the electronics rack and vacuum chamber as installed
on the DC-8 .................................................................................. 21
Histogram plot of the number of sulfate-based aerosol particles measured
as a function of the DC-8 (radar) altitude ............................................. 28
Time-of-flight mass spectra of single aerosol particles recorded during
SUCCESS flights ............................................................................ 29
Variation in the peak heights of SO + (m/z 48), SO2 + (m/z 64), and
SO3 + (m/z 80) measured from 22 different sulfate-based aerosols ............... 31
ifi
TABLES
Table 1
Table 2
Table 3
Table 4
Table 5
Summary of SUCCESS Mission Flights .................................................. 22
DC-8 Flight Data Corresponding to Analyzed Aerosols for May 2, 1996 ............. 23
DC-8 Flight Data Corresponding to Analyzed Aerosols for May 3, 1996 ............. 25
DC-8 Flight Data Corresponding to Analyzed Aerosols for May 4, 1996 ............. 26
DC-8 Flight Data Corresponding to Analyzed Aerosols for May 7, 1996 ............. 27
iv
INTRODUCTION
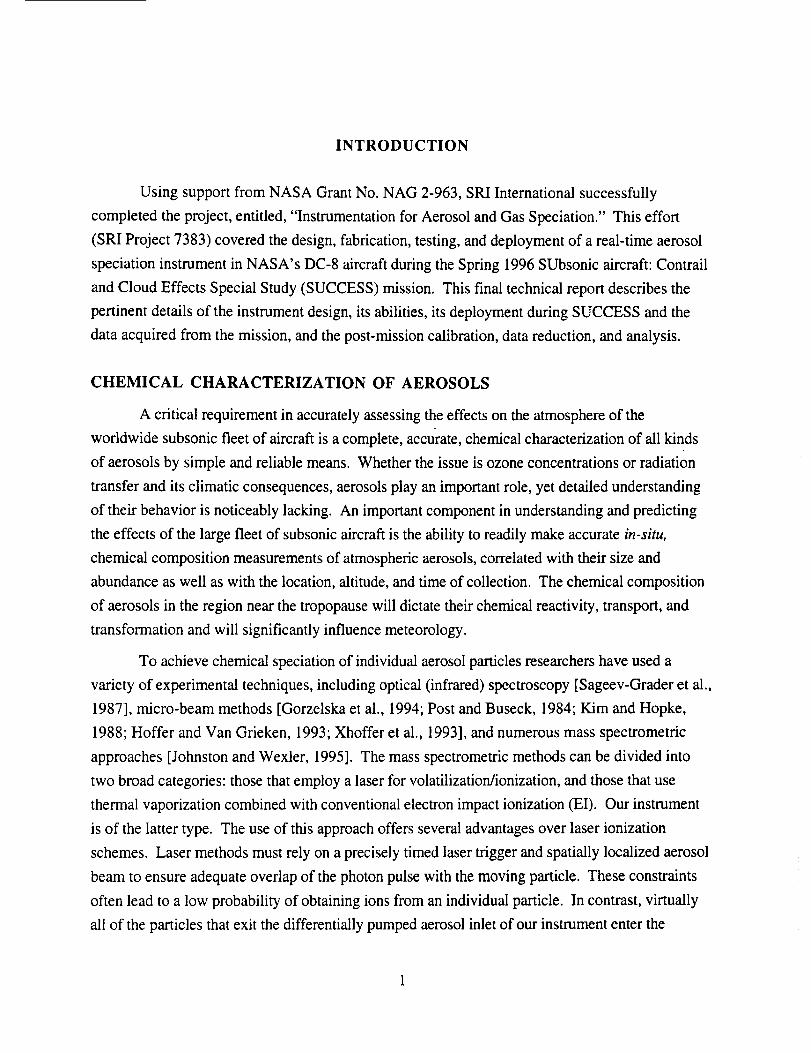
Using support from NASA Grant No. NAG 2-963, SRI International successfully
completed the project, entitled, "Instrumentation for Aerosol and Gas Speciation." This effort
(SRI Project 7383) covered the design, fabrication, testing, and deployment of a real-time aerosol
speciation instrument in NASA's DC-8 aircraft during the Spring 1996 SUbsonic aircraft: Contrail
and Cloud Effects Special Study (SUCCESS) mission. This final technical report describes the
pertinent details of the instrument design, its abilities, its deployment during SUCCESS and the
data acquired from the mission, and the post-mission calibration, data reduction, and analysis.
CHEMICAL CHARACTERIZATION OF AEROSOLS
A critical requirement in accurately assessing the effects on the atmosphere of the
worldwide subsonic fleet of aircraft is a complete, accurate, chemical characterization of all kinds
of aerosols by simple and reliable means. Whether the issue is ozone concentrations or radiation
transfer and its climatic consequences, aerosols play an important role, yet detailed understanding
of their behavior is noticeably lacking. An important component in understanding and predicting
the effects of the large fleet of subsonic aircraft is the ability to readily make accurate in-situ,
chemical composition measurements of atmospheric aerosols, correlated with their size and
abundance as well as with the location, altitude, and time of collection. The chemical composition
of aerosols in the region near the tropopause will dictate their chemical reactivity, transport, and
transformation and will significantly influence meteorology.
To achieve chemical speciation of individual aerosol particles researchers have used a
variety of experimental techniques, including optical (infrared) spectroscopy [Sageev-Grader et al.,
1987], micro-beam methods [Gorzelska et al., 1994; Post and Buseck, 1984; K.im and Hopke,
1988; Hoffer and Van Grieken, 1993; Xhoffer et al., 1993], and numerous mass spectrometric
approaches [Johnston and Wexler, 1995]. The mass spectrometric methods can be divided into
two broad categories: those that employ a laser for volatilization/ionization, and those that use
thermal vaporization combined with conventional electron impact ionization (EI). Our instrument
is of the latter type. The use of this approach offers several advantages over laser ionization
schemes. Laser methods must rely on a precisely timed laser trigger and spatially localized aerosol
beam to ensure adequate overlap of the photon pulse with the moving particle. These constraints
often lead to a low probability of obtaining ions from an individual particle. In contrast, virtually
all of the particles that exit the differentially pumped aerosol inlet of our instrument enter the
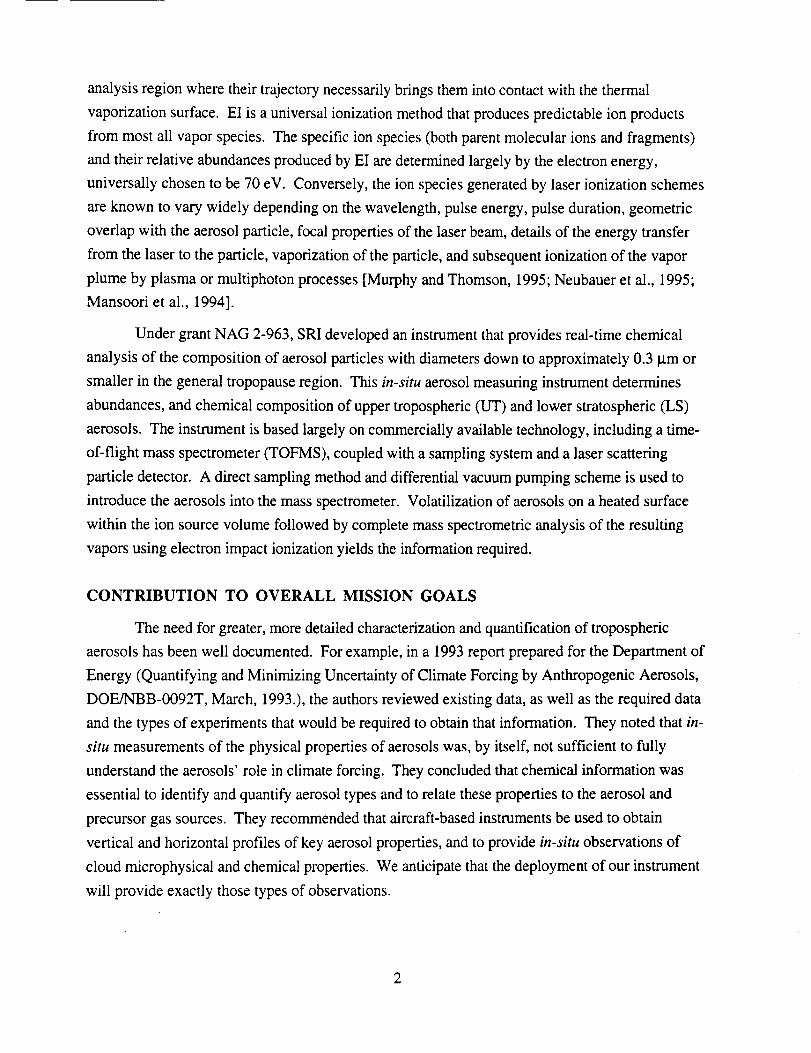
analysisregionwheretheirtrajectorynecessarilybringsthemintocontactwith thethermal
vaporizationsurface.El isauniversalionizationmethodthatproducespredictableion products
from mostall vaporspecies.Thespecificionspecies(bothparentmolecularionsandfragments)andtheirrelativeabundancesproducedbyEI aredeterminedlargelyby theelectronenergy,
universallychosento be70eV. Conversely,theion speciesgeneratedby laserionizationschemes
areknownto varywidelydependingon thewavelength,pulseenergy,pulseduration,geometric
overlapwith theaerosolparticle,focalpropertiesof thelaserbeam,detailsof theenergytransfer
fromthelaserto theparticle,vaporizationof theparticle,andsubsequentionizationof thevapor
plumeby plasmaor multiphotonprocesses[MurphyandThomson,1995;Neubaueret al., 1995;Mansooriet al., 1994].
UndergrantNAG 2-963,SRIdevelopedaninstrumentthatprovidesreal-timechemical
analysisof thecompositionof aerosolparticleswithdiametersdownto approximately0.3 l.tmor
smallerin thegeneraltropopauseregion.This in-situ aerosol measuring instrument determines
abundances, and chemical composition of upper tropospheric (UT) and lower stratospheric (LS)
aerosols. The instrument is based largely on commercially available technology, including a time-
of-flight mass spectrometer (TOFMS), coupled with a sampling system and a laser scattering
particle detector. A direct sampling method and differential vacuum pumping scheme is used to
introduce the aerosols into the mass spectrometer. Volatilization of aerosols on a heated surface
within the ion source volume followed by complete mass spectrometric analysis of the resulting
vapors using electron impact ionization yields the information required.
CONTRIBUTION TO OVERALL MISSION GOALS
The need for greater, more detailed characterization and quantification of tropospheric
aerosols has been well documented. For example, in a 1993 report prepared for the Department of
Energy (Quantifying and Minimizing Uncertainty of Climate Forcing by Anthropogenic Aerosols,
DOE/NBB-0092T, March, 1993.), the authors reviewed existing data, as well as the required data
and the types of experiments that would be required to obtain that information. They noted that in-
situ measurements of the physical properties of aerosols was, by itself, not sufficient to fully
understand the aerosols' role in climate forcing. They concluded that chemical information was
essential to identify and quantify aerosol types and to relate these properties to the aerosol and
precursor gas sources. They recommended that aircraft-based instruments be used to obtain
vertical and horizontal profiles of key aerosol properties, and to provide in-situ observations of
cloud microphysical and chemical properties. We anticipate that the deployment of our instrument
will provide exactly those types of observations.
2
A recentreviewby J.Heintzenberg[1989]pointedout thatdespitetheimportanceof the
particulatecompositionandabundancein thetroposphereabovetheboundarylayer,only minimaldataexist. Henotesthatseriousshortcomingsin thatdatalimit thedata'susefulnessin radiative
andcloudmodels.Morerecently,somelimitedchemicalspeciationof aerosolshasbeenreported
aspartof theGlobalBackscatteringExperiment(GLOBE)andtheGlobalTroposphericExperiment/ArcticBoundaryLayerExpedition(GTE/ABLE). In bothmissions,bulk collectionof
theaerosolswasfollowedbychemicalanalysisusingHPLCandion chromatographyin theformer
case,andenergydispersivex-rayanalysisin the lattercase.TheGLOBEmeasurementsprovide
chemicalspeciationof aerosols.However,theyrepresentonly anaveragebecauseof thebulkcollectionmethodrequiredto providesufficientsamplevolume.TheGTE/ABLEmeasurements
wereparticulatespecific,butprovidedonly limitedelementalcomposition.
Onlyareal-time,in-situ, analytical method can provide single-particle chemical
composition information of the type required. Real-time single-particle analysis also allows
correlation of the size and type of aerosol particles with other tropospheric species, such as ozone
and nitrogen oxides. The instrument developed from an airborne platform and deployed as a result
of this project represents the first attempt to measure in real-time and the chemical composition of
upper tropospheric aerosols.
PROJECT ACCOMPLISHMENTS
INSTRUMENT DESIGN
Our design for the particulate mass spectrometer consists of a differentially pumped aerosol
inlet; a small, diode-laser-based, optical particle counter (OPC) that provides a timing trigger; a
heated surface for rapid vaporization of the particle under vacuum conditions; a reflectron, time-of-
flight (TOF) mass spectrometer using EI to ionize the vaporized species; and a computer for data
acquisition and experiment control. Figure 1 shows a schematic representation of our instrument
in its SUCCESS mission configuration.
Many of the design choices were dictated by the strict time deadline imposed by the mission
aircraft integration schedule. Although SRI was notified of the grant award in the middle of 1994,
funding was not available to us until February 1995. As a result, we had only 13 months to
complete the entire instrument design, assembly, testing, and aircraft integration. Of necessity,
this very short time period resulted in a number of design shortcomings and compromises that
limited instrument performance. Despite these shortcomings, and the fact that this was the first
airborne deployment of a real-time aerosol characterization instrument, it functioned successfully.
EXTERNAL AEROSOL INLET
The main criterion for the design of an aircraft aerosol sampling inlet is to acquire particles
with minimum sampling bias or distortion of the size distribution, and minimum evaporative loss
of volatile components. Losses due to turbulent deposition or inertial impaction are of concern as
well. To eliminate size discrimination, we must use an isokinetic probe in which the velocity of the
sample stream relative to the probe tip remains the same inside the probe as it is outside the aircraft
[Porter et al., 1992; Daum and Springton, 1993].
The inlet system that was used to sample aerosols directly from the upper troposphere
under flight conditions and transfer them to the instrument for speciation consisted of three
components: (1) the external aerosol sampler, (2) the aerosol transfer line, and (3) the differentially
pumped, capillary, sampling system.
Because of the experimental configuration and location of our instrument on the DC-8, and
the use of the forward-most window on the port side of the aircraft (station 290), we were
restricted in our choice of external samplers to a simple, forward-facing probe. This probe was
4
\
5
supplied by ARC, and is shown in their drawing 4237474. The probe consists of a metal tube
3.175 cm in diameter that extends approximately 30 cm beyond the aircraft exterior, mounted on a
curved, passenger port plate. The probe turns 45 ° with a bend radius of approximately 42 cm. A
conical diffuser probe tip with a 0.635 cm sample orifice and a 20.2 ° half-angle was added to the
end of the probe. The conical diffuser probe tip design was provided by the Desert Research
Institute, and is the same as used by that group on previous, DC-8 based, aerosol sampling
experiments. The centerline of the sampling orifice tilted 6° down with respect to the fuselage
centerline to account for the aircraft angle of attack during flight. The approximate Stokes number
in the inlet ranged from 0.014 to 2.2 for particles in the size range from 0.4 to 5 lam.
Aerosols sampled through this probe were transported through approximately 1 m of
0.635-cm-id, conductive silicone tubing (TSI, St. Paul, Minnesota) to the instrument inlet.
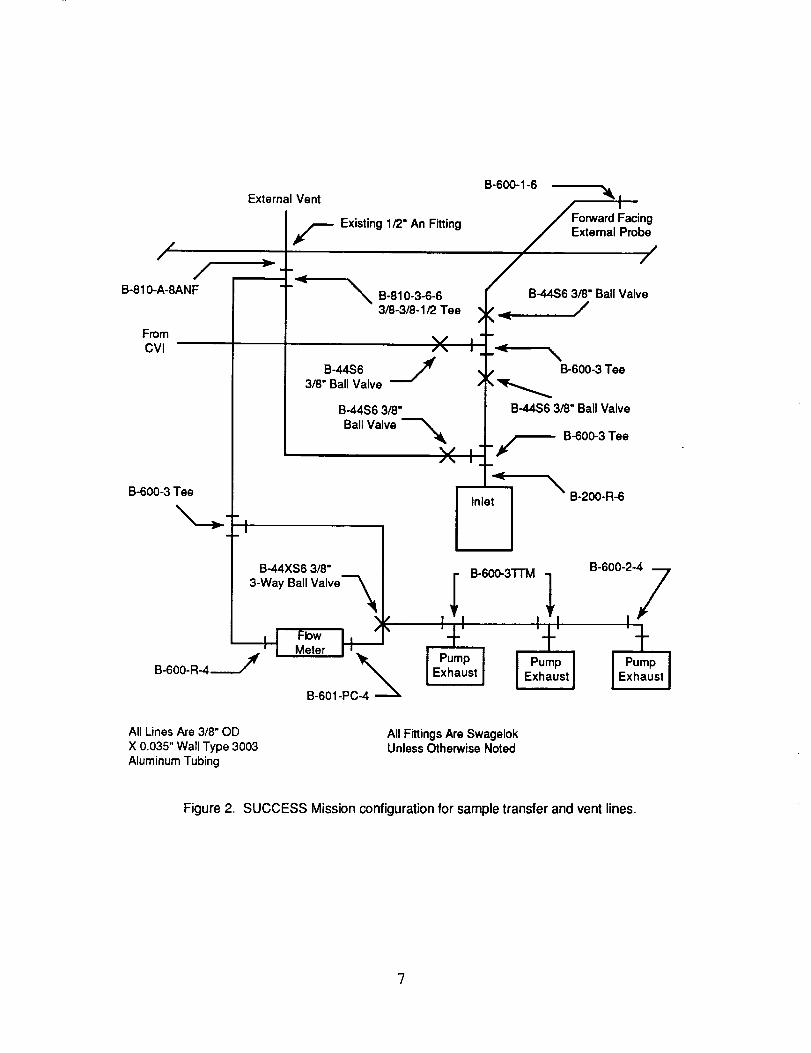
Figure 2 shows the configuration of the DC-8 sample inlet and vent lines. Approximately half of
the 4 L/min air stream was drawn inside the instrument via the particle beam generator for analysis
by the mass spectrometer. The resulting aerosol inlet was far from ideal, operating in a
subisokinetic regime that oversampled larger particles relative to smaller ones [Rader and Marple,
1988]. To a significant degree, this non-ideal aerosol sampling inlet dictated the ultimate lack of
success in acquiring large numbers of chemically interesting, small particles. Rather, the
subioskinetic operation of the probe resulted in primarily very large particles entering the
instrument. Because these large particles were most likely ice particles, our chemical analysis of
these aerosols overwhelmingly and not suprisingly showed only water.
As an alternative to the dedicated aerosol inlet described above, we also had the option of
directing the sample stream from the NCAR counterflow virtual impactor (CVI) [Twohy and
Gandrud, 1998] into our instrument. Although this configuation was used sporatically during the
mission, none of the results presented here were obtained using the CVI inlet. In general, we
observed that aerosols sampled using the CVI inlet did not appear markely different from those
sampled using the dedicated aerosol probe.
PARTICLE BEAM GENERATOR
The second component of the aerosol inlet is the particle beam generator (PBG). The PBG
causes the particles in the sampled air stream to take the form of a beam that ultimately strikes the
heated surface within the ion source of the mass spectrometer. Our PBG design was adapted from
the system developed by Murphy (NOAA, Boulder, Colorado) for direct aerosol sampling from
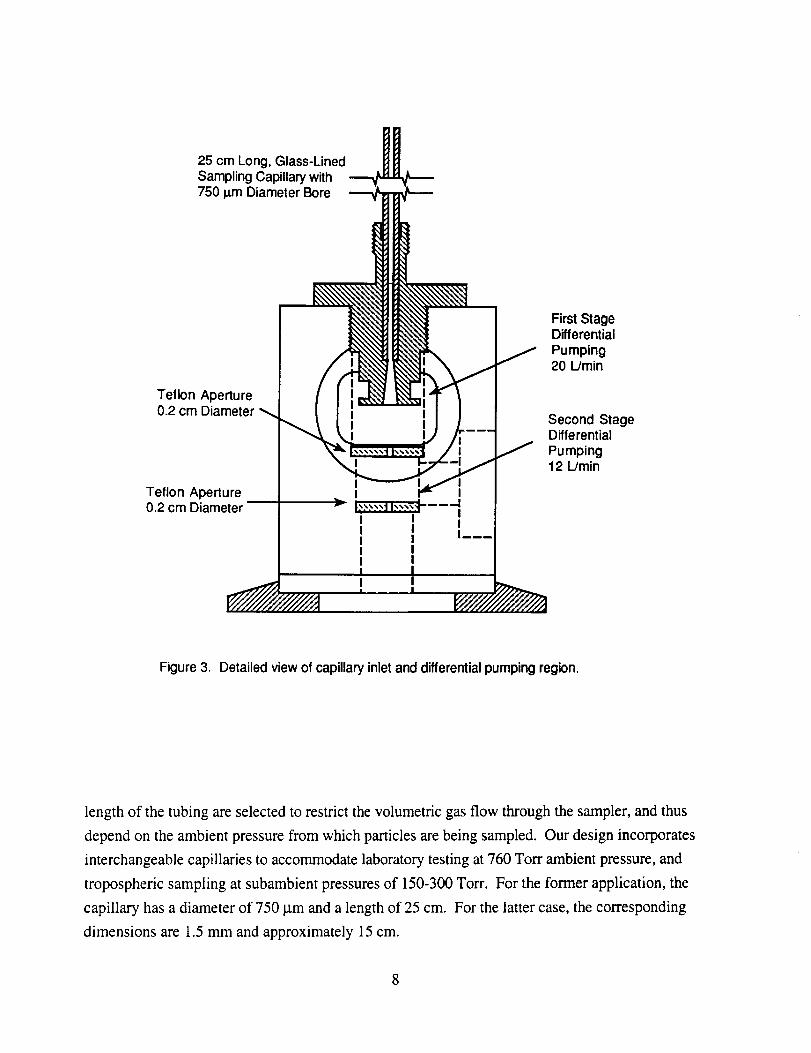
the stratosphere. Figure 3 shows a cross-sectional view of the PBG. This design uses a glass-
lined, stainless steel, capillary to restrict the volumetric gas flow entering the vacuum system, and
to aerodynamically focus the particles near the centerline of the flow. The inner diameter and
6
External Vent
// v.
B-810-A-8ANF
FromCVI
F Existing 1/2" An Fitting
B-600-3 Tee
I
_B-810-3-6-63/8-3/8-1/2 Tee
×B-44S6 j
3/8" Ball Valve
B-44S6 3/8"
Ball Valve
B-44XS6 3/8"
3-Way Ball Valve-'_
Fbw
Meter I'_,_
B-601-PC-4
V
B-600-1-6
Forward Facing
External Probe
,- /
_ B-44S6 3/8" Ball Valve
/
I _ \
_ 8-800-3TeeB-44S6 3/8" Ball Valve
I __ B-600-3TeeI
Ui B-600-3TTM
I I I÷ -
Exhaust Exh
\B-200-R-6
, B-600-2-_
.I I t
'P J I Pump ILust Exhaust I
All Lines Are 3/8" OD
X 0.035" Wall Type 3003Aluminum Tubing
All Fittings Are SwagelokUnless Otherwise Noted
Figure 2. SUCCESS Mission configuration for sample transfer and vent lines.
?
25 cm Long, Glass-Lined _Sampling Capillary with750 p.m Diameter Bore
Teflon Aperture0.2 cm Diameter
Teflon Aperture0.2 cm Diameter
_J
_'_ lY33_.>J 13._3Y._''--MI II II I------
II
Ii I .....
First StageDifferentialPumping20 L/min
Second StageDifferentialPumping12 L/min
Figure 3. Detailed view of capillary inlet and differential pumping region.
length of the tubing are selected to restrict the volumetric gas flow through the sampler, and thus
depend on the ambient pressure from which particles are being sampled. Our design incorporates
interchangeable capillaries to accommodate laboratory testing at 760 Torr ambient pressure, and
tropospheric sampling at subambient pressures of 150-300 Torr. For the former application, the
capillary has a diameter of 750 t.tm and a length of 25 cm. For the latter case, the corresponding
dimensions are 1.5 mm and approximately 15 cm.
8
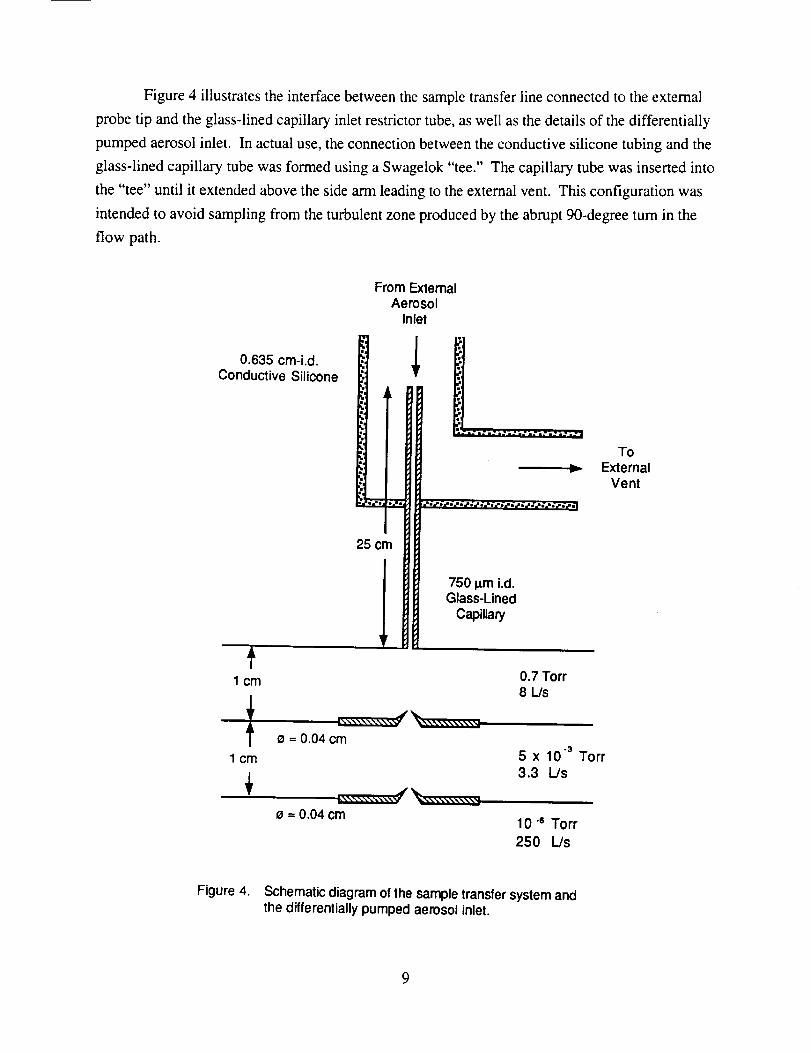
Figure4 illustratestheinterfacebetweenthesampletransferlineconnectedto theexternal
probetip andtheglass-linedcapillaryinletrestrictortube,aswell asthedetailsof thedifferentially
pumpedaerosolinlet. In actualuse,theconnectionbetweentheconductivesiliconetubingandtheglass-linedcapillarytubewasformedusingaSwagelok"tee." Thecapillarytubewasinsertedinto
the"tee" until it extendedabovethesidearmleadingtotheexternalvent. Thisconfigurationwas
intendedto avoidsamplingfrom theturbulentzoneproducedby theabrupt90-degreeturn in theflow path.
0.635 cm-i.d.Conductive Silicone
t1 cm
1 cm
From ExternalAerosol
Inlet
25 cm
l 750 l_m i.d.
Glass-LinedCapillary
0.7 Torr8 I_/s
L\\\\\\\\\\_ _ f _\\\\\\\\\\_ ]
= 0.04 cm
L\\\\\\\"+-\ '_'_I+ _II_\\\\\\\\\\_ I
o = 0.04 cm
-3
5 x 10 Torr3.3 Ws
10 .e Torr
250 L/s
To
ExternalVent
Figure 4. Schematic diagram of the sample transfer system andthe differentially pumped aerosol inlet.
9
Under the typical operating conditions encountered during SUCCESS, a 25 cm length of
750 l.tm in diameter capillary produced a pressure drop of approximately a factor of 200 from an
ambient pressure of 150 Torr to a pressure in the first differential region of 0.7 Torr. The first
differential pumping region was defined by the exit of the capillary and a Teflon disk with a
sampling orifice 0.04 cm in diameter located 1 cm from the capillary. An 8 L/s mechanical pump
was used to remove the excess gas flow from this region. Aerosols and background gas entering
the second differential pumping region again traversed a distance of I cm before encountering a
second Teflon disk with an orifice 0.04 cm in diameter. Pumping in this region was provided by a
3.3 L/s mechanical pump, yielding a typical operating pressure of 5 x 10⁻³ Torr. The overall effect
of the differentially pumped PBG is to significantly enhance the particle/air ratio.
Through the use of a capillary inlet and two stages of differential pumping, the volumetric
gas flow at the exit of the aerosol sampler is reduced by approximately four orders of magnitude,
while a reasonable fraction of the aerosol particles are retained. Recently, other aerosol inlet
designs have been demonstrated based on aerodynamic focusing [Liu et al., 1995]. Although
these new designs provide enhanced aerosol transmission as compared with the one used in our
instrument, how they would function under the conditions encountered during typical DC-8 flights
is not clear.
OPTICAL PARTICLE COUNTER
Upon exiting the second differential pumping region, the aerosol particles pass through the
observation region of an optical particle counter. The OPC used on this instrument is a commercial
device (Vaculaz-2), manufactured by Particle Measuring Systems (PMS, Boulder, Colorado).
This OPC is specifically designed to operate at reduced pressures. The system includes the
vacuum interface module, the sensor module, and the control electronics. The vacuum interface
module, which couples to the exit of the aerosol sampler, contains the necessary optical windows
to admit laser diode radiation from the sensor module and to transmit light scattered from particles
to a photodetector also located in the sensor module. The PBG, the OPC vacuum interface
module, and the electron impact ionization source are all shown diagrammatically in Figure 5 along
with the source region vacuum chamber. The sensor module contains the diode laser, photodiode,
and signal preamplifier. The sensor module is driven by the main electronics module that includes
a microprocessor to determine the particle size based on the intensity of the scattered laser light.
Our Vaculaz system was modified by PMS to provide a very narrow (100 ns) pulse for
each particle that passes through the unit. This pulse is used to trigger the chemical analysis
following a time delay corresponding to the aerosol flight time from the OPC to the vaporization
10
Particle Beam Generator
Optical Particle CounterVacuum Interface
Electron ImpactIonization
!._.___ __/ Source
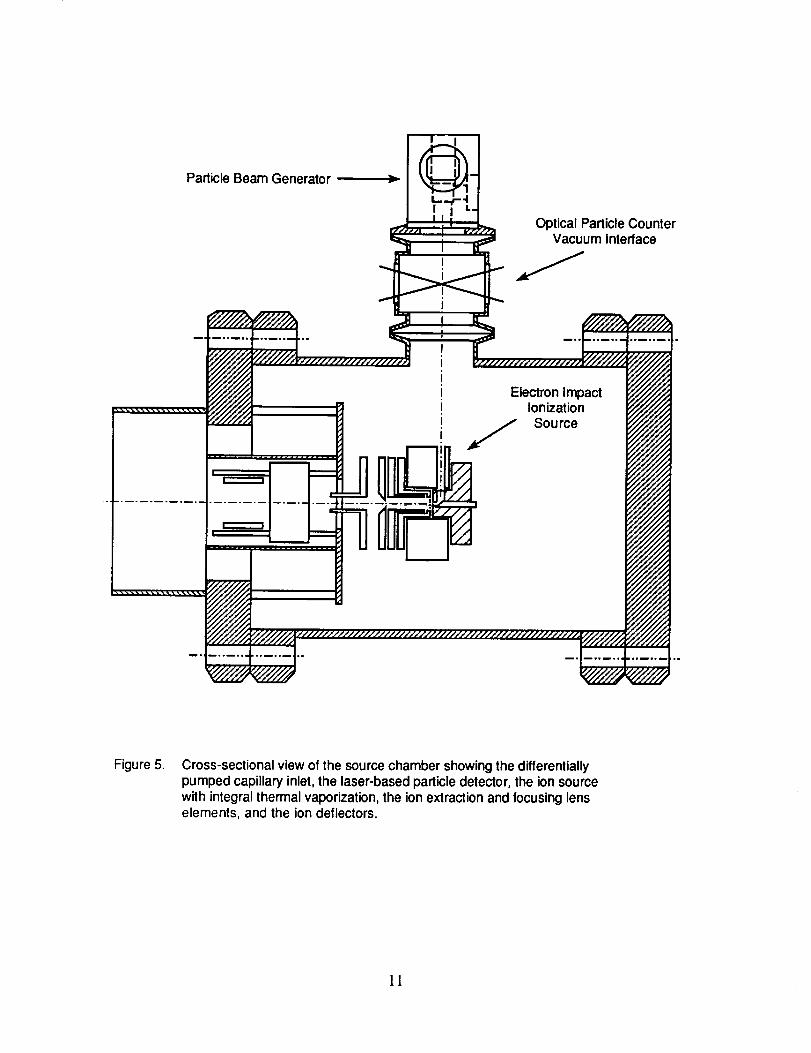
Figure 5. Cross-sectional view of the source chamber showing the differentiallypumped capillary inlet, the laser-based particle detector, the ion sourcewith integral thermal vaporization, the ion extraction and focusing lenselements, and the ion deflectors.
]]
region. In addition to the trigger pulse, we planned to have the Vaculaz provide approximate
aerosol size information based on the magnitude of the scattered light signal. Normally, the
Vaculaz instrument provides four size channels, > 1.0 gm, < 0.50 gm, < 0.35 gm, and a
selectable lower size limit that ranges between 0.20 gm and 0.30 I.tm. Because of the modification
of our unit by PMS to provide the prompt trigger pulse, the four-channel sizing feature did not
function. Instead, the size threshold for which a trigger pulse is generated can be set to two
ranges; particles between 0.20 and 1.0 gm in diameter, and particles greater than 1.0 gm in
diameter.
Particles that pass through the OPC then enter the vacuum chamber, directly above the
electron impact ion source (see Figure 5). Before to installing the ion source, the aerosol inlet and
OPC were temporarily installed onto the vacuum chamber, along with a turbomolecular pump to
evacuate the chamber and two mechanical pumps to evacuate the differentially pumped inlet. The
smaller capillary inlet was installed on the aerosol sampler, and the entire system evacuated after a
grease-covered glass slide was placed in the vacuum chamber at the approximate location of the ion
source. Once the pressure in the system was reduced appropriately, a small amount of
3-gm-diameter sodium fluoresceine powder was introduced into the open end of the capillary.
These particles were entrained in the ambient gas flow, passed through the differential pumping
region and the OPC, and entered the vacuum chamber where they impinged onto the glass slide.
The thin layer of vacuum grease captured the particles, allowing a determination of both the spot
size (3-4 mm diameter) and the location relative to the nominal center line. This information was
used to locate the ion source directly in the path of the particle beam.
AEROSOL VOLATILIZATION
Our instrument uses an indirectly heated, stainless steel surface inclined 45" with respect to
the incident aerosol beam to vaporize the particles. The heated target can be seen in Figure 6,
which depicts the details of the ion source region. Spot welded onto the front of the target surface
are multiple layers of nickel mesh (Buckbee-Meers, Minnesota). The mesh provides numerous
wells, wherein aerosols are trapped, forcing them to undergo multiple collisions with the heated
surfaces. This technique significantly enhances the probability that an aerosol particle
accommodates on the surface long enough to be heated to the nominal target temperature of 600 ° C,
and hence long enough to volatilize. Experiments have shown that at this temperature, most
volatile or semi-volatile particles are vaporized within 0.5 ms. The upper temperature limit of 600"
C was found experimentally to be restricted by the operating limit of the 0.3-cm-diameter cartridge
heater. This temperature is sufficient to volatilize most tropospheric aerosols, with the exception of
refractory materials and elemental carbon (soot) [Smith and O'Dowd, 1996].
12
Attemptsto increasethevolatilizationtemperaturebeyond600° C resultedin failureof the
machinableceramic(Macor)insulatorthatheldtheheater.Becausethisceramicpiecealsoforms
anintegralpartof theionizationsource,its designcouldnotbeeasilyalteredwithouthavingasignificantimpacton theoverallsourcedesign. It shouldbepossible,however,to changethe
sourcedesignto accommodatealargerheaterthatcouldyieldahighervolatilizationtemperature.
Alternatively,theindirectlyheatedvolatilizationmethodcouldbereplacedby adirectlyheated
ribbon-like target[Sinhaet al., 1982; Allen andGould,1981].While thelatterapproachoffers
thepossibilityof achievingvaporizationtemperaturesabove1400° C,ourinitial attemptsto
implementthisapproachresultedin asignificantdistortionof theelectricfieldswithin theion
source,to thepoint whereit wouldnolongerfunctioncorrectly.Hence,thedirectribbonheater
approachwasabandonedin favorof theindirectmethod.It appearsthatwith only amodestamountof additionaleffort,adirectlyheatedribbonvaporizercouldbeincorporatedinto the
presentinstrument,albeitwith amodifiedionsource.
By design,a largeportionof thevaporsproducedduringthevolatilization enter directly
into the ionization region of the instrument. This is apparent in Figure 6 from the close proximity
of the vaporization target to the ionization region located between the two grid structures. The ion
optical axis of the source is also at a 45 ° angle to the volatilization target surface, and hence
perpendicular to the aerosol beam.
Mass Spectrometry
The mass spectrometric requirements of our instrument are modest: an upper mass range
of 500 amu, with unit mass resolution or better. Due to the significantly wider spatial, temporal,
and energy spread of the nascent ions formed by EI as compared to laser ionization, it was
necessary to use an ion mirror, or reflectron-type TOF. A significant improvement in resolution
and signal level was also obtained through the careful design of the ion source itself [Grix et al.,
1989]. Our ion source is based on the design of Wollnik and coworkers at the University of
Giessen, Germany. This source is an electron-impact ion source that operates in a space charge
mode. Because of the high electron density within the ionization volume, a negative space charge
well is generated that traps any positive ions formed. The nominal trapping time is many tens of
milliseconds. A combined extraction and ion bunching scheme is then used to produce a narrow
ion burst of-10 ns duration. As a result of the ion bunching, however, the ion burst has a wide
energy spread (typically 100 eV). The use of a reflecting ion mirror provides sufficient energy
compensation to achieve the required resolution. Once extracted, the ions are spatially focused and
deflected so as to enter the flight tube in line with the entrance to the ion mirror.
13
Ion exit
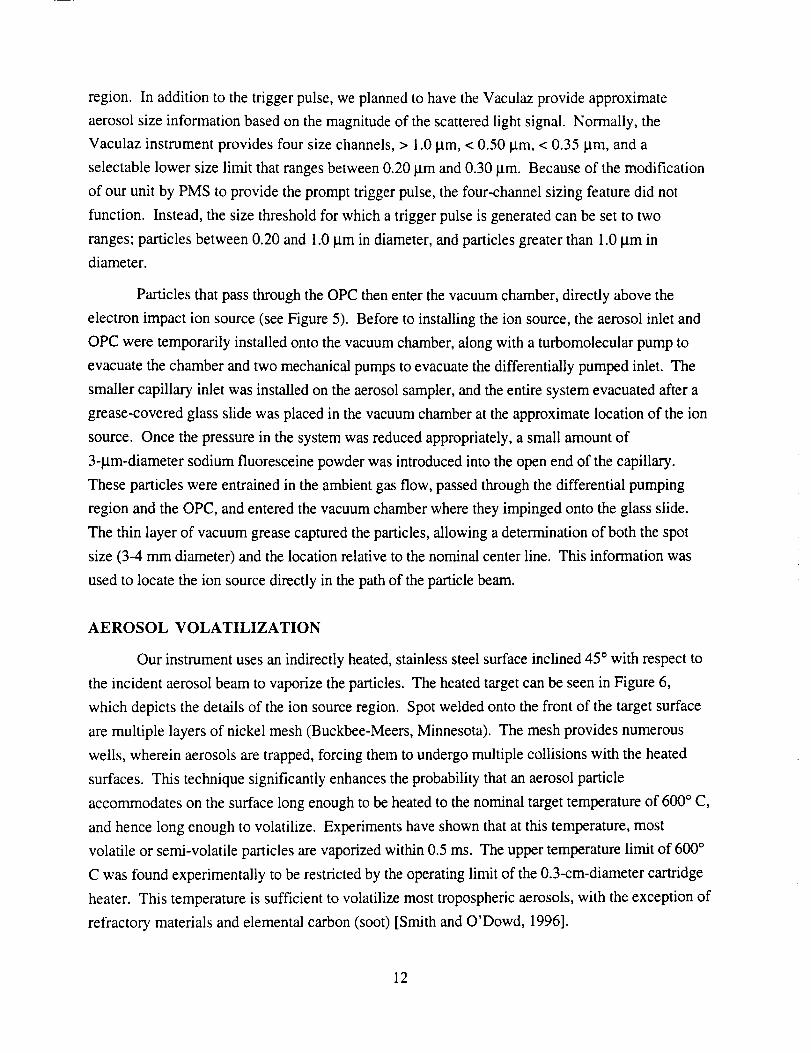
Figure 6.
Aerosol Inlet
G1 _ G4
_ Cartridge
_ Volatilization
_ Target
Cross-sectional view of the electron impact ionization source as modifiedto allow aerosol particles to impinge upon the indirectly heated volatilization surface.
The electrode namingconventionfollows that of Wollnik[Grixet al., 1989].
Electron Impact Ion Source
The ion source chamber shown in Figure 5 is pumped by a 250 L/s turbomolecular pump.
All source components are fabricated either from stainless steel, alumina, Teflon, Vespel, or
Macor. In operation, the potentials on the various source elements are adjusted to produce a
negative space-charge well between the two electrodes, G2 and G4. Within this small volume,
positive ions are formed by 70-eV electron impact and temporarily trapped by the negative well.
Not shown in Figure 6 are the two filaments used to generate the intense electron ionization beam.
The filaments are located on either side of the source (above and below the plane of Figure 6) with
the electrons entering the ionization volume through small slits in the region between electrodes G2
and G4. The electron beams are focused using pairs of small permanent magnets (-300 Gauss)
positioned near the filaments. In addition, a pair of small repeller electrodes is located on either
side of each filament to further enhance the flux of electrons entering the ionization region. Only
one filament is used at any given time, with the other filament assembly biased to act as a collector
for monitoring the electron (trap) current. The trapping efficiency and duration are functions of the
well strength (depth), local pressure, and most importantly, the local ion density.
14
We chosethis ion sourcedesignasbasedon twoof its majorcharacteristics:its high
ionizationefficiencyascomparedwith moreconventionalEl sources,anditsability to trapnascentpositiveionsonamillisecondtimescale.Theformercharacteristicisof obviousbenefitwhen
dealingwith avery limited(neutral)samplesize,aswouldbeproducedby thevolatilizationof a
submicronparticle.Thelattercharacteristicis importantin thepresentapplicationbecausethe
volatilizationprocesscanoccuroveravariabletimeperiodof upto onemillisecond.In a
conventionalEI source,ionsformedfromapulseof neutralsproducedoverthis timeperiodtime
wouldbelostunlesstheywereejectedfromthesourcebypulsingit rapidly (10kHz or faster).
Suchrapidpulsingis possible,however,it hasthedisadvantageof yieldingmanyspectra,eachof
whichexhibitspoorion statisticsdueto therelativelylow numberof ionsin eachpulse.Moreover,evenwhenpulsedrapidly,asignificantnumberof ionswill notbeextractedand
detecteddueto thelackof electrostaticcontainmentwithin thesourceduringthetimebetween
extractionpulses.Conversely,theGiesendesignallowsthemajorityof ionsformedduringthefull vaporizationperiodto bestoredwithin thesourceandextractedtogetherin a singleion packet.
Thetotalnumberof ionsin eachextractedpacketis thushigher,producingamassspectrumof
higherstatisticalquality.
Duringoperation,thevoltagesappliedto electrodesG1,G2,andG3aremaintainedat
fixed, optimalvalues.Whenwewanttorecordamassspectrum,thepotentialonG4 ispulsed
positiveby 200V to repelionsfrom thesource.Thedurationof thisextractionpulseis typically
100ns,with very sharplydefinedrisingandfallingedgestomaintainthehightemporalresolution
neededto achieveacorrespondinglyhighmassresolution.Themagnitudeanddurationof thispulseis enoughto extractessentiallyall of theionsfrom thesourcein a singleionpacket.As soon
asthepotentialonG4 returnsto its quiescentlevel,ionsimmediatelybeginfilling thenowempty
volumedefinedby electrodesG2andG4.
Althoughtheabovecitedadvantagesof thissourcearecriticalfor maximizingthesignal
levelsproducedfromthelimitedamountof neutralvaporresultingfrom theaerosolvaporization,
theyalsoleadto aseriouslimitation in instrumentoperation.As notedabove,thetrappingtime
andefficiencyarelargelydeterminedbythenumberof ionswithin thetrappingvolume. As the
trappingregionfills withpositiveions,theybeginto effectivelyneutralizethetrappingpotential,
which in turnallowsthemoreenergeticionsto escapefromthetrap. As theion densityincreases
further,theresultingpositivespacechargewill beginto activelyrepelionsfrom theregion.
Giventhesizeof thetrappingregion,thestaticelectrodepotentials,andthetypicalelectronflux, onecanestimatethattheregioncanholdapproximately104to 105ionsbeforethespace
chargeeffectsbeginto influencethesourceoperation.If theseionswereonly associatedwith the
vaporizedaerosolmolecules,thenonewouldnotanticipatemuchlossin sensitivityasthetrap
15
beganto fill, becausetheexpectedyield from a0.5gm aerosolin ontheorderof 105ions.
Unfortunately,however,thetrappingregionis alwaysfilled with positiveionsformedbyionizationof thebackgroundvaporsthatarepresentwithin thesourcevolume. Thus,whenan
aerosolparticleisvaporizedandthenascentneutralmoleculesenterthesourcevolumeandbecome
ionized,theymustdisplacethebackgroundionsalreadywithin thetrappingregion. Althoughthis
ion displacementcananddoesoccur,it isequallylikely thatthedesiredsignalionsarisingfromthe
aerosolvaporswill bedisplacedby theundesirablebackgroundions. Theneteffectof thisaction
is to limit boththedynamicrangeof thesourceandthesignal-to-backgroundratio.
Thedynamicrangelimitationimposedbytheion sourcedesigncanbeunderstoodbyestimatingthesignallevelsassociatedwith anaerosolparticlewhosebulkcompositioniswater
with aminorconstituent(say1%by weight)of ammoniumsulfate.Thenumberof neutralwater
moleculesproducedby vaporizationof a0.5gmdiameterparticle,for example,is ontheorderof
2 x 10⁹,andthecorrespondingnumberof ionsproducedby this sourcewouldbeapproximately
105. Theliteraturesuggeststhatthevaporizationof aqueousaerosolparticlesinitially produces
watervaporfollowedby vaporsof theminorcomponents.Becauseof thespace-chargeimposedlimit of 105ionsin thetrappingregion,theinitial productionof ionsfromwatervaporwould fill
thetrappingregionandeffectivelypreventthestorageof ammoniumsulfateions. Therefore,althoughthe 1%ammoniumsulfateconstituentcouldpotentiallygenerate103ionsfrom 2x 10⁷
vaporizedneutralmolecules,theactualnumberof ammoniumsulfateionsthatwould remain
trappedcouldbesubstantiallyless.Furthermore,becausetheextentof thisdiscriminationdueto
space-chargeeffectsis stronglydependenton thelocalneutralvapordensity,thediscrimination
wouldvarywith thecube(volume)of theparticlesize.
Time-of-Flight Mass Spectrometer
The mass spectrometer includes the flight tube, the ion mirror ("reflectron"), and the
detector. The latter three components were purchased as a commercial unit from the R. M. Jordan
Company, Grass Valley, California. The flight tube is a 61 cm long, 20 cm in diameter stainless
steel chamber evacuated by a 250 L/s turbomolecular pump. The pressure under operating
condition is 10 -7 Torr. Ions entering the flight tube from the source chamber travel the length of
the flight tube in a field-free region before entering a two-grid ion mirror. Potentials on the ion
mirror cause the ions to decelerate, stop, reverse direction, and reaccelerate toward the detector.
The detector is a dual, microchannel plate (MCP), electron multiplier with a 50 _ terminated
electron collector. The signal from the collector is fed directly into the analog-to-digital converter
where it is digitized to generate the arrival time spectrum.
16
Duringlaboratorycalibration,wecouldroutinelyobservecharacteristicmassspectraof
singlepolystyrenelatexparticleswithdiametersof 0.482Itm. Basedonthemagnitudeof theobservedion signals,weestimatedthatfully vaporizedparticleswithdiametersdownto
approximately0.25Itm couldbedetectedabovethebackgroundlevel,althoughthiswasnot
verifiedexperimentallybeforedeployment.Subsequentpost-flighttestsshowedthis lowerlimit to
betrue,at leastfor polystyrenelatexparticles.Becausewe lackedtheability to dynamicallysize
laboratory-generatedparticles,wecouldnotverify thelowersizelimit for anyotherparticlecomposition.
DATA ACQUISITION SYSTEM
Giventhefixed ion flight pathandanominalion energyof 1.7keV, andthedesiredmass
rangeof 500amu,ananalog-to-digitalconverter(ADC) speedof 500MHz is required.This
capabilityisprovidedbya DA500AADC (Signatec,Inc.Corona,California). Thisunit plugsinto
anIBM-compatiblecomputer,andprovides8-bit digitizationwith256kB of localdatastorage.
Oncetriggeredby thedataacquisitionsequence(seebelow),theADCacquires32,768datapoints
at 2 ns intervals,thuscoveringarrival timesup to 64Its, andrequiring32kB of datastoragespace.Custominstrumentcontrolsoftwarewasresponsiblefor transferringtherawspectraldata
from theDA500Alocalstorageandstoringtheresultsin adisk file alongwith selectedinstrument
andflight parameters.Theformerincludedtheoperatingpressuresin theaerosolinlet, andthevaporizationtemperature,while thelatterincludedlocation,altitude,_andtruegroundspeedas
suppliedby theDC-8 datanetwork.
The8-bit digitizationprovidedbytheDA500AADCyieldsamaximumsignaldynamic
rangeof only 1partin 256. In reality,aconstantnoiselevelof severalADC"counts"reducesthe
usabledynamicrangeto lessthan2 ordersof magnitude.Thenetresultof this limitation is thatin
orderto observethesmallsignalscorrespondingto chemicallyinterestingspeciespresentatlow
levelsin bulk water,therawsignalmustbeamplifieduntil theformersignalsaredetectable,resultingin the lattersignalexceedingtheavailabledynamicrangeof theADC. As will beapparent
in therawdatashownbelow,theion signalsassociatedwith thebulk waterisoff scaleasaresult
of this limited dynamicrange.Havingthewatersignalexceedtheinputrangeof theADCdoesnot
precludeits massidentification;however,it makesanyquantitationof theparticlecomposition
impossible.Moreover,theintegratedion signalisno longerdirectlyrelatedto theparticlevolume,
andhencecannotbeusedto provideasizeestimate.
Currently,all ADCsabove250MHz arelimitedto 8-bits,soonly threeoptionsare
availableto mitigatethelimiteddynamicrange:(1) therawsignalcanbedirectedthrougha
logarithmicamplifier(log amp);(2)multiplearrivaltimespectracanberecordedandaveraged;and
17
(3) two digitizerscanbeoperatedinparallel,eachwithadifferentinputgain. Thelog ampapproachextendstheeffectivedynamicrangeattheexpenseof linearity.Transformingthedatabackinto a linearscalecanproduceundesirabledistortionin themeasuredintensities.Theaddition
of anamplifierto thesignalpathalsointroducespossibleelectronicnoiseandunwantedelectrical
interference.Nonetheless,thisapproachhasbeenusedby others[MurphyandThomson,1995].
Signalaveragingunderoursingleparticledetectionconditionsisnotstraightforwardowing to thevery limitedtimeduringwhichvapors,andhenceions,areavailablefor measurement.Our
detectionelectronicsdid incorporatea"burstmode"featurewherebyasingleOPCtriggerpulse
would initiate 16sequentialdigitizationevents,eachof 64 Itsduration.Thetotaldigitizedsequenceof I mscorrespondsto theexpectedwidthof thevaporizationevent,sothatsummation
of the 16separatearrival timespectrawouldbejustifiedandmightbeexpectedto yieldanimprovementof afactorof 4 in thesignal-to-backgroundratio.
Laboratorytests,however,did notshowanoticeableimprovementin thesignal-to-
backgroundratio,possiblybecauseof acombinationof otherfactors,includingtheinherent
nonlinearityof the ion sourceanddistortionof therawsignalamplitudeproducedby theMCPs
whenexposedto arapidsequenceof very intenseionbursts.Becausetheburstmodeapproach
offerednosignificantadvantage,andresultedinamuchslowerdataacquisitionrate(particlesper
second),it wasnotusedduringtheSUCCESSmission.Theuseof paralleldigitizersoffersthepossibilityof achievinganeffectivedynamicrangeof 12-to 13-bits.Takingintoaccountthenoise
backgroundandslighterrorsinvolvedin addingtogetherthetwoproperlyscaledspectra,a
dynamicrangeof 4000-to-1is possible.Thethreedrawbacksto thisapproachare:(1) costof an
additionalADC ($6,500);(2)addedprocessingtimeto addtherawspectrain realtime,ordouble
thedatastoragespacefor postprocessedspectra;and(3) therawsignalmustbesplit evenlyusing
a properlyterminated,1:150_ pulsedividersothateachresultingsignalpulseis attenuatedby50%. We haverecentlyimplementedthelatterapproachinour laboratory,andwehave
demonstratedasignificantimprovementin theoveralldynamicrangeof theinstrument.
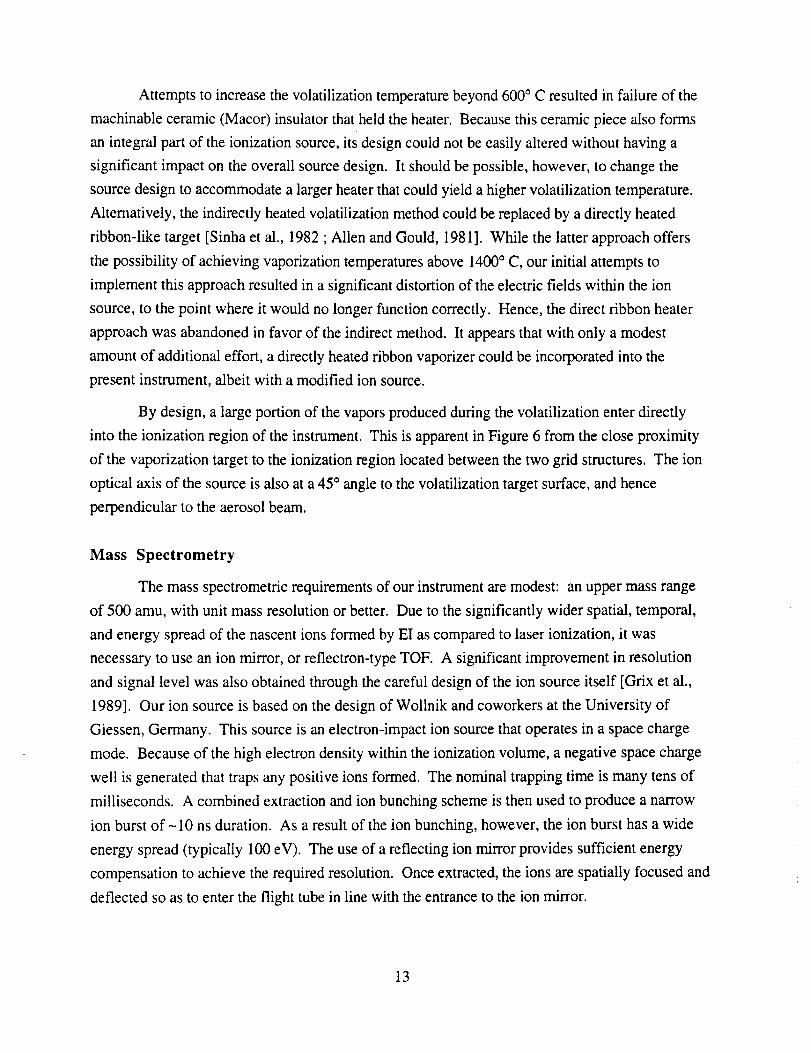
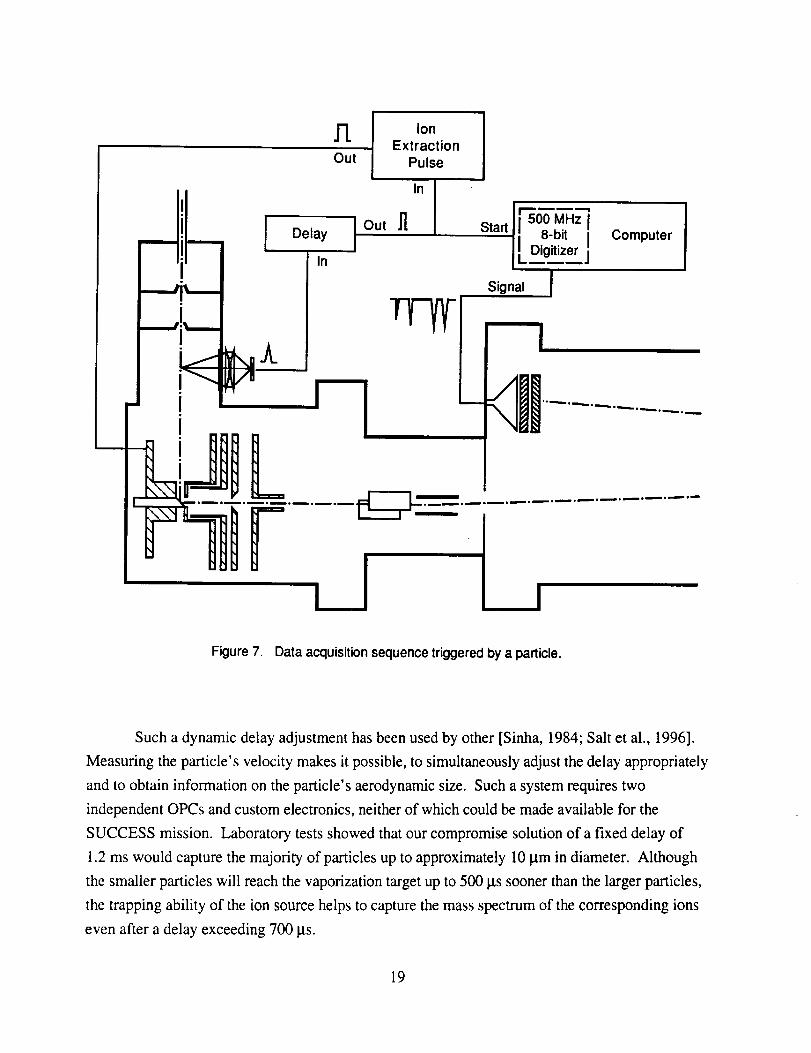
Figure7 showsthesequenceof eventsthatresultsin theacquisitionof aparticlemass
spectrum.Thesequencebeginswith thetriggerpulsegeneratedby theOPCasaresultof particle
passingwithin its viewingwindowthatexceedsitspresetthresholdsize. Thispulseis usedto
triggera delaygeneratorwhoseoutputis asingle,narrowpulsedelayedfromthetriggerpulseby a
fixed timeof 1.2ms. This timecorrespondsto theaveragetransittimeof anaerosolparticlefrom
theOPCto thevaporizationtarget.In practice,this timewill varywith thesizeof theparticleand
shouldbeadjusteddynamicallybasedonsomeindependentmeasureof theparticlevelocity.
18
lil Delay
In
TLOut
IOut
Ion
ExtractionPulse
In
J]Start d
Signal
500 MHz i
8-bit 1DigitizerComputer
,o • •
Figure 7. Data acquisition sequence triggered by a particle.
Such a dynamic delay adjustment has been used by other [Sinha, 1984; Salt et al., 1996].
Measuring the particle's velocity makes it possible, to simultaneously adjust the delay appropriately
and to obtain information on the particle's aerodynamic size. Such a system requires two
independent OPCs and custom electronics, neither of which could be made available for the
SUCCESS mission. Laboratory tests showed that our compromise solution of a fixed delay of
1.2 ms would capture the majority of particles up to approximately 10 Itm in diameter. Although
the smaller particles will reach the vaporization target up to 500 its sooner than the larger particles,
the trapping ability of the ion source helps to capture the mass spectrum of the corresponding ions
even after a delay exceeding 700 its.
19
Theoutputpulsefrom thedelaygeneratorsimultaneouslytriggersthesourceextraction
pulseappliedto G4 andinitiatesanalog-to-digitalconversion.Thispulse,therefore,represents"time zero"of thearrival timespectra.If asecondparticlearriveswithin theOPCbeforethe
completearrivaltimespectrumfromthepreviousparticlehasbeenrecordedandtransferredto a
disk file, its triggerpulseis ignored,andit generatesnodata.However,the"missed"particlestillimpactsthevaporizationtargetandthusproducesaburstof bothneutralmoleculesandionswithin
theion sourceregion. Theseadditionalneutralandion specieswill notaffectsubsequentparticle
spectraaslongasthereisenoughtimeto removethemfromthesourcebydiffusion(neutrals)andby thefinite trappingtime (ions).Thesetimesareon theorderof I to 2 ms,sothatthemaximumparticlearrivalratethatcanbeaccommodatedisbetween500and1000s-1.
DC-8 INTEGRATION
The SRI-developed instrument was completed on schedule to begin the DC-8 integration in
March, 1996, prior to the SUCCESS mission. A number of engineering problems arose during
the integration, related primarily to the weight and turning moment of the instrument. As originally
configured, the time-of-flight mass spectrometer was mounted on the top of a NASA medium rack,
with the support electronics below, and the three mechanical vacuum pumps on the base of the
rack. This configuration exceeded the allowable turning moment for a medium rack, so the
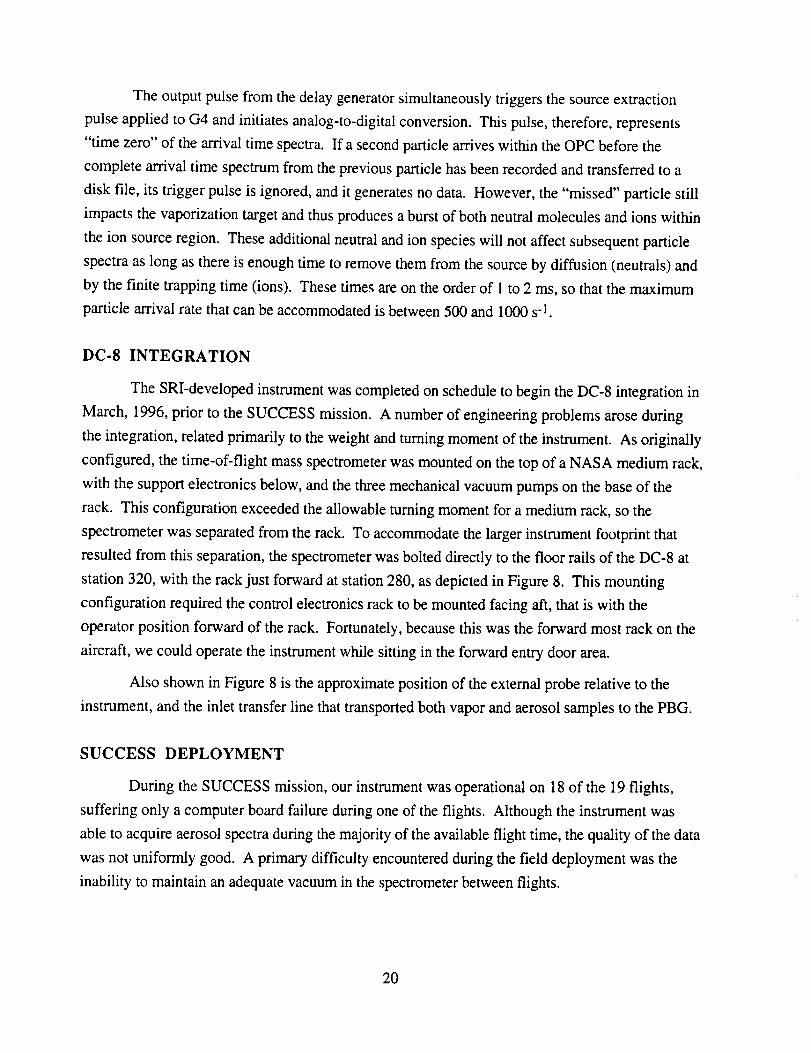
spectrometer was separated from the rack. To accommodate the larger instrument footprint that
resulted from this separation, the spectrometer was bolted directly to the floor rails of the DC-8 at
station 320, with the rack just forward at station 280, as depicted in Figure 8. This mounting
configuration required the control electronics rack to be mounted facing aft, that is with the
operator position forward of the rack. Fortunately, because this was the forward most rack on the
aircraft, we could operate the instrument while sitting in the forward entry door area.
Also shown in Figure 8 is the approximate position of the external probe relative to the
instrument, and the inlet transfer line that transported both vapor and aerosol samples to the PBG.
SUCCESS DEPLOYMENT
During the SUCCESS mission, our instrument was operational on 18 of the 19 flights,
suffering only a computer board failure during one of the flights. Although the instrument was
able to acquire aerosol spectra during the majority of the available flight time, the quality of the data
was not uniformly good. A primary difficulty encountered during the field deployment was the
inability to maintain an adequate vacuum in the spectrometer between flights.
20
Exit
280
300
320
Medium Rack
Figure 8. Relative position of the electronics rack and vacuum chamber as installed on the DC-8.
Between flights, power was not continuous]y available on the DC-8, and hence our
vacuum pumps could not be operated for extended periods of time. During those periods when the
pumps could not be operated, the vacuum within the mass spectrometer rose from the typical base
pressure of 5 × 10⁻⁸ Torr to 100 mTorr, or greater, depending on the length of time without
pumping. As a result of this pressure rise, water vapor accumulated on the two microchannel plate
detectors used to measure the ion signal. Although water vapor itself does not damage the
microchannel plates, it must be removed before applying the high voltage required for plate
operation. Normally, this removal process requires 10-12 hours of continuous exposure to a high
vacuum. Unfortunately, with the typical DC-8 operational schedule, we were only able to evacuate
the instrument for 1-2 hours before beginning measurements on a flight. As a result of this
reduced pumping time, the microchannel plate detectors steadily lost sensitivity over the first half
of the deployment such that much of the data acquired during those missions was not usable.
21
As soon as time was available, we changed the microchannel plates and restored the
instrumental sensitivity. At the same time, we made several modifications to the vacuum system
and our operating procedures to minimize the pressure rise between flights. These measures were
at least partially successful, so that data from the remaining flights was of an acceptable quality.
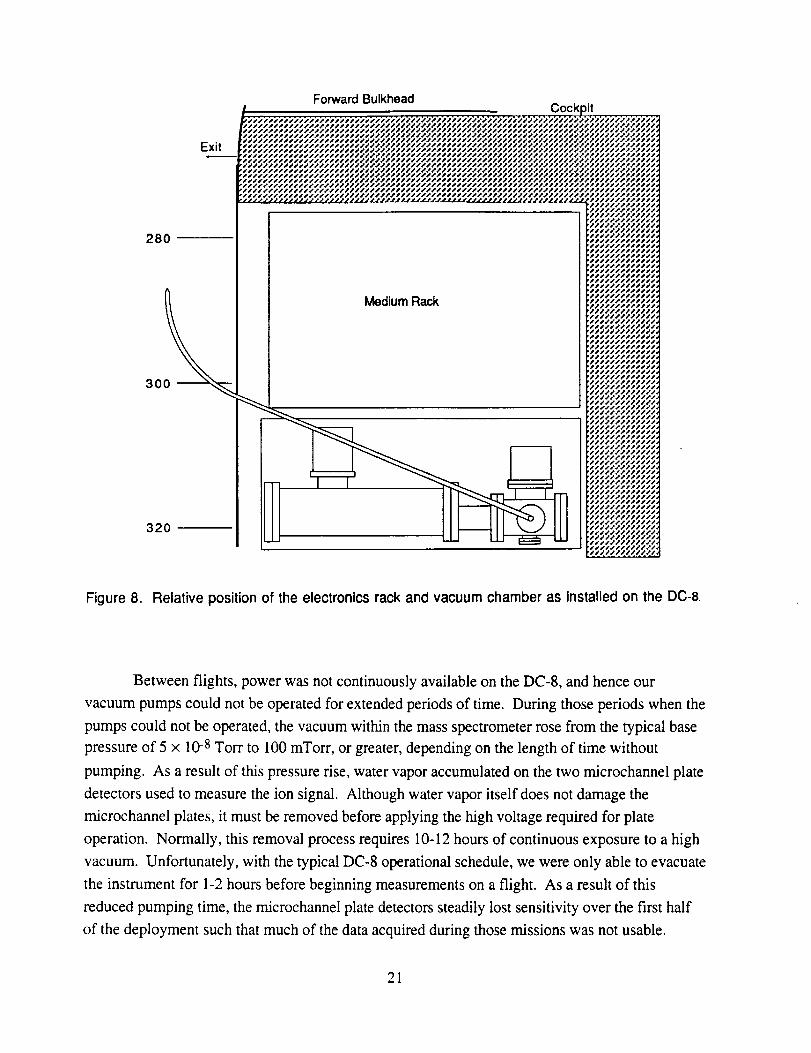
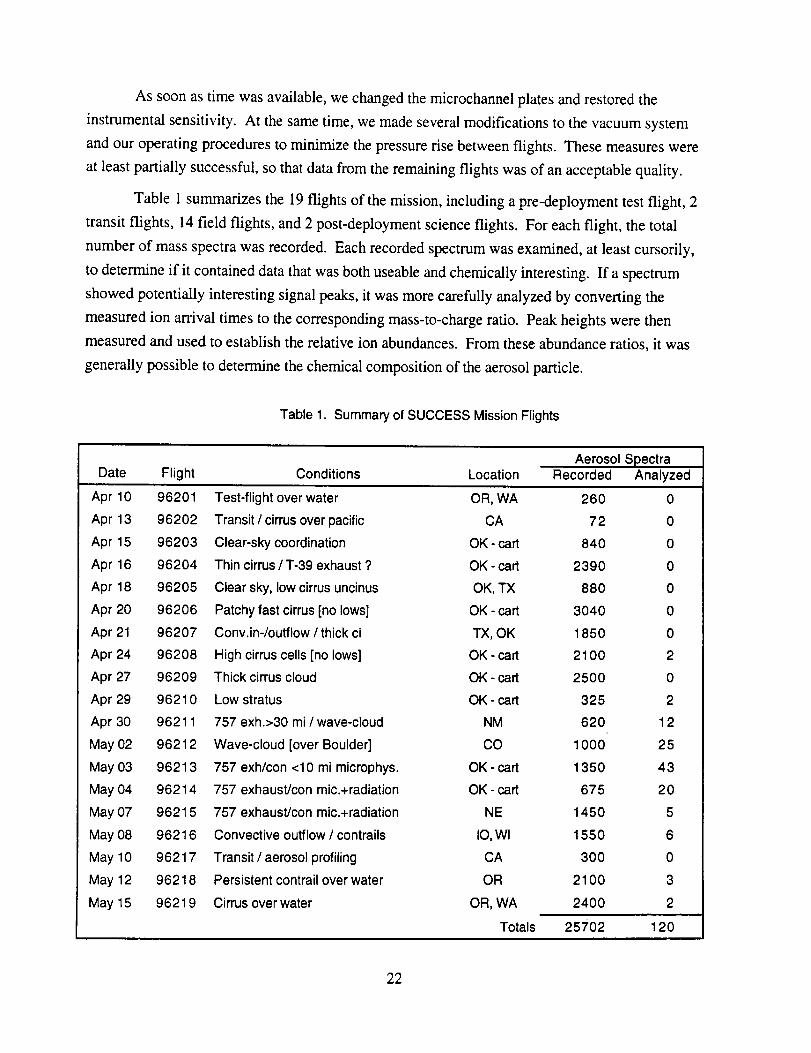
Table 1 summarizes the 19 flights of the mission, including a pre-deployment test flight, 2
transit flights, 14 field flights, and 2 post-deployment science flights. For each flight, the total
number of mass spectra was recorded. Each recorded spectrum was examined, at least cursorily,
to determine if it contained data that was both useable and chemically interesting. If a spectrum
showed potentially interesting signal peaks, it was more carefully analyzed by converting the
measured ion arrival times to the corresponding mass-to-charge ratio. Peak heights were then
measured and used to establish the relative ion abundances. From these abundance ratios, it was
generally possible to determine the chemical composition of the aerosol particle.
Table 1. Summary of SUCCESS Mission Flights
Aerosol SpectraDate Flight Conditions Location Recorded Analyzed
Apr 10 96201 Test-flight overwater OR, WA 260 0
Apr 13 96202 Transit !cirrus over pacific CA 72 0
Apr 15 96203 Clear-sky coordination OK- cart 840 0
Apr 16 96204 Thin cirrus / T-39 exhaust ? OK - cart 2390 0
Apr 18 96205 Clear sky, low cirrus uncinus OK, TX 880 0
Apr 20 96206 Patchy fast cirrus [no lows] OK - cart 3040 0
Apr 21 96207 Conv.in-/outflow / thick ci TX, OK 1850 0
Apr 24 96208 High cirrus cells [no lows] OK- cart 2100 2
Apr 27 96209 Thick cirrus cloud OK- cart 2500 0
Apr 29 96210 Low stratus OK- cart 325 2
Apr 30 96211 757 exh.>30 mi / wave-cloud NM 620 12
May 02 96212 Wave-cloud [over Boulder] CO 1000 25
May 03 96213 757 exh/con <10 mi microphys. OK - cart 1350 43
May 04 96214 757 exhaust/con mic.+radiation OK- cart 675 20
May 07 96215 757 exhaust/con mic.+radiation NE 1450 5
May 08 96216 Convective outflow / contrails IO,Wl 1550 6
May 10 96217 Transit / aerosol profiling CA 300 0
May 12 96218 Persistent contrail over water OR 2100 3
May 15 96219 Cirrus over water OR, WA 2400 2
Totals 25702 120
22
SUCCESS RESULTS
Of the more than 25,000 aerosol mass spectra obtained during the 19 SUCCESS mission
flights, approximately 8,100 were more closely examined. These spectra were chosen based on
two criteria: (1) a normally functioning instrument with good sensitivity and (2) an integrated ion
intensity that was significantly above the average. The former criterion eliminated data obtained
when the instrument was not producing quantifiable data due to an operational problem described
above. The latter criterion allowed us to rapidly sort through the raw data and identify those
spectra that likely contained chemically interesting results.
The examined spectra were classified as to their likely chemical composition based on the
observed ions, their distribution, and their relative intensities. Of the 8,100 spectra included in the
evaluation, 120 were found to have significant ion intensities associated with materials other than
water. All of the remaining spectra showed only evidence of water, with no significant other
chemical species apparent above the background. The distribution of chemical compositions that
were assigned to these 120 aerosol particles is: sulfate 60%, carbonate 13%, nitrate 6%, sodium
4%, potassium 1%, sulfuric acid 9%, and unassigned 6%. In many cases, the counter-ion could
also be inferred from the mass spectra. For example, the majority of sulfate aerosols were
ammonium sulfate, while the carbonate aerosols appeared to be both ammonium(bi) carbonate and
calcium carbonate. We saw no evidence for particles containing mixtures of chemical species,
such as ammonium sulfate and nitrate.
Several typical examples of the mass spectra of chemically identified aerosol particles are
shown below to illustrate the nature of the recorded data. More detailed information on each of the
analyzed mass spectra is included in the SUCCESS mission data archive, as well as on the CD-
ROM produced by NASA Ames Research Center [Gains and Hipskind, 1997].
The majority of chemically interesting aerosol particles were measured on four consecutive
flights beginning on May 2 (96212) and continuing until May 7, 1996 (96215). Tables 2-5
summarize the aerosol characterization data for each of these flights, including the aerosol type as
determined by examination of the mass spectra, the time at which the data was recorded, and the
aircraft position at that time as provided by the DC-8 flight data archive. Appendices A-D show all
of the chemically interesting mass spectra for these four flights, along with a tabular summary of
the intensities for the most important ion species in each spectrum.
Based on visual observation, less than 1% of the measured particle spectra were collected
in clear air, and this included none of the chemically interesting spectra. All of the remaining
spectra were recorded while traversing clouds in the middle and upper troposphere.
23
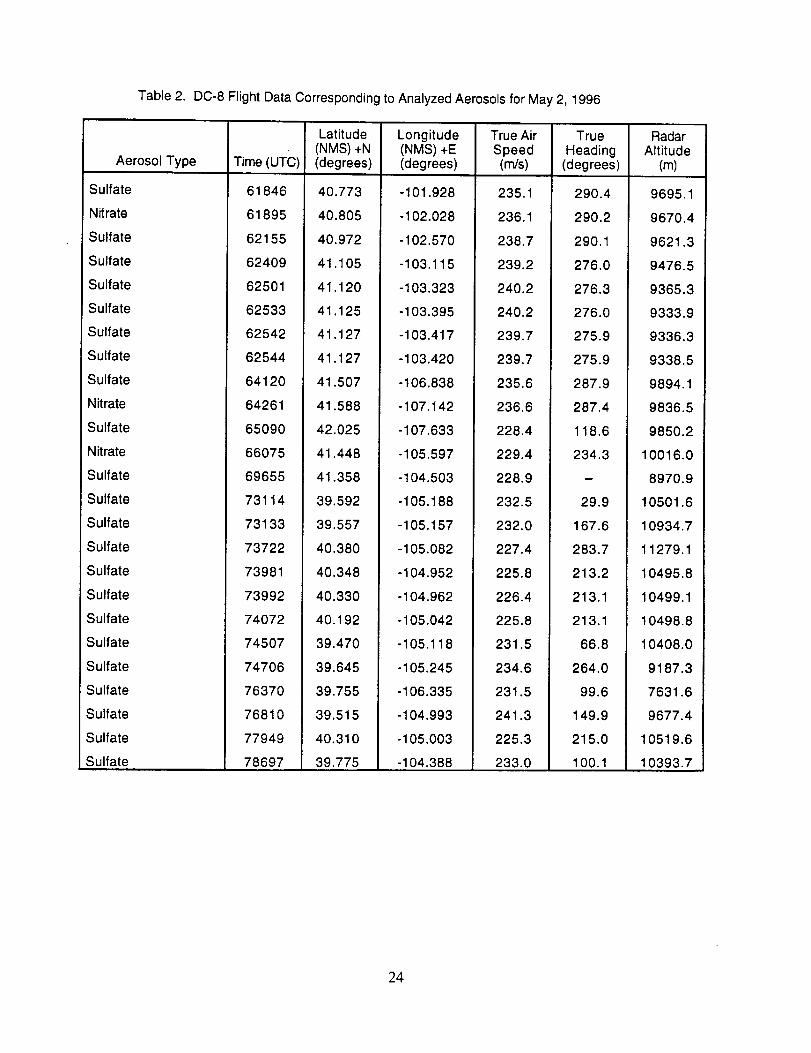
Table 2. DC-8 Flight Data Corresponding to Analyzed Aerosols for May 2, 1996
Aerosol Type
Sulfate
Nitrate
Sulfate
Sulfate
Sulfate
Sulfate
Sulfate
Sulfate
Sulfate
Nitrate
Sulfate
Nitrate
Sulfate
Sulfate
Sulfate
Sulfate
Sulfate
Sulfate
Sulfate
Sulfate
Sulfate
Sulfate
Sulfate
Sulfate
Sulfate
Time (UTC)
61846
61895
62155
62409
62501
62533
62542
62544
64120
64261
65090
66075
69655
73114
73133
73722
73981
73992
74072
74507
74706
76370
76810
77949
78697
Latitude(NMS) +N(degrees)
40.773
4O.8O5
40.972
41.105
41.120
41.125
41.127
41.127
41.507
41.588
42.025
41.448
41.358
39.592
39.557
40.380
40.348
40.330
40.192
39.470
39.645
39.755
39,515
40.310
39.775
Longitude(NMS) +E(degrees)
-101.928
-102.028
-102.570
-103.115
-103.323
-103.395
-103.417
-103.420
-106.838
-107.142
-107.633
-105.597
-104.503
-105.188
-105.157
-105.082
-104.952
-104.962
-105.042
-105.118
-105.245
-106.335
-104.993
-105.003
-104.388
True AirSpeed(m/s)
235.1
236.1
238.7
239.2
240.2
24O.2
239.7
239.7
235.6
236.6
228.4
229.4
228.9
232.5
232.0
227.4
225.8
226.4
225.8
231.5
234.6
231.5
241.3
225.3
233.0
TrueHeading
(degrees)
290.4
290.2
290.1
276.0
276.3
276.0
275.9
275.9
287.9
287.4
118.6
234.3
29.9
167.6
283.7
213.2
213.1
213.1
66.8
264.0
99.6
149.9
215.0
100.1
RadarAltitude
(m)
9695.1
9670.4
9621.3
9476.5
9365.3
9333.9
9336.3
9338.5
9894.1
9836.5
9850.2
10016.0
8970.9
105O1.6
10934.7
11279.1
10495.8
10499.1
10498.8
10408.0
9187.3
7631.6
9677.4
10519.6
10393.7
24
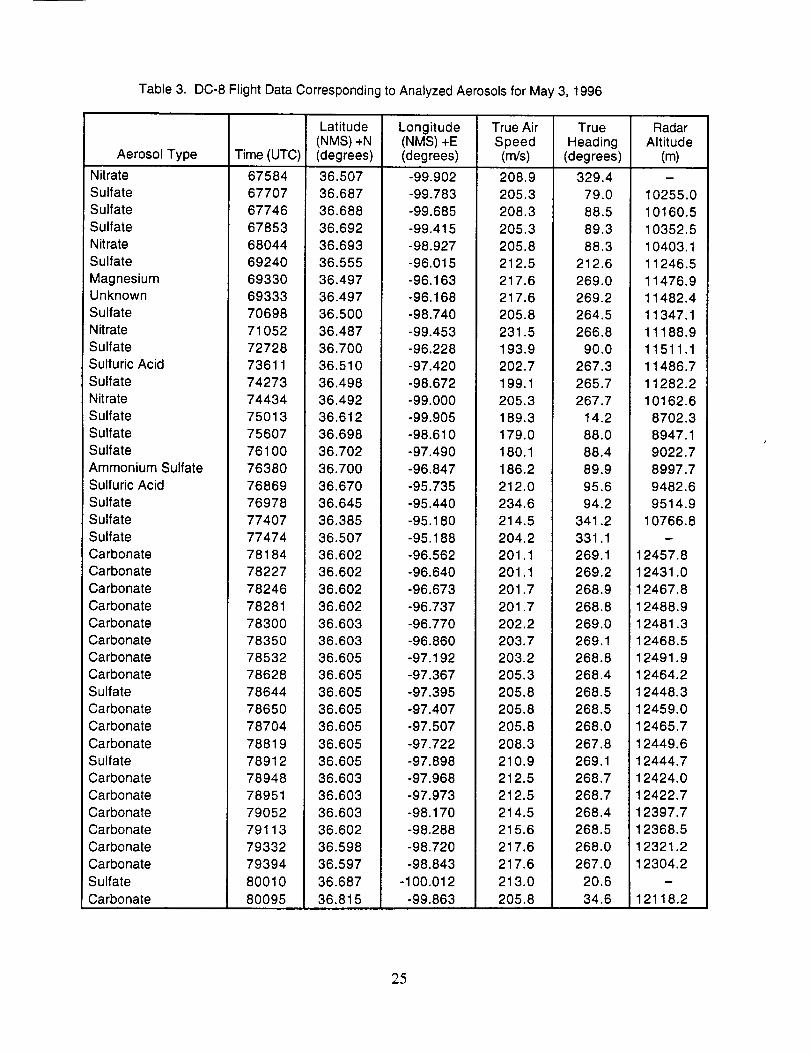
Table3. DC-8FlightDataCorrespondingtoAnalyzedAerosolsforMay3, 1996
AerosolTypeNitrateSulfateSulfateSulfateNitrateSulfateMagnesiumUnknownSulfateNitrateSulfateSulfuricAcidSulfateNitrateSulfateSulfateSulfateAmmoniumSulfateSulfuricAcidSulfateSulfateSulfateCarbonateCarbonateCarbonateCarbonateCarbonateCarbonateCarbonateCarbonateSulfateCarbonateCarbonateCarbonateSulfateCarbonateCarbonateCarbonateCarbonateCarbonateCarbonateSulfateCarbonate
Time(UTC)67584677076774667853680446924069330693337069871052727287361174273744347501375607761007638076869769787740777474781847822778246782817830078350785327862878644786507870478819789127894878951790527911379332793948001080095
Latitude(NMS)+N(degrees)36.50736.68736.68836.69236.69336.55536.49736.49736.50036.48736.70036.51036.49836.49236.61236.69836.70236.70036.67036.64536.38536.50736.60236.60236.60236.60236.60336.60336.60536.60536.60536.60536.60536.60536.60536.60336.60336.60336.60236.59836.59736.68736.815
Longitude(NMS)+E(degrees)-99.902-99.783-99.685-99.415-98.927-96.015-96.163-96.168-98.740-99.453-96.228-97.420-98.672-99.000-99.905-98.610-97.490-96.847-95.735-95.440-95.180-95.188-96.562-96.640-96.673-96.737-96.770-96.860-97.192-97.367-97.395-97.407-97.507-97.722-97.898-97.968-97.973-98.170-98.288-98.720-98.843
-100.012-99.863
TrueAirSpeed(m/s)
208.9205.3208.3205.3205.8212.5217.6217.6205.8231.5193.9202.7199.1205.3189.3179.0180.1186.2212.0234.6214.5204.2201.1201.1201.7201.7202.2203.7203.2205.3205.8205.8205.8208.3210.9212.5212.5214.5215.6217.6217.6
213.0205.8
TrueHeading
(degrees)
329.479.088.589.388.3
212.6269.0269.2264.5266.8
90.0267.3265.7267.7
14.288.088.489.995.694.2
341.2331.1269.1269.2268.9268.8269.0269.1268.8268.4268.5268.5268.0267.8269.1268.7268.7268.4268.5268.0267.0
20.6
34.6
RadarAltitude
(m)i
10255.010160.51O352.510403.111246.511476.911482.411347.111188.911511.111486.711282.210162.6
8702.38947.19022.78997.7
9482.69514.9
10766.8
12457.812431.012467.812488.912481.312468.512491.912464.212448.312459.012465.712449.612444.712424.012422.712397.712368.512321.212304.2
D
12118.2
25
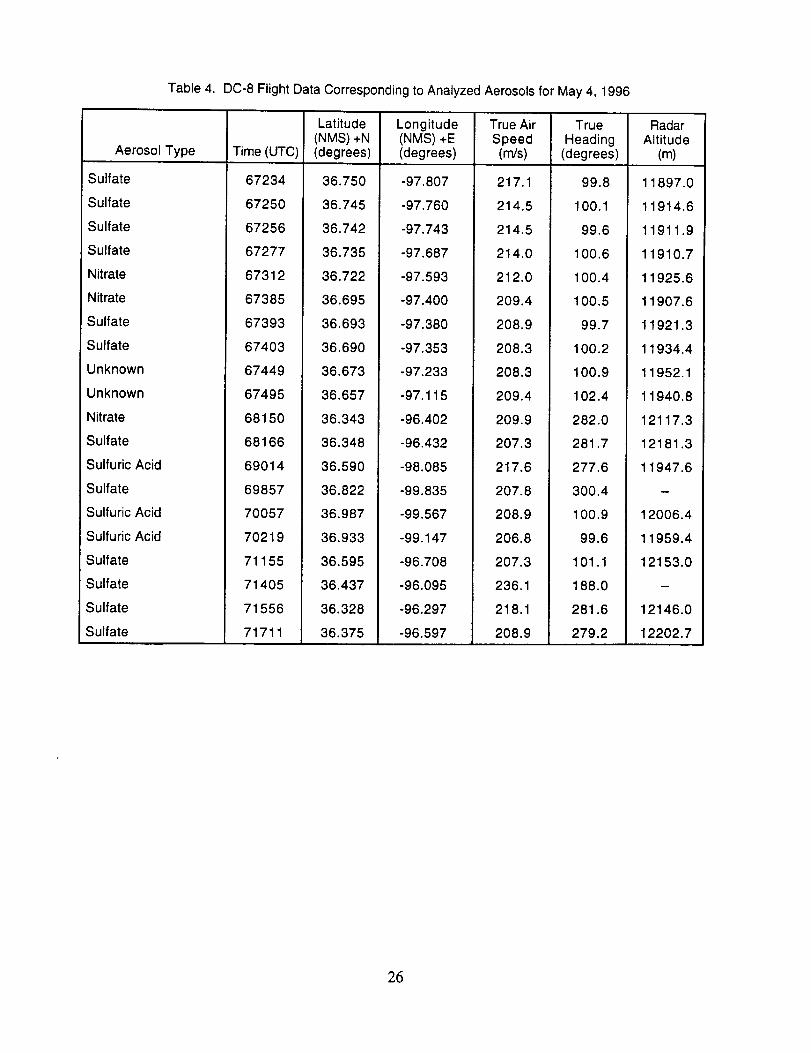
Table 4. DC-8 Flight Data Corresponding to Analyzed Aerosols for May 4, 1996
Aerosol Type
Sulfate
Sulfate
Sulfate
Sulfate
Nitrate
Nitrate
Sulfate
Sulfate
Unknown
Unknown
Nitrate
Sulfate
Sulfuric Acid
Sulfate
Sulfuric Acid
Sulfuric Acid
Sulfate
Sulfate
Sulfate
Sulfate
Time (UTC)
67234
67250
67256
67277
67312
67385
67393
67403
67449
67495
68150
68166
69014
69857
70057
70219
71155
71405
71556
71711
Latitude(NMS) +N(degrees)
Longitude(NMS) +E(degrees)
True AirSpeed(m/s)
36.750
36.745
36.742
36.735
36.722
36.695
36.693
36.690
36.673
36.657
36.343
36.348
36.590
36.822
36.987
36.933
36.595
36.437
36.328
36.375
-97.807
-97.760
-97.743
-97.687
-97.593
-97.400
-97.380
-97.353
-97.233
-97.115
-96.402
-96.432
-98.085
-99.835
-99.567
-99.147
-96.708
-96.095
-96.297
-96.597
217.1
214.5
214.5
214.0
212.0
209.4
208.9
208.3
208.3
209.4
209.9
207.3
217.6
207.8
208.9
206.8
207.3
236.1
218.1
208.9
TrueHeading
(degrees)
99.8
100.1
99.6
1OO.6
100.4
100.5
99.7
100.2
100.9
102.4
282.0
281.7
277.6
300.4
100.9
99.6
101.1
188.0
281.6
279.2
RadarAltitude
(m)
11897.0
11914.6
11911.9
11910.7
11925.6
11907.6
11921.3
11934.4
11952.1
11940.8
12117.3
12181.3
11947.6
w
12006.4
11959.4
12153.0
m
12146.0
12202.7
26
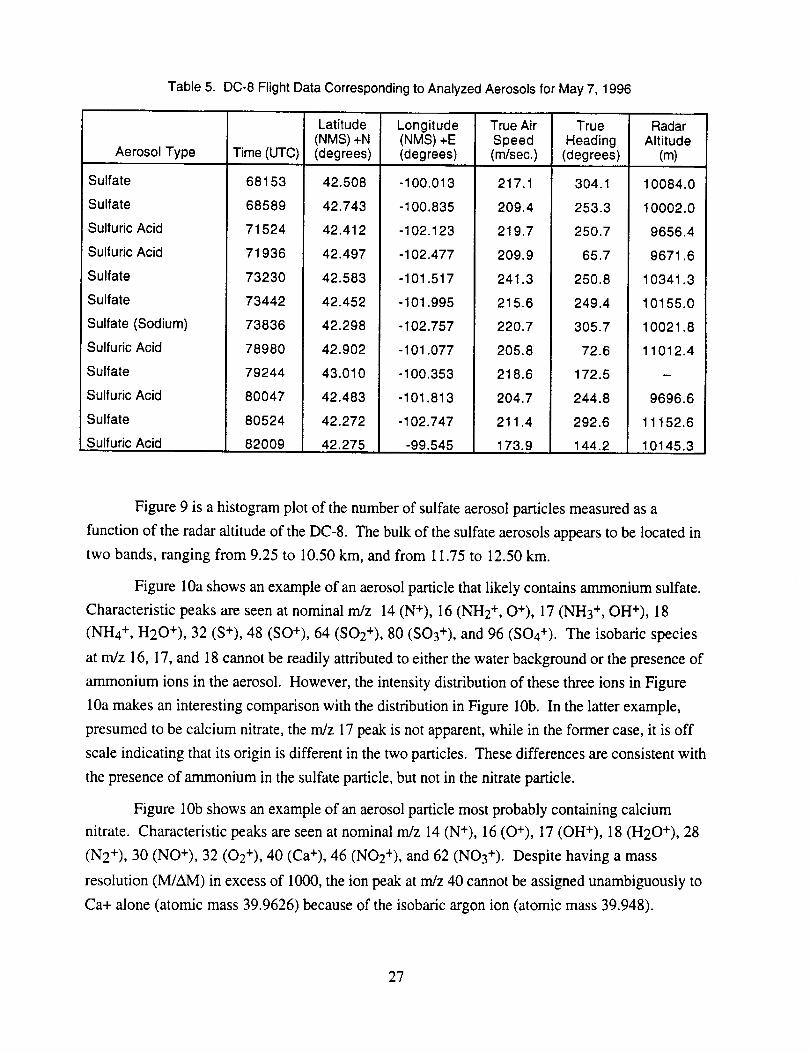
Table 5. DC-8 Flight Data Corresponding to Analyzed Aerosols for May 7, 1996
Aerosol Type
Sulfate
Sulfate
Sulfuric Acid
Sulfuric Acid
Sulfate
Sulfate
Sulfate (Sodium)
Sulfuric Acid
Sulfate
Sulfuric Acid
Sulfate
Sulfuric Acid
Time (UTC)
68153
68589
71524
71936
73230
73442
73836
78980
79244
80047
80524
82009
Latitude(NMS) +N(degrees)
42.5O8
42.743
42.412
42.497
42.583
42.452
42.298
42.902
43.010
42.483
42.272
42.275
Longitude(NMS) +E(degrees)
-100.013
-100.835
-102.123
-102.477
-101.517
-101.995
-102.757
-101.077
-100.353
-101.813
-102.747
-99.545
True AirSpeed(m/sec.)
217.1
209.4
219.7
209.9
241.3
215.6
220.7
205.8
218.6
204.7
211.4
173.9
TrueHeading
(degrees)
304.1
253.3
250.7
65.7
250.8
249.4
305.7
72.6
172.5
244.8
292.6
144.2
RadarAltitude
(m)
10084.0
10002.0
9656.4
9671.6
10341.3
10155.0
10021.8
11012.4
9696.6
11152.6
10145.3
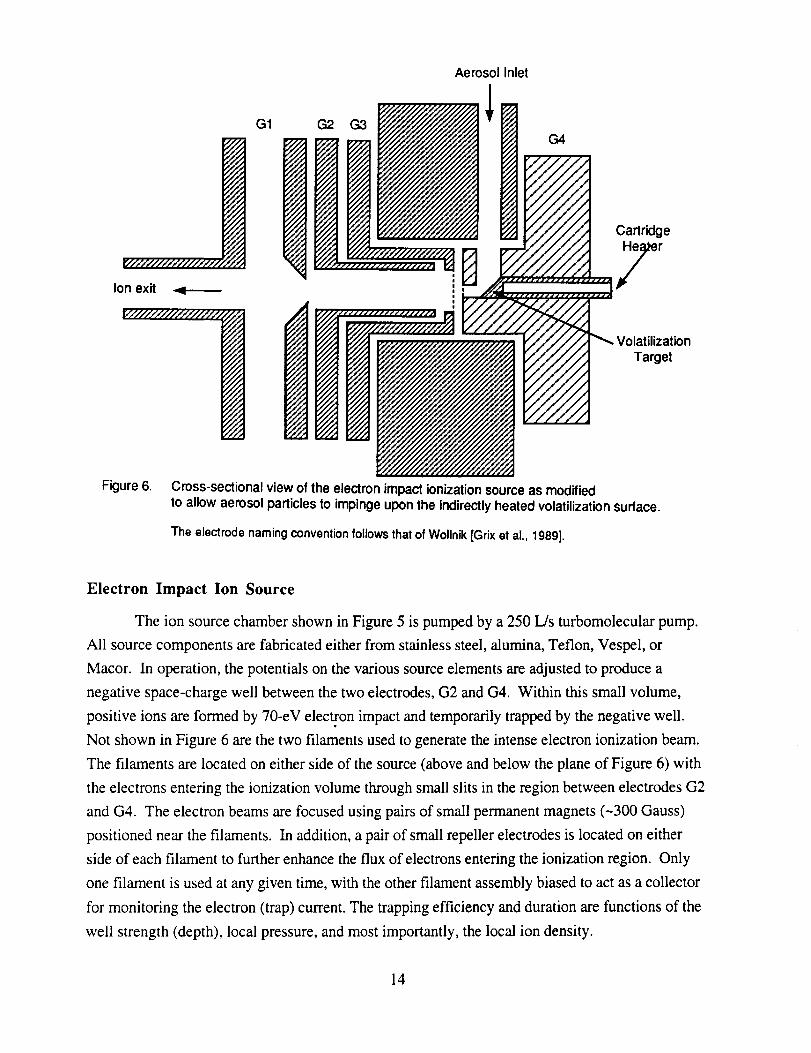
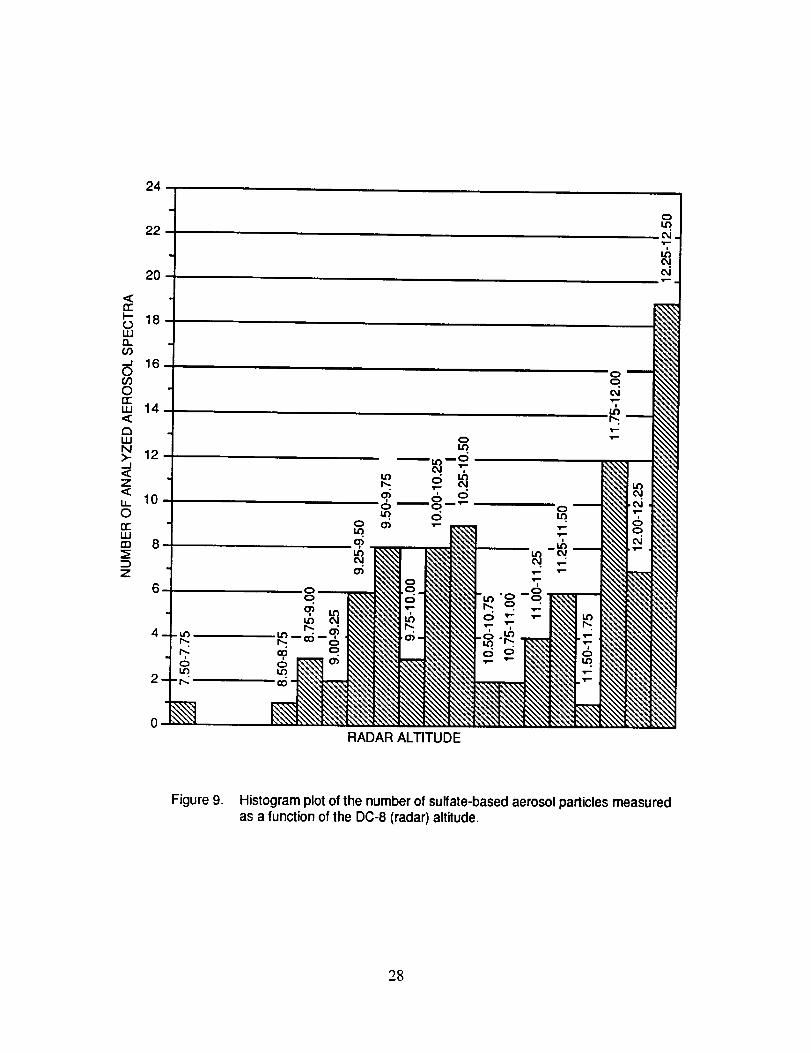
Figure 9 is a histogram plot of the number of sulfate aerosol particles measured as a
function of the radar altitude of the DC-8. The bulk of the sulfate aerosols appears to be located in
two bands, ranging from 9.25 to 10.50 kin, and from 11.75 to 12.50 kin.
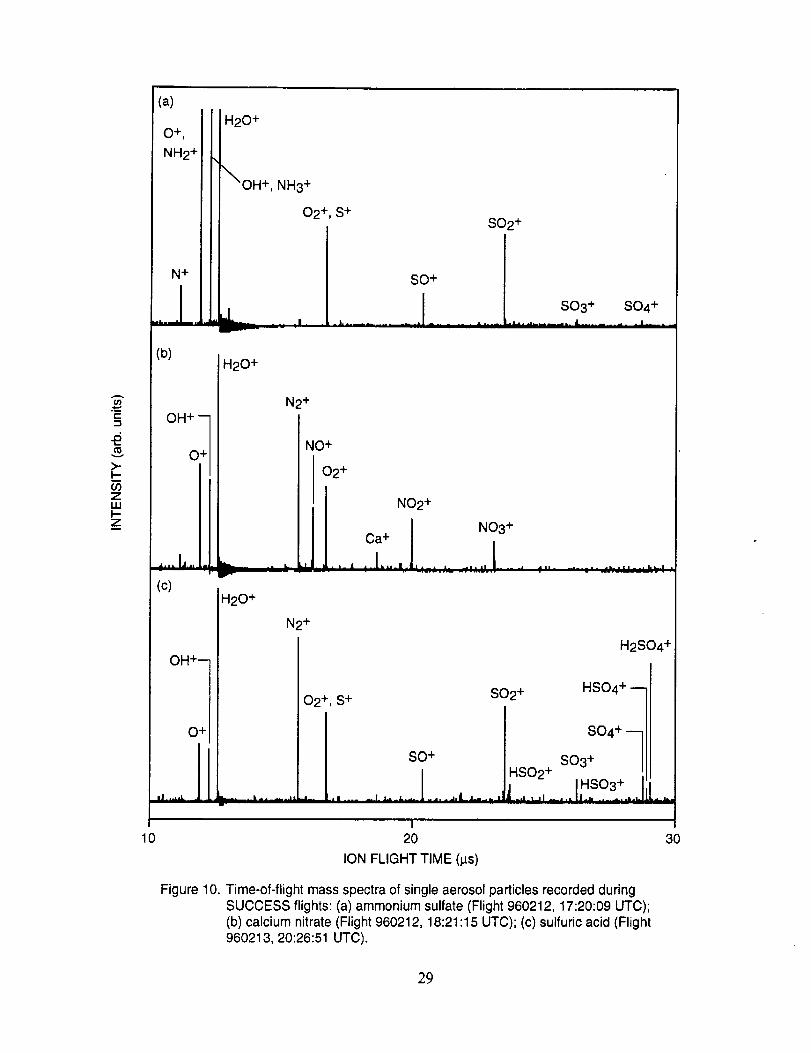
Figure 10a shows an example of an aerosol particle that likely contains ammonium sulfate.
Characteristic peaks are seen at nominal m/z 14 (N+), 16 (NH2 +, O+), 17 (NH3 +, OH+), 18
(NH4 +, H20+), 32 (S+), 48 (SO+), 64 (SO2+), 80 (SO3+), and 96 (SO4+). The isobaric species
at m/z 16, 17, and 18 cannot be readily attributed to either the water background or the presence of
ammonium ions in the aerosol. However, the intensity distribution of these three ions in Figure
10a makes an interesting comparison with the distribution in Figure 10b. In the latter example,
presumed to be calcium nitrate, the m/z 17 peak is not apparent, while in the former case, it is off
scale indicating that its origin is different in the two particles. These differences are consistent with
the presence of ammonium in the sulfate particle, but not in the nitrate particle.
Figure 10b shows an example of an aerosol particle most probably containing calcium
nitrate. Characteristic peaks are seen at nominal m/z 14 (N+), 16 (O+), 17 (OH+), 18 (H20+), 28
(N2+), 30 (NO+), 32 (O2+), 40 (Ca+), 46 (NO2+), and 62 (NO3+). Despite having a mass
resolution (M/AM) in excess of 1000, the ion peak at ngz 40 cannot be assigned unambiguously to
Ca+ alone (atomic mass 39.9626) because of the isobaric argon ion (atomic mass 39.948).
27
24-
n-i-ow0_o3_.1Oo3On"W
1:3WN>....J<Z,<
LI..
On"wO3
Z
22
2O
18
16
14
12
10
8-
=
4=
.
O°
oq
14'3 ¢klr-:. o_
-D-.
N
om.
oo
"T
m.
e_ "2,
_. c_ _- _ 6
o
N NNRADAR ALTITUDE
Figure 9. Histogram plot of the number of sulfate-based aerosol particles measuredas a lunction of the DC-8 (radar) altitude.
28
t-
u(/3ZLLII--Z
(a)
O + ,
NH2 +
N +
m
(b)
OH + --
0 +
H20 +
_OH+,NH3 +
O2+,S +
,,Lm , - -_ =m.
H20+
N2+
.... I_.... I,,_ .....r
(c)H20 +
N2 +
OH +-
mJ....,dL .
0 +¸
m-
S02 +
SO+
ISO3 + SO4 +
NO+
02 +
]1 NO2 +
Ca+ J Ni3+• __l& L|_I. -I • -- • a- _| • am ..... •
411 ......... |.,Ira -., i,L_I *
H2SO4 +
I
O2+, S+ SO2+ HSO4+ ql
SO +HSO2 + SO3+ .
..... L.... J IHSO3 "" hi.... • ...... I_ ..,m,l L.._. ) -a_LJI .... !i.1, ..... ml.,-ILL,, ,.
10I
2O
ION FLIGHT TIME (Its)
Figure 10 Time-of-flight mass spectra of single aerosol particles recorded duringSUCCESS flights: (a) ammonium sulfate (Flight 960212, 17:20:09 UTC);(b) calcium nitrate (Flight 960212, 18:21:15 UTC); (c) sulfuric acid (Flight960213, 20:26:51 UTC).
3O
29
Separation of these ions would require a mass resolution in excess of 2,500. However, because
this spectrum was obtained in a single scan, the m/z 40 intensity due to background argon would
be very much lower than observed here.
The characteristic spectral pattern in Figure 10a is very similar to spectra of ammonium
sulfate aerosols measured in the laboratory, both with regard to the ion species present, and their
relative intensity ratios. In general, the mass spectra of aerosols generated in the laboratory by
nebulizing a dilute aqueous solution of the calibrant showed peak ratios that were constant to
within +10%, while the absolute peak intensities varied by an order of magnitude. The later
variation likely resulted from the variation in aerosol size. The ion species of particles classified as
sulfate observed in all mass spectra recorded during SUCCESS were essentially the same as those
shown in Figure 10a.
Figure 10c shows an example of what appears to be an aerosol particle containing a
significant amount of sulfuric acid. This particle was sampled in the wake of the NASA 757 at a
separation distance of 5-10 km, corresponding to a plume age of 1 min. In fact, most, if not all of
the aerosol particles tentatively assigned as sulfuric acid were sampled under similar conditions,
lending support to the theory that they were formed in the engine exhaust. The spectra in
Figure 10c show characteristic peaks at nominal m/z 16 (O+), 17 (OH+), 18 (H20+), 28 (N2+),
32 (O2 +, S+), 48 (SO+), 64 (SO2+), 65 (HSO2+), 80 (SO3+), 81 (HSO3+), 96 (SO4+), 97
(HSO4÷), and 98 (H2SO4+).
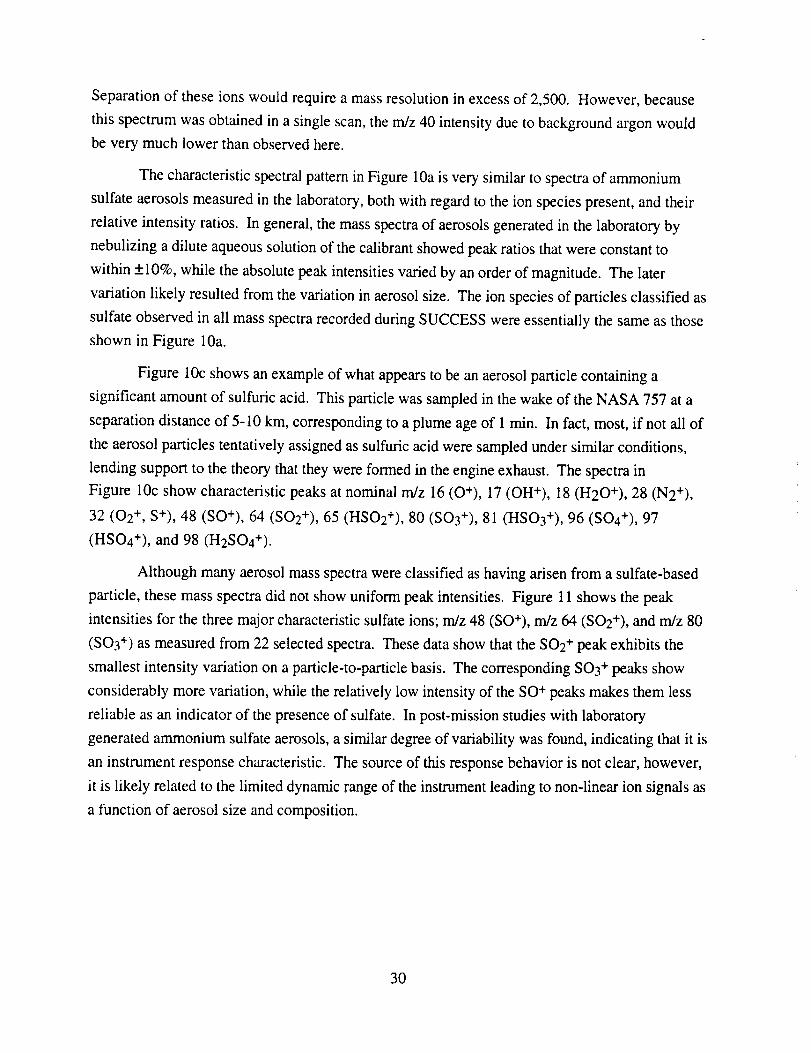
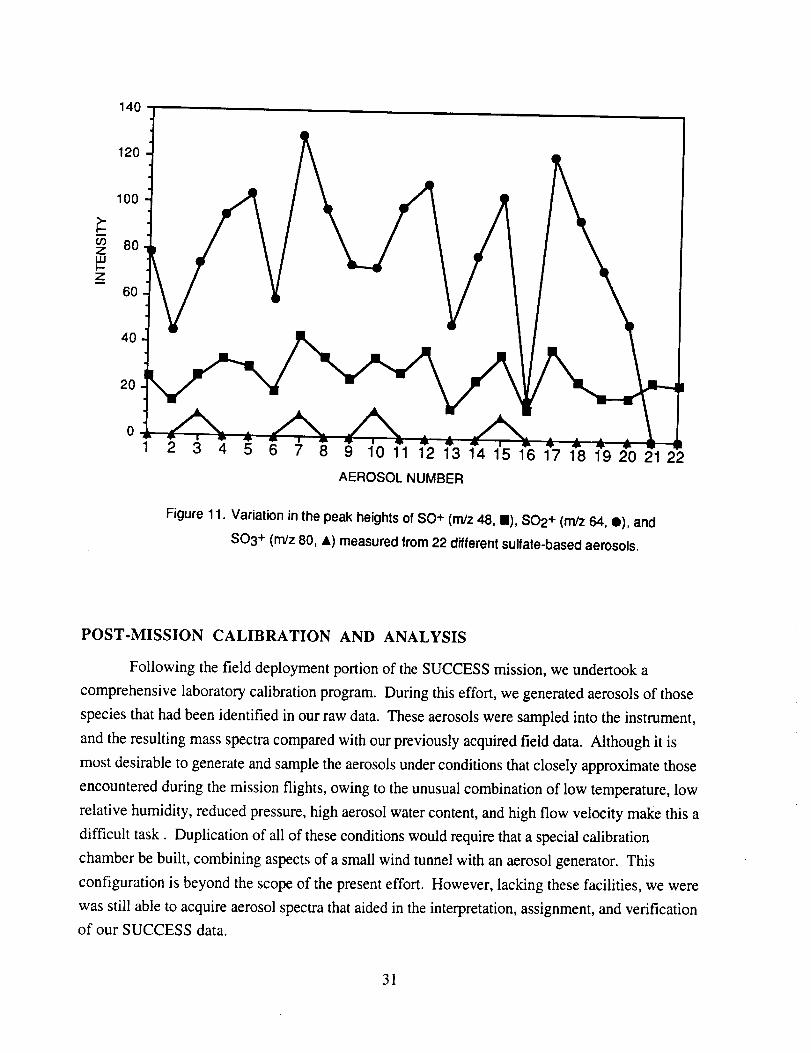
Although many aerosol mass spectra were classified as having arisen from a sulfate-based
particle, these mass spectra did not show uniform peak intensities. Figure 11 shows the peak
intensities for the three major characteristic sulfate ions; m/z 48 (SO÷), m/z 64 (SO2+), and rn/z 80
(SO3 +) as measured from 22 selected spectra. These data show that the SO2 + peak exhibits the
smallest intensity variation on a panicle-to-particle basis. The corresponding SO3 + peaks show
considerably more variation, while the relatively low intensity of the SO + peaks makes them less
reliable as an indicator of the presence of sulfate. In post-mission studies with laboratory
generated ammonium sulfate aerosols, a similar degree of variability was found, indicating that it is
an instrument response characteristic. The source of this response behavior is not clear, however,
it is likely related to the limited dynamic range of the instrument leading to non-linear ion signals as
a function of aerosol size and composition.
30
140
120
100
40
20
0
1 2 3 4 5 6 7 8 9 10 il 12 13 14 15 16 17 18 19 20 21 22
AEROSOL NUMBER
Figure 11. Variation in the peak heights of SO+ (m/z 48, I), SO2 + (m/z 64, 0), and
SO3 + (rn/z 80, &) measured from 22 different sulfate-based aerosols.
POST-MISSION CALIBRATION AND ANALYSIS
Following the field deployment portion of the SUCCESS mission, we undertook a
comprehensive laboratory calibration program. During this effort, we generated aerosols of those
species that had been identified in our raw data. These aerosols were sampled into the instrument,
and the resulting mass spectra compared with our previously acquired field data. Although it is
most desirable to generate and sample the aerosols under conditions that closely approximate those
encountered during the mission flights, owing to the unusual combination of low temperature, low
relative humidity, reduced pressure, high aerosol water content, and high flow velocity make this a
difficult task. Duplication of all of these conditions would require that a special calibration
chamber be built, combining aspects of a small wind tunnel with an aerosol generator. This
configuration is beyond the scope of the present effort. However, lacking these facilities, we were
was still able to acquire aerosol spectra that aided in the interpretation, assignment, and verification
of our SUCCESS data.
31
A secondgoalof our calibrationeffortwastodetermineif ourinletandsamplingsystemintroduceanysignificantsizebias.Thehighpercentageof particlesthatshowonly wateris at
oddswith thegenerallyaccepteddistributionof aerosolparticlesin theUT/LS. Onepossiblesourceof thisdiscrepancyis asizebiasinour instrumentthatallowsonlylargeiceparticlesto be
detectedwhilemissingthesmaller,nonwaterparticles.Wethereforeperformedasystematicstudy
of thesamplingefficiencyof our instrumentasafunctionof theaerosolparticlesize.These
laboratorytestsverifiedthatourPBGwasableto sampleparticlesin thesizerangefromapproximately0.2_tto> 5.0_tm.
Thetypicaltransmissionefficiencymeasuredin thelaboratoryfor 0.502-ktm-diameterpolystyrenelatexspheres(DukeScientific,PaloAlto, California)throughtheaerosolinlet to the
ion sourceregionwas0.2%. Thiswasdeterminedgravimetricallywherebyaknownmassof
particleswasplacedin a 1-Lsphericalglassbulbanda streamof drynitrogenwasusedto maintain
themairbornewheretheyweresampledthroughthecapillaryinlet protrudinginto thebulb. Aglassslidecoatedwith vacuumgreasewasplacedwithin thevacuumchamberatthe locationof the
aerosolinlet apertureto the ionsource.After samplingfor atimesufficientto noticeablyreducethe
originalparticlelevelwithin thebulb,themassof particlesremainingin thebulbanddepositedon
theslidewasmeasuredto determinethetransmissionefficiency.The0.2%overallefficiencyfoundfor 0.5_tmparticlesiscomparableto theefficienciesmeasuredby othersfor similar,
capillary-basedaerosolinlets[MurphyandThomson,1995;Sinhaet al., 1982;Yangetal., 1996;Hinz et al., 1994].
Thetransmissionefficiencywasnotmeasuredoverthefull particlesizerange,norwasany
attemptmadeto determinetheefficiencyunderconditionsmorerepresentativeof theactualDC-8
sampling.Althoughtheselaboratorystudiesdidnotmeasuretheability of ourPBGsamplingsystemto acquireaerosolswithoutsizebias,it ismostprobablethatthegreastestinfluenceon the
samplingcharacteristicsof theinstrumentwasimposedby theexternalprobe. As discussedabove
in thedescriptionof thisprobe,its sub-isokineticsamplingalmostcertainlyresultedin aserious
undersamplingof smalleraerosols.Furthermore,sincewecouldnotmeasureoursampling
efficiencyor samplingsizebiasin thelaboratoryunderconditionsthatwerecharacteristicof actual
flight conditions,theinformationfromanysuchstudieswouldnotbeusefulin assessingthemissionresults.
Althoughwearetemptedto compareourresultswith othertroposphericaerosol
compositiondatameasuredpreviouslyandduringtheSUCCESSmission,suchcomparison
presentsdifficulties. TheioniccompositionresultsobtainedbyTalbotet al. [1998]during
SUCCESScorrespondto 10-minuteaveragesof averylargenumberof particlessampledunder
varyingatmosphericconditions.In general,wewouldnothavemeasuredastatisticallysignificant
32
numberof individualparticlesduringthesame10-minuteperiod,andthusit is notreasonableto
comparesingleparticleandbulk compositiondata.SimilardataobtainedduringABLE 3B
[Grozelskaet al., 1994]for middleanduppertroposphericaerosolcompositioncorrespondedto20-60minutesamplingaverages.Thosedatashowedthatthebulk ionic compositionwas
dominatedby ammoniumandsulfate,with lesseramountsof nitrate.Althoughquantitativelydifferentfrom thepresentresults,thequalitativetrendis similar.
IndividualparticleswerecollectedduringvariousSUCCESSflightsby Pueschelet al.
[1998]andbyChenetal. [1998]usingawire impactorandaTEM grid, respectively,and
subsequentlyanalyzedfor chemicalcomposition.Analysisof theseparticlesoccurredaftera
considerabletimeintervalandafterprolongedexposureto air followedby vacuumexposureduringelectronmicroscopicexamination.Theseconditionsaremarkedlydifferentfrom thoseunder
whichwesampledandvaporizedthesingleparticlesreportedhere,makinganydirectcomparisonproblematic.
Similarly,Sheridanetal. [ 1994]havereportedon theelementalcompositionof singleparticlescollectedon impactorsin theUT. Greaterthan90%of thoseaerosolscontainedsulfate,while theremainderwereclassifiedascarbon-rich,crustal,metallic,andmarine.Of thelatter
types,mostcarbon-rich(soot)materialswouldnotbevaporizedunderourconditions,norwould
mostmetallicparticles.Somecrustalmaterialsandmostmarineaerosolswouldbevaporizedin
our instrument.However,a largeproportionof thechemicallyinterestingparticlesthatweobservedcanbeclassifiedassulfate,in generalagreementwith bothTalbotet al. [1998]andSheridanet al. [1994].
Becausethechemicalcompositionof UT aerosolparticlesis notexpectedto bedominated
by water,thepresentresultsarenoteasilyexplained.Severalpossiblefactorscanbeconsideredto
accountfor theobservedresults.Becausethemajorityof particlesanalyzedby our instrument
weresampledduringcloudtransits,wecanreasonablyconcludethathighhumiditylevelsprevailedthroughouttheunheatedsamplingline. Thisconditioncouldleadto thecondensationof
additionalwaterontosmallerparticles,bothafterenteringtheprobe,andwithin thecapillaryinlet.
Undertheseconditions,onemightexpecttheseparticlesto containarelativelylargeproportionofwatercomparedwith thecorematerial(suchasammoniumsulfateor sulfuricacid). In our
instrument,suchparticlescouldyieldmassspectrashowingonlywater-relatedpeaks.
Thecauseof thisdiscriminationresultsfrom thedesignof theion source.Theion source
wasdesignedto providethehighestpossibleionizationefficiencyto maximizesensitivity.This
highefficiencyis achievedby operatingthesourcein a space-chargeregime,whichresultsin
limiting thetotalnumberof ionsthatcanresidein thesourceat anygiventime. Ourlaboratory
studiesusingthissourcehaveshownthattherangeoverwhichalinearincreasein samplevapor
33
concentrationwithin thesourceyieldsa linearion responseisapproximatelytwo ordersof
magnitude.Theresultof this limited linearresponserangeis thatadominantspecies,suchas
watervapor,will generateenoughion densitywithin thesourceto precludetheionizationof minorspecies.Thisproblemis furtherexacerbatedby thedynamicrangeof thedigitizationelectronics,which is limited to approximately7-bitsof resolutiondueto thedetectornoise.
In additionto thepossibleexistenceof excesswatervaporcondensedontheincoming
aerosolparticles,theambientgasphasewatervaporcouldalsocontributea largebackground
signal. Althoughthetotalpressurein theion sourceregionin theabsenceof avaporizingparticleis 10-6Torr, thepartialpressuredueto waterwill beasignificantfractionof thisunderconditions
of highrelativehumiditywithin theinlet. Becausetheion sourceoperatescontinuously,thishigh
partialpressureof waterwill leadto thecontinuouspresenceof a largenumberdensityof water
ionswithin thesourcevolume. Thus,thematerialarisingfromthevaporizationof anaerosolparticlewill notbeefficientlyionizeddueto thespace-chargelimit extantwithin thesource.The
resultis anaerosolmassspectrumdominatedby water.Whentheinstrumentis operatedin thelaboratory,thebackgroundsignalassociatedwithwaterisverymuchsmallerthanunderflight
conditions,andwetaerosolparticlesarereadilydetectedandchemicallyspeciated.This laboratory
functionalityverifiesthefundamentalviabilityof thethermalvaporizationelectronimpactionization
schemefor singleparticleanalysisdemonstratedpreviouslyby Sinhaet al. [ 1982].
Severalreadilyimplementedchangestotheinstrumentwill mitigatethedifficulties
exhibitedwhenthissystemwasusedunderflight conditionsin theUT. A properlydesigned
externalsamplingprobethatprovidesmorenearlyisokineticconditionswouldsignificantlyreduce
theinlet sizebias[Porteret al., 1992].Temperatureandhumiditycontrolwithin theinletcouldreducetheambientwaterlevels,althoughpossiblyat theexpenseof somecomposition
information. Sizingof eachanalyzedparticlewouldprovideinformationon thecorrelationof
compositionwith size,aswell asgivingsomemeasureof thesamplingandtransmissionefficiency
of the inlet. Changesin thedesignandoperationof theEI sourcewouldsubstantiallyincreaseits
linearresponserange.Thesechangescoupledwith logarithmicdetectionelectronics[Murphyand
Thomson,1995]will resultin aninstrumentwithsignificantlyenhancedcapabilities.
34
CONCLUSIONS
A newinstrumentwasdeveloped and deployed on the SUCCESS mission. This effort
was the first use of a real-time aerosol characterization instrument on an airborne platform. As a
result of the non-optimum extemal aerosol sampler, however, we likely oversampled larger
particles. The large amount of water associated with these particles and the high ambient humidity
encountered during cloud transits where our spectra were taken, resulted in the majority of particles
appearing to contain only water. Despite this limitation, we were able to chemically characterize a
number of individual aerosol particles. Laboratory studies have largely confirmed the assignment
of these aerosol spectra measured in the UT. The paucity of chemically interesting experimental
results obtained using this new instrument during its first deployment as part of the SUCCESS
mission does not admit making statistically significant observations about the chemical composition
of UT aerosol panicles. Straightforward changes to the sampling inlet and the instrument will
permit such upper tropospheric, aerosol compositional observations to be made on future
deployments. However, even in its current configuration, this new instrument demonstrated an
ability to chemically characterize in real-time single aerosol particles sampled directly from the
troposphere.
35
ACKNOWLEDGEMENTS
The authors would like to thank Dr. D. M. Murphy, NOAA, Boulder, CO, for providing
us with his aerosol inlet design, Dr. Hermann Wollnik, University of Giessen, for his assistance in
the design of the ion source, and Dr. Christopher H. Becker, SRI International, for his advice and
encouragement during this effort.
36
REFERENCES
Allen, J., and R. K. Gould, Mass spectrometric analyzer for individual aerosol particles, Rev. Sci.Instrum., 52, 804-809, 1981.
Chen, Y., S. M. Kreidenweis, L. M. McInnes, D. C. Rogers, and P. J. DeMott, Single particleanalyses of ice nucleating particles in the upper troposphere and lower stratosphere,Geophys. Res. Letts., to be published, 1998.
Daum, P. H., and S. R. Springton, Measurement Challenges in Atmospheric Chemistry, Chap. 4,American Chemical Society, 1993.
Gaines, S., and S. Hipskind, eds., Subsonic aircraft: contrail and cloud effects special study,NASA/SASS-001 Edition 1, NASA Ames Research Center, December, 1997.
Gorzelska, K., R. W. Talbot, K. Klemm, B. Lefer, O. Klemm, G. L. Gregory, B. Anderson,and L. A. Barrie, Chemical composition of the atmospheric aerosol in the troposphere overHudson Bay lowlands and Quebec-Labrador regions of Canada, J. Geophys. Res. 99, 1763(1994).
Grix, R., U. Grtiner, G. Li, H. Stroh, and H. Wollnik, An electron impact storage ion source fortime-of-flight mass spectrometers, Int. J. Mass Spectrom. Ion Proc., 93, 323-330, 1989.
Heintzenberg, J., Fine particles in the global troposphere: A review, TelIus, 41B, 149-160, 1989.
Hinz, K-P., R. Kaufmann, and B. Spengler, Laser-induced mass analysis of single particles in theairborne state, Anal. Chem., 66, 2071-2076, 1994.
Johnston, M. V., and A. S. Wexler, MS of individual aerosol particles, Anal. Chem., 67, 721A-726A, 1995.
Kim, D., and P. K. Hopke, Classification of individual particles based on computer-controlledscanning electron microscopy data, Aerosol Sci. TechnoL, 9, 133-151, 1988.
Liu, P., P. J. Ziemann, D. B. Kittleson, and P. H. McMurry, Generating particle beams ofcontrolled diemsnions and divergence. 2. Experimental evaluation of particle motion inaerodynamic lenses and nozzle expansions, Aerosol Sci. Technol., 22, 314-324, 1995.
Mansoori, B. A., M. V. Johnston, and A. S. Wexler, Quantitation of ionic species in singlemicrodroplets by on-line laser desorption/ionization, Anal. Chem., 66, 3681-3687, 1994.
Murphy. D. M., and D. S. Thomson, Laser ionization mass spectroscopy of single aerosolparticles, Aerosol Sci. TechnoL, 22, 237-249, 1995.
Neubauer, K. R., M. V. Johnston, and A. S. Wexler, Chromium speciation in aerosols by rapidsingle-particle mass spectrometry, Int. J. Mass Spectrom. Ion Proc., 151, 77-87, 1995.
Porter, J. N., A. D. Clarke, G. Ferry, and R. F. Pueschel, Aircraft studies of size-dependentaerosol sampling through inlets, J. Geophys. Res., 97, 3815-3824, 1992.
37
Post,J.E., andP.R.Buseck,Characterizationof individualparticlesin thePhoenixurbanaerosolusingelectron-beaminstruments,Environ. Sci. Technol., 18, 35-42, 1984.
Pueschel, R. F., et al., Sulfuric acid and soot particle formation in aircraft exhaust, Geophys. Res.Letts., to be published, 1998.
Rader, D. J., and V. A. Marple, A study of the effects of anisokinetic sampling, AerosolSci.Technol., 8, 283-299, 1988.
Sageev-Grader, G., R. C. Flagan, J. H. Seinfeld, and S. Arnold, Fourier transform infraredspectrometer for a single aerosol particle, Rev. Sci. lnstrum., 58,584-587, 1987.
Salt, K., Noble, C. A., and Prather, K. A., Aerodynamic particle sizing versus light scatteringintensity measurements as methods for real-time particle sizing coupled with time-of-flightmass spectrometry, Anal. Chem., 68, 230-234, 1996.
Sheridan, P. J., C. A. Brock, and J. C. Wilson, Aerosol particles in the upper troposphere andlower stratosphere: elemental composition and morphology of individual particles in northernmidlatitudes, Geophys. Res. Letts., 21, 2587-2590, 1994.
Sinha, M. P., C. E. Giffin, D. D. Norris, T. J. Estes, V. L. Vilker, and S. K. Friedlander,
Particle analysis by mass spectrometry, J. Colloid Interface Sci., 87, 140-153, 1982.
Sinha, M. P., Laser-induced volatilization and ionization of microparticles, Rev. Sci. lnstrum.,55, 886-891, 1984.
Smith, M. H., and C. D. O'Dowd, Observations of accumulation mode aerosol composition andsoot carbon concentrations by means of a high-temperature volatility technique, J. Geophys.Res., 101, 19583-19591, 1996.
Talbot, R. W., J. E. Dibb, and M. Loomis, Influence of vertical transport on free troposphericaerosols over the central USA in springtime, Geophys. Res. Letts., to be published, 1998.
Twohy, C. H., and B. Gandrud, Ice-forming particles in aircraft exhaust, Geophys. Res. Letts.,to be published, 1998.
Xhoffer, C., and R. Van Grieken, Environmental Particles, Vol. 2, Chap. 5, Lewis Publishers,Boca Raton, Florida, 1993.
Xhoffer, C., L. Wouters, P. Artaxo, A. Van Put, and R. Van Grieken, Environmental Particles,Vol. 1, Chap. 3, Lewis Publishers, Boca Raton, Florida, 1993.
Yang, M., P. T. A. Reilly, K. B. Boraas, W. B. Whitten, and J. M. Ramsey, Real-time chemicalanalysis of aerosol panicles using an ion trap mass spectrometer, Rapid Commun. MassSpectrom., 10, 347-351, 1996.
38
APPENDIX A
SELECTED AEROSOL MASS SPECTRA FROM SUCCESS MISSION
FLIGHT 09212

100
8O
60
40
201718fl
28
1 61 32
, 141__ - ' -t ' '
15 3O
SULFATE-RICH AEROSOL
Recorded: 61846 UTC
Date: 960502
64!
, ,,8 ! 111' I ' ' I _ * I T--, I ' ' =1 _ T T
45 60 75 90 105 120 135
m/z Rel. Abund. m/z Rel. Abund. m/z Rel. Abund.
14 8 16 39 17 100
18 100 28 58 32 18
48 5 64 19 119 4
,oo7 ,ll ,, i8o1 II I Nrr_-RICHAEROSOL
! II I Recorded: 61895 UTC
60] II I Date:96O5O2
J ,,111 III20
12[,a_____1_4"6 62 87 , . , , , , , r
15 30 45 60 75 90 105 120 135
m/z Rel. Abund. m_ Re!. Abund. m/z Rel. Abund.
1 3 2 6 14 16
16 42 17 96 18 100
28 100 30 27 32 37
46 12 62 6 87 3
100
8O
60
40
20
17 18 28
16
14
i I
5
m/z
1
17
32
64
32
Rel. Abund.
5100
33
31
4844, I
45 60
m/z
14
18
44
SULFATE-RICH AEROSOL
Recorded: 62155 UTC
Date: 960502
Rel. Abund.
13
100
4
m/z Rel. Abund.
16 75
28 100
48 10
A-]
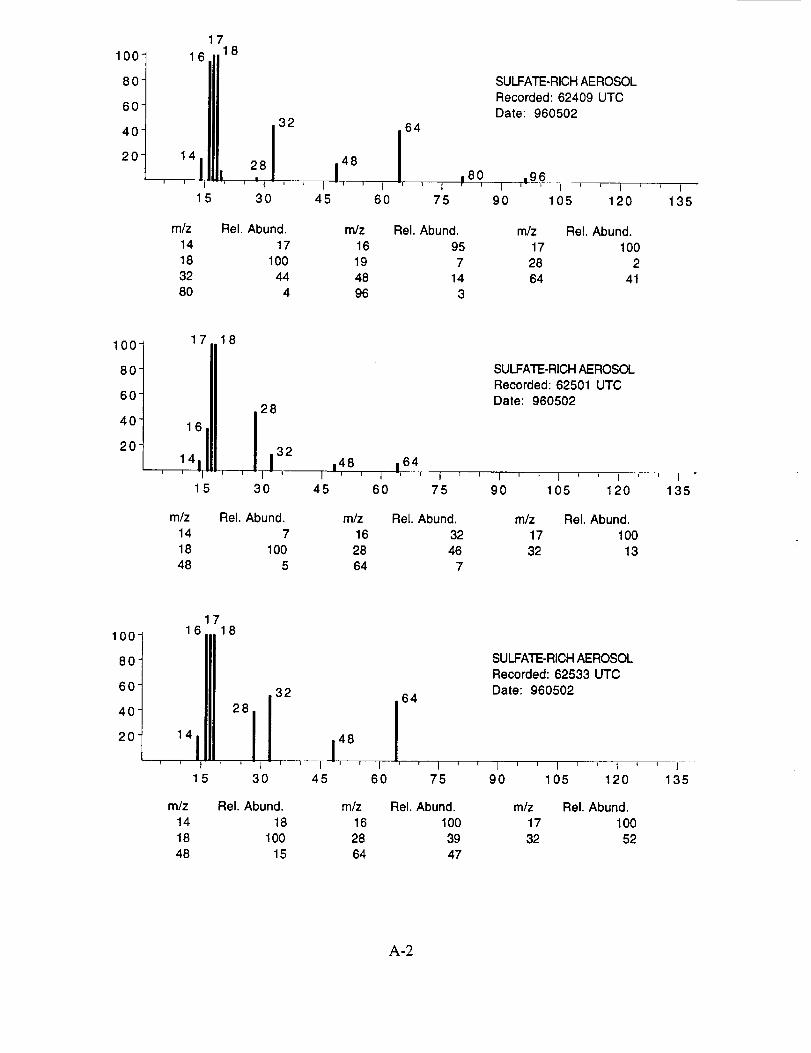
100-
80-
60-
40
20
1718
161 32
I "1i -i _-- i i i
15 30I - i
45
m/z Rel. Abund. mR
14 17 16
18 100 19
32 44 48
80 4 96
64
J p6o
60 75
Rel. Abund.
95
7
14
3
SULFATE-RICH AEROSOL
Recorded: 62409 UTC
Date: 960502
i ,.9§ -i ' ' , ' ' i90 105 120 135
mR Rel. Abund.
17 100
28 264 41
l°°t8O
60
'°120
16
17 18
28
J! 2
30 45
I 148 I,64 '
60 75
m/z Rel. Abund. mR
14 7 16
18 100 28
48 5 64
Rel. Abund.
32
467
SULFATE-RICH AEROSOL
Recorded: 62501 UTC
Date: 960502
I ' _ t ' ' I ' ' I90 105 120 135
m/z Rel. Abund.
17 100
32 13
100
8O
6O
40
20
1716 18
i
28
J' ' 1 ' ' I
15
32
30 45
m/z Rel. Abund. mR
14 18 16
18 100 28
48 15 64
SULFATE-RICH AEROSOL
Recorded: 62533 UTC
Date: 960502
64
I ' ' I ' ' 1 ' i I _ ' I _ ' 7L60 75 90 105 120 135
Rel. Abund. m_ Rel. Abund.
100 17 100
39 32 52
47
A,-2
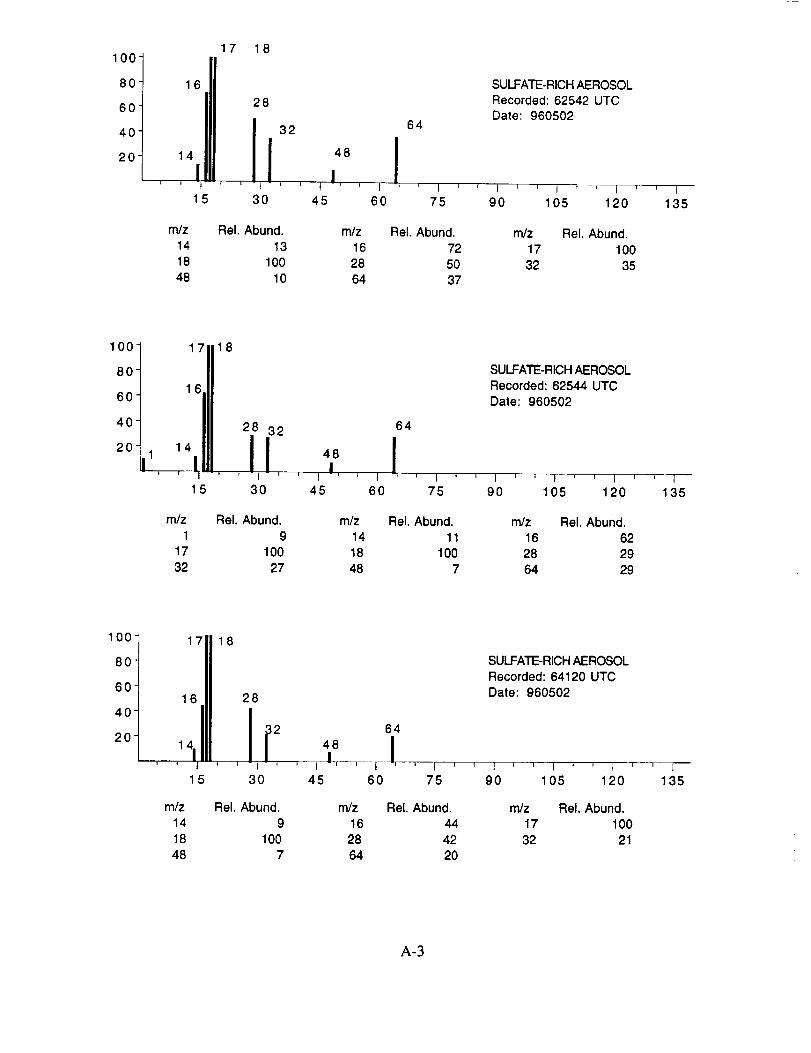
100
8O
60
40
20
17 18
16
14
II I -t I
15
m/z
14
18
48
28
I I 32 48
' I ' J t |,
30 45
Rel. Abund.
13
100
10
' I6O
m/z
16
2864
64
!
SULFATE-RICH AEROSOL
Recorded: 62542 UTC
Date: 960502
' I ' ' I ' ' I _ _ I ' ' I75 90 105 120 135
Rel. Abund.
72
5O
37
m/z Rel. Abund.
17 100
32 35
100
8O
60
40
20
17 18
16
14
28 32
II' I ' ' I |' ' I
30 45 60
mR Rel. Abund. mR
1 9 14
17 100 18
32 27 48
SULFATE-RICH AEROSOL
Recorded: 62544 UTC
Date: 960502
64
I,,75 90 105 120 135
Rel. Abund. m/z Rel. Abund.
11 16 62
100 28 29
7 64 29
100-
80-
60-
40-
20-
171118, ,1 411 , ,
15
28
-I ' I I'
30 45
m/z
14
18
48
Rel. Abund.
9
1007
m/z
16
28
64
64I
I I, _ I ' i
60 75
Rel. Abund.
44
42
20
SULFATE-RICH AEROSOL
Recorded: 64120 UTC
Date: 960502
I ' ' I _ ' I ' ' [g0 105 120 135
m/z Rel. Abund.
17 100
32 21
A-3
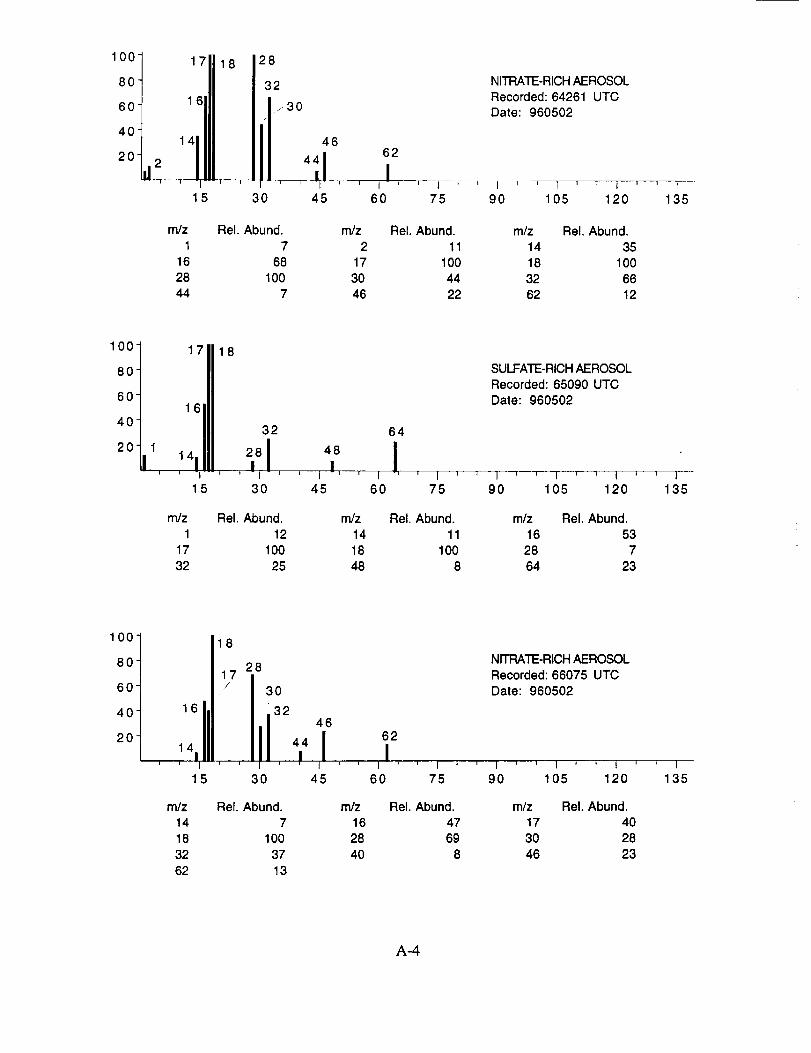
100
80
60
40
20
17 18 28
32
15 30 45 60 75
m/z Rel. Abund. m/z Rel. Abund.
1 7 2 11
16 68 17 100
28 100 30 44
44 7 46 22
NITRATE-RICH AEROSOL
Recorded: 64261 UTC
Date: 960502
t9O 105 120 135
m_ Rel. Abund.
14 35
18 100
32 66
62 12
100
80
60
40
20 _
17
1
I 14
16
15
18
32
3O
SULFATE-RICH AEROSOL
Recorded: 65090 UTCDate: 960502
64
,8, I45 60 75 90 105 120 135
m/z Rel. Abund. mR Rel. Abund. mR Rel. Abund.
1 12 14 11 16 53
17 100 18 100 28 7
32 25 48 8 64 23
,°°1 1188°1 I 1 7 28 Recorded: 66075 UTC
Date: 960502601 I _ 13o40 j 1 6 I.I I ' 32
t Iii Ipl, i°2 0 , 1 41i , , , I ' ' I ' ' I ' ' I ' ' I ' ' | r , I
15 30 45 60 75 90 105 120 135
m/z Rel. Abund. m/z Rel. Abund. m_ Rel. Abund.
14 7 16 47 17 40
18 100 28 69 30 28
32 37 40 8 46 23
62 13
A-4

100
8O
60
40
201
I
17
15
6432
I ' ' I ' _ I '
30 45 60
m/z Rel. Abund. m/z
1 7 14
17 100 18
32 44 48
8O 4 96
SULFATE-RICH AEROSOL
Recorded: 69655 UTC
Date: 960502
8O 96
' I _1..... , I rll ' I ' ' I ' ' I
75 90 105 120 135
Rel. Abund. m/z Rel. Abund.
20 16 94
100 19 6
17 64 514
100
8O
60
40
202
iI
17
18
16
14
i I -- I r
15 30
32
4840 44
I - T-- -1 J
45 60
mR Rel. Abund. mR
1 3 2
16 84 17
28 100 32
44 9 48
64
SULFATE-RICH AEROSOL
Recorded: 73114 UTC
Date: 960502
J I ' ' I ' t I ' ' I ' ' I
75 90 105 120 135
Rel. Abund. mR Rel. Abund.
5 14 17
100 18 100
79 40 6
13 64 38
100-
80-
60-
40-
20
17 18
111 32 64
14 231 48 L' ' I "r'- , I t.....
15 3O 45 60
m/z Rel. Abund. m/z
14 13 16
18 100 28
48 10 64
75
Rel. Abund.
69
10
29
SULFATE-RICH AEROSOL
Recorded: 73133 UTC
Date: 960502
1 f_ 1 , 1 • , i - F--90 105 120 135
rn/z Rel. Abund.
17 100
32 27
A-5
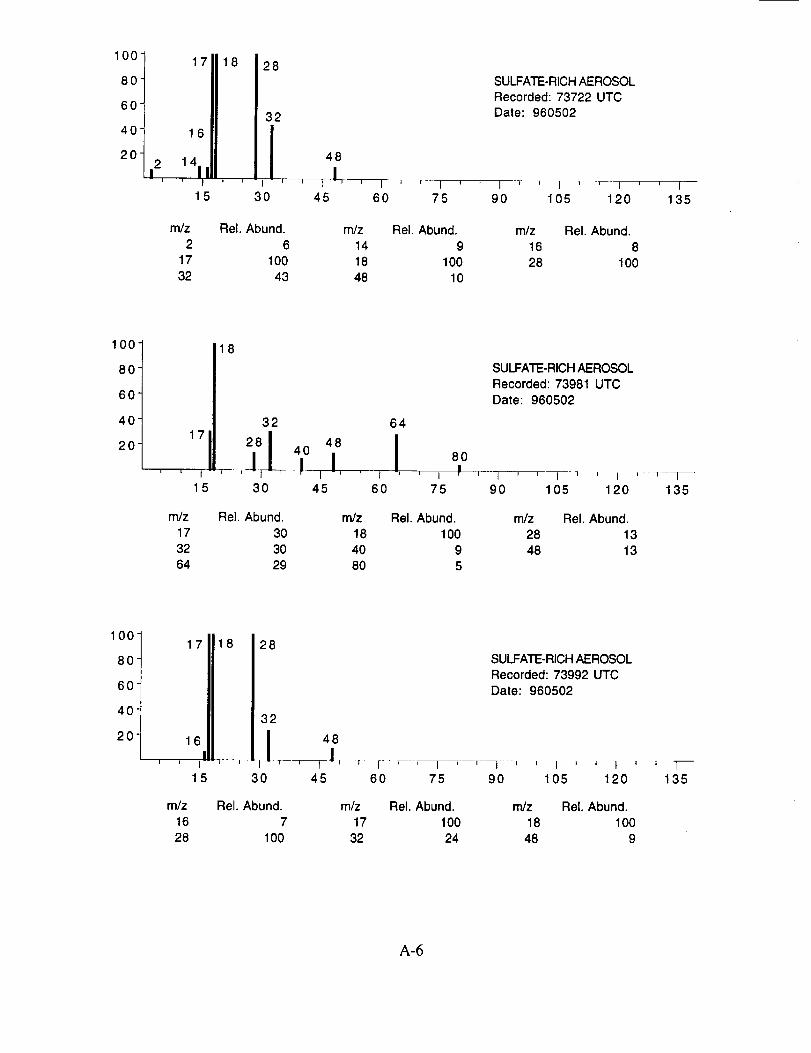
100
8O
60
40
20-2
I
17 ,18 28
32
16
411i
15 30
48
I,145
SULFATE-RICH AEROSOL
Recorded: 73722 UTCDate: 960502
' I ' _ I ' * I _ _ 1 ' ' I ' ' I60 75 90 105 120 135
mR Rel. Abund. mR
2 6 14
17 100 18
32 43 48
Rel. Abund.
9
10010
mR Rel. Abund.
16 8
28 100
100
8O
60
40
20
m/z
17
32
64
18
32
7 28II 1 - I
5 3O
Rel. Abund.
3O
3O
29
4O
P48
I,I
45
m/z
18
40
80
' I60
64
I
SULFATE-RICH AEROSOL
Recorded: 73981 UTC
Date: 960502
8O
' I _1 _ I ' ' I ' ' I ' , I
75 90 105 120 135
Rel. Abund. m/z Rel. Abund.
100 28 13
9 48 13
5
100-
80-
60-
40-
20 c
m/z
16
28
17
16
15
18 28
32
30
SULFATE-RICH AEROSOL
Recorded: 73992 UTC
Date: 960502
48i
.....m----r_l_- I.... i 1 | r--i ] t I--• --r--1 | r T T
45 60 75 90 105 120 135
Rel. Abund.
7
100
m/z Rel. Abund. m/z Rel. Abund.
17 100 18 100
32 24 48 9
A-6
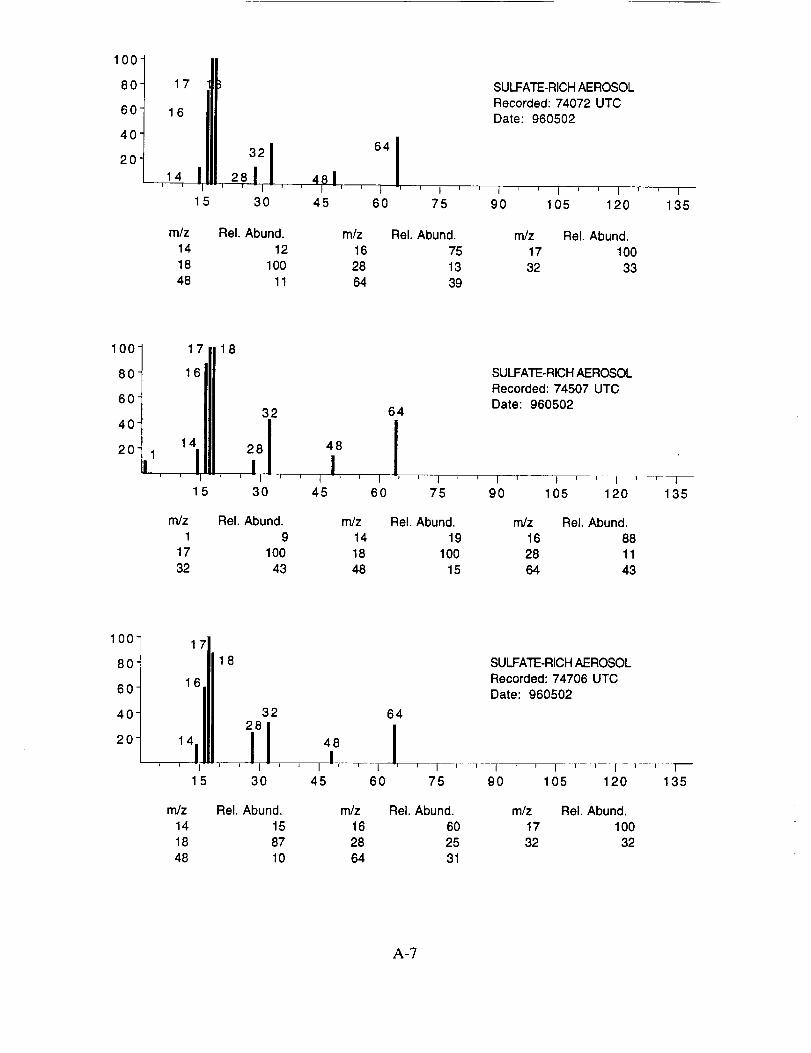
100
8O
6O
40-
20-
17
16
-- I
15
321 °'1281 481
30 45 60
mR Rel. Abund. mR
14 12 1618 100 28
48 11 64
SULFATE-RICH AEROSOL
Recorded: 74072 UTC
Date: 960502
75 90 105 120 135
Rel. Abund. mR Rel. Abund.
75 17 100
13 32 33
39
100
8O
60
40
20-
17 8
11 ,14It -I --
15
32 64
,I,,, ,I,,,,30 45 60
SULFATE-RICH AEROSOL
Recorded: 74507 UTC
Date: 960502
I ' ' I 1 , i ' ' i ' J i75 90 105 120 135
mR Rel. Abund. m/z Rel. Abund.
1 9 14 19
17 100 18 100
32 43 48 15
m/z Rel. Abund.16 88
28 11
64 43
100,r801 18
60 16
,o2832
:,IUII' ' ' -I-' ' I - ' I |
15 30 45 60 75
m_ Rel. Abund. mR Rel. Abund.
14 15 16 60
18 87 28 25
48 10 64 31
SULFATE-RICH AEROSOL
Recorded: 74706 UTC
Date: 960502
.... I'- t
90 105 120 135
m/z Rel. Abund.
17 100
32 32
A,-?
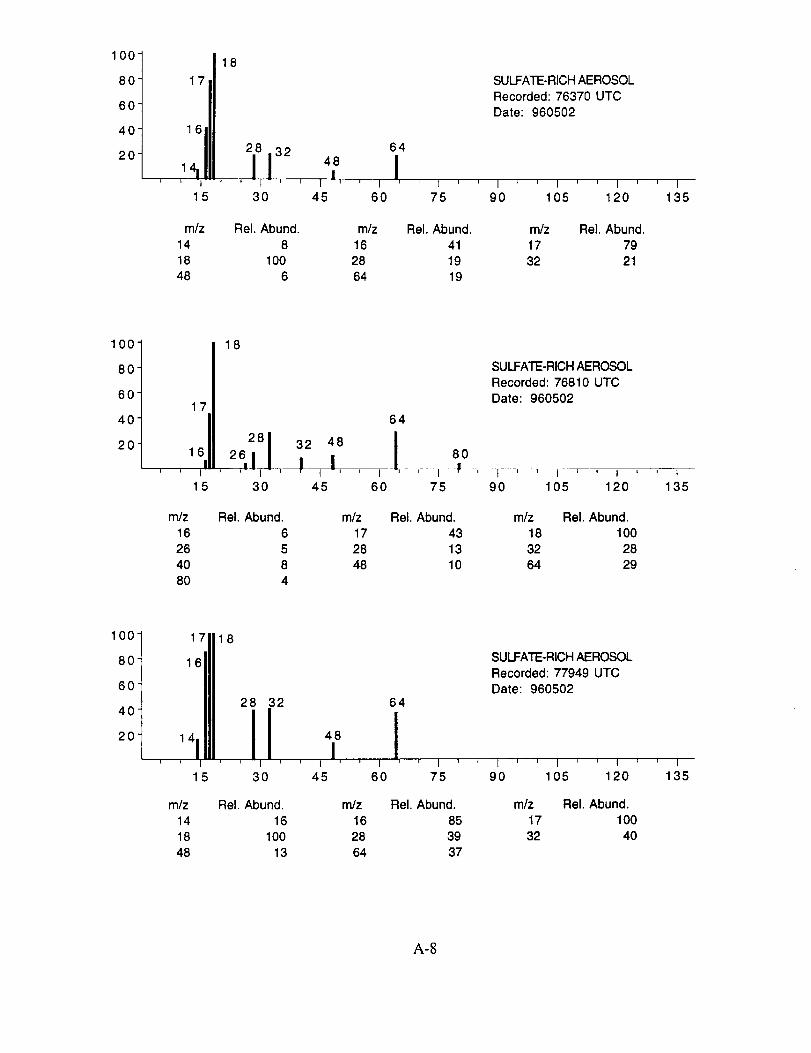
100
8O
60
40
20
17
16
15
18
64
2Sl32!,8 i' ' "t ' I Ilr=_ I ' '
30 45 60
m/z Rel. Abund.
14 8
18 100
48 6
SULFATE-RICH AEROSOL
Recorded: 76370 UTC
Date: 960502
I ' ' I ' ' I ' ' I ' ' I75 90 105 120 135
mR Rel. Abund. mR Rel. Abund.
16 41 17 79
28 19 32 2164 19
100-
80-
60-
40-
20-
18
17
16'I 28'I .-, I' ' I ' ' I
15 30
32 48
I,I
45
m/z Rel. Abund.
16 6
26 5
40 8
80 4
m/z
17
28
48
64
I
60
80
I ! '
75
SULFATE-RICH AEROSOL
Recorded: 76810 UTC
Date: 960502
I ' ' I _ ' I ' ' I90 105 120 135
Rel. Abund. mR Rel. Abund.
43 18 100
13 32 28
10 64 29
100-
80-
60
40
20
1711,6
,,11;8' ' I ' ' I ' ' I '
15 30 45
64
' I60
m/z Rel. Abund. m_
14 16 1618 100 28
48 13 64
SULFATE-RICH AEROSOL
Recorded: 77949 UTC
Date: 960502
I ' ' I ' ' i _ ' t75 90 105 120
Rel. Abund.
85
39
37
m_ Rel. Abund.
17 100
32 40
i135
A-8
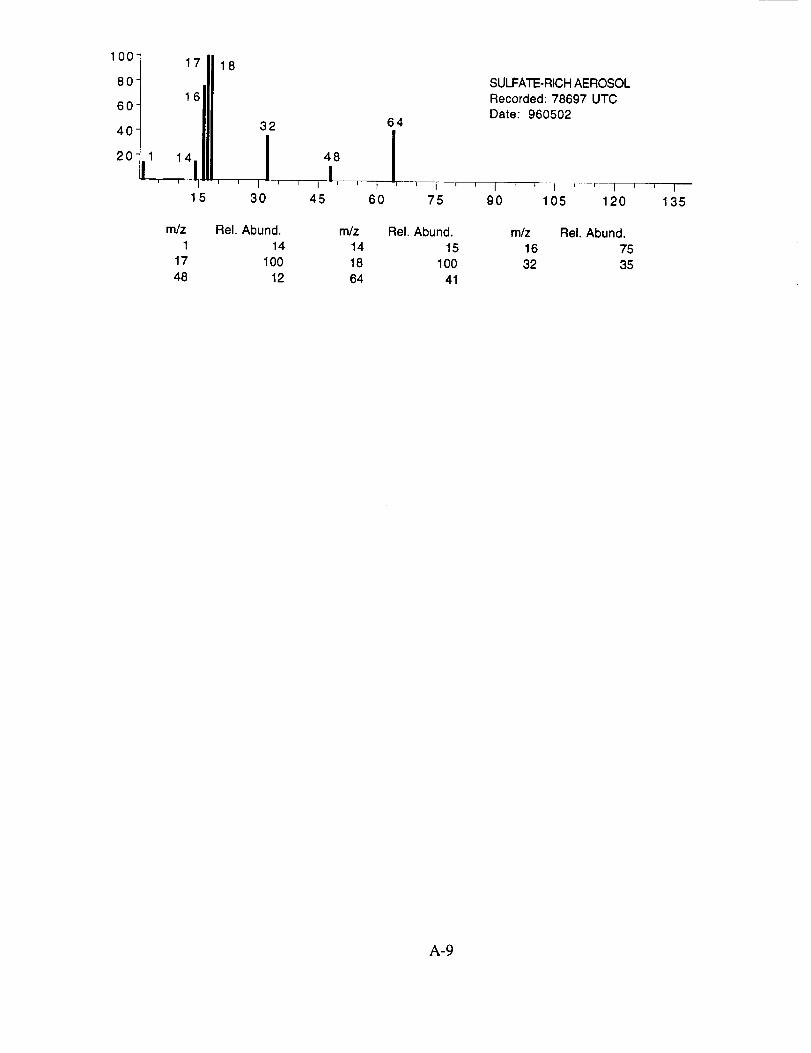
loo] ,71118_o_ _o" _o_.c._o_o,t III6 0 Date: 960502
40 32 64
_,,,10 1., I2 0
15 30 45 60 75 90 105 120 135
m_ Rel. Abund. m_ Rel. Abund. m_ Rel. Abund.
1 14 14 15 16 75
17 100 18 100 32 3548 12 64 41
A-9
APPENDIX B
SELECTED AEROSOL MASS SPECTRA FROM SUCCESS MISSION
FLIGHT 09213
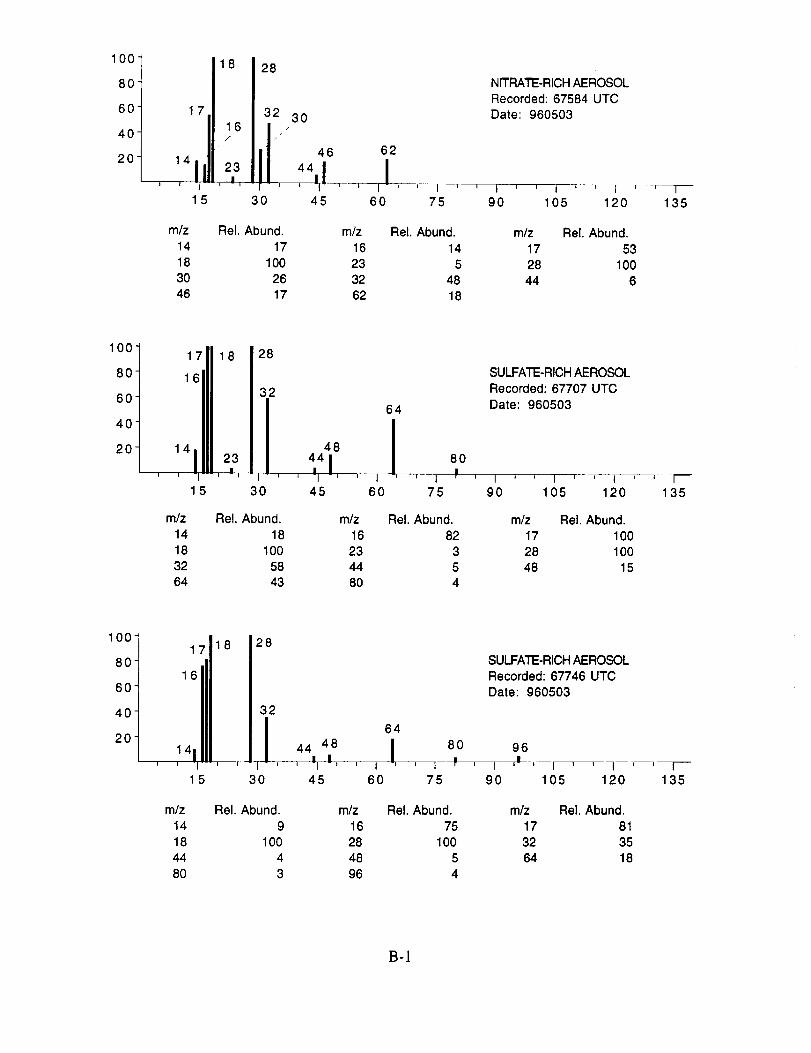
100
8O
60
40-
20-
17
15
m/z
14
183O
46
18 28
32 30
°lplif _
46
23 I44
= ' |1I - I - 1
30 45
Rel. Abund.
17
100
26
17
NITRATE-RICH AEROSOL
Recorded: 67584 UTC
Date: 960503
62
IT_- I , i 1 _ i t _ i I ' _ I i i I
60 75 90 105 120 135
m/z
16
23
3262
Rel. Abund. m/z Rel. Abund.
14 17 53
5 28 100
48 44 618
100
8O
60
40
20
17 18
1114 I
,23 ,
28
32
3O
48
44I-I -' ' 145 60
mR Rel. Abund. m/z
14 18 16
18 100 2332 58 44
64 43 80
64
SULFATE-RICH AEROSOL
Recorded: 67707 UTC
Date: 960503
' 1 P ' I ' ' I ,-- r l _/_"
8O
75 90 105 120 135
Rel. Abund. mR Rel. Abund.
82 17 100
3 28 100
5 48 15
4
100-
80-
60-
40-
20-
17 18
14 Ii n I n I =
15
28
32
64
44481, J
30 45 60
mR Rel. Abund. m/z
14 9 16
18 100 28
44 4 48
80 3 96
SULFATE-RICH AEROSOL
Recorded: 67746 UTC
Date: 960503
80 96
75 90 105' 1 r--T---I-'-
120 135
Rel. Abund.
75
100
5
4
m/z
17
32
64
Rel. Abund.
81
35
18
B-!
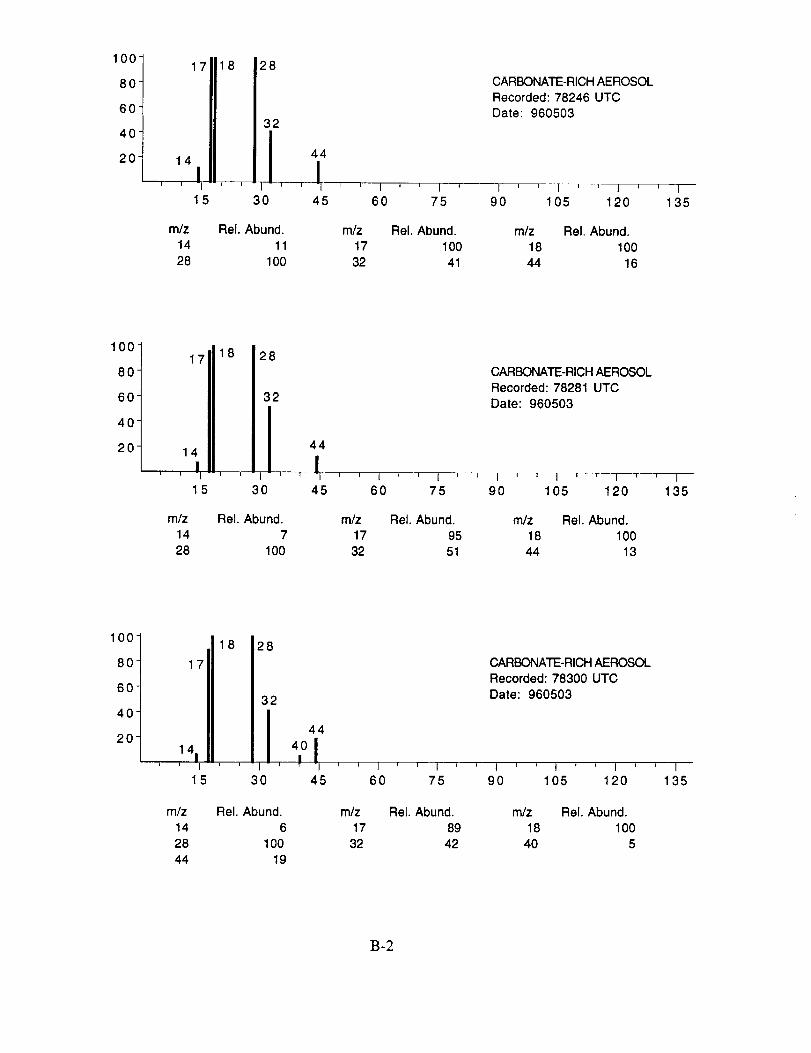
100"
80"
60
40
20 14
i i
m/z14
28
7 18 28
32
CARBONATE-RICH AEROSOL
Recorded: 78246 UTC
Date: 960503
30
44/
45 60 75 90 105 120 135
Rel. Abund.
11
100
mR Rel. Abund. m/z Rel. Abund.
17 100 18 100
32 41 44 16
100-
80-
60-
40-
20-1,18
, ,1 11 ._ ,
15
128
32
14,,- i _ j ..... i i
3O 45
m/z Rel. Abund. m/z
14 7 17
28 100 32
60 75
Rel. Abund.
95
51
CARBONATE-RICH AEROSOL
Recorded: 78281 UTC
Date: 960503
' I ' _ I ' _ I ' ' I90 105 120 135
mR Rel. Abund.
18 10044 13
100
80
60
40
20
m/z
14
28
44
18
17
4,11I ' P
15
28
32
t
3O
Rel. Abund.
6
100
19
44
40IP I '
45
m/z
17
32
j i i j i
60 75
Rel. Abund.
89
42
CARBONATE-RICH AEROSOL
Recorded: 78300 UTC
Date: 960503
' I ' ' I ' _ I ' ' I
90 105 120 135
m/z Rel. Abund.
18 100
40 5
£,-2
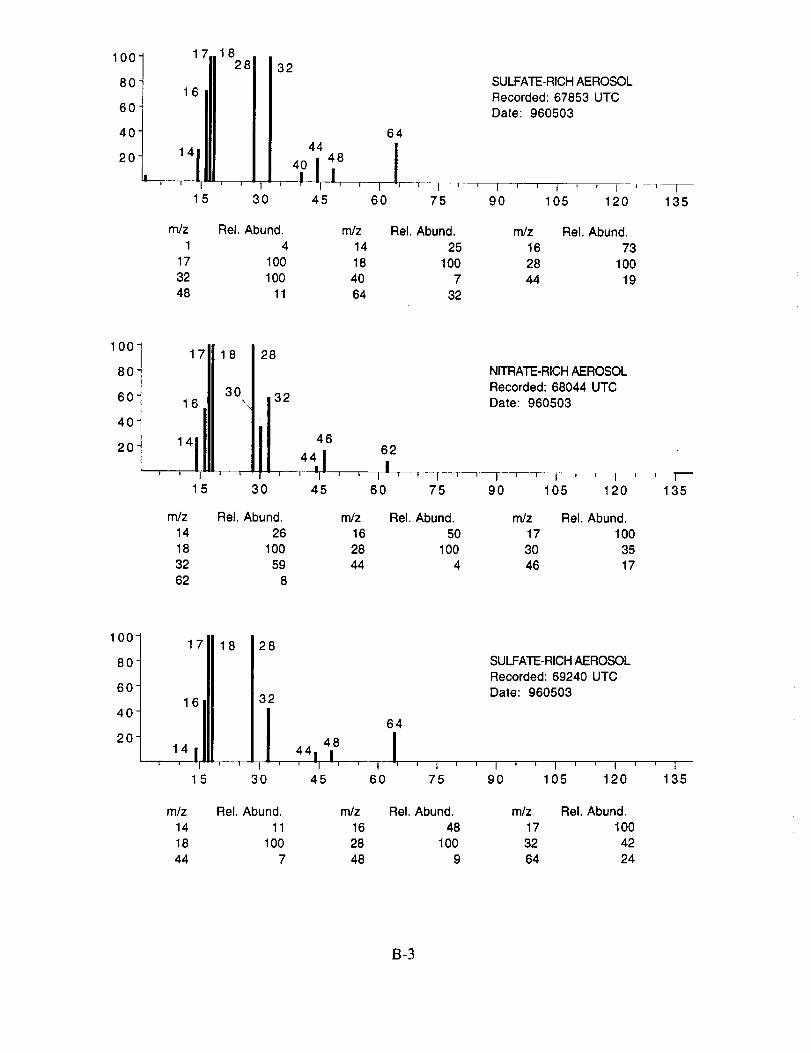
100 17 182832
SULFATE-RICH AEROSOL80 1 6 | Recorded: 67853 UTC
60 i Date: 960503
40 ! 64"/ I20 4_J 48
15 30 45 60 75 90 105 120--T _'--
m/z Rel. Abund. m/z Rel. Abund. mr Rel. Abund.
1 4 14 25 16 73
17 100 18 100 28 100
32 100 40 7 44 1948 11 64 32
[135
100-
80-
60-
40-
20-
17 18 28
1 6 30\ 32
I - I I
15 30
46
i -j-
45
m/z Rel. Abund. mr
14 26 16
18 100 28
32 59 44
62 8
NITRATE-RICH AEROSOL
Recorded: 68044 UTC
Date: 960503
62
t I ' --_.....1 t _ _ _--;_- [ t _ 1......1 -_ --
60 75 90 105 120
Rel. Abund. mr Rel. Abund.
50 17 100
100 30 354 46 17
1135
100
80
60
40
20
17
16
15
m/z
14
1844
18 28
32
=f.... i
3O
Rel. Abund.11
100
7
64
4448 III I, , i ' ' l '
45 60 75
m/z
1628
48
Rel. Abund.
48100
9
SULFATE-RICH AEROSOL
Recorded: 69240 UTC
Date: 960503
I 0 ' I ' ' I '90 105 120
m/z Rel. Abund.
17 100
32 42
64 24
I135
B-3
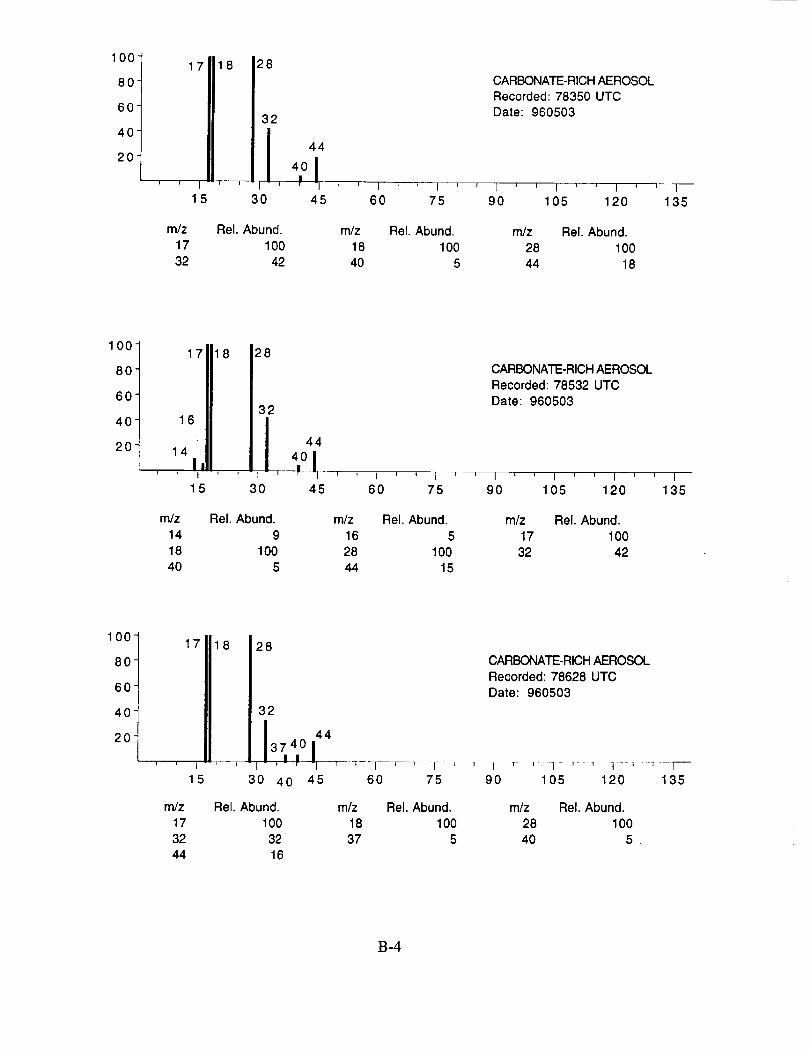
100
80
60-
40-
20-
17 18 28
32
i I I ¥ I
15 30
m/z Rel. Abund.
17 100
32 42
CARBONATE-RICH AEROSOL
Recorded: 78350 UTC
Date: 960503
44
40I]_ I ' ' I ' ' I ' ' I ' ' I ' ' 1 ' r T
45 60 75 90 105 120 135
mr Rel. Abund. m/z Rel. Abund.
18 100 28 100
40 5 44 18
100
8O
60
40-
20-
17
16
14I
I I
15
18 28
32
30 45I I I i
60 75
m_ Rel. Abund. m/z Rel. Abund.
14 9 16 5
18 100 28 100
40 5 44 15
CARBONATE-RICH AEROSOL
Recorded: 78532 UTC
Date: 960503
' I ' ' I ' ' I ' ' i90 105 120 135
mr Rel. Abund.
17 100
32 42
100-
80-
60-
40
20
m/z
17
32
44
17 18
I I
28
30 40 45
Rel. Abund.
10032
16
CARBONATE-RICH AEROSOL
Recorded: 78628 UTC
Date: 960503
32
443740 I
, nj 1, - r _-] --I ..... F---_ I ' ' I ' ' I ' _ I ' _----7---60 75 90 105 120 135
m/z Rel. Abund. m/z Rel. Abund.
18 100 28 100
37 5 40 5
B-4
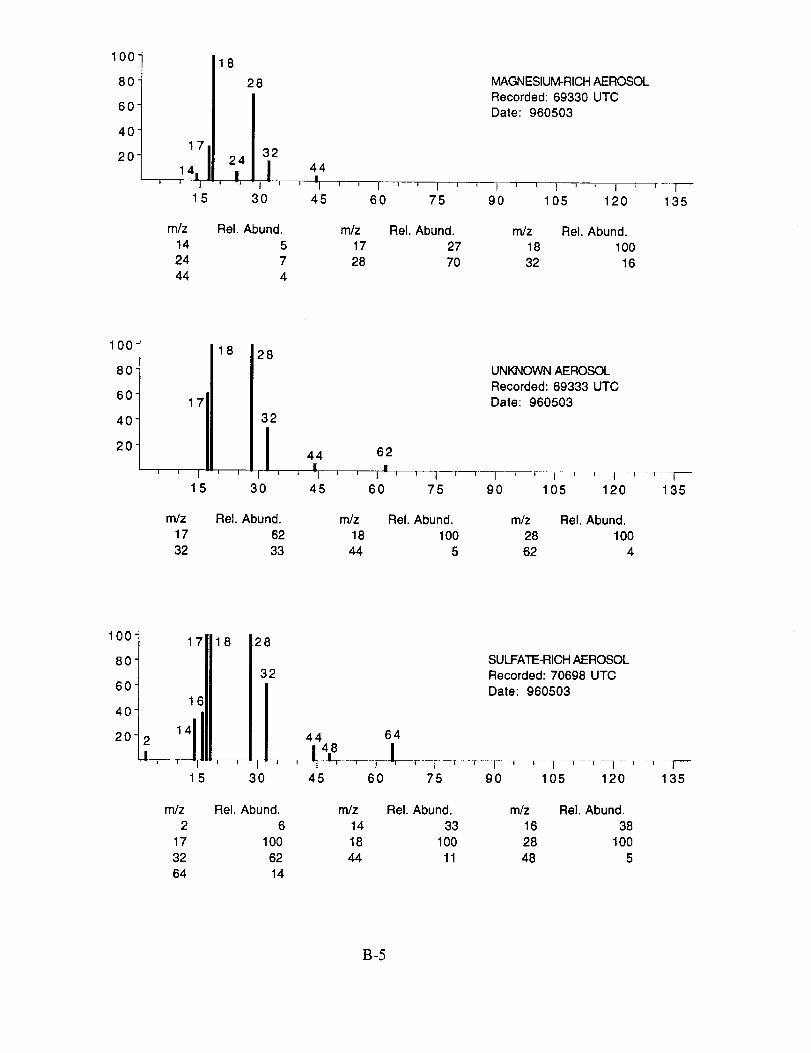
100
8O
60-
40-
20-17
, _ 41
15
m/z
14
24
44
18
28
24
3O
MAGNESIUM-RICH AEROSOL
Recorded: 69330 UTCDate: 960503
3244
45 60 75 90 105 120 135
Rel. Abund.
57
4
mr Rel. Abund. m/z Rel. Abund.
17 27 18 100
28 7O 32 16
100
8O
60
40
20
m/z
17
32
18
i
I I '
3O
28
32
UNKNOWN AEROSOL
Recorded: 69333 UTC
Date: 960503
44 62
' _ II ' ' I I ' ' I ' -_ I ' l........._ _ F- _ r
45 60 75 90 105 120 135
Rel. Abund. m/z Rel. Abund. m_ Rel. Abund.
62 18 100 28 100
33 44 5 62 4
100-
80-
60-
40-
20-
17 18
16
15
28
SULFATE-RICH AEROSOL32 Recorded: 70698 UTC
l Date: 9605034 44!8` _-64
,, , T !, ,-l-----t_---[ -, -, r-,, 1 t, , , , .... F--
30 45 60 75 90 105 120 135
m/z
2
17
3264
Rel. Abund. m_ Rel. Abund. mr Rel. Abund.
6 14 33 16 38
100 18 100 28 100
62 44 11 48 514
B-5
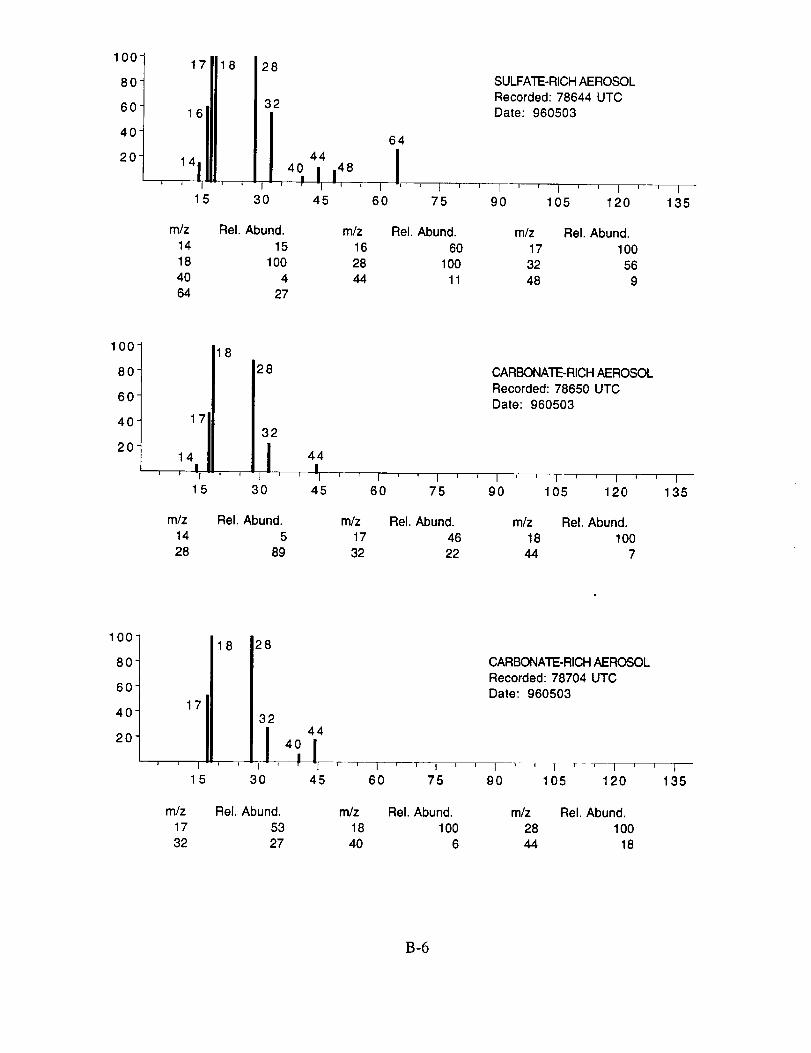
1001
60
40
20
17 8
14
I -I I t
15
28
32
I ,4,830 45
m/z
14
18
40
64
Rel. Abund.
15
100
4
27
m/z
16
28
44
' I6O
SULFATE-RICH AEROSOL
Recorded: 78644 UTCDate: 960503
64
I' I ' J I ' ' I ' _ I ' ' I
75 90 105 120 135
Rel. Abund. mR Rel. Abund.
60 17 100
100 32 56
11 48 9
100-
80-
60-
40-
20-
18
i
17I
141 It I -J I I
15
28 CARBONATE-RICH AEROSOL
Recorded: 78650 UTC
Date: 960503
32
I 44_ !
' ' -1 ' ' I ' ' I ' ' I ' ' I ' ' I ' ' I30 45 60 75 90 105 120 135
m/z
14
28
Rel. Abund. mR Rel. Abund. mR Rel. Abund.
5 17 46 18 100
89 32 22 44 7
100
8O
60
40
20
17
15
m/z
17
32
18
CARBONATE-RICH AEROSOLRecorded: 78704 UTC
Date: 960503
Rel. Abund. rn/z Rel. Abund. mR Rel. Abund.
53 18 100 28 100
27 40 6 44 18
B-6
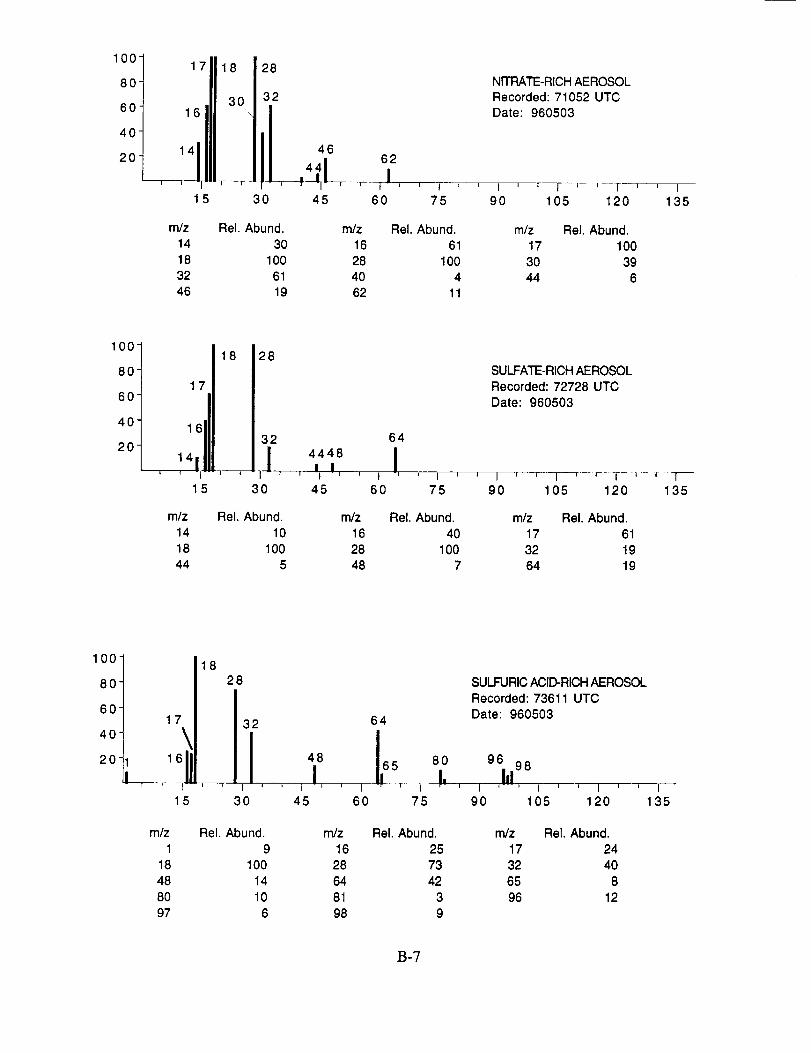
100-
80-
60"
40"
2O
17
16
28
0 32\,
46
44I-, , _- -I1-
30 45
NITRATE-RICH AEROSOL
Recorded: 71052 UTCDate: 960503
62
I60 75 90 105 120 135
m/z Rel. Abund. m/z Rel. Abund. m/z Rel. Abund.
14 30 16 61 17 100
18 100 28 100 30 39
32 61 40 4 44 6
46 19 62 11
100-
80-
60-
40-
20-
17
16
15
28
32 64
!I I
30 45 60
m_ Rel. Abund. m_
14 10 16
18 100 28
44 5 48
SULFATE-RICH AEROSOL
Recorded: 72728 UTC
Date: 960503
75 90
Rel. Abund.
40
1007
I --T ....... [ _---_ r- _ .... T T105 120 135
m/z Rel. Abund.
17 61
32 19
64 19
100-
80-
60-
40-
20-
18
17
15
28
32
I3O
48
I' ' I _ ' I
45 60
m_ Rel. Abund. m_
1 9 16
18 100 28
48 14 64
80 10 81
97 6 98
64
Ir,f
75
Rel. Abund.
25
73
42
3
9
8O
!;
SULFURIC ACID-RICH AEROSOL
Recorded: 73611 UTC
Date: 960503
96
I,i 98
90 105 120 135
m/z Rel. Abund.
17 24
32 40
65 8
96 12
B-7
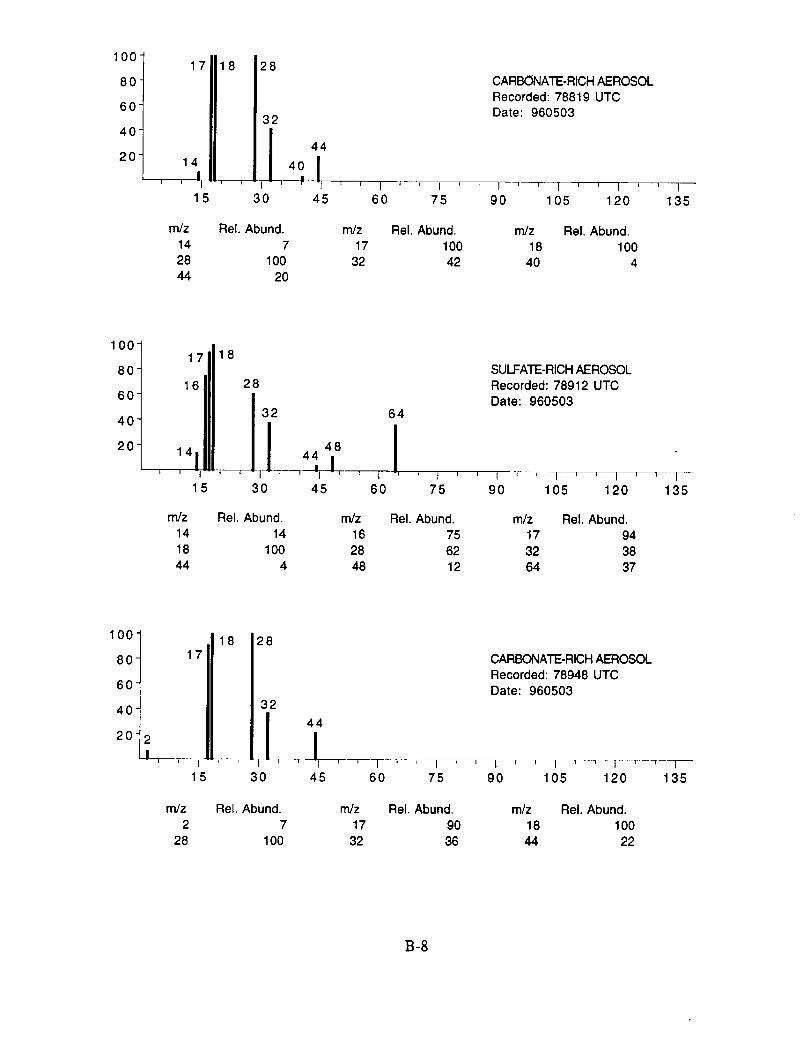
100-
80-
60
40"
20
17 118
i
14
| _-.i i -j
15
m/z
14
28
44
28
32
4O
3O
Rel. Abund.
7
100
2O
CARBONATE-RICH AEROSOL
Recorded: 78819 UTCDate: 960503
44
I ' , I ' ' I ' ' I _ , I ' ' t ' _ t
45 60 75 90 105 120 135
m_ Rel. Abund. m/z Rel. Abund.
17 100 18 100
32 42 40 4
100-
80-
60-
40-
20-
16
l'l15
m/z
14
18
44
28
3O
Rel. Abund.
14
100
4
48
I45
' I60
64
rn/z
16
28
48
SULFATE-RICH AEROSOL
Recorded: 78912 UTCDate: 960503
75 90 105 120 135
Rel. Abund.
75
62
12
m/z Rel. Abund.
17 94
32 38
64 37
100
8O
60
40
20 2
!i i
rn/z
2
28
1718 28
32
i I i
5 3O
Rel. Abund.7
100
CARBONATE-RICH AEROSOL
Recorded: 78948 UTC
Date: 960503
44
I ' _-r ---_-' i ' ' i J _ i _ ' i --r---q 1
45 60 75 g0 105 120 135
m/z Rel. Abund. m/z Rel. Abund.
17 90 18 100
32 36 44 22
B-8
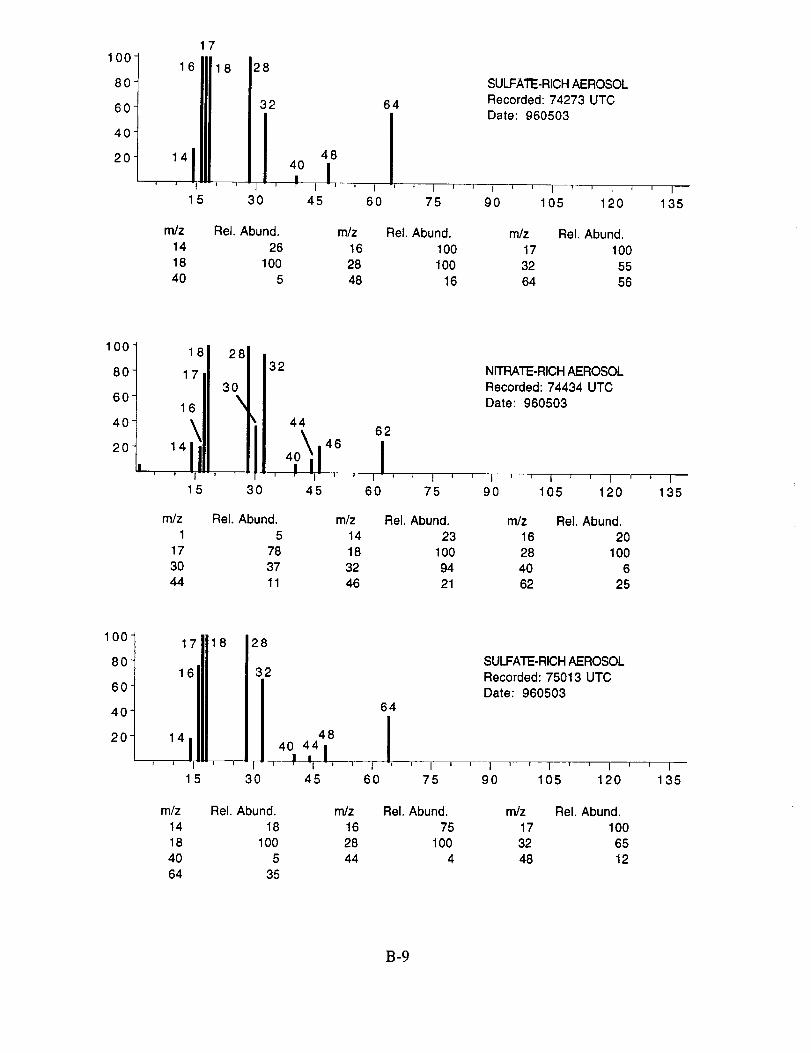
100-
8O
60
40
20
17
16 8 28
32
15 30
I 4O!
- I r I
48
i, ,
45
m/z Rel. Abund. m/z
14 26 16
18 100 28
40 5 48
64
I
6O
SULFATE-RICH AEROSOL
Recorded: 74273 UTC
Date: 960503
I _ _ I ' ' l r- , I ' ' I
75 90 105 120 135
Rel. Abund. mr Rel. Abund.
100 17 100
100 32 55
16 64 56
100-
80-
60-
40-
20-
18
17
16
\14
28
30
\
32
44
30 45
rn/z ReL Abund. mr
1 5 14
17 78 18
30 37 32
44 11 46
NrTRATE-RICH AEROSOL
Recorded: 74434 UTC
Date: 960503
62
II _ _ 1 _ ' I ' ' I =r _ I
60 75 90 105 120
ReL Abund. mr Rel. Abund.
23 16 20
100 28 100
94 40 6
21 62 25
' I
135
100
8O
60
40
20
17 18
16
14
I l I
15
28
32
I40 44 |
30 45
m/z Rel. Abund. mr
14 18 16
18 100 28
40 5 44
64 35
64
T60
SULFATE-RICH AEROSOL
Recorded: 75013 UTC
Date: 960503
I ' F--]75 90
T J 1 r , I ' ' I
105 120 135
Rel. Abund.
75
100
4
m/z Rel. Abund.
17 100
32 6548 12
B-9
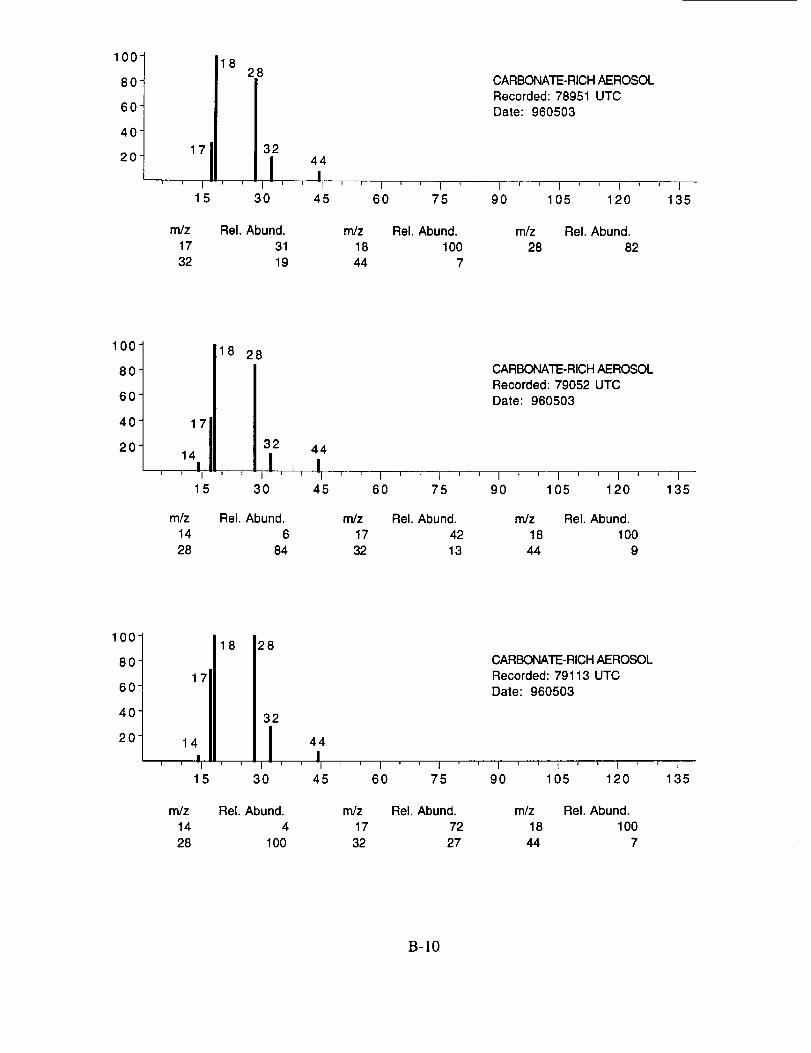
IO0
8O
60-
40-
20-
18
,7I15
28CARBONATE-RICH AEROSOL
Recorded: 78951 UTC
Date: 960503
3244
m
30 45 60 75 90 105 120 135
rn/z
17
32
Rel. Abund. mR Rel. Abund. mR Rel. Abund.
31 18 100 28 82
19 44 7
100
8O
60
40
20
17
14I
i i -
15
m/z
14
28
18 28CARBONATE-RICH AEROSOL
Recorded: 79052 UTC
Date: 960503
32 44
' ' |1 ' ' I ' _ I t _ I _ ' I ' ' t ' ; I
30 45 60 75 90 105 120 135
Rel. Abund. mR Rel. Abund. m/z Rel. Abund.
6 17 42 18 100
84 32 13 44 9
100
8O
60
40
20
m/z
14
28
18
17
14
l_ , i
5
28
30
32
CARBONATE-RICH AEROSOLRecorded: 79113 UTC
Date: 960503
44
' ' II ' ' I ' ' t ' ' 1 ' ' t ' ' I ' ' I
45 60 75 90 105 120 135
Rel. Abund.
4
100
m/z Rel. Abund. mR Rel. Abund.
17 72 18 100
32 27 44 7
B-IO
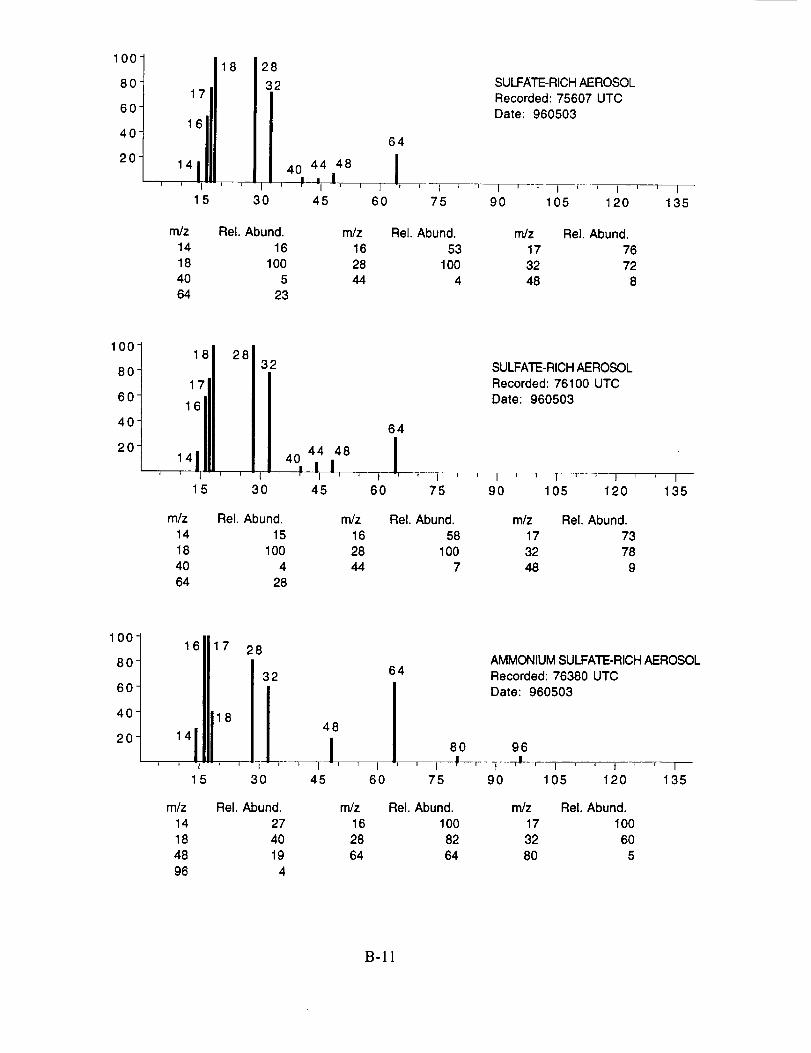
100-
80-
60-
40"
20
17
16
15
m/z
14
18
40
64
118 28
32
I30
Rel. Abund.
16
100
523
64
44 48 J40_' -'i I I
- i i ] i I=
45 60
m/z16
28
44
SULFATE-RICH AEROSOL
Recorded: 75607 UTCDate: 960503
I' _1' _-i_r-,l,,l75 90 105 120 135
Rel. Abund.
53
1004
m/z Rel. Abund.
17 7632 72
48 8
100-
80-
60-
40-
20-
18
lil16
14J
15
m/z
14
18
40
64
28132
I=
|
|
, 44, . ,40 -I
3O
Rel. Abund.
15
1004
28
48I- i --'7--
45
m/z
16
28
44
64
T l ,
60
SULFATE-RICH AEROSOL
Recorded: 76100 UTC
Date: 960503
I , , I ' _ I ' ' t ' ' I75 90 105 120 135
Rel. Abund.
88
100
7
m/z Rel. Abund.
17 73
32 7848 9
100
8O
60
40
20
6111715
28
32
30
48
I45
m/z Rel. Abund. m/z
14 27 16
18 40 28
48 19 64
96 4
' t6O
64AMMONIUM SULFATE-RICH AEROSOL
Recorded: 76380 UTC
Date: 960503
8O 96
' i ! ' T --#--_' i ' ' _ ' ' --]--
75 90 105 120 135
Rel. Abund. m/z Rel. Abund.
100 17 100
82 32 60
64 80 5
B-ll
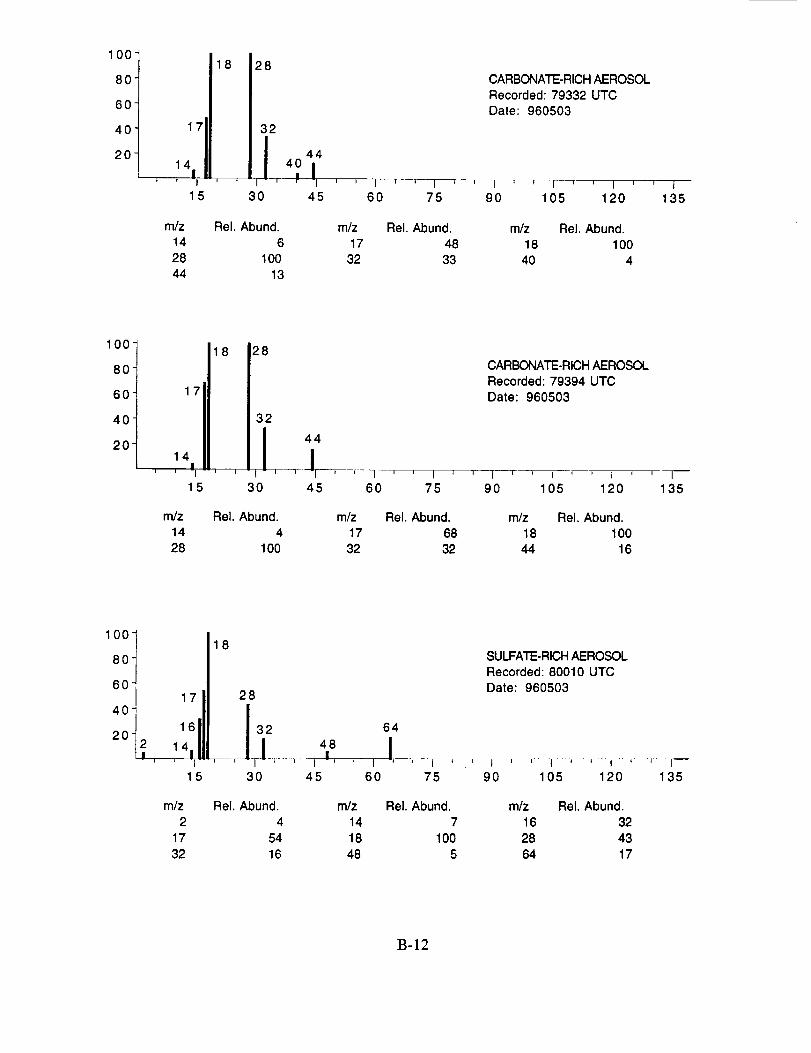
100-
80-
60-
40-
20-
17
18 28
32
30
CARBONATE-RICH AEROSOL
Recorded: 79332 UTC
Date: 960503
44
4o I
45 60 75 90 105 120 135
mR Rel. Abund.
14 6
28 100
44 13
mR Rel. Abund. mr Rel. Abund.
17 48 18 100
32 33 40 4
100
80
60
40
20
18 28
171 32
14 _' ' -I l l
15 30
44/
_-JI_---F -- ' ' I ' ' -
45 60 75
m/z Rel. Abund. mr Rel. Abund.
14 4 17 68
28 100 32 32
CARBONATE-RICH AEROSOL
Recorded: 79394 UTC
Date: 960503
-I ' ' I F , I '
90 105 120
mr Rel. Abund.18 100
44 16
-I_135
100-
80-
60-
40-
20-
17
16
15
18
28
30 45 60
m/z Rel. Abund. mr
2 4 14
17 54 18
32 16 48
SULFATE-RICH AEROSOL
Recorded: 80010 UTC
Date: 960503
I _ ] _ _ _ 175 90 105 120 135
Rel. Abund.7
100
5
m/z Rel. Abund.
16 32
28 43
64 17
B-12
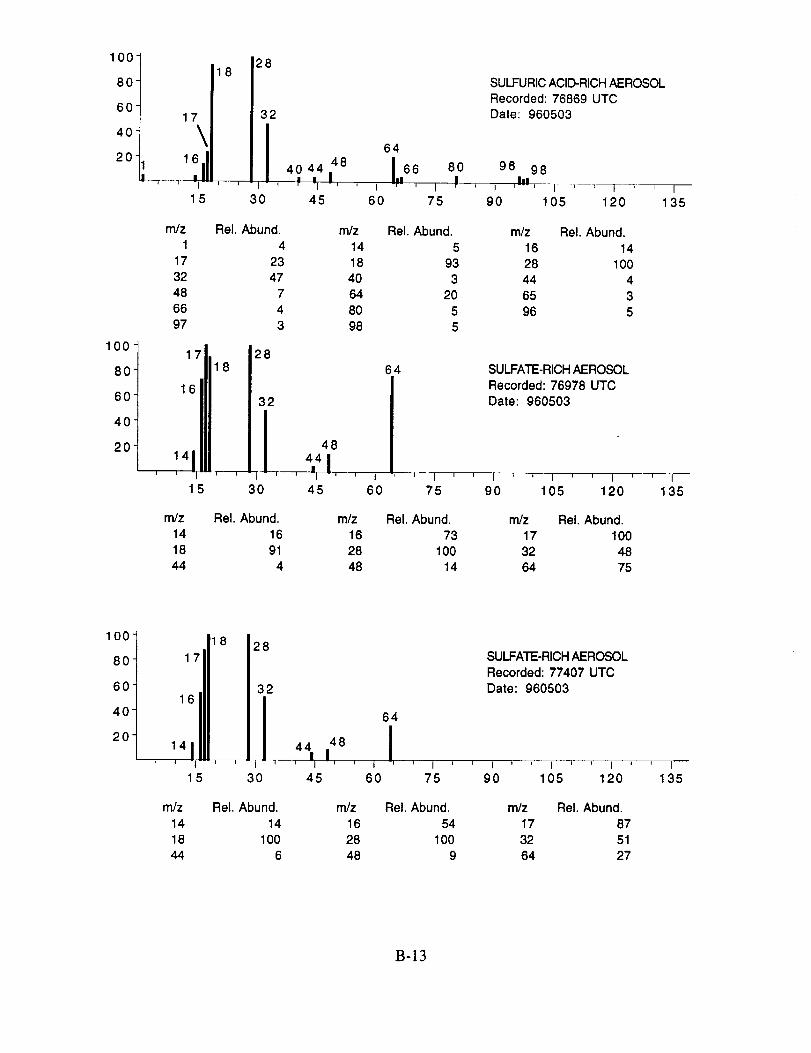
100"
80
60
40
20
100
8O
60
'0t20
17
\16
|
15
2818
32
3O
64
o; ,8 1664 4 I ,.' -I - ' ' I -r- , I
45 60 75
m/z Rel. Abund. m/z Rel. Abund.
1 4 14 5
17 23 18 93
32 47 40 3
48 7 64 20
66 4 80 5
97 3 98 5
17 2818
32
II5 3O
16
80
SULFURIC ACID-RICH AEROSOL
Recorded: 76869 UTC
Date: 960503
96 98|d
I '-"' I _---' 1 _ ' I90 105 120 135
m/z Rel. Abund.
16 14
28 100
44 4
65 3
96 5
48
44 IIII _ , ,
45I
6O
64 SULFATE-RICH AEROSOL
Recorded: 76978 UTC
Date: 960503
m ..r I ' ' I ' ' I ' _ I _ ' I
75 90 105 120 135
mr Rel. Abund. m/z Rel. Abund. m/z Rel. Abund.
14 16 16 73 17 100
18 91 28 100 32 48
44 4 48 14 64 75
100
8O
60
40
20-
18
17
16I15
!28
32
I- i i
30 45
m/z
14
1844
Rel. Abund.
14
100
6
64
I
60
m/z
16
28
48
I '
75
Rel. Abund.
54
100
9
SULFATE-RICH AEROSOL
Recorded: 77407 UTC
Date: 960503
I ' ' I ' _ I ' ' I
90 105 120 135
mr Rel. Abund.
17 87
32 51
64 27
B-I3
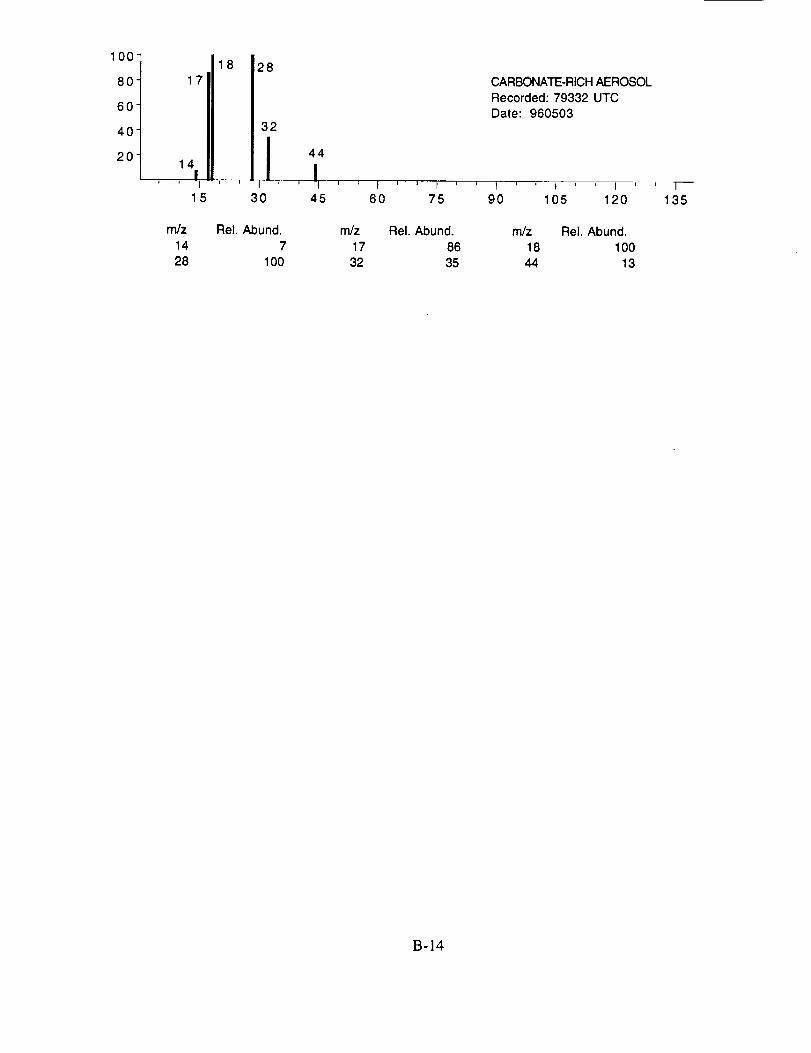
100-
8O _
60"
40"
20"14
rl_z
14
28
18
7
1
5
28
32
CARBONATE-RICH AEROSOL
Recorded: 79332 UTC
Date: 960503
30
44|
' ' |1 ' ' I ' _ t ' ' 1 ' _ I _ ' I ' ' I
45 60 75 90 105 120 135
Rel. Abund.
7
100
m/z Rel. Abund. m/z Rel. Abund.
17 86 18 100
32 35 44 13
B-14
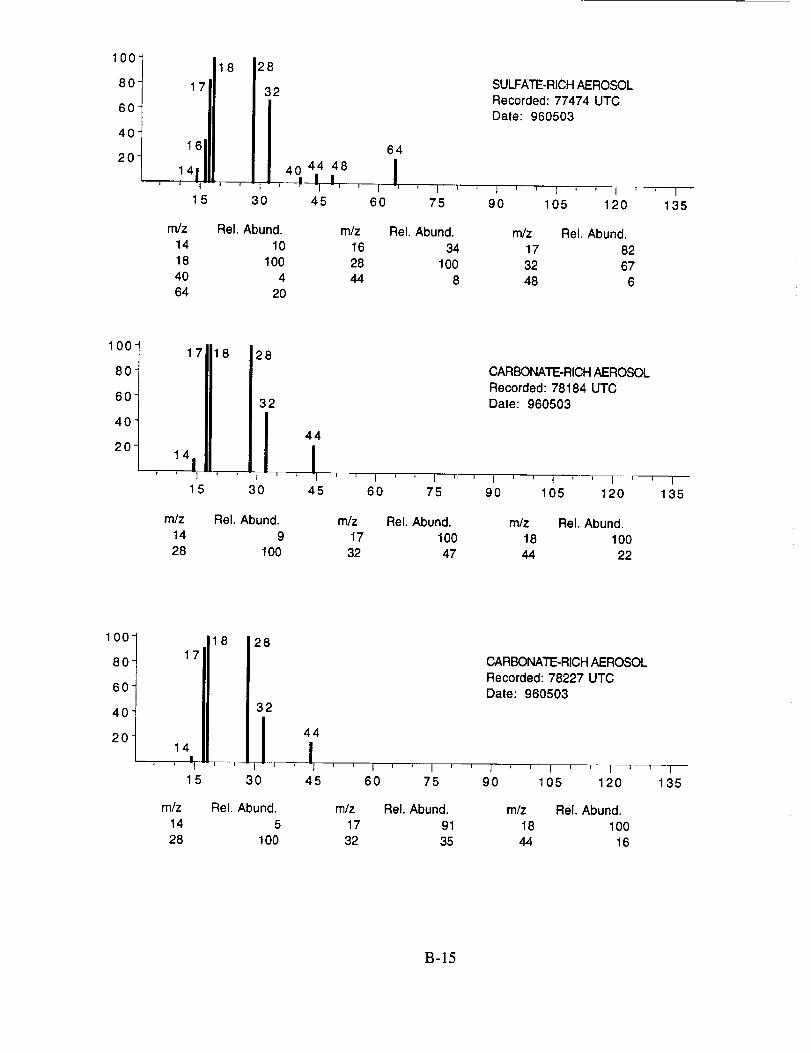
100
8O
60
40
2O16
5
m/z
14
18
40
64
18
17
28
32
I , °4I' It , i '30 45 60
SULFATE-RICH AEROSOL
Recorded: 77474 UTC
Date: 960503
I _ ' 1 ' ' I _ _ I _ _ I
75 90 105 120 135
Rel. Abund. m/z Rel. Abund.
10 16 34
100 28 100
4 44 82O
m/z Rel. Abund.
17 82
32 67
48 6
100
8O
60
40
20
17 18
, 1,41,
15
26
32
3O
44
45
CARBONATE-RICH AEROSOL
Recorded: 78184 UTC
Date: 960503
60 75 90' I ' ' I ' ' I
105 120 135
m/z Rel. Abund. m/z Rel. Abund. nVz Rel. Abund.
14 9 17 100 18 100
28 100 32 47 44 22
100
8O
60
40
2014
17118 28
32
44
30 45j I I n i i
6O 75
m/z Rel. Abund. m/z Rel. Abund.
14 5 17 91
28 100 32 35
CARBONATE-RICH AEROSOL
Recorded: 78227 UTC
Date: 960503
i ' ' I ' * I _ ' I
90 105 120 135
m/z Rel. Abund.
18 100
44 16
B-15
APPENDIX C
SELECTED AEROSOL MASS SPECTRA FROM SUCCESS MISSION
FLIGHT 09214
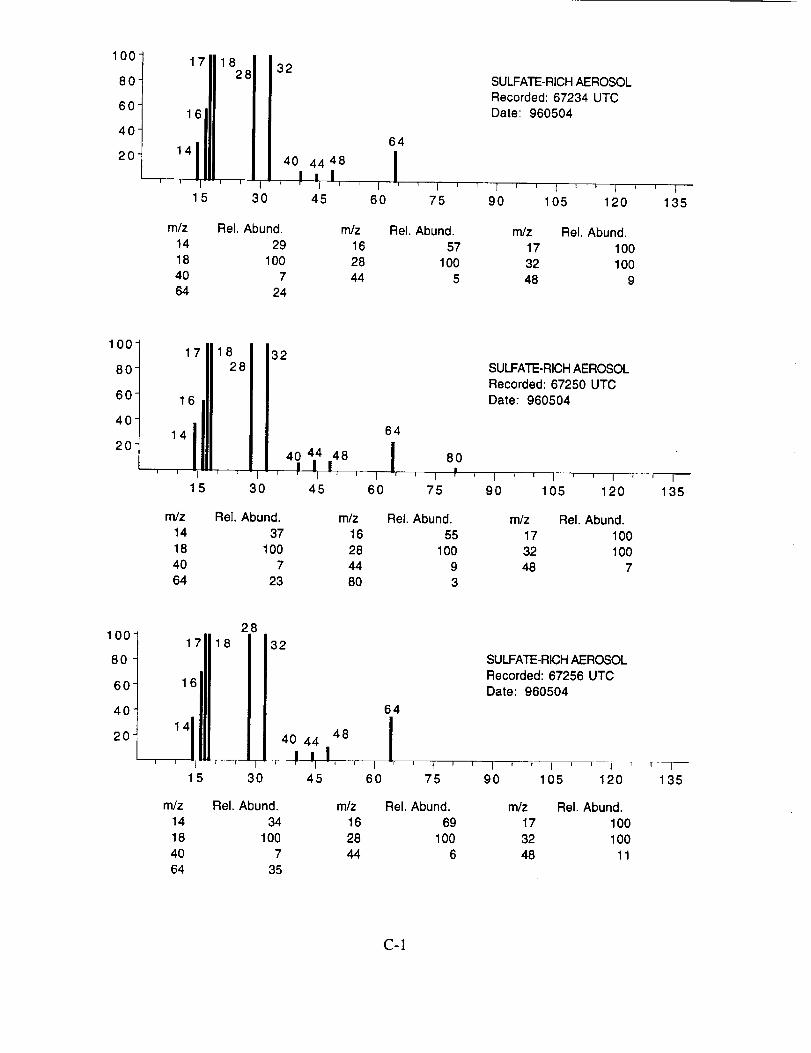
100
80
60
40
20
17 1 821
t -I - I I
15
32
30
40 44 48
, !,1-J f I
45
mR Rel. Abund. m/z
14 29 16
18 100 28
40 7 4464 24
I
60
SULFATE-RICH AEROSOL
Recorded: 67234 UTC
Date: 960504
64
!I ' ' I ' ' I _ ' I ' ' t
75 90 105 120 135
Rel. Abund. mR Rel. Abund.
57 17 100
100 32 100
5 48 9
100
80
60
40-
20- 8'
, 14 It - ,
15 30
32
64
-I - r 1 '
45 60
m/z Rel. Abund. mR
14 37 16
18 100 28
40 7 44
64 23 80
SULFATE-RICH AEROSOL
Recorded: 67250 UTCDate: 960504
8O
' I P ' I ' ' I ' ' I ' ' I75 90 105 120 135
Rel. Abund. mR Rel. Abund.
55 17 100
100 32 100
9 48 73
100
8O
60
40
20
17
i I
2818
I
15 30
32
4840 44
,-! ', !,45
64
Il Jr ,
6O
mR Rel. Abund. m/z
14 34 16
18 100 28
40 7 4464 35
SULFATE-RICH AEROSOLRecorded: 67256 UTC
Date: 960504
} p r I ' '--
75 90
Rel. Abund.
69
100
6
m/z
17
32
48
[ _ _ _T 1105 120 135
Rel. Abund.
100
10011
C-]
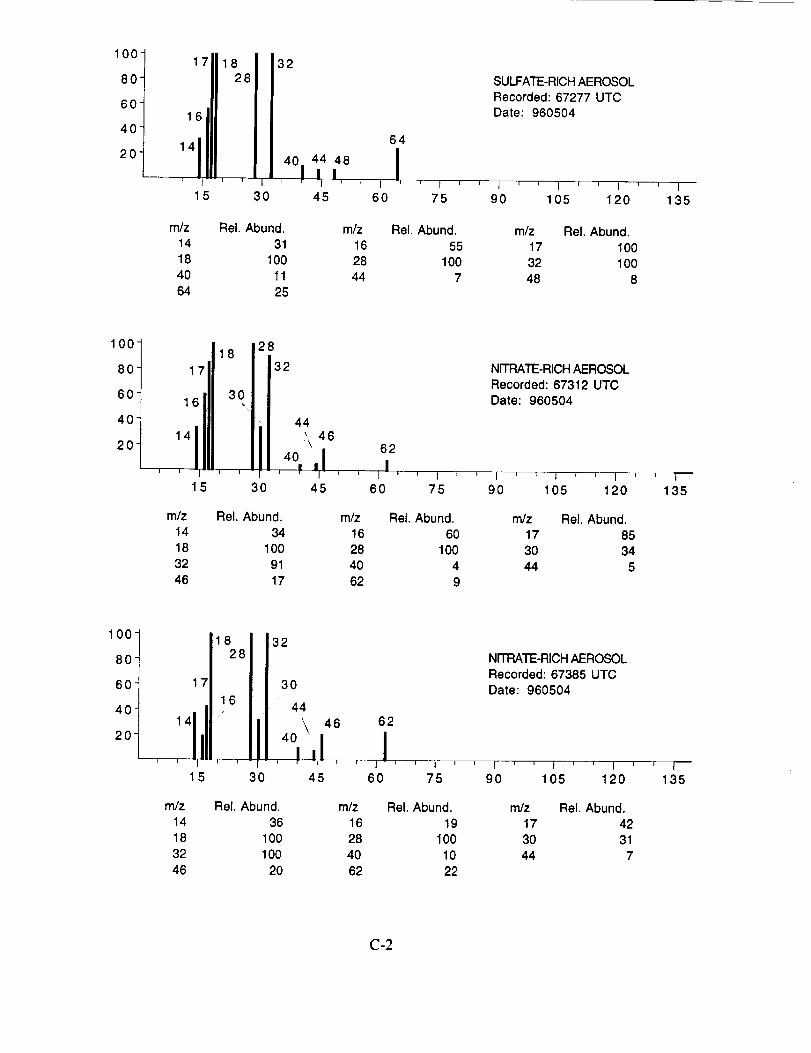
100
8O
60
40-
20-
17rrl,8
15
32
3O
m/z Rel. Abund.
14 31
18 100
40 11
64 25
SULFATE-RICH AEROSOL
Recorded: 67277 UTCDate: 960504
64
44 48 J,40! I I-I ' ' I -' ' I ' _ l ' ' I ' ' I ' ' I
45 60 75 90 105 120 135
m/z Rel. Abund. mR Rel. Abund.
16 55 17 100
28 100 32 100
44 7 48 8
100-
80-
60-
40-
20
18
4 30,
5 30
28
,32
m_ Rel. Abund.
14 34
18 100
32 91
46 17
44
_\ 46
NITRATE-RICH AEROSOL
Recorded: 67312 UTC
Date: 960504
624o J l, r' '
I- ' : I ' l l i l I ' L I ' ' I I l J
45 60 75 90 105 120 135
m_ Rel. Abund. m_ Rel. Abund.
16 60 17 85
28 100 30 34
40 4 44 562 9
100-
80-
60-
40-
20-
m/z
14
18
32
46
1828
17
16
1,1j_r i
15 3O
32
30
44
40 \ 46
NITRATE-RICH AEROSOL
Recorded: 67385 UTC
Date: 960504
62
p,,I '*,'J *, '-, . , , ,
45 60 75 90 105 120 135
Rel. Abund.
36
100
100
2O
m/z Rel. Abund. m/z Rel. Abund.
16 19 17 42
28 100 3O 31
40 10 44 762 22
C-2
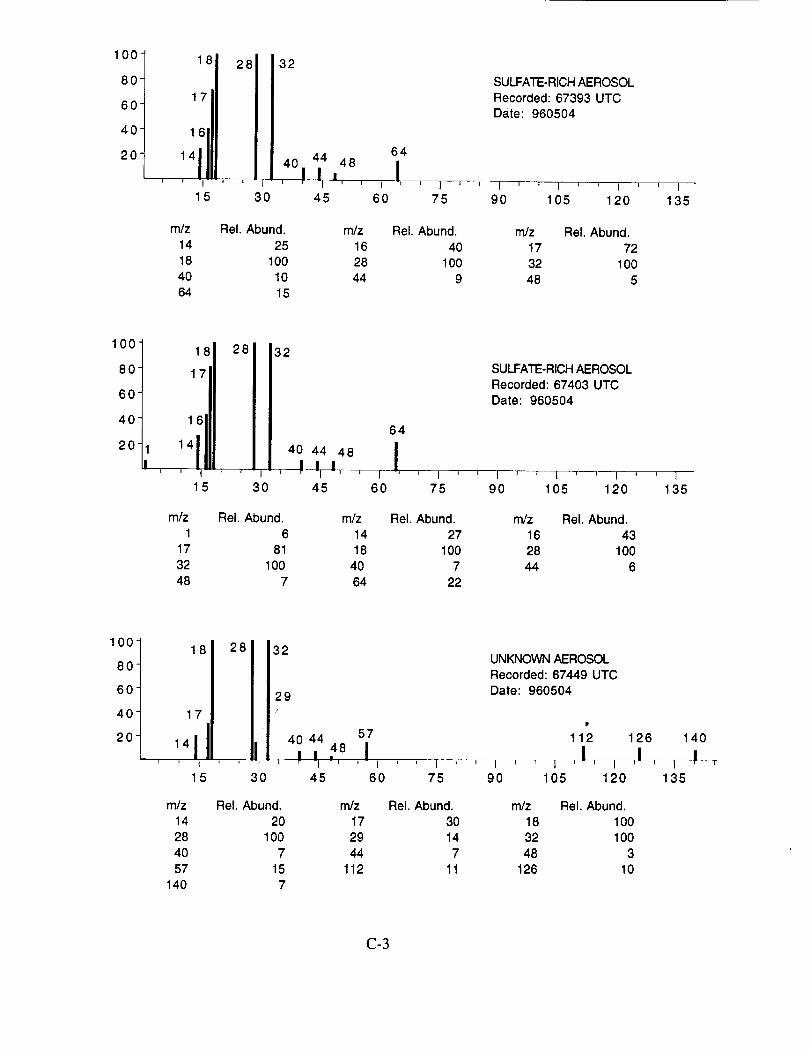
1°°1 18128
4°1 ,6111141,111,,
15 30
32
6440 44 48
pv, I' -I ' ' I '
45 60
m/z Rel. Abund. m/z
14 25 16
18 100 28
40 10 44
64 15
75
Rel. Abund.
40
100
9
SULFATE-RICH AEROSOL
Recorded: 67393 UTC
Date: 960504
'- I ' * I ' , I ' ' I90 105 120 135
m/z Rel. Abund.
17 72
32 100
48 5
1001 181 28
60
40 16
i -I I _
15 30
32
64
40 44 48 Ig i m !'L-'II_- ' I '
45 60
mR Rel. Abund. m/z
1 6 14
17 81 18
32 100 40
48 7 64
SULFATE-RICH AEROSOL
Recorded: 67403 UTC
Date: 960504
' I ' ' I ' ' I _ 1 t75 90 105 120
Rel. Abund.27
100
7
22
mR Rel. Abund.
16 43
28 100
44 6
, ]135
100-
80
6O
4O
2O
18 28
17
,41115 30
32
29
I
m/z Rel. Abund.
14 20
28 100
4O 7
57 15
140 7
UNKNOWN AEROSOL
Recorded: 67449 UTC
Date: 960504
It
4°444s 1,2 1261,o45 60 75 90 105 120 135
mR Rel. Abund. m/z Rel. Abund.
17 30 18 100
29 14 32 100
44 7 48 3
112 11 126 10
C-3
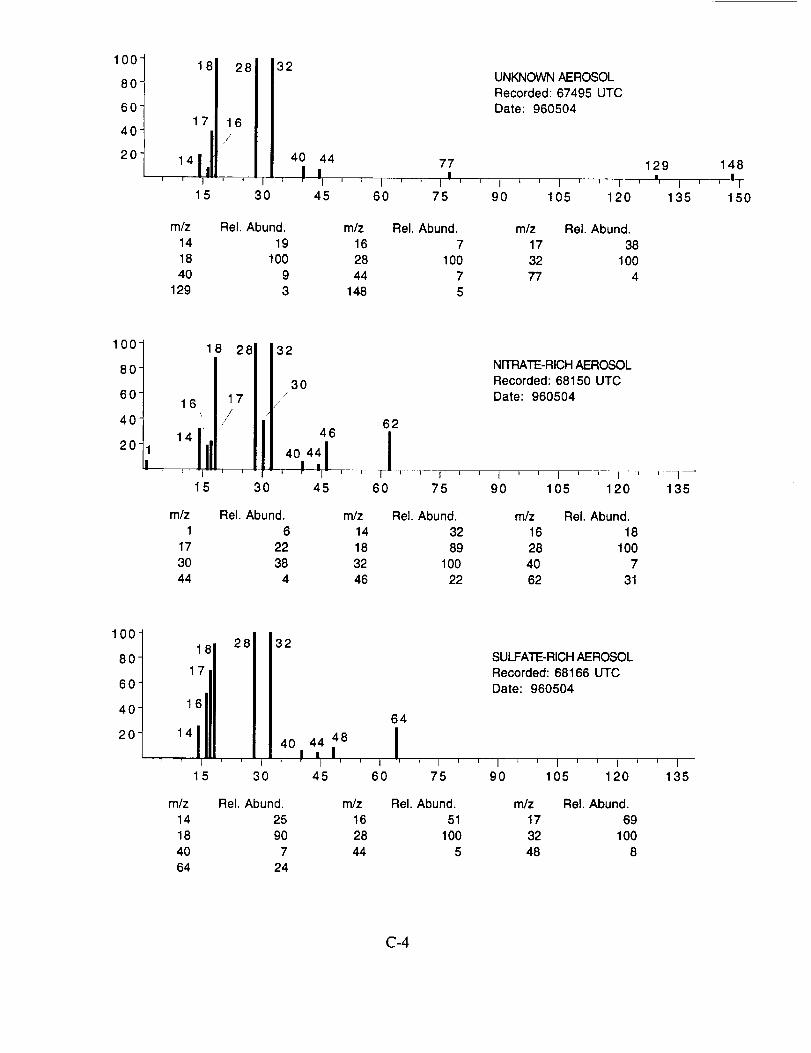
100-
80-
60"
40-
20" 14
J I
5
18 28 32
17 16
/
3O
UNKNOWN AEROSOLRecorded: 67495 UTC
Date: 960504
40 44 77 129 148_ 11 ' J I ' i i1_ I- ' I ' ' I r=-=_-[ , 8, t ' ' T
45 60 75 90 105 120 135 150
mr Rel. Abund.
14 19
18 100
4O 9
129 3
mr Rel. Abund. mR Rel. Abund.
16 7 17 3828 100 32 100
44 7 77 4
148 5
l°°t80
60
'°1120
8 28
16 17/
15 30
32
3O,/
62
40 44 ], J i-r- ' ' l- T-_--
45 60
mr Rel. Abund. m/z
1 6 14
17 22 18
3O 38 32
44 4 46
NITRATE-RICH AEROSOL
Recorded: 68150 UTC
Date: 960504
I ' ' l ' ' I ' ' I ' _ I
75 90 105 120 135
Rel. Abund.
32
89
100
22
m/z Rel. Abund.
16 18
28 100
40 7
62 31
100
8O
60
40
20
18
17
t6
14
15 30
28 32
40 44 48= |
' P'I" ' I45 60
m/z Rel. Abund. rn/z
14 25 16
18 90 28
40 7 44
64 24
SULFATE-RICH AEROSOLRecorded: 68166 UTC
Date: 960504
75 90 105 120 135
Rel. Abund.
51
100
5
rn/z Rel. Abund.
17 69
32 100
48 8
C-4
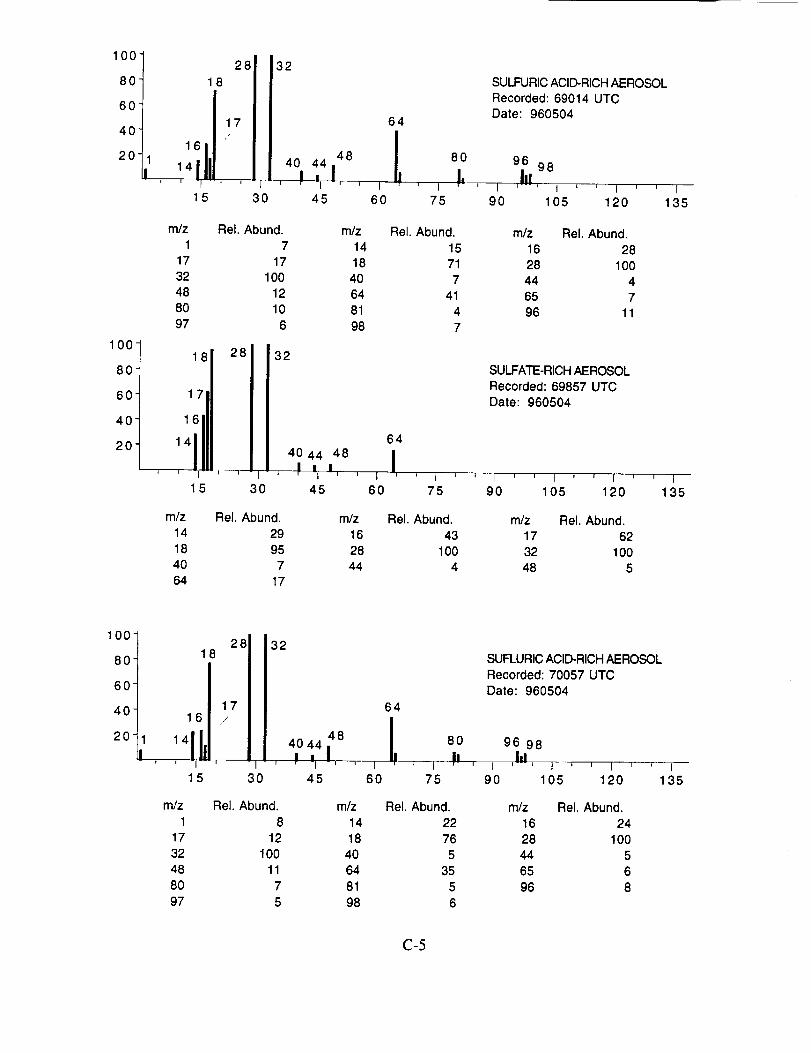
100-_
80-_
60
40
20J 16
15
28
8
17/
i
3O
32
4840 44
P,I!,45
64
J,60 75
m/z Rel. Abund. m/z Rel. Abund.
1 7 14 15
17 17 18 71
32 100 4O 7
48 12 64 41
80 10 81 4
97 6 98 7
32100-
181 288O
40 16
20 14 Ii j l , t
15 30
64
40 44 48 |I , n I
45 60
SULFURIC ACID-RICH AEROSOL
Recorded: 69014 UTCDate: 960504
96Inv98
I '---P I _ ' I ' ' 1
90 105 120 135
m/z Rel. Abund.
16 28
28 100
44 4
65 7
96 11
SULFATE-RICH AEROSOL
Recorded: 69857 UTC
Date: 960504
' I ' _ 1 ' ' I _ ' I ' ' I
75 90 105 120 135
m/z Rel. Abund. mR Rel. Abund.
14 29 16 43
18 95 28 10040 7 44 464 17
mR Rel. Abund.
17 62
32 100
48 5
100
8O
60
40
20
2818
1716 /
/
1411,t i I- i i
15 30
32
64I
40 44 48 lI!80
I,,I ' ,, , !I
45 60 75
m/z Rel. Abund. mR Rel. Abund.
1 8 14 22
17 12 18 76
32 100 40 5
48 11 64 35
80 7 81 5
97 5 98 6
SUFLURIC ACID-RICH AEROSOL
Recorded: 70057 UTC
Date: 960504
96 98
I ,ill , I ' ' I '
90 105 120
m/z Rel. Abund.
16 24
28 100
44 5
65 6
96 8
T135
C-5
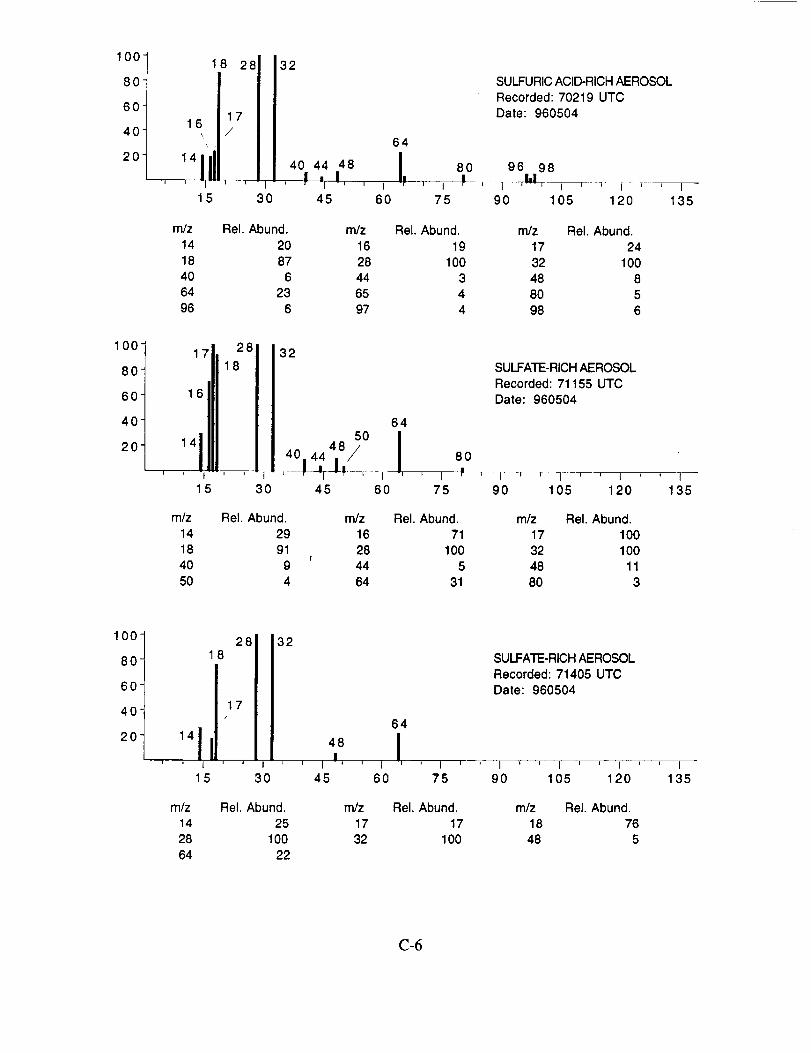
100
8O
6O
40-
20-
8 28 32
1716
'ld7-- i i
15 30
40 44 48
, ! , Ii -' ' I45 60
rn/z Rel. Abund. rn/z
14 20 16
18 87 28
40 6 44
64 23 65
96 6 97
64
it , I
75
SULFURIC ACID-RICH AEROSOL
Recorded: 70219 UTC
Date: 960504
80 96 98i _
90 105 120 135
Rel. Abund.
19
100
34
4
mr Rel. Abund.
17 24
32 100
48 8
8O 5
98 6
100
8O
60
40
20
17 28
16 I 1814i -_ I I
5
32
3O
64
i 8045 60 75
m/z Rel. Abund. mr
14 29 16
18 91 28!
40 9 44
50 4 64
Rel. Abund.
71
100
5
31
SULFATE-RICH AEROSOL
Recorded: 71155 UTC
Date: 960504
I F r ! • , t _ * I90 105 120 135
m/z Rel. Abund.
17 100
32 10048 11
80 3
100
8O
60-
40-
20-
288
17/
I t 1 I I
15
32
30
64
46 i' I I' ' I _ '
45 60
mR Rel. Abund. m/z
14 25 17
28 100 3264 22
75
Rel. Abund.
17
100
SULFATE-RICH AEROSOL
Recorded: 71405 UTCDate: 960504
90 105 120 135
m/z Rel. Abund.
18 76
48 5
C-6
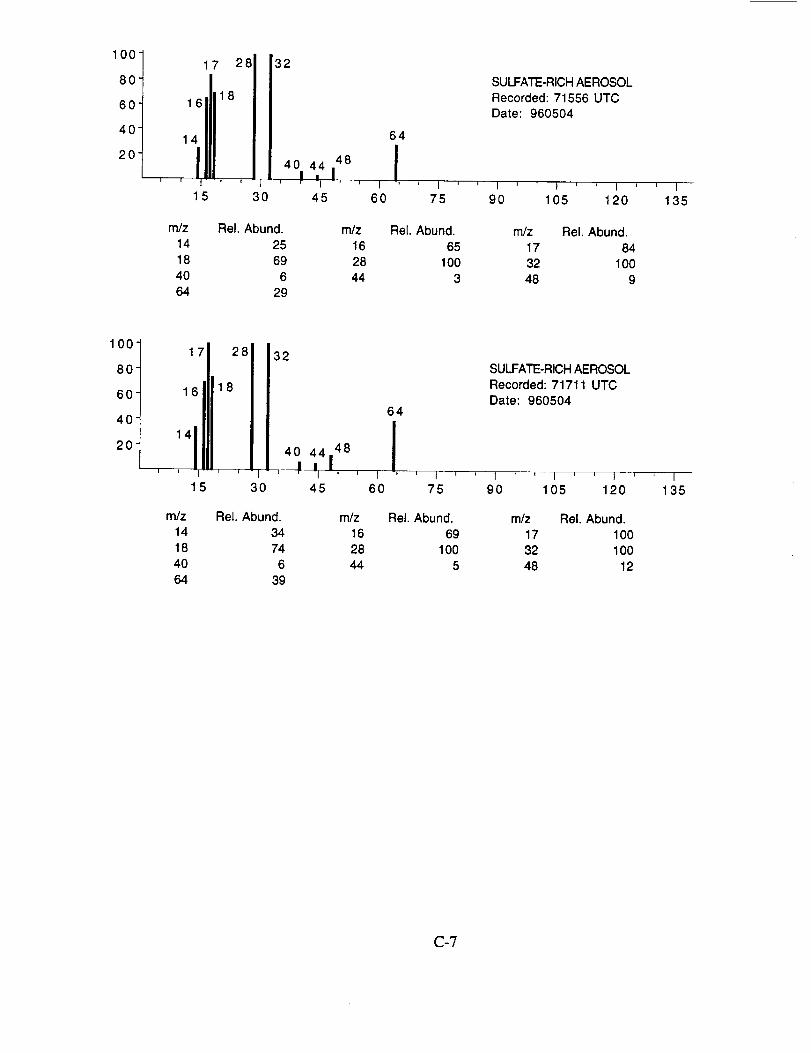
100
8O
60
40
20
17 28
15 30
32
64
40 .,4 146 J' _ -I -_ ' I _ _ I '
45 60 75
mR Rel. Abund. mR Rel. Abund.
14 25 16 6518 69 28 100
40 6 44 364 29
SULFATE-RICH AEROSOL
Recorded: 71556 UTC
Date: 960504
I ' ' I ' ' I '90 105 120
m/z Rel. Abund.
17 84
32 100
48 9
I135
looI 1712811328 0 SULFATE-RICH AEROSOL
6 0 1 6 1 8 Recorded: 71711 UTC
40
4o; 4820 41-I ' r * .... ' I ' _'I ' ' I ' ' I ' ' I
15 30 45 60 75 90 105 120 135
rn/z Rel. Abund. mR Rel. Abund.
14 34 16 6918 74 28 100
40 6 44 5
64 39
mR Rel. Abund.
17 10032 100
48 12
C-7
APPENDIX D
SELECTED AEROSOL MASS SPECTRA FROM SUCCESS MISSION
FLIGHT 09215
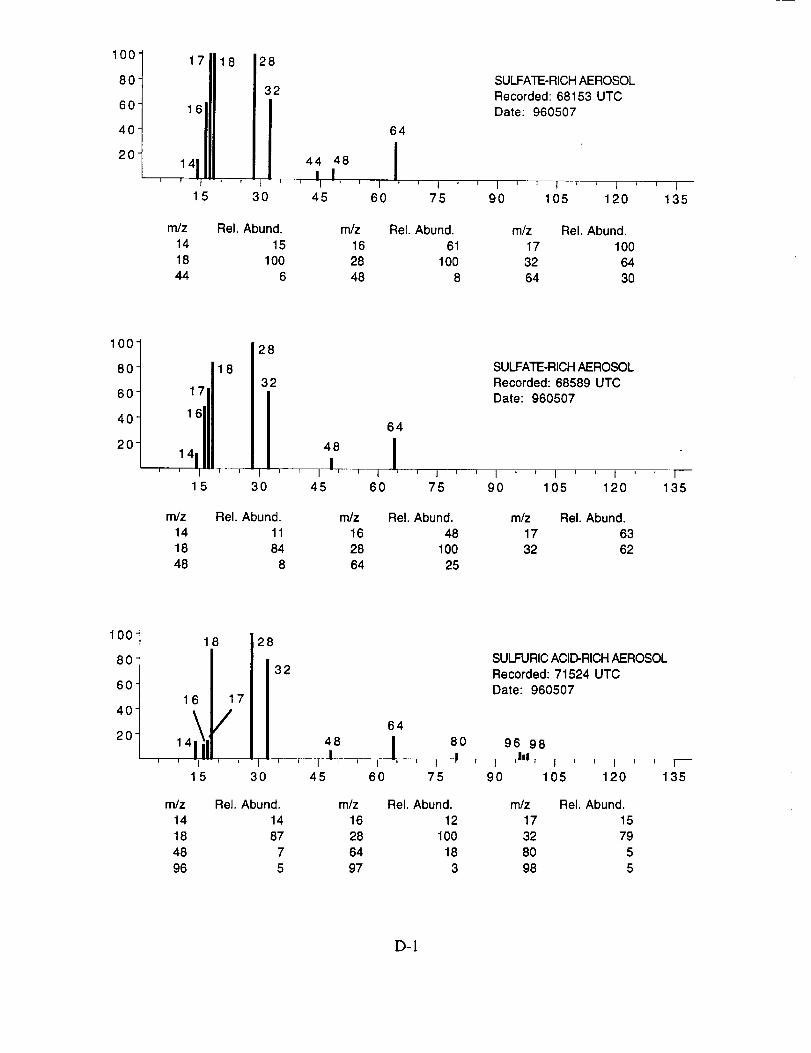
1°°l ,,11,812880 32
40
20
I
15 30
m/z Rel. Abund.
14 15
18 100
44 6
SULFATE-RICH AEROSOL
Recorded: 68153 UTC
Date: 960507
64
' !I ' I " ' I ' ' i ' ' I ' ' i ' ' I
45 60 75 90 105 120 135
mR Rel. Abund. m/z Rel. Abund.
16 61 17 100
28 100 32 64
48 8 64 30
100-
80
60
40
20 18
17
16
7"- T I
15
28
SULFATE-RICH AEROSOL
2 Recorded: 68589 UTC
Date: 960507
64
' I ' ' I ' ' I ' ' I ' ' I ' _ I30 45 60 75 90 105 120 135
m/z Rel. Abund.
14 11
18 84
48 8
m/z Rel. Abund. mR Rel. Abund.
16 48 17 6328 100 32 62
64 25
100
8O
60
40
20
18 28
32
16 17
] i I i
15 30
48
T- I,
45
m/z Rel. Abund. mR
14 14 16
18 87 28
48 7 64
96 5 97
64
I 6oI ' ' I P
60 75
Rel. Abund.
12
100
18
3
SULFURIC ACID-RICH AEROSOL
Recorded: 71524 UTCDate: 960507
96 98
90 105 120
mR Rel. Abund.
17 15
32 79
80 5
98 5
t135
D-I
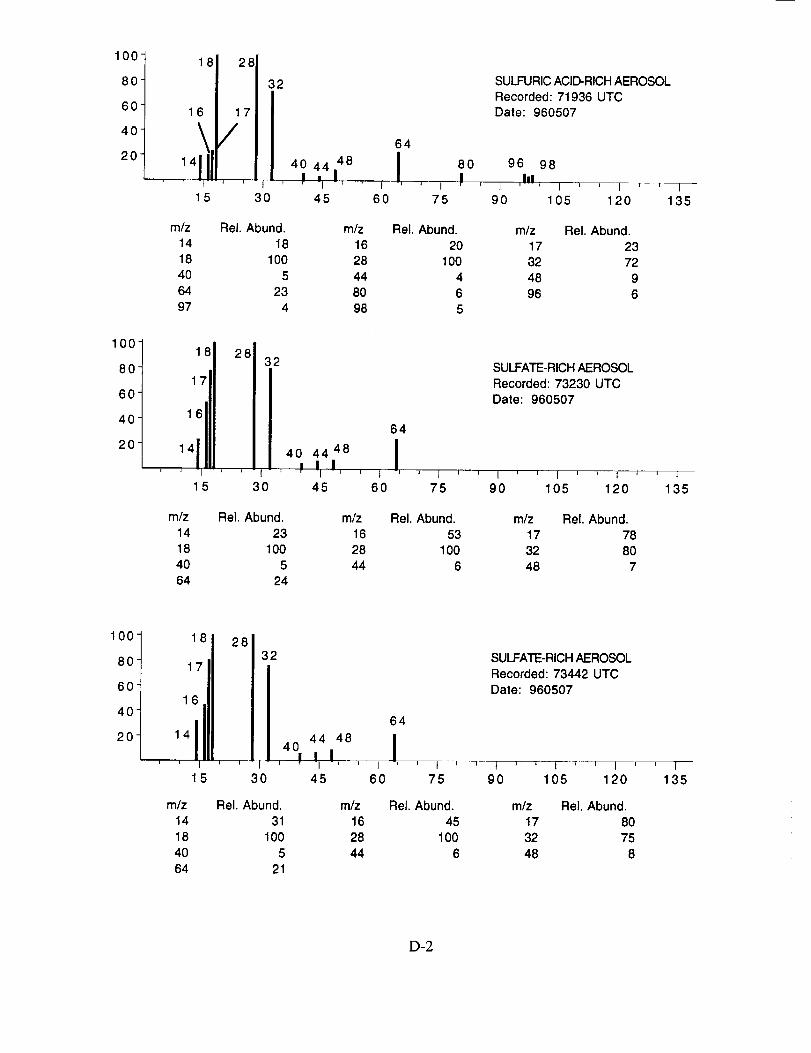
100
8O
60
40
20
181 2_:
16 I 17
15 30
32 SULFURIC ACID-RICH AEROSOLRecorded: 71936 UTC
Date: 960507
64
40 44 I_ 8 I 80 9698hi' ! i- ' i ' , I ! , i ' , , , , i , , t
45 60 75 90 105 120 135
mR Rel. Abund. mR Rel. Abund.
16 20 17 2328 100 32 72
44 4 48 980 6 96 6
98 5
mR Rel. Abund.
14 18
18 100
4O 5
64 23
97 4
I100! 18 28
80 i 2,O irl40 16
i I _ J -
15 30
SULFATE-RICH AEROSOL
Recorded: 73230 UTC
Date: 960507
64
45 60 75 90 105 120 135
mR Rel. Abund. mR Rel. Abund.
14 23 16 53
18 100 28 100
40 5 44 664 24
mR Rel. Abund.
17 78
32 80
48 7
loo7 161 26180 17 32 SULFATE-RICH AEROSOL
1__ Recorded: 73442 UTC
60 1 6 Date: 960507
40 64
20 4% 44 48 I, II I, , I ' ' I ' • I ' ' I -T ' I ' ' I
15 30 45 60 75 90 105 120 135
m/z Rel. Abund. mR Rel. Abund. mR Rel. Abund.
14 31 16 45 17 80
18 100 28 100 32 75
40 5 44 6 48 8
64 21
D-2
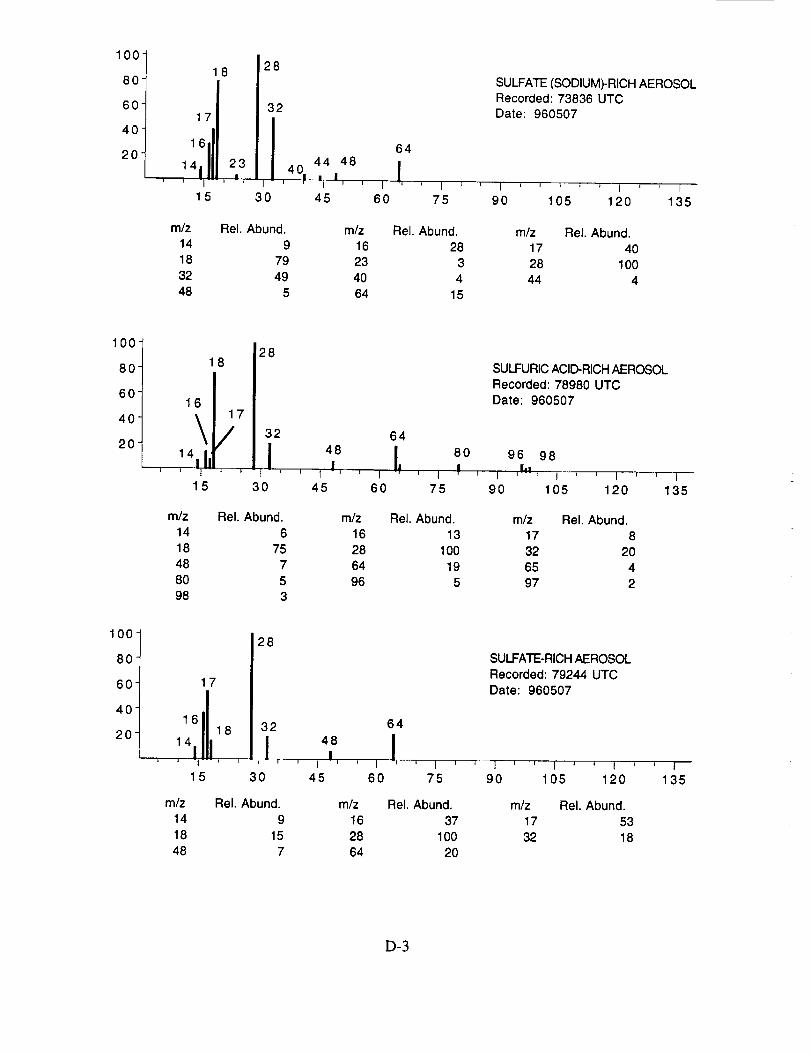
100-
80-
60-
40
20
18 28
17[ 32
41 23Iii _ i - i
15 30
,4_ 44148-I J
45' I
60
m/z Rel. Abund. m/z
14 9 16
18 79 23
32 49 40
48 5 64
SULFATE (SODIUM)-RICH AEROSOLRecorded: 73836 UTCDate: 960507
64
I,I _ ' I ' ' I _ ' 1 ' ' I
75 90 105 120 135
Rel. Abund.
28
3
4
15
mR Rel. Abund.
17 4028 100
44 4
100
8O
60
40
20
288
1617
\/14 Ili_ ,
i i t i i
15 30
i
45
48
I I' ' I
60
m/z Rel. Abund. m/z
14 6 16
18 75 28
48 7 6480 5 96
98 3
t75
SULFURIC ACID-RICH AEROSOL
Recorded: 78980 UTC
Date: 960507
Rel. Abund.
13
100
195
80 96 98i l=l
• ' I '-- ' I ' ' I ' -_ 790 105 120 135
m/z Rel. Abund.
17 832 20
65 4
97 2
100
8O
60
40
20
28
17
, 14! I ,
15 30
48
t |' ' I
45 60
m/z Rel. Abund. m/z
14 9 16
18 15 28
48 7 64
64
SULFATE-RICH AEROSOL
Recorded: 79244 UTC
Date: 960507
I' ' I ' _ T _ _ I ' ' I ' ' I
75 90 105 120 135
Rel. Abund.
37
100
2O
m/z Rel. Abund.
17 53
32 18
D-3
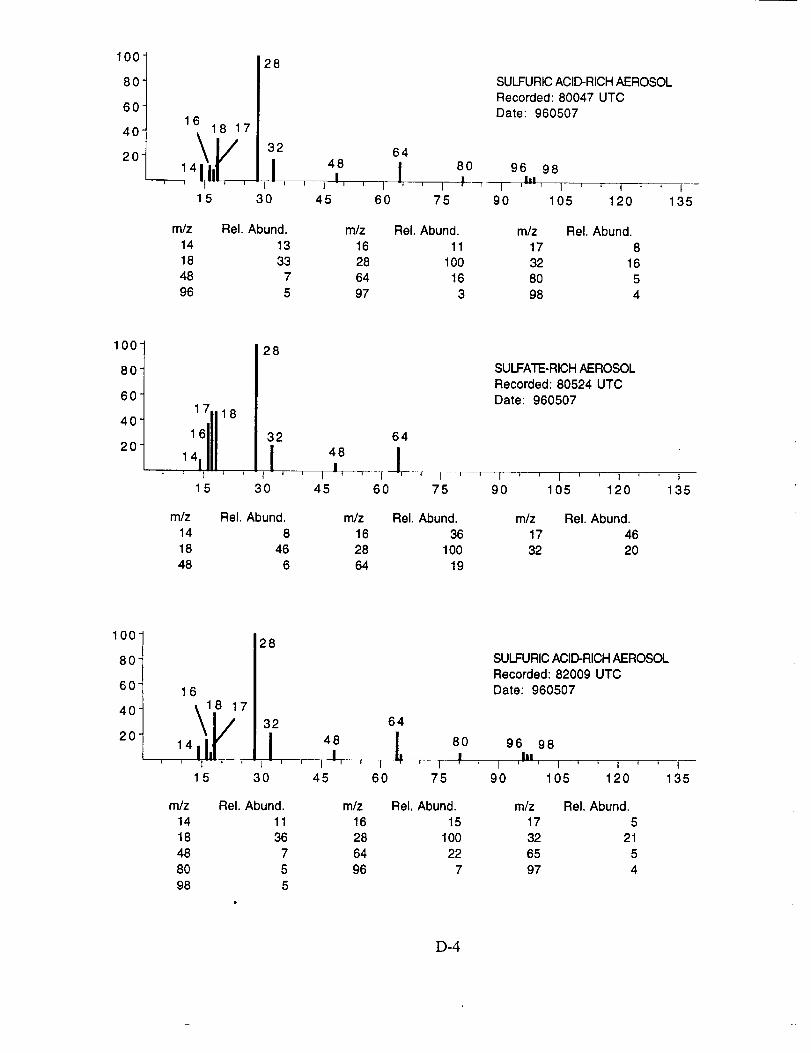
100"
80-
60-
40-
20-
28
1618 17
I I
15 30
32 64
48 i' ' I I' ' I '
45 60
mR Rel. Abund. mR
14 13 16
18 33 28
48 7 64
96 5 97
SULFURIC ACID-RICH AEROSOL
Recorded: 80047 UTC
Date: 960507
80 96 98
I _ _1 _!_!_ 1=' ' I ' ' 1
75 90 105 120 135
Rel. Abund.
11
100
16
3
m/z Rel. Abund.
17 8
32 1680 5
98 4
100-
80-
60-
40-
20-
28
171841t
15 30
m/z Rel. Abund.
14 8
18 46
48 6
SULFATE-RICH AEROSOL
Recorded: 80524 UTCDate: 960507
64
48 j, i I_ 7 I ' ' I ' ' I ' ' I ' _ I ' ' t
45 60 75 90 105 120 135
mR Rel. Abund. mR Rel. Abund.
16 36 17 46
28 100 32 20
64 19
100
8O
60
40
20
16
15
28
32 64
,8 !' ' I I-r_- I 4 , i
30 45 60 75
SULFURIC ACID-RICH AEROSOL
Recorded: 82009 UTC
Date: 960507
80 96 98
I , I , Ill , I ' ' I ' ' I_-"
90 105 120 135
mR Rel. Abund. mR Rel. Abund.
14 11 16 1518 36 28 100
48 7 64 22
80 5 96 7
98 5
mR Rel. Abund.
17 532 21
65 5
97 4
D-4
![V. SPECIATION A. Allopatric Speciation B. Parapatric Speciation (aka Local or Progenitor - Derivative) C. Adaptive Radiation D. Sympatric Speciation [Polyploidy]](https://img.pdfslide.us/doc/110x75/56649d3f5503460f94a186e2/v-speciation-a-allopatric-speciation-b-parapatric-speciation-aka-local.jpg)


![ISSN: 0278-6826 print / 1521-7388 online DOI: 10.1080 ...stakahama.github.io/aprl/files/Takahama2013.pdf · 2003; aerosol chemical speciation monitor [ACSM], Ng et al. 2010; thermal](https://img.pdfslide.us/doc/110x75/5f0aecdc7e708231d42e03d5/issn-0278-6826-print-1521-7388-online-doi-101080-2003-aerosol-chemical.jpg)