Embed Size (px)
Citation preview
Charles University in Prague
Faculty of Mathematics and Physics
DOCTORAL THESIS
Lukas Marek
Instrumentation and Evaluation for
Dynamic Program Analysis
Department of Distributed and Dependable Systems
Advisor: Doc. Ing. Petr Tuma, Dr.
Study programme: Computer Science
Specialization: Software Systems
Prague 2014

Acknowledgments
I would like to thank my advisor Petr Tuma for his encouragement whiledeciding what to do next after finishing my master degree and his support andguidance through my PhD study. I would like to thank all my colleagues from theD3S department and especially my colleagues from the room 205 for making thestudy pleasant and fun experience. I would like to also thank my SCIEX-NMSchadvisor Walter Binder and his colleagues for hosting me for one beautiful year atUniversity of Lugano in Switzerland.
I would like to thank my family and my girlfriend Lucie for their endlesssupport.
I hereby declare that I have authored this doctoral thesis on my own1, using onlythe cited literature and other technical sources.
I understand that my work relates to the rights and obligations under the ActNo. 121/2000 Coll., the Copyright Act, as amended, in particular the fact thatthe Charles University in Prague has the right to conclude a license agreementon the use of this work as a school work pursuant to Section 60 paragraph 1 ofthe Copyright Act.
In Prague, on ............ ........................
1The papers included in Part II have been written in cooperation with their respectiveco-authors.
Annotations
Title
Instrumentation and Evaluation for Dynamic Program Analysis
Author
Lukas Mareke-mail: [email protected], phone: +420 221 914 190
Department
Department of Distributed and Dependable SystemsFaculty of Mathematics and PhysicsCharles University in Prague, Czech Republic
Advisor
Doc. Ing. Petr Tuma, Dr.Department of Distributed and Dependable Systemse-mail: [email protected], phone: +420 221 914 267
Abstract
A dynamic program analysis provides essential information during later phas-es of an application development. It helps with debugging, profiling, perfor-mance optimizations or vulnerability detection. Despite that, support forcreating custom dynamic analysis tools, especially in the domain of managedlanguages, is rather limited.In this thesis, we present two systems to help improve application observabil-
ity on the Java platform. DiSL is a language accompanied with a frameworkallowing simple and flexible instrumentation for the dynamic program analy-sis. DiSL provides high level abstractions to enable quick prototyping even forprogrammers not possessing a knowledge of Java internals. A skilled analysisdeveloper gains full control over the instrumentation process, thus does nothave to worry about unwanted allocations or hidden execution overhead.ShadowVM is a platform that provides isolation between the observed appli-
cation and the analysis environment. To reduce the amount of possible inter-actions between the analysis and the application, ShadowVM offloads analysisevents out of the context of the application. Even though the isolation is theprimary focus of the platform, ShadowVM introduces a number of techniquesto stay performance comparable and provide a similar programming model asexisting dynamic analysis frameworks.
Keywords
Bytecode instrumentation; dynamic program analysis; aspect-oriented pro-gramming; JVM
Anotace
Nazev prace
Instrumentace a vyhodnocenı pro dynamickou analyzu aplikacı
Autor
Lukas Mareke-mail: [email protected], phone: +420 221 914 190
Katedra
Katedra distribuovanych a spolehlivych systemuMatematicko-fyzikalnı fakultaUniverzita Karlova v Praze
Skolitel
Doc. Ing. Petr Tuma, Dr.Katedra distribuovanych a spolehlivych systemue-mail: [email protected], tel.: +420 221 914 267
Abstrakt:
Dynamicka analyza aplikacı zprostredkovava dulezite informace behem poz-dejsıch fazı vyvoje. Napomaha pri ladeni, profilovanı, vykonnostnı optima-lizaci nebo pri detekci bezpecnostnıch chyb. Nicmene, podpora pro vytvarenıvlastnıch nastroju pro dynamickou analyzu, specialne v oblasti rızenych jazyku,je pomerne omezena.Tato prace prezentuje dva systemy, ktere pomahajı zlepsit sledovanı aplikacına platforme Java. DiSL je jazyk a framework, ktery umoznuje jednoduchoua flexibilnı instrumentaci zamerenou na dynamickou analyzu. DiSL poskytujeabstrakce vyssı urovne pro rychle prototypovanı i pro vyvojare, kterı nemajıznalosti internıch systemu v Jave. Kvalifikovany vyvojar zıskava plnou kontrolna instrumentacnım procesem, tudız se nemusı bat nevyzadanych alokacı neboskryte behove rezie.ShadowVM je platforma poskytujıcı separaci mezi sledovanou aplikacı a pros-tredım pro analyzu. Pro zmırnenı interakcı mezi analyzou a aplikacı, Sha-dowVM transportuje udalosti analyzy mimo kontext aplikace. I kdyz je pri-marnım cılem platformy izolace, ShadowVM zavadı nekolik technik tak, abyzustala rychlostne srovnatelna a vytvarela obobne vyvojove podmınky jakoexistujıcı frameworky pro dynamickou analyzu.
Klıcova slova
Bajtkodova instrumentace; dynamicka analyza programu; aspektove oriento-vane programovanı; JVM
Contents
I Introduction and Contribution Overview 3
1 Introduction 51.1 Thesis structure . . . . . . . . . . . . . . . . . . . . . . . . . . . . 61.2 Dynamic analysis . . . . . . . . . . . . . . . . . . . . . . . . . . . 61.3 Application observability . . . . . . . . . . . . . . . . . . . . . . . 7
1.3.1 Observation using execution callbacks . . . . . . . . . . . . 71.3.2 Instrumentation . . . . . . . . . . . . . . . . . . . . . . . . 81.3.3 Sampling . . . . . . . . . . . . . . . . . . . . . . . . . . . 8
1.4 Dynamic analysis evaluation . . . . . . . . . . . . . . . . . . . . . 81.4.1 In-process analysis . . . . . . . . . . . . . . . . . . . . . . 91.4.2 Out-of-process analysis . . . . . . . . . . . . . . . . . . . . 9
1.5 Application observability in Java . . . . . . . . . . . . . . . . . . 91.5.1 Instrumentation in Java . . . . . . . . . . . . . . . . . . . 10
1.6 Dynamic analysis evaluation in Java . . . . . . . . . . . . . . . . 121.7 Dynamic analysis pitfalls . . . . . . . . . . . . . . . . . . . . . . . 131.8 Goals revisited . . . . . . . . . . . . . . . . . . . . . . . . . . . . 16
2 Overview of Contribution 192.1 DiSL, domain specific language for Java bytecode instrumentation 192.2 ShadowVM, framework for remote dynamic analysis evaluation . . 22
II Collection of Papers 27
3 DiSL: A Domain-Specific Language for Bytecode Instrumenta-tion 31
4 ShadowVM: Robust and Comprehensive Dynamic Program Anal-ysis for the Java Platform 45
5 Introduction to Dynamic Program Analysis with DiSL 57
III Related Work and Conclusion 93
6 Related Work 956.1 Instrumentation frameworks . . . . . . . . . . . . . . . . . . . . . 95
6.1.1 Instrumentation in machine code . . . . . . . . . . . . . . 956.1.2 Instrumentation in Java . . . . . . . . . . . . . . . . . . . 976.1.3 Bytecode manipulation libraries . . . . . . . . . . . . . . . 976.1.4 Java instrumentation frameworks . . . . . . . . . . . . . . 986.1.5 Frameworks with predefined probes . . . . . . . . . . . . . 100
6.2 Frameworks for dynamic analysis evaluation in Java . . . . . . . . 1016.2.1 In-process analysis frameworks . . . . . . . . . . . . . . . . 1016.2.2 Out-of-process analysis frameworks . . . . . . . . . . . . . 102
1
6.3 Instrumentation and evaluation frameworks without sources . . . 105
7 Conclusion 1077.1 Future work . . . . . . . . . . . . . . . . . . . . . . . . . . . . . . 108
References 111
List of Publications 117
2
Part I
Introduction and ContributionOverview
3

Chapter 1
Introduction
Dynamic program analysis plays an important role in software development. Itis used to uncover implementation defects or obtain various application charac-teristics. There are many examples of sophisticated dynamic analysis such as:
Taint analysis The taint analysis observes propagation of values from an initialset of variables through the application. The initial set typically contains variablesholding the application input received over a network, through GUI or from adatabase. As a malicious input can compromise a run of the application, theapplication uses specialized methods to verify/sanitize the received input. Thegoal of the taint analysis is to track whether all the received data went through thesanitization process. If the data manages, through a series of computations andassignments, to escape the sanitization and is used as an input in a potentiallyunsafe operation, the taint analysis reports the problematic data flow.
Execution time profiling Another often used dynamic analysis is the execu-tion time profiling. The analysis measures the execution time of a method byacquiring the timing information at the entry and at the exit of the method. Theobservation coverage of execution time profiling is fully adjustable, starting froma single method to the whole application code. As the observation often slowsdown the application by orders of magnitude, limiting the coverage to only asmall part of the application brings noticeable performance gains. On the con-trary, while observing a more complex method, it may be useful to profile themethod with a granularity of basic blocks to obtain more detailed informationabout its behaviour.
Data race detection Yet another example of dynamic analysis is data racedetection in multi-threaded applications. At runtime, the data race analysis mon-itors all field accesses and lock operations. When a non-volatile field is accessed bymultiple threads without relevant lock acquisition, the analysis reports a possibledata race.
Object lifetime analysis In long running applications, memory leaks maydeplete all available application memory. Even though the problem is typicalfor languages with dedicated allocation and deallocation routines, memory leaksmay happen even in languages using garbage collector. An object is considereda memory leak if the application is holding a reference to the object but doesnot intend to use it in the future. Such object cannot be garbage-collected andoccupies memory. The object lifetime analysis tracks all manipulations with ref-erences (pointers) and is able to determine whether an object can be deallocated,i.e., which references on objects are held longer than necessary.
To perform such analyses, the developer often uses well known dynamic anal-ysis tools like OProfile [32], VTune [12, 75], gprof [10, 57], JDB [18] or Visu-
5
alVM [42]. However, such tools are often crafted to collect only one or a setof similar metrics. When a more complex analysis is required, the developer isforced to create a custom solution.
Dynamic analysis tools are carefully designed to not interfere with the ob-served application. Any change in the state or control flow of the applicationcould potentially lead to its invalid behaviour and distorted observation results.It is therefore highly recommended to use one of the analysis frameworks such asdtrace [48] (SystemTap [38, 74]), Valgrind [40, 70] or pin [34, 64] as they providesafe environment for writing custom dynamic analyses. While such frameworksexist for native applications, managed languages still lack a widely adopted solu-tion.
One of the key aspects of a framework for building custom dynamic analyses isthe ability to inform about various types of events happening in the applicationand offer rich context information while analysing these events. The analysisshould be performed in a safe environment where the developer does not have toworry about undesired side effects on the observed application. As performanceis one of the biggest problems of dynamic analysis frameworks, induced overheadshould be minimal and fully under control of the developer. We believe thatone reason for lack of wide adoption of existing Java analysis frameworks is theirinability to deliver a satisfactory solution in all the mentioned aspects. Therefore,the primary goal of the thesis is to create a platform that would ease developmentof dynamic program analyses.
1.1 Thesis structure
The structure of the thesis is as follows. The next section gives a brief overviewof application observability in general, followed by a summary of observationalternatives in Java. The second part of this chapter summarizes our experiencewith dynamic analysis in managed runtimes and concludes with the revisitedgoals of the thesis.
The second chapter summarizes our contribution starting with a high levelinstrumentation language for Java called DiSL. The rest of the second chapterintroduces an environment for analysis evaluation called ShadowVM.
Chapters three, four and five list three published papers containing the detailsof our work. Chapter six describes the related work. Chapter seven concludes.
1.2 Dynamic analysis
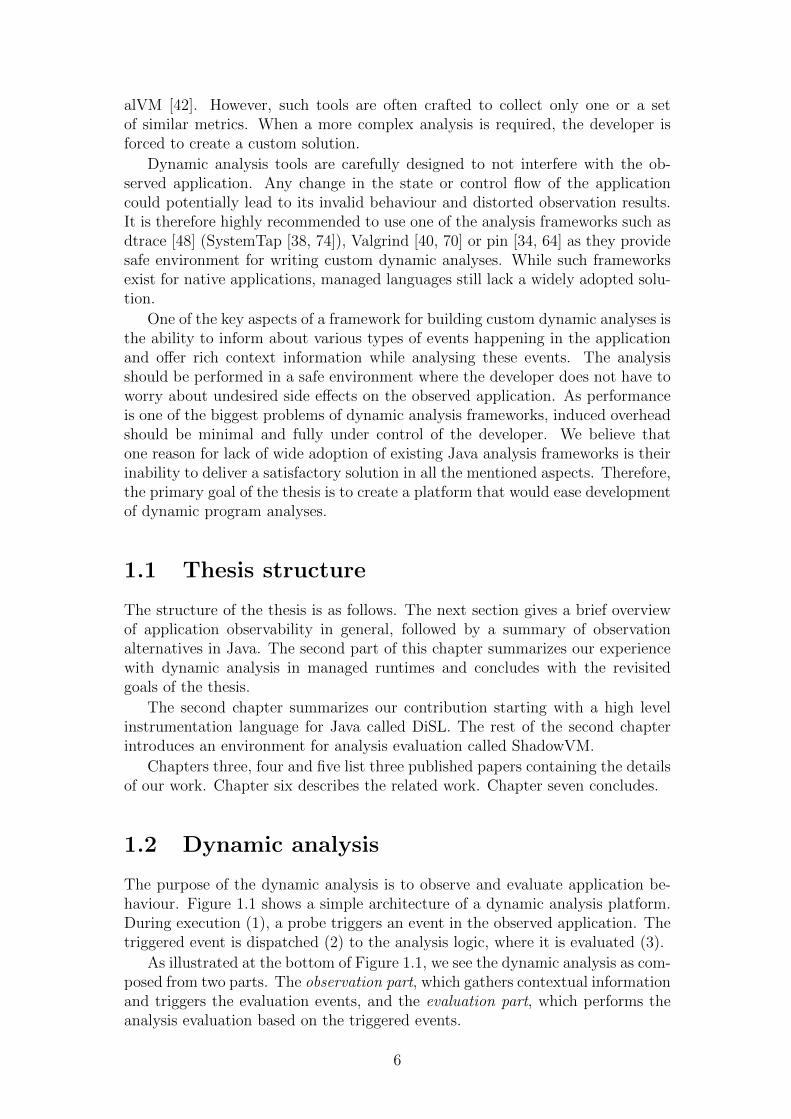
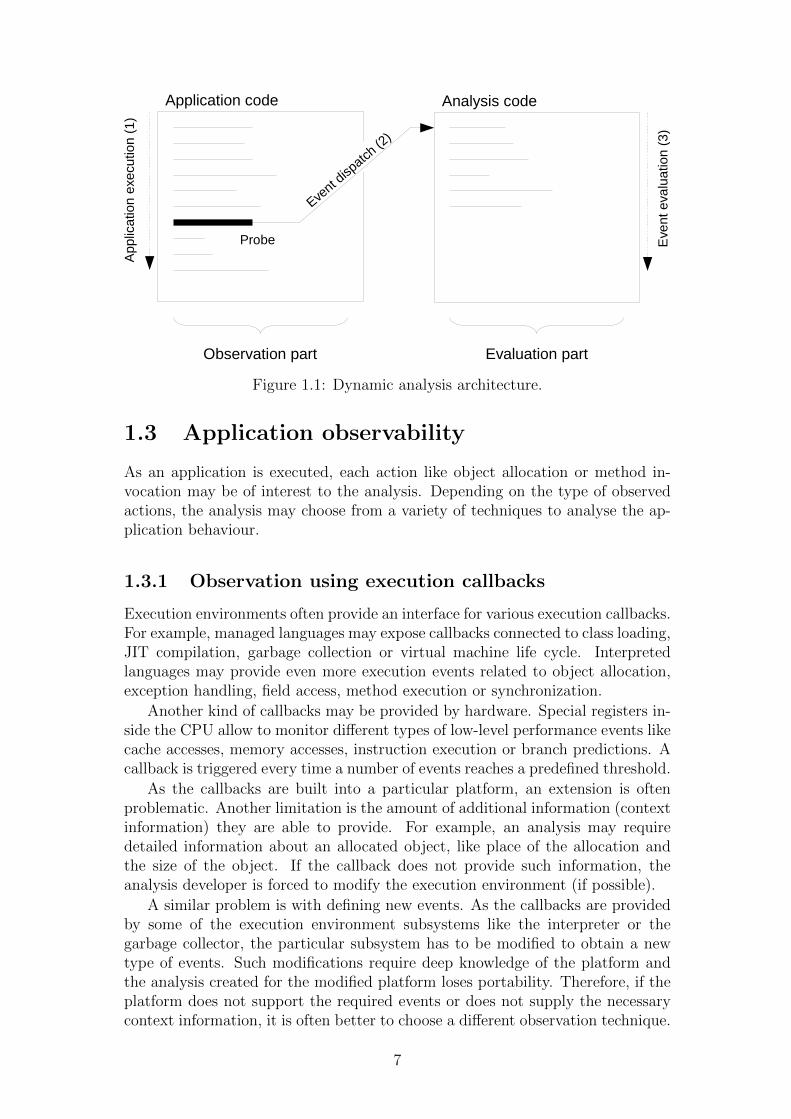
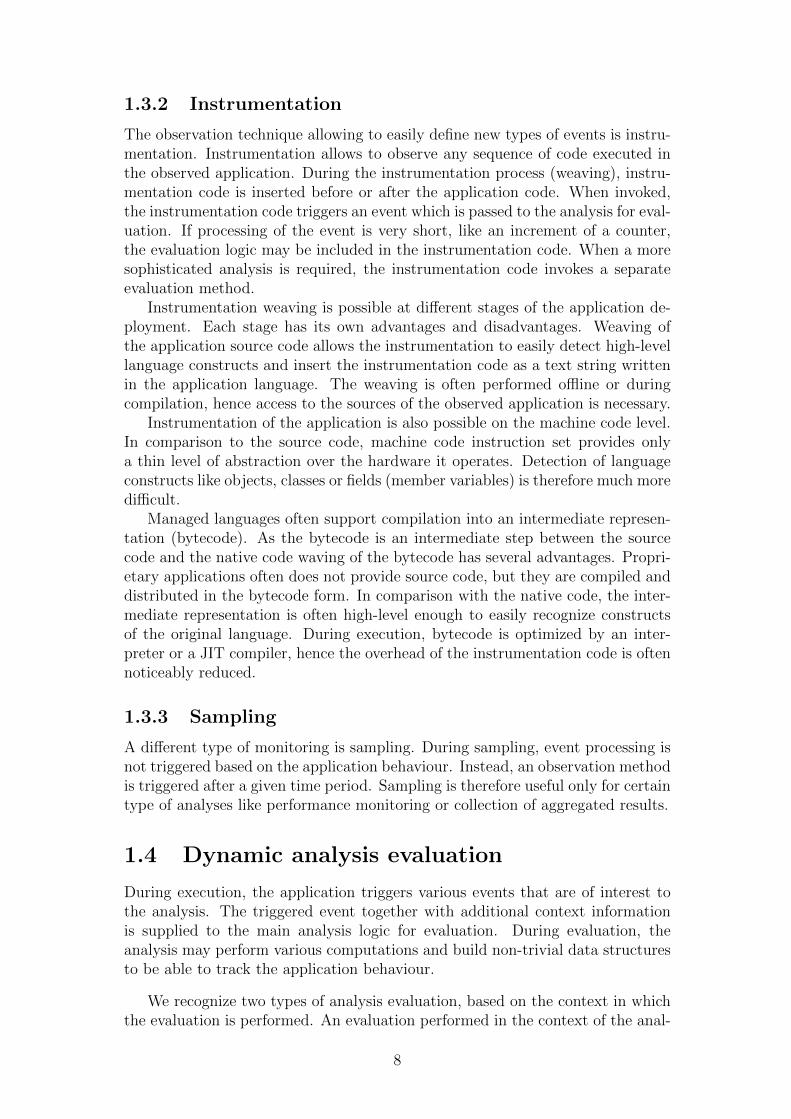
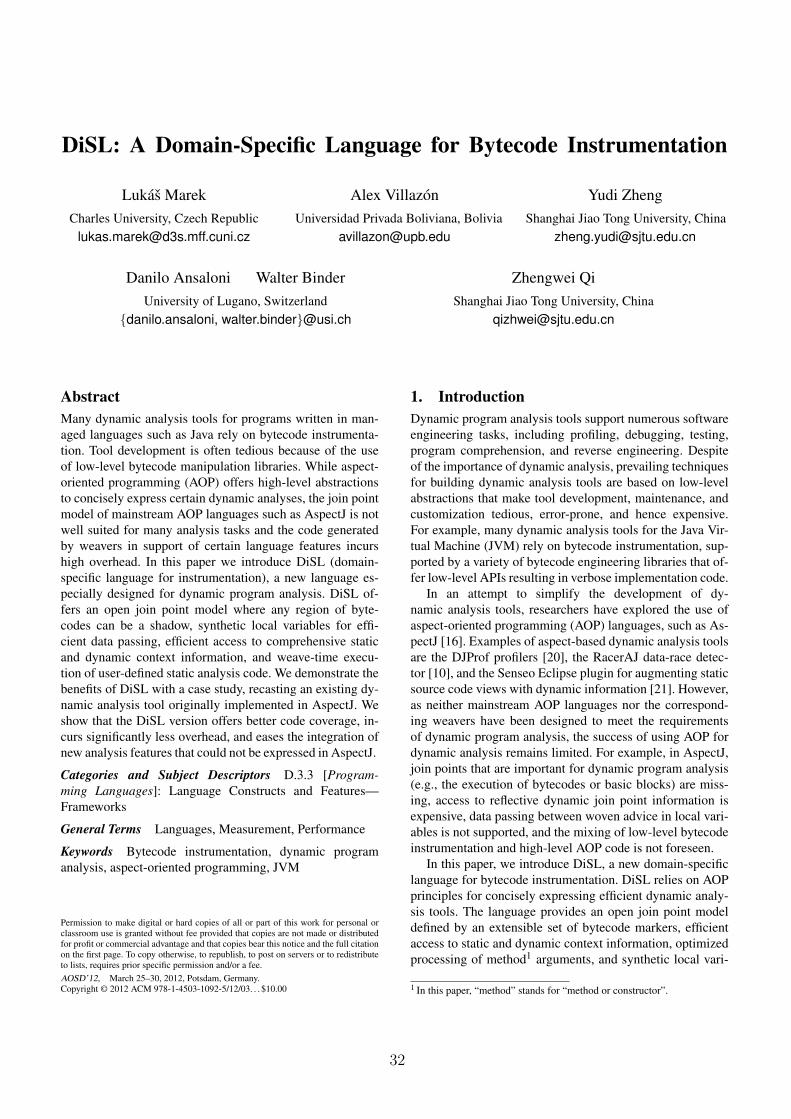
The purpose of the dynamic analysis is to observe and evaluate application be-haviour. Figure 1.1 shows a simple architecture of a dynamic analysis platform.During execution (1), a probe triggers an event in the observed application. Thetriggered event is dispatched (2) to the analysis logic, where it is evaluated (3).
As illustrated at the bottom of Figure 1.1, we see the dynamic analysis as com-posed from two parts. The observation part, which gathers contextual informationand triggers the evaluation events, and the evaluation part, which performs theanalysis evaluation based on the triggered events.
6
Application code
Ap
plic
atio
n e
xecu
tion
(1
)
Analysis code
Eve
nt
eva
lua
tion
(3
)
Probe
Event d
ispatch
(2)
Evaluation partObservation part
Figure 1.1: Dynamic analysis architecture.
1.3 Application observability
As an application is executed, each action like object allocation or method in-vocation may be of interest to the analysis. Depending on the type of observedactions, the analysis may choose from a variety of techniques to analyse the ap-plication behaviour.
1.3.1 Observation using execution callbacks
Execution environments often provide an interface for various execution callbacks.For example, managed languages may expose callbacks connected to class loading,JIT compilation, garbage collection or virtual machine life cycle. Interpretedlanguages may provide even more execution events related to object allocation,exception handling, field access, method execution or synchronization.
Another kind of callbacks may be provided by hardware. Special registers in-side the CPU allow to monitor different types of low-level performance events likecache accesses, memory accesses, instruction execution or branch predictions. Acallback is triggered every time a number of events reaches a predefined threshold.
As the callbacks are built into a particular platform, an extension is oftenproblematic. Another limitation is the amount of additional information (contextinformation) they are able to provide. For example, an analysis may requiredetailed information about an allocated object, like place of the allocation andthe size of the object. If the callback does not provide such information, theanalysis developer is forced to modify the execution environment (if possible).
A similar problem is with defining new events. As the callbacks are providedby some of the execution environment subsystems like the interpreter or thegarbage collector, the particular subsystem has to be modified to obtain a newtype of events. Such modifications require deep knowledge of the platform andthe analysis created for the modified platform loses portability. Therefore, if theplatform does not support the required events or does not supply the necessarycontext information, it is often better to choose a different observation technique.
7
1.3.2 Instrumentation
The observation technique allowing to easily define new types of events is instru-mentation. Instrumentation allows to observe any sequence of code executed inthe observed application. During the instrumentation process (weaving), instru-mentation code is inserted before or after the application code. When invoked,the instrumentation code triggers an event which is passed to the analysis for eval-uation. If processing of the event is very short, like an increment of a counter,the evaluation logic may be included in the instrumentation code. When a moresophisticated analysis is required, the instrumentation code invokes a separateevaluation method.
Instrumentation weaving is possible at different stages of the application de-ployment. Each stage has its own advantages and disadvantages. Weaving ofthe application source code allows the instrumentation to easily detect high-levellanguage constructs and insert the instrumentation code as a text string writtenin the application language. The weaving is often performed offline or duringcompilation, hence access to the sources of the observed application is necessary.
Instrumentation of the application is also possible on the machine code level.In comparison to the source code, machine code instruction set provides onlya thin level of abstraction over the hardware it operates. Detection of languageconstructs like objects, classes or fields (member variables) is therefore much moredifficult.
Managed languages often support compilation into an intermediate represen-tation (bytecode). As the bytecode is an intermediate step between the sourcecode and the native code waving of the bytecode has several advantages. Propri-etary applications often does not provide source code, but they are compiled anddistributed in the bytecode form. In comparison with the native code, the inter-mediate representation is often high-level enough to easily recognize constructsof the original language. During execution, bytecode is optimized by an inter-preter or a JIT compiler, hence the overhead of the instrumentation code is oftennoticeably reduced.
1.3.3 Sampling
A different type of monitoring is sampling. During sampling, event processing isnot triggered based on the application behaviour. Instead, an observation methodis triggered after a given time period. Sampling is therefore useful only for certaintype of analyses like performance monitoring or collection of aggregated results.
1.4 Dynamic analysis evaluation
During execution, the application triggers various events that are of interest tothe analysis. The triggered event together with additional context informationis supplied to the main analysis logic for evaluation. During evaluation, theanalysis may perform various computations and build non-trivial data structuresto be able to track the application behaviour.
We recognize two types of analysis evaluation, based on the context in whichthe evaluation is performed. An evaluation performed in the context of the anal-
8
ysed application is called in-process analysis and the analysis offloaded out of thecontext of the analysed application is called out-of-process analysis.
1.4.1 In-process analysis
Events triggered during in-process analysis have the form of simple method call-backs. It is vital that the execution environment supports some form of isolationbetween the application and the analysis. Otherwise, the evaluation and theanalysed application share many resources like memory, execution threads or thestandard input and output. As the observed application is tightly coupled withthe evaluation logic, in-process analysis may introduce undesired perturbations.Depending on the type of the perturbation, it may invalidate the analysis resultsor break the application execution.
1.4.2 Out-of-process analysis
To prevent perturbation, the analysis may be offloaded out of the applicationcontext. The main goal of offloading is to substantially reduce the amount ofcode executed in the context of the observed application.
Some execution environments already provide an observation mechanism ca-pable pf offloading the analysis events. An example of such a mechanism is thedebugging interface. If the execution environment does not provide a suitableobservation mechanism, the analysis may uses some type of inter-process com-munication (IPC) to offload the events. The commonly used IPC techniquesinclude pipe, network socket, shared memory or remote procedure call.
As our implementation targets Java platform, the next section briefly overviewsthe available monitoring alternatives under Java.
1.5 Application observability in Java
The more complex a system is, the more important it is that the system providesmeans to monitor itself. As applications in Java are executed in a virtual machinewith a JIT compiler, garbage collector and several other service threads, it is vitalto provide an environment where the application and the VM could be safelyobserved.
Historically, Java contained two low level interfaces for application and VMmonitoring. JVMPI [28] was a native interface intended for profiling and al-lowed to observe memory allocations, execution times, locking or thread events.The second, called JVMDI [27], was a debugging interface and allowed to setbreakpoints and watches or access class, object, method and field information.JVMPI never reached a stable state and was always marked as experimental.It was probably because of its many limitations, and so it was replaced [73] inJava 1.5 by a more mature JVM Tool Interface (JVMTI) [29]. During thetransition from JVMPI to JVMTI, JVMDI was also merged into the JVMTI anddeprecated in Java 6.
As a merger of the two, JVMTI became a rich API useful for debugging,profiling and other kinds of application analysis using different types of monitoring
9
techniques like sampling, instrumentation or predefined callbacks. JVMTI alsoallows to monitor various JVM resources and events connected with garbagecollection, class loading, compilation or JVM lifecycle.
JVMTI is a part of a collection of interfaces called Java Platform Debug-ger Architecture (JPDA) [25, 26]. Apart from JVMTI, JPDA also containshigh-level a Java language interface for remote debugging called Java Debug-ger Interface (JDI) [19] and a protocol describing communication betweena debugger and a debugged JVM called Java Debug Wire Protocol (JD-WP) [20]. Compared to JVMTI, JDI provides Java interface and its communi-cation model assumes that events are processed in different JVM, thus it is easierto use and potentially safer. Nevertheless, JDI is not as versatile as JVMTI.As the name suggests, JDI is mainly targeted on real-time debugging and is notdesigned for application wide monitoring.
JVMTI is very powerful, however working in a native code may be seen as toocomplicated for simple dynamic analysis. For that reason, Java also provides ajava.lang.instrument 1 package for instrumentation directly from Java space.The instrument interface does not provide any predefined callbacks or samplinginterface but can be easily used for instrumentation based analysis.
A bit different type of monitoring offers technology called Java Manage-ment Extensions (JMX) [23]. JMX is a framework, which allows to monitorand control the application using objects called Managed Beans (MBean in short).MBeans do not use instrumentation to trigger events instead, they are developeddirectly as a part of an application. The MBean object controls a component(resource) of the application and allows to read the component state, set and getits configuration and register event notification listeners.
During application execution, MBeans are registered in JMX framework wait-ing for a remote connection. As MBean is required to implement one of the prede-fined JMX interfaces, it can be accessed through Java VisualVM [42] monitoringtool. Alternatively, custom monitoring tools can be used.
1.5.1 Instrumentation in Java
As mentioned in the thesis goals, the monitoring interface should provide flexibil-ity in definition of new observation events. The predefined callbacks in JVMTIand JDI provide only a fixed set of events, with no options for extensibility. JMXprovides custom monitoring but only if the MBean objects are designed duringthe application development. Creating MBeans for an existing application meansto modify its source code or bytecode, which effectively means to instrument it.As the instrumentation provides the highest flexibility when defining new events,we will discuss its applicability in Java in more detail.
Instrumentation allows to intercept application behaviour based on executionof an arbitrary bytecode pattern. It is therefore possible to intercept object allo-cations, method executions, exception handling of field access. Instrumentation isable to capture execution patterns with various granularity. It is not a problem toinstrument method entry and method exit. It is also possible to instrument a sin-
1http://docs.oracle.com/javase/7/docs/api/java/lang/instrument/
package-summary.html
10
gle instruction like an evaluation of a conditional statement or a data conversionof a numeric value.
Instrumentation of an application written in Java can be done either offline,online using a Java level java.lang.instrument interface, or online using nativeJVMTI. Each solution has its advantages and disadvantages. We discuss themin turn.
Offline instrumentation
Offline instrumentation does not have any direct support in Java. Every offlineinstrumentation framework needs to load whole application and library code froma persistent storage, traverse the code and apply the instrumentation. The in-strumentation can be done either on source code or pre-compiled bytecode.
Although the offline instrumentation does not have any direct support in Java,it has the highest flexibility of all. During the instrumentation, a class can berenamed, split into several parts and a class hierarchy can be modified. Classescan be freely traversed and re-instrumented several times, which is useful in caseswhere some sort of static analysis of the whole application should be performedbefore the main instrumentation. Offline instrumentation does not delay a startof the application.
The disadvantage of offline instrumentation is in coverage. There is no possi-bility to instrument dynamically generated classes and also classes that are notspecified directly on the class path, for example classes loaded by a custom class-loader over a network. As the instrumentation is done on classes stored on afilesystem, it can be unintentionally applied more than once.
java.lang.instrument interface
A convenient online instrumentation is accessible through a java.lang.instrumentinstrumentation API. Java Virtual Machine automatically intercepts loaded class-es and passes them through the instrumentation interface to a custom Java agentin a form of bytecode. Java does not provide any support for parsing and chang-ing the bytecode, but the agent is able to use some widely adopted bytecodemanipulation library like ASM [2, 47], BCEL [4, 53] or Javassist [17, 49], thussource code of the resulting agent is usually compact.
As the Java agent is running in the same context as the observed application,the instrumentation process may introduce several undesirable side-effects.
The instrumentation agent is written in pure Java and it requires an alreadyinitialized JVM to be able to run. During the initialization (JVM bootstrapphase), JVM loads an initial set of core classes before loading the instrumenta-tion agent. The core classes escape instrumentation and the only option howto instrument them is a process called retransformation [14]. During retrans-formation, JVM replaces code of a loaded class with an altered code. As theclass is already known to JVM and can be already instantiated, retransformationimposes strict rules on introduced changes. During retransformation, fields andmethods must not be added, modified or renamed. It is also forbidden to changemethod signatures or change class inheritance. As a consequence, the Java agentapproach allows only a limited set of modifications to the classes loaded duringthe JVM bootstrap phase.
11
Another problem is hidden in the instrumentation process itself. During theinstrumentation, the Java agent is allowed to use any class from the Java ClassLibrary. When requested, the JVM loads the class, bypassing the Java agent in-strumentation callback. Instrumentation callback has to be bypassed, otherwisethe agent could request the same class and trigger another class loading intro-ducing infinite recursion. The loaded class is however immediately visible alsoto the application. The agent is able to retransform the class when it finishesthe ongoing instrumentation process, however the un-instrumented class may bealready used by the application.
JVMTI interface
Another option for performing online instrumentation is a JVM Tool Interface(JVMTI). JVMTI is a native interface and allows to instrument every class loadedby JVM. There is no need to bypass the instrumentation process in specific sce-narios like in the case of the java.lang.instrument interface and there is (almost)no unintended interaction between the instrumentation code and the observedapplication.
The instrumentation process may however influence initialization during aJVM bootstrap phase. Instrumentation from native space allows to interceptand instrument all loaded classes, even classes loaded during the JVM bootstrapphase. JVM does not permit arbitrary modification to the classes loaded duringbootstrap phase and so, instrumentation code may crash the JVM. The rules onpermitted instrumentation are not documented and differs from version to versionof JVM. It is therefore hard to judge, if the problem is a JVM bug or a limitationof JVMTI.
Applying instrumentation directly in native code can be challenging. To ourknowledge, there is no widely adopted C/C++ library for bytecode manipulation.Resulting code responsible for performing the instrumentation is therefore manytimes bigger (in the terms of lines of code) than a similar solution done using thejava.lang.instrument interface.
1.6 Dynamic analysis evaluation in Java
We consider two types of the dynamic analysis evaluation, the in-process analysisand the out-of-process analysis.
Java does not provide any isolation specifically to support the in-process anal-ysis. During the in-process analysis, the analysis and the observed applicationshare many resources like service threads, the heap, garbage collector, or the JavaClass Library. As a consequence, the evaluation may create a lot of perturbationin the observed application. Various problems that may arise are discussed inmore detail in the following section.
Contrary to in-process analysis, Java provides several interfaces to supportout-of-process analysis. All main observation interfaces offload the events outof the application context. JDI and JMX offload the events into another Javaprocess, whereas JVMTI offloads the events into native code.
Another option for offloading events is the Java Native Interface (JNI) [24].
12
JNI allows the Java code to invoke native methods. Therefore, JNI can be usedto transport events to native code.
1.7 Dynamic analysis pitfalls
Following subsections summarize variety of perturbations we have encounteredwhile developing dynamic analysis tools. Even though the problems are tackledby almost every dynamic analysis, they are often not mentioned in the literature.Hence, there is only limited knowledge among the developers about possible dan-gers connected to the dynamic analysis development.
Our list is not meant to be complete as it is in general hard to predict whatparts of the application will be influenced by the observation. The perturbationsare often discovered later on as an inconsistency in the observed results or as afailed execution of the observation application.
Execution time
A presence of additional code in the observed application may already causeperturbation. An execution time is probably the most visible one, where a highamount of instrumented sites may extend the time of execution by orders ofmagnitude.
The size of inserted code may additionally influence code optimisations madeby a JIT compiler. The JIT compiler inlines small methods to eliminate a costof a method call and to apply more advanced optimizations. If the method sizegrows over a certain threshold, the JIT compiler does not perform inlining as theresulting code would be too large.
Object allocation strategy
Another useful JIT compiler optimization is called scalar replacement. The scalarreplacement optimization uses escape analysis to decide whether it can allocateobjects directly on the execution stack. Such optimization can be done only ifan object reference does not escape out of the scope of the method where it wasallocated. However, if the instrumentation code exports the reference outside ofthe method, the object has to be allocated on the application heap and later oncollected by a garbage collector.
Available memory
During in-process analysis, the application and the analysis evaluation share asingle memory heap. Frequent allocations by the evaluation influence the overallmemory consumption and subsequently increase the frequency of garbage collec-tor runs. If the evaluation stores a substantial amount of data, it may deplete allavailable memory and crash the observed application.
Triggering of events
The in-process analysis and the observed application not only share the memoryheap or the execution threads but also the set of loaded classes. Most of the load-
13
ed classes are used only by the application or by the analysis but some classeslike third party libraries or classes from the Java Class Library may be shared.Methods of such shared libraries should behave differently depending on the con-text from which they are invoked. If a method is invoked from the applicationcode, it should generate the analysis events. On the contrary, if invoked from theanalysis code, the instrumentation code should be skipped.
A solution for the third party libraries is to load the classes by different classloaders where the application class loader loads an instrumented version of theclass and the analysis class loader loads an uninstrumented version. Unfortunate-ly, such solution is not applicable on classes from the Java Class Library, as theycan be loaded only by the system class loader. Therefore, code in the Java ClassLibrary requires a different solution for switchable event triggering. One of suchmechanisms is called dynamic bypass [67].
From a technical side, the dynamic bypass is a simple flag indicating whetherthe current execution originates from the application or from the analysis. Everyinserted instrumentation code is wrapped by a branching condition checking thestate of the dynamic bypass flag. If the dynamic bypass flag is set (indicatingthe code is called from the analysis code), it skips the instrumentation code, i.e.it does not generate additional events.
Shared state corruption
The dynamic bypass mechanism described above only works for reentrant code.If the code is not reentrant, the analysis may damage the state of the sharedclass.
We illustrate the problem on the printing method. An application uses theprinting method which protects data of each stream with a lock. The applicationstarts printing into a stream and successfully acquires a lock. Let us assumethat the stream is the standard output stream, so it is easily accessible from theapplication and also from the analysis. During the printing, the instrumenta-tion code is invoked and execution is transferred to the analysis to evaluate atriggered event. After evaluation, the analysis starts printing the results to thestandard output. As the execution thread already holds the output lock acquiredby the application code, it is allowed to enter into a protected part of the printingmethod. The printing method invoked from the application left the stream in aninconsistent state and the subsequent call damages the state of the stream.
Method size limit and class loading
Methods in Java are limited in size to 64 KiB of bytecode. The limit constrains theamount of instrumentation code that can be directly inlined into a method body.As the analysis developer cannot generally predict the size of the instrumentedmethod, the instrumentation code should contain only essential code to triggeran event. All other code connected to the event evaluation should be extractedinto a separate class.
Classes containing the evaluation logic are not application classes, thereforethey have to be loaded separately. Loading extra classes can be problematic in acase of certain class loaders, used for example in OSGI [33], where the class loadersupports loading of classes from predefined packages only. In OSGI, the standard
14
delegation of the class loading process to a parent class loader is allowed onlyfor classes from the Java Class Library. This behaviour provides better isolationbetween the application components, but poses severe problems for applicationmonitoring. When the instrumentation code invokes a method in an evaluationclass, the application class loader fails to load the class and generates an excep-tion. In the worst case, the exception is handled by the observed application, notproducing any error but corrupting the application behaviour.
Static initializers
While the Java code is being executed, it gradually loads additional applicationand library classes. After a class is loaded, a static initializer is invoked to ini-tialize the class.
The dynamic bypass (described above) prevents triggering of events duringexecution of the analysis code. This mechanism is also active when the analysiscode triggers class loading. Such behaviour is correct only if the loaded class isexclusively used by the analysis. If the application uses the loaded class, the staticinitializer is not invoked and the analysis misses events that would otherwise bepart of the application execution.
Analysing events triggered by analysis
To ensure correct results of the analysis, an instrumented run of the applicationshould produce exactly the same events as the uninstrumented one. Below, wedescribe a situation, where usage of specific Java classes may result in observationof additional events; events not triggered by the observed application.
The application and the analysis can both take advantage of a WeakReference2
class in conjunction with a ReferenceQueue3 container. Weak references are use-ful for object caching and analysis often uses weak references for object lifetimetracking. The dynamic bypass mechanism can prevent triggering of events whilethe WeakReference object is manipulated directly, but operations on Reference-Queue are handled by a special service thread created by the JVM. The analysisshould monitor events created by the service thread as the work of the threadis triggered by the application. Nevertheless, the service thread is also process-ing weak references created by the analysis, thus triggering additional events notrelated to the application behavior.
Introduction of deadlock
While analysing multi-threaded applications, the analysis should never changesynchronization behaviour in the observed application. In other words, the anal-ysis should never acquire a lock that could be potentially held by the applicationas it could lead to a deadlock. An obvious problem is an invocation of methods ona shared object (like printing into standard output), where the analysis and theapplication compete for one shared lock. However, the analysis may introduce adeadlock even if it does not invoke such a shared object directly.
2http://docs.oracle.com/javase/7/docs/api/java/lang/ref/WeakReference.html3http://docs.oracle.com/javase/7/docs/api/java/lang/ref/ReferenceQueue.html
15
Execution trace of thread A
Evaluation of an event
Thread acquires LA (analysis lock)
Evaluation triggers class loading
Thread waits on LC (class loading lock)
Execution trace of thread B
Loading of a class
Thread acquires LC (class loading lock)
Evaluation of a class loading event
Thread waits on LA (analysis lock)
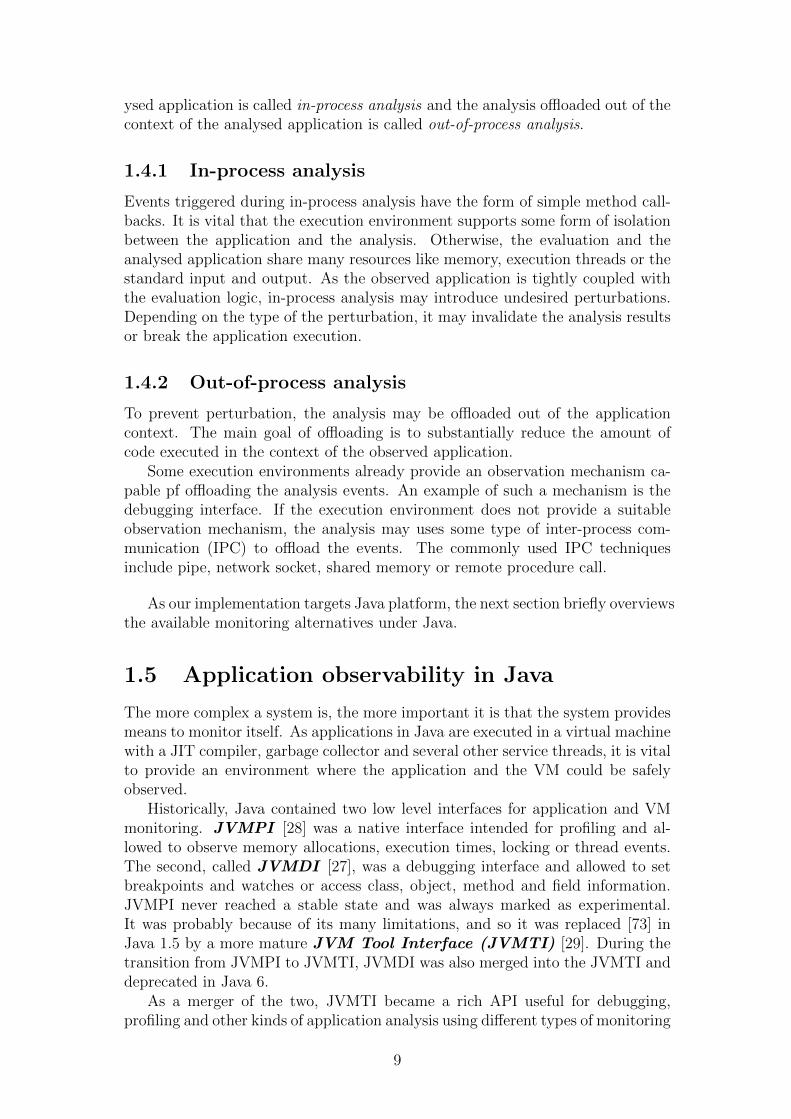
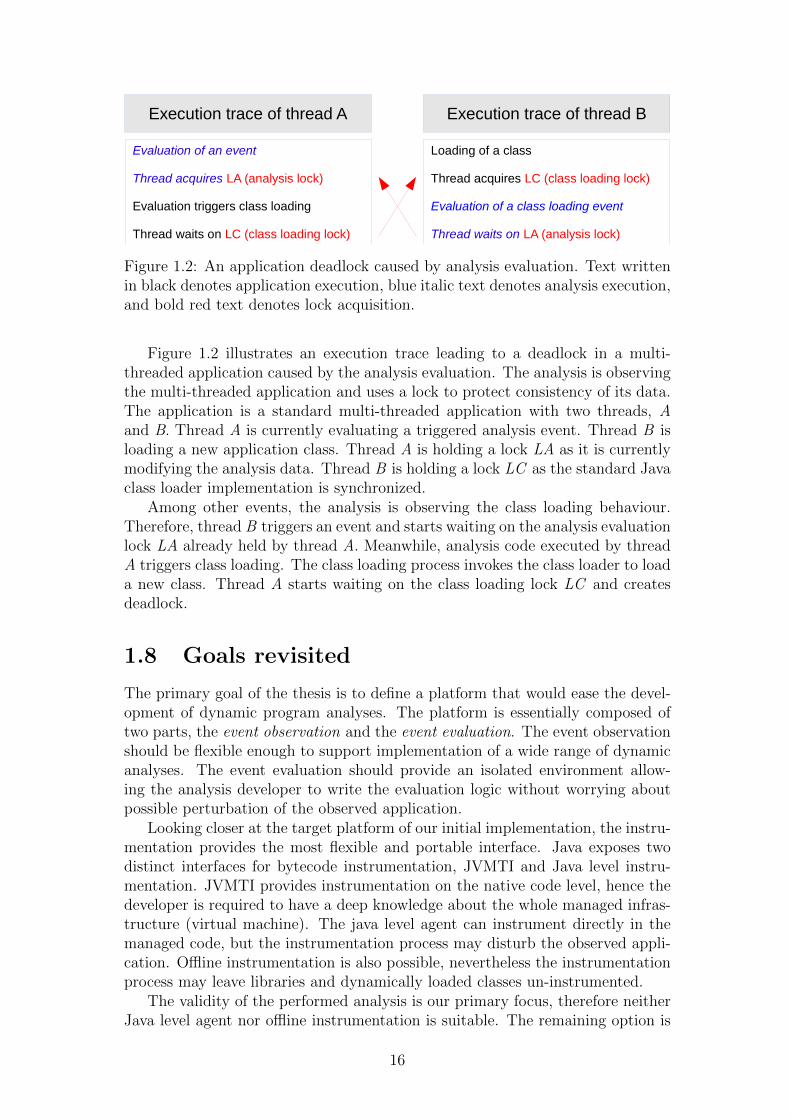
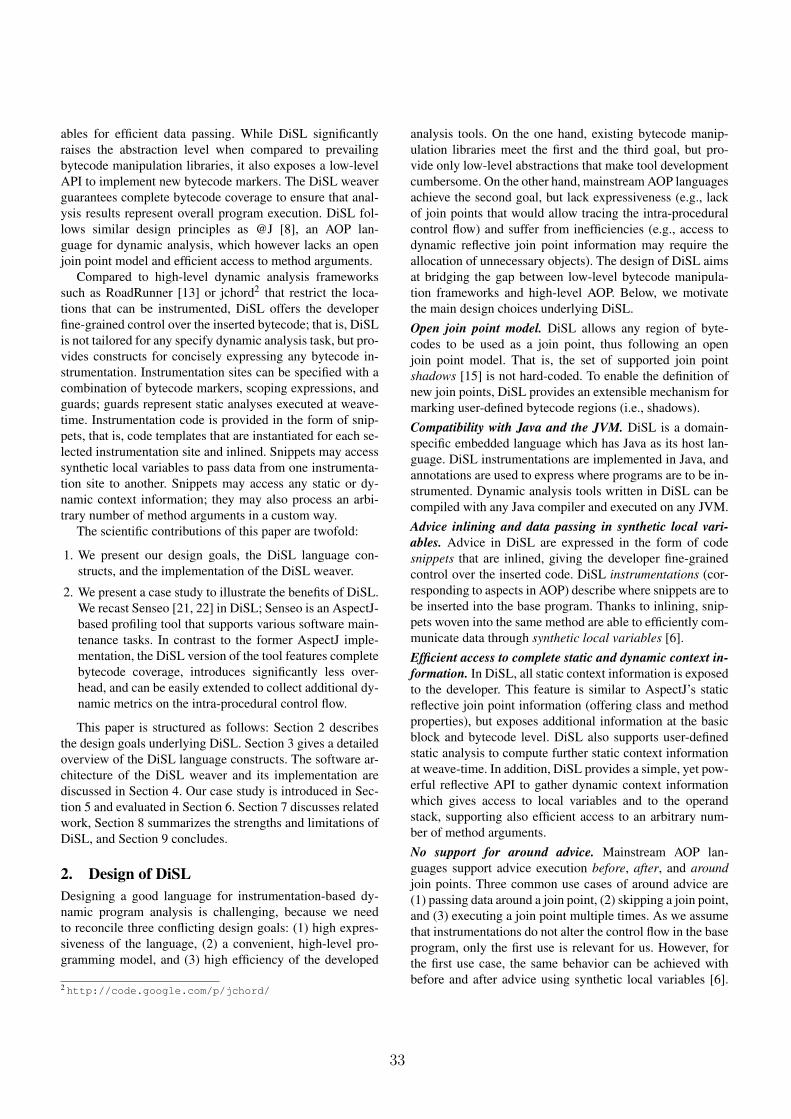
Figure 1.2: An application deadlock caused by analysis evaluation. Text writtenin black denotes application execution, blue italic text denotes analysis execution,and bold red text denotes lock acquisition.
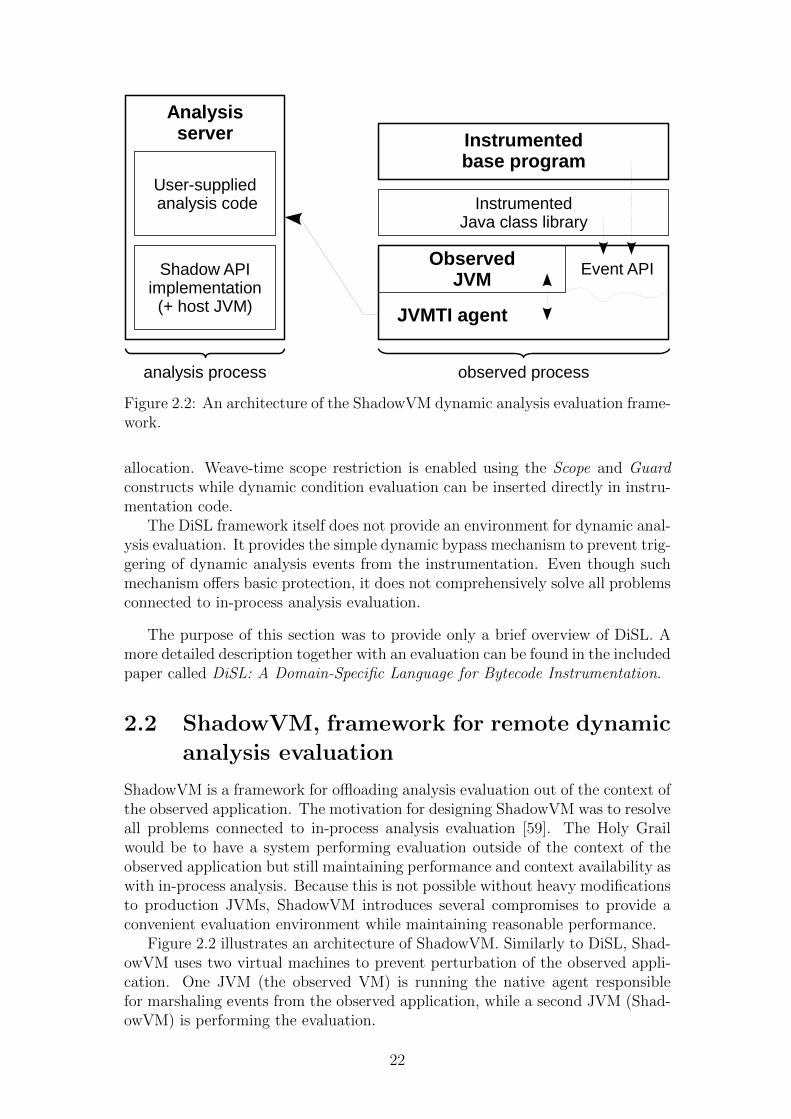
Figure 1.2 illustrates an execution trace leading to a deadlock in a multi-threaded application caused by the analysis evaluation. The analysis is observingthe multi-threaded application and uses a lock to protect consistency of its data.The application is a standard multi-threaded application with two threads, Aand B. Thread A is currently evaluating a triggered analysis event. Thread B isloading a new application class. Thread A is holding a lock LA as it is currentlymodifying the analysis data. Thread B is holding a lock LC as the standard Javaclass loader implementation is synchronized.
Among other events, the analysis is observing the class loading behaviour.Therefore, thread B triggers an event and starts waiting on the analysis evaluationlock LA already held by thread A. Meanwhile, analysis code executed by threadA triggers class loading. The class loading process invokes the class loader to loada new class. Thread A starts waiting on the class loading lock LC and createsdeadlock.
1.8 Goals revisited
The primary goal of the thesis is to define a platform that would ease the devel-opment of dynamic program analyses. The platform is essentially composed oftwo parts, the event observation and the event evaluation. The event observationshould be flexible enough to support implementation of a wide range of dynamicanalyses. The event evaluation should provide an isolated environment allow-ing the analysis developer to write the evaluation logic without worrying aboutpossible perturbation of the observed application.
Looking closer at the target platform of our initial implementation, the instru-mentation provides the most flexible and portable interface. Java exposes twodistinct interfaces for bytecode instrumentation, JVMTI and Java level instru-mentation. JVMTI provides instrumentation on the native code level, hence thedeveloper is required to have a deep knowledge about the whole managed infras-tructure (virtual machine). The java level agent can instrument directly in themanaged code, but the instrumentation process may disturb the observed appli-cation. Offline instrumentation is also possible, nevertheless the instrumentationprocess may leave libraries and dynamically loaded classes un-instrumented.
The validity of the performed analysis is our primary focus, therefore neitherJava level agent nor offline instrumentation is suitable. The remaining option is
16
instrumentation using JVMTI. As JVMTI is a native interface, the goal will beto provide an event specification method that hides the complexity of the nativelevel instrumentation.
Java itself does not provide any support for isolation inside one process. Toprevent undesired perturbation, the event evaluation needs to be offloaded out ofthe Java context.
In 1.6, we mentioned three (JDI, JMX, JVMTI) interfaces for offloading eventsout of the application context. JMX and JDI do not provide capabilities werequire. Especially they are not designed to transfer bigger amounts (tens ofmegabytes per second) of data.
JVMTI provides the interface to observe only a predefined set of JVM eventsin the native space. However, the instrumentation produced using JVMTI isable to trigger custom events in the observed application, therefore we requirea solution allowing to offload custom events out of the Java space. JNI allowsto call an arbitrary native method from Java, thus it can offload any event intothe native space. As we aim to ease the development of the dynamic analyses,our goal will be to pass the event out of the native space into a more convenientenvironment for the event evaluation.
After summarizing the monitoring capabilities of the target platform, we areready to expand the initial goals as follows.
The primary goal of the thesis is to create a platform that would ease the de-velopment of dynamic program analyses. Such a platform should support simplebut flexible method for capturing events originating in the observed application.The events of interest should be specified using an instrumentation language withthe following attributes:
• High-level language constructs enable a developer not familiar with instru-mentation internals to create a custom dynamic analysis.
• A skilled developer should be allowed to define new constructs to capturearbitrary application behaviour.
• The language should provide rich access to static and dynamic contextinformation.
• As the dynamic analysis often requires processing of large amount of events,incurred overhead of the instrumentation code should be minimal and fullyin the hands of the analysis developer.
The platform should provide an isolated environment, where the evaluationof the captured events does not cause perturbation in the observed application.The environment for event evaluation should have the following properties:
• Isolation of the observed application limits perturbation caused by the dy-namic analysis.
• The isolation is achieved by processing analysis events out of the context ofthe observed application.
17
• A programming model of the evaluation environment should be close to theprogramming model of the hosting language.
• The isolation poses a reasonable overhead so that the implemented dynamicanalysis stays performance competitive.
• As we aim for a solution that will be applicable in practice, the implemen-tation should be usable in production JVMs.
18
Chapter 2
Overview of Contribution
This chapter summarizes the work we have done to ease development and reducethe incurred perturbation while observing a runtime behaviour of an application.
The presented observation platform is composed from two parts. The firstcalled DiSL, is a language for instrumentation specifically designed for dynam-ic program analysis. The second called ShadowVM, is a system for offloadingdynamic analysis out of the context of an observed application.
Combined together, DiSL and ShadowVM provide a feature complete infras-tructure for creating custom dynamic analyses of Java applications while improv-ing the development efficiency, minimizing induced perturbation and providingcompetitive performance compared to similar frameworks. Although most of theproblems solved by DiSL and ShadowVM are generic to all managed runtimes,both systems are tightly coupled with the Java environment.
2.1 DiSL, domain specific language for Java byte-
code instrumentation
DiSL is a language for rapid development of instrumentation targeted on the do-main of dynamic program analysis. The key concepts beside the developmentefficiency are small runtime overhead, simple extensibility, and observation cov-erage of the whole Java Class Library.
The DiSL language is hosted in Java and uses Java annotations to guidethe instrumentation process. The language is inspired by the Aspect OrientedPrograming [61] and adopts AOP’s three basic concepts: shadow, join-point,and advice. The DiSL instrumentation framework is implemented on top ofASM [2, 47], a widely adopted Java instrumentation library.
The Instrumentation in DiSL is written as a standard Java class where meth-ods are annotated by a custom DiSL annotation. A method contains instrumen-tation code that will be inlined into the application. The annotation specifieswhether the instrumentation code will be inserted before or after a defined blockof code and includes additional parameters for the instrumentation process likescoping.
Markers
In DiSL, instrumentation code is inserted before or after a block of code markedby a construct called Marker. DiSL provides a library of predefined Markersto easily insert instrumentation code before or after a method body, a methodinvocation or a single bytecode instruction. Custom Marker allows to definearbitrary block that may be of interest to the instrumentation developer.
19
Context information
Providing access to static and dynamic contextual information is an essentialfeature of every instrumentation framework. DiSL exposes two interfaces calledStaticContext and DynamicContext for accessing information about context inwhich is an event triggered. The DynamicContext is a predefined interface provid-ing access to local variables, variables on the Java stack, this object and methodarguments. The StaticContext is fully customizable and allows the developer topre-compute custom static information during weave time and access the pre-computed information in the instrumentation code. Access to basic informationabout classes and methods under instrumentation is in DiSL exposed through apredefined library of StaticContext classes.
Instrumentation scoping
A scoping language implemented in DiSL allows to restrict the instrumentationto particular classes or methods. A scoping pattern is expressed as a stringmatching a class name, a method name and a method signature of a method to beinstrumented. The scoping pattern may additionally use wildcards to substitutea part of the pattern value.
When more control over the scoping is needed, a Guard construct enables toevaluate more comprehensive conditions using Java code. The Guard indicatesfor each instrumented location whether the location should be instrumented ornot. The Guard is a standard Java class with one annotated method evaluatingthe scoping condition. The Guard method has access to all context informationavailable using StaticContext and DynamicContext interfaces.
Data passing
To perform more complex analysis, the instrumentation may require to shareinformation across several instrumented locations. DiSL provides two distinctmechanisms for easy and efficient data passing. A standard Java field defined inan instrumentation class and annotated by a ThreadLocal annotation acts as athread local variable. The behaviour is the same as the Java thread local variable,however DiSL translates all operations on the variable as a direct access to theJava Thread class, thus making it more efficient.
For efficient data passing between instrumentation code inserted into the samemethod body, DiSL introduces a construct called synthetic local variable. It isagain a field defined in an instrumentation class and annotated by a SyntheticLocalannotation. In each application method with inserted instrumentation code, DiSLcreates a new local variable and translates all operations on the synthetic localfield as operations on the local variable.
Exception handling
The instrumentation written in DiSL is free to use arbitrary Java code. As theinstrumentation is meant for observation only, it is not desirable to throw anyexception out of the scope of the instrumentation. Such an exception wouldotherwise propagate through the application and change its control flow. All theinserted code is therefore automatically wrapped by a try-catch block handling
20
ObservedJVM
Instrumentedbase program
InstrumentedJava class library
instrumentation process
Instrumentationserver
User-suppliedinstrumentation
code
Instrumentationframework
(+ host JVM)
observed process
JVMTI agent
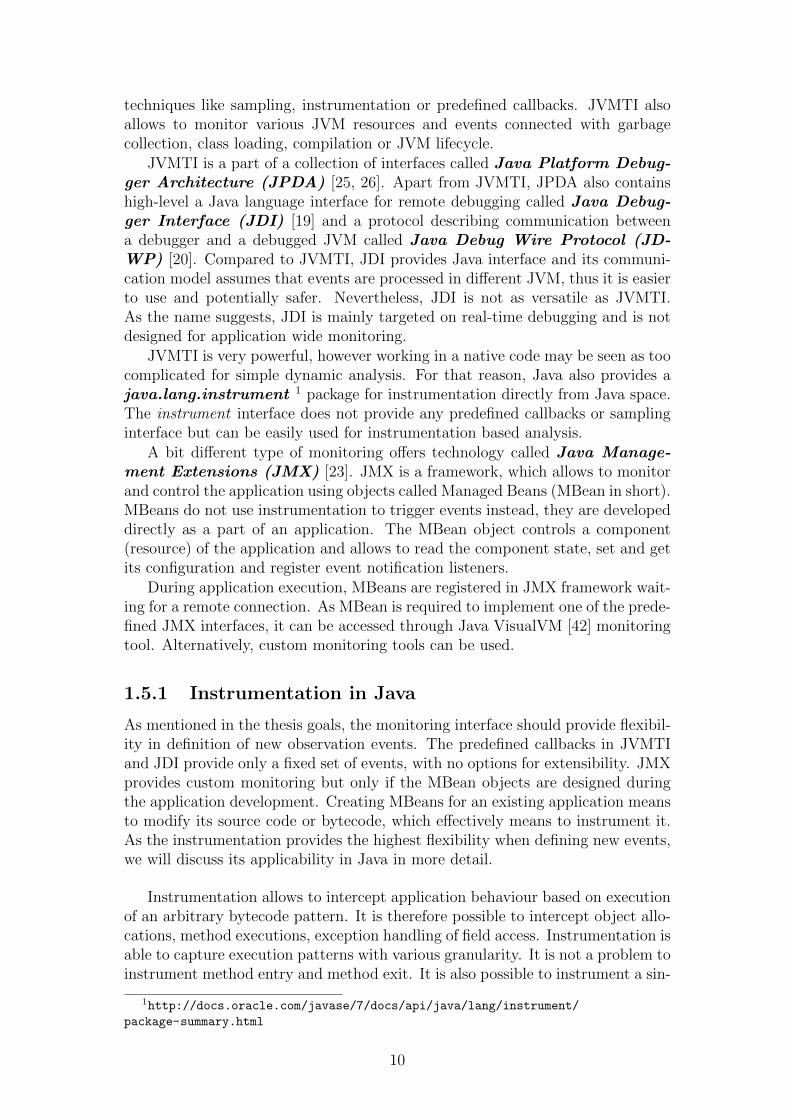
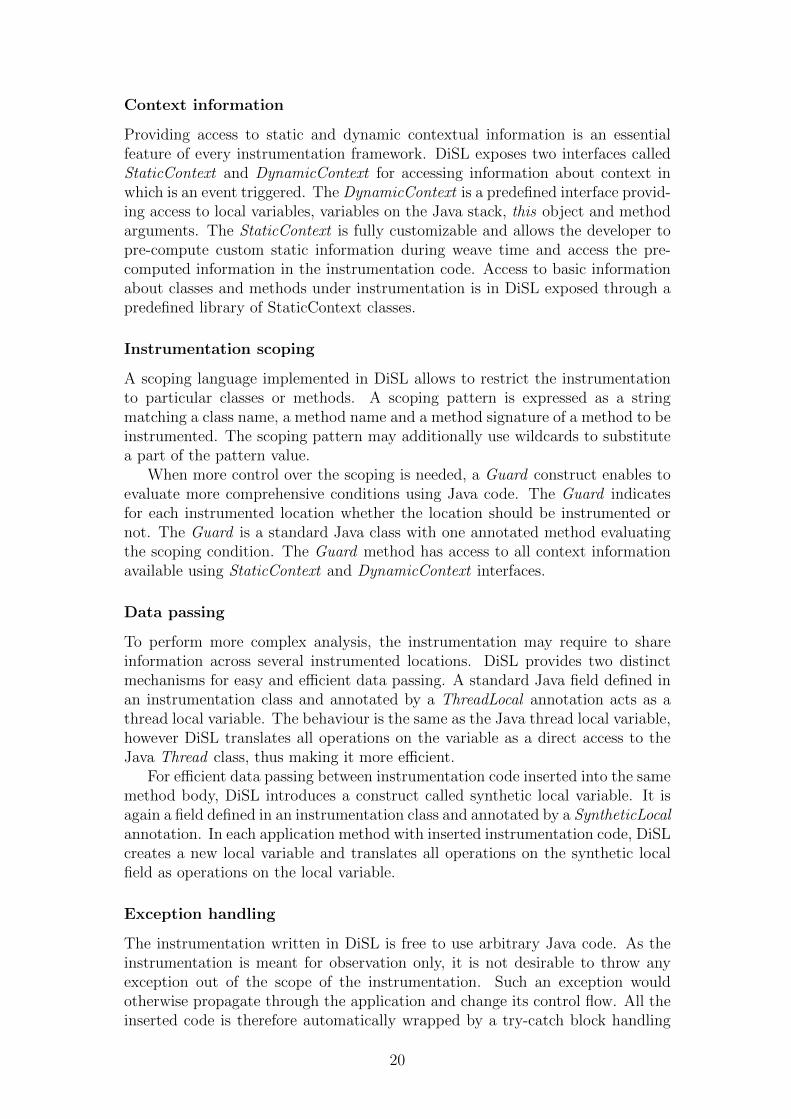
Figure 2.1: An architecture of the DiSL instrumentation framework.
all exceptions introduced in the instrumentation. The wrapping can be disabledwhen the instrumentation reaches production quality.
Framework architecture
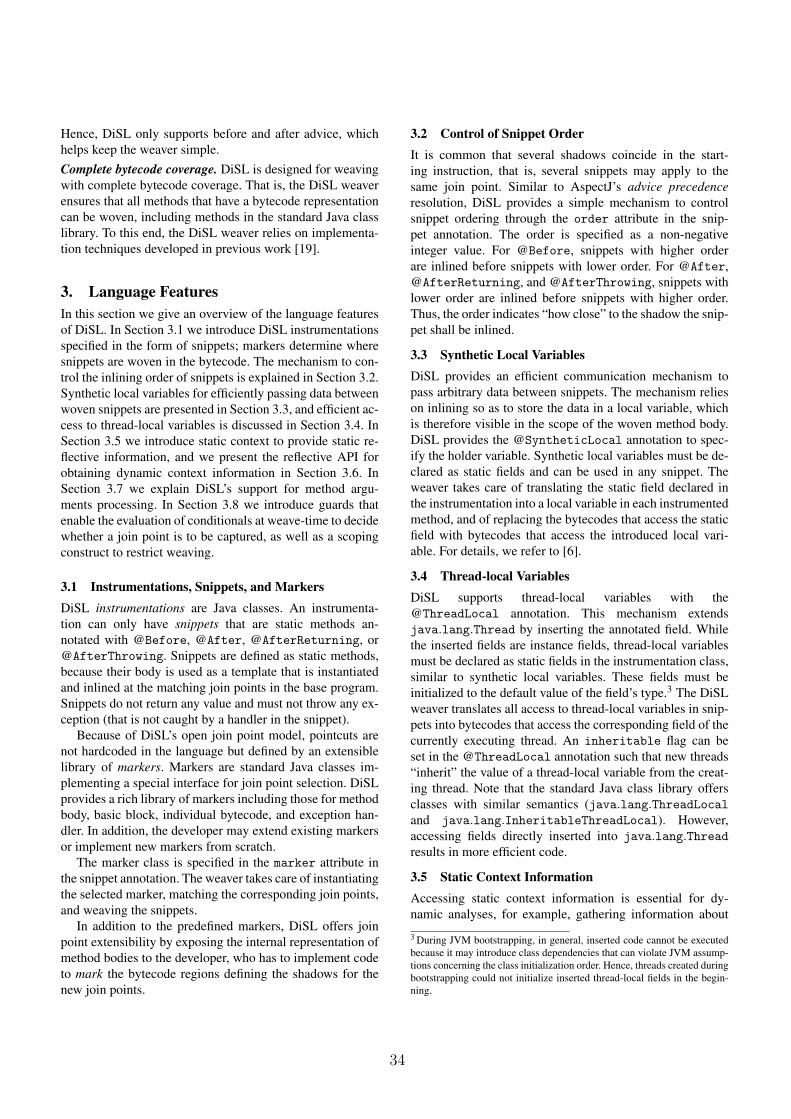
DiSL contains a simple wrapper library for offline instrumentation. The limitationof offline instrumentation is in the use of thread local variables, where specialinstrumentation of java.lang.Thread is required. Besides offline instrumentation,DiSL ships a framework for online application instrumentation. Even though themajority of DiSL features are designed to support hotswapping constraints1 andcould potentially instrument an already running application, the framework iscurrently limited to instrument classes while being loaded by the JVM.
As shown in Figure 2.1, DiSL uses two JVMs to separate the observed appli-cation and the instrumentation. The separation reduces perturbation and allowsto instrument the whole Java Class Library without complex instrumentationprocess. The instrumentation process is as follows. A native agent in the ob-served VM is using the JVMTI interface to intercept newly loaded applicationclasses. The intercepted classes are sent to the second VM for instrumentation.As the instrumentation process is separated from the observed VM, it can safelyrun in Java space. When instrumented, classes are sent back and loaded by theobserved VM.
In summary, DiSL provides the language and the framework for easy and effi-cient instrumentation programming in Java [76]. The instrumentation developerhas the ability to intercept any block of code either with a predefined library ofMarkers or through the extensible marking interface. Customizable StaticCon-text allows to pre-compute arbitrary static information during weave time andefficiently access the computed information during runtime. The DynamicCon-text interface exposes dynamic context information without any hidden memory
1Thread local variables in current implementation do not work without instrumentationdone in a bootstrap phase.
21
ObservedJVM
JVMTI agent
Instrumentedbase program
InstrumentedJava class library
Event API
analysis process
Analysisserver
User-supplied analysis code
Shadow APIimplementation
(+ host JVM)
observed process
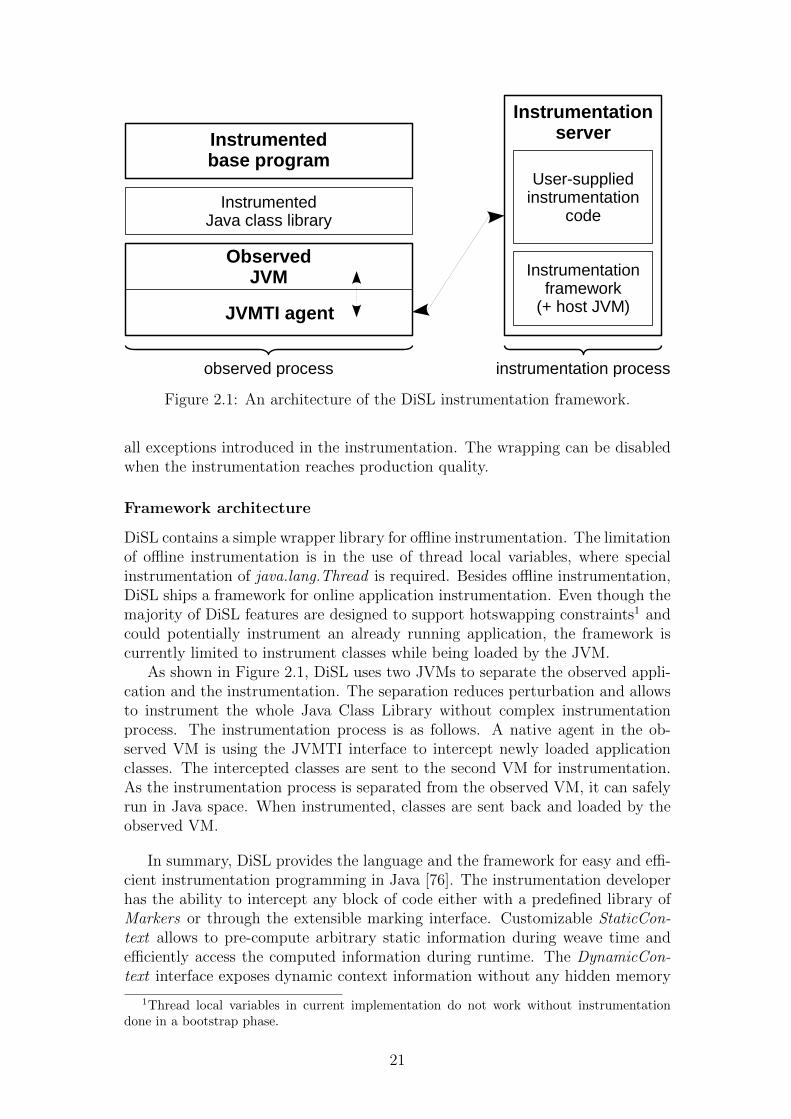
Figure 2.2: An architecture of the ShadowVM dynamic analysis evaluation frame-work.
allocation. Weave-time scope restriction is enabled using the Scope and Guardconstructs while dynamic condition evaluation can be inserted directly in instru-mentation code.
The DiSL framework itself does not provide an environment for dynamic anal-ysis evaluation. It provides the simple dynamic bypass mechanism to prevent trig-gering of dynamic analysis events from the instrumentation. Even though suchmechanism offers basic protection, it does not comprehensively solve all problemsconnected to in-process analysis evaluation.
The purpose of this section was to provide only a brief overview of DiSL. Amore detailed description together with an evaluation can be found in the includedpaper called DiSL: A Domain-Specific Language for Bytecode Instrumentation.
2.2 ShadowVM, framework for remote dynamic
analysis evaluation
ShadowVM is a framework for offloading analysis evaluation out of the context ofthe observed application. The motivation for designing ShadowVM was to resolveall problems connected to in-process analysis evaluation [59]. The Holy Grailwould be to have a system performing evaluation outside of the context of theobserved application but still maintaining performance and context availability aswith in-process analysis. Because this is not possible without heavy modificationsto production JVMs, ShadowVM introduces several compromises to provide aconvenient evaluation environment while maintaining reasonable performance.
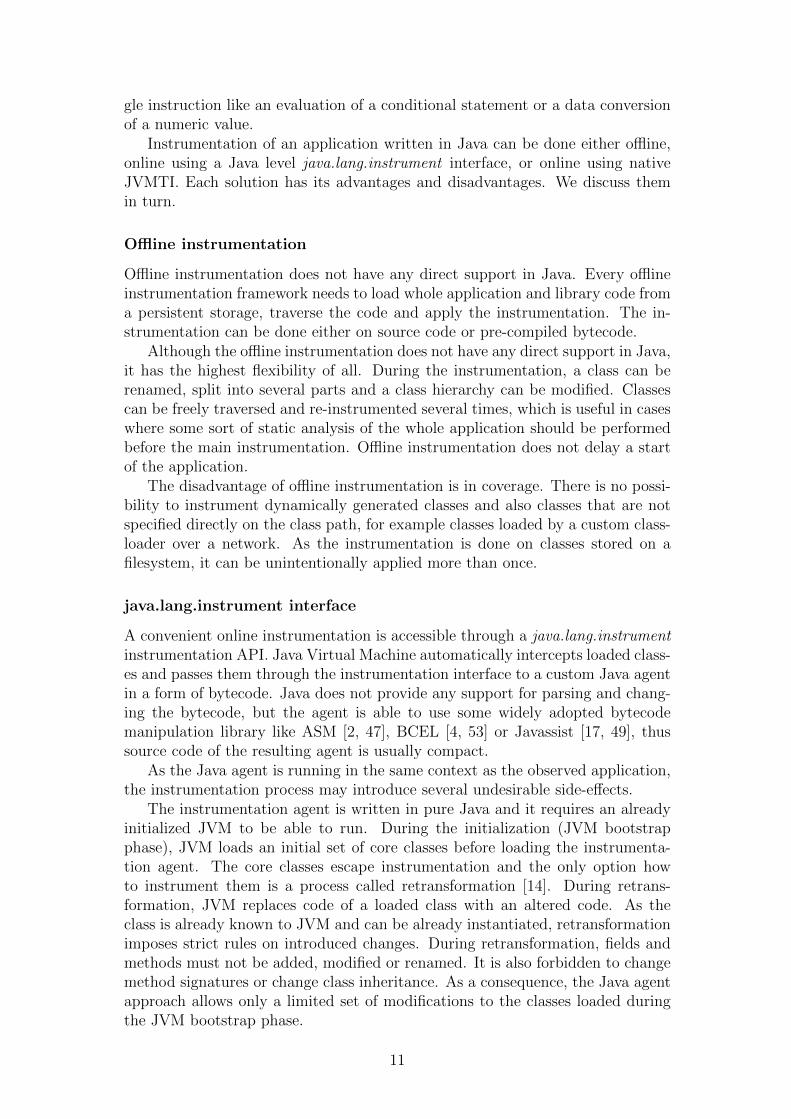
Figure 2.2 illustrates an architecture of ShadowVM. Similarly to DiSL, Shad-owVM uses two virtual machines to prevent perturbation of the observed appli-cation. One JVM (the observed VM) is running the native agent responsiblefor marshaling events from the observed application, while a second JVM (Shad-owVM) is performing the evaluation.
22
Event propagation
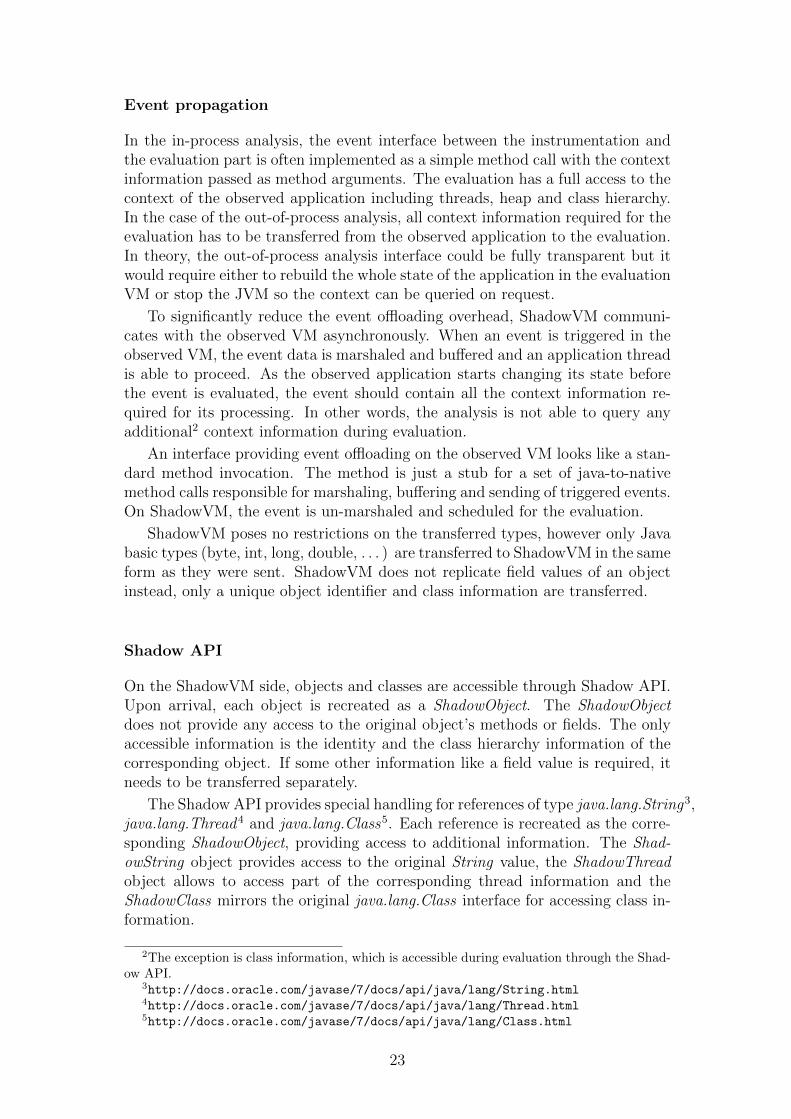
In the in-process analysis, the event interface between the instrumentation andthe evaluation part is often implemented as a simple method call with the contextinformation passed as method arguments. The evaluation has a full access to thecontext of the observed application including threads, heap and class hierarchy.In the case of the out-of-process analysis, all context information required for theevaluation has to be transferred from the observed application to the evaluation.In theory, the out-of-process analysis interface could be fully transparent but itwould require either to rebuild the whole state of the application in the evaluationVM or stop the JVM so the context can be queried on request.
To significantly reduce the event offloading overhead, ShadowVM communi-cates with the observed VM asynchronously. When an event is triggered in theobserved VM, the event data is marshaled and buffered and an application threadis able to proceed. As the observed application starts changing its state beforethe event is evaluated, the event should contain all the context information re-quired for its processing. In other words, the analysis is not able to query anyadditional2 context information during evaluation.
An interface providing event offloading on the observed VM looks like a stan-dard method invocation. The method is just a stub for a set of java-to-nativemethod calls responsible for marshaling, buffering and sending of triggered events.On ShadowVM, the event is un-marshaled and scheduled for the evaluation.
ShadowVM poses no restrictions on the transferred types, however only Javabasic types (byte, int, long, double, . . . ) are transferred to ShadowVM in the sameform as they were sent. ShadowVM does not replicate field values of an objectinstead, only a unique object identifier and class information are transferred.
Shadow API
On the ShadowVM side, objects and classes are accessible through Shadow API.Upon arrival, each object is recreated as a ShadowObject. The ShadowObjectdoes not provide any access to the original object’s methods or fields. The onlyaccessible information is the identity and the class hierarchy information of thecorresponding object. If some other information like a field value is required, itneeds to be transferred separately.
The Shadow API provides special handling for references of type java.lang.String3,java.lang.Thread4 and java.lang.Class5. Each reference is recreated as the corre-sponding ShadowObject, providing access to additional information. The Shad-owString object provides access to the original String value, the ShadowThreadobject allows to access part of the corresponding thread information and theShadowClass mirrors the original java.lang.Class interface for accessing class in-formation.
2The exception is class information, which is accessible during evaluation through the Shad-ow API.
3http://docs.oracle.com/javase/7/docs/api/java/lang/String.html4http://docs.oracle.com/javase/7/docs/api/java/lang/Thread.html5http://docs.oracle.com/javase/7/docs/api/java/lang/Class.html
23
Event oredering
A threading model of the in-process analysis is usually same as of the observedapplication. As the interface between the instrumentation and the evaluationis a simple method call, application threads executing the instrumentation arealso used to perform the evaluation. In ShadowVM, the use of asynchronouscommunication opens a possibility for different event ordering models duringevaluation.
ShadowVM allows to specify ordering model determining how an event isbuffered, transferred and processed. The default (per-thread) ordering guaranteesthat events produced by the same thread on the observed VM are processed inthe same order in ShadowVM. This ordering is similar to in-process analysis withan exception that no guarantees are made in respect to other events produced bydifferent threads, even if the threads are synchronized. When a more fine grainedcontrol over the ordering is needed, the ShadowVM allows to specify an orderinggroup for each event. The event ordering group ensures that events sharing thesame event group are processed in the same order in which they are produced.The default per-thread ordering may be seen as a special case of group orderingwhere the events produced by the same thread share the same event group. Usingevent groups, the analysis developer may easily create a global ordering amongall the produced events by letting them share one global event group.
On ShadowVM, events from the same event group are processed by the samethread. For convenience, ShadowVM maintains one-to-one mapping betweenevent groups and event processing threads, therefore it allows to use thread fea-tures like thread-local variables.
Even though the ordering specification may slightly complicate the event of-floading process, it brings benefits during event evaluation. Locking requiredduring event offloading is already done by the ShadowVM framework. In thescenario, where events are buffered to only one event group (simulating total or-dering), ShadowVM takes care about all the necessary locking. It is guaranteed,that events are processed by a single thread no matter what threading modelis used in the observed application. In contrast, in-process analysis cannot doany assumption about the threading model used by the observed application andlocking has to be adapted to the worst-case scenario.
Life-cycle events
During the evaluation, analysis process thousands of events resulting in thou-sands of ShadowObjects created on the ShadowVM side. ShadowObjects may bereferenced from an analysis data structure and the structure grows infinitely asthe analysis processes more events. In-process analysis usually tracks analysedobjects using weak references and deallocates structures connected to the anal-ysed objects at the time the object is garbage collected. It also registers shutdownhooks to do final processing during observed VM shutdown.
To provide a similar cleanup mechanism, the Shadow API introduces twokinds of life-cycle events. An object lifetime event is triggered every time anobject referenced by a ShadowObject is reclaimed. It is guaranteed that theobject lifetime event is triggered as the last event referencing such an object andmay be used as a cleanup event. A VM death life-cycle event is triggered at the
24
end of the analysis when the observed VM is shutting down. The VM deathlife-cycle event is meant for final cleanup and no other events arrive after VMdeath.
In the ShadowVM programming model, event context propagation can be seenas limiting. Especially the propagation of object references, where the analysisneeds to propagate all requested fields of an object separately. The propagation ofobject state could be automated in the framework, however it would hit anotherlimit where each reference stored in a field would be again only the ShadowObjectwithout any data. A solution would be either propagate the whole reachable stateat the time an event is generated, or propagate every observable state change ofthe application. We believe that the analysis developer should have full controlover the information being transferred and an automated solution should be usedonly when truly required.
To provide better isolation, ShadowVM offloads the dynamic analysis out ofthe context of the observed application. The Shadow API provides access toobjects and class information and introduces life-cycle events to support long-running analyses. ShadowVM introduces several mechanisms to improve theperformance and increase the usability of the platform. The analysis developer isgranted full control over the data being transmitted to eliminate unnecessary datatransfers. The events are transmitted and evaluated asynchronously to decreasethe execution time required for the application threads to dispatch the events. Toreduce lock contention while buffering the events, ShadowVM introduces severalevent ordering models.
The purpose of this section was to provide only a brief overview of ShadowVM.A more detailed description together with an evaluation can be found in theincluded paper called ShadowVM: Robust and Comprehensive Dynamic ProgramAnalysis for the Java Platform.
25

26

Part II
Collection of Papers
27

Preface
Foundations of this thesis were published on several research conferences. In thefollowing chapters, we include full version of the selected publications.
The paper called DiSL: A Domain-Specific Language for Bytecode Instrumen-tation describes the DiSL instrumentation language and its implementation in theDiSL framework. The evaluation part of the paper compares DiSL to ASM andAspectJ, often used instrumentation tools. The author of this thesis largely con-tributed to the design of the DiSL language. He was also the lead developer andone of the two main authors of the DiSL framework and substantially contributedto the text of the paper.
The second paper, ShadowVM: Robust and Comprehensive Dynamic ProgramAnalysis for the Java Platform, describes the framework for offloading dynamicanalyses out of the context of the observed application and assess its performancecompared to the in-process analysis. The author of this thesis designed andimplemented most of the framework and substantially contributed to the text ofthe paper.
The third paper, called Introduction to Dynamic Program Analysis with DiSL,is a complete presentation of DiSL. It introduces most features of DiSL based onexamples and demonstrates the benefits of DiSL on several case studies. Theauthor of this thesis prepared the demonstration of DiSL and its description.The case studies and their evaluation, together with the implementation of theexamples, were prepared by the co-authors.
A complete list of all author’s publications can be found at the end of thethesis.
29

30
Chapter 3
DiSL: A Domain-SpecificLanguage for BytecodeInstrumentation
Lukas Marek,Alex Villazon,Yudi Zheng,Danilo Ansaloni,Walter Binder,Zhengwei Qi
Contributed paper at the 11th Annual International Confer-ence on Aspect-oriented Software Development (AOSD 2012).
In conference proceedings,published by ACM,pages 239-250,ISBN 978-1-4503-1092-5,March 2012.
The original version is available electronically from the publisher’ssite at http://dx.doi.org/10.1145/2162049.2162077.
31
DiSL: A Domain-Specific Language for Bytecode Instrumentation
Lukas Marek
Charles University, Czech Republic
Alex Villazon
Universidad Privada Boliviana, Bolivia
Yudi Zheng
Shanghai Jiao Tong University, China
Danilo Ansaloni Walter Binder
University of Lugano, Switzerland
{danilo.ansaloni, walter.binder}@usi.ch
Zhengwei Qi
Shanghai Jiao Tong University, China
Abstract
Many dynamic analysis tools for programs written in man-
aged languages such as Java rely on bytecode instrumenta-
tion. Tool development is often tedious because of the use
of low-level bytecode manipulation libraries. While aspect-
oriented programming (AOP) offers high-level abstractions
to concisely express certain dynamic analyses, the join point
model of mainstream AOP languages such as AspectJ is not
well suited for many analysis tasks and the code generated
by weavers in support of certain language features incurs
high overhead. In this paper we introduce DiSL (domain-
specific language for instrumentation), a new language es-
pecially designed for dynamic program analysis. DiSL of-
fers an open join point model where any region of byte-
codes can be a shadow, synthetic local variables for effi-
cient data passing, efficient access to comprehensive static
and dynamic context information, and weave-time execu-
tion of user-defined static analysis code. We demonstrate the
benefits of DiSL with a case study, recasting an existing dy-
namic analysis tool originally implemented in AspectJ. We
show that the DiSL version offers better code coverage, in-
curs significantly less overhead, and eases the integration of
new analysis features that could not be expressed in AspectJ.
Categories and Subject Descriptors D.3.3 [Program-
ming Languages]: Language Constructs and Features—
Frameworks
General Terms Languages, Measurement, Performance
Keywords Bytecode instrumentation, dynamic program
analysis, aspect-oriented programming, JVM
Permission to make digital or hard copies of all or part of this work for personal orclassroom use is granted without fee provided that copies are not made or distributedfor profit or commercial advantage and that copies bear this notice and the full citationon the first page. To copy otherwise, to republish, to post on servers or to redistributeto lists, requires prior specific permission and/or a fee.
AOSD’12, March 25–30, 2012, Potsdam, Germany.Copyright © 2012 ACM 978-1-4503-1092-5/12/03. . . $10.00
1. Introduction
Dynamic program analysis tools support numerous software
engineering tasks, including profiling, debugging, testing,
program comprehension, and reverse engineering. Despite
of the importance of dynamic analysis, prevailing techniques
for building dynamic analysis tools are based on low-level
abstractions that make tool development, maintenance, and
customization tedious, error-prone, and hence expensive.
For example, many dynamic analysis tools for the Java Vir-
tual Machine (JVM) rely on bytecode instrumentation, sup-
ported by a variety of bytecode engineering libraries that of-
fer low-level APIs resulting in verbose implementation code.
In an attempt to simplify the development of dy-
namic analysis tools, researchers have explored the use of
aspect-oriented programming (AOP) languages, such as As-
pectJ [16]. Examples of aspect-based dynamic analysis tools
are the DJProf profilers [20], the RacerAJ data-race detec-
tor [10], and the Senseo Eclipse plugin for augmenting static
source code views with dynamic information [21]. However,
as neither mainstream AOP languages nor the correspond-
ing weavers have been designed to meet the requirements
of dynamic program analysis, the success of using AOP for
dynamic analysis remains limited. For example, in AspectJ,
join points that are important for dynamic program analysis
(e.g., the execution of bytecodes or basic blocks) are miss-
ing, access to reflective dynamic join point information is
expensive, data passing between woven advice in local vari-
ables is not supported, and the mixing of low-level bytecode
instrumentation and high-level AOP code is not foreseen.
In this paper, we introduce DiSL, a new domain-specific
language for bytecode instrumentation. DiSL relies on AOP
principles for concisely expressing efficient dynamic analy-
sis tools. The language provides an open join point model
defined by an extensible set of bytecode markers, efficient
access to static and dynamic context information, optimized
processing of method1 arguments, and synthetic local vari-
1 In this paper, “method” stands for “method or constructor”.
32
ables for efficient data passing. While DiSL significantly
raises the abstraction level when compared to prevailing
bytecode manipulation libraries, it also exposes a low-level
API to implement new bytecode markers. The DiSL weaver
guarantees complete bytecode coverage to ensure that anal-
ysis results represent overall program execution. DiSL fol-
lows similar design principles as @J [8], an AOP lan-
guage for dynamic analysis, which however lacks an open
join point model and efficient access to method arguments.
Compared to high-level dynamic analysis frameworks
such as RoadRunner [13] or jchord2 that restrict the loca-
tions that can be instrumented, DiSL offers the developer
fine-grained control over the inserted bytecode; that is, DiSL
is not tailored for any specify dynamic analysis task, but pro-
vides constructs for concisely expressing any bytecode in-
strumentation. Instrumentation sites can be specified with a
combination of bytecode markers, scoping expressions, and
guards; guards represent static analyses executed at weave-
time. Instrumentation code is provided in the form of snip-
pets, that is, code templates that are instantiated for each se-
lected instrumentation site and inlined. Snippets may access
synthetic local variables to pass data from one instrumenta-
tion site to another. Snippets may access any static or dy-
namic context information; they may also process an arbi-
trary number of method arguments in a custom way.
The scientific contributions of this paper are twofold:
1. We present our design goals, the DiSL language con-
structs, and the implementation of the DiSL weaver.
2. We present a case study to illustrate the benefits of DiSL.
We recast Senseo [21, 22] in DiSL; Senseo is an AspectJ-
based profiling tool that supports various software main-
tenance tasks. In contrast to the former AspectJ imple-
mentation, the DiSL version of the tool features complete
bytecode coverage, introduces significantly less over-
head, and can be easily extended to collect additional dy-
namic metrics on the intra-procedural control flow.
This paper is structured as follows: Section 2 describes
the design goals underlying DiSL. Section 3 gives a detailed
overview of the DiSL language constructs. The software ar-
chitecture of the DiSL weaver and its implementation are
discussed in Section 4. Our case study is introduced in Sec-
tion 5 and evaluated in Section 6. Section 7 discusses related
work, Section 8 summarizes the strengths and limitations of
DiSL, and Section 9 concludes.
2. Design of DiSL
Designing a good language for instrumentation-based dy-
namic program analysis is challenging, because we need
to reconcile three conflicting design goals: (1) high expres-
siveness of the language, (2) a convenient, high-level pro-
gramming model, and (3) high efficiency of the developed
2 http://code.google.com/p/jchord/
analysis tools. On the one hand, existing bytecode manip-
ulation libraries meet the first and the third goal, but pro-
vide only low-level abstractions that make tool development
cumbersome. On the other hand, mainstreamAOP languages
achieve the second goal, but lack expressiveness (e.g., lack
of join points that would allow tracing the intra-procedural
control flow) and suffer from inefficiencies (e.g., access to
dynamic reflective join point information may require the
allocation of unnecessary objects). The design of DiSL aims
at bridging the gap between low-level bytecode manipula-
tion frameworks and high-level AOP. Below, we motivate
the main design choices underlying DiSL.
Open join point model. DiSL allows any region of byte-
codes to be used as a join point, thus following an open
join point model. That is, the set of supported join point
shadows [15] is not hard-coded. To enable the definition of
new join points, DiSL provides an extensible mechanism for
marking user-defined bytecode regions (i.e., shadows).
Compatibility with Java and the JVM. DiSL is a domain-
specific embedded language which has Java as its host lan-
guage. DiSL instrumentations are implemented in Java, and
annotations are used to express where programs are to be in-
strumented. Dynamic analysis tools written in DiSL can be
compiled with any Java compiler and executed on any JVM.
Advice inlining and data passing in synthetic local vari-
ables. Advice in DiSL are expressed in the form of code
snippets that are inlined, giving the developer fine-grained
control over the inserted code. DiSL instrumentations (cor-
responding to aspects in AOP) describe where snippets are to
be inserted into the base program. Thanks to inlining, snip-
pets woven into the same method are able to efficiently com-
municate data through synthetic local variables [6].
Efficient access to complete static and dynamic context in-
formation. In DiSL, all static context information is exposed
to the developer. This feature is similar to AspectJ’s static
reflective join point information (offering class and method
properties), but exposes additional information at the basic
block and bytecode level. DiSL also supports user-defined
static analysis to compute further static context information
at weave-time. In addition, DiSL provides a simple, yet pow-
erful reflective API to gather dynamic context information
which gives access to local variables and to the operand
stack, supporting also efficient access to an arbitrary num-
ber of method arguments.
No support for around advice. Mainstream AOP lan-
guages support advice execution before, after, and around
join points. Three common use cases of around advice are
(1) passing data around a join point, (2) skipping a join point,
and (3) executing a join point multiple times. As we assume
that instrumentations do not alter the control flow in the base
program, only the first use is relevant for us. However, for
the first use case, the same behavior can be achieved with
before and after advice using synthetic local variables [6].
33
Hence, DiSL only supports before and after advice, which
helps keep the weaver simple.
Complete bytecode coverage. DiSL is designed for weaving
with complete bytecode coverage. That is, the DiSL weaver
ensures that all methods that have a bytecode representation
can be woven, including methods in the standard Java class
library. To this end, the DiSL weaver relies on implementa-
tion techniques developed in previous work [19].
3. Language Features
In this section we give an overview of the language features
of DiSL. In Section 3.1 we introduce DiSL instrumentations
specified in the form of snippets; markers determine where
snippets are woven in the bytecode. The mechanism to con-
trol the inlining order of snippets is explained in Section 3.2.
Synthetic local variables for efficiently passing data between
woven snippets are presented in Section 3.3, and efficient ac-
cess to thread-local variables is discussed in Section 3.4. In
Section 3.5 we introduce static context to provide static re-
flective information, and we present the reflective API for
obtaining dynamic context information in Section 3.6. In
Section 3.7 we explain DiSL’s support for method argu-
ments processing. In Section 3.8 we introduce guards that
enable the evaluation of conditionals at weave-time to decide
whether a join point is to be captured, as well as a scoping
construct to restrict weaving.
3.1 Instrumentations, Snippets, and Markers
DiSL instrumentations are Java classes. An instrumenta-
tion can only have snippets that are static methods an-
notated with @Before, @After, @AfterReturning, or
@AfterThrowing. Snippets are defined as static methods,
because their body is used as a template that is instantiated
and inlined at the matching join points in the base program.
Snippets do not return any value and must not throw any ex-
ception (that is not caught by a handler in the snippet).
Because of DiSL’s open join point model, pointcuts are
not hardcoded in the language but defined by an extensible
library of markers. Markers are standard Java classes im-
plementing a special interface for join point selection. DiSL
provides a rich library of markers including those for method
body, basic block, individual bytecode, and exception han-
dler. In addition, the developer may extend existing markers
or implement new markers from scratch.
The marker class is specified in the marker attribute in
the snippet annotation. The weaver takes care of instantiating
the selected marker, matching the corresponding join points,
and weaving the snippets.
In addition to the predefined markers, DiSL offers join
point extensibility by exposing the internal representation of
method bodies to the developer, who has to implement code
to mark the bytecode regions defining the shadows for the
new join points.
3.2 Control of Snippet Order
It is common that several shadows coincide in the start-
ing instruction, that is, several snippets may apply to the
same join point. Similar to AspectJ’s advice precedence
resolution, DiSL provides a simple mechanism to control
snippet ordering through the order attribute in the snip-
pet annotation. The order is specified as a non-negative
integer value. For @Before, snippets with higher order
are inlined before snippets with lower order. For @After,
@AfterReturning, and @AfterThrowing, snippets with
lower order are inlined before snippets with higher order.
Thus, the order indicates “how close” to the shadow the snip-
pet shall be inlined.
3.3 Synthetic Local Variables
DiSL provides an efficient communication mechanism to
pass arbitrary data between snippets. The mechanism relies
on inlining so as to store the data in a local variable, which
is therefore visible in the scope of the woven method body.
DiSL provides the @SyntheticLocal annotation to spec-
ify the holder variable. Synthetic local variables must be de-
clared as static fields and can be used in any snippet. The
weaver takes care of translating the static field declared in
the instrumentation into a local variable in each instrumented
method, and of replacing the bytecodes that access the static
field with bytecodes that access the introduced local vari-
able. For details, we refer to [6].
3.4 Thread-local Variables
DiSL supports thread-local variables with the
@ThreadLocal annotation. This mechanism extends
java.lang.Thread by inserting the annotated field. While
the inserted fields are instance fields, thread-local variables
must be declared as static fields in the instrumentation class,
similar to synthetic local variables. These fields must be
initialized to the default value of the field’s type.3 The DiSL
weaver translates all access to thread-local variables in snip-
pets into bytecodes that access the corresponding field of the
currently executing thread. An inheritable flag can be
set in the @ThreadLocal annotation such that new threads
“inherit” the value of a thread-local variable from the creat-
ing thread. Note that the standard Java class library offers
classes with similar semantics (java.lang.ThreadLocaland java.lang.InheritableThreadLocal). However,
accessing fields directly inserted into java.lang.Threadresults in more efficient code.
3.5 Static Context Information
Accessing static context information is essential for dy-
namic analyses, for example, gathering information about
3During JVM bootstrapping, in general, inserted code cannot be executed
because it may introduce class dependencies that can violate JVM assump-
tions concerning the class initialization order. Hence, threads created during
bootstrapping could not initialize inserted thread-local fields in the begin-
ning.
34
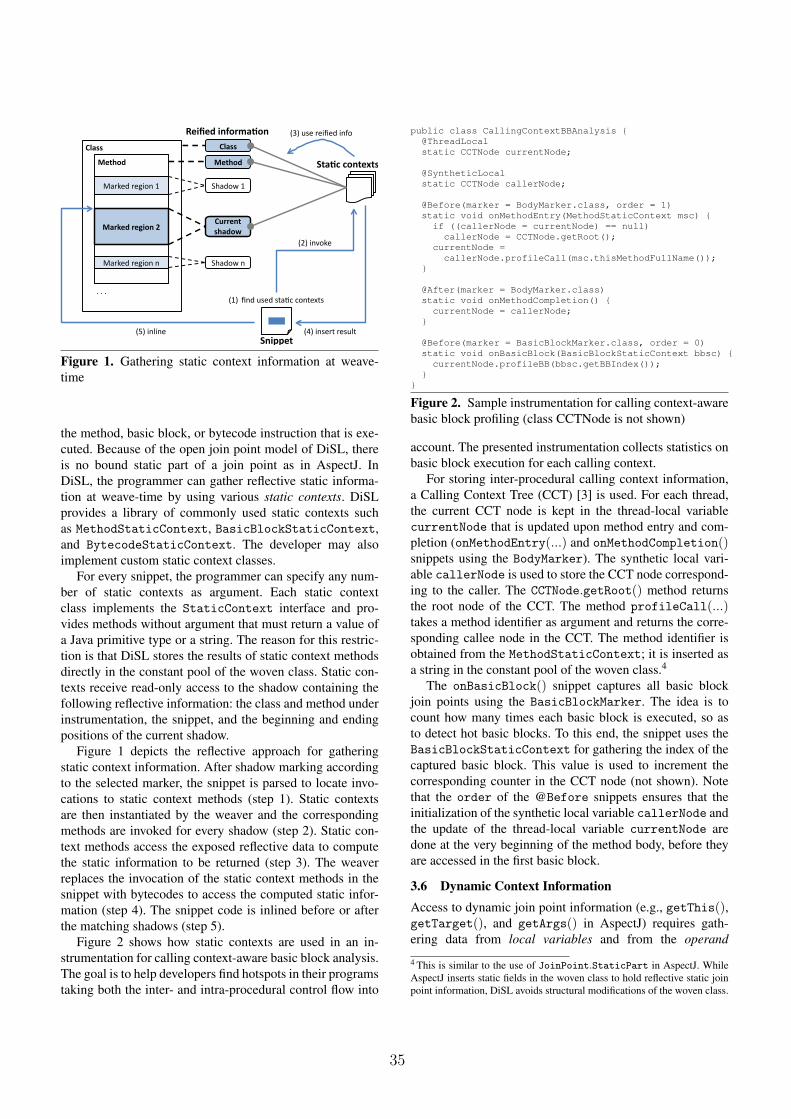
������
�������������
���������
�� ���
��� �����������
��������������
��� �����������
�������
� �����
���������
�������
�������
���������������
������
�� ���
�!�����������������"���������
���� �����������������������
�������� ��
� �����������������
Figure 1. Gathering static context information at weave-
time
the method, basic block, or bytecode instruction that is exe-
cuted. Because of the open join point model of DiSL, there
is no bound static part of a join point as in AspectJ. In
DiSL, the programmer can gather reflective static informa-
tion at weave-time by using various static contexts. DiSL
provides a library of commonly used static contexts such
as MethodStaticContext, BasicBlockStaticContext,
and BytecodeStaticContext. The developer may also
implement custom static context classes.
For every snippet, the programmer can specify any num-
ber of static contexts as argument. Each static context
class implements the StaticContext interface and pro-
vides methods without argument that must return a value of
a Java primitive type or a string. The reason for this restric-
tion is that DiSL stores the results of static context methods
directly in the constant pool of the woven class. Static con-
texts receive read-only access to the shadow containing the
following reflective information: the class and method under
instrumentation, the snippet, and the beginning and ending
positions of the current shadow.
Figure 1 depicts the reflective approach for gathering
static context information. After shadow marking according
to the selected marker, the snippet is parsed to locate invo-
cations to static context methods (step 1). Static contexts
are then instantiated by the weaver and the corresponding
methods are invoked for every shadow (step 2). Static con-
text methods access the exposed reflective data to compute
the static information to be returned (step 3). The weaver
replaces the invocation of the static context methods in the
snippet with bytecodes to access the computed static infor-
mation (step 4). The snippet code is inlined before or after
the matching shadows (step 5).
Figure 2 shows how static contexts are used in an in-
strumentation for calling context-aware basic block analysis.
The goal is to help developers find hotspots in their programs
taking both the inter- and intra-procedural control flow into
public class CallingContextBBAnalysis {
@ThreadLocal
static CCTNode currentNode;
@SyntheticLocal
static CCTNode callerNode;
@Before(marker = BodyMarker.class, order = 1)
static void onMethodEntry(MethodStaticContext msc) {
if ((callerNode = currentNode) == null)
callerNode = CCTNode.getRoot();
currentNode =
callerNode.profileCall(msc.thisMethodFullName());
}
@After(marker = BodyMarker.class)
static void onMethodCompletion() {
currentNode = callerNode;
}
@Before(marker = BasicBlockMarker.class, order = 0)
static void onBasicBlock(BasicBlockStaticContext bbsc) {
currentNode.profileBB(bbsc.getBBIndex());
}
}
Figure 2. Sample instrumentation for calling context-aware
basic block profiling (class CCTNode is not shown)
account. The presented instrumentation collects statistics on
basic block execution for each calling context.
For storing inter-procedural calling context information,
a Calling Context Tree (CCT) [3] is used. For each thread,
the current CCT node is kept in the thread-local variable
currentNode that is updated upon method entry and com-
pletion (onMethodEntry(...) and onMethodCompletion()snippets using the BodyMarker). The synthetic local vari-
able callerNode is used to store the CCT node correspond-
ing to the caller. The CCTNode.getRoot() method returns
the root node of the CCT. The method profileCall(...)takes a method identifier as argument and returns the corre-
sponding callee node in the CCT. The method identifier is
obtained from the MethodStaticContext; it is inserted as
a string in the constant pool of the woven class.4
The onBasicBlock() snippet captures all basic block
join points using the BasicBlockMarker. The idea is to
count how many times each basic block is executed, so as
to detect hot basic blocks. To this end, the snippet uses the
BasicBlockStaticContext for gathering the index of the
captured basic block. This value is used to increment the
corresponding counter in the CCT node (not shown). Note
that the order of the @Before snippets ensures that the
initialization of the synthetic local variable callerNode and
the update of the thread-local variable currentNode are
done at the very beginning of the method body, before they
are accessed in the first basic block.
3.6 Dynamic Context Information
Access to dynamic join point information (e.g., getThis(),getTarget(), and getArgs() in AspectJ) requires gath-
ering data from local variables and from the operand
4 This is similar to the use of JoinPoint.StaticPart in AspectJ. While
AspectJ inserts static fields in the woven class to hold reflective static join
point information, DiSL avoids structural modifications of the woven class.
35
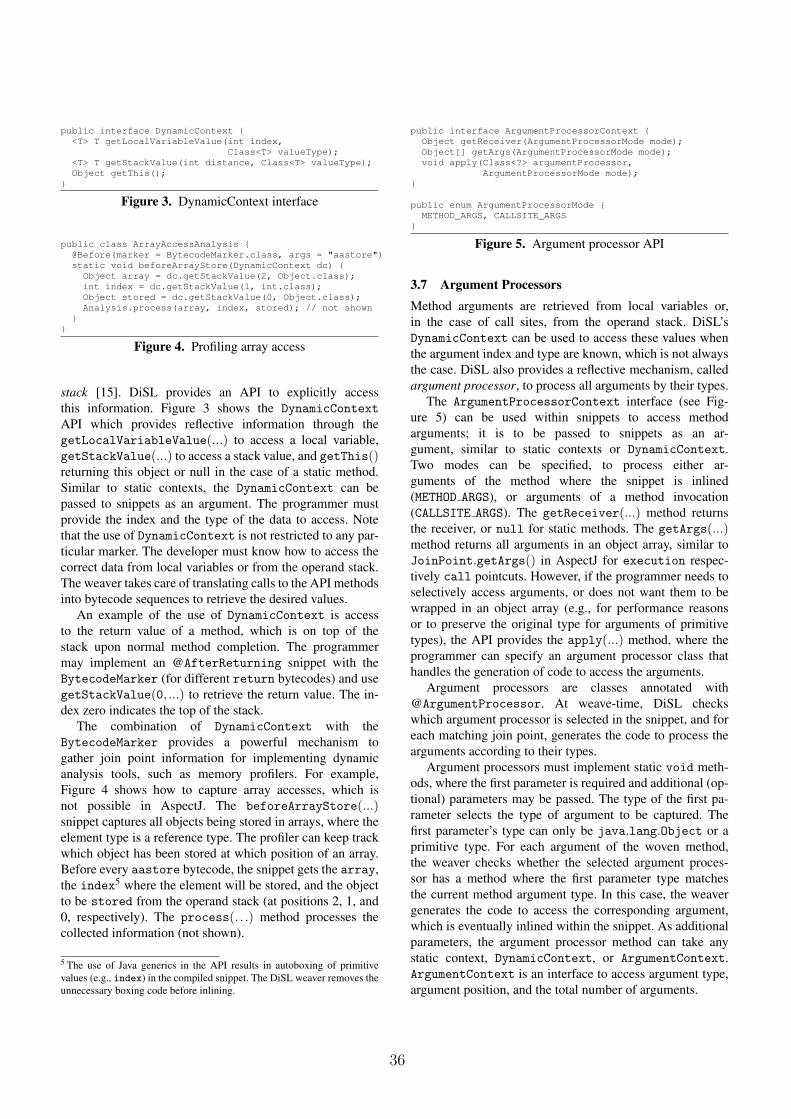
public interface DynamicContext {
<T> T getLocalVariableValue(int index,
Class<T> valueType);
<T> T getStackValue(int distance, Class<T> valueType);
Object getThis();
}
Figure 3. DynamicContext interface
public class ArrayAccessAnalysis {
@Before(marker = BytecodeMarker.class, args = "aastore")
static void beforeArrayStore(DynamicContext dc) {
Object array = dc.getStackValue(2, Object.class);
int index = dc.getStackValue(1, int.class);
Object stored = dc.getStackValue(0, Object.class);
Analysis.process(array, index, stored); // not shown
}
}
Figure 4. Profiling array access
stack [15]. DiSL provides an API to explicitly access
this information. Figure 3 shows the DynamicContext
API which provides reflective information through the
getLocalVariableValue(...) to access a local variable,
getStackValue(...) to access a stack value, and getThis()returning this object or null in the case of a static method.
Similar to static contexts, the DynamicContext can be
passed to snippets as an argument. The programmer must
provide the index and the type of the data to access. Note
that the use of DynamicContext is not restricted to any par-
ticular marker. The developer must know how to access the
correct data from local variables or from the operand stack.
The weaver takes care of translating calls to the API methods
into bytecode sequences to retrieve the desired values.
An example of the use of DynamicContext is access
to the return value of a method, which is on top of the
stack upon normal method completion. The programmer
may implement an @AfterReturning snippet with the
BytecodeMarker (for different return bytecodes) and use
getStackValue(0, ...) to retrieve the return value. The in-
dex zero indicates the top of the stack.
The combination of DynamicContext with the
BytecodeMarker provides a powerful mechanism to
gather join point information for implementing dynamic
analysis tools, such as memory profilers. For example,
Figure 4 shows how to capture array accesses, which is
not possible in AspectJ. The beforeArrayStore(...)snippet captures all objects being stored in arrays, where the
element type is a reference type. The profiler can keep track
which object has been stored at which position of an array.
Before every aastore bytecode, the snippet gets the array,
the index5 where the element will be stored, and the object
to be stored from the operand stack (at positions 2, 1, and
0, respectively). The process(. . .) method processes the
collected information (not shown).
5 The use of Java generics in the API results in autoboxing of primitive
values (e.g., index) in the compiled snippet. The DiSL weaver removes the
unnecessary boxing code before inlining.
public interface ArgumentProcessorContext {
Object getReceiver(ArgumentProcessorMode mode);
Object[] getArgs(ArgumentProcessorMode mode);
void apply(Class<?> argumentProcessor,
ArgumentProcessorMode mode);
}
public enum ArgumentProcessorMode {
METHOD_ARGS, CALLSITE_ARGS
}
Figure 5. Argument processor API
3.7 Argument Processors
Method arguments are retrieved from local variables or,
in the case of call sites, from the operand stack. DiSL’s
DynamicContext can be used to access these values when
the argument index and type are known, which is not always
the case. DiSL also provides a reflective mechanism, called
argument processor, to process all arguments by their types.
The ArgumentProcessorContext interface (see Fig-
ure 5) can be used within snippets to access method
arguments; it is to be passed to snippets as an ar-
gument, similar to static contexts or DynamicContext.
Two modes can be specified, to process either ar-
guments of the method where the snippet is inlined
(METHOD ARGS), or arguments of a method invocation
(CALLSITE ARGS). The getReceiver(...) method returns
the receiver, or null for static methods. The getArgs(...)method returns all arguments in an object array, similar to
JoinPoint.getArgs() in AspectJ for execution respec-
tively call pointcuts. However, if the programmer needs to
selectively access arguments, or does not want them to be
wrapped in an object array (e.g., for performance reasons
or to preserve the original type for arguments of primitive
types), the API provides the apply(...) method, where the
programmer can specify an argument processor class that
handles the generation of code to access the arguments.
Argument processors are classes annotated with
@ArgumentProcessor. At weave-time, DiSL checks
which argument processor is selected in the snippet, and for
each matching join point, generates the code to process the
arguments according to their types.
Argument processors must implement static void meth-
ods, where the first parameter is required and additional (op-
tional) parameters may be passed. The type of the first pa-
rameter selects the type of argument to be captured. The
first parameter’s type can only be java.lang.Object or a
primitive type. For each argument of the woven method,
the weaver checks whether the selected argument proces-
sor has a method where the first parameter type matches
the current method argument type. In this case, the weaver
generates the code to access the corresponding argument,
which is eventually inlined within the snippet. As additional
parameters, the argument processor method can take any
static context, DynamicContext, or ArgumentContext.
ArgumentContext is an interface to access argument type,
argument position, and the total number of arguments.
36
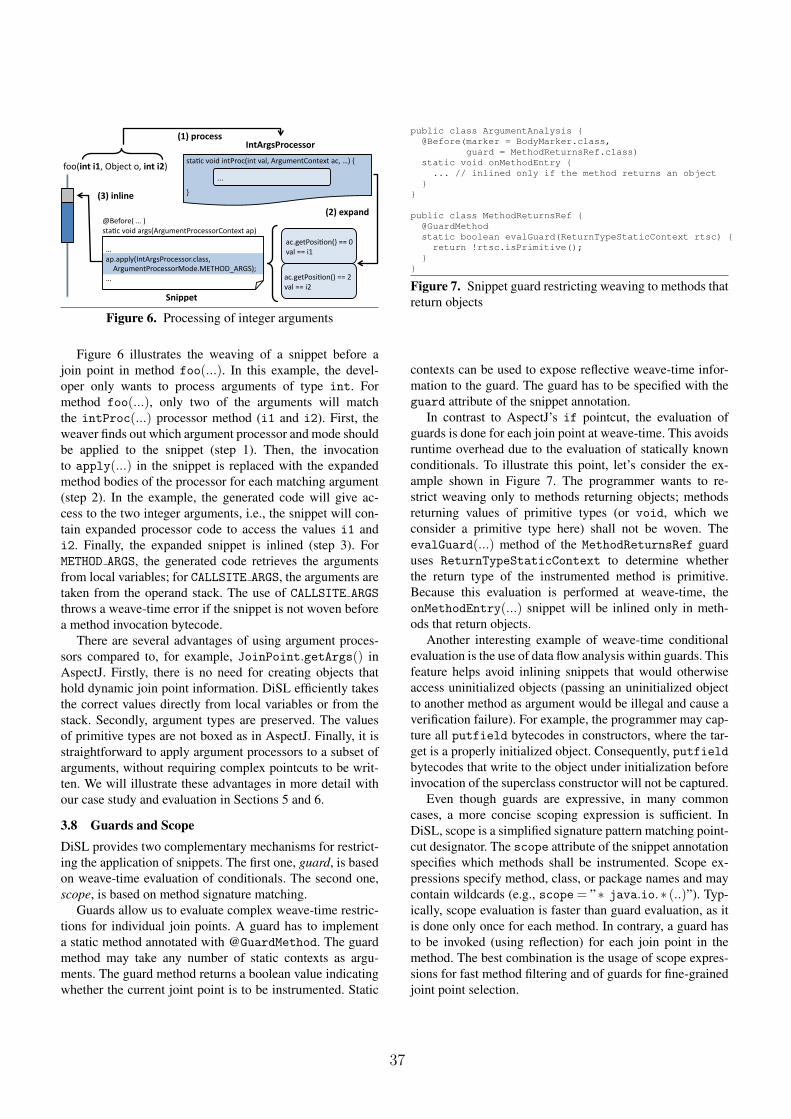
� �!��$������ ����-�� �$��(����#��� ��� �% ���(�+.�/�
0�
���-� ����(������ ��(�� ����.�
� �����
1������-�+�.�
� �!��$��������-���#��� ������������ �% ���.�
� ��������������
***�
��*�� ����!��-.�55�2�
$���55��3�
��*�� ����!��-.�55�4�
$���55��4�
�������� ��
����� �� �
�����������
+�
��*����&-� �������������*�����(����������������������������
�������#��� ������������*�����,� ��.)�
+�
Figure 6. Processing of integer arguments
Figure 6 illustrates the weaving of a snippet before a
join point in method foo(...). In this example, the devel-
oper only wants to process arguments of type int. For
method foo(...), only two of the arguments will match
the intProc(...) processor method (i1 and i2). First, the
weaver finds out which argument processor and mode should
be applied to the snippet (step 1). Then, the invocation
to apply(...) in the snippet is replaced with the expanded
method bodies of the processor for each matching argument
(step 2). In the example, the generated code will give ac-
cess to the two integer arguments, i.e., the snippet will con-
tain expanded processor code to access the values i1 and
i2. Finally, the expanded snippet is inlined (step 3). For
METHOD ARGS, the generated code retrieves the arguments
from local variables; for CALLSITE ARGS, the arguments are
taken from the operand stack. The use of CALLSITE ARGS
throws a weave-time error if the snippet is not woven before
a method invocation bytecode.
There are several advantages of using argument proces-
sors compared to, for example, JoinPoint.getArgs() in
AspectJ. Firstly, there is no need for creating objects that
hold dynamic join point information. DiSL efficiently takes
the correct values directly from local variables or from the
stack. Secondly, argument types are preserved. The values
of primitive types are not boxed as in AspectJ. Finally, it is
straightforward to apply argument processors to a subset of
arguments, without requiring complex pointcuts to be writ-
ten. We will illustrate these advantages in more detail with
our case study and evaluation in Sections 5 and 6.
3.8 Guards and Scope
DiSL provides two complementary mechanisms for restrict-
ing the application of snippets. The first one, guard, is based
on weave-time evaluation of conditionals. The second one,
scope, is based on method signature matching.
Guards allow us to evaluate complex weave-time restric-
tions for individual join points. A guard has to implement
a static method annotated with @GuardMethod. The guard
method may take any number of static contexts as argu-
ments. The guard method returns a boolean value indicating
whether the current joint point is to be instrumented. Static
public class ArgumentAnalysis {
@Before(marker = BodyMarker.class,
guard = MethodReturnsRef.class)
static void onMethodEntry {
... // inlined only if the method returns an object
}
}
public class MethodReturnsRef {
@GuardMethod
static boolean evalGuard(ReturnTypeStaticContext rtsc) {
return !rtsc.isPrimitive();
}
}
Figure 7. Snippet guard restricting weaving to methods that
return objects
contexts can be used to expose reflective weave-time infor-
mation to the guard. The guard has to be specified with the
guard attribute of the snippet annotation.
In contrast to AspectJ’s if pointcut, the evaluation of
guards is done for each join point at weave-time. This avoids
runtime overhead due to the evaluation of statically known
conditionals. To illustrate this point, let’s consider the ex-
ample shown in Figure 7. The programmer wants to re-
strict weaving only to methods returning objects; methods
returning values of primitive types (or void, which we
consider a primitive type here) shall not be woven. The
evalGuard(...) method of the MethodReturnsRef guard
uses ReturnTypeStaticContext to determine whether
the return type of the instrumented method is primitive.
Because this evaluation is performed at weave-time, the
onMethodEntry(...) snippet will be inlined only in meth-
ods that return objects.
Another interesting example of weave-time conditional
evaluation is the use of data flow analysis within guards. This
feature helps avoid inlining snippets that would otherwise
access uninitialized objects (passing an uninitialized object
to another method as argument would be illegal and cause a
verification failure). For example, the programmer may cap-
ture all putfield bytecodes in constructors, where the tar-
get is a properly initialized object. Consequently, putfield
bytecodes that write to the object under initialization before
invocation of the superclass constructor will not be captured.
Even though guards are expressive, in many common
cases, a more concise scoping expression is sufficient. In
DiSL, scope is a simplified signature pattern matching point-
cut designator. The scope attribute of the snippet annotation
specifies which methods shall be instrumented. Scope ex-
pressions specify method, class, or package names and may
contain wildcards (e.g., scope= ”∗ java.io.∗ (..)”). Typ-ically, scope evaluation is faster than guard evaluation, as it
is done only once for each method. In contrary, a guard has
to be invoked (using reflection) for each join point in the
method. The best combination is the usage of scope expres-
sions for fast method filtering and of guards for fine-grained
joint point selection.
37
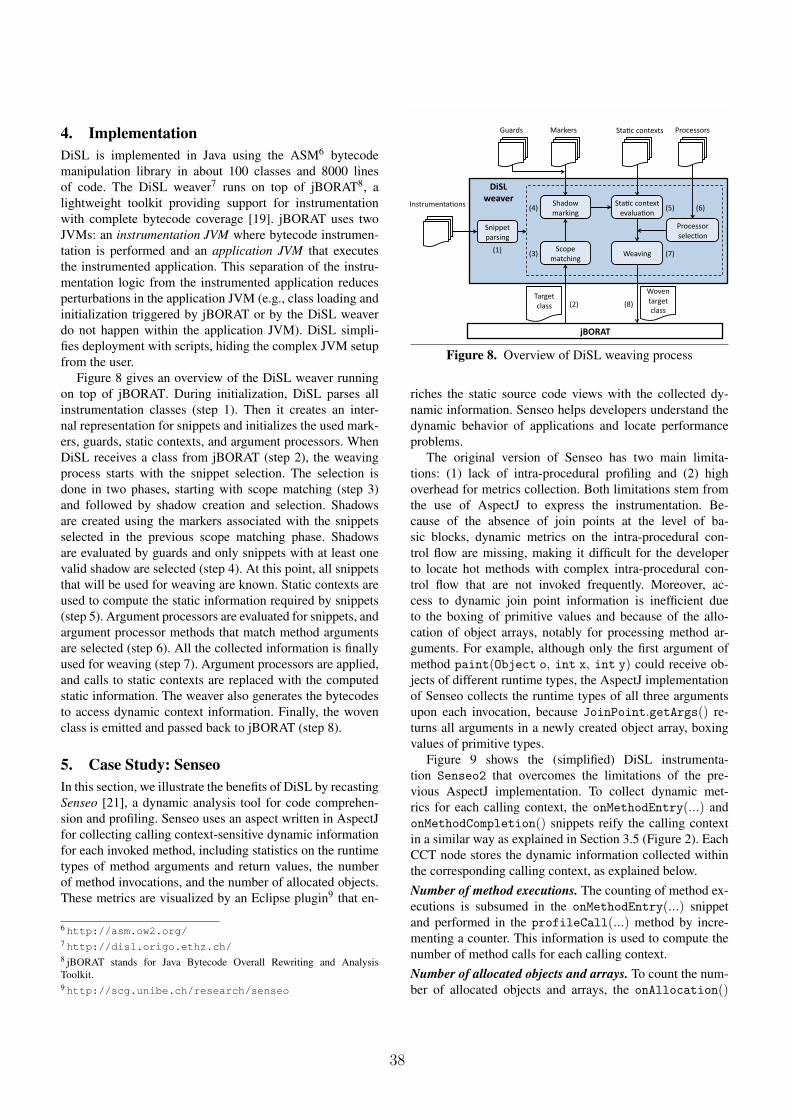
4. Implementation
DiSL is implemented in Java using the ASM6 bytecode
manipulation library in about 100 classes and 8000 lines
of code. The DiSL weaver7 runs on top of jBORAT8, a
lightweight toolkit providing support for instrumentation
with complete bytecode coverage [19]. jBORAT uses two
JVMs: an instrumentation JVM where bytecode instrumen-
tation is performed and an application JVM that executes
the instrumented application. This separation of the instru-
mentation logic from the instrumented application reduces
perturbations in the application JVM (e.g., class loading and
initialization triggered by jBORAT or by the DiSL weaver
do not happen within the application JVM). DiSL simpli-
fies deployment with scripts, hiding the complex JVM setup
from the user.
Figure 8 gives an overview of the DiSL weaver running
on top of jBORAT. During initialization, DiSL parses all
instrumentation classes (step 1). Then it creates an inter-
nal representation for snippets and initializes the used mark-
ers, guards, static contexts, and argument processors. When
DiSL receives a class from jBORAT (step 2), the weaving
process starts with the snippet selection. The selection is
done in two phases, starting with scope matching (step 3)
and followed by shadow creation and selection. Shadows
are created using the markers associated with the snippets
selected in the previous scope matching phase. Shadows
are evaluated by guards and only snippets with at least one
valid shadow are selected (step 4). At this point, all snippets
that will be used for weaving are known. Static contexts are
used to compute the static information required by snippets
(step 5). Argument processors are evaluated for snippets, and
argument processor methods that match method arguments
are selected (step 6). All the collected information is finally
used for weaving (step 7). Argument processors are applied,
and calls to static contexts are replaced with the computed
static information. The weaver also generates the bytecodes
to access dynamic context information. Finally, the woven
class is emitted and passed back to jBORAT (step 8).
5. Case Study: Senseo
In this section, we illustrate the benefits of DiSL by recasting
Senseo [21], a dynamic analysis tool for code comprehen-
sion and profiling. Senseo uses an aspect written in AspectJ
for collecting calling context-sensitive dynamic information
for each invoked method, including statistics on the runtime
types of method arguments and return values, the number
of method invocations, and the number of allocated objects.
These metrics are visualized by an Eclipse plugin9 that en-
6 http://asm.ow2.org/
7 http://disl.origo.ethz.ch/
8 jBORAT stands for Java Bytecode Overall Rewriting and Analysis
Toolkit.9 http://scg.unibe.ch/research/senseo
!"#$%#&' ()"*+'+,-)%.)&'
!"#$%&'
/"#0%)'
+1"&&'
2%"34-0'
2,3%-'
)"#0%)'
+1"&&'
(+,5%'
6")+74-0'
()"*+'+,-)%.)'
%3"18"*,-'
(7"9,:'
6"#$4-0'
(-455%)'
5"#&4-0'
()*+''
,-./-0'
;<='
;>=';?='
;@=' ;A='
;B='
;C='
D#,+%&&,#'
&%1%+*,-'
E-&)#86%-)"*,-&'
D#,+%&&,#&'F8"#9&'
;G='
Figure 8. Overview of DiSL weaving process
riches the static source code views with the collected dy-
namic information. Senseo helps developers understand the
dynamic behavior of applications and locate performance
problems.
The original version of Senseo has two main limita-
tions: (1) lack of intra-procedural profiling and (2) high
overhead for metrics collection. Both limitations stem from
the use of AspectJ to express the instrumentation. Be-
cause of the absence of join points at the level of ba-
sic blocks, dynamic metrics on the intra-procedural con-
trol flow are missing, making it difficult for the developer
to locate hot methods with complex intra-procedural con-
trol flow that are not invoked frequently. Moreover, ac-
cess to dynamic join point information is inefficient due
to the boxing of primitive values and because of the allo-
cation of object arrays, notably for processing method ar-
guments. For example, although only the first argument of
method paint(Object o, int x, int y) could receive ob-
jects of different runtime types, the AspectJ implementation
of Senseo collects the runtime types of all three arguments
upon each invocation, because JoinPoint.getArgs() re-
turns all arguments in a newly created object array, boxing
values of primitive types.
Figure 9 shows the (simplified) DiSL instrumenta-
tion Senseo2 that overcomes the limitations of the pre-
vious AspectJ implementation. To collect dynamic met-
rics for each calling context, the onMethodEntry(...) and
onMethodCompletion() snippets reify the calling context
in a similar way as explained in Section 3.5 (Figure 2). Each
CCT node stores the dynamic information collected within
the corresponding calling context, as explained below.
Number of method executions. The counting of method ex-
ecutions is subsumed in the onMethodEntry(...) snippet
and performed in the profileCall(...) method by incre-
menting a counter. This information is used to compute the
number of method calls for each calling context.
Number of allocated objects and arrays. To count the num-
ber of allocated objects and arrays, the onAllocation()
38
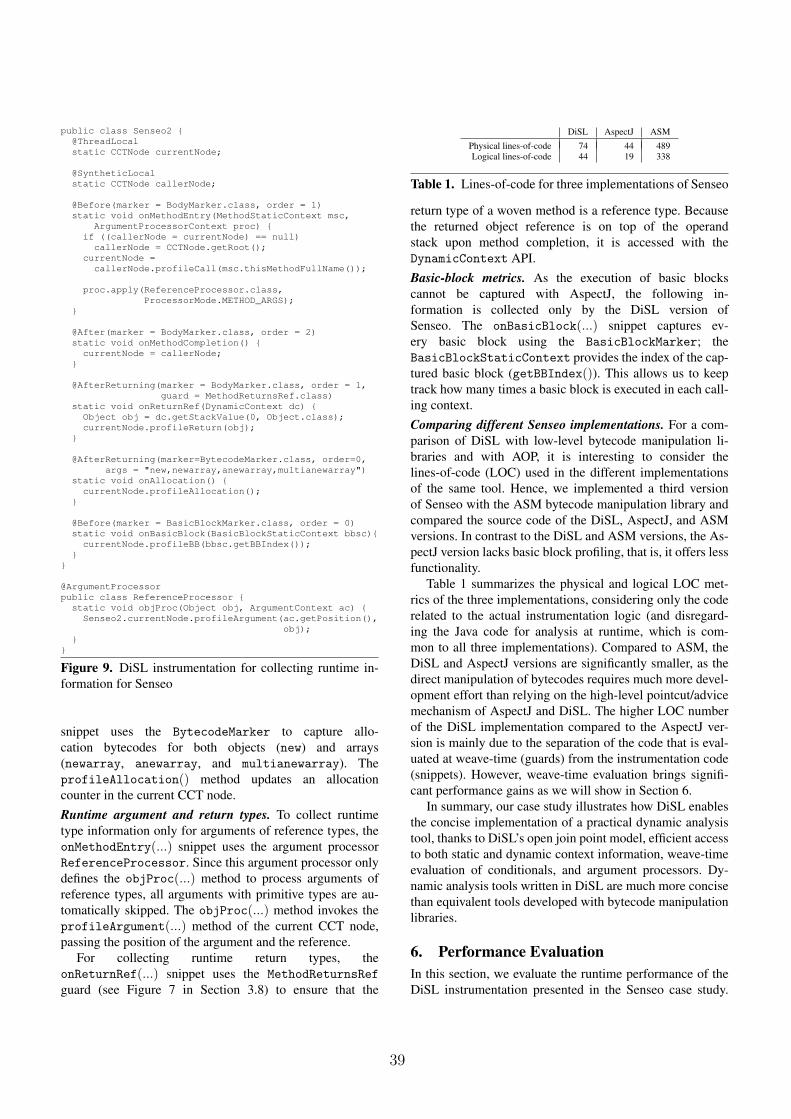
public class Senseo2 {
@ThreadLocal
static CCTNode currentNode;
@SyntheticLocal
static CCTNode callerNode;
@Before(marker = BodyMarker.class, order = 1)
static void onMethodEntry(MethodStaticContext msc,
ArgumentProcessorContext proc) {
if ((callerNode = currentNode) == null)
callerNode = CCTNode.getRoot();
currentNode =
callerNode.profileCall(msc.thisMethodFullName());
proc.apply(ReferenceProcessor.class,
ProcessorMode.METHOD_ARGS);
}
@After(marker = BodyMarker.class, order = 2)
static void onMethodCompletion() {
currentNode = callerNode;
}
@AfterReturning(marker = BodyMarker.class, order = 1,
guard = MethodReturnsRef.class)
static void onReturnRef(DynamicContext dc) {
Object obj = dc.getStackValue(0, Object.class);
currentNode.profileReturn(obj);
}
@AfterReturning(marker=BytecodeMarker.class, order=0,
args = "new,newarray,anewarray,multianewarray")
static void onAllocation() {
currentNode.profileAllocation();
}
@Before(marker = BasicBlockMarker.class, order = 0)
static void onBasicBlock(BasicBlockStaticContext bbsc){
currentNode.profileBB(bbsc.getBBIndex());
}
}
@ArgumentProcessor
public class ReferenceProcessor {
static void objProc(Object obj, ArgumentContext ac) {
Senseo2.currentNode.profileArgument(ac.getPosition(),
obj);
}
}
Figure 9. DiSL instrumentation for collecting runtime in-
formation for Senseo
snippet uses the BytecodeMarker to capture allo-
cation bytecodes for both objects (new) and arrays
(newarray, anewarray, and multianewarray). The
profileAllocation() method updates an allocation
counter in the current CCT node.
Runtime argument and return types. To collect runtime
type information only for arguments of reference types, the
onMethodEntry(...) snippet uses the argument processor
ReferenceProcessor. Since this argument processor only
defines the objProc(...) method to process arguments of
reference types, all arguments with primitive types are au-
tomatically skipped. The objProc(...) method invokes the
profileArgument(...) method of the current CCT node,
passing the position of the argument and the reference.
For collecting runtime return types, the
onReturnRef(...) snippet uses the MethodReturnsRef
guard (see Figure 7 in Section 3.8) to ensure that the
DiSL AspectJ ASM
Physical lines-of-code 74 44 489Logical lines-of-code 44 19 338
Table 1. Lines-of-code for three implementations of Senseo
return type of a woven method is a reference type. Because
the returned object reference is on top of the operand
stack upon method completion, it is accessed with the
DynamicContext API.
Basic-block metrics. As the execution of basic blocks
cannot be captured with AspectJ, the following in-
formation is collected only by the DiSL version of
Senseo. The onBasicBlock(...) snippet captures ev-
ery basic block using the BasicBlockMarker; the
BasicBlockStaticContext provides the index of the cap-
tured basic block (getBBIndex()). This allows us to keep
track how many times a basic block is executed in each call-
ing context.
Comparing different Senseo implementations. For a com-
parison of DiSL with low-level bytecode manipulation li-
braries and with AOP, it is interesting to consider the
lines-of-code (LOC) used in the different implementations
of the same tool. Hence, we implemented a third version
of Senseo with the ASM bytecode manipulation library and
compared the source code of the DiSL, AspectJ, and ASM
versions. In contrast to the DiSL and ASM versions, the As-
pectJ version lacks basic block profiling, that is, it offers less
functionality.
Table 1 summarizes the physical and logical LOC met-
rics of the three implementations, considering only the code
related to the actual instrumentation logic (and disregard-
ing the Java code for analysis at runtime, which is com-
mon to all three implementations). Compared to ASM, the
DiSL and AspectJ versions are significantly smaller, as the
direct manipulation of bytecodes requires much more devel-
opment effort than relying on the high-level pointcut/advice
mechanism of AspectJ and DiSL. The higher LOC number
of the DiSL implementation compared to the AspectJ ver-
sion is mainly due to the separation of the code that is eval-
uated at weave-time (guards) from the instrumentation code
(snippets). However, weave-time evaluation brings signifi-
cant performance gains as we will show in Section 6.
In summary, our case study illustrates how DiSL enables
the concise implementation of a practical dynamic analysis
tool, thanks to DiSL’s open join point model, efficient access
to both static and dynamic context information, weave-time
evaluation of conditionals, and argument processors. Dy-
namic analysis tools written in DiSL are much more concise
than equivalent tools developed with bytecode manipulation
libraries.
6. Performance Evaluation
In this section, we evaluate the runtime performance of the
DiSL instrumentation presented in the Senseo case study.
39
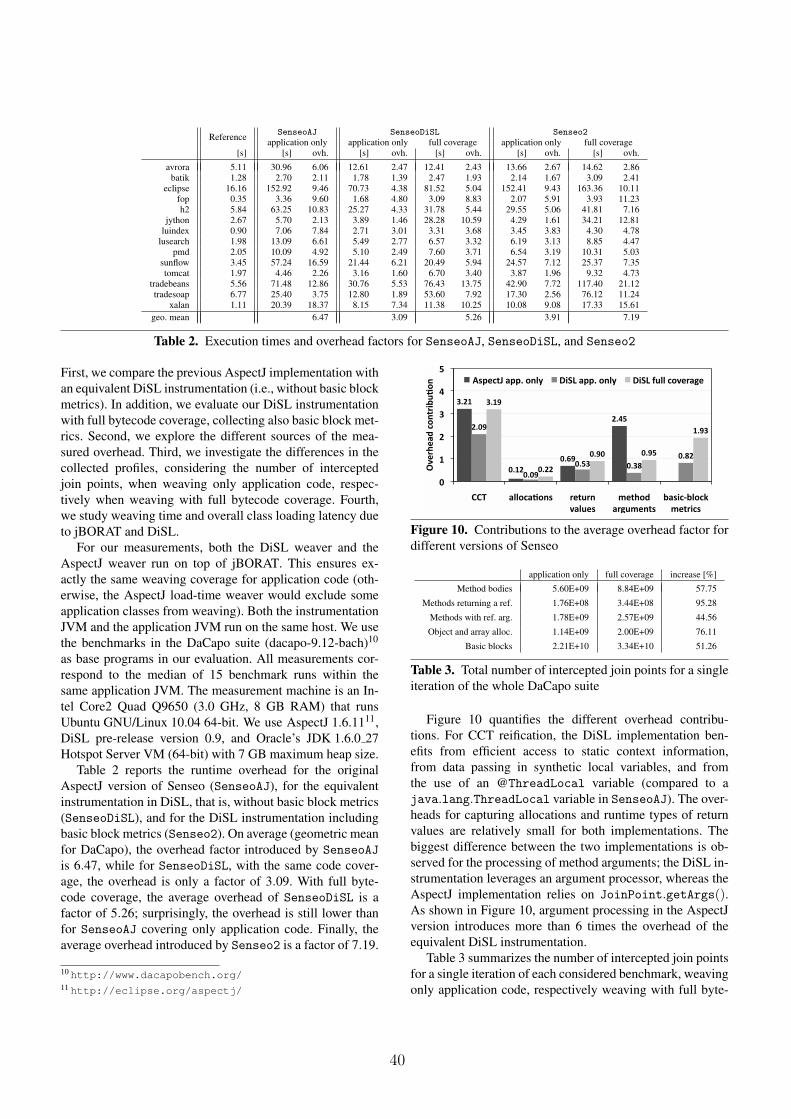
ReferenceSenseoAJ SenseoDiSL Senseo2
application only application only full coverage application only full coverage[s] [s] ovh. [s] ovh. [s] ovh. [s] ovh. [s] ovh.
avrora 5.11 30.96 6.06 12.61 2.47 12.41 2.43 13.66 2.67 14.62 2.86batik 1.28 2.70 2.11 1.78 1.39 2.47 1.93 2.14 1.67 3.09 2.41
eclipse 16.16 152.92 9.46 70.73 4.38 81.52 5.04 152.41 9.43 163.36 10.11fop 0.35 3.36 9.60 1.68 4.80 3.09 8.83 2.07 5.91 3.93 11.23h2 5.84 63.25 10.83 25.27 4.33 31.78 5.44 29.55 5.06 41.81 7.16
jython 2.67 5.70 2.13 3.89 1.46 28.28 10.59 4.29 1.61 34.21 12.81luindex 0.90 7.06 7.84 2.71 3.01 3.31 3.68 3.45 3.83 4.30 4.78lusearch 1.98 13.09 6.61 5.49 2.77 6.57 3.32 6.19 3.13 8.85 4.47
pmd 2.05 10.09 4.92 5.10 2.49 7.60 3.71 6.54 3.19 10.31 5.03sunflow 3.45 57.24 16.59 21.44 6.21 20.49 5.94 24.57 7.12 25.37 7.35tomcat 1.97 4.46 2.26 3.16 1.60 6.70 3.40 3.87 1.96 9.32 4.73
tradebeans 5.56 71.48 12.86 30.76 5.53 76.43 13.75 42.90 7.72 117.40 21.12tradesoap 6.77 25.40 3.75 12.80 1.89 53.60 7.92 17.30 2.56 76.12 11.24
xalan 1.11 20.39 18.37 8.15 7.34 11.38 10.25 10.08 9.08 17.33 15.61
geo. mean 6.47 3.09 5.26 3.91 7.19
Table 2. Execution times and overhead factors for SenseoAJ, SenseoDiSL, and Senseo2
First, we compare the previous AspectJ implementation with
an equivalent DiSL instrumentation (i.e., without basic block
metrics). In addition, we evaluate our DiSL instrumentation
with full bytecode coverage, collecting also basic block met-
rics. Second, we explore the different sources of the mea-
sured overhead. Third, we investigate the differences in the
collected profiles, considering the number of intercepted
join points, when weaving only application code, respec-
tively when weaving with full bytecode coverage. Fourth,
we study weaving time and overall class loading latency due
to jBORAT and DiSL.
For our measurements, both the DiSL weaver and the
AspectJ weaver run on top of jBORAT. This ensures ex-
actly the same weaving coverage for application code (oth-
erwise, the AspectJ load-time weaver would exclude some
application classes from weaving). Both the instrumentation
JVM and the application JVM run on the same host. We use
the benchmarks in the DaCapo suite (dacapo-9.12-bach)10
as base programs in our evaluation. All measurements cor-
respond to the median of 15 benchmark runs within the
same application JVM. The measurement machine is an In-
tel Core2 Quad Q9650 (3.0 GHz, 8 GB RAM) that runs
Ubuntu GNU/Linux 10.04 64-bit. We use AspectJ 1.6.1111,
DiSL pre-release version 0.9, and Oracle’s JDK 1.6.0 27
Hotspot Server VM (64-bit) with 7 GB maximum heap size.
Table 2 reports the runtime overhead for the original
AspectJ version of Senseo (SenseoAJ), for the equivalent
instrumentation in DiSL, that is, without basic block metrics
(SenseoDiSL), and for the DiSL instrumentation including
basic block metrics (Senseo2). On average (geometric mean
for DaCapo), the overhead factor introduced by SenseoAJ
is 6.47, while for SenseoDiSL, with the same code cover-
age, the overhead is only a factor of 3.09. With full byte-
code coverage, the average overhead of SenseoDiSL is a
factor of 5.26; surprisingly, the overhead is still lower than
for SenseoAJ covering only application code. Finally, the
average overhead introduced by Senseo2 is a factor of 7.19.
10 http://www.dacapobench.org/
11 http://eclipse.org/aspectj/
!"#$%
&"$#%
&"'(%
#")*%#"&(%
&"&(%
&"*!% &"!+%
&"+#%
!"$(%
&"##%
&"(&% &"(*%
$"(!%
&%
$%
#%
!%
)%
*%
,,-% .//01.2034% 567853%
9./864%
:67;0<%
.5=8:6374%
>.4?1@>/01A%
:675?14%
B965;6.<%10375?>8203%
C4D617E%.DD"%03/F% G?HI%.DD"%03/F% G?HI%J8//%10965.=6%
Figure 10. Contributions to the average overhead factor for
different versions of Senseo
application only full coverage increase [%]
Method bodies 5.60E+09 8.84E+09 57.75
Methods returning a ref. 1.76E+08 3.44E+08 95.28
Methods with ref. arg. 1.78E+09 2.57E+09 44.56
Object and array alloc. 1.14E+09 2.00E+09 76.11
Basic blocks 2.21E+10 3.34E+10 51.26
Table 3. Total number of intercepted join points for a single
iteration of the whole DaCapo suite
Figure 10 quantifies the different overhead contribu-
tions. For CCT reification, the DiSL implementation ben-
efits from efficient access to static context information,
from data passing in synthetic local variables, and from
the use of an @ThreadLocal variable (compared to a
java.lang.ThreadLocal variable in SenseoAJ). The over-heads for capturing allocations and runtime types of return
values are relatively small for both implementations. The
biggest difference between the two implementations is ob-
served for the processing of method arguments; the DiSL in-
strumentation leverages an argument processor, whereas the
AspectJ implementation relies on JoinPoint.getArgs().As shown in Figure 10, argument processing in the AspectJ
version introduces more than 6 times the overhead of the
equivalent DiSL instrumentation.
Table 3 summarizes the number of intercepted join points
for a single iteration of each considered benchmark, weaving
only application code, respectively weaving with full byte-
40
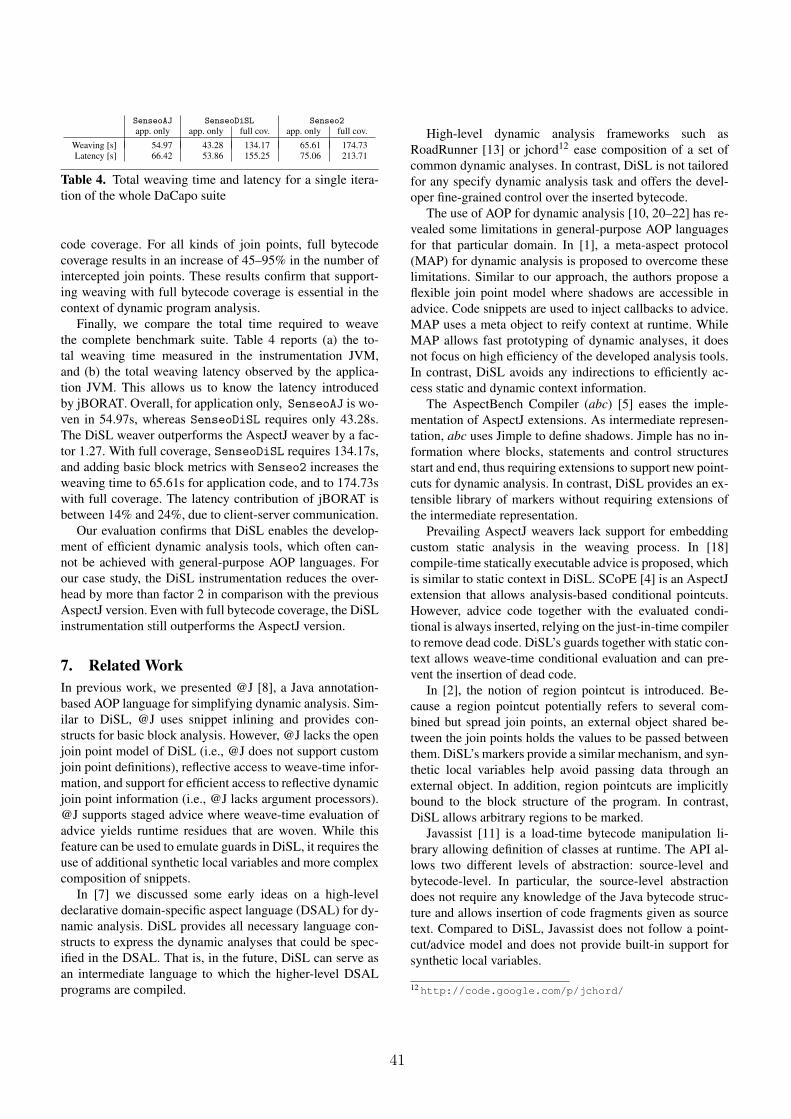
SenseoAJ SenseoDiSL Senseo2app. only app. only full cov. app. only full cov.
Weaving [s] 54.97 43.28 134.17 65.61 174.73Latency [s] 66.42 53.86 155.25 75.06 213.71
Table 4. Total weaving time and latency for a single itera-
tion of the whole DaCapo suite
code coverage. For all kinds of join points, full bytecode
coverage results in an increase of 45–95% in the number of
intercepted join points. These results confirm that support-
ing weaving with full bytecode coverage is essential in the
context of dynamic program analysis.
Finally, we compare the total time required to weave
the complete benchmark suite. Table 4 reports (a) the to-
tal weaving time measured in the instrumentation JVM,
and (b) the total weaving latency observed by the applica-
tion JVM. This allows us to know the latency introduced
by jBORAT. Overall, for application only, SenseoAJ is wo-
ven in 54.97s, whereas SenseoDiSL requires only 43.28s.
The DiSL weaver outperforms the AspectJ weaver by a fac-
tor 1.27. With full coverage, SenseoDiSL requires 134.17s,
and adding basic block metrics with Senseo2 increases the
weaving time to 65.61s for application code, and to 174.73s
with full coverage. The latency contribution of jBORAT is
between 14% and 24%, due to client-server communication.
Our evaluation confirms that DiSL enables the develop-
ment of efficient dynamic analysis tools, which often can-
not be achieved with general-purpose AOP languages. For
our case study, the DiSL instrumentation reduces the over-
head by more than factor 2 in comparison with the previous
AspectJ version. Even with full bytecode coverage, the DiSL
instrumentation still outperforms the AspectJ version.
7. Related Work
In previous work, we presented @J [8], a Java annotation-
based AOP language for simplifying dynamic analysis. Sim-
ilar to DiSL, @J uses snippet inlining and provides con-
structs for basic block analysis. However, @J lacks the open
join point model of DiSL (i.e., @J does not support custom
join point definitions), reflective access to weave-time infor-
mation, and support for efficient access to reflective dynamic
join point information (i.e., @J lacks argument processors).
@J supports staged advice where weave-time evaluation of
advice yields runtime residues that are woven. While this
feature can be used to emulate guards in DiSL, it requires the
use of additional synthetic local variables and more complex
composition of snippets.
In [7] we discussed some early ideas on a high-level
declarative domain-specific aspect language (DSAL) for dy-
namic analysis. DiSL provides all necessary language con-
structs to express the dynamic analyses that could be spec-
ified in the DSAL. That is, in the future, DiSL can serve as
an intermediate language to which the higher-level DSAL
programs are compiled.
High-level dynamic analysis frameworks such as
RoadRunner [13] or jchord12 ease composition of a set of
common dynamic analyses. In contrast, DiSL is not tailored
for any specify dynamic analysis task and offers the devel-
oper fine-grained control over the inserted bytecode.
The use of AOP for dynamic analysis [10, 20–22] has re-
vealed some limitations in general-purpose AOP languages
for that particular domain. In [1], a meta-aspect protocol
(MAP) for dynamic analysis is proposed to overcome these
limitations. Similar to our approach, the authors propose a
flexible join point model where shadows are accessible in
advice. Code snippets are used to inject callbacks to advice.
MAP uses a meta object to reify context at runtime. While
MAP allows fast prototyping of dynamic analyses, it does
not focus on high efficiency of the developed analysis tools.
In contrast, DiSL avoids any indirections to efficiently ac-
cess static and dynamic context information.
The AspectBench Compiler (abc) [5] eases the imple-
mentation of AspectJ extensions. As intermediate represen-
tation, abc uses Jimple to define shadows. Jimple has no in-
formation where blocks, statements and control structures
start and end, thus requiring extensions to support new point-
cuts for dynamic analysis. In contrast, DiSL provides an ex-
tensible library of markers without requiring extensions of
the intermediate representation.
Prevailing AspectJ weavers lack support for embedding
custom static analysis in the weaving process. In [18]
compile-time statically executable advice is proposed, which
is similar to static context in DiSL. SCoPE [4] is an AspectJ
extension that allows analysis-based conditional pointcuts.
However, advice code together with the evaluated condi-
tional is always inserted, relying on the just-in-time compiler
to remove dead code. DiSL’s guards together with static con-
text allows weave-time conditional evaluation and can pre-
vent the insertion of dead code.
In [2], the notion of region pointcut is introduced. Be-
cause a region pointcut potentially refers to several com-
bined but spread join points, an external object shared be-
tween the join points holds the values to be passed between
them. DiSL’s markers provide a similar mechanism, and syn-
thetic local variables help avoid passing data through an
external object. In addition, region pointcuts are implicitly
bound to the block structure of the program. In contrast,
DiSL allows arbitrary regions to be marked.
Javassist [11] is a load-time bytecode manipulation li-
brary allowing definition of classes at runtime. The API al-
lows two different levels of abstraction: source-level and
bytecode-level. In particular, the source-level abstraction
does not require any knowledge of the Java bytecode struc-
ture and allows insertion of code fragments given as source
text. Compared to DiSL, Javassist does not follow a point-
cut/advice model and does not provide built-in support for
synthetic local variables.
12 http://code.google.com/p/jchord/
41
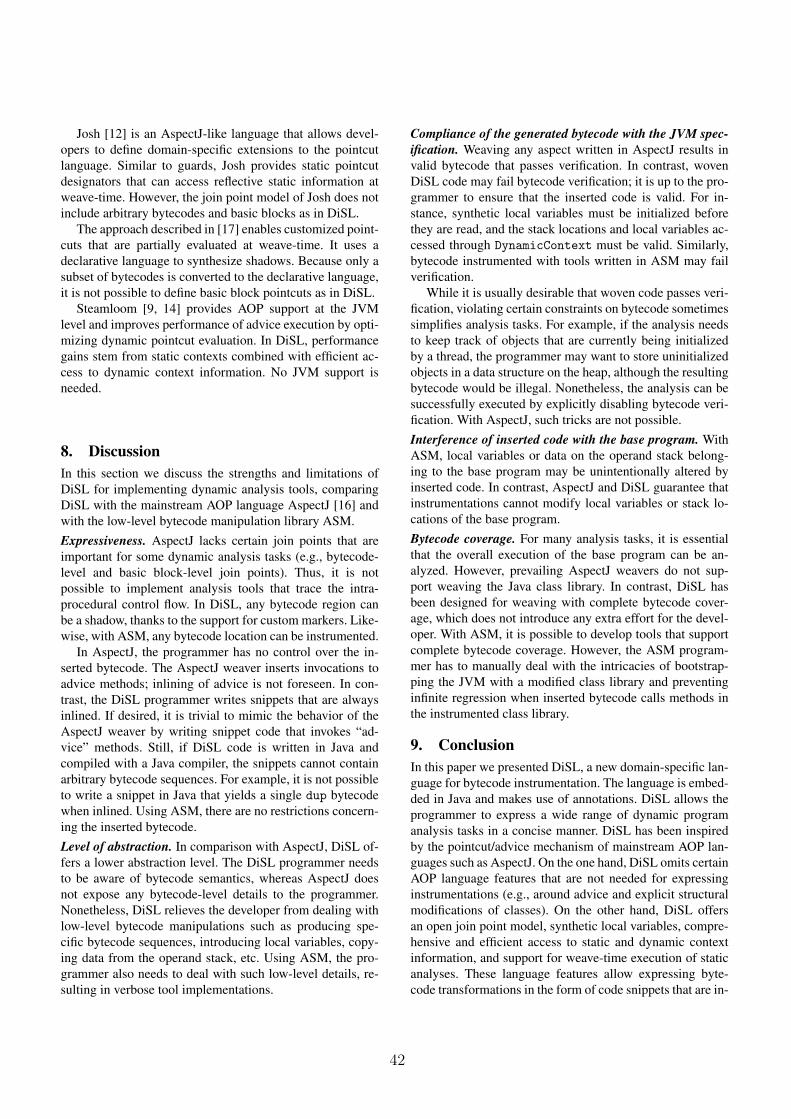
Josh [12] is an AspectJ-like language that allows devel-
opers to define domain-specific extensions to the pointcut
language. Similar to guards, Josh provides static pointcut
designators that can access reflective static information at
weave-time. However, the join point model of Josh does not
include arbitrary bytecodes and basic blocks as in DiSL.
The approach described in [17] enables customized point-
cuts that are partially evaluated at weave-time. It uses a
declarative language to synthesize shadows. Because only a
subset of bytecodes is converted to the declarative language,
it is not possible to define basic block pointcuts as in DiSL.
Steamloom [9, 14] provides AOP support at the JVM
level and improves performance of advice execution by opti-
mizing dynamic pointcut evaluation. In DiSL, performance
gains stem from static contexts combined with efficient ac-
cess to dynamic context information. No JVM support is
needed.
8. Discussion
In this section we discuss the strengths and limitations of
DiSL for implementing dynamic analysis tools, comparing
DiSL with the mainstream AOP language AspectJ [16] and
with the low-level bytecode manipulation library ASM.
Expressiveness. AspectJ lacks certain join points that are
important for some dynamic analysis tasks (e.g., bytecode-
level and basic block-level join points). Thus, it is not
possible to implement analysis tools that trace the intra-
procedural control flow. In DiSL, any bytecode region can
be a shadow, thanks to the support for custom markers. Like-
wise, with ASM, any bytecode location can be instrumented.
In AspectJ, the programmer has no control over the in-
serted bytecode. The AspectJ weaver inserts invocations to
advice methods; inlining of advice is not foreseen. In con-
trast, the DiSL programmer writes snippets that are always
inlined. If desired, it is trivial to mimic the behavior of the
AspectJ weaver by writing snippet code that invokes “ad-
vice” methods. Still, if DiSL code is written in Java and
compiled with a Java compiler, the snippets cannot contain
arbitrary bytecode sequences. For example, it is not possible
to write a snippet in Java that yields a single dup bytecode
when inlined. Using ASM, there are no restrictions concern-
ing the inserted bytecode.
Level of abstraction. In comparison with AspectJ, DiSL of-
fers a lower abstraction level. The DiSL programmer needs
to be aware of bytecode semantics, whereas AspectJ does
not expose any bytecode-level details to the programmer.
Nonetheless, DiSL relieves the developer from dealing with
low-level bytecode manipulations such as producing spe-
cific bytecode sequences, introducing local variables, copy-
ing data from the operand stack, etc. Using ASM, the pro-
grammer also needs to deal with such low-level details, re-
sulting in verbose tool implementations.
Compliance of the generated bytecode with the JVM spec-
ification. Weaving any aspect written in AspectJ results in
valid bytecode that passes verification. In contrast, woven
DiSL code may fail bytecode verification; it is up to the pro-
grammer to ensure that the inserted code is valid. For in-
stance, synthetic local variables must be initialized before
they are read, and the stack locations and local variables ac-
cessed through DynamicContext must be valid. Similarly,
bytecode instrumented with tools written in ASM may fail
verification.
While it is usually desirable that woven code passes veri-
fication, violating certain constraints on bytecode sometimes
simplifies analysis tasks. For example, if the analysis needs
to keep track of objects that are currently being initialized
by a thread, the programmer may want to store uninitialized
objects in a data structure on the heap, although the resulting
bytecode would be illegal. Nonetheless, the analysis can be
successfully executed by explicitly disabling bytecode veri-
fication. With AspectJ, such tricks are not possible.
Interference of inserted code with the base program. With
ASM, local variables or data on the operand stack belong-
ing to the base program may be unintentionally altered by
inserted code. In contrast, AspectJ and DiSL guarantee that
instrumentations cannot modify local variables or stack lo-
cations of the base program.
Bytecode coverage. For many analysis tasks, it is essential
that the overall execution of the base program can be an-
alyzed. However, prevailing AspectJ weavers do not sup-
port weaving the Java class library. In contrast, DiSL has
been designed for weaving with complete bytecode cover-
age, which does not introduce any extra effort for the devel-
oper. With ASM, it is possible to develop tools that support
complete bytecode coverage. However, the ASM program-
mer has to manually deal with the intricacies of bootstrap-
ping the JVM with a modified class library and preventing
infinite regression when inserted bytecode calls methods in
the instrumented class library.
9. Conclusion
In this paper we presented DiSL, a new domain-specific lan-
guage for bytecode instrumentation. The language is embed-
ded in Java and makes use of annotations. DiSL allows the
programmer to express a wide range of dynamic program
analysis tasks in a concise manner. DiSL has been inspired
by the pointcut/advice mechanism of mainstream AOP lan-
guages such as AspectJ. On the one hand, DiSL omits certain
AOP language features that are not needed for expressing
instrumentations (e.g., around advice and explicit structural
modifications of classes). On the other hand, DiSL offers
an open join point model, synthetic local variables, compre-
hensive and efficient access to static and dynamic context
information, and support for weave-time execution of static
analyses. These language features allow expressing byte-
code transformations in the form of code snippets that are in-
42
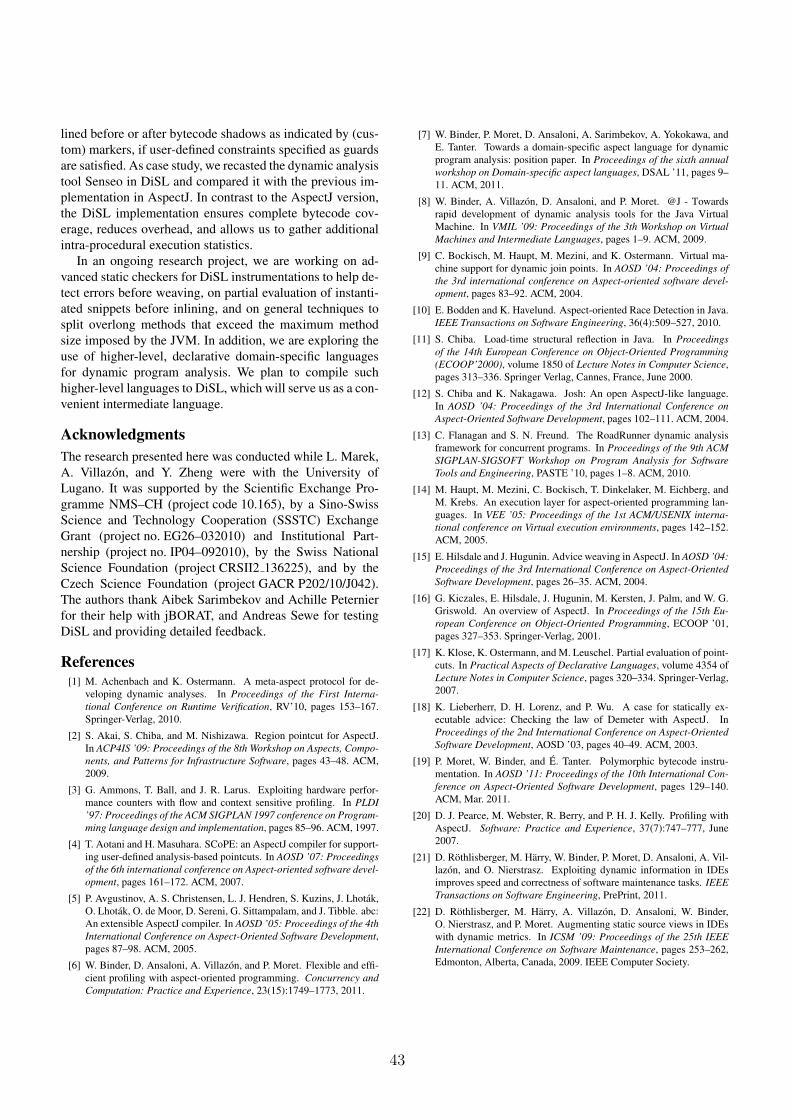
lined before or after bytecode shadows as indicated by (cus-
tom) markers, if user-defined constraints specified as guards
are satisfied. As case study, we recasted the dynamic analysis
tool Senseo in DiSL and compared it with the previous im-
plementation in AspectJ. In contrast to the AspectJ version,
the DiSL implementation ensures complete bytecode cov-
erage, reduces overhead, and allows us to gather additional
intra-procedural execution statistics.
In an ongoing research project, we are working on ad-
vanced static checkers for DiSL instrumentations to help de-
tect errors before weaving, on partial evaluation of instanti-
ated snippets before inlining, and on general techniques to
split overlong methods that exceed the maximum method
size imposed by the JVM. In addition, we are exploring the
use of higher-level, declarative domain-specific languages
for dynamic program analysis. We plan to compile such
higher-level languages to DiSL, which will serve us as a con-
venient intermediate language.
Acknowledgments
The research presented here was conducted while L. Marek,
A. Villazon, and Y. Zheng were with the University of
Lugano. It was supported by the Scientific Exchange Pro-
gramme NMS–CH (project code 10.165), by a Sino-Swiss
Science and Technology Cooperation (SSSTC) Exchange
Grant (project no. EG26–032010) and Institutional Part-
nership (project no. IP04–092010), by the Swiss National
Science Foundation (project CRSII2 136225), and by the
Czech Science Foundation (project GACR P202/10/J042).
The authors thank Aibek Sarimbekov and Achille Peternier
for their help with jBORAT, and Andreas Sewe for testing
DiSL and providing detailed feedback.
References
[1] M. Achenbach and K. Ostermann. A meta-aspect protocol for de-
veloping dynamic analyses. In Proceedings of the First Interna-
tional Conference on Runtime Verification, RV’10, pages 153–167.
Springer-Verlag, 2010.
[2] S. Akai, S. Chiba, and M. Nishizawa. Region pointcut for AspectJ.
In ACP4IS ’09: Proceedings of the 8th Workshop on Aspects, Compo-
nents, and Patterns for Infrastructure Software, pages 43–48. ACM,
2009.
[3] G. Ammons, T. Ball, and J. R. Larus. Exploiting hardware perfor-
mance counters with flow and context sensitive profiling. In PLDI
’97: Proceedings of the ACM SIGPLAN 1997 conference on Program-
ming language design and implementation, pages 85–96. ACM, 1997.
[4] T. Aotani and H. Masuhara. SCoPE: an AspectJ compiler for support-
ing user-defined analysis-based pointcuts. In AOSD ’07: Proceedings
of the 6th international conference on Aspect-oriented software devel-
opment, pages 161–172. ACM, 2007.
[5] P. Avgustinov, A. S. Christensen, L. J. Hendren, S. Kuzins, J. Lhotak,
O. Lhotak, O. de Moor, D. Sereni, G. Sittampalam, and J. Tibble. abc:
An extensible AspectJ compiler. In AOSD ’05: Proceedings of the 4th
International Conference on Aspect-Oriented Software Development,
pages 87–98. ACM, 2005.
[6] W. Binder, D. Ansaloni, A. Villazon, and P. Moret. Flexible and effi-
cient profiling with aspect-oriented programming. Concurrency and
Computation: Practice and Experience, 23(15):1749–1773, 2011.
[7] W. Binder, P. Moret, D. Ansaloni, A. Sarimbekov, A. Yokokawa, and
E. Tanter. Towards a domain-specific aspect language for dynamic
program analysis: position paper. In Proceedings of the sixth annual
workshop on Domain-specific aspect languages, DSAL ’11, pages 9–
11. ACM, 2011.
[8] W. Binder, A. Villazon, D. Ansaloni, and P. Moret. @J - Towards
rapid development of dynamic analysis tools for the Java Virtual
Machine. In VMIL ’09: Proceedings of the 3th Workshop on Virtual
Machines and Intermediate Languages, pages 1–9. ACM, 2009.
[9] C. Bockisch, M. Haupt, M. Mezini, and K. Ostermann. Virtual ma-
chine support for dynamic join points. In AOSD ’04: Proceedings of
the 3rd international conference on Aspect-oriented software devel-
opment, pages 83–92. ACM, 2004.
[10] E. Bodden and K. Havelund. Aspect-oriented Race Detection in Java.
IEEE Transactions on Software Engineering, 36(4):509–527, 2010.
[11] S. Chiba. Load-time structural reflection in Java. In Proceedings
of the 14th European Conference on Object-Oriented Programming
(ECOOP’2000), volume 1850 of Lecture Notes in Computer Science,
pages 313–336. Springer Verlag, Cannes, France, June 2000.
[12] S. Chiba and K. Nakagawa. Josh: An open AspectJ-like language.
In AOSD ’04: Proceedings of the 3rd International Conference on
Aspect-Oriented Software Development, pages 102–111. ACM, 2004.
[13] C. Flanagan and S. N. Freund. The RoadRunner dynamic analysis
framework for concurrent programs. In Proceedings of the 9th ACM
SIGPLAN-SIGSOFT Workshop on Program Analysis for Software
Tools and Engineering, PASTE ’10, pages 1–8. ACM, 2010.
[14] M. Haupt, M. Mezini, C. Bockisch, T. Dinkelaker, M. Eichberg, and
M. Krebs. An execution layer for aspect-oriented programming lan-
guages. In VEE ’05: Proceedings of the 1st ACM/USENIX interna-
tional conference on Virtual execution environments, pages 142–152.
ACM, 2005.
[15] E. Hilsdale and J. Hugunin. Advice weaving in AspectJ. In AOSD ’04:
Proceedings of the 3rd International Conference on Aspect-Oriented
Software Development, pages 26–35. ACM, 2004.
[16] G. Kiczales, E. Hilsdale, J. Hugunin, M. Kersten, J. Palm, and W. G.
Griswold. An overview of AspectJ. In Proceedings of the 15th Eu-
ropean Conference on Object-Oriented Programming, ECOOP ’01,
pages 327–353. Springer-Verlag, 2001.
[17] K. Klose, K. Ostermann, and M. Leuschel. Partial evaluation of point-
cuts. In Practical Aspects of Declarative Languages, volume 4354 of
Lecture Notes in Computer Science, pages 320–334. Springer-Verlag,
2007.
[18] K. Lieberherr, D. H. Lorenz, and P. Wu. A case for statically ex-
ecutable advice: Checking the law of Demeter with AspectJ. In
Proceedings of the 2nd International Conference on Aspect-Oriented
Software Development, AOSD ’03, pages 40–49. ACM, 2003.
[19] P. Moret, W. Binder, and E. Tanter. Polymorphic bytecode instru-
mentation. In AOSD ’11: Proceedings of the 10th International Con-
ference on Aspect-Oriented Software Development, pages 129–140.
ACM, Mar. 2011.
[20] D. J. Pearce, M. Webster, R. Berry, and P. H. J. Kelly. Profiling with
AspectJ. Software: Practice and Experience, 37(7):747–777, June
2007.
[21] D. Rothlisberger, M. Harry, W. Binder, P. Moret, D. Ansaloni, A. Vil-
lazon, and O. Nierstrasz. Exploiting dynamic information in IDEs
improves speed and correctness of software maintenance tasks. IEEE
Transactions on Software Engineering, PrePrint, 2011.
[22] D. Rothlisberger, M. Harry, A. Villazon, D. Ansaloni, W. Binder,
O. Nierstrasz, and P. Moret. Augmenting static source views in IDEs
with dynamic metrics. In ICSM ’09: Proceedings of the 25th IEEE
International Conference on Software Maintenance, pages 253–262,
Edmonton, Alberta, Canada, 2009. IEEE Computer Society.
43

44
Chapter 4
ShadowVM: Robust andComprehensive DynamicProgram Analysis for the JavaPlatform
Lukas Marek,Stephen Kell,Yudi Zheng,Lubomır Bulej,Walter Binder,Petr Tuma,Danilo Ansaloni,Aibek Sarimbekov,Andreas Sewe
Contributed paper at the 12th International Conference onGenerative Programming: Concepts & Experiences (GPCE2013).
In conference proceedings,published by ACM,pages 105-114,ISBN 978-1-4503-2373-4,October 2013.
The original version is available electronically from the publisher’ssite at http://dx.doi.org/10.1145/2517208.2517219.
45
ShadowVM: Robust and ComprehensiveDynamic Program Analysis for the Java Platform
Lukas MarekFaculty of Mathematics and PhysicsCharles University, Czech Republic
Stephen Kell Yudi ZhengFaculty of Informatics
University of Lugano, [email protected]
Lubomır Bulej Walter BinderFaculty of Informatics
University of Lugano, [email protected]
Petr TumaFaculty of Mathematics and PhysicsCharles University, Czech Republic
Danilo Ansaloni Aibek SarimbekovFaculty of Informatics
University of Lugano, [email protected]
Andreas SeweSoftware Technology Group
TU Darmstadt, [email protected]
AbstractDynamic analysis tools are often implemented using instrumenta-tion, particularly on managed runtimes including the Java VirtualMachine (JVM). Performing instrumentation robustly is especiallycomplex on such runtimes: existing frameworks offer limited cov-erage and poor isolation, while previous work has shown that ap-parently innocuous instrumentation can cause deadlocks or crashesin the observed application. This paper describes ShadowVM, asystem for instrumentation-based dynamic analyses on the JVMwhich combines a number of techniques to greatly improve bothisolation and coverage. These centre on the offload of analysis toa separate process; we believe our design is the first system to en-able genuinely full bytecode coverage on the JVM. We describe aworking implementation, and use a case study to demonstrate itsimproved coverage and to evaluate its runtime overhead.
Categories and Subject Descriptors D.3.3 [Programming Lan-guages]: Language Constructs and Features—Frameworks
Keywords Dynamic analysis; JVM; instrumentation
1. IntroductionTo gain insight about how to optimise, debug, extend and refactorlarge systems, programmers depend on analysis tools. One popularclass of tools is dynamic program analysis tools, which observe aprogram in execution and report additional data about that execu-tion. Many popular bug-finding and profiling tools are of this form,including the Valgrind suite [19], DTrace [2], and GProf [12]. Mean-while, research continues to devise more complex and specialisedtools, for race detection [10], white-box testing [25], security policyenforcement [28] and more.
Permission to make digital or hard copies of all or part of this work for personal orclassroom use is granted without fee provided that copies are not made or distributedfor profit or commercial advantage and that copies bear this notice and the full citationon the first page. Copyrights for components of this work owned by others than ACMmust be honored. Abstracting with credit is permitted. To copy otherwise, or republish,to post on servers or to redistribute to lists, requires prior specific permission and/or afee. Request permissions from [email protected]’13, October 27 - 28 2013, Indianapolis, IN, USA.Copyright © 2013 ACM 978-1-4503-2373-4/13/10. . . $15.00.http://dx.doi.org/10.1145/10.1145/2517208.2517219
Developing dynamic analyses is difficult. One approach is toinvasively modify the host runtime system, but this is an experttask yielding a non-portable solution. Alternatively, instrumentationframeworks including Pin [6] and DynamoRIO [5] (exportinga roughly compiler-style intermediate representation), and alsoJavassist [7], Soot [21] and DiSL [16] (targeting Java bytecode), arehighly general. However, using them can be challenging, since theyrequire deep understanding of both the intermediate representationand the host runtime environment. More constrained frameworks [2,11] provide stronger properties with less user effort, but each catersto a smaller set of use cases. Outwith these use cases, developing ahigh-quality dynamic analysis remains a Herculean task, plagued bythe recurrence of three mutually antagonistic requirements: isolation,meaning roughly that observing the program does not cause it todeviate from the path it would ordinarily take; coverage, meaningthe ability to observe all relevant events during execution, includingboth user code and system code; and performance, meaning theminimisation of slowdown caused by the analysis.
In this paper we present ShadowVM1, a system for dynamic anal-ysis of programs running within the Java Virtual Machine (JVM)which advances on prior work by simultaneously combining strongisolation and high coverage. Analyses execute asynchronously withrespect to the observed program, allowing parallelism to mitigateisolation-induced slowdowns. To our knowledge, ours is the firstcomplete dynamic analysis framework offering asynchronous execu-tion without effectively serializing heavily instrumented workloads.It does so by exploiting heterogeneity among dynamic analyses,which typically only need to preserve the order of observed eventsfor particular subsets of events. In summary, this paper presents thefollowing contributions:
• We describe an architecture and programming model for dy-namic analyses of Java bytecode which enforces isolation byperforming all analysis computation in a separate process. Thisenables asynchronous remote evaluation while permitting a fa-miliar programming model similar to that of existing instrumen-tation frameworks.
• We summarise the state of the art regarding coverage on the JVM,identifying challenges which so far limit the coverage availableunder existing systems, and explaining how our implementation
1 Sources available at http://disl.ow2.org
46
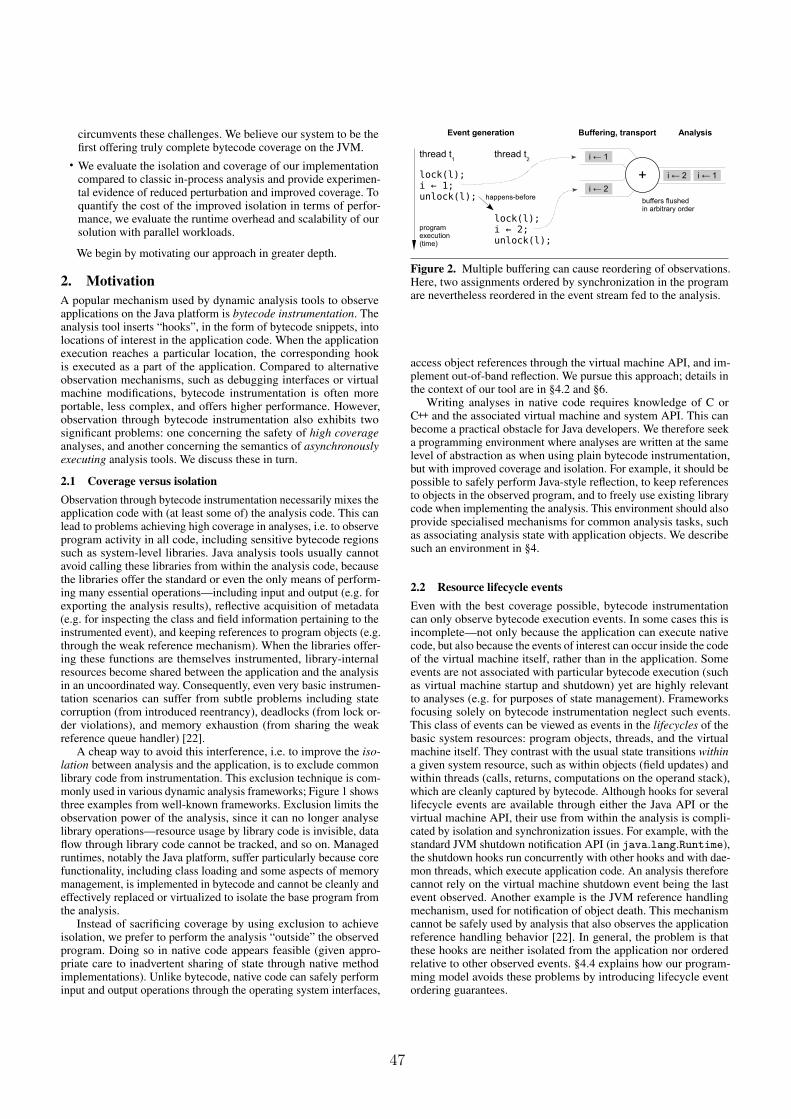
circumvents these challenges. We believe our system to be thefirst offering truly complete bytecode coverage on the JVM.
• We evaluate the isolation and coverage of our implementationcompared to classic in-process analysis and provide experimen-tal evidence of reduced perturbation and improved coverage. Toquantify the cost of the improved isolation in terms of perfor-mance, we evaluate the runtime overhead and scalability of oursolution with parallel workloads.
We begin by motivating our approach in greater depth.
2. MotivationA popular mechanism used by dynamic analysis tools to observeapplications on the Java platform is bytecode instrumentation. Theanalysis tool inserts “hooks”, in the form of bytecode snippets, intolocations of interest in the application code. When the applicationexecution reaches a particular location, the corresponding hookis executed as a part of the application. Compared to alternativeobservation mechanisms, such as debugging interfaces or virtualmachine modifications, bytecode instrumentation is often moreportable, less complex, and offers higher performance. However,observation through bytecode instrumentation also exhibits twosignificant problems: one concerning the safety of high coverageanalyses, and another concerning the semantics of asynchronouslyexecuting analysis tools. We discuss these in turn.
2.1 Coverage versus isolationObservation through bytecode instrumentation necessarily mixes theapplication code with (at least some of) the analysis code. This canlead to problems achieving high coverage in analyses, i.e. to observeprogram activity in all code, including sensitive bytecode regionssuch as system-level libraries. Java analysis tools usually cannotavoid calling these libraries from within the analysis code, becausethe libraries offer the standard or even the only means of perform-ing many essential operations—including input and output (e.g. forexporting the analysis results), reflective acquisition of metadata(e.g. for inspecting the class and field information pertaining to theinstrumented event), and keeping references to program objects (e.g.through the weak reference mechanism). When the libraries offer-ing these functions are themselves instrumented, library-internalresources become shared between the application and the analysisin an uncoordinated way. Consequently, even very basic instrumen-tation scenarios can suffer from subtle problems including statecorruption (from introduced reentrancy), deadlocks (from lock or-der violations), and memory exhaustion (from sharing the weakreference queue handler) [22].
A cheap way to avoid this interference, i.e. to improve the iso-lation between analysis and the application, is to exclude commonlibrary code from instrumentation. This exclusion technique is com-monly used in various dynamic analysis frameworks; Figure 1 showsthree examples from well-known frameworks. Exclusion limits theobservation power of the analysis, since it can no longer analyselibrary operations—resource usage by library code is invisible, dataflow through library code cannot be tracked, and so on. Managedruntimes, notably the Java platform, suffer particularly because corefunctionality, including class loading and some aspects of memorymanagement, is implemented in bytecode and cannot be cleanly andeffectively replaced or virtualized to isolate the base program fromthe analysis.
Instead of sacrificing coverage by using exclusion to achieveisolation, we prefer to perform the analysis “outside” the observedprogram. Doing so in native code appears feasible (given appro-priate care to inadvertent sharing of state through native methodimplementations). Unlike bytecode, native code can safely performinput and output operations through the operating system interfaces,
thread t1
thread t2
lock(l);i ← 1;unlock(l);
lock(l);i ← 2;unlock(l);
Event generation Buffering, transport
happens-before
i ← 1
i ← 2
Analysis
programexecution(time)
buffers flushedin arbitrary order
+ i ← 2 i ← 1
Figure 2. Multiple buffering can cause reordering of observations.Here, two assignments ordered by synchronization in the programare nevertheless reordered in the event stream fed to the analysis.
access object references through the virtual machine API, and im-plement out-of-band reflection. We pursue this approach; details inthe context of our tool are in §4.2 and §6.
Writing analyses in native code requires knowledge of C orC++ and the associated virtual machine and system API. This canbecome a practical obstacle for Java developers. We therefore seeka programming environment where analyses are written at the samelevel of abstraction as when using plain bytecode instrumentation,but with improved coverage and isolation. For example, it should bepossible to safely perform Java-style reflection, to keep referencesto objects in the observed program, and to freely use existing librarycode when implementing the analysis. This environment should alsoprovide specialised mechanisms for common analysis tasks, suchas associating analysis state with application objects. We describesuch an environment in §4.
2.2 Resource lifecycle eventsEven with the best coverage possible, bytecode instrumentationcan only observe bytecode execution events. In some cases this isincomplete—not only because the application can execute nativecode, but also because the events of interest can occur inside the codeof the virtual machine itself, rather than in the application. Someevents are not associated with particular bytecode execution (suchas virtual machine startup and shutdown) yet are highly relevantto analyses (e.g. for purposes of state management). Frameworksfocusing solely on bytecode instrumentation neglect such events.This class of events can be viewed as events in the lifecycles of thebasic system resources: program objects, threads, and the virtualmachine itself. They contrast with the usual state transitions withina given system resource, such as within objects (field updates) andwithin threads (calls, returns, computations on the operand stack),which are cleanly captured by bytecode. Although hooks for severallifecycle events are available through either the Java API or thevirtual machine API, their use from within the analysis is compli-cated by isolation and synchronization issues. For example, with thestandard JVM shutdown notification API (in java.lang.Runtime),the shutdown hooks run concurrently with other hooks and with dae-mon threads, which execute application code. An analysis thereforecannot rely on the virtual machine shutdown event being the lastevent observed. Another example is the JVM reference handlingmechanism, used for notification of object death. This mechanismcannot be safely used by analysis that also observes the applicationreference handling behavior [22]. In general, the problem is thatthese hooks are neither isolated from the application nor orderedrelative to other observed events. §4.4 explains how our program-ming model avoids these problems by introducing lifecycle eventordering guarantees.
47
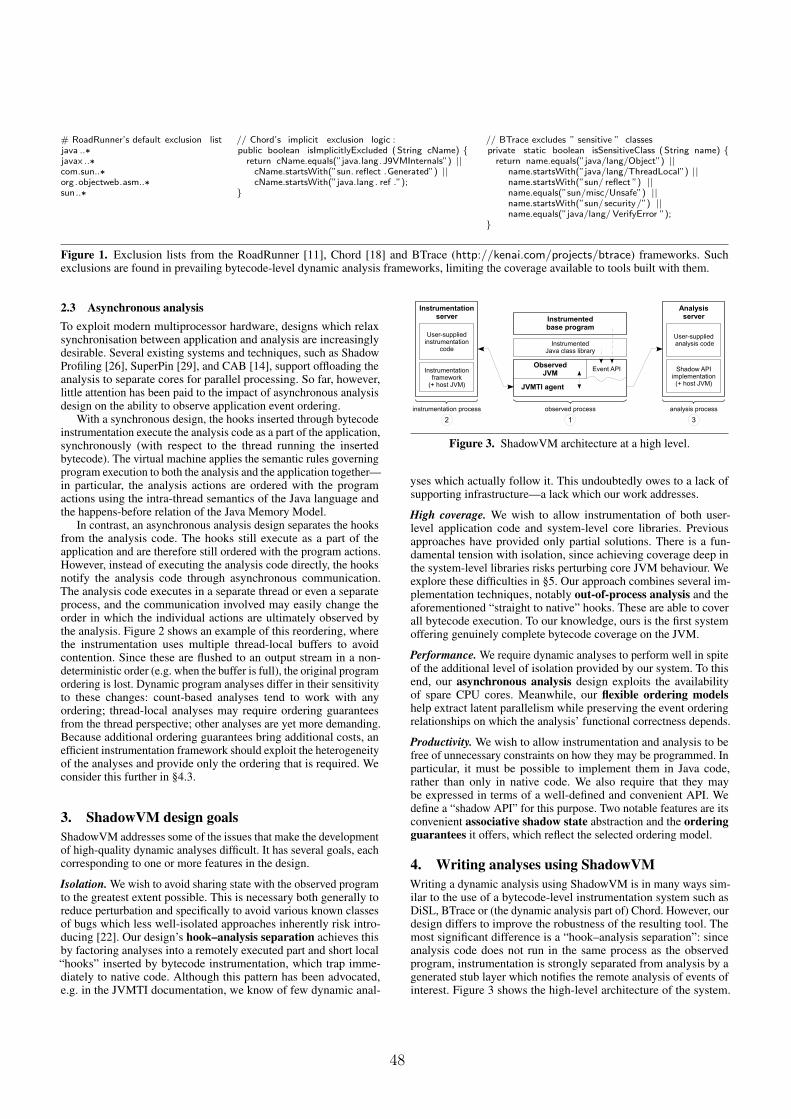
# RoadRunner’s default exclusion listjava ..∗javax ..∗com.sun..∗org.objectweb.asm..∗sun..∗
// Chord’s implicit exclusion logic :public boolean isImplicitlyExcluded ( String cName) {
return cName.equals(”java.lang.J9VMInternals”) ||cName.startsWith(”sun. reflect .Generated”) ||cName.startsWith(”java.lang . ref .”);
}
// BTrace excludes ” sensitive ” classesprivate static boolean isSensitiveClass ( String name) {
return name.equals(”java/lang/Object”) ||name.startsWith(”java/lang/ThreadLocal”) ||name.startsWith(”sun/ reflect ”) ||name.equals(”sun/misc/Unsafe”) ||name.startsWith(”sun/security/”) ||name.equals(”java/lang/ VerifyError ”);
}
Figure 1. Exclusion lists from the RoadRunner [11], Chord [18] and BTrace (http://kenai.com/projects/btrace) frameworks. Suchexclusions are found in prevailing bytecode-level dynamic analysis frameworks, limiting the coverage available to tools built with them.
2.3 Asynchronous analysisTo exploit modern multiprocessor hardware, designs which relaxsynchronisation between application and analysis are increasinglydesirable. Several existing systems and techniques, such as ShadowProfiling [26], SuperPin [29], and CAB [14], support offloading theanalysis to separate cores for parallel processing. So far, however,little attention has been paid to the impact of asynchronous analysisdesign on the ability to observe application event ordering.
With a synchronous design, the hooks inserted through bytecodeinstrumentation execute the analysis code as a part of the application,synchronously (with respect to the thread running the insertedbytecode). The virtual machine applies the semantic rules governingprogram execution to both the analysis and the application together—in particular, the analysis actions are ordered with the programactions using the intra-thread semantics of the Java language andthe happens-before relation of the Java Memory Model.
In contrast, an asynchronous analysis design separates the hooksfrom the analysis code. The hooks still execute as a part of theapplication and are therefore still ordered with the program actions.However, instead of executing the analysis code directly, the hooksnotify the analysis code through asynchronous communication.The analysis code executes in a separate thread or even a separateprocess, and the communication involved may easily change theorder in which the individual actions are ultimately observed bythe analysis. Figure 2 shows an example of this reordering, wherethe instrumentation uses multiple thread-local buffers to avoidcontention. Since these are flushed to an output stream in a non-deterministic order (e.g. when the buffer is full), the original programordering is lost. Dynamic program analyses differ in their sensitivityto these changes: count-based analyses tend to work with anyordering; thread-local analyses may require ordering guaranteesfrom the thread perspective; other analyses are yet more demanding.Because additional ordering guarantees bring additional costs, anefficient instrumentation framework should exploit the heterogeneityof the analyses and provide only the ordering that is required. Weconsider this further in §4.3.
3. ShadowVM design goalsShadowVM addresses some of the issues that make the developmentof high-quality dynamic analyses difficult. It has several goals, eachcorresponding to one or more features in the design.
Isolation. We wish to avoid sharing state with the observed programto the greatest extent possible. This is necessary both generally toreduce perturbation and specifically to avoid various known classesof bugs which less well-isolated approaches inherently risk intro-ducing [22]. Our design’s hook–analysis separation achieves thisby factoring analyses into a remotely executed part and short local“hooks” inserted by bytecode instrumentation, which trap imme-diately to native code. Although this pattern has been advocated,e.g. in the JVMTI documentation, we know of few dynamic anal-
ObservedJVM
JVMTI agent
Instrumentedbase program
InstrumentedJava class library
Event API
instrumentation process
Instrumentationserver
User-suppliedinstrumentation
code
Instrumentationframework
(+ host JVM)
2
analysis process
Analysisserver
User-supplied analysis code
Shadow APIimplementation
(+ host JVM)
3
observed process
1
Figure 3. ShadowVM architecture at a high level.
yses which actually follow it. This undoubtedly owes to a lack ofsupporting infrastructure—a lack which our work addresses.
High coverage. We wish to allow instrumentation of both user-level application code and system-level core libraries. Previousapproaches have provided only partial solutions. There is a fun-damental tension with isolation, since achieving coverage deep inthe system-level libraries risks perturbing core JVM behaviour. Weexplore these difficulties in §5. Our approach combines several im-plementation techniques, notably out-of-process analysis and theaforementioned “straight to native” hooks. These are able to coverall bytecode execution. To our knowledge, ours is the first systemoffering genuinely complete bytecode coverage on the JVM.
Performance. We require dynamic analyses to perform well in spiteof the additional level of isolation provided by our system. To thisend, our asynchronous analysis design exploits the availabilityof spare CPU cores. Meanwhile, our flexible ordering modelshelp extract latent parallelism while preserving the event orderingrelationships on which the analysis’ functional correctness depends.
Productivity. We wish to allow instrumentation and analysis to befree of unnecessary constraints on how they may be programmed. Inparticular, it must be possible to implement them in Java code,rather than only in native code. We also require that they maybe expressed in terms of a well-defined and convenient API. Wedefine a “shadow API” for this purpose. Two notable features are itsconvenient associative shadow state abstraction and the orderingguarantees it offers, which reflect the selected ordering model.
4. Writing analyses using ShadowVMWriting a dynamic analysis using ShadowVM is in many ways sim-ilar to the use of a bytecode-level instrumentation system such asDiSL, BTrace or (the dynamic analysis part of) Chord. However, ourdesign differs to improve the robustness of the resulting tool. Themost significant difference is a “hook–analysis separation”: sinceanalysis code does not run in the same process as the observedprogram, instrumentation is strongly separated from analysis by agenerated stub layer which notifies the remote analysis of events ofinterest. Figure 3 shows the high-level architecture of the system.
48
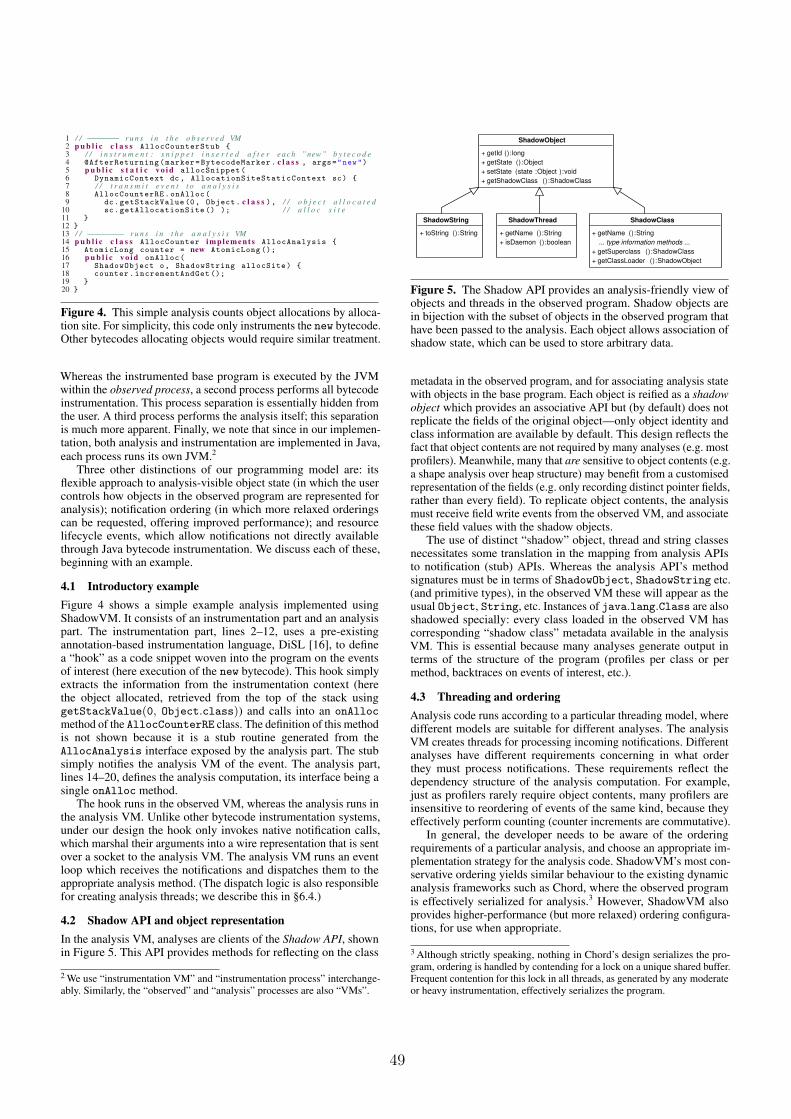
1 / / −−−−−− r u n s i n t h e o b s e r v e d VM2 p u b l i c c l a s s AllocCounterStub {3 / / i n s t r u m e n t : s n i p p e t i n s e r t e d a f t e r e a c h ”new” b y t e c o d e4 @AfterReturning(marker=BytecodeMarker. c l a s s , args="new")5 p u b l i c s t a t i c v o i d allocSnippet(6 DynamicContext dc, AllocationSiteStaticContext sc) {7 / / t r a n s m i t e v e n t t o a n a l y s i s8 AllocCounterRE.onAlloc(9 dc.getStackValue (0, Object. c l a s s ), / / o b j e c t a l l o c a t e d
10 sc.getAllocationSite () ); / / a l l o c s i t e11 }12 }13 / / −−−−−−− r u n s i n t h e a n a l y s i s VM14 p u b l i c c l a s s AllocCounter i m p l e m e n t s AllocAnalysis {15 AtomicLong counter = new AtomicLong ();16 p u b l i c v o i d onAlloc(17 ShadowObject o, ShadowString allocSite) {18 counter.incrementAndGet ();19 }20 }
Figure 4. This simple analysis counts object allocations by alloca-tion site. For simplicity, this code only instruments the new bytecode.Other bytecodes allocating objects would require similar treatment.
Whereas the instrumented base program is executed by the JVMwithin the observed process, a second process performs all bytecodeinstrumentation. This process separation is essentially hidden fromthe user. A third process performs the analysis itself; this separationis much more apparent. Finally, we note that since in our implemen-tation, both analysis and instrumentation are implemented in Java,each process runs its own JVM.2
Three other distinctions of our programming model are: itsflexible approach to analysis-visible object state (in which the usercontrols how objects in the observed program are represented foranalysis); notification ordering (in which more relaxed orderingscan be requested, offering improved performance); and resourcelifecycle events, which allow notifications not directly availablethrough Java bytecode instrumentation. We discuss each of these,beginning with an example.
4.1 Introductory exampleFigure 4 shows a simple example analysis implemented usingShadowVM. It consists of an instrumentation part and an analysispart. The instrumentation part, lines 2–12, uses a pre-existingannotation-based instrumentation language, DiSL [16], to definea “hook” as a code snippet woven into the program on the eventsof interest (here execution of the new bytecode). This hook simplyextracts the information from the instrumentation context (herethe object allocated, retrieved from the top of the stack usinggetStackValue(0, Object.class)) and calls into an onAllocmethod of the AllocCounterRE class. The definition of this methodis not shown because it is a stub routine generated from theAllocAnalysis interface exposed by the analysis part. The stubsimply notifies the analysis VM of the event. The analysis part,lines 14–20, defines the analysis computation, its interface being asingle onAlloc method.
The hook runs in the observed VM, whereas the analysis runs inthe analysis VM. Unlike other bytecode instrumentation systems,under our design the hook only invokes native notification calls,which marshal their arguments into a wire representation that is sentover a socket to the analysis VM. The analysis VM runs an eventloop which receives the notifications and dispatches them to theappropriate analysis method. (The dispatch logic is also responsiblefor creating analysis threads; we describe this in §6.4.)
4.2 Shadow API and object representationIn the analysis VM, analyses are clients of the Shadow API, shownin Figure 5. This API provides methods for reflecting on the class
2 We use “instrumentation VM” and “instrumentation process” interchange-ably. Similarly, the “observed” and “analysis” processes are also “VMs”.
ShadowThread
+ getName ():String
+ isDaemon ():boolean
ShadowClass
+ getName ():String
... type information methods ...
+ getSuperclass ():ShadowClass
+ getClassLoader ():ShadowObject
ShadowString
+ toString ():String
ShadowObject
+ getId ():long
+ getState ():Object
+ setState (state :Object ):void
+ getShadowClass ():ShadowClass
Figure 5. The Shadow API provides an analysis-friendly view ofobjects and threads in the observed program. Shadow objects arein bijection with the subset of objects in the observed program thathave been passed to the analysis. Each object allows association ofshadow state, which can be used to store arbitrary data.
metadata in the observed program, and for associating analysis statewith objects in the base program. Each object is reified as a shadowobject which provides an associative API but (by default) does notreplicate the fields of the original object—only object identity andclass information are available by default. This design reflects thefact that object contents are not required by many analyses (e.g. mostprofilers). Meanwhile, many that are sensitive to object contents (e.g.a shape analysis over heap structure) may benefit from a customisedrepresentation of the fields (e.g. only recording distinct pointer fields,rather than every field). To replicate object contents, the analysismust receive field write events from the observed VM, and associatethese field values with the shadow objects.
The use of distinct “shadow” object, thread and string classesnecessitates some translation in the mapping from analysis APIsto notification (stub) APIs. Whereas the analysis API’s methodsignatures must be in terms of ShadowObject, ShadowString etc.(and primitive types), in the observed VM these will appear as theusual Object, String, etc. Instances of java.lang.Class are alsoshadowed specially: every class loaded in the observed VM hascorresponding “shadow class” metadata available in the analysisVM. This is essential because many analyses generate output interms of the structure of the program (profiles per class or permethod, backtraces on events of interest, etc.).
4.3 Threading and orderingAnalysis code runs according to a particular threading model, wheredifferent models are suitable for different analyses. The analysisVM creates threads for processing incoming notifications. Differentanalyses have different requirements concerning in what orderthey must process notifications. These requirements reflect thedependency structure of the analysis computation. For example,just as profilers rarely require object contents, many profilers areinsensitive to reordering of events of the same kind, because theyeffectively perform counting (counter increments are commutative).
In general, the developer needs to be aware of the orderingrequirements of a particular analysis, and choose an appropriate im-plementation strategy for the analysis code. ShadowVM’s most con-servative ordering yields similar behaviour to the existing dynamicanalysis frameworks such as Chord, where the observed programis effectively serialized for analysis.3 However, ShadowVM alsoprovides higher-performance (but more relaxed) ordering configura-tions, for use when appropriate.
3 Although strictly speaking, nothing in Chord’s design serializes the pro-gram, ordering is handled by contending for a lock on a unique shared buffer.Frequent contention for this lock in all threads, as generated by any moderateor heavy instrumentation, effectively serializes the program.
49
We describe ordering using the following terminology. Programactions are state transitions in the observed process. A subset ofthese are of interest to the analysis, so are hooked. This generates anevent, which is a message encapsulating the values gathered by thehook code, and which is transmitted to the analysis VM. Notificationis the receipt of an event by the analysis VM from the observed VM.We say that the hooked program action in the observed VM triggersa notification in the analysis VM. The ordering of notifications isnot, in general, the same as the ordering of the program actionsthat triggered them. The different ordering models we now describecause different subsets of the ordering of program actions to bepreserved in the ordering of notifications. (We note that the “groundtruth” ordering of program actions is determined by the behaviourof the host system. In our case, since the host system is a JVM, thisbehaviour is circumscribed by the Java standard.)
Per-thread configuration. In this configuration, notifications areordered by the (per-thread) program order in the observed program.Events from each thread are stored in a dedicated FIFO buffer poolby the agent, the pools are flushed in arbitrary order with respect toeach other. Notifications are dispatched to multiple analysis threadscorresponding to the threads that trigger the events in the observedprogram.
Per-group configuration. This is the most flexible configuration.The developer specifies a group identifier to be used with eachhook. Each group has its own FIFO buffer pool for notifications. Itcan be seen as a generalisation of per-thread ordering where poolsneed not map to threads. For example, a group could map to a setof threads, a single object, code in a particular set of classes, andso on. Similar to the per-thread configuration, the analysis serverdispatches notifications to the corresponding analysis methods inmultiple threads, one thread per group.
Global-ordering configuration. This is the most conservative con-figuration. Conceptually, it can be thought of as per-group configura-tion with a single group identifier. A single buffer pool is used, andthe analysis server dispatches all notifications to the correspondinganalysis methods in a single thread.
4.4 Resource lifecycle eventsShadowVM analyses can request notifications for special eventswhich do not correspond to execution of bytecodes. Rather, theyrelate to some unit of resource in the program, where these resourcescan be threads, objects or the VM itself. These special events markthe end of resource lifetimes. For example, the user can requestnotification of object death (which occurs in the garbage collector,so has no corresponding bytecode). Our attention to orderingguarantees extends to these events. Specifically, we guarantee thatfollowing a notification of the death of a thread, object or the VM,no further notifications referencing that entity will occur. In the caseof the VM, a “VM death” notification is the last one of the execution.
This contrasts with existing APIs which might be usedfor such purposes, such as finalizers, or the Java library’sRuntime.addShutdownHook method. These APIs offer few or noguarantees about the scheduling of hook code, making them difficultto employ from analyses without risking loss of coverage. For exam-ple, although an analysis could register its own shutdown hook, thereis no guarantee that some user-supplied hook would not run afterit. A similar lack of guarantee applies to object finalizers (which, inany case, need not mark the end of an object’s lifetime, owing toresurrection [4]). Meanwhile, there is no portable way to identifythe bytecode representing the precise end of a thread’s execution.
As with other notifications, these ordering guarantees are en-forced in the buffer management code. For all ordering configura-
tions, ShadowVM ensures that the lifecycle events are delivered inproper order related to the notifications produced by hooks.
5. Coverage challengesIn any instrumentation-based design, isolating the analysed programfrom the analysis is inherently in tension with coverage, becausethe inserted code necessarily shares an execution context with theanalysed program code. By default, therefore, it is not isolated fromit. Isolation can only be provided by adopting a discipline whichrestricts what is done from the inserted code, yet still provides anal-yses with essential functionality such as allocating memory, keepingreferences to objects in the observed program, and performing I/O.In this section we summarise the specific difficulties of achievingthis on the Java platform, and the extent to which existing solutionshave (and have not) overcome them.
Exclusion list. A simple way to avoid isolation difficulties is tosacrifice coverage, by omitting instrumentation of core classes. Thisavoids bootstrapping problems, interference between program andanalysis (through shared library state), and infinite regress (if theselibraries are used from instrumentation). We saw some exclusionlists in Figure 1.
Load–instrument gaps. High coverage relies on intercepting theloading of a high proportion of the base program code, so that aninstrumented version can be substituted. Many naive instrumentationimplementations on the Java platform miss some coverage bymissing load events (therefore never instrumenting the loaded code),or by allowing execution of uninstrumented versions of the code forsome time. The Java instrumentation API in java.lang.instrumentsuffers from this problem because it does not allow applying theinstrumentation during JVM start. Moreover, since the Java codeperforming the instrumentation may itself trigger additional classesto be loaded (which cannot be transformed at that point), it leaves theuntransformed version available for use by other threads. We avoidthis by performing instrumentation outside the observed VM (ina separate process) using JVMTI’s ClassFileLoad hook (whichdoes not lead to concurrent use of the uninstrumented code).
Missed initializers. Possibly the most obvious problem with instru-menting core libraries is infinite regress when those libraries areinvoked from the inserted code. It is easily avoided using a per-thread “bypass” flag [17]. However, a side-effect of bypass is thatinitializers for classes used by the analysis are run while the bypassis active and so are not analysed; if the same classes are used laterby the program, their initializers will not be re-run, and so will notbe covered. ShadowVM does not suffer from this problem becausethe only classes referenced by its implementation are Object andString which are preloaded by the JVM bootstrap long before thefirst bytecode is executed.
Avoiding bootstrap bypass. Special-case handling is inevitablyrequired for instrumentation affecting the very earliest bytecodethat the JVM executes, a.k.a. the “bootstrap phase”. The hook codesnippets as well as our generated stub classes are carefully restrictedto a safe subset of bytecode operations. For example, it is not safeto allocate objects in inserted code that might be invoked fromObject. < clinit > (causing a stack overflow). Since our stubsneed only call a static native method, this careful construction ispossible—the fact that calls to our native stub code can be called soearly owes to the fact that an initial set of classes, including Objectand Class, is necessarily special-cased by the JVM.4
4 The JVM’s definition of a class being “loaded” implies that a Class objectexists for it [13, §12.2]—yet, to instantiate the Class object for class Objectunder these rules, both Class and its superclass Object would (circularly)
50
Reference handling. The standard way for an analysis to main-tain references to objects in the observed program is to useWeakReferences. Usually, one shared reference handler thread(or a garbage collection thread) processes cleared reference objects(WeakReference, SoftReference, PhantomReference) on be-half of all other threads. If this thread’s code is instrumented, it maycreate a self-sustaining allocation cycle, because the inserted codewithin the reference handler may allocate more WeakReferences.Excluding the reference handling code avoids this problem, butloses coverage of reference handling on behalf of the observed pro-gram. Our design avoids using WeakReferences and thus avoidsthis problem.
6. ShadowVM ArchitectureWe have summarized the high-level, multi-process architecture ofShadowVM earlier in §4. Here, we review the key architecturalelements in greater detail. In general, the architecture is driven by thedesign goals elaborated in §3, and the ShadowVM responsibilitiesare split between three processes, as shown in Figure 3.
Firstly, the observed VM (augmented with a JVMTI agent)contains the instrumented base program and class library. Theinserted hook code is responsible for producing base programevents that are of interest to the analysis. The agent has two keyresponsibilities: installing instrumented base program code in theobserved VM, and forwarding events produced by the hooks in thebase program to the analysis.
A second VM contains the instrumentation server, itself writtenin Java. The instrumentation server performs all bytecode instru-mentation, communicating Java bytecode with the observed VM’sagent via a socket.
The third VM contains the analysis server, which hosts theanalysis written against the Shadow API. The analysis server isresponsible for dispatching event notifications received via socketfrom the observed VM’s agent to the analysis code, while respectingthe selected ordering configuration.
We now review the various responsibilities in turn.
6.1 Load-time instrumentationTo ensure load-time instrumentation of the base program, the agentintercepts all class loading events in the observed VM and requestsinstrumented versions from the instrumentation VM. The use ofa separate VM to perform instrumentation avoids the substantialperturbation which would be caused if instrumentation were per-formed within the observed VM. For example, doing so would bringforth a significant amount of class loading and initialization activ-ity, which would then not be analysed at the proper point in theobserved program’s execution. Besides reducing perturbation, thisseparation is also essential to enable high-coverage instrumentationencompassing the Java Class Library (JCL).
6.2 Base-program event generationThe user-defined hooks in the base program are responsible forgenerating the events of interest for a particular analysis. The hooksare expressed as DiSL [16] snippets. However, unlike conventionalanalyses based on bytecode instrumentation (including ordinaryuses of DiSL), the hook code is always of the same restrictedform: invoking a native helper method (event API) provided bythe observed VM’s agent, passing as arguments values capturingthe program state that is relevant to the instrumented event. Beyondthis point, the reified event is the responsibility of the agent, andin this paper we do not concern ourselves further with how theinstrumentation itself is expressed or performed. We simply assume
already need to be loaded and initialized. All JVMs therefore employ somekind of special-casing to avoid this circularity.
that the events of interest at bytecode level can be interceptedand handled appropriately, and to simplify hook development, weprovide a library of snippets for various event types.
6.3 Event forwardingThe agent natively implements an event API, into which hooks callduring the execution of the instrumented base program, producingbase program events. The methods of this API marshal their argu-ments into buffers and the agent delivers the event notifications inan asynchronous manner to the analysis server executing on theanalysis VM. This separation is crucial to achieve high coverage andisolation, because it allows instrumenting the base program withoutany bypass mechanisms. It also allows using extra computing powerfor analysis without perturbing the base-program execution.
The communication between observed and analysis processes re-quires carefully designed buffering and threading strategies in orderto yield high-performance asynchronous analyses while respectingordering constraints (introduced in §4.3). Events produced by baseprogram threads are stored and marshaled into buffers in the contextof the event API invocations. Object references in the buffers areprocessed by a separate thread that ensures, with the help of objecttagging, that objects have unique identity and that it is preserved onthe analysis server. Another thread then sends the completed buffersto the analysis VM.
6.4 Notification deliveryRecall that the analysis code runs in a separate JVM (analysis VM).Base program event notifications are sent via socket to the analysisserver. Dispatch logic in the analysis server consumes from thissocket, performs appropriate unmarshaling, and invokes methods ofthe analysis.
Apart from the threading model described in §4.3, which isexposed to the analysis, the analysis server has to cooperate withthe agent to maintain notification ordering mandated by the selectedordering configuration. The internal threading model of the analysisserver was designed to properly order resource lifecycle notificationswith respect to base program event notifications. In addition to thethreads dispatching base program notifications, the analysis serveralso creates a dedicated thread to deliver resource lifecycle eventnotifications to the analysis.
7. EvaluationWe consider the high degree of isolation and full bytecode coverageto be the key benefits of ShadowVM. We therefore aim at evaluatingthe difference in perturbation and analysis coverage when a baseprogram is subjected to a heavy-weight dynamic analysis—once im-plemented in the classic in-process manner, and once implementedusing ShadowVM.
With respect to performance, the distributed nature of theShadowVM approach comes with an inherent overhead due to reifi-cation and forwarding of events to the analysis VM. However, theShadowVM approach also has an inherent scaling potential, whichhinges on the ability of a particular analysis to execute in multi-ple threads mirroring the base-program threads. We therefore aimat quantifying the overhead of a ShadowVM-based analysis com-pared to classic in-process analysis and to assess the scalability ofShadowVM with parallel workloads.
As case study for our evaluation, we chose the field immutabilityanalysis (FIA) by Sewe et al. [1]5. In summary, FIA tracks allobject allocations and field accesses and maintains a per-field “state-machine” that describes the mutability of that field. If a field iswritten outside the dynamic extent of an object’s constructor, it is
5 The sources are available at http://www.disl.scalabench.org/modules/immutability-disl-analysis/.
51
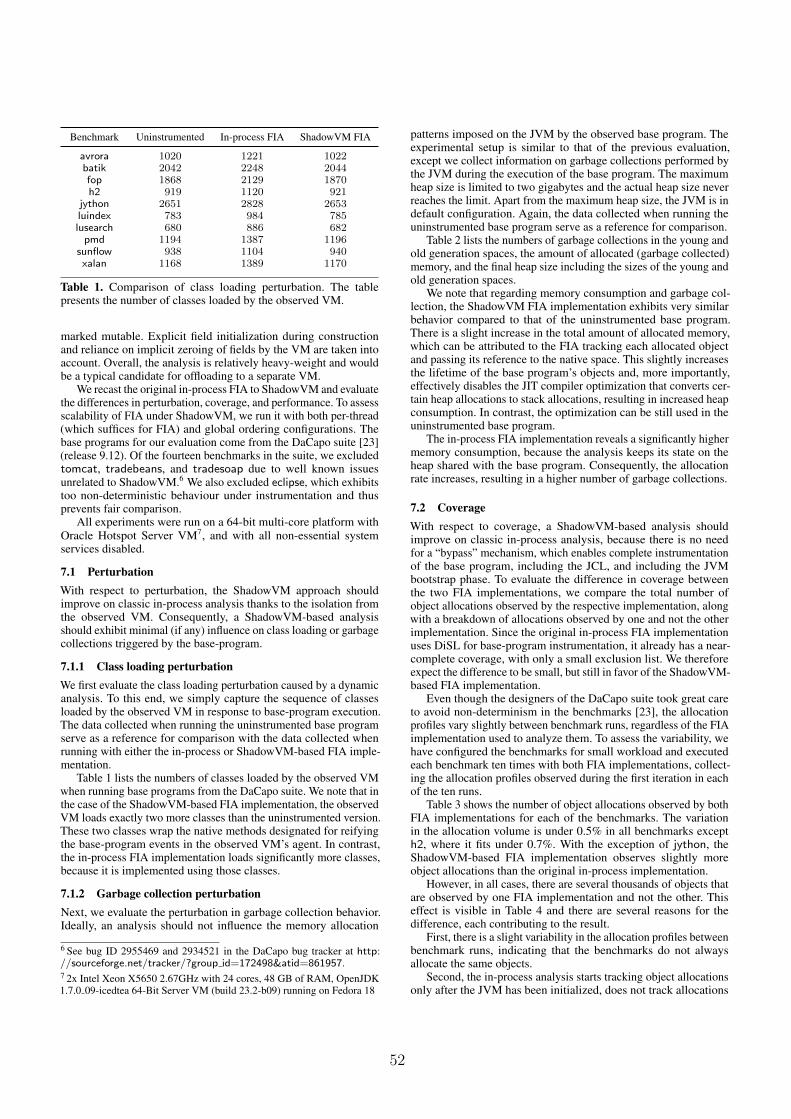
Benchmark Uninstrumented In-process FIA ShadowVM FIA
avrora 1020 1221 1022batik 2042 2248 2044fop 1868 2129 1870h2 919 1120 921
jython 2651 2828 2653luindex 783 984 785lusearch 680 886 682
pmd 1194 1387 1196sunflow 938 1104 940xalan 1168 1389 1170
Table 1. Comparison of class loading perturbation. The tablepresents the number of classes loaded by the observed VM.
marked mutable. Explicit field initialization during constructionand reliance on implicit zeroing of fields by the VM are taken intoaccount. Overall, the analysis is relatively heavy-weight and wouldbe a typical candidate for offloading to a separate VM.
We recast the original in-process FIA to ShadowVM and evaluatethe differences in perturbation, coverage, and performance. To assessscalability of FIA under ShadowVM, we run it with both per-thread(which suffices for FIA) and global ordering configurations. Thebase programs for our evaluation come from the DaCapo suite [23](release 9.12). Of the fourteen benchmarks in the suite, we excludedtomcat, tradebeans, and tradesoap due to well known issuesunrelated to ShadowVM.6 We also excluded eclipse, which exhibitstoo non-deterministic behaviour under instrumentation and thusprevents fair comparison.
All experiments were run on a 64-bit multi-core platform withOracle Hotspot Server VM7, and with all non-essential systemservices disabled.
7.1 PerturbationWith respect to perturbation, the ShadowVM approach shouldimprove on classic in-process analysis thanks to the isolation fromthe observed VM. Consequently, a ShadowVM-based analysisshould exhibit minimal (if any) influence on class loading or garbagecollections triggered by the base-program.
7.1.1 Class loading perturbationWe first evaluate the class loading perturbation caused by a dynamicanalysis. To this end, we simply capture the sequence of classesloaded by the observed VM in response to base-program execution.The data collected when running the uninstrumented base programserve as a reference for comparison with the data collected whenrunning with either the in-process or ShadowVM-based FIA imple-mentation.
Table 1 lists the numbers of classes loaded by the observed VMwhen running base programs from the DaCapo suite. We note that inthe case of the ShadowVM-based FIA implementation, the observedVM loads exactly two more classes than the uninstrumented version.These two classes wrap the native methods designated for reifyingthe base-program events in the observed VM’s agent. In contrast,the in-process FIA implementation loads significantly more classes,because it is implemented using those classes.
7.1.2 Garbage collection perturbationNext, we evaluate the perturbation in garbage collection behavior.Ideally, an analysis should not influence the memory allocation
6 See bug ID 2955469 and 2934521 in the DaCapo bug tracker at http://sourceforge.net/tracker/?group id=172498&atid=861957.7 2x Intel Xeon X5650 2.67GHz with 24 cores, 48 GB of RAM, OpenJDK1.7.0 09-icedtea 64-Bit Server VM (build 23.2-b09) running on Fedora 18
patterns imposed on the JVM by the observed base program. Theexperimental setup is similar to that of the previous evaluation,except we collect information on garbage collections performed bythe JVM during the execution of the base program. The maximumheap size is limited to two gigabytes and the actual heap size neverreaches the limit. Apart from the maximum heap size, the JVM is indefault configuration. Again, the data collected when running theuninstrumented base program serve as a reference for comparison.
Table 2 lists the numbers of garbage collections in the young andold generation spaces, the amount of allocated (garbage collected)memory, and the final heap size including the sizes of the young andold generation spaces.
We note that regarding memory consumption and garbage col-lection, the ShadowVM FIA implementation exhibits very similarbehavior compared to that of the uninstrumented base program.There is a slight increase in the total amount of allocated memory,which can be attributed to the FIA tracking each allocated objectand passing its reference to the native space. This slightly increasesthe lifetime of the base program’s objects and, more importantly,effectively disables the JIT compiler optimization that converts cer-tain heap allocations to stack allocations, resulting in increased heapconsumption. In contrast, the optimization can be still used in theuninstrumented base program.
The in-process FIA implementation reveals a significantly highermemory consumption, because the analysis keeps its state on theheap shared with the base program. Consequently, the allocationrate increases, resulting in a higher number of garbage collections.
7.2 CoverageWith respect to coverage, a ShadowVM-based analysis shouldimprove on classic in-process analysis, because there is no needfor a “bypass” mechanism, which enables complete instrumentationof the base program, including the JCL, and including the JVMbootstrap phase. To evaluate the difference in coverage betweenthe two FIA implementations, we compare the total number ofobject allocations observed by the respective implementation, alongwith a breakdown of allocations observed by one and not the otherimplementation. Since the original in-process FIA implementationuses DiSL for base-program instrumentation, it already has a near-complete coverage, with only a small exclusion list. We thereforeexpect the difference to be small, but still in favor of the ShadowVM-based FIA implementation.
Even though the designers of the DaCapo suite took great careto avoid non-determinism in the benchmarks [23], the allocationprofiles vary slightly between benchmark runs, regardless of the FIAimplementation used to analyze them. To assess the variability, wehave configured the benchmarks for small workload and executedeach benchmark ten times with both FIA implementations, collect-ing the allocation profiles observed during the first iteration in eachof the ten runs.
Table 3 shows the number of object allocations observed by bothFIA implementations for each of the benchmarks. The variationin the allocation volume is under 0.5% in all benchmarks excepth2, where it fits under 0.7%. With the exception of jython, theShadowVM-based FIA implementation observes slightly moreobject allocations than the original in-process implementation.
However, in all cases, there are several thousands of objects thatare observed by one FIA implementation and not the other. Thiseffect is visible in Table 4 and there are several reasons for thedifference, each contributing to the result.
First, there is a slight variability in the allocation profiles betweenbenchmark runs, indicating that the benchmarks do not alwaysallocate the same objects.
Second, the in-process analysis starts tracking object allocationsonly after the JVM has been initialized, does not track allocations
52
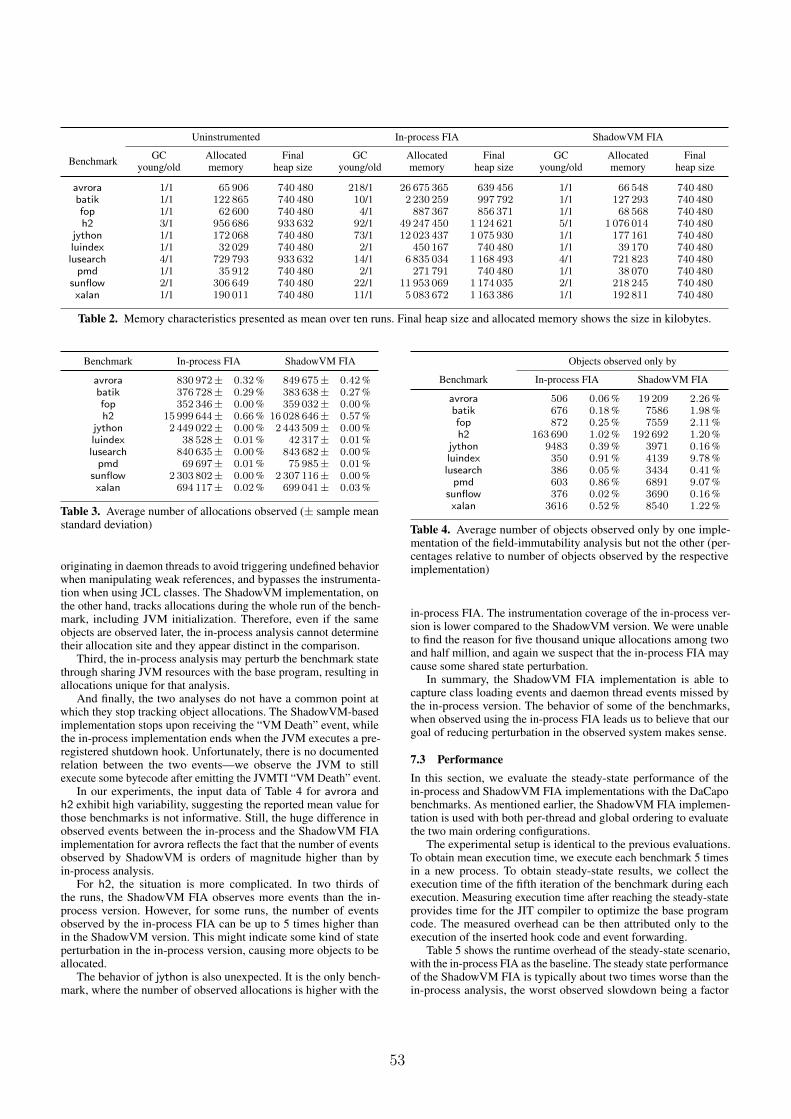
Uninstrumented In-process FIA ShadowVM FIA
Benchmark GC Allocated Final GC Allocated Final GC Allocated Finalyoung/old memory heap size young/old memory heap size young/old memory heap size
avrora 1/1 65 906 740 480 218/1 26 675 365 639 456 1/1 66 548 740 480batik 1/1 122 865 740 480 10/1 2 230 259 997 792 1/1 127 293 740 480fop 1/1 62 600 740 480 4/1 887 367 856 371 1/1 68 568 740 480h2 3/1 956 686 933 632 92/1 49 247 450 1 124 621 5/1 1 076 014 740 480
jython 1/1 172 068 740 480 73/1 12 023 437 1 075 930 1/1 177 161 740 480luindex 1/1 32 029 740 480 2/1 450 167 740 480 1/1 39 170 740 480lusearch 4/1 729 793 933 632 14/1 6 835 034 1 168 493 4/1 721 823 740 480
pmd 1/1 35 912 740 480 2/1 271 791 740 480 1/1 38 070 740 480sunflow 2/1 306 649 740 480 22/1 11 953 069 1 174 035 2/1 218 245 740 480xalan 1/1 190 011 740 480 11/1 5 083 672 1 163 386 1/1 192 811 740 480
Table 2. Memory characteristics presented as mean over ten runs. Final heap size and allocated memory shows the size in kilobytes.
Benchmark In-process FIA ShadowVM FIA
avrora 830 972± 0.32% 849 675± 0.42%batik 376 728± 0.29% 383 638± 0.27%fop 352 346± 0.00% 359 032± 0.00%h2 15 999 644± 0.66% 16 028 646± 0.57%
jython 2 449 022± 0.00% 2 443 509± 0.00%luindex 38 528± 0.01% 42 317± 0.01%lusearch 840 635± 0.00% 843 682± 0.00%
pmd 69 697± 0.01% 75 985± 0.01%sunflow 2 303 802± 0.00% 2 307 116± 0.00%xalan 694 117± 0.02% 699 041± 0.03%
Table 3. Average number of allocations observed (± sample meanstandard deviation)
originating in daemon threads to avoid triggering undefined behaviorwhen manipulating weak references, and bypasses the instrumenta-tion when using JCL classes. The ShadowVM implementation, onthe other hand, tracks allocations during the whole run of the bench-mark, including JVM initialization. Therefore, even if the sameobjects are observed later, the in-process analysis cannot determinetheir allocation site and they appear distinct in the comparison.
Third, the in-process analysis may perturb the benchmark statethrough sharing JVM resources with the base program, resulting inallocations unique for that analysis.
And finally, the two analyses do not have a common point atwhich they stop tracking object allocations. The ShadowVM-basedimplementation stops upon receiving the “VM Death” event, whilethe in-process implementation ends when the JVM executes a pre-registered shutdown hook. Unfortunately, there is no documentedrelation between the two events—we observe the JVM to stillexecute some bytecode after emitting the JVMTI “VM Death” event.
In our experiments, the input data of Table 4 for avrora andh2 exhibit high variability, suggesting the reported mean value forthose benchmarks is not informative. Still, the huge difference inobserved events between the in-process and the ShadowVM FIAimplementation for avrora reflects the fact that the number of eventsobserved by ShadowVM is orders of magnitude higher than byin-process analysis.
For h2, the situation is more complicated. In two thirds ofthe runs, the ShadowVM FIA observes more events than the in-process version. However, for some runs, the number of eventsobserved by the in-process FIA can be up to 5 times higher thanin the ShadowVM version. This might indicate some kind of stateperturbation in the in-process version, causing more objects to beallocated.
The behavior of jython is also unexpected. It is the only bench-mark, where the number of observed allocations is higher with the
Objects observed only by
Benchmark In-process FIA ShadowVM FIA
avrora 506 0.06% 19 209 2.26%batik 676 0.18% 7586 1.98%fop 872 0.25% 7559 2.11%h2 163 690 1.02% 192 692 1.20%
jython 9483 0.39% 3971 0.16%luindex 350 0.91% 4139 9.78%lusearch 386 0.05% 3434 0.41%
pmd 603 0.86% 6891 9.07%sunflow 376 0.02% 3690 0.16%xalan 3616 0.52% 8540 1.22%
Table 4. Average number of objects observed only by one imple-mentation of the field-immutability analysis but not the other (per-centages relative to number of objects observed by the respectiveimplementation)
in-process FIA. The instrumentation coverage of the in-process ver-sion is lower compared to the ShadowVM version. We were unableto find the reason for five thousand unique allocations among twoand half million, and again we suspect that the in-process FIA maycause some shared state perturbation.
In summary, the ShadowVM FIA implementation is able tocapture class loading events and daemon thread events missed bythe in-process version. The behavior of some of the benchmarks,when observed using the in-process FIA leads us to believe that ourgoal of reducing perturbation in the observed system makes sense.
7.3 PerformanceIn this section, we evaluate the steady-state performance of thein-process and ShadowVM FIA implementations with the DaCapobenchmarks. As mentioned earlier, the ShadowVM FIA implemen-tation is used with both per-thread and global ordering to evaluatethe two main ordering configurations.
The experimental setup is identical to the previous evaluations.To obtain mean execution time, we execute each benchmark 5 timesin a new process. To obtain steady-state results, we collect theexecution time of the fifth iteration of the benchmark during eachexecution. Measuring execution time after reaching the steady-stateprovides time for the JIT compiler to optimize the base programcode. The measured overhead can be then attributed only to theexecution of the inserted hook code and event forwarding.
Table 5 shows the runtime overhead of the steady-state scenario,with the in-process FIA as the baseline. The steady state performanceof the ShadowVM FIA is typically about two times worse than thein-process analysis, the worst observed slowdown being a factor
53
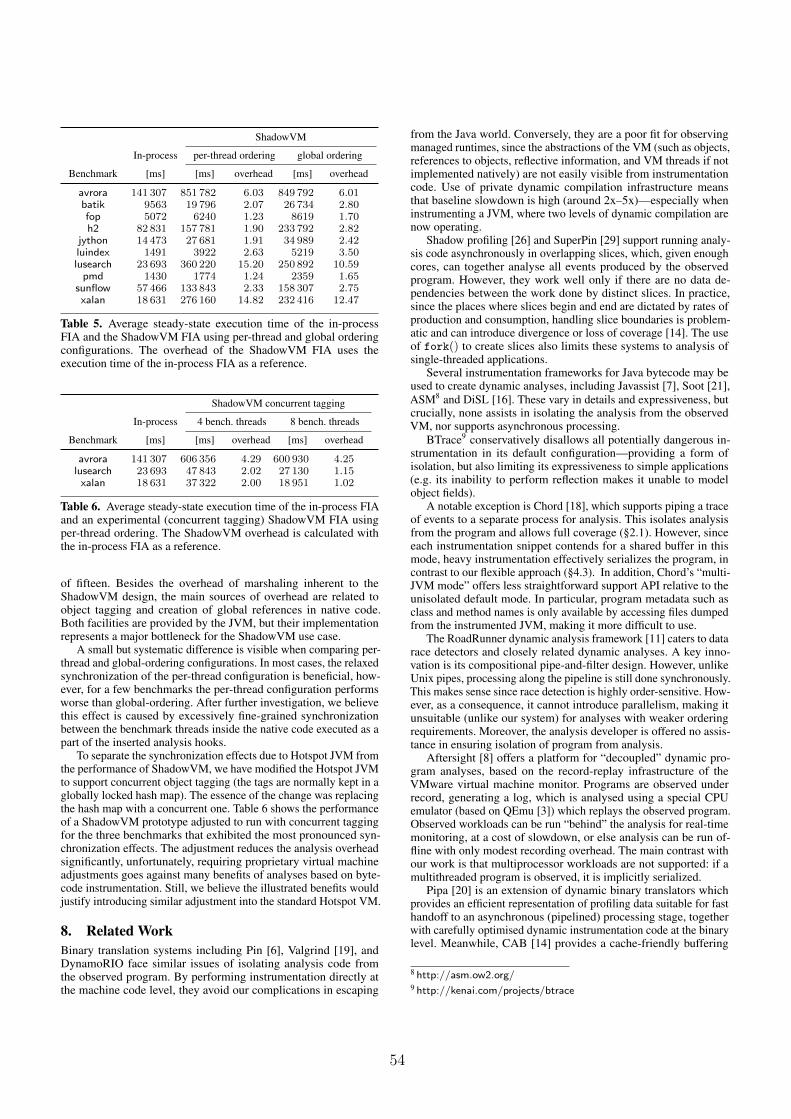
ShadowVM
In-process per-thread ordering global ordering
Benchmark [ms] [ms] overhead [ms] overhead
avrora 141 307 851 782 6.03 849 792 6.01batik 9563 19 796 2.07 26 734 2.80fop 5072 6240 1.23 8619 1.70h2 82 831 157 781 1.90 233 792 2.82
jython 14 473 27 681 1.91 34 989 2.42luindex 1491 3922 2.63 5219 3.50lusearch 23 693 360 220 15.20 250 892 10.59
pmd 1430 1774 1.24 2359 1.65sunflow 57 466 133 843 2.33 158 307 2.75xalan 18 631 276 160 14.82 232 416 12.47
Table 5. Average steady-state execution time of the in-processFIA and the ShadowVM FIA using per-thread and global orderingconfigurations. The overhead of the ShadowVM FIA uses theexecution time of the in-process FIA as a reference.
ShadowVM concurrent tagging
In-process 4 bench. threads 8 bench. threads
Benchmark [ms] [ms] overhead [ms] overhead
avrora 141 307 606 356 4.29 600 930 4.25lusearch 23 693 47 843 2.02 27 130 1.15
xalan 18 631 37 322 2.00 18 951 1.02
Table 6. Average steady-state execution time of the in-process FIAand an experimental (concurrent tagging) ShadowVM FIA usingper-thread ordering. The ShadowVM overhead is calculated withthe in-process FIA as a reference.
of fifteen. Besides the overhead of marshaling inherent to theShadowVM design, the main sources of overhead are related toobject tagging and creation of global references in native code.Both facilities are provided by the JVM, but their implementationrepresents a major bottleneck for the ShadowVM use case.
A small but systematic difference is visible when comparing per-thread and global-ordering configurations. In most cases, the relaxedsynchronization of the per-thread configuration is beneficial, how-ever, for a few benchmarks the per-thread configuration performsworse than global-ordering. After further investigation, we believethis effect is caused by excessively fine-grained synchronizationbetween the benchmark threads inside the native code executed as apart of the inserted analysis hooks.
To separate the synchronization effects due to Hotspot JVM fromthe performance of ShadowVM, we have modified the Hotspot JVMto support concurrent object tagging (the tags are normally kept in aglobally locked hash map). The essence of the change was replacingthe hash map with a concurrent one. Table 6 shows the performanceof a ShadowVM prototype adjusted to run with concurrent taggingfor the three benchmarks that exhibited the most pronounced syn-chronization effects. The adjustment reduces the analysis overheadsignificantly, unfortunately, requiring proprietary virtual machineadjustments goes against many benefits of analyses based on byte-code instrumentation. Still, we believe the illustrated benefits wouldjustify introducing similar adjustment into the standard Hotspot VM.
8. Related WorkBinary translation systems including Pin [6], Valgrind [19], andDynamoRIO face similar issues of isolating analysis code fromthe observed program. By performing instrumentation directly atthe machine code level, they avoid our complications in escaping
from the Java world. Conversely, they are a poor fit for observingmanaged runtimes, since the abstractions of the VM (such as objects,references to objects, reflective information, and VM threads if notimplemented natively) are not easily visible from instrumentationcode. Use of private dynamic compilation infrastructure meansthat baseline slowdown is high (around 2x–5x)—especially wheninstrumenting a JVM, where two levels of dynamic compilation arenow operating.
Shadow profiling [26] and SuperPin [29] support running analy-sis code asynchronously in overlapping slices, which, given enoughcores, can together analyse all events produced by the observedprogram. However, they work well only if there are no data de-pendencies between the work done by distinct slices. In practice,since the places where slices begin and end are dictated by rates ofproduction and consumption, handling slice boundaries is problem-atic and can introduce divergence or loss of coverage [14]. The useof fork() to create slices also limits these systems to analysis ofsingle-threaded applications.
Several instrumentation frameworks for Java bytecode may beused to create dynamic analyses, including Javassist [7], Soot [21],ASM8 and DiSL [16]. These vary in details and expressiveness, butcrucially, none assists in isolating the analysis from the observedVM, nor supports asynchronous processing.
BTrace9 conservatively disallows all potentially dangerous in-strumentation in its default configuration—providing a form ofisolation, but also limiting its expressiveness to simple applications(e.g. its inability to perform reflection makes it unable to modelobject fields).
A notable exception is Chord [18], which supports piping a traceof events to a separate process for analysis. This isolates analysisfrom the program and allows full coverage (§2.1). However, sinceeach instrumentation snippet contends for a shared buffer in thismode, heavy instrumentation effectively serializes the program, incontrast to our flexible approach (§4.3). In addition, Chord’s “multi-JVM mode” offers less straightforward support API relative to theunisolated default mode. In particular, program metadata such asclass and method names is only available by accessing files dumpedfrom the instrumented JVM, making it more difficult to use.
The RoadRunner dynamic analysis framework [11] caters to datarace detectors and closely related dynamic analyses. A key inno-vation is its compositional pipe-and-filter design. However, unlikeUnix pipes, processing along the pipeline is still done synchronously.This makes sense since race detection is highly order-sensitive. How-ever, as a consequence, it cannot introduce parallelism, making itunsuitable (unlike our system) for analyses with weaker orderingrequirements. Moreover, the analysis developer is offered no assis-tance in ensuring isolation of program from analysis.
Aftersight [8] offers a platform for “decoupled” dynamic pro-gram analyses, based on the record-replay infrastructure of theVMware virtual machine monitor. Programs are observed underrecord, generating a log, which is analysed using a special CPUemulator (based on QEmu [3]) which replays the observed program.Observed workloads can be run “behind” the analysis for real-timemonitoring, at a cost of slowdown, or else analysis can be run of-fline with only modest recording overhead. The main contrast withour work is that multiprocessor workloads are not supported: if amultithreaded program is observed, it is implicitly serialized.
Pipa [20] is an extension of dynamic binary translators whichprovides an efficient representation of profiling data suitable for fasthandoff to an asynchronous (pipelined) processing stage, togetherwith carefully optimised dynamic instrumentation code at the binarylevel. Meanwhile, CAB [14] provides a cache-friendly buffering
8 http://asm.ow2.org/9 http://kenai.com/projects/btrace
54
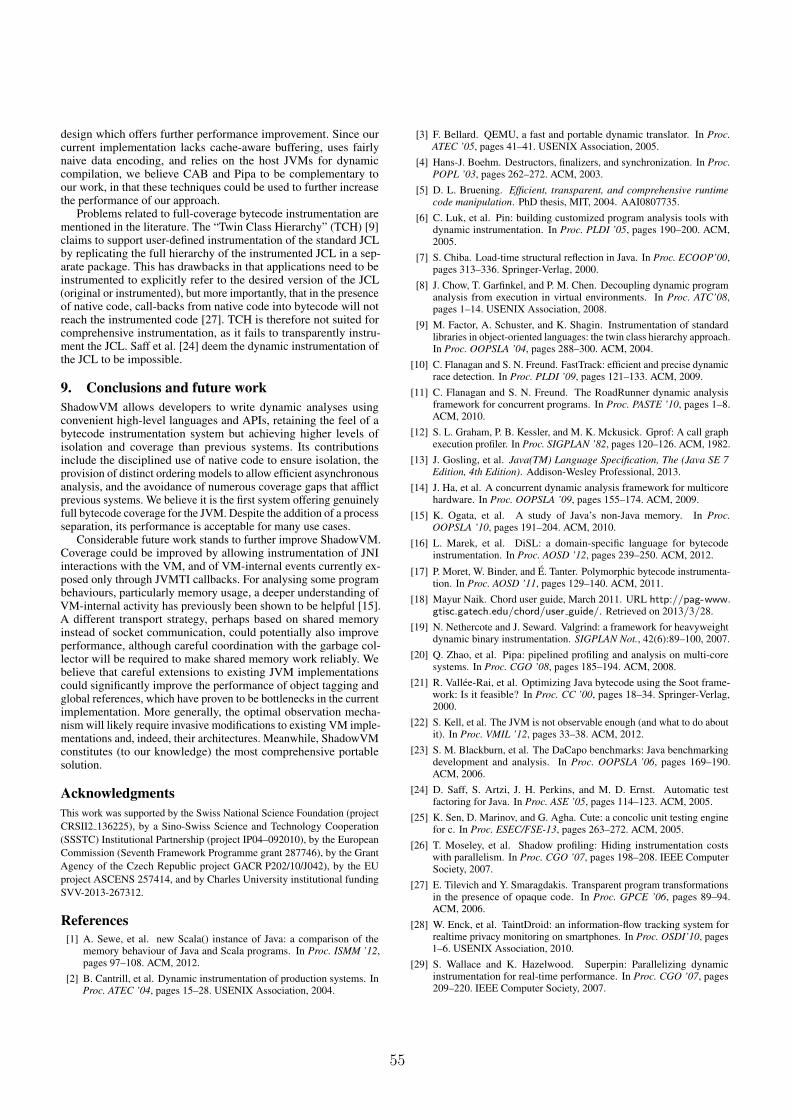
design which offers further performance improvement. Since ourcurrent implementation lacks cache-aware buffering, uses fairlynaive data encoding, and relies on the host JVMs for dynamiccompilation, we believe CAB and Pipa to be complementary toour work, in that these techniques could be used to further increasethe performance of our approach.
Problems related to full-coverage bytecode instrumentation arementioned in the literature. The “Twin Class Hierarchy” (TCH) [9]claims to support user-defined instrumentation of the standard JCLby replicating the full hierarchy of the instrumented JCL in a sep-arate package. This has drawbacks in that applications need to beinstrumented to explicitly refer to the desired version of the JCL(original or instrumented), but more importantly, that in the presenceof native code, call-backs from native code into bytecode will notreach the instrumented code [27]. TCH is therefore not suited forcomprehensive instrumentation, as it fails to transparently instru-ment the JCL. Saff et al. [24] deem the dynamic instrumentation ofthe JCL to be impossible.
9. Conclusions and future workShadowVM allows developers to write dynamic analyses usingconvenient high-level languages and APIs, retaining the feel of abytecode instrumentation system but achieving higher levels ofisolation and coverage than previous systems. Its contributionsinclude the disciplined use of native code to ensure isolation, theprovision of distinct ordering models to allow efficient asynchronousanalysis, and the avoidance of numerous coverage gaps that afflictprevious systems. We believe it is the first system offering genuinelyfull bytecode coverage for the JVM. Despite the addition of a processseparation, its performance is acceptable for many use cases.
Considerable future work stands to further improve ShadowVM.Coverage could be improved by allowing instrumentation of JNIinteractions with the VM, and of VM-internal events currently ex-posed only through JVMTI callbacks. For analysing some programbehaviours, particularly memory usage, a deeper understanding ofVM-internal activity has previously been shown to be helpful [15].A different transport strategy, perhaps based on shared memoryinstead of socket communication, could potentially also improveperformance, although careful coordination with the garbage col-lector will be required to make shared memory work reliably. Webelieve that careful extensions to existing JVM implementationscould significantly improve the performance of object tagging andglobal references, which have proven to be bottlenecks in the currentimplementation. More generally, the optimal observation mecha-nism will likely require invasive modifications to existing VM imple-mentations and, indeed, their architectures. Meanwhile, ShadowVMconstitutes (to our knowledge) the most comprehensive portablesolution.
AcknowledgmentsThis work was supported by the Swiss National Science Foundation (projectCRSII2 136225), by a Sino-Swiss Science and Technology Cooperation(SSSTC) Institutional Partnership (project IP04–092010), by the EuropeanCommission (Seventh Framework Programme grant 287746), by the GrantAgency of the Czech Republic project GACR P202/10/J042), by the EUproject ASCENS 257414, and by Charles University institutional fundingSVV-2013-267312.
References[1] A. Sewe, et al. new Scala() instance of Java: a comparison of the
memory behaviour of Java and Scala programs. In Proc. ISMM ’12,pages 97–108. ACM, 2012.
[2] B. Cantrill, et al. Dynamic instrumentation of production systems. InProc. ATEC ’04, pages 15–28. USENIX Association, 2004.
[3] F. Bellard. QEMU, a fast and portable dynamic translator. In Proc.ATEC ’05, pages 41–41. USENIX Association, 2005.
[4] Hans-J. Boehm. Destructors, finalizers, and synchronization. In Proc.POPL ’03, pages 262–272. ACM, 2003.
[5] D. L. Bruening. Efficient, transparent, and comprehensive runtimecode manipulation. PhD thesis, MIT, 2004. AAI0807735.
[6] C. Luk, et al. Pin: building customized program analysis tools withdynamic instrumentation. In Proc. PLDI ’05, pages 190–200. ACM,2005.
[7] S. Chiba. Load-time structural reflection in Java. In Proc. ECOOP’00,pages 313–336. Springer-Verlag, 2000.
[8] J. Chow, T. Garfinkel, and P. M. Chen. Decoupling dynamic programanalysis from execution in virtual environments. In Proc. ATC’08,pages 1–14. USENIX Association, 2008.
[9] M. Factor, A. Schuster, and K. Shagin. Instrumentation of standardlibraries in object-oriented languages: the twin class hierarchy approach.In Proc. OOPSLA ’04, pages 288–300. ACM, 2004.
[10] C. Flanagan and S. N. Freund. FastTrack: efficient and precise dynamicrace detection. In Proc. PLDI ’09, pages 121–133. ACM, 2009.
[11] C. Flanagan and S. N. Freund. The RoadRunner dynamic analysisframework for concurrent programs. In Proc. PASTE ’10, pages 1–8.ACM, 2010.
[12] S. L. Graham, P. B. Kessler, and M. K. Mckusick. Gprof: A call graphexecution profiler. In Proc. SIGPLAN ’82, pages 120–126. ACM, 1982.
[13] J. Gosling, et al. Java(TM) Language Specification, The (Java SE 7Edition, 4th Edition). Addison-Wesley Professional, 2013.
[14] J. Ha, et al. A concurrent dynamic analysis framework for multicorehardware. In Proc. OOPSLA ’09, pages 155–174. ACM, 2009.
[15] K. Ogata, et al. A study of Java’s non-Java memory. In Proc.OOPSLA ’10, pages 191–204. ACM, 2010.
[16] L. Marek, et al. DiSL: a domain-specific language for bytecodeinstrumentation. In Proc. AOSD ’12, pages 239–250. ACM, 2012.
[17] P. Moret, W. Binder, and E. Tanter. Polymorphic bytecode instrumenta-tion. In Proc. AOSD ’11, pages 129–140. ACM, 2011.
[18] Mayur Naik. Chord user guide, March 2011. URL http://pag-www.gtisc.gatech.edu/chord/user guide/. Retrieved on 2013/3/28.
[19] N. Nethercote and J. Seward. Valgrind: a framework for heavyweightdynamic binary instrumentation. SIGPLAN Not., 42(6):89–100, 2007.
[20] Q. Zhao, et al. Pipa: pipelined profiling and analysis on multi-coresystems. In Proc. CGO ’08, pages 185–194. ACM, 2008.
[21] R. Vallee-Rai, et al. Optimizing Java bytecode using the Soot frame-work: Is it feasible? In Proc. CC ’00, pages 18–34. Springer-Verlag,2000.
[22] S. Kell, et al. The JVM is not observable enough (and what to do aboutit). In Proc. VMIL ’12, pages 33–38. ACM, 2012.
[23] S. M. Blackburn, et al. The DaCapo benchmarks: Java benchmarkingdevelopment and analysis. In Proc. OOPSLA ’06, pages 169–190.ACM, 2006.
[24] D. Saff, S. Artzi, J. H. Perkins, and M. D. Ernst. Automatic testfactoring for Java. In Proc. ASE ’05, pages 114–123. ACM, 2005.
[25] K. Sen, D. Marinov, and G. Agha. Cute: a concolic unit testing enginefor c. In Proc. ESEC/FSE-13, pages 263–272. ACM, 2005.
[26] T. Moseley, et al. Shadow profiling: Hiding instrumentation costswith parallelism. In Proc. CGO ’07, pages 198–208. IEEE ComputerSociety, 2007.
[27] E. Tilevich and Y. Smaragdakis. Transparent program transformationsin the presence of opaque code. In Proc. GPCE ’06, pages 89–94.ACM, 2006.
[28] W. Enck, et al. TaintDroid: an information-flow tracking system forrealtime privacy monitoring on smartphones. In Proc. OSDI’10, pages1–6. USENIX Association, 2010.
[29] S. Wallace and K. Hazelwood. Superpin: Parallelizing dynamicinstrumentation for real-time performance. In Proc. CGO ’07, pages209–220. IEEE Computer Society, 2007.
55

56
Chapter 5
Introduction to DynamicProgram Analysis with DiSL
Lukas Marek,Yudi Zheng,Danilo Ansaloni,Lubomır Bulej,Aibek Sarimbekov,Walter Binder,Petr Tuma
Accepted for publication in 5th Special Issue on ExperimentalSoftware and Toolkits
In Science of Computer Programming,to be published by Elsevier,In Press.
The original version is available electronically from the publisher’ssite at http://dx.doi.org/10.1016/j.scico.2014.01.003.
57
Introduction to Dynamic Program Analysis with DiSL
Lukáš Mareka, Yudi Zhengb, Danilo Ansalonib, Lubomír Bulejb,Aibek Sarimbekovb, Walter Binderb, Petr Tůmaa
aCharles University, Czech RepublicbUniversity of Lugano, Switzerland
AbstractDynamic program analysis (DPA) tools assist in many software engineer-ing and development tasks, including profiling, program comprehension, andperformance model construction and calibration. On the Java platform,many DPA tools are implemented either using aspect-oriented programming(AOP), or rely on bytecode instrumentation to modify the base program code.The pointcut/advice model found in AOP enables rapid tool development,but does not allow expressing certain instrumentations due to limitations ofmainstream AOP languages—developers thus use bytecode manipulation togain more expressiveness and performance. However, while the existing byte-code manipulation libraries handle some low-level details, they still make tooldevelopment tedious and error-prone. Targeting this issue, we provide thefirst complete presentation of DiSL, an open-source instrumentation frame-work that reconciles the conciseness of the AOP pointcut/advice model andthe expressiveness and performance achievable with bytecode manipulationlibraries. Specifically, we extend our previous work to provide an overview ofthe DiSL architecture, advanced features, and the programming model. Wealso include case studies illustrating successful deployment of DiSL-basedDPA tools.Keywords:dynamic program analysis, bytecode instrumentation, aspect-orientedprogramming, domain-specific languages, Java Virtual Machine
Email addresses: [email protected] (Lukáš Marek),[email protected] (Yudi Zheng), [email protected] (Danilo Ansaloni),[email protected] (Lubomír Bulej), [email protected](Aibek Sarimbekov), [email protected] (Walter Binder),[email protected] (Petr Tůma)
Preprint submitted to Science of Computer Programming April 14, 2014
58
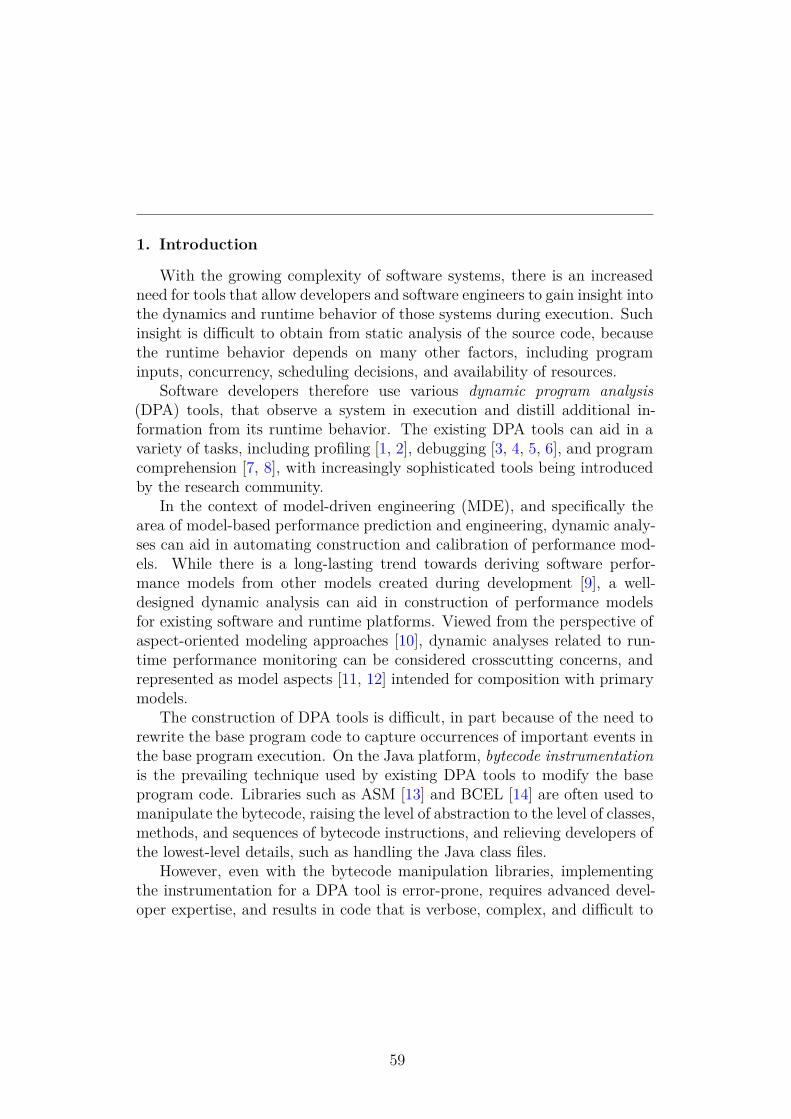
1. Introduction
With the growing complexity of software systems, there is an increasedneed for tools that allow developers and software engineers to gain insight intothe dynamics and runtime behavior of those systems during execution. Suchinsight is difficult to obtain from static analysis of the source code, becausethe runtime behavior depends on many other factors, including programinputs, concurrency, scheduling decisions, and availability of resources.
Software developers therefore use various dynamic program analysis(DPA) tools, that observe a system in execution and distill additional in-formation from its runtime behavior. The existing DPA tools can aid in avariety of tasks, including profiling [1, 2], debugging [3, 4, 5, 6], and programcomprehension [7, 8], with increasingly sophisticated tools being introducedby the research community.
In the context of model-driven engineering (MDE), and specifically thearea of model-based performance prediction and engineering, dynamic analy-ses can aid in automating construction and calibration of performance mod-els. While there is a long-lasting trend towards deriving software perfor-mance models from other models created during development [9], a well-designed dynamic analysis can aid in construction of performance modelsfor existing software and runtime platforms. Viewed from the perspective ofaspect-oriented modeling approaches [10], dynamic analyses related to run-time performance monitoring can be considered crosscutting concerns, andrepresented as model aspects [11, 12] intended for composition with primarymodels.
The construction of DPA tools is difficult, in part because of the need torewrite the base program code to capture occurrences of important events inthe base program execution. On the Java platform, bytecode instrumentationis the prevailing technique used by existing DPA tools to modify the baseprogram code. Libraries such as ASM [13] and BCEL [14] are often used tomanipulate the bytecode, raising the level of abstraction to the level of classes,methods, and sequences of bytecode instructions, and relieving developers ofthe lowest-level details, such as handling the Java class files.
However, even with the bytecode manipulation libraries, implementingthe instrumentation for a DPA tool is error-prone, requires advanced devel-oper expertise, and results in code that is verbose, complex, and difficult to
59
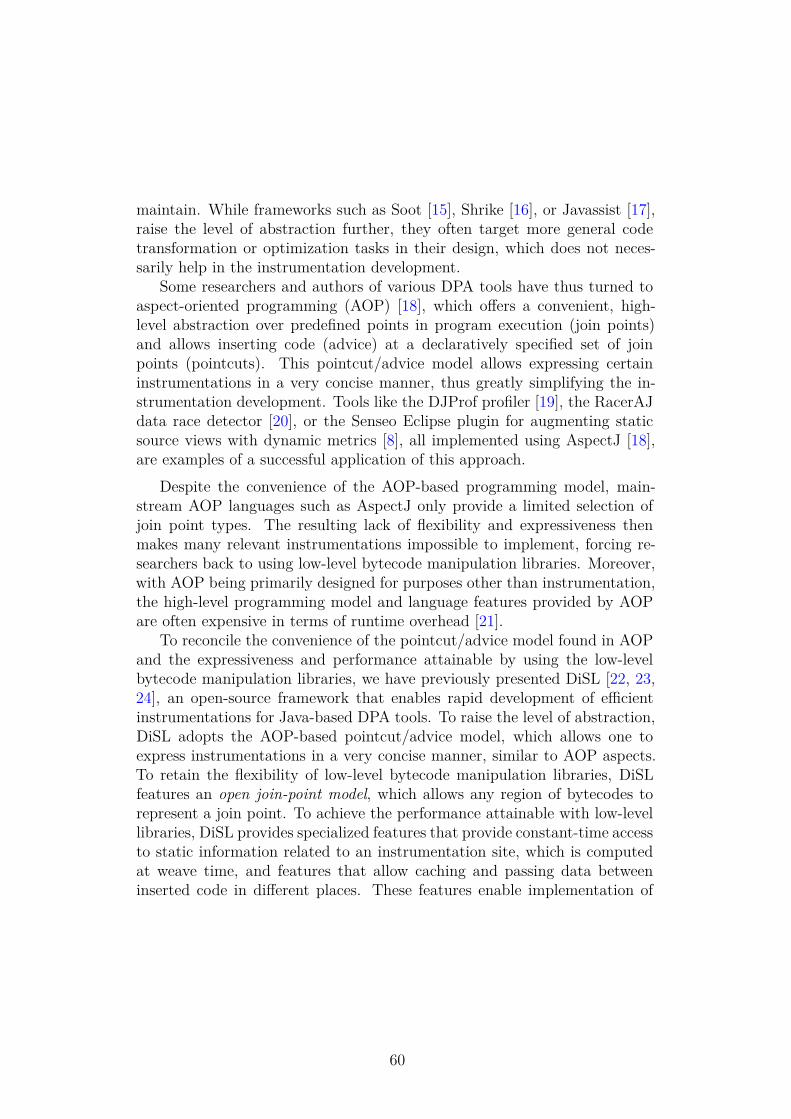
maintain. While frameworks such as Soot [15], Shrike [16], or Javassist [17],raise the level of abstraction further, they often target more general codetransformation or optimization tasks in their design, which does not neces-sarily help in the instrumentation development.
Some researchers and authors of various DPA tools have thus turned toaspect-oriented programming (AOP) [18], which offers a convenient, high-level abstraction over predefined points in program execution (join points)and allows inserting code (advice) at a declaratively specified set of joinpoints (pointcuts). This pointcut/advice model allows expressing certaininstrumentations in a very concise manner, thus greatly simplifying the in-strumentation development. Tools like the DJProf profiler [19], the RacerAJdata race detector [20], or the Senseo Eclipse plugin for augmenting staticsource views with dynamic metrics [8], all implemented using AspectJ [18],are examples of a successful application of this approach.
Despite the convenience of the AOP-based programming model, main-stream AOP languages such as AspectJ only provide a limited selection ofjoin point types. The resulting lack of flexibility and expressiveness thenmakes many relevant instrumentations impossible to implement, forcing re-searchers back to using low-level bytecode manipulation libraries. Moreover,with AOP being primarily designed for purposes other than instrumentation,the high-level programming model and language features provided by AOPare often expensive in terms of runtime overhead [21].
To reconcile the convenience of the pointcut/advice model found in AOPand the expressiveness and performance attainable by using the low-levelbytecode manipulation libraries, we have previously presented DiSL [22, 23,24], an open-source framework that enables rapid development of efficientinstrumentations for Java-based DPA tools. To raise the level of abstraction,DiSL adopts the AOP-based pointcut/advice model, which allows one toexpress instrumentations in a very concise manner, similar to AOP aspects.To retain the flexibility of low-level bytecode manipulation libraries, DiSLfeatures an open join-point model, which allows any region of bytecodes torepresent a join point. To achieve the performance attainable with low-levellibraries, DiSL provides specialized features that provide constant-time accessto static information related to an instrumentation site, which is computedat weave time, and features that allow caching and passing data betweeninserted code in different places. These features enable implementation of
60
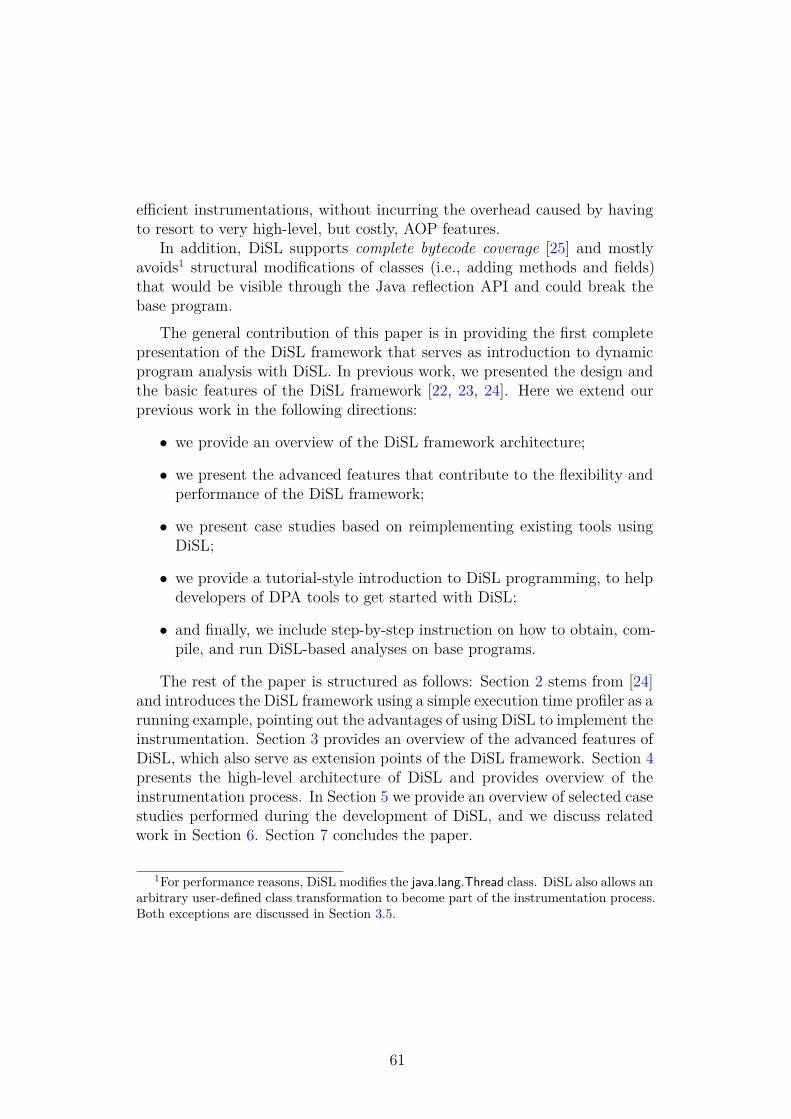
efficient instrumentations, without incurring the overhead caused by havingto resort to very high-level, but costly, AOP features.
In addition, DiSL supports complete bytecode coverage [25] and mostlyavoids1 structural modifications of classes (i.e., adding methods and fields)that would be visible through the Java reflection API and could break thebase program.
The general contribution of this paper is in providing the first completepresentation of the DiSL framework that serves as introduction to dynamicprogram analysis with DiSL. In previous work, we presented the design andthe basic features of the DiSL framework [22, 23, 24]. Here we extend ourprevious work in the following directions:
• we provide an overview of the DiSL framework architecture;
• we present the advanced features that contribute to the flexibility andperformance of the DiSL framework;
• we present case studies based on reimplementing existing tools usingDiSL;
• we provide a tutorial-style introduction to DiSL programming, to helpdevelopers of DPA tools to get started with DiSL;
• and finally, we include step-by-step instruction on how to obtain, com-pile, and run DiSL-based analyses on base programs.
The rest of the paper is structured as follows: Section 2 stems from [24]and introduces the DiSL framework using a simple execution time profiler as arunning example, pointing out the advantages of using DiSL to implement theinstrumentation. Section 3 provides an overview of the advanced features ofDiSL, which also serve as extension points of the DiSL framework. Section 4presents the high-level architecture of DiSL and provides overview of theinstrumentation process. In Section 5 we provide an overview of selected casestudies performed during the development of DiSL, and we discuss relatedwork in Section 6. Section 7 concludes the paper.
1For performance reasons, DiSL modifies the java.lang.Thread class. DiSL also allows anarbitrary user-defined class transformation to become part of the instrumentation process.Both exceptions are discussed in Section 3.5.
61
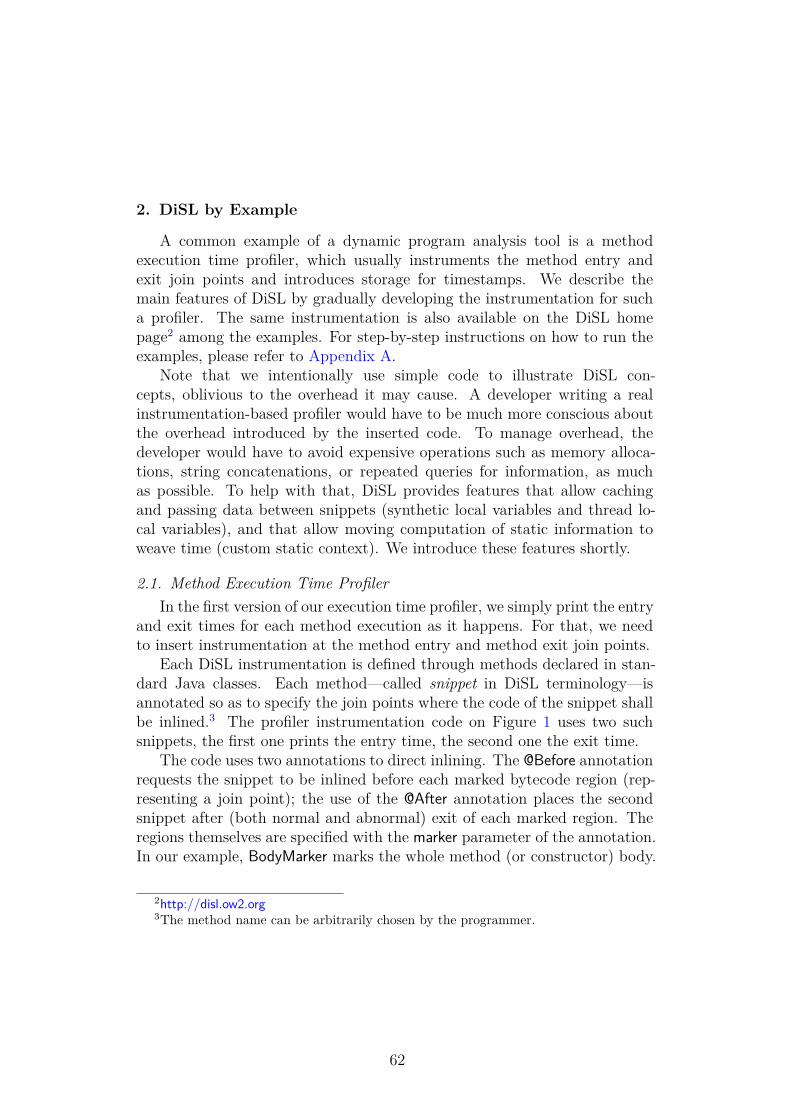
2. DiSL by Example
A common example of a dynamic program analysis tool is a methodexecution time profiler, which usually instruments the method entry andexit join points and introduces storage for timestamps. We describe themain features of DiSL by gradually developing the instrumentation for sucha profiler. The same instrumentation is also available on the DiSL homepage2 among the examples. For step-by-step instructions on how to run theexamples, please refer to Appendix A.
Note that we intentionally use simple code to illustrate DiSL con-cepts, oblivious to the overhead it may cause. A developer writing a realinstrumentation-based profiler would have to be much more conscious aboutthe overhead introduced by the inserted code. To manage overhead, thedeveloper would have to avoid expensive operations such as memory alloca-tions, string concatenations, or repeated queries for information, as muchas possible. To help with that, DiSL provides features that allow cachingand passing data between snippets (synthetic local variables and thread lo-cal variables), and that allow moving computation of static information toweave time (custom static context). We introduce these features shortly.
2.1. Method Execution Time ProfilerIn the first version of our execution time profiler, we simply print the entry
and exit times for each method execution as it happens. For that, we needto insert instrumentation at the method entry and method exit join points.
Each DiSL instrumentation is defined through methods declared in stan-dard Java classes. Each method—called snippet in DiSL terminology—isannotated so as to specify the join points where the code of the snippet shallbe inlined.3 The profiler instrumentation code on Figure 1 uses two suchsnippets, the first one prints the entry time, the second one the exit time.
The code uses two annotations to direct inlining. The @Before annotationrequests the snippet to be inlined before each marked bytecode region (rep-resenting a join point); the use of the @After annotation places the secondsnippet after (both normal and abnormal) exit of each marked region. Theregions themselves are specified with the marker parameter of the annotation.In our example, BodyMarker marks the whole method (or constructor) body.
2http://disl.ow2.org3The method name can be arbitrarily chosen by the programmer.
62
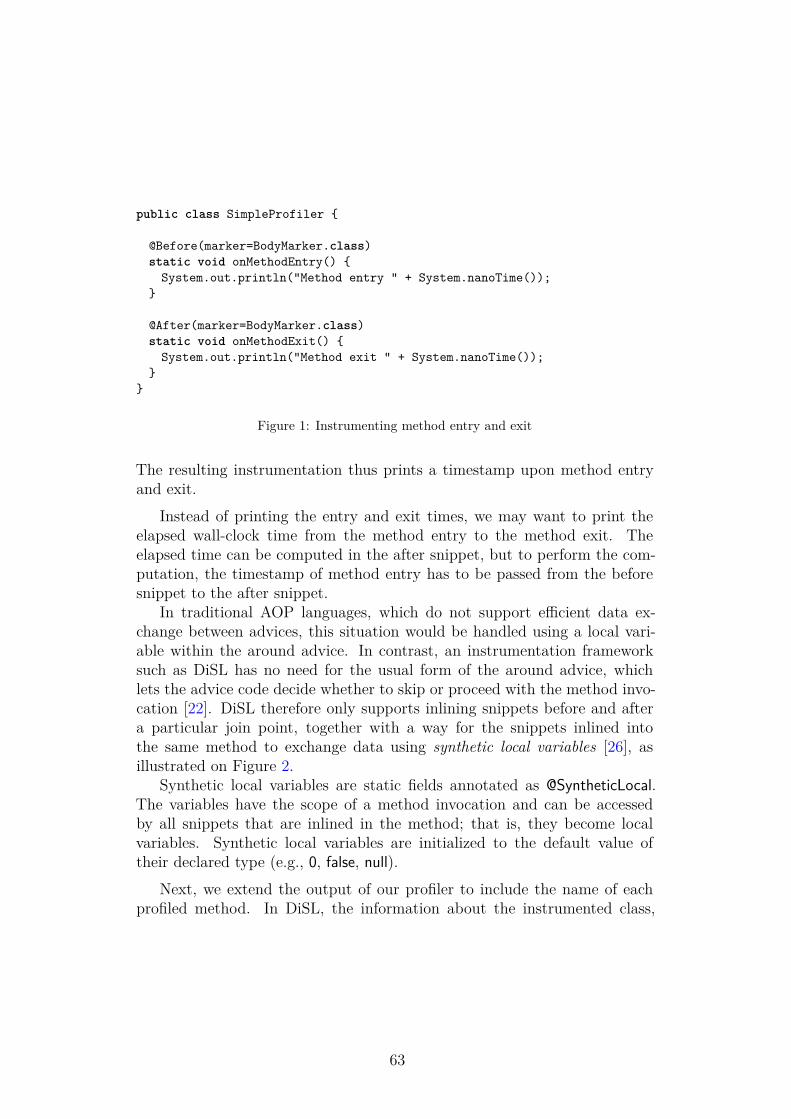
public class SimpleProfiler {
@Before(marker=BodyMarker.class)static void onMethodEntry() {
System.out.println("Method entry " + System.nanoTime());}
@After(marker=BodyMarker.class)static void onMethodExit() {
System.out.println("Method exit " + System.nanoTime());}
}
Figure 1: Instrumenting method entry and exit
The resulting instrumentation thus prints a timestamp upon method entryand exit.
Instead of printing the entry and exit times, we may want to print theelapsed wall-clock time from the method entry to the method exit. Theelapsed time can be computed in the after snippet, but to perform the com-putation, the timestamp of method entry has to be passed from the beforesnippet to the after snippet.
In traditional AOP languages, which do not support efficient data ex-change between advices, this situation would be handled using a local vari-able within the around advice. In contrast, an instrumentation frameworksuch as DiSL has no need for the usual form of the around advice, whichlets the advice code decide whether to skip or proceed with the method invo-cation [22]. DiSL therefore only supports inlining snippets before and aftera particular join point, together with a way for the snippets inlined intothe same method to exchange data using synthetic local variables [26], asillustrated on Figure 2.
Synthetic local variables are static fields annotated as @SyntheticLocal.The variables have the scope of a method invocation and can be accessedby all snippets that are inlined in the method; that is, they become localvariables. Synthetic local variables are initialized to the default value oftheir declared type (e.g., 0, false, null).
Next, we extend the output of our profiler to include the name of eachprofiled method. In DiSL, the information about the instrumented class,
63
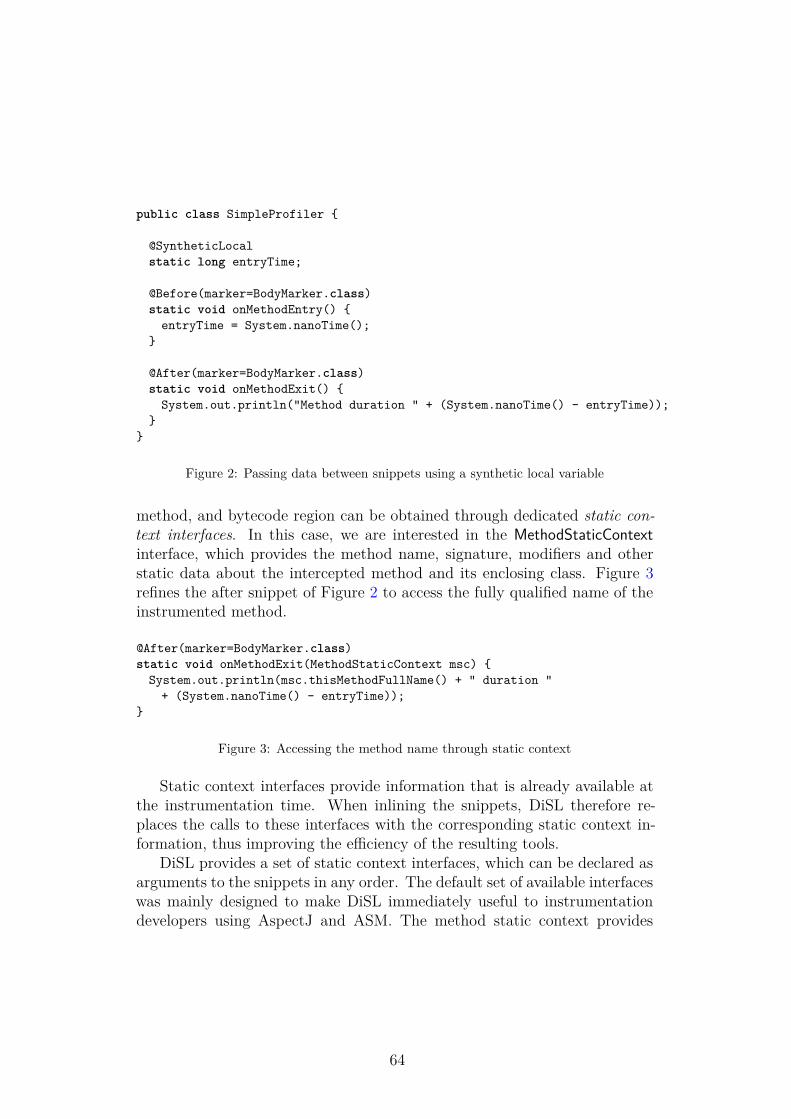
public class SimpleProfiler {
@SyntheticLocalstatic long entryTime;
@Before(marker=BodyMarker.class)static void onMethodEntry() {
entryTime = System.nanoTime();}
@After(marker=BodyMarker.class)static void onMethodExit() {
System.out.println("Method duration " + (System.nanoTime() - entryTime));}
}
Figure 2: Passing data between snippets using a synthetic local variable
method, and bytecode region can be obtained through dedicated static con-text interfaces. In this case, we are interested in the MethodStaticContextinterface, which provides the method name, signature, modifiers and otherstatic data about the intercepted method and its enclosing class. Figure 3refines the after snippet of Figure 2 to access the fully qualified name of theinstrumented method.
@After(marker=BodyMarker.class)static void onMethodExit(MethodStaticContext msc) {
System.out.println(msc.thisMethodFullName() + " duration "+ (System.nanoTime() - entryTime));
}
Figure 3: Accessing the method name through static context
Static context interfaces provide information that is already available atthe instrumentation time. When inlining the snippets, DiSL therefore re-places the calls to these interfaces with the corresponding static context in-formation, thus improving the efficiency of the resulting tools.
DiSL provides a set of static context interfaces, which can be declared asarguments to the snippets in any order. The default set of available interfaceswas mainly designed to make DiSL immediately useful to instrumentationdevelopers using AspectJ and ASM. The method static context provides
64
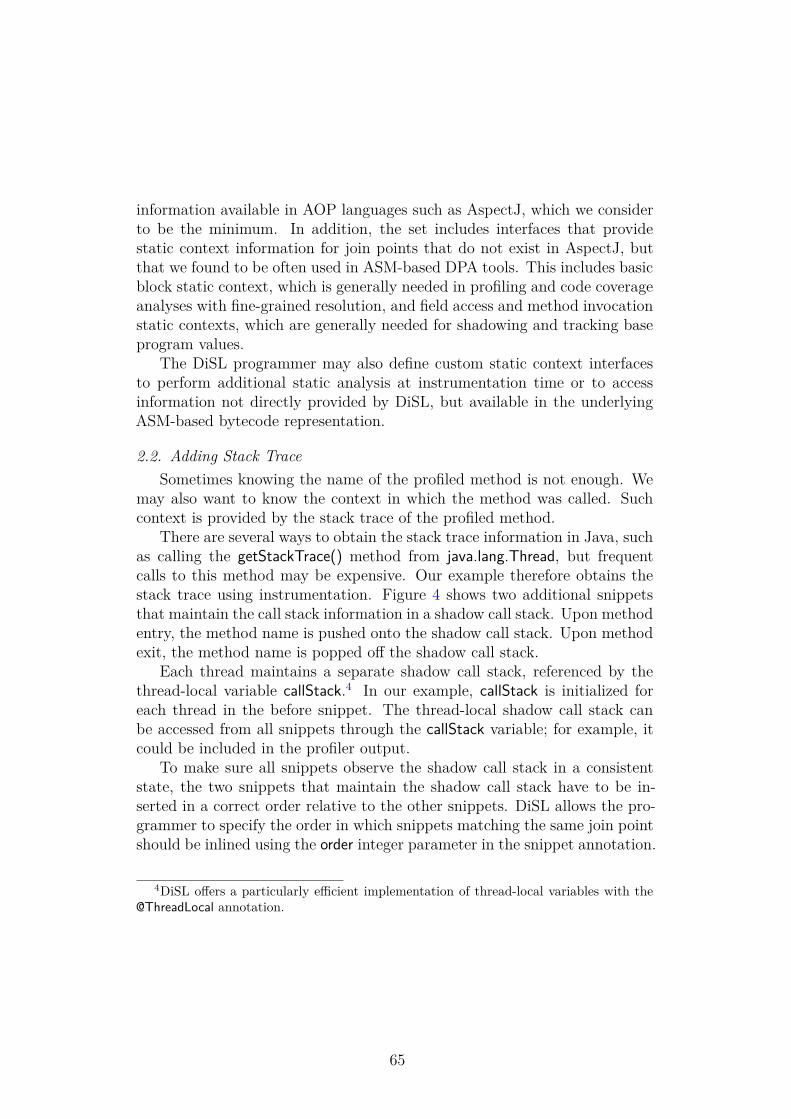
information available in AOP languages such as AspectJ, which we considerto be the minimum. In addition, the set includes interfaces that providestatic context information for join points that do not exist in AspectJ, butthat we found to be often used in ASM-based DPA tools. This includes basicblock static context, which is generally needed in profiling and code coverageanalyses with fine-grained resolution, and field access and method invocationstatic contexts, which are generally needed for shadowing and tracking baseprogram values.
The DiSL programmer may also define custom static context interfacesto perform additional static analysis at instrumentation time or to accessinformation not directly provided by DiSL, but available in the underlyingASM-based bytecode representation.
2.2. Adding Stack TraceSometimes knowing the name of the profiled method is not enough. We
may also want to know the context in which the method was called. Suchcontext is provided by the stack trace of the profiled method.
There are several ways to obtain the stack trace information in Java, suchas calling the getStackTrace() method from java.lang.Thread, but frequentcalls to this method may be expensive. Our example therefore obtains thestack trace using instrumentation. Figure 4 shows two additional snippetsthat maintain the call stack information in a shadow call stack. Upon methodentry, the method name is pushed onto the shadow call stack. Upon methodexit, the method name is popped off the shadow call stack.
Each thread maintains a separate shadow call stack, referenced by thethread-local variable callStack.4 In our example, callStack is initialized foreach thread in the before snippet. The thread-local shadow call stack canbe accessed from all snippets through the callStack variable; for example, itcould be included in the profiler output.
To make sure all snippets observe the shadow call stack in a consistentstate, the two snippets that maintain the shadow call stack have to be in-serted in a correct order relative to the other snippets. DiSL allows the pro-grammer to specify the order in which snippets matching the same join pointshould be inlined using the order integer parameter in the snippet annotation.
4DiSL offers a particularly efficient implementation of thread-local variables with the@ThreadLocal annotation.
65
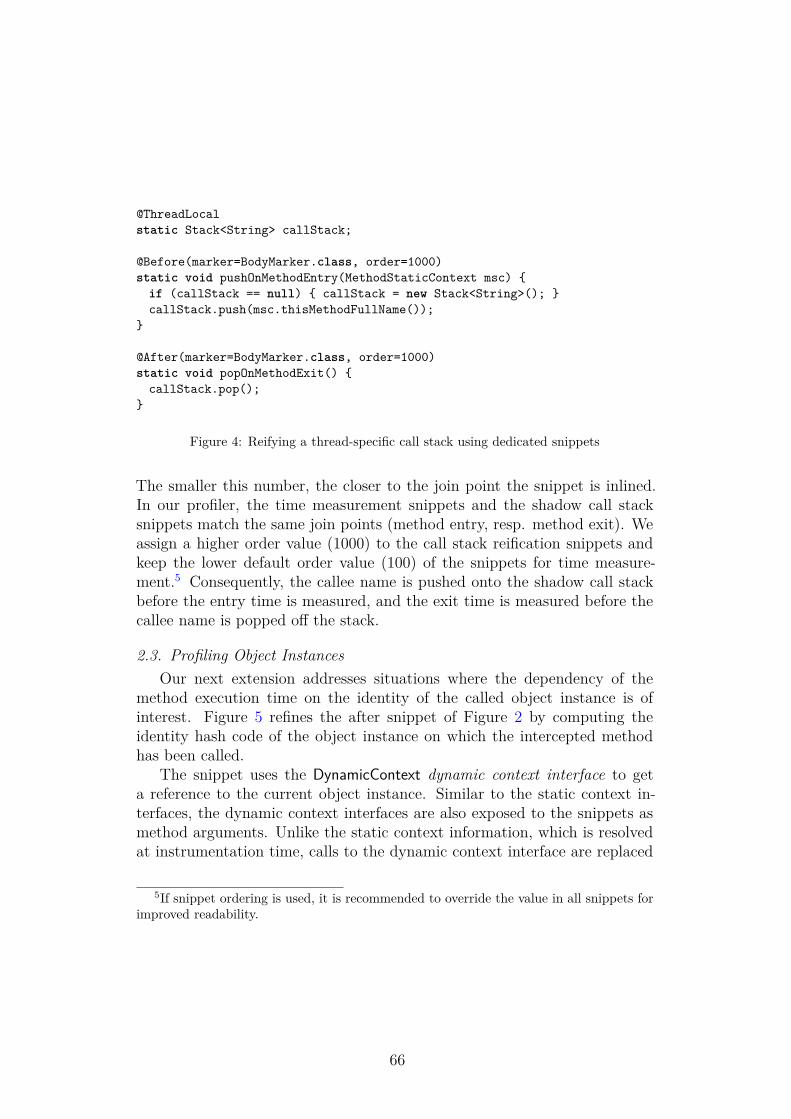
@ThreadLocalstatic Stack<String> callStack;
@Before(marker=BodyMarker.class, order=1000)static void pushOnMethodEntry(MethodStaticContext msc) {
if (callStack == null) { callStack = new Stack<String>(); }callStack.push(msc.thisMethodFullName());
}
@After(marker=BodyMarker.class, order=1000)static void popOnMethodExit() {
callStack.pop();}
Figure 4: Reifying a thread-specific call stack using dedicated snippets
The smaller this number, the closer to the join point the snippet is inlined.In our profiler, the time measurement snippets and the shadow call stacksnippets match the same join points (method entry, resp. method exit). Weassign a higher order value (1000) to the call stack reification snippets andkeep the lower default order value (100) of the snippets for time measure-ment.5 Consequently, the callee name is pushed onto the shadow call stackbefore the entry time is measured, and the exit time is measured before thecallee name is popped off the stack.
2.3. Profiling Object InstancesOur next extension addresses situations where the dependency of the
method execution time on the identity of the called object instance is ofinterest. Figure 5 refines the after snippet of Figure 2 by computing theidentity hash code of the object instance on which the intercepted methodhas been called.
The snippet uses the DynamicContext dynamic context interface to geta reference to the current object instance. Similar to the static context in-terfaces, the dynamic context interfaces are also exposed to the snippets asmethod arguments. Unlike the static context information, which is resolvedat instrumentation time, calls to the dynamic context interface are replaced
5If snippet ordering is used, it is recommended to override the value in all snippets forimproved readability.
66
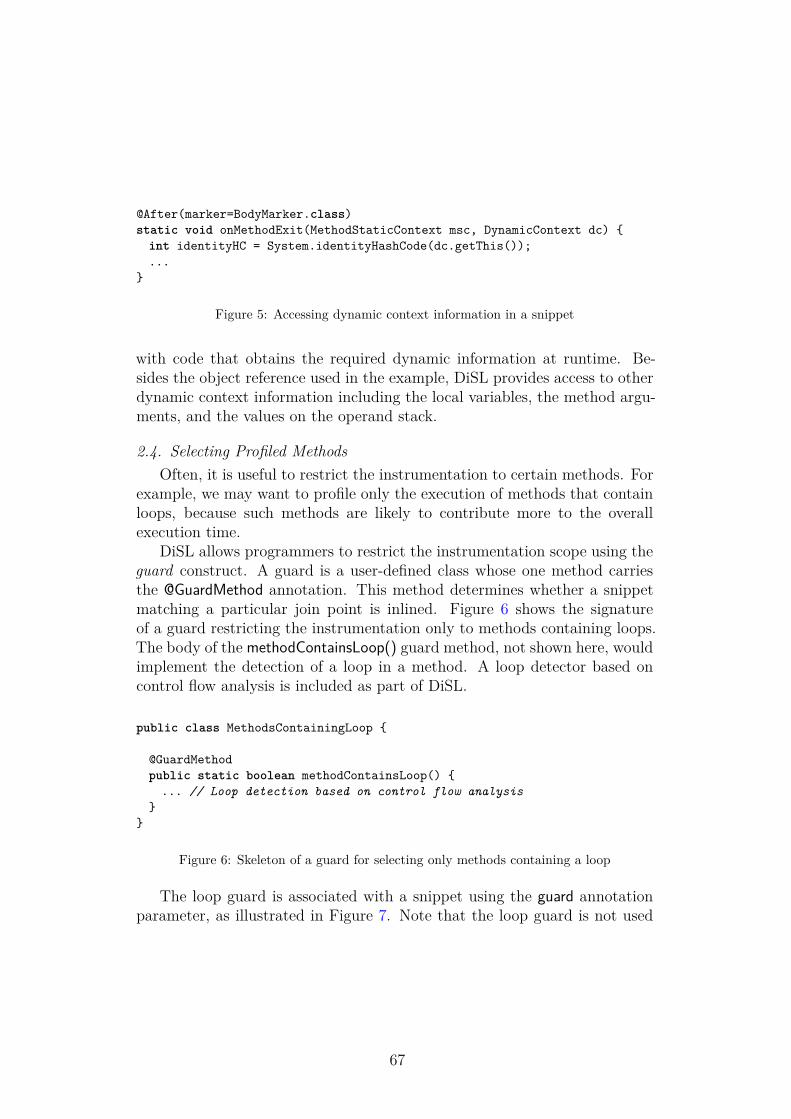
@After(marker=BodyMarker.class)static void onMethodExit(MethodStaticContext msc, DynamicContext dc) {
int identityHC = System.identityHashCode(dc.getThis());...
}
Figure 5: Accessing dynamic context information in a snippet
with code that obtains the required dynamic information at runtime. Be-sides the object reference used in the example, DiSL provides access to otherdynamic context information including the local variables, the method argu-ments, and the values on the operand stack.
2.4. Selecting Profiled MethodsOften, it is useful to restrict the instrumentation to certain methods. For
example, we may want to profile only the execution of methods that containloops, because such methods are likely to contribute more to the overallexecution time.
DiSL allows programmers to restrict the instrumentation scope using theguard construct. A guard is a user-defined class whose one method carriesthe @GuardMethod annotation. This method determines whether a snippetmatching a particular join point is inlined. Figure 6 shows the signatureof a guard restricting the instrumentation only to methods containing loops.The body of the methodContainsLoop() guard method, not shown here, wouldimplement the detection of a loop in a method. A loop detector based oncontrol flow analysis is included as part of DiSL.
public class MethodsContainingLoop {
@GuardMethodpublic static boolean methodContainsLoop() {
... // Loop detection based on control flow analysis}
}
Figure 6: Skeleton of a guard for selecting only methods containing a loop
The loop guard is associated with a snippet using the guard annotationparameter, as illustrated in Figure 7. Note that the loop guard is not used
67
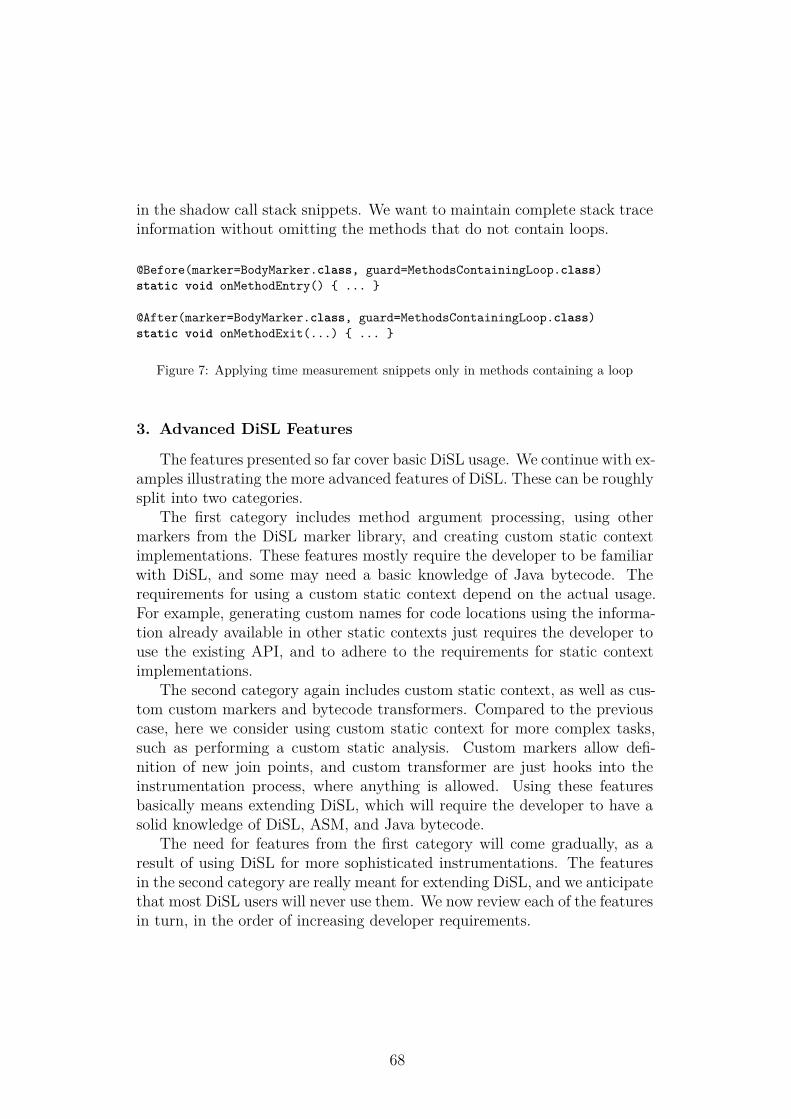
in the shadow call stack snippets. We want to maintain complete stack traceinformation without omitting the methods that do not contain loops.
@Before(marker=BodyMarker.class, guard=MethodsContainingLoop.class)static void onMethodEntry() { ... }
@After(marker=BodyMarker.class, guard=MethodsContainingLoop.class)static void onMethodExit(...) { ... }
Figure 7: Applying time measurement snippets only in methods containing a loop
3. Advanced DiSL Features
The features presented so far cover basic DiSL usage. We continue with ex-amples illustrating the more advanced features of DiSL. These can be roughlysplit into two categories.
The first category includes method argument processing, using othermarkers from the DiSL marker library, and creating custom static contextimplementations. These features mostly require the developer to be familiarwith DiSL, and some may need a basic knowledge of Java bytecode. Therequirements for using a custom static context depend on the actual usage.For example, generating custom names for code locations using the informa-tion already available in other static contexts just requires the developer touse the existing API, and to adhere to the requirements for static contextimplementations.
The second category again includes custom static context, as well as cus-tom custom markers and bytecode transformers. Compared to the previouscase, here we consider using custom static context for more complex tasks,such as performing a custom static analysis. Custom markers allow defi-nition of new join points, and custom transformer are just hooks into theinstrumentation process, where anything is allowed. Using these featuresbasically means extending DiSL, which will require the developer to have asolid knowledge of DiSL, ASM, and Java bytecode.
The need for features from the first category will come gradually, as aresult of using DiSL for more sophisticated instrumentations. The featuresin the second category are really meant for extending DiSL, and we anticipatethat most DiSL users will never use them. We now review each of the featuresin turn, in the order of increasing developer requirements.
68
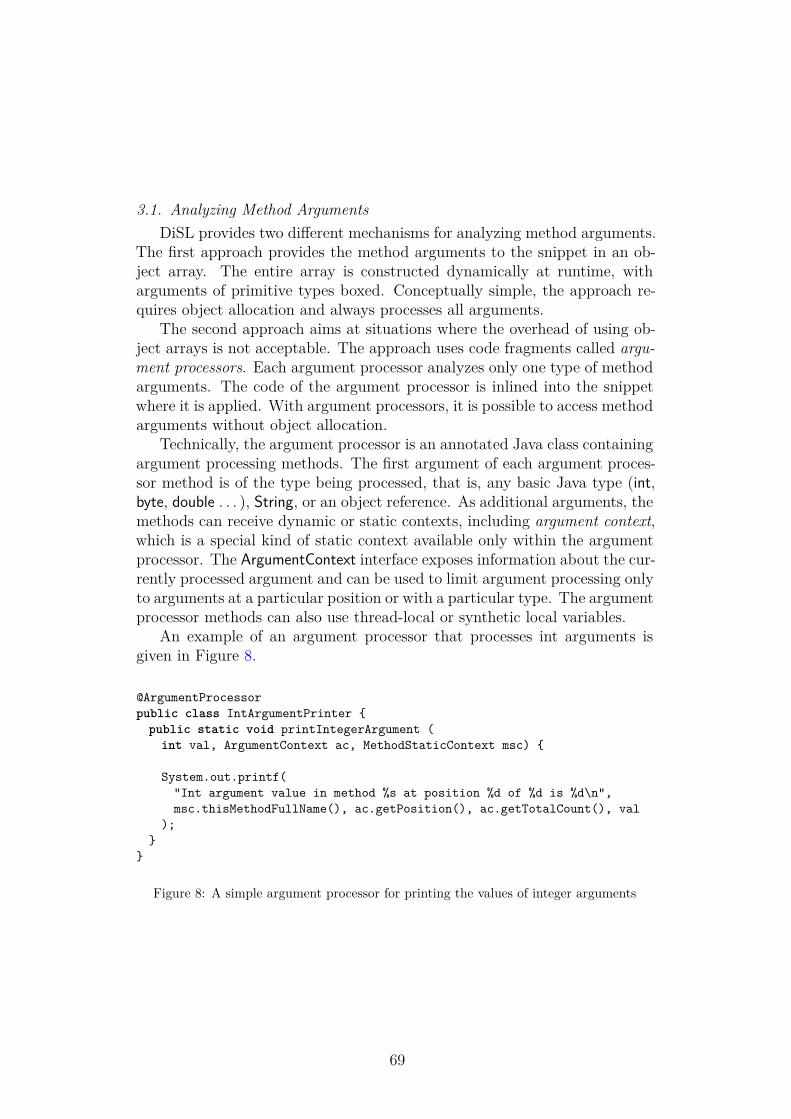
3.1. Analyzing Method ArgumentsDiSL provides two different mechanisms for analyzing method arguments.
The first approach provides the method arguments to the snippet in an ob-ject array. The entire array is constructed dynamically at runtime, witharguments of primitive types boxed. Conceptually simple, the approach re-quires object allocation and always processes all arguments.
The second approach aims at situations where the overhead of using ob-ject arrays is not acceptable. The approach uses code fragments called argu-ment processors. Each argument processor analyzes only one type of methodarguments. The code of the argument processor is inlined into the snippetwhere it is applied. With argument processors, it is possible to access methodarguments without object allocation.
Technically, the argument processor is an annotated Java class containingargument processing methods. The first argument of each argument proces-sor method is of the type being processed, that is, any basic Java type (int,byte, double . . . ), String, or an object reference. As additional arguments, themethods can receive dynamic or static contexts, including argument context,which is a special kind of static context available only within the argumentprocessor. The ArgumentContext interface exposes information about the cur-rently processed argument and can be used to limit argument processing onlyto arguments at a particular position or with a particular type. The argumentprocessor methods can also use thread-local or synthetic local variables.
An example of an argument processor that processes int arguments isgiven in Figure 8.
@ArgumentProcessorpublic class IntArgumentPrinter {
public static void printIntegerArgument (int val, ArgumentContext ac, MethodStaticContext msc) {
System.out.printf("Int argument value in method %s at position %d of %d is %d\n",msc.thisMethodFullName(), ac.getPosition(), ac.getTotalCount(), val
);}
}
Figure 8: A simple argument processor for printing the values of integer arguments
69
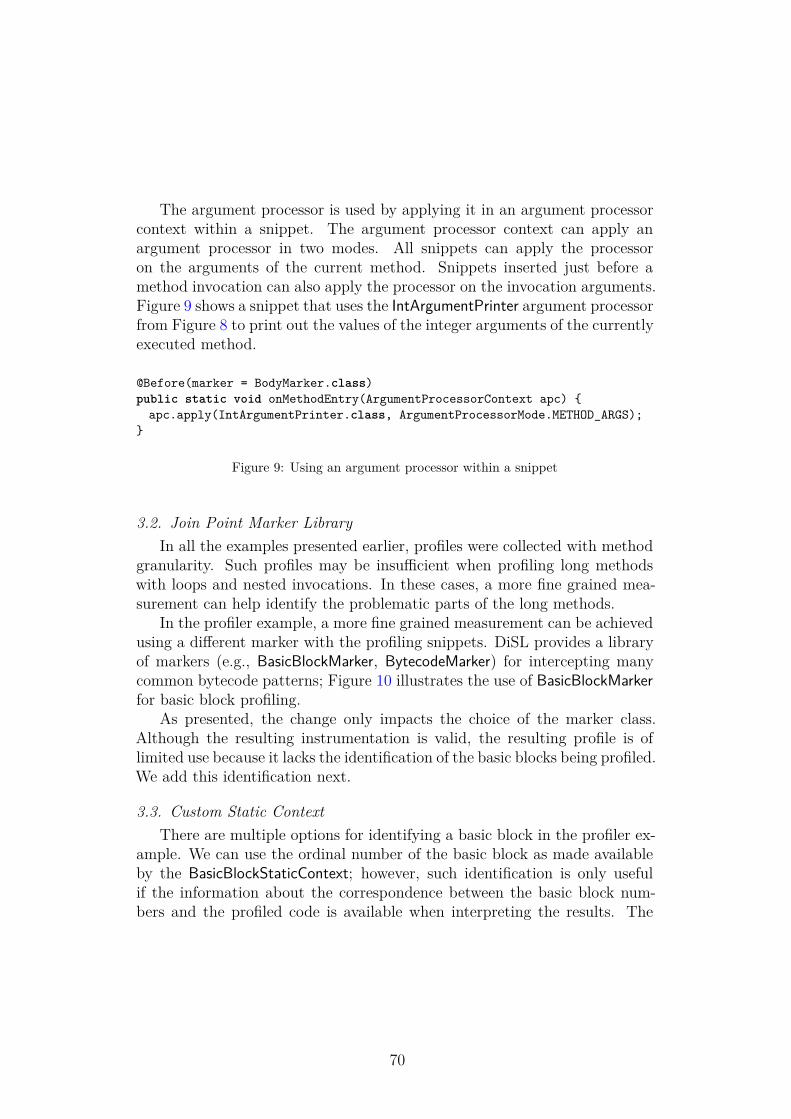
The argument processor is used by applying it in an argument processorcontext within a snippet. The argument processor context can apply anargument processor in two modes. All snippets can apply the processoron the arguments of the current method. Snippets inserted just before amethod invocation can also apply the processor on the invocation arguments.Figure 9 shows a snippet that uses the IntArgumentPrinter argument processorfrom Figure 8 to print out the values of the integer arguments of the currentlyexecuted method.
@Before(marker = BodyMarker.class)public static void onMethodEntry(ArgumentProcessorContext apc) {
apc.apply(IntArgumentPrinter.class, ArgumentProcessorMode.METHOD_ARGS);}
Figure 9: Using an argument processor within a snippet
3.2. Join Point Marker LibraryIn all the examples presented earlier, profiles were collected with method
granularity. Such profiles may be insufficient when profiling long methodswith loops and nested invocations. In these cases, a more fine grained mea-surement can help identify the problematic parts of the long methods.
In the profiler example, a more fine grained measurement can be achievedusing a different marker with the profiling snippets. DiSL provides a libraryof markers (e.g., BasicBlockMarker, BytecodeMarker) for intercepting manycommon bytecode patterns; Figure 10 illustrates the use of BasicBlockMarkerfor basic block profiling.
As presented, the change only impacts the choice of the marker class.Although the resulting instrumentation is valid, the resulting profile is oflimited use because it lacks the identification of the basic blocks being profiled.We add this identification next.
3.3. Custom Static ContextThere are multiple options for identifying a basic block in the profiler ex-
ample. We can use the ordinal number of the basic block as made availableby the BasicBlockStaticContext; however, such identification is only usefulif the information about the correspondence between the basic block num-bers and the profiled code is available when interpreting the results. The
70
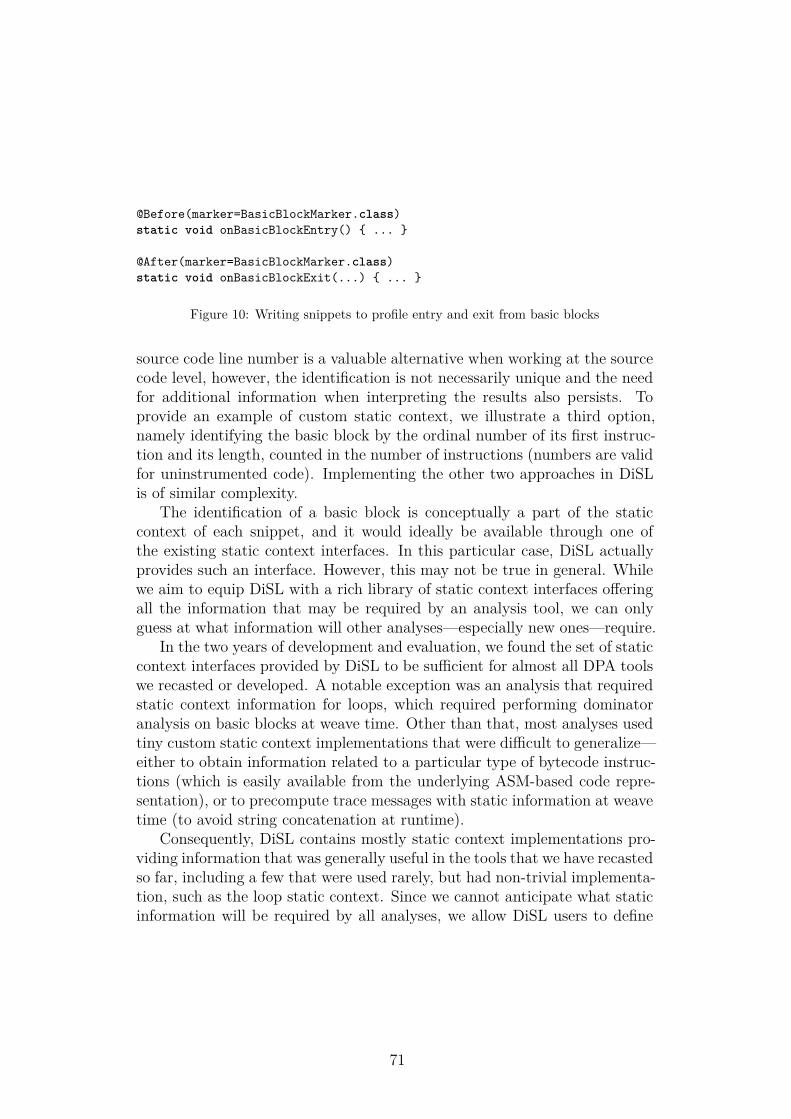
@Before(marker=BasicBlockMarker.class)static void onBasicBlockEntry() { ... }
@After(marker=BasicBlockMarker.class)static void onBasicBlockExit(...) { ... }
Figure 10: Writing snippets to profile entry and exit from basic blocks
source code line number is a valuable alternative when working at the sourcecode level, however, the identification is not necessarily unique and the needfor additional information when interpreting the results also persists. Toprovide an example of custom static context, we illustrate a third option,namely identifying the basic block by the ordinal number of its first instruc-tion and its length, counted in the number of instructions (numbers are validfor uninstrumented code). Implementing the other two approaches in DiSLis of similar complexity.
The identification of a basic block is conceptually a part of the staticcontext of each snippet, and it would ideally be available through one ofthe existing static context interfaces. In this particular case, DiSL actuallyprovides such an interface. However, this may not be true in general. Whilewe aim to equip DiSL with a rich library of static context interfaces offeringall the information that may be required by an analysis tool, we can onlyguess at what information will other analyses—especially new ones—require.
In the two years of development and evaluation, we found the set of staticcontext interfaces provided by DiSL to be sufficient for almost all DPA toolswe recasted or developed. A notable exception was an analysis that requiredstatic context information for loops, which required performing dominatoranalysis on basic blocks at weave time. Other than that, most analyses usedtiny custom static context implementations that were difficult to generalize—either to obtain information related to a particular type of bytecode instruc-tions (which is easily available from the underlying ASM-based code repre-sentation), or to precompute trace messages with static information at weavetime (to avoid string concatenation at runtime).
Consequently, DiSL contains mostly static context implementations pro-viding information that was generally useful in the tools that we have recastedso far, including a few that were used rarely, but had non-trivial implementa-tion, such as the loop static context. Since we cannot anticipate what staticinformation will be required by all analyses, we allow DiSL users to define
71
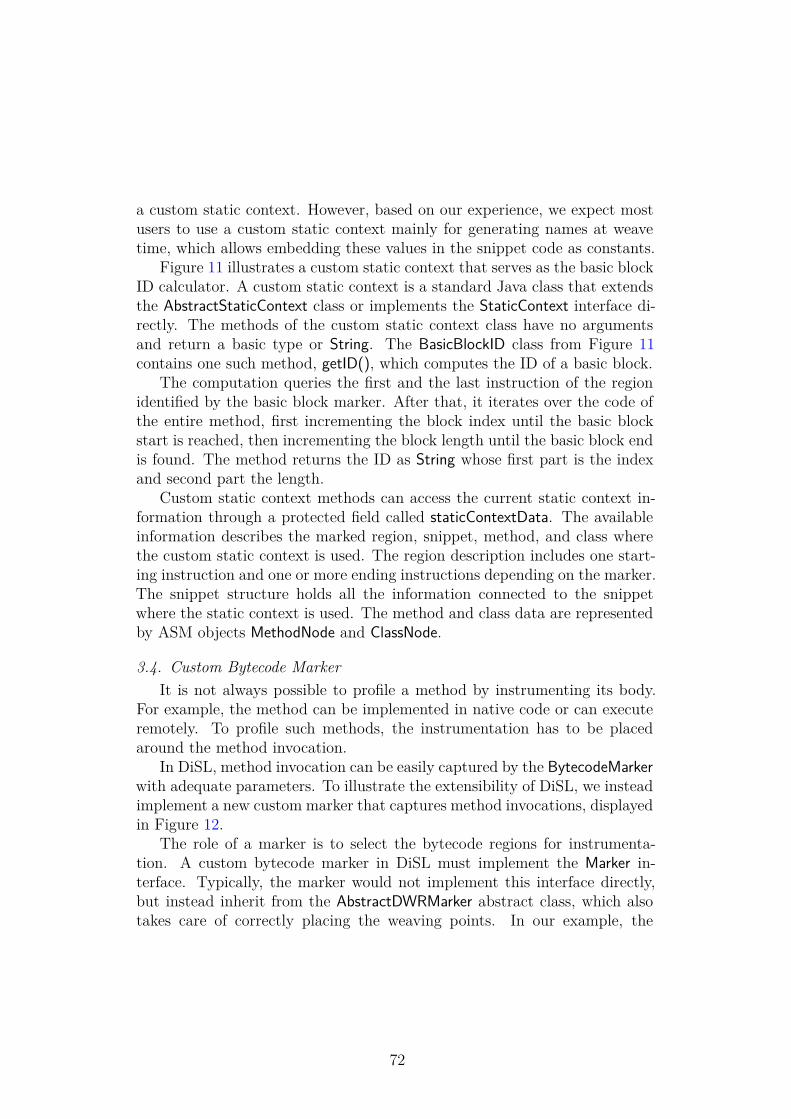
a custom static context. However, based on our experience, we expect mostusers to use a custom static context mainly for generating names at weavetime, which allows embedding these values in the snippet code as constants.
Figure 11 illustrates a custom static context that serves as the basic blockID calculator. A custom static context is a standard Java class that extendsthe AbstractStaticContext class or implements the StaticContext interface di-rectly. The methods of the custom static context class have no argumentsand return a basic type or String. The BasicBlockID class from Figure 11contains one such method, getID(), which computes the ID of a basic block.
The computation queries the first and the last instruction of the regionidentified by the basic block marker. After that, it iterates over the code ofthe entire method, first incrementing the block index until the basic blockstart is reached, then incrementing the block length until the basic block endis found. The method returns the ID as String whose first part is the indexand second part the length.
Custom static context methods can access the current static context in-formation through a protected field called staticContextData. The availableinformation describes the marked region, snippet, method, and class wherethe custom static context is used. The region description includes one start-ing instruction and one or more ending instructions depending on the marker.The snippet structure holds all the information connected to the snippetwhere the static context is used. The method and class data are representedby ASM objects MethodNode and ClassNode.
3.4. Custom Bytecode MarkerIt is not always possible to profile a method by instrumenting its body.
For example, the method can be implemented in native code or can executeremotely. To profile such methods, the instrumentation has to be placedaround the method invocation.
In DiSL, method invocation can be easily captured by the BytecodeMarkerwith adequate parameters. To illustrate the extensibility of DiSL, we insteadimplement a new custom marker that captures method invocations, displayedin Figure 12.
The role of a marker is to select the bytecode regions for instrumenta-tion. A custom bytecode marker in DiSL must implement the Marker in-terface. Typically, the marker would not implement this interface directly,but instead inherit from the AbstractDWRMarker abstract class, which alsotakes care of correctly placing the weaving points. In our example, the
72
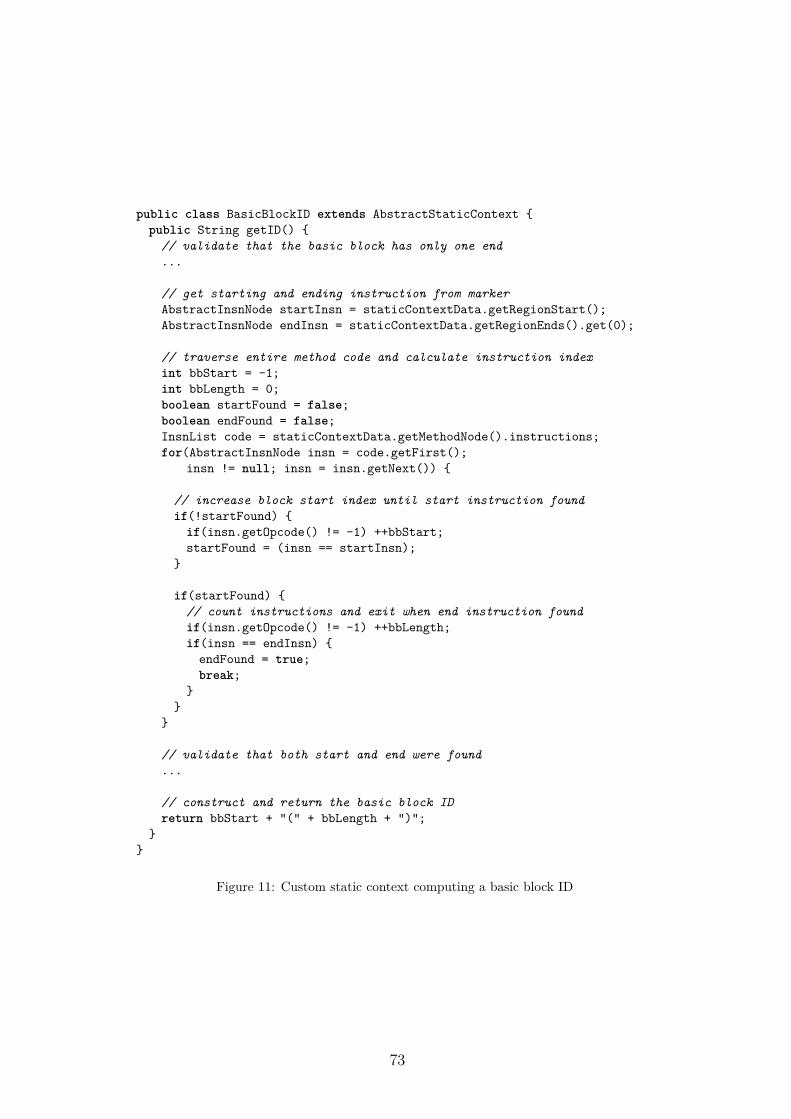
public class BasicBlockID extends AbstractStaticContext {public String getID() {
// validate that the basic block has only one end...
// get starting and ending instruction from markerAbstractInsnNode startInsn = staticContextData.getRegionStart();AbstractInsnNode endInsn = staticContextData.getRegionEnds().get(0);
// traverse entire method code and calculate instruction indexint bbStart = -1;int bbLength = 0;boolean startFound = false;boolean endFound = false;InsnList code = staticContextData.getMethodNode().instructions;for(AbstractInsnNode insn = code.getFirst();
insn != null; insn = insn.getNext()) {
// increase block start index until start instruction foundif(!startFound) {
if(insn.getOpcode() != -1) ++bbStart;startFound = (insn == startInsn);
}
if(startFound) {// count instructions and exit when end instruction foundif(insn.getOpcode() != -1) ++bbLength;if(insn == endInsn) {
endFound = true;break;
}}
}
// validate that both start and end were found...
// construct and return the basic block IDreturn bbStart + "(" + bbLength + ")";
}}
Figure 11: Custom static context computing a basic block ID
73
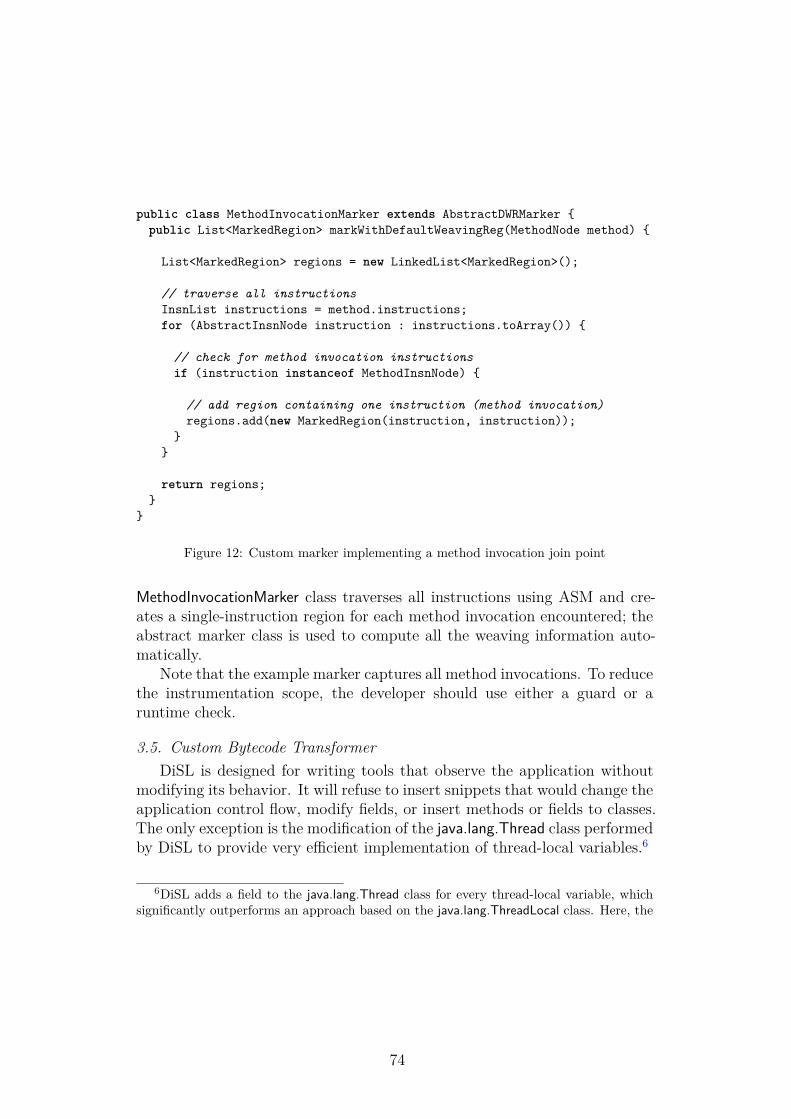
public class MethodInvocationMarker extends AbstractDWRMarker {public List<MarkedRegion> markWithDefaultWeavingReg(MethodNode method) {
List<MarkedRegion> regions = new LinkedList<MarkedRegion>();
// traverse all instructionsInsnList instructions = method.instructions;for (AbstractInsnNode instruction : instructions.toArray()) {
// check for method invocation instructionsif (instruction instanceof MethodInsnNode) {
// add region containing one instruction (method invocation)regions.add(new MarkedRegion(instruction, instruction));
}}
return regions;}
}
Figure 12: Custom marker implementing a method invocation join point
MethodInvocationMarker class traverses all instructions using ASM and cre-ates a single-instruction region for each method invocation encountered; theabstract marker class is used to compute all the weaving information auto-matically.
Note that the example marker captures all method invocations. To reducethe instrumentation scope, the developer should use either a guard or aruntime check.
3.5. Custom Bytecode TransformerDiSL is designed for writing tools that observe the application without
modifying its behavior. It will refuse to insert snippets that would change theapplication control flow, modify fields, or insert methods or fields to classes.The only exception is the modification of the java.lang.Thread class performedby DiSL to provide very efficient implementation of thread-local variables.6
6DiSL adds a field to the java.lang.Thread class for every thread-local variable, whichsignificantly outperforms an approach based on the java.lang.ThreadLocal class. Here, the
74
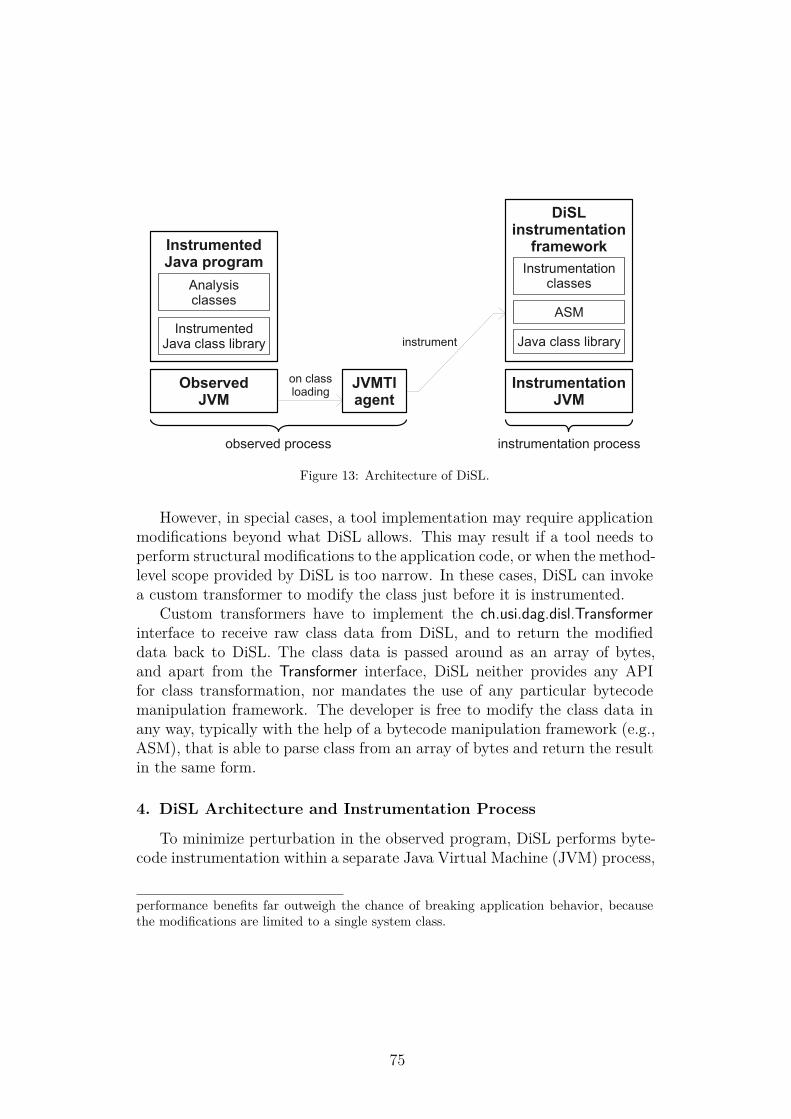
� �
��������
�� ��������
�������������
���� ����
� ������������������
����� �����������������������
��������������
���������������� ���� ����������������
� ����������
����� ����������������
�����������������
���
����� ���������������
Figure 13: Architecture of DiSL.
However, in special cases, a tool implementation may require applicationmodifications beyond what DiSL allows. This may result if a tool needs toperform structural modifications to the application code, or when the method-level scope provided by DiSL is too narrow. In these cases, DiSL can invokea custom transformer to modify the class just before it is instrumented.
Custom transformers have to implement the ch.usi.dag.disl.Transformerinterface to receive raw class data from DiSL, and to return the modifieddata back to DiSL. The class data is passed around as an array of bytes,and apart from the Transformer interface, DiSL neither provides any APIfor class transformation, nor mandates the use of any particular bytecodemanipulation framework. The developer is free to modify the class data inany way, typically with the help of a bytecode manipulation framework (e.g.,ASM), that is able to parse class from an array of bytes and return the resultin the same form.
4. DiSL Architecture and Instrumentation Process
To minimize perturbation in the observed program, DiSL performs byte-code instrumentation within a separate Java Virtual Machine (JVM) process,
performance benefits far outweigh the chance of breaking application behavior, becausethe modifications are limited to a single system class.
75
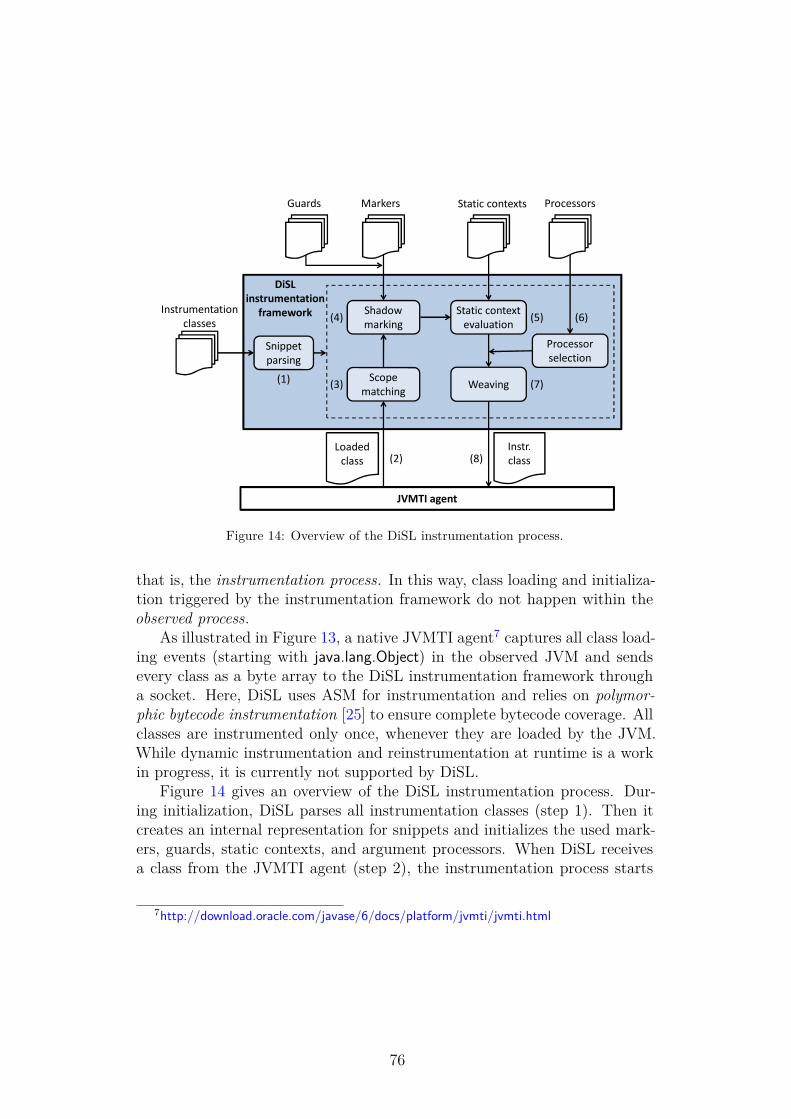
������� ��������� ��
���������
������
����
�������
������
����
����
�������
��������� �
����������
������
�������
�������
�������
�� �
���������
���������
���
������
� � �!�
�"�
�#�
$�������
��������
���������������
������
$��������%�����
�&�
Figure 14: Overview of the DiSL instrumentation process.
that is, the instrumentation process. In this way, class loading and initializa-tion triggered by the instrumentation framework do not happen within theobserved process.
As illustrated in Figure 13, a native JVMTI agent7 captures all class load-ing events (starting with java.lang.Object) in the observed JVM and sendsevery class as a byte array to the DiSL instrumentation framework througha socket. Here, DiSL uses ASM for instrumentation and relies on polymor-phic bytecode instrumentation [25] to ensure complete bytecode coverage. Allclasses are instrumented only once, whenever they are loaded by the JVM.While dynamic instrumentation and reinstrumentation at runtime is a workin progress, it is currently not supported by DiSL.
Figure 14 gives an overview of the DiSL instrumentation process. Dur-ing initialization, DiSL parses all instrumentation classes (step 1). Then itcreates an internal representation for snippets and initializes the used mark-ers, guards, static contexts, and argument processors. When DiSL receivesa class from the JVMTI agent (step 2), the instrumentation process starts
7http://download.oracle.com/javase/6/docs/platform/jvmti/jvmti.html
76
with the snippet selection. The selection is done in three phases, startingwith scope matching (step 3). Then, bytecode regions are marked using themarkers associated with the snippets selected in the previous phase. Finally,marked bytecode regions are evaluated by guards and only snippets with atleast one valid marked region are selected (step 4).
At this point, all snippets that will be used for instrumentation are known.Static contexts are used to compute the static information required by snip-pets (step 5). As described in Section 3, custom static contexts allow pro-grammers to declare expressions to be evaluated at instrumentation time.However, if such expressions do not require custom context information, theycan simply be embedded in the snippet code. In fact, DiSL can be config-ured to perform partial evaluation of inlined snippets [23]. This optimizationcan simplify certain snippet constructs, for example it can make conditionalbranching on static information in the snippet as efficient as using a guard.
Argument processors are evaluated for snippets, and argument processormethods that match method arguments are selected (step 6). All the col-lected information is finally used for instrumentation (step 7). Argumentprocessors are applied, and calls to static contexts are replaced with the com-puted static information. The framework also generates the bytecodes toaccess dynamic context information. To prevent the instrumentation codefrom throwing exceptions that could modify the control flow in the observedprogram, DiSL automatically inserts code intercepting all exceptions origi-nating from the snippets, reporting an error if an exception is thrown (andnot handled) by the instrumentation. Finally, the instrumented class is re-turned to the observed JVM (step 8) where it is linked. For a more detaileddescription of the process, we refer the interested reader to [22].
5. Case Studies
To demonstrate the benefits of DiSL when developing instrumentation forDPA tools, we present several case studies involving existing DPA tools. Theinstrumentation parts of those tools were originally implemented either usingAspectJ, or the ASM bytecode manipulation library. For evaluation purposes,we reimplemented the instrumentation part of each tool using DiSL and com-pared both the conciseness and the performance of the DiSL-based instru-mentation with the original implementation. We first give a short overviewof the recasted tools, and then proceed with the evaluation.
77
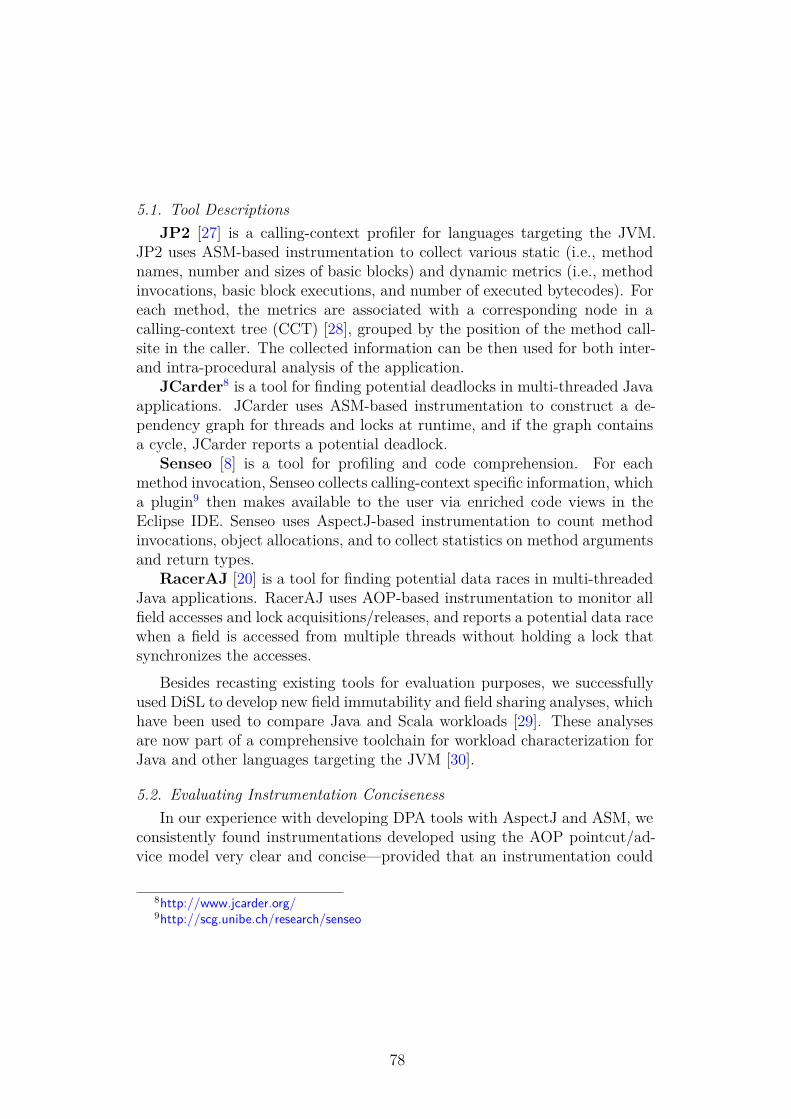
5.1. Tool DescriptionsJP2 [27] is a calling-context profiler for languages targeting the JVM.
JP2 uses ASM-based instrumentation to collect various static (i.e., methodnames, number and sizes of basic blocks) and dynamic metrics (i.e., methodinvocations, basic block executions, and number of executed bytecodes). Foreach method, the metrics are associated with a corresponding node in acalling-context tree (CCT) [28], grouped by the position of the method call-site in the caller. The collected information can be then used for both inter-and intra-procedural analysis of the application.
JCarder8 is a tool for finding potential deadlocks in multi-threaded Javaapplications. JCarder uses ASM-based instrumentation to construct a de-pendency graph for threads and locks at runtime, and if the graph containsa cycle, JCarder reports a potential deadlock.
Senseo [8] is a tool for profiling and code comprehension. For eachmethod invocation, Senseo collects calling-context specific information, whicha plugin9 then makes available to the user via enriched code views in theEclipse IDE. Senseo uses AspectJ-based instrumentation to count methodinvocations, object allocations, and to collect statistics on method argumentsand return types.
RacerAJ [20] is a tool for finding potential data races in multi-threadedJava applications. RacerAJ uses AOP-based instrumentation to monitor allfield accesses and lock acquisitions/releases, and reports a potential data racewhen a field is accessed from multiple threads without holding a lock thatsynchronizes the accesses.
Besides recasting existing tools for evaluation purposes, we successfullyused DiSL to develop new field immutability and field sharing analyses, whichhave been used to compare Java and Scala workloads [29]. These analysesare now part of a comprehensive toolchain for workload characterization forJava and other languages targeting the JVM [30].
5.2. Evaluating Instrumentation ConcisenessIn our experience with developing DPA tools with AspectJ and ASM, we
consistently found instrumentations developed using the AOP pointcut/ad-vice model very clear and concise—provided that an instrumentation could
8http://www.jcarder.org/9http://scg.unibe.ch/research/senseo
78
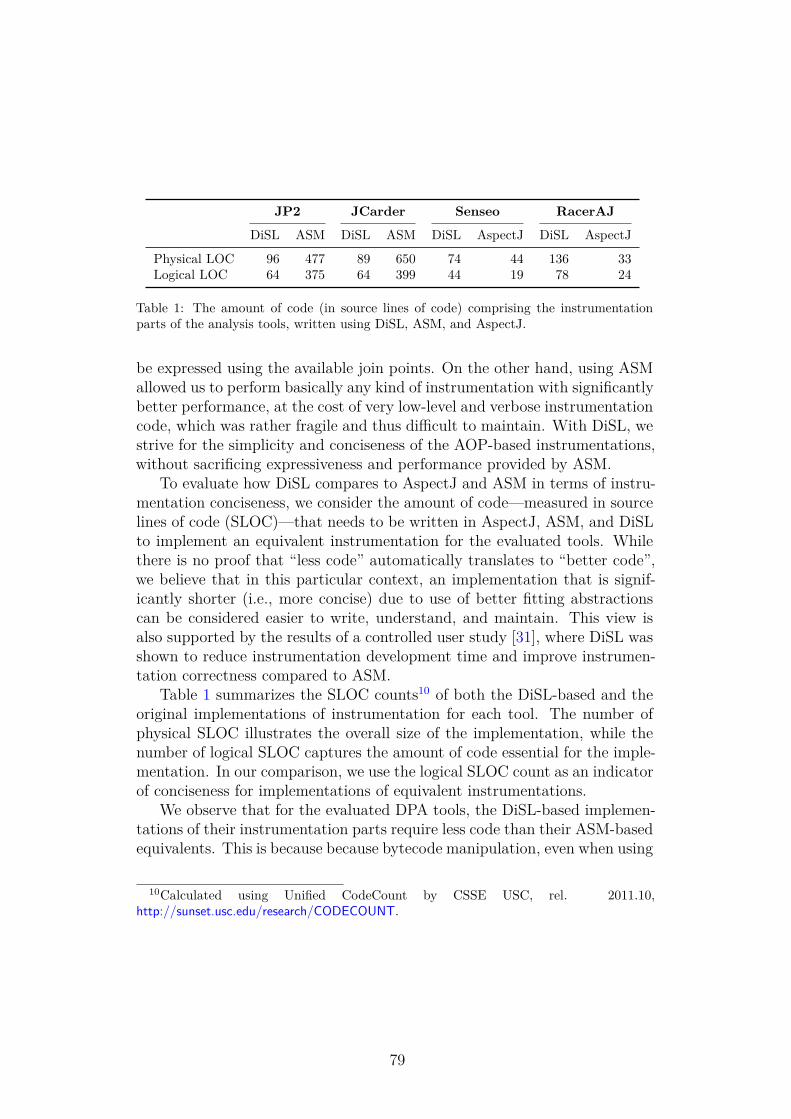
JP2 JCarder Senseo RacerAJDiSL ASM DiSL ASM DiSL AspectJ DiSL AspectJ
Physical LOC 96 477 89 650 74 44 136 33Logical LOC 64 375 64 399 44 19 78 24
Table 1: The amount of code (in source lines of code) comprising the instrumentationparts of the analysis tools, written using DiSL, ASM, and AspectJ.
be expressed using the available join points. On the other hand, using ASMallowed us to perform basically any kind of instrumentation with significantlybetter performance, at the cost of very low-level and verbose instrumentationcode, which was rather fragile and thus difficult to maintain. With DiSL, westrive for the simplicity and conciseness of the AOP-based instrumentations,without sacrificing expressiveness and performance provided by ASM.
To evaluate how DiSL compares to AspectJ and ASM in terms of instru-mentation conciseness, we consider the amount of code—measured in sourcelines of code (SLOC)—that needs to be written in AspectJ, ASM, and DiSLto implement an equivalent instrumentation for the evaluated tools. Whilethere is no proof that “less code” automatically translates to “better code”,we believe that in this particular context, an implementation that is signif-icantly shorter (i.e., more concise) due to use of better fitting abstractionscan be considered easier to write, understand, and maintain. This view isalso supported by the results of a controlled user study [31], where DiSL wasshown to reduce instrumentation development time and improve instrumen-tation correctness compared to ASM.
Table 1 summarizes the SLOC counts10 of both the DiSL-based and theoriginal implementations of instrumentation for each tool. The number ofphysical SLOC illustrates the overall size of the implementation, while thenumber of logical SLOC captures the amount of code essential for the imple-mentation. In our comparison, we use the logical SLOC count as an indicatorof conciseness for implementations of equivalent instrumentations.
We observe that for the evaluated DPA tools, the DiSL-based implemen-tations of their instrumentation parts require less code than their ASM-basedequivalents. This is because because bytecode manipulation, even when using
10Calculated using Unified CodeCount by CSSE USC, rel. 2011.10,http://sunset.usc.edu/research/CODECOUNT.
79
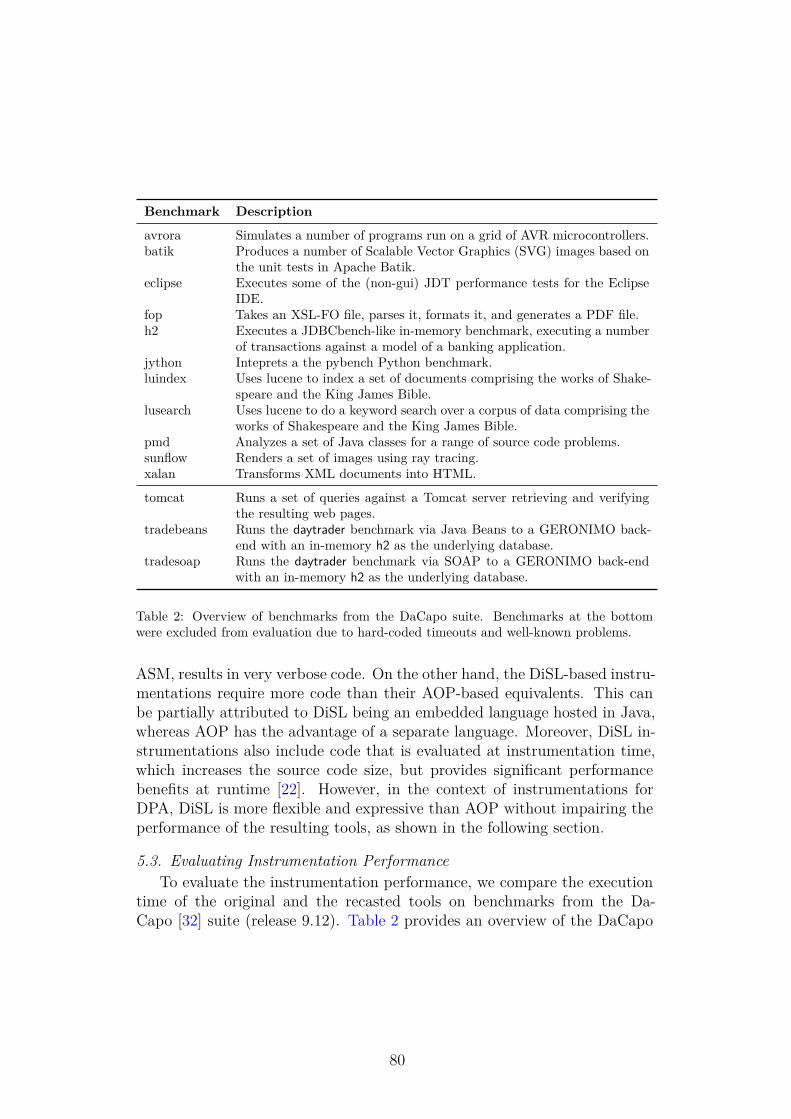
Benchmark Description
avrora Simulates a number of programs run on a grid of AVR microcontrollers.batik Produces a number of Scalable Vector Graphics (SVG) images based on
the unit tests in Apache Batik.eclipse Executes some of the (non-gui) JDT performance tests for the Eclipse
IDE.fop Takes an XSL-FO file, parses it, formats it, and generates a PDF file.h2 Executes a JDBCbench-like in-memory benchmark, executing a number
of transactions against a model of a banking application.jython Inteprets a the pybench Python benchmark.luindex Uses lucene to index a set of documents comprising the works of Shake-
speare and the King James Bible.lusearch Uses lucene to do a keyword search over a corpus of data comprising the
works of Shakespeare and the King James Bible.pmd Analyzes a set of Java classes for a range of source code problems.sunflow Renders a set of images using ray tracing.xalan Transforms XML documents into HTML.
tomcat Runs a set of queries against a Tomcat server retrieving and verifyingthe resulting web pages.
tradebeans Runs the daytrader benchmark via Java Beans to a GERONIMO back-end with an in-memory h2 as the underlying database.
tradesoap Runs the daytrader benchmark via SOAP to a GERONIMO back-endwith an in-memory h2 as the underlying database.
Table 2: Overview of benchmarks from the DaCapo suite. Benchmarks at the bottomwere excluded from evaluation due to hard-coded timeouts and well-known problems.
ASM, results in very verbose code. On the other hand, the DiSL-based instru-mentations require more code than their AOP-based equivalents. This canbe partially attributed to DiSL being an embedded language hosted in Java,whereas AOP has the advantage of a separate language. Moreover, DiSL in-strumentations also include code that is evaluated at instrumentation time,which increases the source code size, but provides significant performancebenefits at runtime [22]. However, in the context of instrumentations forDPA, DiSL is more flexible and expressive than AOP without impairing theperformance of the resulting tools, as shown in the following section.
5.3. Evaluating Instrumentation PerformanceTo evaluate the instrumentation performance, we compare the execution
time of the original and the recasted tools on benchmarks from the Da-Capo [32] suite (release 9.12). Table 2 provides an overview of the DaCapo
80
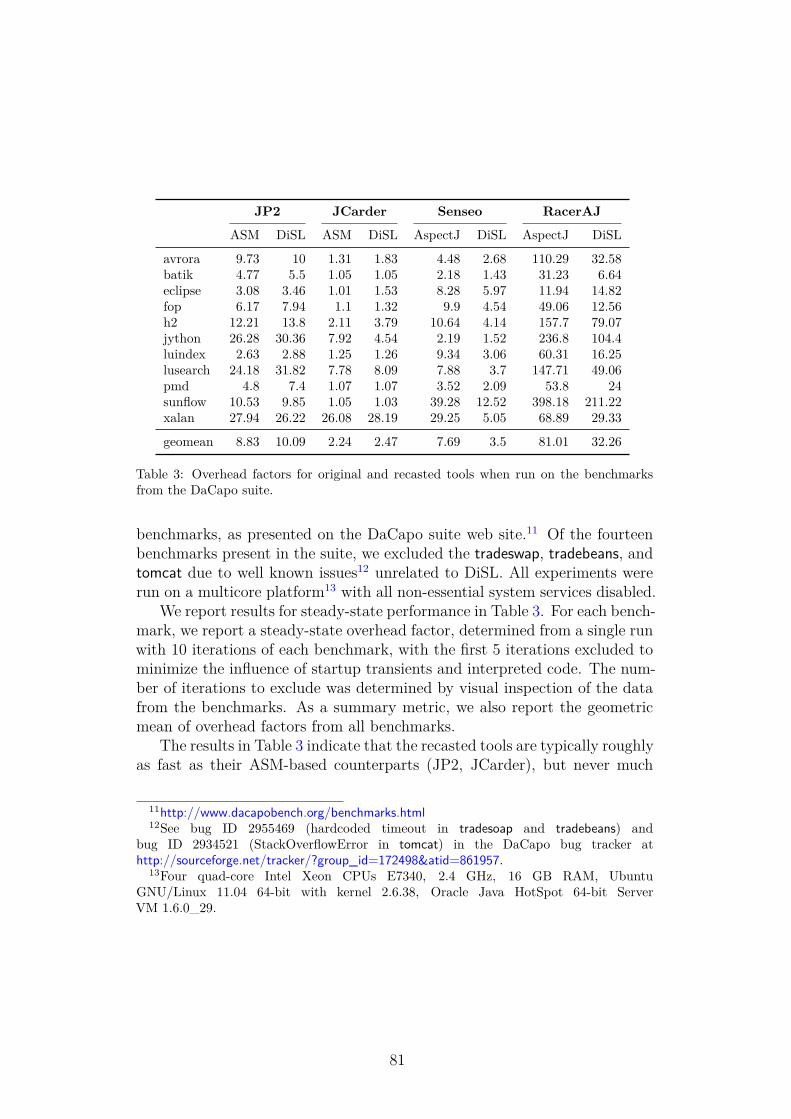
JP2 JCarder Senseo RacerAJASM DiSL ASM DiSL AspectJ DiSL AspectJ DiSL
avrora 9.73 10 1.31 1.83 4.48 2.68 110.29 32.58batik 4.77 5.5 1.05 1.05 2.18 1.43 31.23 6.64eclipse 3.08 3.46 1.01 1.53 8.28 5.97 11.94 14.82fop 6.17 7.94 1.1 1.32 9.9 4.54 49.06 12.56h2 12.21 13.8 2.11 3.79 10.64 4.14 157.7 79.07jython 26.28 30.36 7.92 4.54 2.19 1.52 236.8 104.4luindex 2.63 2.88 1.25 1.26 9.34 3.06 60.31 16.25lusearch 24.18 31.82 7.78 8.09 7.88 3.7 147.71 49.06pmd 4.8 7.4 1.07 1.07 3.52 2.09 53.8 24sunflow 10.53 9.85 1.05 1.03 39.28 12.52 398.18 211.22xalan 27.94 26.22 26.08 28.19 29.25 5.05 68.89 29.33
geomean 8.83 10.09 2.24 2.47 7.69 3.5 81.01 32.26
Table 3: Overhead factors for original and recasted tools when run on the benchmarksfrom the DaCapo suite.
benchmarks, as presented on the DaCapo suite web site.11 Of the fourteenbenchmarks present in the suite, we excluded the tradeswap, tradebeans, andtomcat due to well known issues12 unrelated to DiSL. All experiments wererun on a multicore platform13 with all non-essential system services disabled.
We report results for steady-state performance in Table 3. For each bench-mark, we report a steady-state overhead factor, determined from a single runwith 10 iterations of each benchmark, with the first 5 iterations excluded tominimize the influence of startup transients and interpreted code. The num-ber of iterations to exclude was determined by visual inspection of the datafrom the benchmarks. As a summary metric, we also report the geometricmean of overhead factors from all benchmarks.
The results in Table 3 indicate that the recasted tools are typically roughlyas fast as their ASM-based counterparts (JP2, JCarder), but never much
11http://www.dacapobench.org/benchmarks.html12See bug ID 2955469 (hardcoded timeout in tradesoap and tradebeans) and
bug ID 2934521 (StackOverflowError in tomcat) in the DaCapo bug tracker athttp://sourceforge.net/tracker/?group_id=172498&atid=861957.
13Four quad-core Intel Xeon CPUs E7340, 2.4 GHz, 16 GB RAM, UbuntuGNU/Linux 11.04 64-bit with kernel 2.6.38, Oracle Java HotSpot 64-bit ServerVM 1.6.0_29.
81
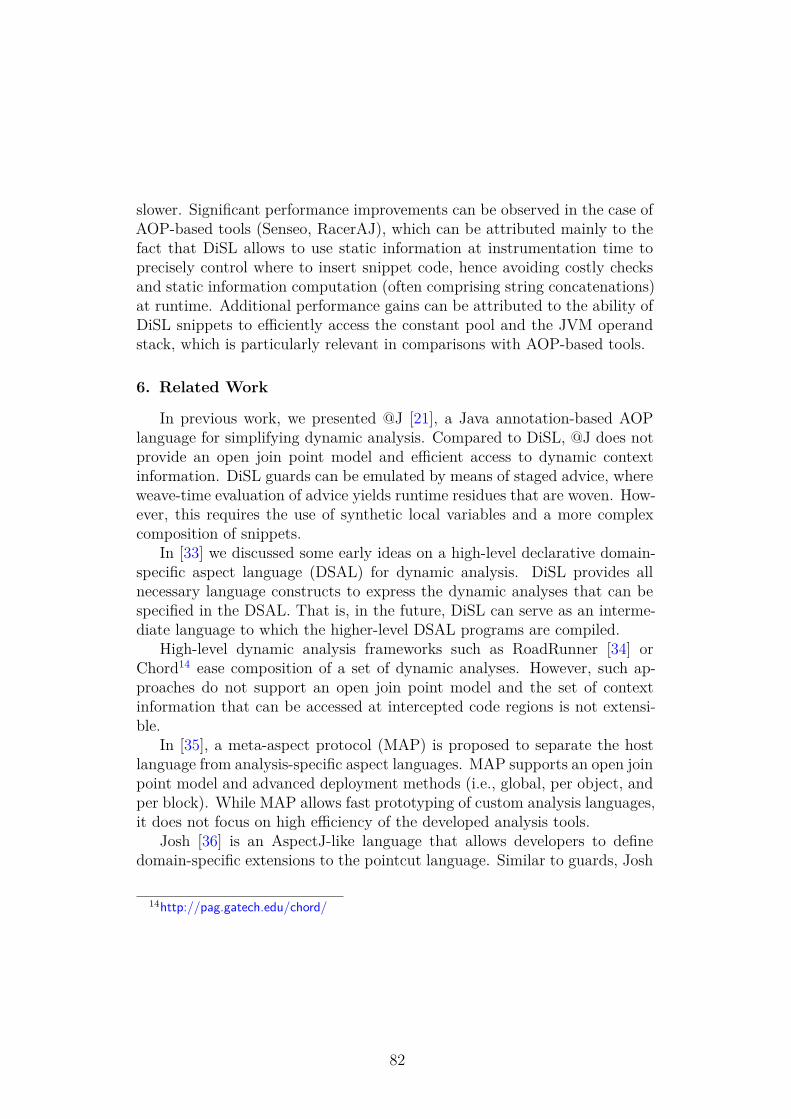
slower. Significant performance improvements can be observed in the case ofAOP-based tools (Senseo, RacerAJ), which can be attributed mainly to thefact that DiSL allows to use static information at instrumentation time toprecisely control where to insert snippet code, hence avoiding costly checksand static information computation (often comprising string concatenations)at runtime. Additional performance gains can be attributed to the ability ofDiSL snippets to efficiently access the constant pool and the JVM operandstack, which is particularly relevant in comparisons with AOP-based tools.
6. Related Work
In previous work, we presented @J [21], a Java annotation-based AOPlanguage for simplifying dynamic analysis. Compared to DiSL, @J does notprovide an open join point model and efficient access to dynamic contextinformation. DiSL guards can be emulated by means of staged advice, whereweave-time evaluation of advice yields runtime residues that are woven. How-ever, this requires the use of synthetic local variables and a more complexcomposition of snippets.
In [33] we discussed some early ideas on a high-level declarative domain-specific aspect language (DSAL) for dynamic analysis. DiSL provides allnecessary language constructs to express the dynamic analyses that can bespecified in the DSAL. That is, in the future, DiSL can serve as an interme-diate language to which the higher-level DSAL programs are compiled.
High-level dynamic analysis frameworks such as RoadRunner [34] orChord14 ease composition of a set of dynamic analyses. However, such ap-proaches do not support an open join point model and the set of contextinformation that can be accessed at intercepted code regions is not extensi-ble.
In [35], a meta-aspect protocol (MAP) is proposed to separate the hostlanguage from analysis-specific aspect languages. MAP supports an open joinpoint model and advanced deployment methods (i.e., global, per object, andper block). While MAP allows fast prototyping of custom analysis languages,it does not focus on high efficiency of the developed analysis tools.
Josh [36] is an AspectJ-like language that allows developers to definedomain-specific extensions to the pointcut language. Similar to guards, Josh
14http://pag.gatech.edu/chord/
82
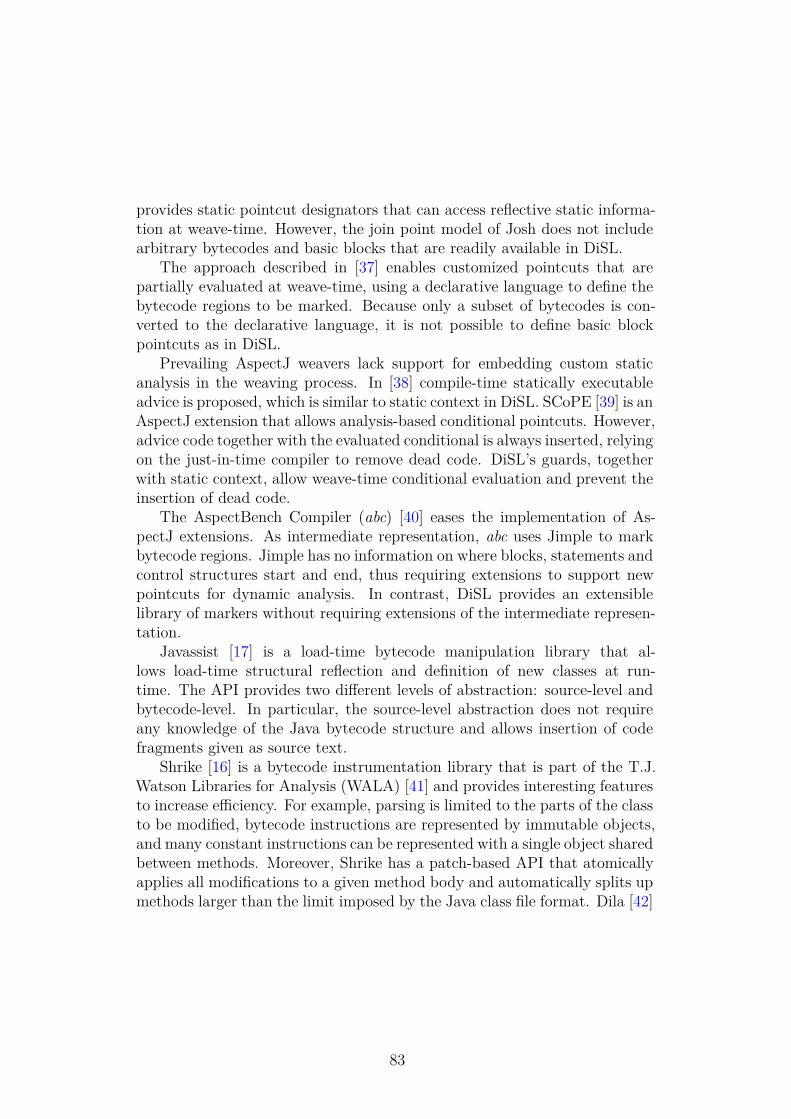
provides static pointcut designators that can access reflective static informa-tion at weave-time. However, the join point model of Josh does not includearbitrary bytecodes and basic blocks that are readily available in DiSL.
The approach described in [37] enables customized pointcuts that arepartially evaluated at weave-time, using a declarative language to define thebytecode regions to be marked. Because only a subset of bytecodes is con-verted to the declarative language, it is not possible to define basic blockpointcuts as in DiSL.
Prevailing AspectJ weavers lack support for embedding custom staticanalysis in the weaving process. In [38] compile-time statically executableadvice is proposed, which is similar to static context in DiSL. SCoPE [39] is anAspectJ extension that allows analysis-based conditional pointcuts. However,advice code together with the evaluated conditional is always inserted, relyingon the just-in-time compiler to remove dead code. DiSL’s guards, togetherwith static context, allow weave-time conditional evaluation and prevent theinsertion of dead code.
The AspectBench Compiler (abc) [40] eases the implementation of As-pectJ extensions. As intermediate representation, abc uses Jimple to markbytecode regions. Jimple has no information on where blocks, statements andcontrol structures start and end, thus requiring extensions to support newpointcuts for dynamic analysis. In contrast, DiSL provides an extensiblelibrary of markers without requiring extensions of the intermediate represen-tation.
Javassist [17] is a load-time bytecode manipulation library that al-lows load-time structural reflection and definition of new classes at run-time. The API provides two different levels of abstraction: source-level andbytecode-level. In particular, the source-level abstraction does not requireany knowledge of the Java bytecode structure and allows insertion of codefragments given as source text.
Shrike [16] is a bytecode instrumentation library that is part of the T.J.Watson Libraries for Analysis (WALA) [41] and provides interesting featuresto increase efficiency. For example, parsing is limited to the parts of the classto be modified, bytecode instructions are represented by immutable objects,and many constant instructions can be represented with a single object sharedbetween methods. Moreover, Shrike has a patch-based API that atomicallyapplies all modifications to a given method body and automatically splits upmethods larger than the limit imposed by the Java class file format. Dila [42]
83
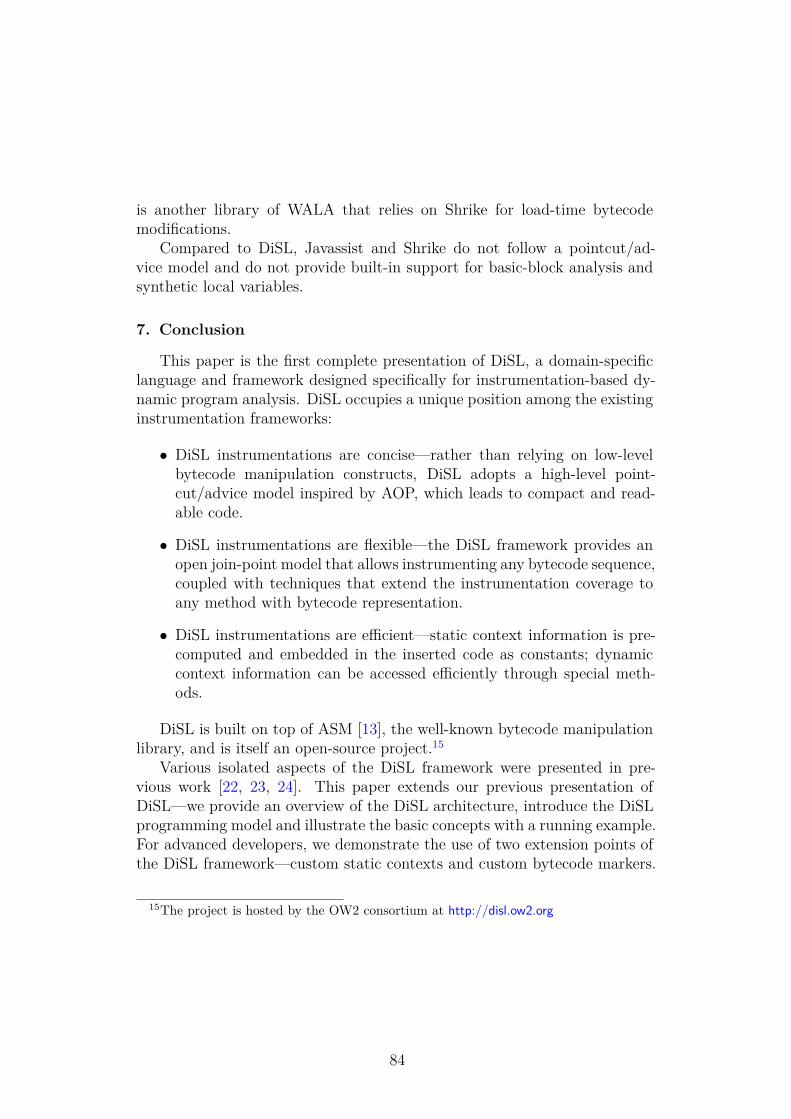
is another library of WALA that relies on Shrike for load-time bytecodemodifications.
Compared to DiSL, Javassist and Shrike do not follow a pointcut/ad-vice model and do not provide built-in support for basic-block analysis andsynthetic local variables.
7. Conclusion
This paper is the first complete presentation of DiSL, a domain-specificlanguage and framework designed specifically for instrumentation-based dy-namic program analysis. DiSL occupies a unique position among the existinginstrumentation frameworks:
• DiSL instrumentations are concise—rather than relying on low-levelbytecode manipulation constructs, DiSL adopts a high-level point-cut/advice model inspired by AOP, which leads to compact and read-able code.
• DiSL instrumentations are flexible—the DiSL framework provides anopen join-point model that allows instrumenting any bytecode sequence,coupled with techniques that extend the instrumentation coverage toany method with bytecode representation.
• DiSL instrumentations are efficient—static context information is pre-computed and embedded in the inserted code as constants; dynamiccontext information can be accessed efficiently through special meth-ods.
DiSL is built on top of ASM [13], the well-known bytecode manipulationlibrary, and is itself an open-source project.15
Various isolated aspects of the DiSL framework were presented in pre-vious work [22, 23, 24]. This paper extends our previous presentation ofDiSL—we provide an overview of the DiSL architecture, introduce the DiSLprogramming model and illustrate the basic concepts with a running example.For advanced developers, we demonstrate the use of two extension points ofthe DiSL framework—custom static contexts and custom bytecode markers.
15The project is hosted by the OW2 consortium at http://disl.ow2.org
84
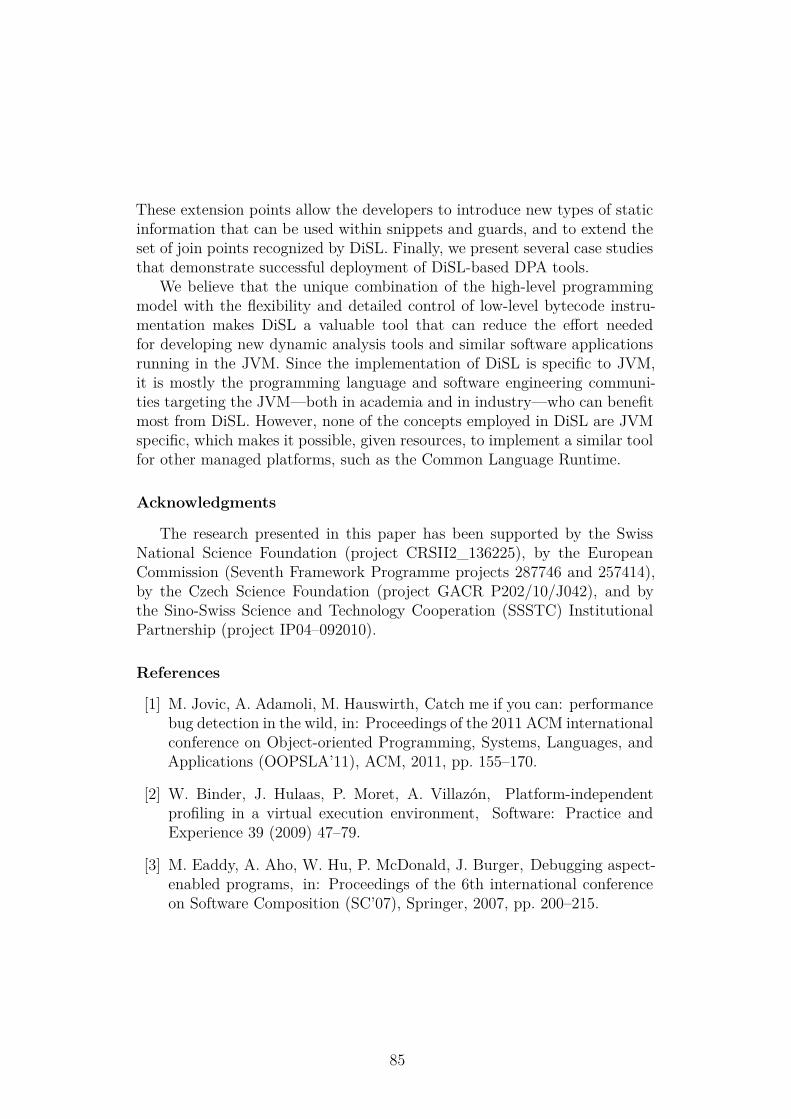
These extension points allow the developers to introduce new types of staticinformation that can be used within snippets and guards, and to extend theset of join points recognized by DiSL. Finally, we present several case studiesthat demonstrate successful deployment of DiSL-based DPA tools.
We believe that the unique combination of the high-level programmingmodel with the flexibility and detailed control of low-level bytecode instru-mentation makes DiSL a valuable tool that can reduce the effort neededfor developing new dynamic analysis tools and similar software applicationsrunning in the JVM. Since the implementation of DiSL is specific to JVM,it is mostly the programming language and software engineering communi-ties targeting the JVM—both in academia and in industry—who can benefitmost from DiSL. However, none of the concepts employed in DiSL are JVMspecific, which makes it possible, given resources, to implement a similar toolfor other managed platforms, such as the Common Language Runtime.
Acknowledgments
The research presented in this paper has been supported by the SwissNational Science Foundation (project CRSII2_136225), by the EuropeanCommission (Seventh Framework Programme projects 287746 and 257414),by the Czech Science Foundation (project GACR P202/10/J042), and bythe Sino-Swiss Science and Technology Cooperation (SSSTC) InstitutionalPartnership (project IP04–092010).
References
[1] M. Jovic, A. Adamoli, M. Hauswirth, Catch me if you can: performancebug detection in the wild, in: Proceedings of the 2011 ACM internationalconference on Object-oriented Programming, Systems, Languages, andApplications (OOPSLA’11), ACM, 2011, pp. 155–170.
[2] W. Binder, J. Hulaas, P. Moret, A. Villazón, Platform-independentprofiling in a virtual execution environment, Software: Practice andExperience 39 (2009) 47–79.
[3] M. Eaddy, A. Aho, W. Hu, P. McDonald, J. Burger, Debugging aspect-enabled programs, in: Proceedings of the 6th international conferenceon Software Composition (SC’07), Springer, 2007, pp. 200–215.
85
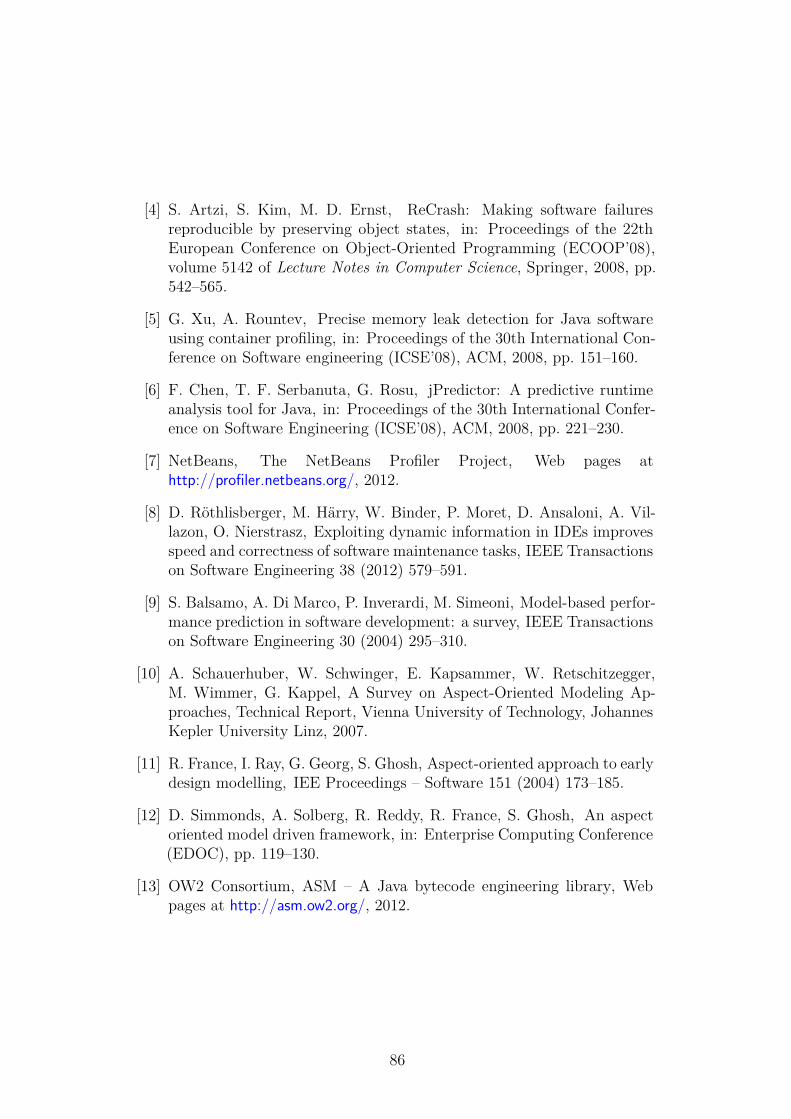
[4] S. Artzi, S. Kim, M. D. Ernst, ReCrash: Making software failuresreproducible by preserving object states, in: Proceedings of the 22thEuropean Conference on Object-Oriented Programming (ECOOP’08),volume 5142 of Lecture Notes in Computer Science, Springer, 2008, pp.542–565.
[5] G. Xu, A. Rountev, Precise memory leak detection for Java softwareusing container profiling, in: Proceedings of the 30th International Con-ference on Software engineering (ICSE’08), ACM, 2008, pp. 151–160.
[6] F. Chen, T. F. Serbanuta, G. Rosu, jPredictor: A predictive runtimeanalysis tool for Java, in: Proceedings of the 30th International Confer-ence on Software Engineering (ICSE’08), ACM, 2008, pp. 221–230.
[7] NetBeans, The NetBeans Profiler Project, Web pages athttp://profiler.netbeans.org/, 2012.
[8] D. Röthlisberger, M. Härry, W. Binder, P. Moret, D. Ansaloni, A. Vil-lazon, O. Nierstrasz, Exploiting dynamic information in IDEs improvesspeed and correctness of software maintenance tasks, IEEE Transactionson Software Engineering 38 (2012) 579–591.
[9] S. Balsamo, A. Di Marco, P. Inverardi, M. Simeoni, Model-based perfor-mance prediction in software development: a survey, IEEE Transactionson Software Engineering 30 (2004) 295–310.
[10] A. Schauerhuber, W. Schwinger, E. Kapsammer, W. Retschitzegger,M. Wimmer, G. Kappel, A Survey on Aspect-Oriented Modeling Ap-proaches, Technical Report, Vienna University of Technology, JohannesKepler University Linz, 2007.
[11] R. France, I. Ray, G. Georg, S. Ghosh, Aspect-oriented approach to earlydesign modelling, IEE Proceedings – Software 151 (2004) 173–185.
[12] D. Simmonds, A. Solberg, R. Reddy, R. France, S. Ghosh, An aspectoriented model driven framework, in: Enterprise Computing Conference(EDOC), pp. 119–130.
[13] OW2 Consortium, ASM – A Java bytecode engineering library, Webpages at http://asm.ow2.org/, 2012.
86
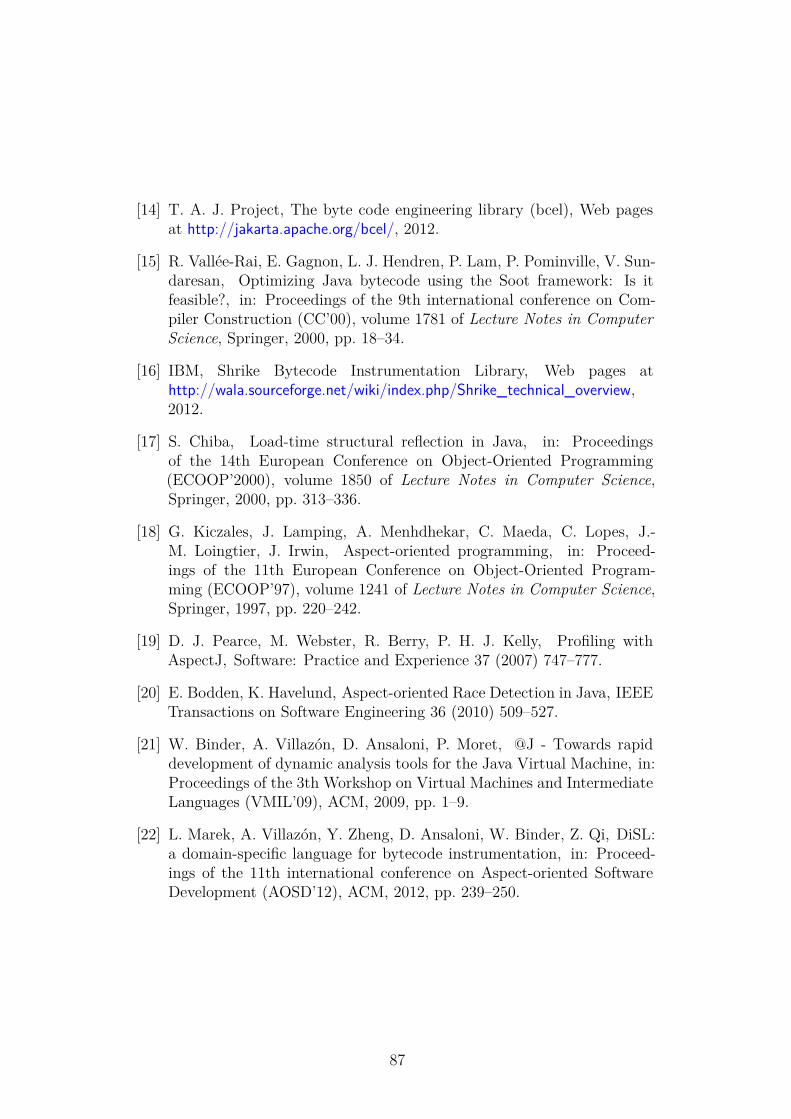
[14] T. A. J. Project, The byte code engineering library (bcel), Web pagesat http://jakarta.apache.org/bcel/, 2012.
[15] R. Vallée-Rai, E. Gagnon, L. J. Hendren, P. Lam, P. Pominville, V. Sun-daresan, Optimizing Java bytecode using the Soot framework: Is itfeasible?, in: Proceedings of the 9th international conference on Com-piler Construction (CC’00), volume 1781 of Lecture Notes in ComputerScience, Springer, 2000, pp. 18–34.
[16] IBM, Shrike Bytecode Instrumentation Library, Web pages athttp://wala.sourceforge.net/wiki/index.php/Shrike_technical_overview,2012.
[17] S. Chiba, Load-time structural reflection in Java, in: Proceedingsof the 14th European Conference on Object-Oriented Programming(ECOOP’2000), volume 1850 of Lecture Notes in Computer Science,Springer, 2000, pp. 313–336.
[18] G. Kiczales, J. Lamping, A. Menhdhekar, C. Maeda, C. Lopes, J.-M. Loingtier, J. Irwin, Aspect-oriented programming, in: Proceed-ings of the 11th European Conference on Object-Oriented Program-ming (ECOOP’97), volume 1241 of Lecture Notes in Computer Science,Springer, 1997, pp. 220–242.
[19] D. J. Pearce, M. Webster, R. Berry, P. H. J. Kelly, Profiling withAspectJ, Software: Practice and Experience 37 (2007) 747–777.
[20] E. Bodden, K. Havelund, Aspect-oriented Race Detection in Java, IEEETransactions on Software Engineering 36 (2010) 509–527.
[21] W. Binder, A. Villazón, D. Ansaloni, P. Moret, @J - Towards rapiddevelopment of dynamic analysis tools for the Java Virtual Machine, in:Proceedings of the 3th Workshop on Virtual Machines and IntermediateLanguages (VMIL’09), ACM, 2009, pp. 1–9.
[22] L. Marek, A. Villazón, Y. Zheng, D. Ansaloni, W. Binder, Z. Qi, DiSL:a domain-specific language for bytecode instrumentation, in: Proceed-ings of the 11th international conference on Aspect-oriented SoftwareDevelopment (AOSD’12), ACM, 2012, pp. 239–250.
87
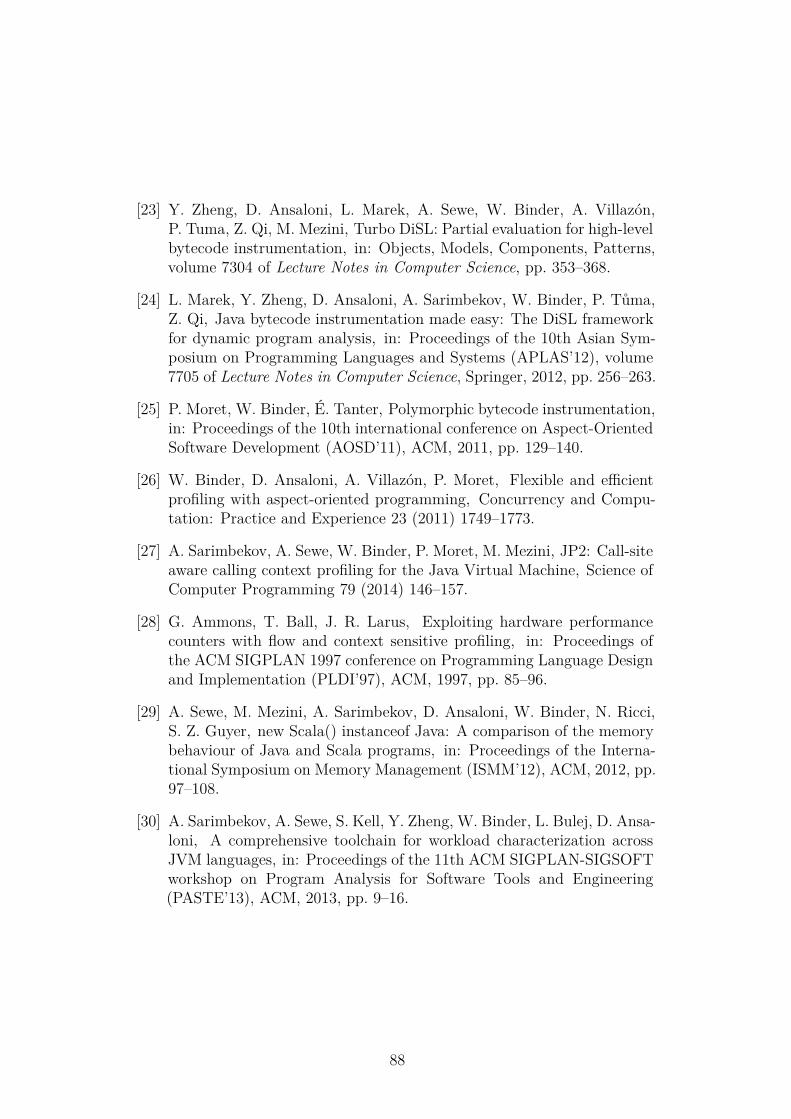
[23] Y. Zheng, D. Ansaloni, L. Marek, A. Sewe, W. Binder, A. Villazón,P. Tuma, Z. Qi, M. Mezini, Turbo DiSL: Partial evaluation for high-levelbytecode instrumentation, in: Objects, Models, Components, Patterns,volume 7304 of Lecture Notes in Computer Science, pp. 353–368.
[24] L. Marek, Y. Zheng, D. Ansaloni, A. Sarimbekov, W. Binder, P. Tůma,Z. Qi, Java bytecode instrumentation made easy: The DiSL frameworkfor dynamic program analysis, in: Proceedings of the 10th Asian Sym-posium on Programming Languages and Systems (APLAS’12), volume7705 of Lecture Notes in Computer Science, Springer, 2012, pp. 256–263.
[25] P. Moret, W. Binder, É. Tanter, Polymorphic bytecode instrumentation,in: Proceedings of the 10th international conference on Aspect-OrientedSoftware Development (AOSD’11), ACM, 2011, pp. 129–140.
[26] W. Binder, D. Ansaloni, A. Villazón, P. Moret, Flexible and efficientprofiling with aspect-oriented programming, Concurrency and Compu-tation: Practice and Experience 23 (2011) 1749–1773.
[27] A. Sarimbekov, A. Sewe, W. Binder, P. Moret, M. Mezini, JP2: Call-siteaware calling context profiling for the Java Virtual Machine, Science ofComputer Programming 79 (2014) 146–157.
[28] G. Ammons, T. Ball, J. R. Larus, Exploiting hardware performancecounters with flow and context sensitive profiling, in: Proceedings ofthe ACM SIGPLAN 1997 conference on Programming Language Designand Implementation (PLDI’97), ACM, 1997, pp. 85–96.
[29] A. Sewe, M. Mezini, A. Sarimbekov, D. Ansaloni, W. Binder, N. Ricci,S. Z. Guyer, new Scala() instanceof Java: A comparison of the memorybehaviour of Java and Scala programs, in: Proceedings of the Interna-tional Symposium on Memory Management (ISMM’12), ACM, 2012, pp.97–108.
[30] A. Sarimbekov, A. Sewe, S. Kell, Y. Zheng, W. Binder, L. Bulej, D. Ansa-loni, A comprehensive toolchain for workload characterization acrossJVM languages, in: Proceedings of the 11th ACM SIGPLAN-SIGSOFTworkshop on Program Analysis for Software Tools and Engineering(PASTE’13), ACM, 2013, pp. 9–16.
88
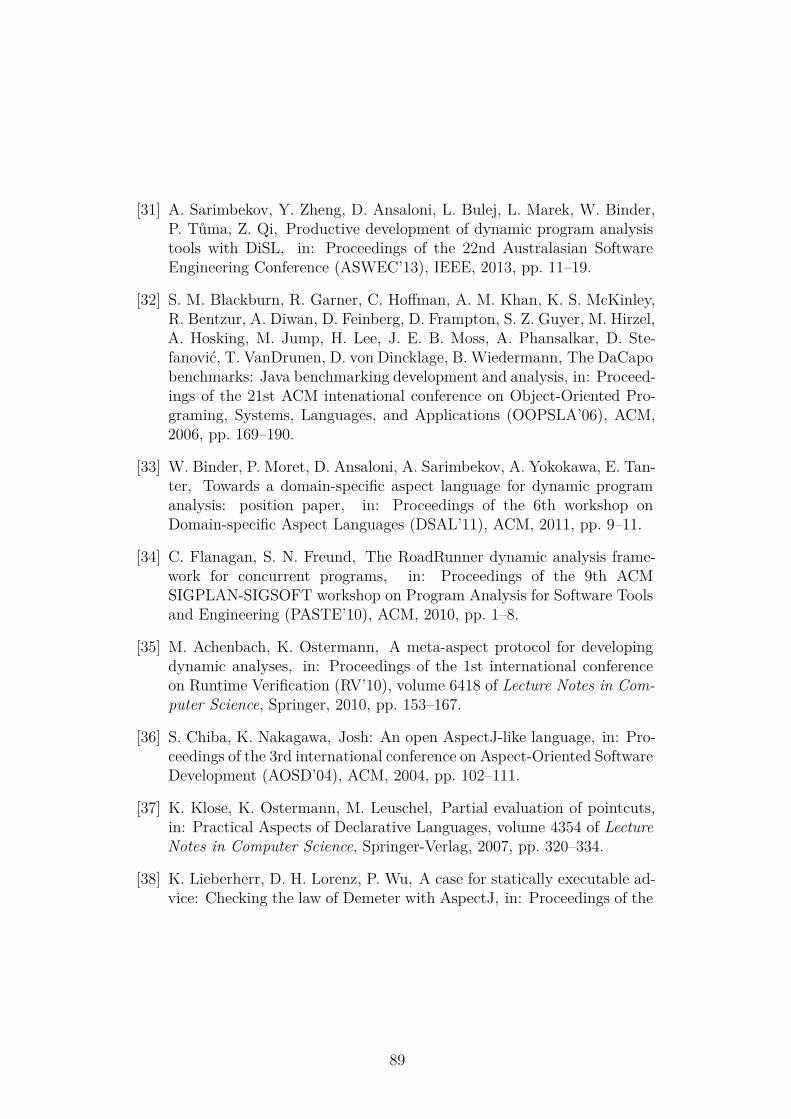
[31] A. Sarimbekov, Y. Zheng, D. Ansaloni, L. Bulej, L. Marek, W. Binder,P. Tůma, Z. Qi, Productive development of dynamic program analysistools with DiSL, in: Proceedings of the 22nd Australasian SoftwareEngineering Conference (ASWEC’13), IEEE, 2013, pp. 11–19.
[32] S. M. Blackburn, R. Garner, C. Hoffman, A. M. Khan, K. S. McKinley,R. Bentzur, A. Diwan, D. Feinberg, D. Frampton, S. Z. Guyer, M. Hirzel,A. Hosking, M. Jump, H. Lee, J. E. B. Moss, A. Phansalkar, D. Ste-fanović, T. VanDrunen, D. von Dincklage, B. Wiedermann, The DaCapobenchmarks: Java benchmarking development and analysis, in: Proceed-ings of the 21st ACM intenational conference on Object-Oriented Pro-graming, Systems, Languages, and Applications (OOPSLA’06), ACM,2006, pp. 169–190.
[33] W. Binder, P. Moret, D. Ansaloni, A. Sarimbekov, A. Yokokawa, E. Tan-ter, Towards a domain-specific aspect language for dynamic programanalysis: position paper, in: Proceedings of the 6th workshop onDomain-specific Aspect Languages (DSAL’11), ACM, 2011, pp. 9–11.
[34] C. Flanagan, S. N. Freund, The RoadRunner dynamic analysis frame-work for concurrent programs, in: Proceedings of the 9th ACMSIGPLAN-SIGSOFT workshop on Program Analysis for Software Toolsand Engineering (PASTE’10), ACM, 2010, pp. 1–8.
[35] M. Achenbach, K. Ostermann, A meta-aspect protocol for developingdynamic analyses, in: Proceedings of the 1st international conferenceon Runtime Verification (RV’10), volume 6418 of Lecture Notes in Com-puter Science, Springer, 2010, pp. 153–167.
[36] S. Chiba, K. Nakagawa, Josh: An open AspectJ-like language, in: Pro-ceedings of the 3rd international conference on Aspect-Oriented SoftwareDevelopment (AOSD’04), ACM, 2004, pp. 102–111.
[37] K. Klose, K. Ostermann, M. Leuschel, Partial evaluation of pointcuts,in: Practical Aspects of Declarative Languages, volume 4354 of LectureNotes in Computer Science, Springer-Verlag, 2007, pp. 320–334.
[38] K. Lieberherr, D. H. Lorenz, P. Wu, A case for statically executable ad-vice: Checking the law of Demeter with AspectJ, in: Proceedings of the
89
2nd international conference on Aspect-Oriented Software Development(AOSD’03), ACM, 2003, pp. 40–49.
[39] T. Aotani, H. Masuhara, SCoPE: an AspectJ compiler for supportinguser-defined analysis-based pointcuts, in: Proceedings of the 6th interna-tional conference on Aspect-oriented Software Development (AOSD’07),ACM, 2007, pp. 161–172.
[40] P. Avgustinov, A. S. Christensen, L. J. Hendren, S. Kuzins, J. Lhoták,O. Lhoták, O. de Moor, D. Sereni, G. Sittampalam, J. Tibble, abc:An extensible AspectJ compiler, in: Proceedings of the 4th interna-tional conference on Aspect-Oriented Software Development (AOSD’05),ACM, 2005, pp. 87–98.
[41] IBM, Watson Libraries for Analysis (WALA), Web pages athttp://wala.sourceforge.net/wiki/index.php/Main_Page, 2012.
[42] IBM, Dynamic Load-time Instrumentation Li-brary for Java (Dila), Web pages athttp://wala.sourceforge.net/wiki/index.php/GettingStarted:wala.dila,2012.
90
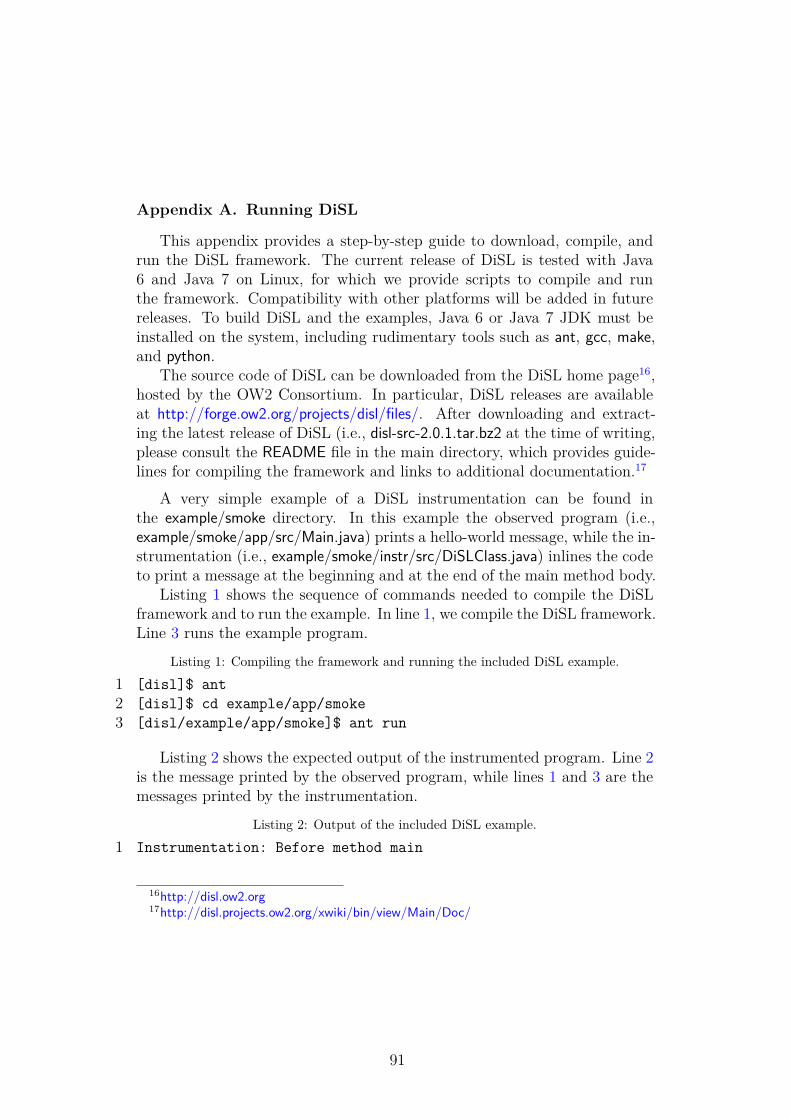
Appendix A. Running DiSL
This appendix provides a step-by-step guide to download, compile, andrun the DiSL framework. The current release of DiSL is tested with Java6 and Java 7 on Linux, for which we provide scripts to compile and runthe framework. Compatibility with other platforms will be added in futurereleases. To build DiSL and the examples, Java 6 or Java 7 JDK must beinstalled on the system, including rudimentary tools such as ant, gcc, make,and python.
The source code of DiSL can be downloaded from the DiSL home page16,hosted by the OW2 Consortium. In particular, DiSL releases are availableat http://forge.ow2.org/projects/disl/files/. After downloading and extract-ing the latest release of DiSL (i.e., disl-src-2.0.1.tar.bz2 at the time of writing,please consult the README file in the main directory, which provides guide-lines for compiling the framework and links to additional documentation.17
A very simple example of a DiSL instrumentation can be found inthe example/smoke directory. In this example the observed program (i.e.,example/smoke/app/src/Main.java) prints a hello-world message, while the in-strumentation (i.e., example/smoke/instr/src/DiSLClass.java) inlines the codeto print a message at the beginning and at the end of the main method body.
Listing 1 shows the sequence of commands needed to compile the DiSLframework and to run the example. In line 1, we compile the DiSL framework.Line 3 runs the example program.
Listing 1: Compiling the framework and running the included DiSL example.1 [disl]$ ant2 [disl]$ cd example/app/smoke3 [disl/example/app/smoke]$ ant run
Listing 2 shows the expected output of the instrumented program. Line 2is the message printed by the observed program, while lines 1 and 3 are themessages printed by the instrumentation.
Listing 2: Output of the included DiSL example.1 Instrumentation: Before method main
16http://disl.ow2.org17http://disl.projects.ow2.org/xwiki/bin/view/Main/Doc/
91
2 Application: Inside method main3 Instrumentation: After method main
It is possible to use the disl.py script to invoke DiSL with user-definedinstrumentations, provided the following rules are adhered to:
• All the instrumentation and the analysis classes must be packed intoa single jar file, including any external libraries used by the analysis.Such libraries can be added to the jar file using, for example, the jarjar18
tool.
• The MANIFEST.MF file in the META-INF directory of the jar file mustlist all the DiSL classes used for the instrumentation; Listing 3 showsthe manifest file of the included example. In this case, the instrumen-tation consists of a single class (i.e., DiSLClass) that can be found inthe default package.
Run disl.py -h for information on how to use the script and to list allavailable parameters.
Listing 3: Manifest file of the included DiSL example.Manifest-Version: 1.0DiSL-Classes: DiSLClass
An archive of all examples and tools presented in this paper (i.e.,disl-examples-1.2.tar.bz2) can be downloaded from the DiSL release page.This archive must be extracted within the main directory of DiSL and in-cludes an additional README file that describes how to run the examples.Listing 4 shows how the runExample.sh script can be used to run the exampleshown in Figure 1 of this paper.
Listing 4: Running the profiler example presented in Figure 1.[disl/examples]$ ./runExample.sh \2.1-Method_Execution_Time_Profiler-Figure_1
18http://code.google.com/p/jarjar/
92
Part III
Related Work and Conclusion
93

Chapter 6
Related Work
This chapter provides an overview of the related work. The overview does notrefer to every related publication, as they are already covered in the includedpapers. Instead, it provides a deeper comparison with related dynamic analy-sis frameworks, since such comparison is normally not possible in the publishedpapers due to space constrains.
DiSL and ShadowVM are essentially a part of one framework, however theywere designed to be used separately. We believe that each of the parts deservesa separate comparison. Therefore, the related work is divided into two sections.The first one describes instrumentation (comparison with DiSL) and the secondone describes the dynamic analysis evaluation (comparison with ShadowVM).Some mentioned frameworks solve both problems, thus span over both sections.Even though the framework itself may be only a single tool, we compare itsinstrumentation and analysis evaluation capabilities separately.
6.1 Instrumentation frameworks
This section provides an overview of the instrumentation frameworks and dis-cusses their difference with DiSL. Initially, we will cover well-known machineinstruction level frameworks, following with a discussion of the instrumentationframeworks targeting the Java environment.
6.1.1 Instrumentation in machine code
Although the frameworks operating on the machine instruction level are not pri-marily designed for instrumentation of managed languages, they provide highflexibility, high control over the instrumentation process and good isolation fromthe managed environment, hence they may serve as a foundation for a morecomplex observation platform.
Pin
Pin [34, 64] is a C/C++ framework providing a rich API for application instru-mentation. Pin operates at machine instruction level, however the API providesan abstraction over the machine architecture so the analysis written using Pincan remain architecture-independent as much as possible. Pin instruments anapplication during execution, similarly to the Just-In-Time (JIT) compiler fromthe managed runtimes. It governs the execution of all new blocks of code andgives the developer an opportunity to insert event callbacks before the code isexecuted.
95
DynamicRIO
DynamicRIO [9, 46] is an instrumentation framework similar to Pin. Comparedto Pin, DynamicRIO is better suited for generic code transformations for theprice of having more complicated API.
Valgrind
Another framework for instrumentation of native programs is Valgrind [69, 70, 40].Compared to the previous two frameworks, Valgrind provides instrumentationcapabilities for heavy weight analysis that are not supported under Pin or Dy-namicRIO. It is suitable for analysis intercepting many events and operating onlarge amount of analysis data. The distinguishing feature is its disassemble-and-resynthesise (D&R) technique. During D&R, Valgrind reads the machine code ofthe target application, translates it to an intermediate representation, applies therequested instrumentation and translates the application back to machine code.D&R improves an ability to control the effects of instrumentation code on theobserved application code, thus providing a safer environment for the analysis.
SystemTap
SystemTap1 [38, 74] is an instrumentation framework for GNU/Linux systems.SystemTap collects events from user-space applications and is also capable ofmonitoring a whole operating system by inserting instrumentation code directlyinto the Linux kernel.
SystemTap defines its own language for describing the instrumentation andhandling the events. The event handling routines are not meant to perform thewhole analysis, especially in cases where it would require a lot of computation.Instead, the event routine should only store the required information and quicklyreturn. The processing of collected data is managed by other tools.
As event handlers written using SystemTap often observe sensitive data (inrelation to stability of the system), the code of the event handlers is analyzed tomeet certain safety properties. During script compilation, SystemTap controlsproperties like the length of execution, memory allocations or unsafe operationslike manipulation with the observed structures.
SystemTap provides two different options how to instrument user-space ap-plications. One way is to compile in the instrumentation probes, i.e., include theprobes directly into the source code of the application. The other option is touse the debug information created by compiler to determine the place where theprobes should be inserted.
Comparison with DiSL
As all of the mentioned frameworks were not primarily designed to observe man-aged runtimes, their applicability remains limited. They have no notion of classes,instances, synchronization primitives or a garbage collector. Machine instructioncode produced by a JIT compiler is optimized to perform well on the designated
1SystemTap is a similar solution to Dtrace, a framework for instrumentation under theSolaris operating system.
96
CPU. Therefore, detecting high-level language patterns like field assignments orobject creations may be complicated.
Instrumentation of managed applications on the machine instruction levelassumes that the managed runtime is using a JIT compiler to translate codeto machine instructions. A virtual machine may, however use an interpreter toexecute the bytecode. An interpreted application does not have the form of thecoherent machine instruction code and cannot be easily instrumented.
Compared to them, DiSL works on Java bytecode level, which is an interme-diate representation between the Java source code and the machine code. Thank-fully, modern Java compilers perform almost no optimization when compiling theJava source code to the bytecode. Without optimizations and using the specificinstruction set that is much closer to object oriented language, detection of high-level language patterns in Java bytecode is relatively easy. To raise the level ofabstraction, DiSL provides a predefined library of markers to instrument commonexecution patterns.
In summary, instrumentation on the machine instruction level requires directsupport of the target managed runtime. Without the detection of high-level lan-guage patterns, the machine code instrumentation frameworks have no possibili-ty to introduce high-level constructs to simplify the instrumentation of managedlanguages.
6.1.2 Instrumentation in Java
In this section, we summarize tools for instrumentation under Java. The first sub-section describes generic bytecode transformation libraries. Following subsectionsconcentrate on tools providing more convenient instrumentation interfaces.
6.1.3 Bytecode manipulation libraries
Bytecode transformation libraries like ASM, Soot or BCEL provide API for writ-ing very efficient and fully customizable instrumentation. The API works directlywith a stream of bytecodes and only a small abstraction layer is provided.
ASM
ASM [2, 47] defines two distinct APIs for bytecode manipulation. The Core APIallows to inspect and modify classes using a visitor design pattern and the TreeAPI represents methods, fields and bytecode in a form of an object tree (similarlyto the Java reflection API).The Core API is very fast and efficient especially incases where the transformation is done during a single pass through the trans-formed class. The information about the class and method under transformationis provided through visitor method arguments. Visitor methods are invoked foreach method, annotation and even bytecode instruction.
The Tree API is often used for more complicated transformation or bytecodeanalysis. The information about classes, methods, fields and instructions arestored in separate objects. These objects are grouped in lists and form a treestructure. A root of the tree is a class with references to fields and methods. Themethod contains list of bytecode instructions.
97
BCEL
BCEL [4, 53] is a bytecode transformation library similar to ASM. Compared toASM, BCEL is slower and cumbersome while working with local variables butmay require writing less code.
Soot
Soot [37, 77] is a framework for static analysis and optimization of Java byte-code. Soot provides four intermediate representations of Java bytecode. Thefirst representation, called Baf, provides only a thin abstraction over the Javabytecode. Same as a Java bytecode, it uses stack-based bytecode representation,but its instructions are fully typed to simplify transformation and analysis. An-other representation is a 3-address code representation called Jimple. Jimple isa preferred form for code analysis and optimization. The third representation iscalled Shimple. Shimple is a variation of Jimple using static single assignmentform. The last representation, called Grimp, allows unification of several byte-code instructions into a tree and creating a structure similar to Java source codesuitable for human-readable outputs.
Comparison with DiSL
The bytecode engineering libraries provide a rich API for class transformationsbut such an API is unnecessarily complex for dynamic analysis instrumentation.As dynamic analysis does not require to modify the behaviour of the observedapplication, the instrumentation API can be simpler and provide a higher level ofabstraction over the instrumented bytecode. DiSL provides a predefined libraryof bytecode pattern markers to easily instrument for example object allocations,basic blocks or exception handlers. To provide a similar flexibility to the low-level transformation libraries, a DiSL developer may take an advantage of theunderlying ASM library and design a custom marker to instrument an arbitraryexecution pattern.
The bytecode engineering libraries specify the instrumentation as a series ofbytecode instructions inserted in between the bytecodes of the original method. Adeveloper using these libraries has to be either very skilled in bytecode program-ming or to use additional tools to convert Java code to bytecode. In contrast,DiSL allows to specify the instrumentation as Java code directly, abstracting thedeveloper from the bytecode internals and allowing to concentrate mainly on theanalysis logic.
6.1.4 Java instrumentation frameworks
The following subsections overviews instrumentation frameworks in Java. Com-pared to the bytecode transformation libraries, the instrumentation frameworksdo not allow arbitrary class transformation, but provide high-level abstractionsto simplify the specification of the instrumentation.
98
AspectJ
One of the most commonly used tools for dynamic analysis instrumentation inJava is AspectJ [3, 60, 61]. AspectJ is a language based on the aspect-orientedprogramming paradigm, built on top of Java by extending the language withadditional keywords. Thanks to such high-level language integration, AspectJprovides a convenient way for writing instrumentation. Compared to low-levelbytecode manipulation libraries, the programmer does not have to deal with astream of instructions. Instead, he writes the instrumentation code directly inJava and uses AspectJ’s join-point model to navigate its insertion. The join-pointmodel in AspectJ is designed to intercept various application behaviour like fieldoperations or execution of method bodies and exception handlers.
The access to the static and dynamic context information is provided throughan objects created at runtime. For each join-point, AspectJ creates a corre-sponding object to expose context information like method arguments, methodcall target or accessed field value.
AspectJ supports several types of weaving. Convenient method for applyinginstrumentation is to compile the application sources using the AspectJ compiler.Another option is to use the Java instrumentation agent to perform weaving atruntime.
AspectBench Compiler
The AspectBench Compiler (abc) [1, 45] is an AspectJ compiler designed to beeasily extensible. abc uses the Polyglot [35, 72] compiler as a front-end to easilyextend the Java language syntax, and the Soot framework (described earlier) asthe instrumentation backend.
Javassist
Javassist [17, 49] is a bytecode transformation library. Beside the low-level trans-formation API, Javassist allows to reflect classes similarly to Java reflection APIand add fields or methods by specifying their Java code.
Comparison with DiSL
Compared to the bytecode manipulation libraries, AspectJ offers only a prede-fined set of join-points. It does not provide any convenient extension mechanismto instrument an arbitrary execution pattern, i.e., does not provide a mechanismto introduce new types of events. The AspectBench Compiler (abc) was designedto overcome this limitation. Even though abc allows extensibility of the AspectJlanguage, it is still necessary to define rules for semantic checks and implementseveral new core classes when creating a custom join-point or a new advice. Theamount of work depends on the type of the extension, however the AspectJ lan-guage was never designed to be easily extensible. In contrast, DiSL was designedwith extensibility in mind and standard extensions require implementation ofonly one new class.
The DiSL API allows to access the context information through pre-definedor custom made objects. During weave time, DiSL pre-computes requested val-ues and translates all calls to context objects into series of bytecodes direct-
99
ly fetching the required information as constant values. AspectJ also providesobject-oriented API to access context information. The objects are however nottranslated into simple bytecode instructions, instead the whole object tree is ac-cessible at runtime. When the instrumentation requests the context information,AspectJ has to allocate and fill the objects with data. Even though the ob-jects may be reused, such solution still requires additional allocations and createsruntime overhead.
Overall, AspectJ does not provide any control over the internal allocationsnor helper code executed during runtime. The core principle in DiSL is to givethe instrumentation developer full control over the instrumentation process. Allconstructs in DiSL are evaluated at weave-time and replaced by constants orbytecodes. DiSL by itself never allocates new objects and introduces only smallruntime overhead2.
None of the instrumentation methods in AspectJ is able to provide full byte-code coverage, especially instrumentation of the Java Class Library. In compari-son to AspectJ, DiSL uses the Java native agent, allowing to instrument all loadedbytecode classes including all classes from the Java Class Library.
Similar to AspectJ, Javassist is limited to only a predefined set of join-pointswhile using the high-level instrumentation API. If more fine grained instrumenta-tion is required, a byte-code level API (similar to the low-level bytecode manip-ulation libraries API) may be used. DiSL does not allow to modify the observedcode as it was primarily designed for program observation, but it outperformsJavassist in flexibility of the high-level instrumentation API.
6.1.5 Frameworks with predefined probes
Following frameworks does not allow to insert arbitrary instrumentation but usea set of predefined probes to observe the application.
Sofya
Sofya [36, 63, 62] is an instrumentation and analysis evaluation framework buildon a publish-subscribe messaging pattern. Instrumentation process in Sofya isguided using description language called EDL. EDL supports only a selection ofbasic patterns and filtering based on class or method names.
Sofya does not allow to insert arbitrary code into the observed application,instead it provides a set of predefined probes. It is safer to not allow the developerto modify the monitoring probes, however such restriction greatly reduces theframework flexibility. If modifications are necessary, the developer may access anunderlying BCEL bytecode manipulation library.
Sofya provides access to static and dynamic context information, but spec-ification of what data can be requested by the evaluation is very limited. Thespecification is often reduced to a decision whether to transfer the whole contextinformation or not.
2A top of the code specified by a programmer, the DiSL framework inserts code to supportthe dynamic bypass mechanism and check for unexpected instrumentation code exceptions. Asnone of these mechanisms is mandatory for DiSL to operate, the insertion of such code can bedisabled by the programmer.
100
Chord
Chord [7, 68] is a platform for static and dynamic program analysis. It providesload-time instrumentation and allows to instrument classes from the Java ClassLibrary. Chord uses a Java instrumentation agent, therefore it may potentiallymiss some classes and leave them un-instrumented. The bytecode manipulationin Chord is performed by the Javasist library. The analysis evaluation can beperformed in the context or out of the context of the observed application (to bediscussed in 6.2.2).
Same as Sofya, Chord uses a predefined set of probes to trigger various eventsincluding method entry and exit, synchronization operations and field accesses.For each of the probes, Chord provides a predefined context information.
Comparison with DiSL
Both frameworks are significantly limited when adding new events or extendingcontext information in the existing ones. As both frameworks use an underlyingbytecode manipulation library, extensions are possible. In both cases, the probesare implemented in several layers of the framework, hence an extension wouldrequire non-trivial modifications to several core framework classes. Furthermore,the resulting analysis would be bound to the modified version of the framework.
In DiSL, extensions use a predefined API. Each extension is bundled togetherwith the instrumentation and is loaded automatically during instrumentation.
6.2 Frameworks for dynamic analysis evaluation
in Java
Frameworks for analysis evaluation are usually built on top of an instrumentationframework and provide a supporting infrastructure to evaluate custom dynamicanalysis in a safe environment. In this work, we distinguish two types of analysisframeworks. The first, called in-process analysis frameworks, perform analysis inthe context of the observed application and may potentially influence its execu-tion. The second type of frameworks offloads an analysis out of the context ofan observed application to minimize possible perturbation; these we call out-of-process analysis frameworks.
6.2.1 In-process analysis frameworks
A great advantage of in-process analysis over out-of-process analysis is the abilityto query any application context information with small overhead. Well-craftedin-process analysis may outperform out-of-process analysis by orders of magni-tude depending on the scenario. As the analysis may influence the observedapplication, it has to be carefully designed and thoroughly tested.
AspectJ
AspectJ [3, 60, 61] is an instrumentation framework (described in 6.1.4), but isalso provides basic support for in-process analysis. In AspectJ, aspect classes
101
contain definitions of the intercepted events together with the code being invokedwhen such an event is triggered. In addition, the classes may also include helpermethods and fields to separate the event logic from the main analysis logic andto store the analysis data structures between the event invocations.
BTrace
BTrace [5] is a dynamic tracing tool for Java. It uses Java annotations to guide theinstrumentation process and Java code to express the analysis logic. As BTraceis designed to be safe, it restricts the analysis code to only harmless operationswhich cannot influence the observed application. The analysis cannot, amongother restrictions, allocate new objects, throw or catch exceptions, assign valuesto fields, use class literals or contain loops. The analysis is allowed to invokemethods only from the BTrace utility package and the helper analysis methods.All other method calls are forbidden. BTrace allows to intercept only a predefinedset of events like method executions, field accesses or object allocations, with nopossibility of extensions.
RoadRunner
RoadRunner [39, 56] is a dynamic analysis framework for concurrent Java pro-grams. RoadRunner concentrates on rapid prototyping where dynamic analysisis described as a filter over a stream of predefined events. The framework allowsto compose several simple dynamic analyses into chains to create a more complexanalysis. RoadRunner intercepts events like lock acquisition, lock release, threadstart, thread interruption, thread join or thread sleep.
Comparison with ShadowVM
The mentioned frameworks prevent perturbation in the observed application us-ing two distinct approaches. AspectJ and RoadRunner exclude classes from in-strumentation. Even though it would be possible to exclude only classes sharedbetween the analysis and the observed application, the frameworks exclude largepart of the Java Class Library.
BTrace prevents the perturbation by restricting the evaluation to only safe op-erations. Nevertheless, it is not always harmful to use a loop or call a pure methodand restrictions imposed by BTrace limits versatility of the analysis framework.
The ShadowVM prevents the perturbation by offloading the analysis out ofthe context of the observed application and does not enforce restrictions thatwould limit the versatility or the coverage of the framework.
6.2.2 Out-of-process analysis frameworks
The out-of-process analysis frameworks offload the analysis out of the managedJava space. The two most typical approaches are either a use of Java level mar-shaling and transportation mechanisms like JDI [19], Java beans [23] or simpleI/O API, or a use of JNI [24] with processing and transportation of events per-formed in native space.
102
Chord
The events in Chord [7, 68] (the instrumentation part described in 6.1.5) areserialized into a byte buffer. The events can be deserialized and evaluated inthe context of the observed application, redirected to a file on a hard drive orstreamed to another VM.
The serialization process allows to preserve only a unique identification for anobject. This is not a problem during the in-process analysis, where the analysiscan access a translation map and get a reference to the real object. If the analysisis performed in another VM, Chord does not provide any mechanism to queryadditional object data.
Sofya
Sofya [36, 63, 62] is an instrumentation (described in 6.1.5) and analysis frame-work. Although we split the description of the instrumentation and the analysisinto two parts, they are tightly coupled. The whole Sofya’s infrastructure is com-posed of six layers. The bottom two layers are responsible for bytecode analysisand instrumentation. The third layer is responsible for communication betweenthe observed application and the evaluation part. The communication is medi-ated by JDI [19] or a custom transfer protocol. The fourth layer dispatches thegathered events to the analysis and the fifth layer provides various componentsfor event filtering. The fifth layer also dispatches events to multiple consumers,allowing to process a single event by multiple analyses. The sixth layer containsthe main analysis logic.
Using JDI, Sofya can combine the instrumentation events together with theJava debugging events. The main reason for such a solution is the ability toprecisely capture a correct timing of the synchronization events, which poses anissue if captured only by the instrumentation.
Caffeine
Caffeine [6, 58] is a tool for dynamic analysis. Caffeine intercepts Java debuggingevents and supplies them to the JIProlog [22] engine for analysis evaluation usingthe JDI protocol. Caffeine restricts the type of available events to only basic oneslike method invocation or field access. The analysis is evaluated in the separateJVM and the JDI provides Caffeine with good isolation between the analyzedapplication and the performed analysis.
*J
*J [13, 55] is a dynamic analysis framework using a native JVMPI [28] agentfor event triggering with a separate Java analyzer for the event processing. Theanalyzer runs during the measurement and parses the stream of events from asocket. The analyzer contains a predefined set of operations such as various trans-formations, metrics, triggers and printers to help process the stream of events.Definition of new operation and its combinations with predefined ones is alsopossible.
*J does not use instrumentation and relays entirely on the (already depre-cated) JVMPI interface. Context information provided for each event is fixed
103
with no possibility of extensions. Even though JVMPI allows to intercept in-structions processed by an interpreter, capturing more sophisticated bytecodepatterns would make the analysis incredibly slow.
Javana
Javana [16, 65] is a framework written in C, targeted on building analysis toolsfor Java. Javana uses the DIOTA [8, 66] binary instrumentation framework tocapture various application behaviour on a machine instruction level. To be ableto analyse the Java events properly on the machine instruction level, Javanarequires several hooks to the selected JVM operations like object allocation, re-allocaion and reclamation. The hooks have the form of JNI method calls invokedevery time the desired JVM operation occurs. As the standard JVMs do notsupport such functionality, Javana uses a modified Jikes RVM [21, 44].
Javana provides only basic support for event filtering, with no possibilityto restrict monitoring to only a part of the application. Any extension of theavailable events and their context information would mean to not only extendthe framework but also the accompanying JVM. As the provided events mainlyobserve the lifecycle of Java objects, and the low-level application behaviour,analyses written in Javana are mainly targeted on memory access profiling.
Comparison with ShadowVM
Sofya and Chord pre-process and dispatch events directly from the context ofthe observed application. As the frameworks and the observed application shareclasses necessary for buffering, network communication or file management, theevent dispatching may potentially influence the application behaviour, especiallyif the shared classes are also observed.
Caffeine, *J and Javana prevent the perturbation by using Java observationinterfaces. Such a solution provide good isolation, but limits the dynamic analysisto only predefined events.
ShadowVM prevents the perturbation by offloading the analysis out of thecontext of the observed application through JNI calls. Compared to Javana,ShadowVM is using the JNI native calls to offload arbitrary events. Javana isusing JNI to hook only memory-related JVM events.
Caffeine, Javana and Sofya3 stop the application while evaluating an event. Asall the frameworks are offloading events out of the application context, the com-munication adds additional delay to the evaluation. Even a very small analysiscapturing only small amount of events may substantially slow down the observedapplication.
*J and Chord improve the performance by buffering the events and evaluatingthem asynchronously. However, each Java object is represented only as a uniqueobject identification without any additional information.
Similar to *J and Chord, ShadowVM evaluates the events asynchronously.In addition, ShadowVM allows to access whole class hierarchy of an object andprovides all class information associated with a class. To furthermore improve
3When the communication is mediated through JDI.
104
the performance, ShadowVM introduces several event ordering models to reducelock contention while buffering the events.
6.3 Instrumentation and evaluation frameworks
without sources
To be able to provide a satisfying comparison with the related work, having accessto the source code of the described framework is a mandatory requirement as itis often the only source of the accurate documentation. In this subsection, weprovide a list of tools for which we were unable to find the references to theirsources.
• Aftersight [52] decouples the observed application from the evaluation byrunning the observed application in a dedicated virtual machine, loggingall non-deterministic inputs and replaying them on an isolated analysisplatform.
• Josh [50] is an open compiler solution for making aspect-oriented languageseasily extensible.
• MAP [43] is a meta-aspect protocol for rapid prototyping of dynamic anal-ysis.
• ConTest [71] Listeners is an instrumentation and runtime engine for multi-threaded systems.
• DejaVu [51] allows a deterministic replay of multi-threaded Java programs.
105

106
Chapter 7
Conclusion
Byte-code level program instrumentation is a difficult and error-prone task. Cur-rent instrumentation tools try to provide a higher level of abstraction to simplifythe specification of the instrumented locations and the code being inserted. How-ever, the tools still fail to provide a simple-but-versatile instrumentation API. Onone hand, there are bytecode transformation libraries able to perform arbitraryinstrumentation but not providing a high-level API which even a non-skilled1
developer could use. On the other hand, the tools providing the high-level APIto easily specify and guide instrumentation lack the flexibility and do not allowexperienced users to control the instrumentation process.
In this thesis we presented DiSL, an instrumentation framework that is tryingto bridge both worlds. DiSL provides high-level abstractions that a non-skilledprogrammer can use to assemble the desired instrumentation. An experienceddeveloper can design custom Markers, Guards and StaticContexts to select anarbitrary location for instrumentation and access custom context information.Given such modularity, DiSL has the flexibility of Java bytecode transformationlibraries but also provides the high-level API where only a very limited knowledgeof bytecode is required [76].
In DiSL, the developer has a full control over the instrumentation process. Nohidden allocation or additional code is inserted without the developer’s knowl-edge. The efficiency and the transparency during the weaving allows to betterpredict possible perturbation and more easily manage the incurred overhead.
Processing of analysis events triggered by the instrumentation can have unde-sired effects on the observed application. Observation problems such as missingevents or shared state corruption are hard to detect even for a skilled analysisdeveloper. ShadowVM addresses such problems by offloading the analysis out ofthe context of the observed application. By running the evaluation in a separateVM, the analysis is free to allocate memory, use all classes from the Java ClassLibrary or introduce arbitrary locking. The developer is thus freed from thinkingabout the possible interference and is able to fully concentrate on the analysislogic.
On the ShadowVM, the analysis accesses the object and class informationusing the Shadow API. For each transferred object, the analysis may explore theclass hierarchy and retrieve arbitrary class information using the reflection-likeAPI. The reclamation of an object and the termination of the observed applicationis announced through the Shadow API life-cycle events.
ShadowVM introduces several techniques to speed up the offloading process.ShadowVM separates the observation and the evaluation so they can run in-parallel. The introduced event ordering models help to decrease lock contentionwhile buffering the events and increase parallelism while evaluating the events.
ShadowVM uses standard JNI and JVMTI native interfaces for event offload-ing, hence it is deployable in production JVMs.
1A developer not familiar with the Java bytecode.
107
DiSL is used in several research projects at the author’s home department,University of Lugano and University of Darmstadt, with other universities show-ing interest in using DiSL. After a thorough review, DiSL was accepted to theSPEC RG tool repository2. DiSL (together with ShadowVM3) is available asopen-source under the Apache license in the OW2 software repository at http:
//disl.ow2.org/.
7.1 Future work
The following section covers various ideas and problems connected to dynamicanalysis still not solved by DiSL and ShadowVM.
DiSL
The instrumentation using DiSL is still not perfect. The analysis developer oftenknows which type of the application actions he wants to instrument. However,JVM may perform some of the actions in the native space, hence they cannot beeasily instrumented using Java bytecode instrumentation.
An example of such instrumentation is object allocation. In Java bytecode,objects are allocated using the new4 instruction. Unfortunately, JVM may allo-cate new objects in the native code, for example while loading new classes.
The analysis developer may decide to instrument the JNI calls responsible forobject allocation, but this is not a perfect solution. Not all objects are neces-sary allocated using a JNI call and such a solution would be probably heavilydependent on the particular JVM implementation.
The JVM provides an interface informing a developer about new object allo-cations in the native code. Therefore, DiSL could combine the instrumentationwith callbacks. We believe this is not a great solution either, as the callbacksdo not provide such flexibility and context information as the instrumentation.The adaptation of DiSL for supporting callbacks would also require to bend thelanguage to cooperate with specific events produced by various environments.
A solution to the problem may be in systems that currently serve only asresearch platforms, namely Maxine VM [30, 78] and JikesRVM [21, 44]. The VMsare fully implemented in Java and use only a very limited amount of native codefor bootstrap process, thus they do not hide object allocations or field assignmentsin native code. Use of bytecode instrumentation to observe such a system istherefore more thorough [41] compared to production JVMs, which are largelyimplemented in native code. Fortunately, we may observe a trend [11, 54] tomove from native code to Java code even in production JVMs and hopefully, wewill see more observable VMs in the future.
Another instrumentation problem not solved by DiSL is the timing of syn-chronization events. This is particularly problematic when observing access tovolatile variables. As the access to a volatile variable is based on atomic reads
2http://research.spec.org/tools/3DiSL and ShadowVM are currently distributed in one software bundle.4The new instruction has various alternatives to allocate arrays.
108
and writes, there is no simple instrumentation5 that could observe the order ofthe accesses to the variable without introduction of additional locking.
A possible solution is to use the Java Debugging Interface and intercept syn-chronization events using data breakpoints. Another approach we are investigat-ing is an encapsulation of the volatile variable that would allow to monitor thesynchronization order.
DiSL language would benefit from many small improvements. The instru-mentation written in DiSL could be validated using advanced static checking forproperties like modification of the state of the observed application. The in-strumentation scoping language and the Guard construct could be replaced withsingle mechanism. The synthetic local variables and thread local variables couldsupport better initialization. DiSL could provide custom dynamic contexts thatwould provide dynamic information based on the used Marker.
Various JVM enhancements would improve applicability of DiSL. For exam-ple, the JVM should be more tolerant (stable) while instrumenting core classes ofthe Java Class Library. The limits on the size of one method and the mandatoryStack Map Frames [15] complicate the instrumentation process.
A feature currently missing in DiSL is instrumentation of already runningapplications. DiSL was designed to support on-the-fly instrumentation, howeverthe implementation of some essential parts is still missing and a few technicalissues need to be resolved.
ShadowVM
A problem not entirely solved by ShadowVM is instrumentation. ShadowVMprovides a safe environment for evaluation of the analysis, but the event and itscontextual data still need to be gathered in the context of the observed appli-cation. The instrumentation is still potentially vulnerable to all the problemsconnected to in-process analysis evaluation. The advantage compared to thetraditional frameworks is a substantial reduction of the potentially harmful op-erations. The only responsibility of the instrumentation is to obtain the datarequired for the analysis, which normally means accessing variables on the (Ja-va bytecode) stack or request the field values. All other work, including eventbuffering and dispatching, is performed in the native code.
One solution is to move the context gathering to the native code. Such achange would demand creating a framework similar to DiSL in the native spaceand thoroughly explore whether the JVMTI and JNI interfaces do not interferewith the observed application and provide enough information so the solution hasthe same strength as in the Java code.
Another solution would require support from the JVM. The MultitenantJVM [31] allows to run multiple applications inside one JVM host by separatingshared resources like heap, file and socket I/O. We believe this could be a step inthe right direction also for the analysis evaluation.
Still, the features provided by Multitenant JVM are for now insufficient forthe dynamic analysis. The analysis evaluation would be run in the Multitenant
5By simple instrumentation we mean instrumentation inserted before or after the variableaccess.
109
JVM as a separate process. First, the Multitenant JVM would need to supportseparation between the (un)instrumented Java Class Libraries. Also, the anal-ysis evaluation would need to access and reflect any resource in the applicationbut only under a restricted mode where it cannot perform field writes or invokemethods (that would change the state of the observed application).
In addition to the better isolation, the runtime could support copy-on-writesnapshots of the analysed application. Using the snapshot, the analysis wouldobtain access to the state in which the event was triggered for the whole time ofthe event evaluation. As the snapshot mechanism would be probably costly, itwould be used only in cases where the analysis requires to traverse a large partof the heap during each event. Currently, such analyses reconstruct the wholeheap by monitoring all modifications to the heap and traverse it offline, which isincredibly costly. Alternatively, the analysis may also traverse the heap onlinewhen an event occurs, but the heap may be modified by other threads. Comparedto those techniques, the snapshot mechanism may provide better performance orheap immutability while traversing a large part of the heap during evaluation.
110
References
[1] abc: The AspectBench Compiler for AspectJ. http://www.sable.mcgill.
ca/abc/.
[2] ASM. http://asm.ow2.org/.
[3] AspectJ - crosscutting objects for better modularity. http://eclipse.org/aspectj/.
[4] BCEL - The Byte Code Engineering Library. http://commons.apache.
org/proper/commons-bcel/.
[5] BTrace. https://kenai.com/projects/btrace.
[6] Caffeine. http://www.yann-gael.gueheneuc.net/Work/Research/
Caffeine/Download/.
[7] Chord: A Program Analysis Platform for Java. http://pag.gatech.edu/
chord.
[8] DIOTA - Dynamic Instrumentation, Optimisation and Transformation ofApplications. http://www.elis.ugent.be/diota/.
[9] DynamoRIO - Dynamic Instrumentation Tool Platform. http://www.
dynamorio.org/.
[10] GNU gprof. http://sourceware.org/binutils/docs/gprof/.
[11] Graal Project. http://openjdk.java.net/projects/graal/.
[12] Intel VTune Amplifier XE 2013. http://software.intel.com/en-us/
intel-vtune-amplifier-xe.
[13] *J: A Tool for Dynamic Analysis of Java Programs. http://www.sable.
mcgill.ca/starj/.
[14] Java instrumentation interface. http://docs.oracle.com/javase/7/
docs/api/java/lang/instrument/Instrumentation.html.
[15] Java Stack Map Frame. http://docs.oracle.com/javase/specs/jvms/
se7/html/jvms-4.html#jvms-4.10.1.4.
[16] Javana. http://www.elis.ugent.be/javana/.
[17] Javassist - Java Programming Assistant. http://www.csg.ci.i.u-tokyo.
ac.jp/~chiba/javassist/.
[18] JDB: Java Debugger. http://docs.oracle.com/javase/7/docs/
technotes/tools/windows/jdb.html.
[19] JDI - Java Debug Interface. http://docs.oracle.com/javase/7/docs/
jdk/api/jpda/jdi/index.html.
111
[20] JDWP - Java Debug Wire Protocol. http://docs.oracle.com/javase/1.5.0/docs/guide/jpda/jdwp-spec.html.
[21] Jikes RVM (Research Virtual Machine). http://jikesrvm.org/.
[22] JIProlog - Java Internet Prolog. http://www.jiprolog.com/.
[23] JMX - Java Management Extensions. http://docs.oracle.com/javase/
7/docs/technotes/guides/management/.
[24] JNI - Java Native Interface. http://docs.oracle.com/javase/1.5.0/
docs/guide/jni/.
[25] JPDA - Java Platform Debugger Architecture. http://docs.oracle.com/
javase/7/docs/technotes/guides/jpda/jpda.html.
[26] JPDA - Structure Overview. http://docs.oracle.com/javase/7/docs/
technotes/guides/jpda/architecture.html.
[27] JVMDI - Java Virtual Machine Debug Interface Reference. http://www.
oracle.com/technetwork/java/javase/jvmdi-spec-135507.html.
[28] JVMPI - Java Virtual Machine Profiler Interface. http://docs.oracle.
com/javase/1.5.0/docs/guide/jvmpi/jvmpi.html.
[29] JVMTI - JVM Tool Interface. http://docs.oracle.com/javase/1.5.0/
docs/guide/jvmti/jvmti.html.
[30] Maxine VM. https://wikis.oracle.com/display/MaxineVM/Home.
[31] Multitenant JVM. http://www.ibm.com/developerworks/java/library/j-multitenant-java/index.html?ca=drs-.
[32] OProfile. http://oprofile.sourceforge.net/.
[33] OSGi - The Dynamic Module System for Java. http://www.osgi.org.
[34] Pin - A Dynamic Binary Instrumentation Tool. http://software.intel.
com/en-us/articles/pin-a-dynamic-binary-instrumentation-tool.
[35] Polyglot - A compiler front end framework for building Java language exten-sions. http://www.cs.cornell.edu/Projects/polyglot/.
[36] Sofya: A Java Bytecode Analysis Tool. http://sofya.unl.edu/.
[37] Soot: a Java Optimization Framework. http://www.sable.mcgill.ca/
soot/.
[38] SystemTap. http://sourceware.org/systemtap/.
[39] The RoadRunner Dynamic Analysis. http://dept.cs.williams.edu/
~freund/rr/.
[40] Valgrind. http://valgrind.org/.
112
[41] Virtual Machine Level Analysis. https://wikis.oracle.com/display/
MaxineVM/Virtual+Machine+Level+Analysis.
[42] VisualVM: All-In-One Java Troubleshooting Tool. http://visualvm.java.net/.
[43] M. Achenbach and K. Ostermann. A meta-aspect protocol for developingdynamic analyses. In Runtime Verification, pages 153–167. Springer, 2010.
[44] B. Alpern, C. R. Attanasio, J. J. Barton, M. G. Burke, P. Cheng, J.-D.Choi, A. Cocchi, S. J. Fink, D. Grove, M. Hind, et al. The Jalapeno virtualmachine. IBM Systems Journal, 39(1):211–238, 2000.
[45] P. Avgustinov, A. S. Christensen, L. Hendren, S. Kuzins, J. Lhotak,O. Lhotak, O. de Moor, D. Sereni, G. Sittampalam, and J. Tibble. abc:An extensible AspectJ compiler. In Transactions on Aspect-Oriented Soft-ware Development I, pages 293–334. Springer, 2006.
[46] D. L. Bruening. Efficient, transparent, and comprehensive runtime code ma-nipulation. PhD thesis, Massachusetts Institute of Technology, 2004.
[47] E. Bruneton, R. Lenglet, and T. Coupaye. ASM: A code manipulation toolto implement adaptable systems. In Adaptable and extensible componentsystems, 2002.
[48] B. Cantrill, M. W. Shapiro, A. H. Leventhal, et al. Dynamic Instrumentationof Production Systems. In USENIX Annual Technical Conference, GeneralTrack, pages 15–28, 2004.
[49] S. Chiba. Load-Time Structural Reflection in Java. In E. Bertino, edi-tor, ECOOP 2000 — Object-Oriented Programming, volume 1850 of LectureNotes in Computer Science, pages 313–336. Springer Berlin Heidelberg, 2000.
[50] S. Chiba and K. Nakagawa. Josh: An Open AspectJ-like Language. InProceedings of the 3rd International Conference on Aspect-oriented SoftwareDevelopment, AOSD ’04, pages 102–111, New York, NY, USA, 2004. ACM.
[51] J.-D. Choi, B. Alpern, T. Ngo, M. Sridharan, and J. Vlissides. Aperturbation-free replay platform for cross-optimized multithreaded applica-tions. In Parallel and Distributed Processing Symposium., Proceedings 15thInternational, pages 10–pp. IEEE, 2001.
[52] J. Chow, T. Garfinkel, and P. M. Chen. Decoupling dynamic program anal-ysis from execution in virtual environments. In USENIX 2008 Annual Tech-nical Conference, pages 1–14, 2008.
[53] M. Dahm. Byte code engineering. In JIT’99, pages 267–277. Springer, 1999.
[54] G. Duboscq, L. Stadler, T. Wurthinger, D. Simon, C. Wimmer, andH. Mossenbock. Graal ir: An extensible declarative intermediate repre-sentation. In Proceedings of the Asia-Pacific Programming Languages andCompilers Workshop, 2013.
113
[55] B. Dufour, L. Hendren, and C. Verbrugge. *J: A Tool for Dynamic Anal-ysis of Java Programs. In Companion of the 18th Annual ACM SIGPLANConference on Object-oriented Programming, Systems, Languages, and Ap-plications, OOPSLA ’03, pages 306–307, New York, NY, USA, 2003. ACM.
[56] C. Flanagan and S. N. Freund. The RoadRunner Dynamic Analysis Frame-work for Concurrent Programs. In Proceedings of the 9th ACM SIGPLAN-SIGSOFT Workshop on Program Analysis for Software Tools and Engineer-ing, PASTE ’10, pages 1–8, New York, NY, USA, 2010. ACM.
[57] S. L. Graham, P. B. Kessler, and M. K. Mckusick. Gprof: A Call GraphExecution Profiler. In Proceedings of the 1982 SIGPLAN Symposium onCompiler Construction, SIGPLAN ’82, pages 120–126, New York, NY, USA,1982. ACM.
[58] Y.-G. Gueheneuc, R. Douence, and N. Jussien. No Java without caffeine: Atool for dynamic analysis of Java programs. In Automated Software Engi-neering, 2002. Proceedings. ASE 2002. 17th IEEE International Conferenceon, pages 117–126. IEEE, 2002.
[59] S. Kell, D. Ansaloni, W. Binder, and L. Marek. The JVM is Not ObservableEnough (and What to Do About It). In Proceedings of the Sixth ACM Work-shop on Virtual Machines and Intermediate Languages, VMIL ’12, pages33–38, New York, NY, USA, 2012. ACM.
[60] G. Kiczales, E. Hilsdale, J. Hugunin, M. Kersten, J. Palm, and W. G. Gris-wold. An overview of AspectJ. In ECOOP 2001—Object-Oriented Program-ming, pages 327–354. Springer, 2001.
[61] G. Kiczales, J. Lamping, A. Mendhekar, C. Maeda, C. Lopes, J.-M. Loingti-er, and J. Irwin. Aspect-oriented programming. In ECOOP’97 — Object-Oriented Programming, volume 1241 of Lecture Notes in Computer Science,pages 220–242. Springer Berlin Heidelberg, 1997.
[62] A. Kinneer, M. B. Dwyer, and G. Rothermel. Sofya: A flexible framework fordevelopment of dynamic program analyses for Java software. CSE Technicalreports, page 20, 2006.
[63] A. Kinneer, M. B. Dwyer, and G. Rothermel. Sofya: Supporting RapidDevelopment of Dynamic Program Analyses for Java. In Companion to theProceedings of the 29th International Conference on Software Engineering,ICSE COMPANION ’07, pages 51–52, Washington, DC, USA, 2007. IEEEComputer Society.
[64] C.-K. Luk, R. Cohn, R. Muth, H. Patil, A. Klauser, G. Lowney, S. Wallace,V. J. Reddi, and K. Hazelwood. Pin: Building Customized Program AnalysisTools with Dynamic Instrumentation. In Proceedings of the 2005 ACM SIG-PLAN Conference on Programming Language Design and Implementation,PLDI ’05, pages 190–200, New York, NY, USA, 2005. ACM.
114
[65] J. Maebe, D. Buytaert, L. Eeckhout, and K. De Bosschere. Javana: ASystem for Building Customized Java Program Analysis Tools. SIGPLANNot., 41(10):153–168, Oct. 2006.
[66] J. Maebe, M. Ronsse, and K. De Bosschere. DIOTA: Dynamic instrumen-tation, optimization and transformation of applications. In Compendium ofWorkshops and Tutorials held in conjunction with PACT’02, 2002.
[67] P. Moret, W. Binder, and E. Tanter. Polymorphic Bytecode Instrumen-tation. In Proceedings of the Tenth International Conference on Aspect-oriented Software Development, AOSD ’11, pages 129–140, New York, NY,USA, 2011. ACM.
[68] M. Naik, A. Aiken, and J. Whaley. Effective Static Race Detection for Java.In Proceedings of the 2006 ACM SIGPLAN Conference on ProgrammingLanguage Design and Implementation, PLDI ’06, pages 308–319, New York,NY, USA, 2006. ACM.
[69] N. Nethercote and J. Seward. Valgrind: A program supervision framework.Electronic notes in theoretical computer science, 89(2):44–66, 2003.
[70] N. Nethercote and J. Seward. Valgrind: A Framework for Heavyweight Dy-namic Binary Instrumentation. In Proceedings of the 2007 ACM SIGPLANConference on Programming Language Design and Implementation, PLDI’07, pages 89–100, New York, NY, USA, 2007. ACM.
[71] Y. Nir-Buchbinder and S. Ur. ConTest Listeners: A Concurrency-oriented In-frastructure for Java Test and Heal Tools. In Fourth International Workshopon Software Quality Assurance: In Conjunction with the 6th ESEC/FSEJoint Meeting, SOQUA ’07, pages 9–16, New York, NY, USA, 2007. ACM.
[72] N. Nystrom, M. R. Clarkson, and A. C. Myers. Polyglot: An extensible com-piler framework for java. In Compiler Construction, pages 138–152. Springer,2003.
[73] K. O’Hair. The JVMPI Transition to JVMTI. http://www.oracle.
com/technetwork/articles/javase/jvmpitransition-138768.html, Jul2004.
[74] V. Prasad, W. Cohen, F. C. Eigler, M. Hunt, J. Keniston, and B. Chen.Locating System Problems Using Dynamic Instrumentation. In Proceedings2005 Ottawa Linux Symposium (OLS), Jul 2005.
[75] J. Reinders. VTune performance analyzer essentials. Intel Press, 2005.
[76] A. Sarimbekov, Y. Zheng, D. Ansaloni, L. Bulej, L. Marek, W. Binder,P. Tuma, and Z. Qi. Productive Development of Dynamic Program AnalysisTools with DiSL. In Software Engineering Conference (ASWEC), 2013 22ndAustralian, pages 11–19, June 2013.
[77] R. Vallee-Rai, P. Co, E. Gagnon, L. Hendren, P. Lam, and V. Sundaresan.Soot - a Java Bytecode Optimization Framework. In Proceedings of the 1999
115
Conference of the Centre for Advanced Studies on Collaborative Research,CASCON ’99, pages 13–. IBM Press, 1999.
[78] C. Wimmer, M. Haupt, M. L. Van De Vanter, M. Jordan, L. Daynes, andD. Simon. Maxine: An Approachable Virtual Machine for, and in, Java.ACM Trans. Archit. Code Optim., 9(4):30:1–30:24, Jan. 2013.
116
List of Publications
Refereed Conference Publications
L. Marek, A. Villazon, Y. Zheng, D. Ansaloni, W. Binder, and Z. Qi. DiSL:A Domain-specific Language for Bytecode Instrumentation. In Proceedingsof the 11th Annual International Conference on Aspect-oriented SoftwareDevelopment, AOSD ’12, pages 239–250, New York, NY, USA, 2012. ACM.
L. Marek, S. Kell, Y. Zheng, L. Bulej, W. Binder, P. Tuma, D. Ansaloni,A. Sarimbekov, and A. Sewe. ShadowVM: Robust and Comprehensive Dy-namic Program Analysis for the Java Platform. In Proceedings of the 12thInternational Conference on Generative Programming: Concepts & Experi-ences, GPCE ’13, pages 105–114, New York, NY, USA, 2013. ACM.
L. Marek, Y. Zheng, D. Ansaloni, L. Bulej, A. Sarimbekov, W. Binder, andP. Tuma. Introduction to dynamic program analysis with DiSL. Scienceof Computer Programming, 5th Special Issue on Experimental Software andToolkits, In Press.
L. Marek, Y. Zheng, D. Ansaloni, A. Sarimbekov, W. Binder, P. Tuma, andZ. Qi. Java Bytecode Instrumentation Made Easy: The DiSL Framework forDynamic Program Analysis (Demo paper). In Programming Languages andSystems, volume 7705 of Lecture Notes in Computer Science, pages 256–263.Springer Berlin Heidelberg, 2012.
L. Marek, Y. Zheng, D. Ansaloni, L. Bulej, A. Sarimbekov, W. Binder, andZ. Qi. Introduction to Dynamic Program Analysis with DiSL (Demo paper).In Proceedings of the 4th ACM/SPEC International Conference on Perfor-mance Engineering, ICPE ’13, pages 429–430, New York, NY, USA, 2013.ACM.
Y. Zheng, D. Ansaloni, L. Marek, A. Sewe, W. Binder, A. Villazon, P. Tuma,Z. Qi, and M. Mezini. Turbo DiSL: Partial Evaluation for High-Level Byte-code Instrumentation. In Objects, Models, Components, Patterns, volume7304 of Lecture Notes in Computer Science, pages 353–368. Springer BerlinHeidelberg, 2012.
A. Sarimbekov, Y. Zheng, D. Ansaloni, L. Bulej, L. Marek, W. Binder, P. Tuma,and Z. Qi. Productive Development of Dynamic Program Analysis Tools withDiSL. In Software Engineering Conference (ASWEC), 2013 22nd Australian,pages 11–19, June 2013.
S. Kell, D. Ansaloni, W. Binder, and L. Marek. The JVM is Not ObservableEnough (and What to Do About It). In Proceedings of the Sixth ACM Work-shop on Virtual Machines and Intermediate Languages, VMIL ’12, pages33–38, New York, NY, USA, 2012. ACM.
D. Ansaloni, W. Binder, C. Bockisch, E. Bodden, K. Hatun, L. Marek, Z. Qi,A. Sarimbekov, A. Sewe, P. Tuma, and Y. Zheng. Challenges for Refinement
117
and Composition of Instrumentations: Position Paper. In Software Compo-sition, volume 7306 of Lecture Notes in Computer Science, pages 86–96.Springer Berlin Heidelberg, 2012.
V. Babka, L. Marek, and P. Tuma. When Misses Differ: Investigating Impact
of Cache Misses on Observed Performance. In Proceedings of the 15th Inter-national Conference on Parallel and Distributed Systems (ICPADS 2009),pages 112–119. IEEE, December 2009.
T. Martinec, L. Marek, A. Steinhauser, P. Tuma, Q. Noorshams, A. Rentschler,and R. Reussner. Constructing Performance Model of JMS Middleware Plat-form. In Proceedings of the 5th ACM/SPEC International Conference onPerformance Engineering, ICPE ’14, pages 123–134, New York, NY, USA,2014. ACM.
Technical Reports
V. Babka, L. Bulej, M. Decky, J. Kraft, P. Libic, L. Marek, C. Seceleanu, andP. Tuma. Resource usage modeling, Q-ImPrESS project deliverable D3.3.http://www.q-impress.eu, February 2009.
V. Babka, L. Bulej, P. Libic, L. Marek, T. Martinec, A. Podzimek, and P. Tuma.Resource impact analysis, Q-ImPrESS project deliverable D3.4. http://
www.q-impress.eu, January 2011.
V. Babka, L. Bulej, A. Ciancone, A. Filieri, M. Hauck, P. Libic, L. Marek,J. Stammel, and P. Tuma. Prediction Validation, Q-ImPrESS Project De-liverable D4.2. http://www.q-impress.eu/, 2010.
J. Keznikl, M. Malohlava, L. Marek, and P. Tuma. Ferdinand Project Mid-dleware List, Tech. Report No. 2011/2. Dep. of SW Engineering, CharlesUniversity in Prague, http://d3s.mff.cuni.cz/publications/download/KezniklMalohlavaMarekTuma-MiddlewareList.pdf, 2011.
L. Bulej, L. Marek, and P. Tuma. Object Instance Profiling,Tech. Report No. 2009/7. Dep. of SW Engineering, Charles Uni-versity in Prague, http://d3s.mff.cuni.cz/publications/download/
BulejMarekTuma-Technical2009-07.pdf, 2009.
Other Publications
L. Marek, Y. Zheng, D. Ansaloni, W. Binder, Z. Qi, and P. Tuma. DiSL:An Extensible Language for Efficient and Comprehensive Dynamic ProgramAnalysis. In Proceedings of the Seventh Workshop on Domain-Specific As-pect Languages, DSAL ’12, pages 27–28, New York, NY, USA, 2012. ACM.Invited talk at DSAL ’12.
118