Embed Size (px)
Citation preview

Instrumental Variables Method for CausalInference in Observational Studies
John PuraBIOS790
October 15, 2015
John PuraBIOS790 Instrumental Variables Method for Causal Inference in Observational Studies

Causal Inference
Goal is to estimate causal treatment e�ect Y (1) ≠ Y (0), whereY (0), Y (1) are potential, unobserved outcomesRecall the fundamental problem of causal inference: We cannotdirectly estimate the above quantity because for an individual,we only observe Y = TY (1) + (1 ≠ T )Y (0), where T is thetreatment status (i.e. treatment the individual receives).Treatment-outcome relationship may be obscured by combinede�ect of measured and unmeasured confounders
John PuraBIOS790 Instrumental Variables Method for Causal Inference in Observational Studies

Some terminology
Endogenous variable: variable correlated with error term (inour case this will be treatment received)Exogenous variable: variable uncorrelated with error term (inour case this will be the IV - to be defined)Endogeneity problem: situation in which the regressors ofinterest (i.e. treatment) are correlated with the error term(leads to biased e�ect estimates, e.g. in OLS)
Omitted variable/unmeasured confounding is a type ofendogeneity problemEndogeneity of the treatment suggests non-ignorability oftreatment status - i.e. there are systematic factors thatpredispose individuals to receive a particular treatment
John PuraBIOS790 Instrumental Variables Method for Causal Inference in Observational Studies

Instrumental variables
In the presence of unconfounded treatment assignment, IVanalysis can be used to eliminate bias from certain threats tointernal validitity (e.g. unmeasured confounders) that plaguetraditional methods (e.g. OLS)
U æ T æ Y Ω X , ‘
An variable U is an instrument for the causal e�ect of T on Y
if the following general assumptions hold:1. Relevance: U is correlated with the endogenous variable T (i.e.
Cov(U, T ) ”= 0)2. Independence: U has no independent e�ect on Y , except
through T
3. Exclusion Restriction: U is exogenous (i.e. Cov(U, ‘) = 0)
John PuraBIOS790 Instrumental Variables Method for Causal Inference in Observational Studies

Instrumental variables
IVs are a “natural experiment” that are randomly assigned toeach individual and influences the outcome only through thetreatmentInstrumental variables splits the variation in treatment variableinto an exogenous (uncorrelated with ‘) part and anendogenous (correlated with ‘) partIV analysis trades the “no unmeasured confounding” (noendogeneity) assumption for exogenous instrumentsassumption, so that IV framework is useful when compliance totreatment is an issue (non-ignorable treatment status)
John PuraBIOS790 Instrumental Variables Method for Causal Inference in Observational Studies

What can we estimate?
Intent-to-treat e�ect (ITTE) - e�ect of being eligible/assignedto the treatmentAverage treatment e�ect (ATE) - e�ect of treatment onrandomly selected personAverage treatment e�ect for the treated (ATT) - e�ect oftaking treatment or average treatment e�ect for the treated(ATT)
If treatment is randomly assigned, then ATE = ATTGenerally, these are di�erent due to selection into treatment
John PuraBIOS790 Instrumental Variables Method for Causal Inference in Observational Studies

What can we estimate?
Local average treatment e�ect (LATE): - average treatmente�ect for those who comply with treatment assignment; ratioof ITTE to proportion of compliers in the population (seeAngrist, et al., JASA 1996)
Requires extra assumptionsNot the same as ATE/ATT (unless we have large number ofcompliers/no always-takers)Aims to recover an analog of ATE from ITTEAlways larger than ITTEDi�erent instruments will give di�erent LATE estimate
John PuraBIOS790 Instrumental Variables Method for Causal Inference in Observational Studies

Basic IV Estimation
Overall IV based estimate - weighted average ofstratum-specific estimates (over distribution of T).
Strata with high compliance rates are upweightedReflects the e�ect of treatment had everyone in the populationbeen compliant
Wald-estimator: ratio of U-Y relationship to U-T relationship(instrument strength)
Violated assumptions may magnify residual confounding biasfrom numeratorWeak instruments (denominator close to zero) may produceunstable e�ects
John PuraBIOS790 Instrumental Variables Method for Causal Inference in Observational Studies

Two Model-based Frameworks for IV Estimation
Structural Equation ModelsEach equation in the model represents a causal linkAssumes constant treatment e�ect conditional on observedcharacteristics
Potential Outcomes (aka Rubin Causal Model)Extension of SEM framework in the presence of heterogeneoustreatment e�ectRequires extra assumptions (see Angrist, et al, JASA 1996) todefine a valid instrument
John PuraBIOS790 Instrumental Variables Method for Causal Inference in Observational Studies

2-Stage Least Squares
Both the SEM and RCM frameworks use a 2-stage approachwith the following estimating equations
Stage 1: T = U“ + X– + ‹
Stage 2: Y = T— + ‘
John PuraBIOS790 Instrumental Variables Method for Causal Inference in Observational Studies

2-Stage Least Squares
The 2SLS estimation is as follows1. Fit the Stage 1 propensity model to get predicted T̂
2. Substitute Stage 1 fitted values into Stage 2
Need robust standard errors as SEs from Stage 2 do not takeinto account estimation in the Stage 1To identify the treatment e�ect, 2SLS only retains thevariation in T that is correlated with U and uncorrelated withomitted variables (and thus hopefully exogenous)
This is done in Stage 1generally less e�cient than traditional outcome regression
Stage 1 F-tests can be used to monitor constribution ofadditional instruments
John PuraBIOS790 Instrumental Variables Method for Causal Inference in Observational Studies

Caveats
IV are consistent, but not as e�cient as OLSEstimation relies on asymptotic (large-sample) theory, if the IVmeets general assumptionsIV estimands built around estimates of T̂ , rather than a fixed,true value of T . Therefore, IV estimates have finite samplebias, which ø with number of instruments, but ¿ wheninstruments become highly correlated with endogenousvariables and with ø n.
John PuraBIOS790 Instrumental Variables Method for Causal Inference in Observational Studies

Example - Catheterization in Treatment of Acute MI
Example found in Newhouse & McClellan, 1998Observational study of 205,021 elderly (>65 yrs) patients whosu�ered an AMI in 1987. Patients were catheterized and/orrevascularized. Revascularization is never done without priorcatheterization.Study goal is to evaluate the e�ect of catheterization andassociated revascularization on mortality (measured at varioustimepoints)
John PuraBIOS790 Instrumental Variables Method for Causal Inference in Observational Studies
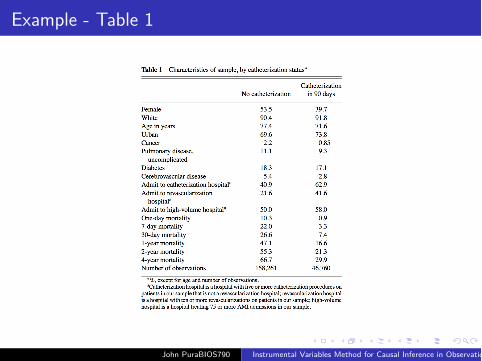
Example - Table 1
John PuraBIOS790 Instrumental Variables Method for Causal Inference in Observational Studies

Example - Table 1
About 30% of subjects were catheterized within 90 days of AMIWithin 4 years following AMI, there appears to be strong e�ectof catheterizationIn an randomized trial, we would expect this 37% di�erence tohold.It is clear that certain characteristics predispose individuals toreceive either treatment
Those not catheterized were older and had higher prevalence ofcomorbidities.
John PuraBIOS790 Instrumental Variables Method for Causal Inference in Observational Studies

Example - Table 1
Large di�erence in mortality at day 1 may suggest thatdi�erence in mortality at day 1 stems from underlyingdi�erences in health status between the two groupsLastly, catheterized patients were more likely to be admitted tocath, revasc, and HV hospitalsSome of the di�erences in observed mortality may result fromdi�erent hospital practices, independent of the proceduresgiven to the patients.
John PuraBIOS790 Instrumental Variables Method for Causal Inference in Observational Studies

Example - Table 1
After OLS and adjusting for patient and hospitalcharacteristics, there still appeared to be residual confounding -di�erence in mortality rates consistently increase from day 1(7%) to 4 years (28%)Use IV to estimate procedure e�ect via 3 instruments:distances to catheterization, revascularlization and HVhospitals (median split of distance)
John PuraBIOS790 Instrumental Variables Method for Causal Inference in Observational Studies

Example - Table 2
John PuraBIOS790 Instrumental Variables Method for Causal Inference in Observational Studies

Example - Check IV Assumptions
Relevance: Distance to cath hospital is correlated with receivingcatheterization
Those living Æ 2.5 mi. of a cath hospital have a 6.7% greaterchance of receiving cath within 90 days following AMI (and3.5% greater chance of subsequent revasc)
John PuraBIOS790 Instrumental Variables Method for Causal Inference in Observational Studies

Example - Check IV Assumptions
Independence: One can see from the table that mortality rates areroughly similar across di�. distance group from 1 day to 4 yearsafter AMI. Comorbidity rates are also similar. Caution: if di�.distance was associated with clinical severity of heart attack, thenassumption is not met. However, assume for now that independenceis reasonable. ## Example - Check IV AssumptionsExclusion restriction: Assume for now that it is satisfied.However, violations may arise if regional cath rates were low andassociated with worse health states because of access-to-care issuesor if traveling greater distances indicated poor access to otherhealth care services.
John PuraBIOS790 Instrumental Variables Method for Causal Inference in Observational Studies
Example - Initial Estimate
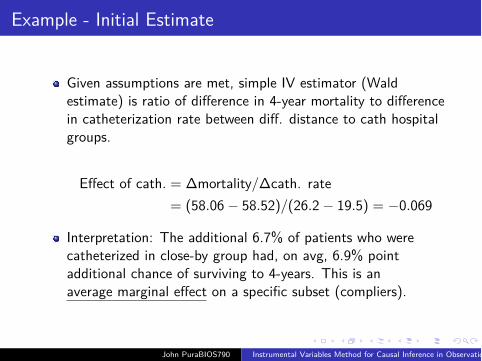
Given assumptions are met, simple IV estimator (Waldestimate) is ratio of di�erence in 4-year mortality to di�erencein catheterization rate between di�. distance to cath hospitalgroups.
E�ect of cath. = �mortality/�cath. rate= (58.06 ≠ 58.52)/(26.2 ≠ 19.5) = ≠0.069
Interpretation: The additional 6.7% of patients who werecatheterized in close-by group had, on avg, 6.9% pointadditional chance of surviving to 4-years. This is anaverage marginal e�ect on a specific subset (compliers).
John PuraBIOS790 Instrumental Variables Method for Causal Inference in Observational Studies

Example - Table 2
6.9% figure may be too optimistic.Patient and hospital characteristics were not controlled for(though they appear balanced across groups)Largest di�erence is admission to HV hospitalCan use other IVs (and covariates) to control for admission toIV hospital and estimate e�ect of procedure (Table 3)
John PuraBIOS790 Instrumental Variables Method for Causal Inference in Observational Studies

Example - Table 3
John PuraBIOS790 Instrumental Variables Method for Causal Inference in Observational Studies

Example - Table 3
Adjusting for demographics, admission to HV hospital and ruralresidence reduced estimated e�ect from ~7% to ~5%.But there is 5% point reduction from catheterization at day,before procedure could have life-saving e�ect!It is possible something associated with cath (not cath itself)has a beneficial e�ect of mortality (e.g. hospitals with cathunits more likely to have cardiologists and nurses treating AMIpatients, treatment practices better than less specializedpersonnel)
John PuraBIOS790 Instrumental Variables Method for Causal Inference in Observational Studies

Example - Table 3
Results in Table 3 cannot be used to make inferences aboutthe e�ects of cath and revasc on the “average elderly person”.Rather, the 5% point reduction is solely in the populationwhose treatment changes via their location (compliers)
John PuraBIOS790 Instrumental Variables Method for Causal Inference in Observational Studies


![Bayesian Causal Inference - uni-muenchen.de...from causal inference have been attracting much interest recently. [HHH18] propose that causal [HHH18] propose that causal inference stands](https://img.pdfslide.us/doc/110x75/5ec457b21b32702dbe2c9d4c/bayesian-causal-inference-uni-from-causal-inference-have-been-attracting.jpg)