Embed Size (px)
Citation preview

1
INSTRUMENT DEVELOPMENT AND SUMMARY OF RESULTS FROM THE PISA-BASED
TEST FOR SCHOOLS PILOT IN 2012
Introduction
1. This note describes the main phases of the development of the PISA-Based Test for Schools
assessment, including the development of items, the results of the international equating study, the
outcomes of the pilot trial conducted with schools and local school systems, and concludes by setting out
options for country-specific uses of the assessment. This note is based on a briefing to the PISA Governing
Board in 2012.
2. The PISA-Based test for schools is based on three of the PISA assessment frameworks: reading
literacy, mathematical literacy and scientific literacy. Results of the test will be comparable to existing
PISA scales to allow for benchmarking with international PISA results, to the extent that the test is
administered under appropriate conditions. In countries that implement the assessment, schools, networks
of schools and local education practitioners will be able to administer the test and obtain results that will
allow them to benchmark the performance of their schools internationally.
3. The PISA-Based Test for Schools aims to support international benchmarking and improvement
efforts of schools, networks and local educators by providing descriptive information and analyses on the
skills and creative application of knowledge of 15-year-old students in reading, mathematics, and science
that are comparable to existing PISA scales. At the same time, researchers and educators will have the
option of using the PISA-based test, calibrated on the PISA scales and validated, thereby decreasing
security pressures on the main PISA secure items.
Development of items and international equating study
4. This section describes the development of items and the international equating study that was
undertaken by the Australian Council for Educational Research (ACER). The section describes the
technical procedures that were followed for item development and the equating of the new items to
existing PISA scales. The equating study served two key functions: one of field-trialling a pool of 284
newly developed items and two, of validating the equivalence of these items to the PISA scales.
Instrument Design and Item development
5. The OECD Secretariat commissioned ACER in 2010 to begin initial design and development of
the cognitive instruments of the PISA-based test for schools. As the initial design and item development
phase was implemented by ACER, the OECD (through the Central Purchasing Group) held a competitive
call-for-tenders process in April-June 2011 to award the contract for further item development and the
implementation of an international field trial and equating study. The call-for-tenders was sent to 31
suppliers from which ACER, CTB/McGraw-Hill and the National Foundation for Educational Research
(NFER) submitted bids. The bids were reviewed by a Technical Review Panel (TRP) consisting of five
invited experts (Mark Wilson/USA, José Luis Gaviria/Spain, Rosario Martinez Arias/Spain, Henry
Braun/USA, Richard Wolfe/Canada) and two OECD analysts from the PISA team. Following the
recommendation of the TRP, the contract was awarded to ACER based on the technical strengths of the

2
bid, particularly the item development process (similar to the main PISA studies) including cognitive
walkthroughs, cognitive interviews and cognitive comparison studies.
6. ACER developed 421 items for the PISA-based test for schools in a similar fashion as that used
for items for the main PISA studies.1 The development of the items was based on the 2009 assessment
frameworks for reading and science, and the 2012 framework for mathematics. The OECD also requested
that ACER ensure an appropriate balance of item-response types (i.e. similar to the main PISA studies) and
of item difficulties, and to ensure sufficient construct representation. ACER was also asked to provide
coding guides that would allow consistent and accurate coding by expert coders.
7. ACER assembled 20 item developers among which were included individuals who have been
involved in test development for the PISA international surveys. The number of items developed for the
assessment (to the cognitive interview stage) was more than four times the number required for the final
instruments (approximately 140), which is similar to the ratio applied for the main PISA studies, from
development to the main survey.
8. ACER sought feedback from external domain experts in order to check and refine the quality of
the items to be selected for the assessment. In order to mirror the PISA quality in the test instruments as
much as possible, ACER approached current and past members of the PISA expert groups, and highly-
regarded test developers from the PISA Consortia 2000-2012. Following the procedures used for the
reviews of items conducted for the main PISA studies, feedback was requested from content experts on
curriculum relevance and interest level for 15-year-olds, authenticity of context, and relevance to
preparedness for life. Two mathematics, three reading and two science experts were also asked by ACER
to identify any cultural or gender concerns, potential translation issues, problems with the coding guides or
other issues such as the categorisation according to framework variables. Finally experts were asked to
give an overall rating on priority for inclusion in the final instruments.
9. For the selection of items, the following criteria were used: fit to framework, a range of
difficulty, good representation of content, interest level for 15-year-olds, likely endurance over time, and
permission to use any third party material. In addition, domain-specific characteristics of the items (text
format, type, situation and aspect for reading items; process, content and context for mathematics items;
and competency, knowledge about and of science) were considered for their selection in the international
equating study, as well as item response types (e.g. multiple choice and constructed response, both expert
and manual). The ultimate goal was to mirror as much as possible the framework coverage, item difficulty
distribution and item response types as the main PISA 2009 study.
10. As part of the instrument development process, a small group of recognised experts in the fields
of test development, test equating, Rasch models and scaling were invited by the Secretariat to participate
in the Technical Review Group (TRG) from January 2012 onwards. The TRG is independent of ACER and
is chaired by Mark Wilson (BEAR/U.C. Berkeley, U.S.A.) and includes Frank Rijmen (ETS, U.S.A.) and
Richard Wolfe (Professor emeritus, DPE Chair/Ontario Institute for Studies in Education
(OISE)/University of Toronto, Canada). The TRG has been asked to review the technical parameters of the
1 . Cognitive walkthroughs involve all items undergoing a review process through which items are closely reviewed and scrutinised by
professional item writers to ensure items comply with intended designs (also referred to sometimes as item panelling or shredding. Items routinely undergo significant modifications for improvement following this step. Cognitive interviews involve test developers
working with four or five 14- to 16-year-olds. Each item is exposed to a small group of students. Cognitive group interviews are also
used to further expose fundamental aspects of how students perceive and react to items. These cognitive interviews provide evidence relating to the cognitive processes involved as students work through items. Cognitive comparison studies involve piloting sets of
items with larger numbers of students in schools. Each unit is piloted with a convenience sample of approximately 30 students (15
year-olds) in the country concerned. This allows the relative difficulty of items to be compared (e.g. error percentage, time to complete) and real student responses to be obtained to refine and illustrate scoring guides.

3
instruments and provide expert recommendations on specific technical areas such as the equating study
design, scaling models and methods for the computation of standard errors of mean estimates.
Design and implementation of the equating study
11. The translation and adaptation process for the new items was conducted by ACER following the
procedures used for the main PISA studies, including co-ordinating with national NPMs, for example, in
Canada and the U.K. and using the Translation and Adaptation Spreadsheets (TAS). For the U.S.-version
of the items/units, ACER directly co-ordinated with local partners with long experience working on the
main PISA assessments. A similar procedure was also implemented for the student and school
questionnaires. In keeping with the OECD policy of using British English for source versions, the U.K.
versions of the items were used as the source version of the items.
Table 1. Summary of items developed and selected for the international equating study and final instruments
Items developed for
assessment
Selected and used for
equating study
Selected for the pilot
instruments
Reading 225 100 47
Mathematical 161 75 40
Scientific 225 114 54
611 289 141
12. ACER conducted the international equating study between May 2011 and February 2012 with
over 5600 students in Australia, Ireland, the U.K., the U.S. and with international schools, in co-ordination
with NFER in the U.K., Westat in the U.S. and Educational Research Centre/St Patrick’s College in
Ireland. In the first phase of the equating study, 64 PISA-secure items (28 in reading, 16 in mathematics
and 20 in science) were included in order to obtain 68 new items calibrated on the existing PISA scales that
acted, in turn, as the anchor items for the second phase of the equating study. The number of PISA-secure
items included in the equating study is based on the linking process used between previous PISA rounds
(e.g. 26 items for reading).
13. ACER and its implementation partners followed the PISA 2012 Field Trial quality assurance
procedures relating to printing quality, security of materials and equivalence to source versions. Test
administrators for the FT/ES in Australia and the United Kingdom had been previously trained for the
PISA 2012 field trial and in the United States, experienced test administrators had experience with the
National Assessment of Educational Progress (NAEP). In the equating study, the items were presented to
students in thirteen one-hour booklets, with each booklet being composed of two clusters of the same
domain. There were thirteen clusters (four mathematics clusters, five reading clusters and four science
clusters) with each cluster appearing in both first and second position in the booklets to neutralise position
effect in calibrating the items. In addition, each domain cluster appeared with two other clusters of the
domain (e.g. Maths 1 appears with the clusters Maths 2 and Maths 4) to establish a linkage between single
domain booklets for the item calibration.
14. All coding of constructed-response items for the equating study was directly conducted by ACER
with experienced coding teams that had participated in PISA studies made up of seven coders for reading
and 14 coders for mathematics and science. The coding operation conducted by ACER followed common
practice used for the main PISA studies, including appropriate training materials and training sessions.
Every response was independently coded twice as a quality control measure. Data entry was conducted
immediately following the coding for the equating study which allowed for any discrepancies to be
identified and quickly resolved by the lead test development staff.

4
Results of the equating study
15. As a result of the equating study with over 5600 students, between 392 to 800 student responses
were obtained for each item, across several English-speaking contexts and schools, in order to conduct the
equating of the item parameters – that is, to place the newly developed items on the appropriate PISA
scales for reading, mathematics and science.
16. The reading items were mapped on to the 2000 scale by adjusting the PISA 2009 item parameters
by a linear transformation to the PISA 2000 scale. The mathematics and science items were put on the
PISA scale (2003 and 2006 respectively) by anchoring the PISA link items at their 2003 and 2006 item
parameters. To compensate for time interval of the PISA item parameters as well as the 2-cluster format (1
hour of testing time) for each student in the equating study, parameters for the PISA link items were re-
estimated over the first two clusters (i.e. as opposed to four). This was done to account for the likely effect
of increased estimated difficulties in PISA from low-responses in the third and fourth clusters. This
adjustment was calculated by ACER to be 0.182, 0.152 and 0.108 in reading, mathematics and science,
respectively, and applied to the original PISA item parameters from 2003 and 2006 in mathematics and
science, respectively, and to the item parameters on the PISA 2000 logit scales.
17. The resulting equating errors were calculated in the same manner as in the PISA 2009 study (e.g.
using the newly calculated item parameters without anchoring and comparing these to the PISA items).
The equating errors were 5.94 for reading, 3.99 for mathematics and 5.97 for mathematics and are,
although somewhat higher, comparable to the equating errors encountered in the main PISA studies given
the smaller data set of the equating study compared to the main PISA studies.
18. With regards to test targeting, ACER conducted a review of the distribution of students and items
using uni-dimensional scaling with ConQuest software to produce item maps.2 The review showed that
there is a good distribution of items at different levels of difficulties. Areas where the difficulty ranges
could be reinforced such as the range between -1 and .-2 in science, for example, can be considered in the
subsequent phases of item replenishment as described later in this note.
19. The selected pool of items for the assessment instruments include 47 items in reading, 40 items in
mathematics and 54 items in science, each domain with approximate assessment time of 93 minutes based
on PISA estimates. For the final selection of items to be included in the assessment instruments, a balance
was sought between framework coverage and robust psychometric properties. For all three domains, the
selected pool of 141 items closely matches the original design blueprints used for item development and
the equating study. The blueprints included targets that mirrored the PISA 2009 main study relating to
aspect, text format and text type variables for reading; process, content and context variables for
mathematics items, and competency, knowledge about and knowledge of science variables (summaries of
the items by domain are presented in Annex A).
20. In addition to the variables described above, item-response types were also a design factor during
item development and for the final instruments. The goal was to mirror as much as possible the distribution
of response types of the main PISA 2009 study. The main difference of the final assessment items,
however, is that all three domains are equally represented in terms of testing time (approximately 93
minutes per domain), which is the PISA standard for minor domains in every cycle. Nevertheless, the final
instruments closely match the item-response types of the main PISA study; for the constructed response
2 . The item maps produced for the review by ACER were based on the convention adopted in PISA 2000 that a student in
the middle of a proficiency level would correctly answer an item of average difficulty for that level with probability
62.5%, and that the student would answer questions at the bottom of the proficiency level about 80% percent of the
time, and those at the top about 50% of the time.

5
type of items, the combined manual and expert make up 48% of the items in comparison to 49% in the
main PISA 2009 study as shown in Table 2.
Table 2. Items included in pilot instruments by response types and in comparison with PISA 2009
Reading Maths Science Total % PISA 2009
Simple Multiple Choice 19 11 18 48 34% 35%
Complex Multiple Choice 7 3 15 25 18% 16%
Constructed Response - Manual 5 25 1 31 22% 8%
Constructed Response -Expert 16 1 20 37 26% 41%*
Pilot Instruments: 47 40 54 141
PISA 2009 Instruments: 131* 35 53 219
* This is due to the fact that reading was the main domain assessed in PISA 2009.
21. Based on the selection of 141 items for the pilot instruments and the equal amount of assessment
time represented by these in each domain, base clusters were constructed from units and items similar to
the process employed for the main PISA clusters. The clusters were assembled with the intent to reflect the
major framework variables of the given domain, as much as possible, and to include items of a range of
difficulties based on the field trial and equating study. A balanced design (i.e. every item appears at least
once with every other item) was proposed for the construction of seven booklets, with 40 minutes of
assessment time allocated to each booklet, as described in Table 3.
Table 3. Booklet design of pilot instruments
Booklet First
cluster Second cluster
Third cluster
1 R1 RSM M1
2 RSM M2 S2
3 M2 M1 R2
4 M1 S2 S1
5 S2 R2 R1
6 R2 S1 RSM
7 S1 R1 M2
22. This booklet for the pilot instruments was decided upon based on three considerations to obtain
unbiased parameter estimates and linking among clusters: (1) Every item appears an equal number of times
throughout the set of booklets; (2) Every cluster appears once in every position; and (3) Every cluster
appears once with every other cluster. With this design, each booklet is 120 minutes in length to match the
PISA main studies and provide students a similar test experience. It is important to note, however, as
described later in this note, that countries would be able to implement adaptations of the clusters and
booklet design based on their specific needs and applications, in accordance with PGB guidelines and
ensuring technical robustness and comparability.
23. Given the necessities of the pilot trial described later in this note, ACER was also commissioned
to co-ordinate the national adaptations of the source versions of the items/units, clusters and booklets. This
was done following procedures used in the main PISA studies, with the use of the Translation and
Adaptation Spreadsheets, and with the valuable support from the PISA Governing Board members and
NPMs in the case of Canada and with NFER for the Scottish versions. All national versions of the
items/units were checked by ACER’s instrument construction staff and test developers to ensure that the

6
adaptations were correctly implemented. Thus, there are four versions of the English-language items/units
and test booklets that were used in Canada, the U.K., Scotland and the United States.
Contextual questionnaire design
24. Given the importance of contextual information for scaling, score-generation, analysis and
reporting of the main PISA studies, data collection of contextual information through questionnaires was
included in the assessment design. For the design of the student and school questionnaires to be part of the
assessment instruments, the questionnaires used in the main PISA studies since 2003 were reviewed.3 The
following were the main analytical criteria used in the review process to assemble the questionnaires for
the pilot:
The potential comparability of school-level results in the pilot with published PISA 2009 results;
The analytical relevance of the indices used in the main PISA analysis and reports. This included
looking at initial reports from PISA 2003, 2006, and 2009 thematic reports produced from PISA
2003 and 2006 results, and the PISA in Focus series.
The potential relevance of indices and variables for school-level reporting and for local
educators. Variables and indices that may have not been prominently featured in initial or
thematic PISA reports, the review identified some variables and indices that may be of particular
relevance for school-level reporting.
25. Based on this review, the questionnaires assembled for the pilot instruments include most of the
core items from the PISA 2009 Student Questionnaire to allow for direct comparisons with PISA 2009
results and analyses. It is important to note that most of these core questions will remain unchanged in
PISA 2012 and are part of a pool of basic questions that will likely be retained for future PISA cycles.
However, other aspects such as instrumental motivation in mathematics, disciplinary climate, enjoyment of
science and self-efficacy of students in science and mathematics are also included from previous 2003 and
2006 PISA cycles.
26. In addition, country-specific questions were included in the student and school questionnaires for
the United States. In all cases, a similar estimated response time of 28 to 30 minutes was kept for the final
design of the student questionnaires to not over-burden students and the test administration at schools. A
detailed description of the variables and indices considered and included in the student and school
questionnaires is included in Annex B. It should be noted that country-specific adoption of the assessment
would imply the possibility to include country-specific options, in accordance with PGB guidelines.
Similar to the adaptation process carried out for the test items/units, ACER co-ordinated the adaptation of
the student and school questionnaires with the support of Canadian authorities and NFER.
Pilot trial in 2012
27. This section describes the international pilot trial conducted with schools across Canada, the U.K.
and the U.S. The purpose of the pilot trial was to test and validate elements of the English-language
version of the assessment relating to (A) the instrument design parameters; (B) confirming the
administrative conditions and procedures necessary for comparability to PISA scales; (C) exploring the
reporting format of results to participating schools and local systems, and (D) exploring options for post-
pilot availability and uses of the assessment, including general cost parameters.
3 . Given that reading-specific questions were revised along with the reading literacy framework between the 2000 and
2009 assessment, the PISA 2000 student questionnaires were not reviewed for example.

7
28. In consultation with PGB representatives in Canada, the U.K. and the U.S., and in collaboration
with local partners, the school recruitment and application process was conducted between September
2011 and April 2012 in Canada, the U.K. and the U.S. Given the implementation of the main PISA 2012
study, it was important to maintain the school recruitment process very focused and with limited public
communication to avoid confusion or interference with the main PISA process. Thus, the school
recruitment process focused on establishing a pool of potential schools and networks to be approached for
participation in the pilot. It is important to note that the ultimate goal of the recruitment process was not to
obtain a statistically representative sample of schools, but to obtain a convenience sample with as much
diversity as possible of school types and student profiles.
29. The school selection process for the pilot proceeded based on the following criteria: (a) type of
school and admissions (e.g. selective admissions such as magnet, private or other types; (b) student profiles
such as Title I schools or diversity of student characteristics (e.g. ethnic background); (c) performance
indicators available and/or proxies; (d) geographic location and school size, and (e) a consideration of the
comparative and convenience purposes of the administration of the pilot.
30. Through this process, 150 schools in the U.S. submitted applications to be considered in the pilot.
From the schools that applied, 105 schools in the U.S. were invited to participate in the pilot trial by the
OECD and in consultation with NCES. In the U.K.., NFER was commissioned to conduct a targeted
recruitment process of approximately 20 schools and education authorities in Scotland facilitated the
participation of two schools in the pilot. In Canada, education authorities from the province of Manitoba
expressed interest in participating in the pilot to the PGB representatives who also co-ordinated the
process. Thus, a total of 126 schools are participating in the pilot trial: 105 schools in the United States, 18
Schools in the U.K. (England, Scotland and Wales) and three schools in Canada (Manitoba).
31. Through two international call-for-tenders process conducted by the OECD in August 2011 and
January 2012, CTB/McGraw-Hill was awarded the contract for the overall administration of testing and
reporting with pilot schools. CTB/McGraw-Hill’s experience in test administration, particularly with local
education systems and schools in the United States, as well as the technical quality of their bid and their
institutional capacity and competitive pricing, were considered strengths by the technical review panel that
recommended awarding the contract to them. CTB/McGraw-Hill sub-contracted the National Foundation
for Educational Research (NFER) to conduct the administration of the 18 pilot schools in the U.K. This
allowed CTB/McGraw-Hill to focus on the schools in the U.S. and the three schools in Canada (Manitoba
province) participating in the pilot.
32. The main assessment window for the pilot was May and June 2012. As the contractor responsible
for test administration and quality assurance procedures, CTB/McGraw-Hill organised the testing sessions
directly with participating schools and the School Co-ordinators named for this purpose, similar to the
security and quality assurance procedures used for main PISA. CTB/McGraw-Hill was responsible for
sending Test Administrators to conduct the testing sessions at schools. Manuals for School Coordinators,
Test Administrators (including scripts to be read to students during testing sessions) and general
Procedures manual were adapted and used, similar to those used in the main PISA studies but adapted to
the design and nature of the assessment and pilot trial.4 Testing session report forms and materials tracking
forms were used during the administration and CTB/McGraw-Hill staff carried out interviews with School
Co-ordinators and communicated extensively in some cases with school principals, assistant principals and
4. In order to explore the possibility of “self-testing” of schools and the necessary monitoring and security
involved with this type of testing, two specific schools participated by signing non-disclosure agreements
and effectively self-testing. The school reports provided to these two schools will be annotated and the
results will be compared to other schools participating in the pilot and to PISA 2009 results to determine if
this kind of modality is viable at some point in the future.

8
local administrative authorities (e.g. districts and local authorities in the U.K.). Based on the quality
assurance process conducted by CTB/McGraw-Hill, feedback received from School Co-ordinators and
Test Administrators, manuals will be revised to reflect the most relevant and appropriate guidance.
33. In a limited number of cases (15 schools), testing sessions have also been conducted in
September and October 2012 in order to (a) increase the student sample size and participation rate at
specific schools and (b) to explore grade-based reporting options with extending sampling (in one school,
for example, more than 200 students have been tested for this option). As of 10 October 2012, more than
7600 students had been tested as part of the pilot trial, with an average student sample size of 62 students
tested at each school and approximately half of schools with participation rates above 70%.
34. CTB/McGraw-Hill used the coding and scoring guides provided by ACER for the instruments. In
Addition, the contractor implemented institutional quality assurance procedures that met or surpassed the
quality assurance procedures outlined in the related PISA manuals for coding and data management that
were also provided. The results of the inter-coder reliability analysis conducted by CTB/McGraw-Hill
show robust reliability of the coding process.
35. For the scaling and score-generation procedures, a technical review meeting was held in San
Francisco, CA, USA with members of CTB/McGraw-Hill’s senior research scientist, research staff
assigned to the pilot, and the three members of the Technical Review Group commissioned by the OECD.
Based on the outcomes of this meeting, CTB/McGraw-Hill developed the specifications for the scaling of
cognitive and contextual data based primarily on PISA methods, parameters and macros that are publicly
available. Consultations also occurred directly between CTB/McGraw-Hill and ACER regarding the
functionalities of ConQuest and the unidimensional modelling used in PISA. This included score
generation using plausible values, principal component analysis by country using contextual data for
students, and the computation of sampling variance and total standard errors of school estimates that
include equating errors. Lastly, CTB/McGraw-Hill proceeded to replicate some of the published PISA
2009 results, particularly for school-level estimates, in order to confirm and validate the PISA methods that
were then adapted for the pilot data of schools.
Content of reports to be provided to participating schools
36. The reports produced by the main PISA studies are geared for and used by policy makers,
decision makers and researchers at country and education system levels. The school reports and district
notes that will be provided as part of the pilot trial, however, are geared towards a different audience:
school staff, local educators and communities. One of the challenges in developing the content of the
reports is to not only make them statistically sound and technically robust, but to also make them
accessible and relevant for the school audience (principals, teachers, aides and staff).
37. School reports will be made available to the appropriate school authorities, both in printed and
electronic form (e-books). Working with local U.S. partners, the Secretariat was able to obtain valuable
feedback regarding the types of figures and reporting options that would be of most relevance to local
educators. Between March and May 2012, one of the U.S. partners organised focus groups with
approximately 50 district and school authorities who provided feedback on mock figures and charts
developed for this purpose by the Secretariat. It is important to note that for the subsequent post-pilot
applications of the assessment, countries could of course design their own reports. The proposed outline of
the reports is summarised here and a detailed description is included in Annex C:
Summary of Your School’s Results
1. Introduction: Understanding your school’s results from the assessment

9
2. What students at your school know and can do in reading, mathematics and science
3. Your school’s results in an international context
4. Student Engagement and the Learning Environment at Your School in an International
Perspective
Annexes
38. In addition to the individual school reports, in a limited number of selected districts in the United
States, summary notes will also be provided to district-level authorities. These notes will be provided given
the interest of district-level educational authorities to be able to have an executive summary of the results
“at a glance” for multiple schools that participated in the pilot within the same district. In the cases of New
York City, Fairfax Public School District and Peoria, for example, several schools from each of these
districts participated in the pilot. The notes will be provided after 19 November to selected districts and the
OECD Secretariat will consult with the National Center for Education Statistics (NCES) in the United
States on the design and content of these district summary notes. It is expected this type of summary note
can serve as a model for Local Authorities in the U.K. that may also be interested in this option in future
post-pilot administrations of the assessment.
Outcomes and main findings
39. This section summarises the main outcomes and findings from the pilot trial focusing on the
degree to which the assessment is fit-for-purpose and under what conditions. It also presents relevant
findings from the pilot with regards to the timing of the assessment, the communication and engagement
with potential users, and lessons learned with regards to how to avoid potential confusion between the
school assessment and the main PISA studies every three years.
40. Based on the performance score estimates in reading, mathematics and science derived from the
pilot data sets, there is sound evidence that the cognitive instruments are fit-for-purpose. In addition, the
values obtained for contextual indices from student and school questionnaires confirm that the scaling
methods yield results that mirror what would be expected based on PISA 2009 results, including the PISA
index of economic, social and cultural status (ESCS). In combination, the mapping of school estimates in
performance and ESCS correspond closely with PISA 2009 results. Despite the fact that the pool of pilot
schools are a convenience sample and there is self-selection bias, results for schools participating in the
pilot in the United States, for example, show that the correlation between reading performance and ESCS
mean estimates for schools corresponds closely to results for PISA 2009 for the U.S. Figure 1 shows
school-level mean reading performance estimates for PISA 2009 schools in the United States (green
schools and green linear trend line) and for 102 pilot schools (blue bubbles and blue linear trend line).

10
Figure 1. Mean performance estimates in reading for schools in the United States and mean socio-economic status of schools, PISA 2009 and pilot schools 2012
41. In addition, the correlations of performance estimates between reading and mathematics,
mathematics and science, and reading and science match those found in PISA 2009 results. Although the
schools that participated in the PISA-Based Test for Schools pilot are not representative of schools in the
participating countries, it is worth noting that the average results for the pilot schools in the United States
obtained with the PISA-Based Test for Schools instruments, for example, are similar to the overall results
for the United States obtained in PISA 2009, once schools are compared with schools that are similar in
social context. Furthermore, the values obtained for the pilot schools for indices such as self-efficacy in
mathematics and sciences, and instrumental motivation in mathematics and science, are congruent with
PISA 2009 results. This is also corroborated by looking at percentages of student responses to particular
questions in the student questionnaires. The distribution of reader profiles among 102 pilot schools in the
United States is nearly identical to the distribution reported for the United States in PISA 2009. Standard
errors reported for school performance estimates (e.g. 9 to 15 score points) are larger than those reported in
the main PISA studies for countries and economies, as would be expected, but results for the pilot schools
indicate that even with larger standard errors and showing confidence intervals, reporting of school results
can still be relevant and meaningful.
42. The experience with 126 schools participating in the pilot has also provided information
regarding the processes and conditions under which school-level estimates of performance and contextual
250
300
350
400
450
500
550
600
650
700
-2.5 -1.5 -0.5 0.5 1.5 2.5PISA index of economic, social and cultural status

11
indices will be most comparable to conditions of the main PISA studies. The following activities need to
be carried out following the established procedures in order to facilitate the most robust comparability of
school results to PISA scales and results:
A. Test administration with schools and local systems in compliance with scripts, guidelines and
quality assurance procedures;
B. Coding of test materials, coding review, scoring and data input in compliance with guides and
appropriate methods;
C. Robust data management (“clean-up” and validation), and
D. Appropriate scaling of cognitive and contextual data, score-generation, analysis and appropriate
reporting of results, considering standard errors and confidence intervals, along with technical
caveats.
43. Similar to the experience of some NPMs with regards to the administration involved with the
main PISA studies, the following conditions relating to administration need to be met for robust
comparability:
Quality of school-level sampling frame that includes all age-eligible students and clearly
identifies any potential exclusion of students. Student exclusions should be clearly supported by
appropriate school staff and confirmed by test administrators.
Sufficient preparation time and information to teachers, students and parents to ensure highest
possible participation of students the day(s) of testing.
Quality proctoring/invigilation during testing sessions to ensure comparable conditions, time
allotments and completeness of answers to questionnaires and to monitor potential distractions
and motivational issues among students.
Security of testing materials and appropriate handling/shipping to avoid breaches of security and
lost, damaged or misplaced materials.
44. One important finding from the pilot relates to the importance of timing with regards to the
administration of the assessment during the academic year. In cases where countries make the test
available “on request”, so that schools and local education systems could decide when to administer the
assessment, this is likely to be during the months when there is less assessment occurring. In the case of the
United States, for example, schools are likely to want to administer the assessment at the start of the
academic year (September to November) and well before the heavy assessment period of March to June.
45. Another finding relates to the importance of local education authorities (i.e. district offices and
local authorities) in minimising the potential confusion between the main PISA studies and the school-
level assessment. Communication and co-ordination with state- and district-level authorities in the U.S.,
and local authorities in Scotland, for example, ensured that even during the same assessment year as the
main PISA studies, confusion was kept to a minimum with regards to the school assessment.
46. The pilot of the PISA-based test for schools and the assessment windows for the main PISA 2012
study in all three countries occurred in 2012. Despite this challenge, it has been possible to manage
communication and avoid confusion and interference, thanks in large part to the PGB representatives and

12
the participation of NPMs. A further safeguard against this could be to not offer the possibility of the
school-level assessment during PISA assessment years (i.e. every three years).
47. Because of the international and high-profile nature of PISA, as well as the potential interest that
exists for the PISA-based test for schools, the management of public expectation and communications is
important. Based on the determination of the PGB with regards to country-specific use of the assessment,
the Secretariat will develop a detailed outline of a communication strategy and guidelines for first quarter
2013 that countries will be able to use in preparation for the availability of the assessment.
48. In general, the communication strategy will seek to accomplish the following: mitigate potential
risks to the PISA brand (e.g. from misuse, miscommunication or confusion); promote the appropriate uses
of the assessment and a deeper understanding of the content behind it (i.e. PISA frameworks); and to
stimulate peer learning and exchanges between local educators around PISA results and specifically,
international benchmarking based on the school-level assessment.

13
ANNEX A. SUMMARY CHARACTERISTICS OF ITEMS INCLUDED IN THE ASSESSMENT
INSTRUMENTS
Mathematics
Process variable
Target % Approximate target
no. of items
Actual no.
of items
Actual no. of
score points
Employing 55 22 20 22
Formulating 25 10 11 13
Interpreting 20 8 9 11
Total 100 40 40 46
Content variable
Target %
Approximate target
no. of items
Actual no.
of items
Actual no. of
score points
Change and relationships 32 13 13 14
Quantity 23 9 9 10
Space and shape 25 10 10 13
Uncertainty and data 20 8 8 9
Total 100 40 40 46
Context variable
Target % Approximate target
no. of items
Actual no.
of items
Actual no. of
score points
Occupational 23 9 9 11
Personal 25 10 10 12
Scientific 27 11 11 12
Societal 25 10 10 11
Total 100 40 40 46

14
Item Type variable
Target % Approximate target
no. of items
Actual no.
of items
Actual no. of
score points
Constructed Response
Expert
17 7 7 12
Constructed Response
Manual
47 19 19 19
Complex Multiple Choice 8 3 3 4
Simple Multiple Choice 28 11 11 11
Total 100 40 40 46

15
Reading
Aspect variable
Target % Approximate target
no. of items
Actual no.
of items
Actual no. of
score points
Access and retrieve 25 11-13 17 18
Integrate and interpret 50 23-24 18 20
Reflect and evaluate 25 11-13 11 11
Total 100 47 46 49
Text format variable
Target % Approximate target
no. of items
Actual no.
of items
Actual no. of
score points
Continuous 60 28 30 33
Non-continuous 30 14 13 13
Mixed and multiple 10 5 3 3
Total 100 47 46 46
Text type variable
Target % Approximate target
no. of items
Actual no.
of items
Actual no. of
score points
Narration 15 7-8 8 9
Description (physical) Not
specified
Not specified 15 16
Exposition (conceptual) Not
specified
Not specified 8 8
Argumentation Not
specified
Not specified 12 13
Instruction Not
specified
Not specified 3 3
Total 100 47 46 49

16
Situation variable
Target % Approximate target
no. of items
Actual no.
of items
Actual no. of
score points
Personal 28 13 19 21
Public 28 13 8 8
Occupational 16 8 7 8
Educational 28 13 12 21
Total 100 47 46 49
Item format variable
Target % Approximate target
no. of items
Actual no.
of items
Actual no. of
score points
Constructed Response
Expert 45 21
17 18
Constructed Response
Manual
4 4
Complex Multiple Choice 55 26
7 9
Simple Multiple Choice 18 18
Total 100 47 46 49
17
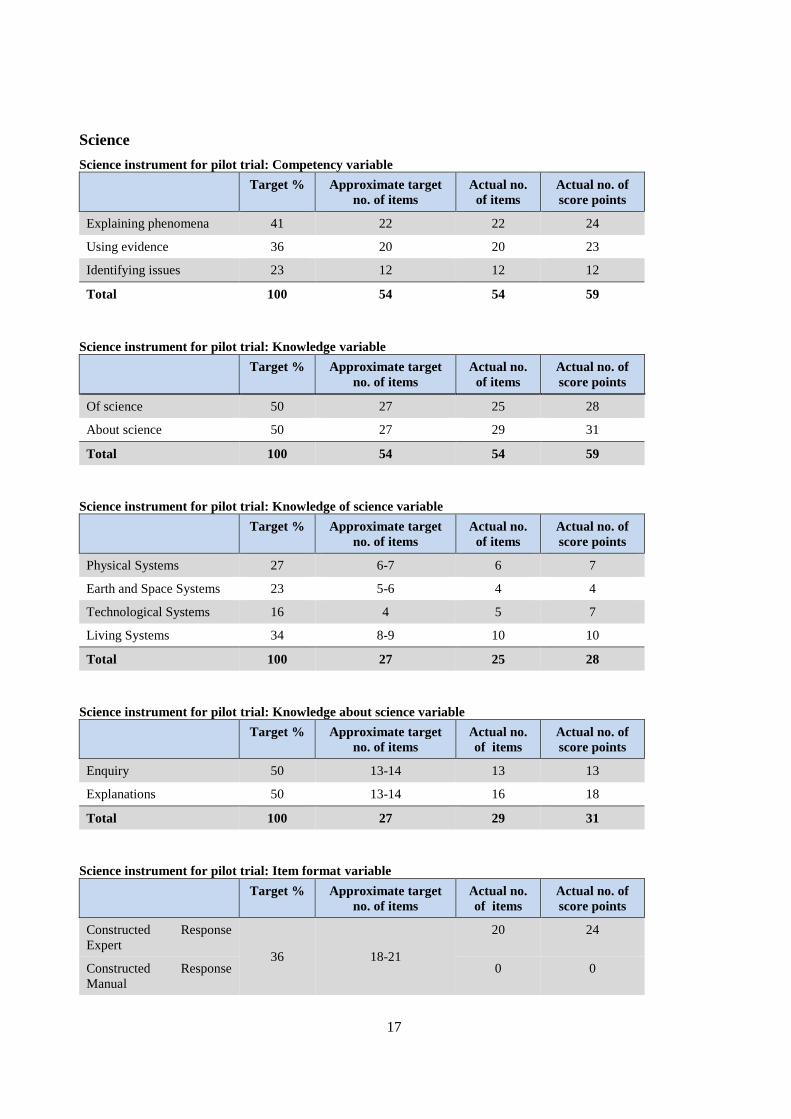
Science
Science instrument for pilot trial: Competency variable
Target % Approximate target
no. of items
Actual no.
of items
Actual no. of
score points
Explaining phenomena 41 22 22 24
Using evidence 36 20 20 23
Identifying issues 23 12 12 12
Total 100 54 54 59
Science instrument for pilot trial: Knowledge variable
Target % Approximate target
no. of items
Actual no.
of items
Actual no. of
score points
Of science 50 27 25 28
About science 50 27 29 31
Total 100 54 54 59
Science instrument for pilot trial: Knowledge of science variable
Target % Approximate target
no. of items
Actual no.
of items
Actual no. of
score points
Physical Systems 27 6-7 6 7
Earth and Space Systems 23 5-6 4 4
Technological Systems 16 4 5 7
Living Systems 34 8-9 10 10
Total 100 27 25 28
Science instrument for pilot trial: Knowledge about science variable
Target % Approximate target
no. of items
Actual no.
of items
Actual no. of
score points
Enquiry 50 13-14 13 13
Explanations 50 13-14 16 18
Total 100 27 29 31
Science instrument for pilot trial: Item format variable
Target % Approximate target
no. of items
Actual no.
of items
Actual no. of
score points
Constructed Response
Expert 36 18-21
20 24
Constructed Response
Manual
0 0

18
Complex Multiple Choice 64 32-36
16 17
Simple Multiple Choice 18 18
Total 100 54 54 59
19
ANNEX B. DESRIPTION OF THE STUDENT AND SCHOOL QUESTIONNAIRES USED IN
THE PISA-BASED TEST FOR SCHOOLS PILOT TRIAL 2012
49. This annex describes the content of the student and school questionnaires to be used as part of the
PISA-Based Test for Schools pilot trial in 2012. The note describes the review process carried out on the
questionnaires used for the main PISA studies in 2009 and 2012, and the criteria used to identify relevant
topics, indices and variables.
Introduction
50. The PISA-Based test for schools is currently being developed by the OECD based on three of the
PISA assessment frameworks (i.e. reading literacy, mathematical literacy and scientific literacy). The 2009
assessment frameworks for reading and science are used, while the 2012 framework is used for
mathematics.
3. Schools and stakeholders that are participating in the pilot have been consulted in previous
months to ensure that results and reporting are as clear and relevant as possible to school staff. Technical
caveats regarding how schools should interpret their results will also be included in the reports.
4. Given the importance of contextual information for scaling, score-generation, analysis and
reporting of the main PISA studies, it is important to consider the elements that can be included in an
appropriate manner in the PISA-Based Test for Schools pilot trial. The ability to internationally benchmark
performance is one of the primary values for schools that participate in the assessment. It is important
therefore for the pilot trial to explore the extent to which contextual information and results that are
reported in the main PISA studies can also form part of the school assessment. Thus, as part of the
administrative, analytical and reporting aspects of the pilot, information collected from the student and
school questionnaires will be reported, when possible, such as the socio-economic status of participating
students and schools.
Questionnaire Review Process
5. The student questionnaires used in the main PISA studies since 2003 were reviewed.5 The
following were the main analytical criteria used in the review process:
The potential comparability of school-level results in the pilot with published PISA 2009 results;
The analytical relevance of the indices used in the main PISA analysis and reports. This
included looking at initial reports from PISA 2003, 2006, and 2009 thematic reports produced
from PISA 2003 and 2006 results, and the PISA in Focus series.
The potential relevance of indices and variables for school-level reporting and for educators.
Even if some of the variables and indices have not been prominently featured in initial or
thematic PISA reports, the review identified some questions and indices that may be of particular
relevance for school-level reporting.
5. Given that reading-specific questions were revised along with the reading literacy framework between the 2000 and
2009 assessment, the PISA 2000 student questionnaire was not reviewed.

20
6. As part of the review process, a detailed workbook with “Questionnaire Review Sheets” was
produced to identify core and domain-specific questions included in both the student and school
questionnaires, as well as to identify relevant changes between PISA cycles, and to ultimately select those
variables to be proposed for the PISA-Based Test for Schools pilot trial. The workbook with the
dynamically linked review sheets can be consulted in the attached file.
Student Questionnaire Core Items
7. The review process began by identifying core questions and indices (i.e. not domain-specific)
regarding student’s family background and educational history used in the PISA 2009 and 2012 student
questionnaires. The review process also identified any changes in the wording of core items between 2009
and 2012 as well as those questions that were dropped for the latter. The following paragraphs describe the
main differences identified in the core items between the 2009 and 2012 student questionnaires.
8. Only one set of core questions from PISA 2009 are not included in PISA 2012:
PISA 2009 Section 4. Learning Time
Q31 ST31 What type of <out-of-school-time lessons> do you attend currently? Not included in 2012
(ST31Q01 to ST31Q09)
9. Some of the core questions from PISA 2009 have been changed for the PISA 2012 Student
Questionnaire. In some cases the adjustments are relatively small (e.g. from “to what extent do you agree
or disagree” to “to what extent do you agree”) and in other cases the adjustments are more substantial (e.g.
from “I get along well with most of my teachers” to “Students get along well with most teachers”). The
following describes these modifications identified in Q33 and Q34:
PISA 2009 Section 5: Your School In PISA 2012 Student Questionnaire
Q33 ST33 Thinking about what you have learned in school: To what extent do you agree or disagree with the following statements?
ST88 Thinking about what you have learned in school: To what extent do you agree with the following statements?
(ST33Q01 to ST33Q04) (ST88Q01 to ST88Q04) Q34 ST34 How much do you disagree or agree
with each of the following statements
about teachers at your school?
ST86 Thinking about the teachers at your
school: to what extent do you agree
with the following statements?
ST34Q01 a) I get along well with most of my
teachers
ST86Q01 a) Students get along well with
most teachers
ST34Q02 b) Most of my teachers are interested in
my well-being
ST86Q02 b) Most teachers are interested in
students well-being
(ST34Q03 to ST34Q05) (ST86Q03 to ST86Q05)
10. One set of questions – Q36 – is covered both in PISA 2009 and PISA 2012 but is linked to
reading in the former and mathematics in the latter:
PISA 2009 Section 6: Your <Test Language> Lessons In PISA 2012 Student Questionnaire
Q36 ST36 How often do these things happen in
your English lessons?
ST81 How often do these things happen
in your mathematics lessons?
(ST36Q01 to ST36Q05) (ST81Q01 to ST81Q05)

21
11. The following core questions are not in PISA 2009 but are in the PISA 2012 questionnaire:
Additional Core Questions in PISA 2012 Student Questionnaire
ST08Q01 In the last two full weeks of school, how many times did you
arrive late for school?
ST09Q01 In the last two full weeks of school, how many times did you
<skip> a whole school day?
ST115Q01 In the last two full weeks of school, how many times did you
<skip> some classes?
12. This set of core items unique to PISA 2012 will not be included in the pilot trial for 2012,
although this can be reviewed for subsequent versions of the assessment.
Proposal of Core Items for the PISA-Based Test for Schools Pilot Trial
13. The proposal is to include most of the core items from the PISA 2009 Student Questionnaire in
the PISA-Based Test for Schools pilot to allow for direct comparisons with the most recent PISA results
and analyses. It is important to note also that most of these core questions will remain unchanged in PISA
2012 and are part of a pool of basic questions that will likely be retained for all future PISA cycles.
14. The following are the variables proposed to be included in the Student Questionnaires of the pilot
trial, with the relevant indices noted in parenthesis:
2009-ST01: Grade level (GRADE)
2009-ST02: Study programme (ISCEDL, ISCEDD, ISCEDO)
2009-ST03: Age (AGE)
2009-ST04: Gender
2009-ST05: Pre-primary education attendance
2009-ST06: Starting age for primary education
2009-ST07: Grade repetition
2009-ST08: Family structure
2009-ST09: Mother’s main job (ESCS, HISEI, BMMJ)
2009-ST10: Mother’s education (ESCS, HISCED, PARED, MISCED)
2009-ST11: Mother’s qualifications (ESCS, HISCED, PARED, MISCED)
2009-ST12: Mother’s employment status (ESCS, HISEI, BMMJ)
2009-ST13: Father’s main job (ESCS, HISEI, BMFJ)
2009-ST14: Father’s education (ESCS, HISCED, PARED, FISCED)
2009-ST15: Father’s qualifications (ESCS, HISCED, PARED, FISCED)
2009-ST16: Father’s employment status (ESCS, HISEI, BFMJ)
2009-ST17: Country of birth for student and parents (IMMIG)
2009-ST18: Age at arrival in country of test
2009-ST19: Language spoken at home
2009-ST20: Home resources (ESCS, HOMEPOS, WEALTH, HEDRES, CULTPOS)
2009-ST21: Family wealth (ESCS, HOMEPOS, WEALTH)
2009-ST22: Books in home (ESCS, HOMEPOS)
2009-ST28: Minutes in a class period (LMINS, MMINS, SMINS)
2009-ST29: Number of class periods in each subject (LMINS, MMINS, SMINS)
2009-ST30: Number of class periods in total
2009-ST32: Hours typically spent out-of-school-time lessons
2009-ST33: Attitude towards school (ATSCHL) (only question changed – options are the same)
2009-ST34: Student-teacher relations (STUDREL)

22
2009-ST35: Number of students in test language class
2009-ST36: Disciplinary climate (DISCLIMA)
Note: As described in paragraph 37 below, questions on disciplinary climate in mathematics lessons should
follow right after question 2009-ST36.
15. For ST32, ST33 and ST34 in the 2009 questionnaire, the PISA-Based Test for Schools pilot will
use the 2012 updated versions and will treat the constructs as the same as those referenced in 2009. For
Q36 related to disciplinary climate, the question will remain in the reading-specific 2009 version to allow
direct comparisons with results and analysis for PISA 2009.
16. The following core-items from the PISA 2009 student questionnaire will not be included:
Q31 ST31 What type of <out-of-school-time lessons> do you attend currently?
Student Questionnaire Domain-Specific Items
17. The cognitive instruments developed for the PISA-Based Test for Schools pilot cover all three
subject domains equally (i.e. without “major” or “minor” domains as in the main PISA assessments). The
Student Questionnaire for the pilot trial will therefore include a limited number of domain-specific
questions for all three domains. This will make it possible to produce school-level results on some of the
key indicators of student engagement, learning strategies and practices for all three domains.
18. The questions to be included in the pilot are derived from the PISA 2006 cycle for science, the
PISA 2009 for reading, and from a pool of questions that was used for the first time in PISA 2003 and will
be retained in PISA 2012 for mathematics.
51. The review process attempted to identify relevant domain-specific questions to be included in the
pilot trial based on the following criteria:
Questions that relate to several topics in order to retain, when possible, the scope of the main PISA
studies.
Questions for which PISA results show a considerable correlation (positive or negative) between
the students’ responses and performance in the subjects.
The topics covered in more than one subject domain to allow greater coverage of these topics in
the school reports.
The domain-specific questions may have particular relevance for school-level reporting and for
school staff. Although some questions may not have figured prominently in PISA initial or
thematic reports, some domain-specific questions may be of particular interest to schools and local
educators.
52. Based on these criteria, the following paragraphs describe the topics and questions that have been
selected as domain-specific questions to be included in the pilot trial in 2012.
Enjoyment of reading, science and mathematics
53. PISA results have shown a consistently strong correlation between students’ level of engagement
with the subjects and their cognitive skills in those subjects. Across the PISA cycles, the context
questionnaires have covered engagement with the subjects in different ways, mostly in terms of enjoyment,
motivation and interest.

23
54. In the PISA-Based Test for Schools pilot, the students’ engagement with the subjects will be
measured in terms of enjoyment. PISA 2006 showed that for students across OECD countries, enjoyment
is a stronger predictor of science performance than the students’ general interest in science and their
motivation to learn science. Moreover, students’ enjoyment of the subjects has been covered by the context
questionnaires for all three subjects, most recently in PISA 2009 where it was a main topic in the survey.
55. Enjoyment will be measured for all subjects with the domain-specific questions from PISA 2003,
2006 and 2009, respectively. Enjoyment of reading is covered by three question sets: time spent reading
for enjoyment and the students’ general enjoyment of reading, both of which are closely related to reading
performance, as well as the diversity of the materials students read for enjoyment. The diversity of reading
materials will be included to attempt to categorise students as deep, wide or surface readers (as in PISA
2009), a categorisation that is also based on the students’ awareness of effective learning strategies in
reading.
56. The question sets that will be included to cover students’ enjoyment of the subjects are:
2009-ST23: Time spent reading for enjoyment
2009-ST24: Enjoyment of reading (ENJOY)
2009-ST25: Materials students read for enjoyment (DIVREAD)
2006-ST16: Enjoyment of science (JOYSCIE)
2003-ST30: Interest in, enjoyment of and instrumental motivation in mathematics (INTMAT,
INSTMOT)
57. The questions on interest in, enjoyment of and instrumental motivation in mathematics are
retained unchanged in the PISA 2012 Student Questionnaire. This set of questions also includes questions
on interest and instrumental motivation in mathematics.
Self-efficacy in science and mathematics:
58. Students’ self-belief is another context variable that shows a strong correlation with student’s
performance in the subjects. Similar to the level of engagement with the subjects, self-belief can be an
important part of improving the performance. Self-belief is measured for mathematics and science in PISA
2003 and 2006, but not for reading in PISA 2009.
59. Self-belief is measured in terms of self-efficacy (how much students believe in their own ability
to handle tasks effectively and overcome difficulties) and self-concept (how much students believe in their
own academic abilities). The PISA-Based Test for Schools pilot will include questions on self-efficacy as
this variable has proven to be a stronger predictor of performance than self-concept in both mathematics
and science. In both subjects, self-efficacy is one of the strongest predictors of performance among all the
context variables. The questions on self-efficacy in mathematics are retained unchanged in the PISA 2012
Student Questionnaire.
60. The question sets that will be included to cover students’ self-efficacy are:
2006-ST17: Self-efficacy in science (SCIEEFF)
2003-ST31: Self-efficacy in mathematics (MATHEFF)
Awareness of effective learning strategies in reading:
61. PISA 2009 shows that students’ awareness of the most effective learning strategies is closely
associated with reading proficiency and that understanding how to learn effectively can sometimes be even
more important for reading performance than how much the students read. This indicator is based on a

24
methodology that was introduced in PISA 2009 and that has proven a more robust measure than indicators
on the students’ learning strategies and preferences (PISA 2009 Results: Learning to Learn, Volume III,
OECD, 2010, page 98). Based on these findings, the indicator will be included in the Student
Questionnaire for the PISA-Based Test for Schools pilot. As mentioned above, the questions on awareness
of learning strategies can be used, together with the questions on the materials that students read for
enjoyment, to categorise the students as either deep, wide or surface readers.
62. PISA 2003 included questions on students’ approaches to learning in mathematics, however the
indicators based on these questions proved to have a relatively weak explanatory power (between 0.0% and
0.3% of explained variance in student performance) and they will not be included in the PISA-Based Test
for Schools pilot. PISA 2006 did not cover learning strategies in science.
63. The question sets that will be included to cover students’ awareness of effective learning
strategies are:
2009-ST41: Metacognition strategies in reading: Understanding and remembering (UNDREM)
2009-ST42: Metacognition strategies in reading: Summarising (METASUM)
64. The following indices from the PISA 2009 questionnaires are not included in the proposed
Student Questionnaire for the pilot trial:
MEMOR ELAB CSTRAT ONLNREAD LIBUSE
Approaches to learning:
Memorisation
Approaches to learning:
Elaboration
Approaches to learning: Control
strategies
Online reading
activities
Use of libraries
School library RFSINTRP RFSNCONT RFSTRLIT RFSUMAT
Does the school have a school
library
Interpretation of literary texts
Use of texts containing non-
continuous materials
Reading activities for traditional
literary courses
Use of functional
texts
65. Based on these non-selected topics, the following reading-specific questions have been excluded
from the proposal for the pilot trial:
Q26 ST26 How often are you involved in the following reading activities?
Q27 ST27 When you are studying, how often do you do the following?
Q39 ST39 How often do you visit a library for the following activities?
Q40 ST40Q01 Does your school have a <school library>?
From the cognitive booklets: Reading for school
Q1 During the last month, how often did you have to read the following types of texts for
school (in the classroom or for homework)?
Q2 During the last month, how often did you have to do the following kinds of tasks for
school (in the classroom or for homework)?

25
Mathematics-specific questions
66. The following mathematics-related question 2003-STQ32 and the related indicators ANXMAT
and SCMAT are included in the proposal for the pilot trial given the potential relevance for school-level
reporting (these questions are from PISA 2003 STQ and are also included in the 2012 questionnaire):
Findings based on Mathematics Teaching and Learning Strategies
in PISA (OECD, 2010):
ANXMAT SCMAT
Students with high levels of mathematics anxiety tend to
perform worse in mathematics and students in lower-performing
schools tend to be more anxious.
Index of
anxiety in mathematics
Two-thirds of students find some of their mathematics work too
difficult and half say they do not learn mathematics quickly.
Index of self-
concept in
mathematics
Q32 ST32 Thinking about studying Mathematics: To
what extent do you agree with the following
statements?
ST32Q01 a) I often worry that it will be difficult for me in
Mathematics classes.
ST32Q02 b) I am just not good at Mathematics. xx
ST32Q03 c) I get very tense when I have to do Mathematics
homework.
Xx
ST32Q04 d) I get good <marks> in Mathematics. xx
ST32Q05 e) I get very nervous doing Mathematics
problems.
Xx
ST32Q06 f) I learn Mathematics quickly. xx
ST32Q07 g) I have always believed that Mathematics is one
of my best subjects.
xx
ST32Q08 h) I feel helpless when doing a Mathematics
problem.
Xx
ST32Q09 i) In my Mathematics classes, I understand even
the most difficult work.
xx
ST32Q10 j) I worry that I will get poor <marks> in
Mathematics.
Xx
67. The following question used in PISA 2003 (2003-STQ38) and the related indicators TEACHSUP
and DISCLIM are considered for the pilot trial given the potential relevance for school-level reporting
(note that ST38Q04 is dropped in PISA 2012 and note that, as mentioned below, these questions will be
included in the 2012 version as two separate units):
Findings based on Mathematics Teaching and Learning Strategies
in PISA (OECD, 2010): TEACHSUP DISCLIM
Negative correlation with performance in multivariate analysis.
Possible interpretation is that teachers focus their support on
those students who need it most.
Index of teacher
support
The variable shows one of the most consistently positive
correlations with mathematics performance across countries.
School average disciplinary climate seems to have a strong
positive effect in addition to the individual effects.
Index of
disciplinary
climate in
mathematics lessons

26
Findings based on Mathematics Teaching and Learning Strategies
in PISA (OECD, 2010): TEACHSUP DISCLIM
Negative correlation with performance in multivariate analysis.
Possible interpretation is that teachers focus their support on
those students who need it most.
Index of teacher
support
The variable shows one of the most consistently positive
correlations with mathematics performance across countries.
School average disciplinary climate seems to have a strong
positive effect in addition to the individual effects.
Index of
disciplinary
climate in
mathematics
lessons
Q38 ST38 How often do these things happen in your
<Mathematics> lessons?
ST38Q01 a) The teacher shows an interest in every
student's learning.
ST38Q02 b) Students don't listen to what the teacher says.
ST38Q03 c) The teacher gives extra help when students
need it.
ST38Q04 d) Students work from books and other printed
material. Not included in 2012
ST38Q05 e) The teacher helps students with their learning.
ST38Q06 f) There is noise and disorder.
ST38Q07 g) The teacher continues teaching until the
students understand.
ST38Q08 h) The teacher has to wait a long time for
students to <quieten down>.
ST38Q09 i) Students cannot work well.
ST38Q10 j) The teacher gives students an opportunity to
express opinions.
ST38Q11 k) Students don't start working for a long time
after the lesson begins.
68. In the 2012 Student Questionnaire, the sub-questions (items) used for the TEACHSUP and
DISCLIM indices are split into two questions 2012-Q77 and 2012-Q81. Therefore, based on the 2012
version, the following questions will be included in the questionnaire:
In PISA 2012 Student Questionnaire
ST77 How often do these things happen in your mathematics lessons?
(ST77Q01 to ST77Q05)
ST81 How often do these things happen in your mathematics lessons?
(ST81Q01 to ST81Q05)
69. As noted earlier, the proposal is to place these questions on disciplinary climate in mathematics
lessons right after the question on disciplinary climate in English lesions: Q36 in the 2009 questionnaire.
Given the similarity of the questions, it will be clear to students that they are asked to first think about the
disciplinary climate in their English lessons and next about the disciplinary climate in their mathematics
lessons. 70. There may be particular interest among schools in knowing how effectively students perceive

27
their schools to be engaging them and preparing for science-related careers. Thus, the following questions
2006-Q27 and 2006-Q28 from the 2006 Student Questionnaires when science was the main domain are
proposed to be included in the pilot trial:
Not used for the initial report PISA 2006 Science Competencies
for Tomorrow’s World (OECD, 2007) but may be of relevance for
school-level reports.
CARPREP
Index of school
preparation for science-
related careers
Q27 ST27 How much do you agree with the
statements below? Xx
ST27Q01 a) The subjects available at my school
provide students with the basic skills and
knowledge for a <science-related career> xx
ST27Q02 b) The <school science> subjects at my
school provide students with the basic skills
and knowledge for many different careers. xx
ST27Q03 c) The subjects I study provide me with the
basic skills and knowledge for a <science-
related career> xx
ST27Q04 d) My teachers equip me with the basic
skills and knowledge I need for a <science-
related career> xx
Not used for the initial report PISA 2006 Science Competencies
for Tomorrow’s World (OECD, 2007) but may be of relevance for
school-level reports.
CARINFO
Index of
student
information on
science-related
careers
Q28 ST28 How informed are you about these
topics? xx
ST28Q01 a) <Science-related careers> that are
available in the job market xx
ST28Q02 b) Where to find information about
<science-related careers> xx
ST28Q03 c) The steps students need to take if they
want a <science-related career> xx
ST28Q04 d) Employers or companies that hire people
to work in <science-related careers> xx
71. The following question 2006-Q29 may be of particular interest to schools participating in the
pilot, even if the related index SCIEFUT shows little correlation with performance across OECD countries:
Findings based on PISA 2006 Science Competencies for
Tomorrow’s World (OECD, 2007): SCIEFUT
Index of
future-
oriented
motivation to
learn science
Correlation with performance across OECD countries (Table A10.3,
PISA 2006 Results, Vol. 1): 0.08

28
"Only a minority of students reported an interest in studying or working in science in
the future. This suggests that schools need to more effectively promote scientific
careers and create pathways that encourage more students to continue studying the
subject."
Q29 ST29 How much do you agree with the
statements below? xx
ST29Q01 a) I would like to work in a career involving
<broad science> xx
ST29Q02 b) I would like to study <broad science>
after <secondary school> xx
ST29Q03 c) I would like to spend my life doing
advanced <broad science> xx
ST29Q04 d) I would like to work on <broad science>
projects as an adult xx
72. The following question 2006-Q35 may be of particular interest to schools that wish to know if
students are motivated to learn science because they feel it will be valuable to them in their future
academic and professional careers , even if the related index shows little correlation with performance:
Findings based on PISA 2006 Science Competencies for
Tomorrow’s World (OECD, 2007):
INSTSCIE
Index of
instrumental
motivation to
learn science
Correlation with performance across
OECD countries (Table A10.3, PISA 2006
Results, Vol. 1):
0.09
"Given the frequently perceived shortage of students following science in higher
education in many countries, it is important that policy makers gain an insight to
whether or not this trend is likely to continue."
Q35 ST35 How much do you agree with the
statements below? xx
ST35Q01 a) Making an effort in my <school science>
subject(s) is worth it because this will help
me in the work I want to do later on xx
ST35Q02 b) What I learn in my <school science>
subject(s) is important for me because I
need this for what I want to study later on xx
ST35Q03 c) I study <school science> because I know
it is useful for me xx
ST35Q04 d) Studying my <school science> subject(s)
is worthwhile for me because what I learn
will improve my career prospects xx
ST35Q05 e) I will learn many things in my <school
science> subject(s) that will help me get a
job xx
73. It may be relevant for schools to understand what their students consider as their most important
school subjects, comparatively speaking and to see if there is any correlation with performance. In
addition, some schools that explicitly focus on science and/or mathematics may want to know if in fact
their students consider these to be the most important and whether this correlates to performance in other
subjects. Therefore, the following question from the 2006 questionnaire 2006-Q36 is proposed to be
included:

29
Not used for the initial report PISA 2006 Science Competencies for
Tomorrow’s World (OECD, 2007) but may be of relevance for school-level
reports.
Q36 ST36 In general, how important do you think it is for
you to do well in the subjects below?
ST36Q01 a) <School science> subjects
ST36Q02 b) Mathematics subjects
ST36Q03 c) <test language> subjects
General Proposal
74. Based on the selection of questions described above, the Student Questionnaire for the PISA-
Based Test for Schools pilot included questions with a total estimated response time for each student of
approximately 28 to 33 minutes, based on a 10-second response time on average for each question. This is
18% more than the approximate time used by each student for the PISA 2009 student questionnaires. If the
questions included in the booklets in PISA 2009 are added to each student’s response time, then the
difference between the proposal for the pilot and the time for each student in the 2009 PISA study is only 2
minutes and 15 seconds per student.
75. In the proposal for the student questionnaire for the pilot as described in this note, the core
questions make up approximately 63% of the questions, while domain-specific questions account for 14%
in reading, 8% in mathematics and 14% in science.
National adaptation and country-specific options
76. As part of the instrument development process, the student questionnaires were adapted into
U.S., UK and Canadian versions using the adaptations already developed for main PISA. For the UK, the
questionnaires were adapted into two versions, one for England, Wales and Northern Ireland (hereafter
referred to as the UK version), and one for Scotland (hereafter referred to as the Scottish version). National
adaptations in the student questionnaire include country-specific terms and expressions that relate to school
organisation and culturally-specific adaptations related to questions on home possessions, for example. The
adaptations also include country-specific usage of the English language (e.g. date notation).
77. The questions proposed for the pilot are selected from versions used in PISA 2006, 2009 and
2012. In cases where questions used in more than one PISA round have not been adapted identically across
these rounds, the proposal is to use the most recent country adaptation for the pilot. For two questions
taken from PISA 2012, 2012-ST55 and 2012-ST81, adaptations for the United Kingdom will not be
available in the main study version when the pilot is conducted. The proposal was to use the field trial
adaptations for the pilot for these particular questions.
78. The national adaptation in the U.S. of one the questions in the student questionnaire also includes
a modification of the number of questions. Question 5 in the international PISA 2009 questionnaire (“Did
you attend <ISCED 0>?”) was adapted as two separate questions (“Did you attend pre-school?” and “Did
you attend kindergarten?”) in the US version of the PISA 2009 questionnaire. Detailed guidelines for
recoding the responses on this question are available.
79. Question 2009-ST02 on study programme is not administered in the United States in main PISA
and will similarly not be included in the pilot questionnaire for the Unites States.

30
80. In addition to the country-specific adaptations of the student questionnaire, all three countries
have included additional questions on topics that are not included in the international version of the student
questionnaire. Data obtained from these questions are not reported in the international PISA reports.
Except for some of the additional questions included for the U.S., additional questions were not be
included for the Canadian, U.K. and Scottish questionnaires.
81. In PISA 2009, the U.S. version of the student questionnaire included the following five questions
or sub-questions:
StQ5: Student is Hispanic or Latino
StQ6: Student’s race
StQ10 (sub-question): Grade repetition in kindergarten
StQ11: Highest level of school the student expects to complete
StQ30 (sub-question): Involvement with text-messaging
82. These additional items were included, except the additional sub-question for StQ30 as this sub-
question is part of a question block that will not be included in the pilot questionnaire. The additional items
are expected to add 1-2 minutes to the total response time for each student, in the pilot questionnaire for
the U.S. After the pilot, national adaptations of the PISA-Based Test for Schools instruments will make it
possible to include additional country-specific questions that have already been used in main PISA.
Questionnaire structure
83. The proposal is to use the same general structure for the questionnaire as in main PISA. The first
part of the questionnaire included core questions on the student’s school career and family background and
the second part will include subject-specific questions. The subject-specific questions were ordered
according to subjects with two sections of reading questions, two sections of science questions and one
section of mathematics questions. The section on reading activities outside school was placed before the
questions related to the school, similarly to structure of the main PISA 2009 questionnaire.
84. To facilitate the analysis and comparisons during the pilot trial, questionnaire items were
identified by years and letters, and by numbers if referred like that in the source questionnaires.
52. The structure with section headings is:
SECTION 1: ABOUT YOU
2009-ST01: Grade level (GRADE)
2009-ST02: Study programme (ISCEDL, ISCEDD, ISCEDO)
2009-ST03: Age (AGE)
2009-ST04: Gender
US-2009-ST05: Student is Hispanic or Latino - only in US version
US-2009-ST06: Student’s race only in US version
2009-ST05: Pre-primary education attendance
2009-ST06: Starting age for primary education
2009-ST07: Grade repetition
US-2009-ST10 (sub-question): Grade repetition in kindergarten - only in US version; add as sub-
question in international-2009-ST07
US-2009-ST11: Highest level of school the student expects to complete - only in US version
SECTION 2: YOUR FAMILY AND YOUR HOME [With intro text]
2009-ST08: Family structure

31
2009-ST09: Mother’s main job (ESCS, HISEI, BMMJ)
2009-ST10: Mother’s education (ESCS, HISCED, PARED, MISCED)
2009-ST11: Mother’s qualifications (ESCS, HISCED, PARED, MISCED)
2009-ST12: Mother’s employment status (ESCS, HISEI, BMMJ)
2009-ST13: Father’s main job (ESCS, HISEI, BMFJ)
2009-ST14: Father’s education (ESCS, HISCED, PARED, FISCED)
2009-ST15: Father’s qualifications (ESCS, HISCED, PARED, FISCED)
2009-ST16: Father’s employment status (ESCS, HISEI, BFMJ)
2009-ST17: Country of birth for student and parents (IMMIG)
2009-ST18: Age at arrival in country of test
2009-ST19: Language spoken at home
2009-ST20: Home resources (ESCS, HOMEPOS, WEALTH, HEDRES, CULTPOS)
2009-ST21: Family wealth (ESCS, HOMEPOS, WEALTH)
2009-ST22: Books in home (ESCS, HOMEPOS)
SECTION 3: YOUR READING ACTIVITIES [With intro text]
2009-ST23: Time spent reading for enjoyment
2009-ST24: Enjoyment of reading (ENJOY)
2009-ST25: Materials students read for enjoyment (DIVREAD)
SECTION 4: LEARNING TIME
2009-ST28: Minutes in a class period (LMINS, MMINS, SMINS)
2009-ST29: Number of class periods in each subject (LMINS, MMINS, SMINS)
2009-ST30: Number of class periods in total
2012-ST55: Hours typically spent out-of-school-time lessons
SECTION 5: YOUR SCHOOL
2012-ST88: Attitude towards school (ATSCHL)
2012-ST86: Student-teacher relations (STUDREL)
SECTION 6: YOUR SCHOOL LESSONS AND SUBJECTS
2009-ST35: Number of students in test language class
2009-ST36: Disciplinary climate in test language lessons (DISCLIMA) – order of response options
reversed to correspond with 2012-ST81.
2012-ST81: Disciplinary climate in mathematics lessons (DISCLIM)
2006-ST36: Importance of doing well in science, mathematics and test language subjects
SECTION 7: YOUR STRATEGIES IN READING AND UNDERSTANDING TEXTS [With intro text]
2009-ST41: Metacognition strategies in reading: Understanding and remembering (UNDREM)
2009-ST42: Metacognition strategies in reading: Summarising (METASUM)
SECTION 8: YOUR VIEWS ON <BROAD SCIENCE> [With intro text]
2006-ST16: Enjoyment of science (JOYSCIE)
2006-ST17: Self-efficacy in science (SCIEEFF)
SECTION 9: CAREERS AND <BROAD SCIENCE> [With intro text]
2006-ST27: School preparation for science-related careers (CARPREP)
2006-ST28: Student information on science-related careers (CARINFO)
2006-ST29: Future-oriented motivation to learn science (SCIEFUT)
2006-ST35: Instrumental motivation to learn science (INSTSCIE)

32
SECTION 10: YOUR MATHEMATICS EXPERIENCES
2003-ST30: Interest in, enjoyment of and instrumental motivation in mathematics (INTMAT,
INSTMOT)
2003-ST31: Self-efficacy in mathematics (MATHEFF)
2003-ST32: Anxiety and self-concept in mathematics (ANXMAT, SCMAT)
2012-ST77: Teacher support in mathematics lessons (TEACHSUP)

33
The School Questionnaire in the 2012 pilot of the PISA-Based Test for Schools
85. In addition to the Student Questionnaires, the school principal, director or similar authority was
asked to complete a School Questionnaire, following the same procedure as in main PISA. The data
gathered through the School Questionnaire will be used to provide context for the performance level of the
students in terms of school characteristics such as location and school type. The data will also be used to
obtain information on school policies and practices and, when appropriate, to present school-level results
in comparison with country-level results from the PISA 2009 study.
86. As in the main PISA assessment the School Questionnaire covered such elements as:
The structure and organisation of the school
Student and teacher demographics
The school’s resources
The school’s instruction, curriculum and assessment
The school climate
School policies and practices
Criteria for selection of questions for the School Questionnaire
87. The following criteria have been used to determine the exact questions to include in the School
Questionnaire:
The questionnaire will be based mainly on questions from PISA 2009 to allow for direct
comparisons between the data gathered at the school-level in the pilot and results for countries and
economies from PISA 2009.
All questions that have been used to construct school-level indices and/or to present results at
country- and economy-level in the PISA 2009 initial reports (Volumes I, II, III, IV and V) will be
included in the questionnaire.
All PISA 2009 questions that are retained in PISA 2012 will be included in the questionnaire as
these can be considered “trend” questions that will maintain relevance over the years. Most of
these questions are retained unchanged in the 2012 School Questionnaire. Some questions,
however, have been changed from 2009 to 2012. In the PISA-Based Test for Schools pilot these
questions will be retained in the 2009 version to ensure that direct comparisons can be made with
existing PISA analysis.
All questions used in the monthly “PISA in Focus” policy-oriented notes until February 2012 will
be included in the questionnaire.
The total estimated response time of the questionnaire will be around 30 minutes, similar to the
School Questionnaire in the main PISA assessment.
88. The following table shows all blocks of questions from the PISA 2009 School Questionnaire with
an indication of whether the questions will be included in the PISA-Based Test for Schools pilot. Each
block contains one or more sub-items which are not shown in the table. For each block of questions the
table contains the following information:

34
PISA for Schools: Whether the question block will be included in the School Questionnaire for
the 2012 pilot of the PISA-Based Test for Schools.
PISA 2012: Whether the question block is retained in the 2012 School Questionnaire (“same”
indicates that question block is retained unchanged, while “changed” indicates that the question
block has been adjusted in 2012).
PISA 2009: Whether some or all of the questions in the question block has been used in the PISA
2009 reports (Volume I, II, III, IV and V).
PISA in Focus: Whether some or all of the questions in the question block has been used in the
monthly “PISA in Focus” policy-oriented notes (the issues are listed).
Indices: Whether some or all of the questions in the question block is used to produce school-level
indices.
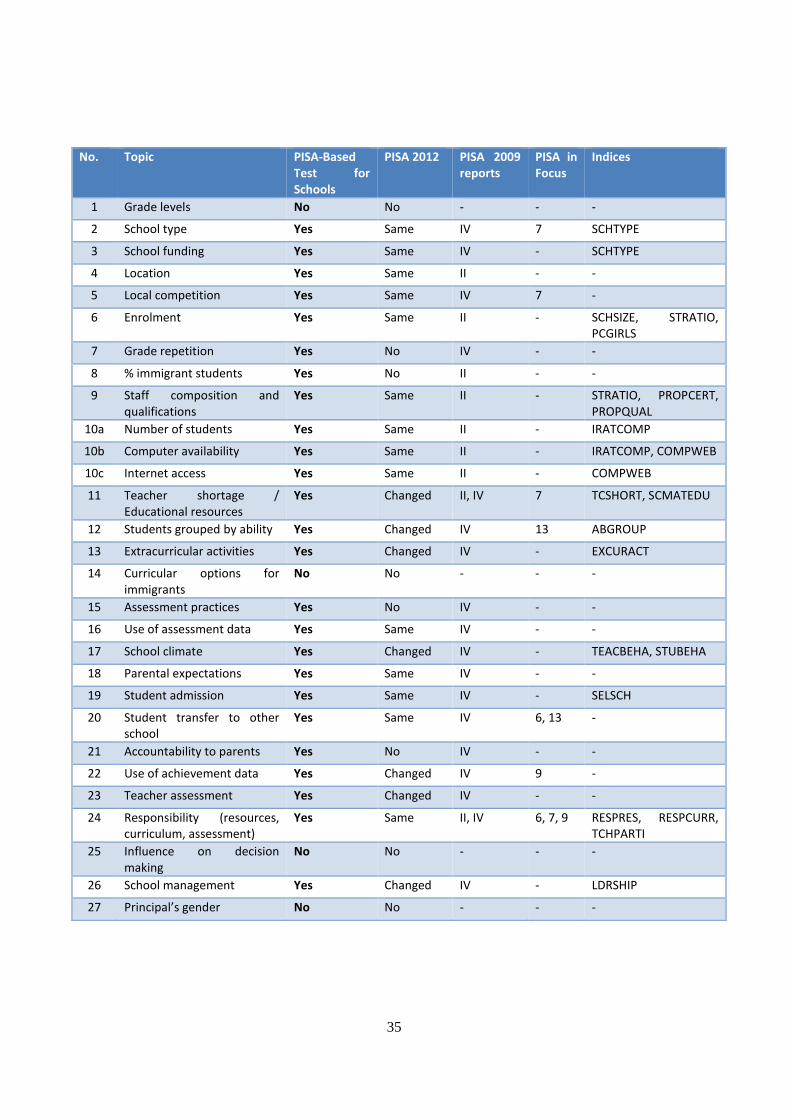
35
No. Topic PISA-Based Test for Schools
PISA 2012 PISA 2009 reports
PISA in Focus
Indices
1 Grade levels No No - - -
2 School type Yes Same IV 7 SCHTYPE
3 School funding Yes Same IV - SCHTYPE
4 Location Yes Same II - -
5 Local competition Yes Same IV 7 -
6 Enrolment Yes Same II - SCHSIZE, STRATIO, PCGIRLS
7 Grade repetition Yes No IV - -
8 % immigrant students Yes No II - -
9 Staff composition and qualifications
Yes Same II - STRATIO, PROPCERT, PROPQUAL
10a Number of students Yes Same II - IRATCOMP
10b Computer availability Yes Same II - IRATCOMP, COMPWEB
10c Internet access Yes Same II - COMPWEB
11 Teacher shortage / Educational resources
Yes Changed II, IV 7 TCSHORT, SCMATEDU
12 Students grouped by ability Yes Changed IV 13 ABGROUP
13 Extracurricular activities Yes Changed IV - EXCURACT
14 Curricular options for immigrants
No No - - -
15 Assessment practices Yes No IV - -
16 Use of assessment data Yes Same IV - -
17 School climate Yes Changed IV - TEACBEHA, STUBEHA
18 Parental expectations Yes Same IV - -
19 Student admission Yes Same IV - SELSCH
20 Student transfer to other school
Yes Same IV 6, 13 -
21 Accountability to parents Yes No IV - -
22 Use of achievement data Yes Changed IV 9 -
23 Teacher assessment Yes Changed IV - -
24 Responsibility (resources, curriculum, assessment)
Yes Same II, IV 6, 7, 9 RESPRES, RESPCURR, TCHPARTI
25 Influence on decision making
No No - - -
26 School management Yes Changed IV - LDRSHIP
27 Principal’s gender No No - - -

36
Confidentiality
89. Selected results from the school questionnaire could be presented in the school report as
appropriate, either in terms of indices or responses on individual questions. Answers from the school
questionnaire will be reported anonymously and in aggregated form when presented outside the school
reports, for example in district-level reports that bring together the results for several schools in a district.
A confidentiality disclaimer was included in the questionnaire that specified how the results will be used
and presented.
National adaptations of the School Questionnaire
90. As part of the instrument development, the school questionnaire was adapted into U.S., UK and
Canadian versions using the adaptations already developed for main PISA. National adaptations in the
school questionnaire include country-specific terms and expressions that relate to school organisation. In
the UK the adaptations also cover differences in the education systems between England, Wales and
Northern Ireland. In the Canadian version the adaptations include an additional paragraph in the
introduction that defines the term “Grade 10 or equivalent”, which is used throughout the questionnaire.
91. In the 2009 version of the Canadian school questionnaire two out of four sub-questions were
omitted from the set of questions on methods used to monitor teacher practice (Q23). Along with other
national adaptation, it proposed that this national adaptation were retained in the Canadian version of the
pilot questionnaire.
92. The questions proposed for the pilot are selected from versions used in PISA 2006, 2009 and
2012. In cases where questions used in more than one PISA round have not been adapted identically across
these rounds, the most recent country adaptation was used for the pilot.
93. In addition to the country-specific adaptations of the school questionnaire, the U.S. and the UK
have included additional questions on topics that are not included in the international version of the school
questionnaire. Data obtained from these questions are not reported in the international PISA reports.
94. In PISA 2009, the U.S. version of the school questionnaire included the following three
additional questions or sub-questions:
ScQ5b: Number of local schools that compete for students
ScQ10d (sub-question): Number of computers available to all students
ScQ27: Percentage of students eligible for free- or reduced-price lunch
95. Question 27 on free- or reduced-price lunch coverage was included in the pilot questionnaire for
the United States. This question, expected to add less than a minute to the total response time for each
school, can provide a strong country-specific indicator of students’ socio-economic background at the
school-level as a supplement to the indices on socio-economic and cultural status based on students’
reports.
96. After the pilot, national adaptations of the PISA-Based Test for Schools instruments will make it
possible to include additional country-specific questions that have already been used in main PISA.
Questionnaire structure
97. The same general structure for the School questionnaire as in main PISA was followed. To
facilitate the analysis and comparisons during the pilot trial, questionnaire items were distinguished by
years and letters, and by numbers if referred like that in the source questionnaires.

37
98. The structure with section headings is:
Section A: The Structure and Organisation of the School
2009-SC02: Public or Private (SCHTYPE)
2009-SC03: Funding (SCHTYPE)
2009-SC04: Community
2009-SC05: Schooling
2012-SC23: Students leaving without certificate
2012-SC39: Quality assurance/improvement
Section B: The Student and Teacher Body
2009-SC06: Enrolment (SCHSIZE, STRATIO, PCGIRLS)
2009-SC07: Grade repetition
2009-SC08: English as second language
2009-SC09: Teaching staff (STRATIO, PROPCERT, PROPQUAL)
Section C: The School’s Resources
2009-SC10Q01: Number students in grade (IRATCOMP)
2009-SC10Q02: Computers available (IRATCOMP, COMPWEB)
2009-SC10Q03: Internet connected (COMPWEB)
2009-SC11: School capacity hindered (TCSHORT, SCMATEDU) with 2009-SC11Q05 and SC11Q06
(library staff and support personal) replaced by 2012-SC14Q11 to 2012-SC14Q13 (k to m on
infrastructure)
Section D: School Instruction, Curriculum and Assessment
2009-SC12: Ability grouping (ABGROUP)
2009-SC13: Extracurricular activities (EXCURACT)
2009-SC14: Activities offered for English-language learners
2012-SC20: Extra mathematics lessons offered
2012-SC21: Purpose of additional mathematics
2009-SC15: Assessment methods
2009-SC16: Purposes of assessment
Section E: School Climate
2009-SC17: Teacher and student factors hindering school climate (TEACBEHA, STUBEHA)
2009-SC18: Parental expectations
Section F: School Policies and Practices
2009-SC19: Admissions selection (SELSCH)
2009-SC20: Transfer of students
2009-SC21: Accountability to parents
2009-SC22: Uses of achievement data
2009-SC23: Monitoring teacher practices
2009-SC24: School responsibilities (RESPRES, RESPCURR, TCHPARTI)
2009-SC26: School leadership (LDRSHP)
2012-SC35: Professional development in mathematics
Section G: Pilot Administration Feedback
Pilot Administration Feedback “Is there any comment that you wish to make regarding any aspect of the
assessment administration?” (Constructed response)

38
ANNEX C. OUTLINE OF THE REPORTS THAT PARTICIPATING SCHOOLS WILL RECEIVE
IN THE PISA-BASED TEST FOR SCHOOLS PILOT IN 2012
October 2012
99. The Organisation for Economic Co-operation and Development (OECD) is developing a PISA-
comparable test designed to be administered and used by schools, local networks and for research
purposes. During the pilot trial taking place in 2012, the test is known as the PISA-Based Test for Schools.
Results of this test will be comparable to international PISA scales to allow for international benchmarking
with countries and economies that participate in the main PISA studies. An important step in the
development and implementation of the test is the pilot trial being conducted in May and June 2012 with
approximately 125 schools in the U.S., Canada, England, Wales and Scotland.
100. This note briefly describes the outline of the reports that participating schools will receive as part
of the PISA-Based Test for Schools pilot. The final design and content of the reports are in development
and will be finalised by the end of September 2012 based on the technical parameters dictated by the
instruments and in consultation with stakeholders and educators.
101. School reports will be made available to the appropriate school authorities in electronic form
through secure means starting the week of 19 November 2012. The OECD is working closely with
instrument development and test administration contractors (ACER and CTB/McGraw-Hill, respectively)
to finalise the analytical outputs needed for the school reports. Examples of the proposed figures and charts
to be included in the reports are included in a separate Excel file and a list of text boxes to be included in
the reports is included at the end of this note.
102. The proposed outline of the reports is as follows:
Summary of Your School’s Results
I. Introduction: Understanding your school’s results from the assessment
II. What students at your school know and can do in reading, mathematics and science
III. Your school’s results in an international context
IV. Student Engagement and the Learning Environment at Your School in an International
Perspective
Annexes
103. The reports produced by the main PISA studies are geared for policy makers, decision makers
and researchers at country and education-system levels. The reports provided as part of the PISA-Based
Test for Schools pilot trial, however, are geared towards a different audience: local educators and
communities. One of the challenges in developing the content of the reports is to not only make them
statistically sound and technically robust, but to also make them accessible and relevant for the school
audience (principals, teachers, aides and staff). Additionally, the school reports should serve to make the
body of PISA research more accessible and relevant to local educators.
104. The school reports will include standard errors for all tables, similar to the main PISA reports,
when appropriate. Additionally, in an effort to make the reports accessible to local educators while
maintaining statistical rigour when presenting the errors associated with the school estimates, confidence
intervals and error bars will be included in figures where appropriate. A Reader’s Guide and explanatory

39
notes of statistical terms and concepts and other technical matters will be included so as to facilitate the
comprehension of the reports.
105. The following sections describe the specific content to be included in the school reports:
Summary of Your School’s Results
This will be a brief summary of the school’s results in reading, mathematics and science, as assessed by the
PISA-Based Test for Schools and reported on the PISA scales. Salient features of the school’s results will
be highlighted such as the proficiency level(s) obtained by the majority of students and the achievement of
the school’s top and lowest performing students. Relevant comparisons of the school’s results will be made
to national results from PISA, where appropriate, and to similar schools in other countries.
I. INTRODUCTION: UNDERSTANDING YOUR SCHOOL’S RESULTS FROM THE
ASSESSMENT
This section will begin with a descriptive overview of the assessment, explaining in clear language what
the test is designed to measure and how it attempts to do that. The commonalities and important
differences between the PISA-Based Test for Schools and the main PISA assessment will be briefly
described in non-technical language. The concepts of the PISA assessment frameworks, PISA scales and
proficiency levels, and estimates of school results will be introduced. This section will also explain the
organisation of the school report and provide a “Reader’s Guide” with general technical caveats and the
basic statistical terminology used in the report will be described.
II. WHAT STUDENTS AT YOUR SCHOOL KNOW AND CAN DO IN READING,
MATHEMATICS AND SCIENCE
This section will describe the school’s performance in reading, mathematics and science in terms of
school-level means, mean scores for male and female students (if a large enough sample participated at the
school), and students’ distributions in proficiency levels, including the percentage of top performing
students and students that do not reach the baseline levels of proficiency. In presenting the school’s results,
the section will also explain in detail the proficiency levels used to describe student performance. The
school’s results will be compared to country-level results from PISA 2009 and, where applicable, to
regions or provinces within the country. The section should allow the school to become familiar with its
own results and results for other schools in the country, before these are placed in an international context
in subsequent sections of the report.
II.1 A profile of student performance at your school compared to <your country>
This subsection will give an overview of the school’s overall performance compared to the school’s own
country – one of the participating pilot countries of Canada, the U.K. and the U.S. For schools in Canada
the subsection will include a figure that places the school’s results in the context of PISA 2009 results for
the provinces. For schools in the United Kingdom, overall results will be placed in the context of England,
Northern Ireland, Scotland and Wales. For schools in the United States, the section will include a short
description of the overall performance variation within the country in PISA 2009. Additionally, the
subsection will describe the general tendency in the country results from 2000 to 2009. For schools in the
U.K., the PISA results for Scotland will be highlighted as the overall U.K. results are only available for
two PISA rounds (2006 and 2009).
II.2. What students at your school know and can do in reading compared to <your country>

40
This subsection will describe the school’s results in reading in further detail, focussing on the distribution
of students on the PISA proficiency levels. The subsection will also describe differences between girls and
boys in their level of reading proficiency compared to the national average (if relevant).
II.3 What students at your school know and can do in mathematics This subsection will describe the school’s results in mathematics in further detail, focussing on the
distribution of students on the PISA proficiency levels. The subsection will also describe differences
between girls and boys in their level of mathematics proficiency compared to the national average.
II.4 What students at your school know and can do in science
This subsection will describe the school’s results in science in further detail, focussing on the distribution
of students on the PISA proficiency levels. The subsection will also describe differences between girls and
boys in their level of science proficiency compared to the national average.
II.5 How your school’s results compare to similar schools in <your country>
This subsection will enable the school to see how its students perform in reading, science and mathematics
compared to students at similar schools in the school’s own country, before comparing with similar schools
in other countries in a subsequent section. Similar schools are defined as schools with similar socio-
economic background of the student population as measured by the PISA index of economic, social and
cultural status (ESCS).
The subsection will explain how comparisons to similar schools in terms of socio-economic background
can help the school to identify its relative strengths and weaknesses and to set ambitious goals for the
school’s performance. The introduction will also summarise findings from PISA 2009 on the relationship
between socio-economic background and performance at schools, noting that although socioeconomic
status is correlated with performance, some students, schools and education systems are able to perform at
higher levels than what would be reasonably expected based on their socioeconomic characteristics.
II.6 Example items
This subsection will include 2 to 3 items for each subject domain with a basic scoring guide and
indications of the cognitive demands asked of the students, with the corresponding proficiency levels.
Selected released PISA items and hyperlinks to OECD resources will also be included.
III. YOUR SCHOOL’S RESULTS IN AN INTERNATIONAL CONTEXT
This section will place the school’s performance in an international context for benchmarking purposes.
The school’s results will be compared to PISA 2009 results for a selected group of 12 countries and
economies. The comparison group will include the countries that are participating in the 2012 pilot of the
PISA-Based Test for Schools as well as the OECD average. Most of the comparison countries and
economies are top performing or have undertaken significant reforms and seen rapid improvement. The 12
countries and economies represent a range of education systems and models as well as policies and
practices that are relevant for school improvement efforts. The proposed comparison group are:
Brazil (partner country)
Canada
Finland
Germany
Japan
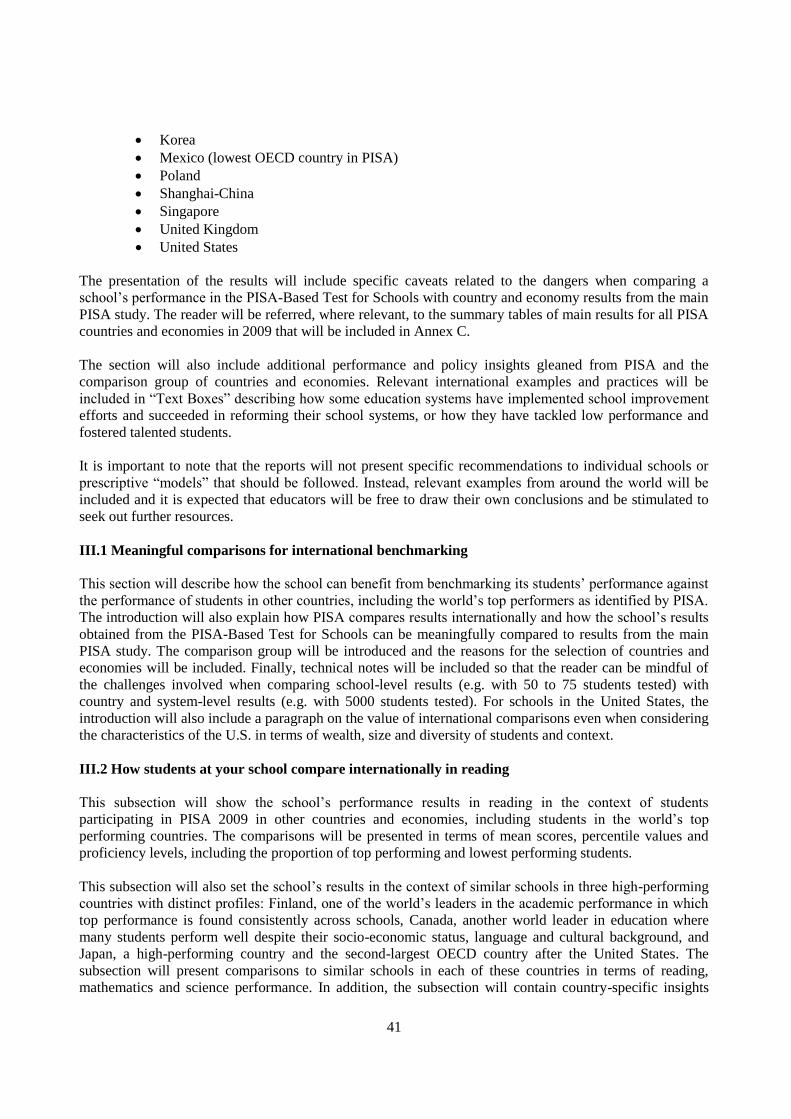
41
Korea
Mexico (lowest OECD country in PISA)
Poland
Shanghai-China
Singapore
United Kingdom
United States
The presentation of the results will include specific caveats related to the dangers when comparing a
school’s performance in the PISA-Based Test for Schools with country and economy results from the main
PISA study. The reader will be referred, where relevant, to the summary tables of main results for all PISA
countries and economies in 2009 that will be included in Annex C.
The section will also include additional performance and policy insights gleaned from PISA and the
comparison group of countries and economies. Relevant international examples and practices will be
included in “Text Boxes” describing how some education systems have implemented school improvement
efforts and succeeded in reforming their school systems, or how they have tackled low performance and
fostered talented students.
It is important to note that the reports will not present specific recommendations to individual schools or
prescriptive “models” that should be followed. Instead, relevant examples from around the world will be
included and it is expected that educators will be free to draw their own conclusions and be stimulated to
seek out further resources.
III.1 Meaningful comparisons for international benchmarking
This section will describe how the school can benefit from benchmarking its students’ performance against
the performance of students in other countries, including the world’s top performers as identified by PISA.
The introduction will also explain how PISA compares results internationally and how the school’s results
obtained from the PISA-Based Test for Schools can be meaningfully compared to results from the main
PISA study. The comparison group will be introduced and the reasons for the selection of countries and
economies will be included. Finally, technical notes will be included so that the reader can be mindful of
the challenges involved when comparing school-level results (e.g. with 50 to 75 students tested) with
country and system-level results (e.g. with 5000 students tested). For schools in the United States, the
introduction will also include a paragraph on the value of international comparisons even when considering
the characteristics of the U.S. in terms of wealth, size and diversity of students and context.
III.2 How students at your school compare internationally in reading
This subsection will show the school’s performance results in reading in the context of students
participating in PISA 2009 in other countries and economies, including students in the world’s top
performing countries. The comparisons will be presented in terms of mean scores, percentile values and
proficiency levels, including the proportion of top performing and lowest performing students.
This subsection will also set the school’s results in the context of similar schools in three high-performing
countries with distinct profiles: Finland, one of the world’s leaders in the academic performance in which
top performance is found consistently across schools, Canada, another world leader in education where
many students perform well despite their socio-economic status, language and cultural background, and
Japan, a high-performing country and the second-largest OECD country after the United States. The
subsection will present comparisons to similar schools in each of these countries in terms of reading,
mathematics and science performance. In addition, the subsection will contain country-specific insights

42
from PISA and other OECD research, including lessons from education systems that are most successful in
reducing the negative impact of socio-economic background on student performance. For schools in
Canada, the United States will replace Canada in the international comparisons.
III.3 How students at your school compare internationally in mathematics
This subsection will set the school’s performance results in mathematics in the context of those of students
from around the world, including students in the world’s top performing countries and economies. The
comparisons will be presented in terms of mean scores and proficiency levels, including the proportion of
top performing and lowest performing students. The subsection will also set the school’s mathematics
results in the context of similar schools in high-performing countries.
III.4 How students at your school compare internationally in science
This subsection will set the school’s performance results in science in the context of those of students at a
global scale, including students in the world’s top performing countries and economies. The comparisons
will be presented in terms of mean scores and proficiency levels, including the proportion of top
performing and lowest performing students. The subsection will also set the school’s science results in the
context of similar schools in high-performing countries.
IV. STUDENT ENGAGEMENT AND THE LEARNING ENVIRONMENT AT YOUR SCHOOL IN
AN INTERNATIONAL PERSPECTIVE
IV.1 The learning environment at your school and other schools in <your country>
PISA shows that a strong learning environment at the school is consistently and robustly associated with
better student performance when comparing students’ performance within a country. This subsection will
enable the school to identify how its learning environment (as identified by the questionnaires) compares to
the country average. This section also describes international findings on the relationship between learning
environment and student performance. The subsection will focus on two elements that across countries
have proven to be crucial in establishing an environment that is conducive to learning: the teacher-student
relations and the disciplinary climate at the school, as reported by the students.
IV.2 Students’ reading habits and the relationship with performance
Across schools and nations, students’ reading performance is closely associated to their reading habits and
approaches to learning. This subsection will describe international findings on these relations and show
how the reading habits among the school’s students compare with those of other students in the school’s
own country. It will also show how reading habits are correlated with reading skills at the school, at a
national level and in the two OECD countries with the highest performance results in reading, Korea and
Finland.
IV.3 Students’ attitudes to mathematics and the relationship with performance
Across schools and countries, students’ attitudes towards and engagement with mathematics are important
to learning and closely related to performance. This subsection will show to which extent students at the
school, compared to students across the country, believe that learning mathematics and making an effort is
important for their future education and career, and to which extent they believe that investment in learning
can help them to overcome difficulties in mathematics. The subsection will also show how both of these
aspects, the students’ instrumental motivation and their self-efficacy in mathematics, are related to
mathematics performance at the school and in PISA studies.
IV.4 Students’ self-belief and interest in science and the relationship with performance

43
Similar to mathematics, international research has found strong relations between students’ attitudes to
science and their performance results. Successful learners in science find it useful for their own career
prospects to study science. A strong sense of self-efficacy can affect students’ willingness to make an
effort, which is again reflected in their performance. This subsection will show to which degree the
school’s students are confident in overcoming difficulties in science compared to other students in the
country, and to what extent students find it useful for their own future to make an effort in science. The
subsection will also show how these aspects, self-efficacy and instrumental motivation in science, are
related to student performance at the school and in PISA studies.
ANNEXES
The school reports will include the following annexes:
A. Overview of the PISA-Based Test for Schools assessment (i.e. numbers of items, units and
response-types)
B. The 2012 pilot trial of the PISA-Based Test for Schools
Box I.2: The relation between the PISA assessment frameworks and national curricula and assessment
How the test was carried out at your school
Figure I.2: Summary of testing carried out at your school: test date(s), number of students tested
C. Tables of country and economy results from PISA 2009
Percentage of students at each proficiency level on the reading scale by country (Table I.2.1 in
PISA 2009 with Level 1b and Below Level 1b merged)
Mean score, mean score adjusted for ESCS, variation and gender difference in student
performance on the reading scale (Table I.2.3 in PISA 2009)
Percentage of students at each proficiency level on the mathematics scale by country (Table
I.3.1 in PISA 2009)
Mean score, mean score adjusted for ESCS, variation and gender difference in student
performance on the mathematics scale (Table I.3.3 in PISA 2009)
Percentage of students at each proficiency level on the science scale by country (Table I.3.4 in
PISA 2009)
Mean score, mean score adjusted for ESCS, variation and gender difference in student
performance on the science scale (Table I.3.6 in PISA 2009)

44
PISA-Based Test for Schools Pilot Trial 2012
PROPOSAL OF TEXT BOXES TO BE INCLUDED IN THE SCHOOL REPORTS
Section 1. Introduction: Understanding your school’s results from the assessment
Box 1.1 An introduction to PISA and the OECD
Box 1.2 The PISA assessment frameworks
Box 1.3 Reader’s Guide to the School Report (will include statistical terminology used in the report)
Section 2. What students at your school know and can do in reading, mathematics and science
Section 3. Your school’s results in an international context
Box 3.1 The relationship between education and economic growth
Box 3.2 The group of comparison countries and economies highlighted in the report
Box 3.3 The link between reading performance and success in adult life
Box 3.4 What PISA shows regarding student achievement in mathematics
Box 3.5 What PISA shows regarding student achievement in science
Section 4. Student Engagement and the Learning Environment at Your School in an International
Perspective
Box 4.1 How PISA measures the socio-economic and cultural background of students
Box 4.2 Resilient students that succeed “Against the Odds”: Lessons from PISA (resilient students in
PISA 2009 for the pilot countries)
Additional potential text boxes (the content of these boxes will attempt to speak to school staff and local
educators as opposed to country-level policy discussions)
Box 1. International benchmarks for local improvement: An example from Brazil
Box 2. 20 point action plan to improve performance in Welsh schools
Box 3. Support for students that need extra-help – “Student Success Teachers in Ontario, Canada
Box 4. The importance of recruiting and training good teachers – An Example from Singapore
Box 5. Supporting disadvantaged schools
Box 6. The potential of immigrant students and English-language learners
Box 7. A Commitment to Inclusion – An Example from Finland
Box 8. How schools in Shanghai-China draw on the strengths of the best schools
Box 9. What makes a school successful? Some lessons from PISA
Box 10. Learning in the 21st century: What does it mean for schools and local educators?
Box 11. Making the most of top-performing teachers
Box 13. Teacher-to-teacher peer learning - An example from East Asia
Box 14. School policies, practices and resources: Examples of innovative learning environments
Box 15. How schools use ICT in Korea for continuous school improvement