Embed Size (px)
Citation preview

Instrument calibration tables
This worksheet and all related files are licensed under the Creative Commons Attribution License,version 1.0. To view a copy of this license, visit http://creativecommons.org/licenses/by/1.0/, or send aletter to Creative Commons, 559 Nathan Abbott Way, Stanford, California 94305, USA. The terms andconditions of this license allow for free copying, distribution, and/or modification of all licensed works bythe general public.
1

Questions
Question 1
Suppose you had a current-to-pressure (“I/P”) transducer with an output range of 3 to 15 PSI andan input range of 4 to 20 mA. The following calibration table shows several input signal levels and theircorresponding percentages of span and output pressures:
Input signal Percent of span Output pressureapplied (mA) (%) (PSI)
6.88 18 5.165.1 6.88 3.8312.8 55 9.617.44 84 13.086.53 15.83 4.9
While the calculations for obtaining percent and output pressure (PSI) from input current (mA) valuesare not very complex, they can be tedious. A powerful computer-based tool for relieving this tedium is atype of application called a spreadsheet. A very common example of spreadsheet software is Microsoft Excel(although other spreadsheet programs exist, some of them free!).
A spreadsheet program presents a screen full of rectangular cells into which text, numerical values, andmathematical formulae may be entered. Each cell is “addressed” by a system of row and column designators,traditionally numbers for rows and letters for columns (like the classic game of “Battleship” where coordinateson a grid-map are called out by letter and number combination) but a more modern convention designatesboth rows and columns by number.
We may set up a spreadsheet to calculate percentage values for this I/P based on input currents asfollows. The yellow and blue cell shading (color fill) shown in this example is entirely optional, but helpsto distinguish number-entry fields from calculated-value fields (the number in the yellow cell R2C1 is themilliamp value you type in to the spreadsheet, while the number in the blue cell R2C3 is the PSI valuecalculated by the spreadsheet):
1
2
3
4
5
Input (mA) Percent
6.88 18.0
1 2 3 4 5
What follows is a list of cell entries needed to create the spreadsheet display you see above:
• Cell R1C1: Input (mA)
• Cell R2C1: 6.88
• Cell R1C3: Percent
• Cell R2C3: = (R2C1 - 4) / 16 (select “%” display formatting)
The text inside cells R1C1 and R1C3 is not essential for the spreadsheet to function – like the colorshading, they merely serve as labels to help describe what the number values mean. The formula enteredinto cell R2C3 begins with an equals sign (=), which tells the spreadsheet to regard it as a formula ratherthan as text to be displayed verbatim as in R1C1 and R1C3. Note how the formula references the numericalvalue located in the “row 2 column 1” cell by calling it “R2C1”. This allows the user to enter differentvalues into cell R2C1, and the spreadsheet will automatically re-calculate the percentage for each enteredmA value. Thus, if you were to edit the contents of cell R2C1 to hold 12.8 instead of 6.88, the value shownin cell R2C3 would update to display 55.0 instead of 18.0 as it does now.
2

Your first task here is to start up a spreadsheet program and enter what is shown above, then validatethe accuracy of your work by entering several different current (milliamp) values and checking that thepercentages for each are calculated correctly by the spreadsheet.
Now that you have successfully created this spreadsheet, add the appropriate entries into cells R1C5and R2C5 so that it also calculates the appropriate output pressure for the I/P, for any arbitrary inputcurrent entered into cell R2C1. When complete, your modified spreadsheet should look something like this:
1
2
3
4
5
Input (mA) Percent
6.88 18.0 5.16
Output (PSI)
1 2 3 4 5
Show what entries you had to place into cells R1C5 and R2C5 to make this spreadsheet work.
Suggestions for Socratic discussion
• Identify the text character used to represent division in the formula shown in cell R2C3. What is theappropriate character to represent multiplication?
• Explain why parentheses are used in the formula in cell R2C3. Hint: a good problem-solving approachfor answering this question is to analyze what would happen if the parentheses were not there!
• Explain what would happen if cell R2C3 were not configured to display in percent.• There is more than one correct formula to enter into cell R2C5 to properly calculate the output pressure
in PSI. One formula references the percentage value (located at R2C3), while the other formula referencesthe milliamp value (located at R2C1). Compare these two formulae, and explain which one makes moresense to you.
• Explain how a spreadsheet is such a powerful mathematical tool for performing “tedious” calculationssuch as instrument input/output responses. Can you think of any other practical uses for a spreadsheet?
file i01626
3

Question 2
A tachogenerator is used to measure the rotary speed of a machine. Its calibrated range is 0 to 1500RPM (revolutions per minute) and its corresponding signal output is 0 to 10 volts DC. Given these rangevalues, calculate the output voltages for the following input shaft speeds, and then describe how you wereable to correlate the different speeds to output voltage values:
Shaft speed Output voltage(RPM) (volts DC)
100350500750890975123014101500
file i00085
Question 3
Suppose you wish to calibrate an electronic pressure transmitter to an input range of 0 to 50 PSI, withan output range of 4 to 20 mA. Complete the following calibration table showing the proper test pressuresand the ideal output signal levels at those pressures:
Input pressure Percent of span Output signalapplied (PSI) (%) (mA)
0255075100
file i01763
Question 4
Suppose you wish to calibrate an electronic pressure transmitter to an input range of 0 to 200 PSI, withan output range of 4 to 20 mA. Complete the following calibration table showing the proper test pressuresand the ideal output signal levels at those pressures:
Input pressure Percent of span Output signalapplied (PSI) (%) (mA)
0255075100
file i01764
4

Question 5
In instrumentation parlance, a transducer is a calibrated device used to convert one standardized signalinto another standardized signal. One very common form of transducer is an I/P transducer, which convertsan electric current signal into a pneumatic pressure signal:
I/P
Current signalinput
Air pressuresignal outputY
The symbols shown above are standard for process and instrumentation diagrams (P&ID’s), where anelectric cable is shown as a dashed line, a pneumatic pipe or tube shown as a line with double hash-marksperiodically drawn through it, and the instrument is a circle with letters (in this case, “Y”, representing asignal relay, computing element, transducer, or converter).
The most popular range for electric current signals is 4 to 20 mA DC. The most common range forpneumatic (air pressure) signals is 3 to 15 PSI. Therefore, the most common type of I/P transducer has aninput range of 4-20 mA and an output range of 3-15 PSI. Both of these ranges are there to represent somemeasured or manipulated quantity in an instrument system. That is, 0% of range will be represented by a 4mA input signal to the I/P, and a 3 PSI output signal; 100% of range will be represented by a 20 mA inputsignal and a 15 PSI output signal; 50% range will be represented by a 12 mA input and a 9 PSI output.
Complete all the missing data in the following calibration table for this I/P transducer, and then describehow you were able to correlate the different percentages of range with specific current and pressure signalvalues:
Input current Percent of range Output pressure(mA) (%) (PSI)
4 0 31020253040
12 50 96070758090
20 100 15
Challenge: build a computer spreadsheet that calculates all current and pressure values from givenpercentages.
file i00084
5

Question 6
Suppose you wish to calibrate a current-to-pressure (“I/P”) transducer to an output range of 3 to 15PSI, with an input range of 4 to 20 mA. Complete the following calibration table showing the proper testpressures and the ideal input signal levels at those pressures:
Input signal Percent of span Output pressureapplied (mA) (%) (PSI)
358095
file i01625
Question 7
An electronic level transmitter has a calibrated range of 0 to 2 feet, and its output signal range is 4 to20 mA. Complete the following table of values for this transmitter, assuming perfect calibration (no error).Be sure to show your work!
Measured level Percent of span Output signal(feet) (%) (mA)1.6
7.140
file i00032
Question 8
A pneumatic level transmitter has a calibrated range of 0 to 5 feet, and its output signal range is 3 to15 PSI. Complete the following table of values for this transmitter, assuming perfect calibration (no error).Be sure to show your work!
Measured level Percent of span Output signal(feet) (%) (PSI)3.2
450
2.411.3
18
file i00097
6

Question 9
Suppose you wish to calibrate an electronic pressure transmitter to an input range of 0 to 50 inches ofwater, with an output range of 4 to 20 mA. Complete the following calibration table showing the proper testpressures and the ideal output signal levels at those pressures:
Input pressure Percent of span Output signalapplied (” W.C.) (%) (mA)
53361
file i00462
Question 10
An electronic pressure transmitter has a calibrated range of 0 to 200 inches of mercury, and its outputsignal range is 4 to 20 mA. Complete the following table of values for this transmitter, assuming perfectcalibration (no error):
Input pressure Percent of span Output signalapplied (” Hg) (%) (mA)
2419
11.7
file i00473
Question 11
Suppose you wish to calibrate a pneumatic pressure transmitter to an input range of -10 to +50 inchesof mercury, with an output range of 3 to 15 PSI. Complete the following calibration table showing the testpressures to use and the allowable low/high output signals for a calibrated tolerance of +/- 0.5% (of span).Assume you can only use positive test pressures (no vacuum), and be sure to designate which side the testpressure should be applied to (H = high ; L = low):
Input pressure Percent of span Output signal Output signal Output signalapplied (” Hg) (%) ideal (PSI) low (PSI) high (PSI)
0255075100
Each correct numerical value is worth 0.8 points (16 total points divided by 20 total answers)file i00467
7

Question 12
A pneumatic differential pressure transmitter has a calibrated range of −100 to +100 inches of watercolumn (” W.C.), and its output signal range is 3 to 15 PSI. Complete the following table of values for thistransmitter, assuming perfect calibration (no error). Be sure to show your work!
Input pressure Percent of span Output signalapplied (”W.C.) (%) (PSI)
0−30
813
6510
Suggestions for Socratic discussion
• Develop a linear equation in the form of y = mx + b that directly relates input pressure (x) to outputpressure (y).
• Demonstrate how to estimate numerical answers for this problem without using a calculator.
file i00096
8

Question 13
A turbine flowmeter measuring cooling water for a large power generator uses an electronic circuit toconvert its pickup coil pulses into a 4-20 mA analog current signal. The “K factor” for the turbine elementis 99 pulses per gallon, and the 4-20 mA analog output is ranged from 0 to 500 GPM flow. Complete thefollowing table of values for this transmitter, assuming perfect calibration (no error). Be sure to show yourwork!
Measured flow Pickup signal Percent of output Output signal(GPM) frequency (Hz) span (%) (mA)
250412
305780
6349
1016
Suggestions for Socratic discussion
• Demonstrate how to estimate numerical answers for this problem without using a calculator.• Suppose you were asked to check the accuracy of the frequency-to-current converter circuit for this
flowmeter. What sort of test equipment would you use, and how could you perform the test with theflowmeter still installed in the cooling water pipe?
• Could the pulse output of the pickup coil be used directly as a flow signal, or is the converter circuitabsolutely necessary?
• Explain how a PLC could be used to totalize the water flow through this flowmeter, to provide totalusage values at the end of each day.
file i00101
Question 14
Suppose you wish to calibrate a turbine flowmeter to an input range of 0 to 600 gallons per minute.The k factor for this turbine is 20 pulses per gallon, making the input frequency range 0 to 200 Hz for thisflow range. The output signal range is 4 to 20 mA. Complete the following calibration table showing theproper test frequencies and the ideal output signals at those levels:
Simulated flow Input frequency Percent of span Output signalrate (GPM) applied (Hz) (%) (mA)
972560
400
file i02996
9

Question 15
Suppose you wish to calibrate a turbine flowmeter to an input range of 0 to 300 gallons per minute.The k factor for this turbine is 80 pulses per gallon, making the input frequency range 0 to 400 Hz for thisflow range. The output signal range is 4 to 20 mA. Complete the following calibration table showing theproper test frequencies and the ideal output signals at those levels:
Simulated flow Input frequency Percent of span Output signalrate (GPM) applied (Hz) (%) (mA)
17130
45300
file i00694
Question 16
Suppose you wish to calibrate a turbine flowmeter to an input range of 0 to 800 gallons per minute.The k factor for this turbine is 30 pulses per gallon, making the input frequency range 0 to 400 Hz for thisflow range. The output signal range is 4 to 20 mA. Complete the following calibration table showing theproper test frequencies and the ideal output signals at those levels:
Simulated flow Input frequency Percent of span Output signalrate (GPM) applied (Hz) (%) (mA)
552563
700
file i00695
Question 17
An electronic pressure transmitter has a calibrated range of -10 to 60 PSI, and its output signal rangeis 4 to 20 mA. Complete the following table of values for this transmitter, assuming perfect calibration (noerror). Be sure to show your work!
Input pressure Percent of span Output signalapplied (PSI) (%) (mA)
0-5
1213.6
4022
file i00095
10

Question 18
A pneumatic level transmitter has a calibrated range of 150 inches to 300 inches of liquid level, with anoutput range of 3 to 15 PSI. Complete the following table of values for this transmitter, assuming perfectcalibration (no error):
Input level Percent of span Output signalapplied (inches) (%) (PSI)
47.2
189
file i00506
Question 19
Suppose you wish to calibrate a pneumatic level transmitter to an input range of 0 to 400 inches, withan output range of 3 to 15 PSI. Complete the following calibration table showing the proper test levels andthe ideal output signals at those levels:
Input level Percent of span Output signalapplied (inches) (%) (PSI)
0255075100
file i00507
Question 20
An ultrasonic level transmitter has a calibrated range of 40 to 75 inches and its output signal range is4 to 20 mA. Complete the following table of values for this transmitter, assuming perfect calibration (noerror). Be sure to show your work!
Measured level Percent of span Output signal(inches) (%) (mA)
476
7560
15.134
Suggestions for Socratic discussion
• Demonstrate how to estimate numerical answers for this problem without using a calculator.
file i00098
11

Question 21
Suppose you wish to calibrate an RTD temperature transmitter to an input range of 50 to 200 degreesF, with an output range of 4 to 20 mA. Complete the following calibration table showing the proper testtemperatures and the ideal output signals at those levels:
Input temp Percent of span Output signalapplied (deg F) (%) (mA)
0255075100
file i00644
Question 22
Suppose you wish to calibrate a thermocouple temperature transmitter to an input range of 0 to 1500degrees F, with an output range of 4 to 20 mA. Complete the following calibration table showing the propertest temperatures and the ideal output signals at those levels:
Input temp Percent of span Output signalapplied (deg F) (%) (mA)
0255075100
file i00645
Question 23
A temperature transmitter has a calibrated range of -80 to 150 degrees F and its output signal rangeis 4 to 20 mA. Complete the following table of values for this transmitter, assuming perfect calibration (noerror). Be sure to show your work!
Measured temp Percent of span Output signal(oF) (%) (mA)120-45
4225
7.512.9
file i00099
12

Question 24
A Foxboro pneumatic square root extractor has a calibrated range of 3 to 15 PSI for both input andoutput. Complete the following table of values for this relay, assuming perfect calibration (no error). Besure to show your work!
Input signal Percent of input Percent of output Output signal(PSI) span (%) span (%) (PSI)
513
5030
8015
712
Suggestions for Socratic discussion
• Why are pneumatic square-root extractors all but obsolete in modern industry? What has replacedtheir functionality?
• Share problem-solving techniques for obtaining answers to this problem.
file i00100
13

Question 25
Every instrument has at least one input and at least one output. For instruments responding linearly,the correspondence between input and output is proportional:
x yInput Output
Instrument
=x - LRVin
URVin - LRVin
y - LRVout
URVout - LRVout
LRVin
URVin
LRVout
URVout
A practical example of this is a pressure transmitter, in this case one with an input range of 0 to 1023PSI and an output of 4-20 mA:
x
y
Input
Output
=
H L
URVout = 20 mALRVout = 4 mA
URVin = 1023 PSILRVin = 0 PSI
x - 0 PSI
1023 PSI 16 mA
y - 4 mA
If you happened to measure an output current of 14.7 mA from this pressure transmitter, it would bea simple matter for you to calculate the corresponding input pressure to be 684.13 PSI.
However, students are often taken by surprise when they encounter an analog-to-digital converter (ADC)or digital-to-analog converter (DAC) and are asked to correlate input and output for such devices. Whatmight seem a daunting task at first, though, soon reveals itself to be the same input-to-output correspondencecalculations they’ve seen all along in the guise of analog sensors and other instruments.
Take for example this analog-to-digital converter, with a 10-bit output (a “count” range of 0 to 1023)and a 4-20 mA input:
x Output y
URVout = 1023LRVout = 0
Input
10-bit ADCLRVin = 4 mAURVin = 20 mA
Calculate the corresponding “count” output of this ADC circuit given a 6.82 mA input signal.
Suggestions for Socratic discussion
14

• Explain why the “count” value generated by an analog-to-digital converter must be an integer number.For example, explain why a count value of 3275 might be valid, but a count value of 3274.83 is not.
file i04545
Question 26
The ADC0804 is an example of an integrated circuit analog-to-digital converter (ADC), converting ananalog input voltage signal into an 8-bit binary output:
ADC0804
+V
Vin
Digital data output lines
DB0DB7
Clk in
When operated from a 5.0 volt DC power supply in its simplest mode, the ADC0804 converts any DCinput voltage between 0.0 volts and 5.0 volts into an 8-bit number at the command of a clock pulse. A 0.0volt input yields a binary output (or “count”) of 00000000, of course, while a 5.0 volt input yields a countof 11111111.
Complete this table of numbers, relating various DC input voltages with count values (expressed inbinary, hex, and decimal) for an ADC0804 having an input range of 0.0 to 5.0 volts DC:
DC input voltage Binary count Hex count Decimal count0.0 volts 00000000
00110011 512.2 volts 70
B3 17911001100 CC
5.0 volts 11111111
Suggestions for Socratic discussion
• Explain why the “count” value generated by an analog-to-digital converter must be an integer number.For example, explain why a count value of 3275 might be valid, but a count value of 3274.83 is not.
file i03270
15

Question 27
An analog-to-digital converter has a 12-bit binary output and an analog input voltage range of 0.0 to+ 5.0 volts. Calculate:
• The digital output (in hexadecimal) at 0.0 volts analog input =
• The digital output (in hexadecimal) at 5.0 volts analog input =
• The digital output (in hexadecimal) at 2.1 volts analog input =
• The analog input corresponding to a digital output of 2D0 = volts
• The analog input corresponding to a digital output of F14 = volts
file i03587
Question 28
An analog-to-digital converter has a 16-bit binary output and an analog input voltage range of 0.0 to+ 10.0 volts. Calculate:
• The digital output (in hexadecimal) at 0.0 volts analog input =
• The digital output (in hexadecimal) at 10.0 volts analog input =
• The digital output (in hexadecimal) at 3.4 volts analog input =
• The analog input corresponding to a digital output of 3D6A = volts
• The analog input corresponding to a digital output of C005 = volts
file i02661
Question 29
An analog-to-digital converter (ADC) has a calibrated input range of 0 to 10 volts, and a 12-bit output(0 to 4095 “count” range). Complete the following table of values for this converter, assuming perfectcalibration (no error):
Input voltage Percent of span Counts Counts(volts) (%) (decimal) (hexadecimal)
0255075100
file i03823
16

Question 30
An essential component of any digital control system is an analog-to-digital converter, or ADC. This isnecessary to convert the analog process variable measurement into a digital number for the control algorithmto process. Another essential component is a digital-to-analog converter, or DAC, which does the exactopposite.
In a system using 4-20 mA analog currents to relay instrument signals, there is an ADC located at theprocess variable input of the controller, and a DAC located at the output of the controller:
Transmitter
4-20 mA
Controller
ADC
4-20 mA
DACI/P
Transducer
Control valve
In digital “Fieldbus” systems, the communication is all digital, which places the ADC at the transmitterand the DAC at the transducer:
Transmitter Controller
ADC
DACTransducer
Control valve
Fieldbus Fieldbus
17

In either case, we need to “scale” the binary count of the ADC and DAC to their respective analogvariable values. Consider a flow control system, with a flow transmitter ranged from 0 to 200 GPM and apneumatic control valve operating on a pressure range of 3 to 15 PSI (instrument air). Assuming the ADChas a resolution of 16 bits (a digital conversion range of $0000 to $FFFF) and the DAC has a resolution of14 bits (a digital conversion range of $0000 to $3FFF), determine the digital values corresponding to a 50%PV signal (100 GPM flow rate) and a 50% valve position (9 PSI pneumatic signal). Write these hexadecimalnumber values in the following tables:
Calibration table for process variable signal (ADC)
Measurement Digital output0 GPM $0000
100 GPM200 GPM $FFFF
Calibration table for output signal (DAC)
Measurement Digital output$0000 0 PSI
9 PSI$3FFF 15 PSI
Note that the DAC output does not correspond to a live zero scale. In other words, a digital input valueof $0000 will output no pressure to the valve (0 PSI), rather than a standard pneumatic “zero” signal of 3PSI.
file i01498
Question 31
An analog-to-digital converter (ADC) has a calibrated input range of 0 to 10 volts, and a 16-bit output(0 to 65535 “count” range). Complete the following table of values for this converter, assuming perfectcalibration (no error):
Input voltage Percent of span Counts Counts(volts) (%) (decimal) (hexadecimal)
0255075100
file i03824
18

Question 32
A digital pressure transmitter has a calibrated input range of 0 to 75 PSI, and a 14-bit output (0 to 16383“count” range). Complete the following table of values for this transmitter, assuming perfect calibration (noerror):
Input pressure Percent of span Counts Counts(PSI) (%) (decimal) (hexadecimal)
036628995
file i03825
Question 33
A digital pressure transmitter has a calibrated input range of 50 to 200 PSI, and a 10-bit output (0 to1023 “count” range). Complete the following table of values for this transmitter, assuming perfect calibration(no error):
Input pressure Percent of span Counts Counts(PSI) (%) (decimal) (hexadecimal)
722395678
file i03826
19

Question 34
A digital level transmitter has a calibrated input range of 20 to 170 inches of liquid level, and a 10-bitoutput (0 to 1023 “count” range). Complete the following table of values for this transmitter, assumingperfect calibration (no error):
Input level Percent of span Counts Counts(inches) (%) (decimal) (hexadecimal)
1128557392
file i03827
Question 35
An analog-to-digital converter (ADC) has a calibrated input range of 0 to 5 volts, and a 12-bit output.Complete the following table of values for this converter, assuming perfect calibration (no error):
Input voltage Percent of span Counts Counts(volts) (%) (decimal) (hexadecimal)
1.63022
40A2F
Suggestions for Socratic discussion
• Calculate the resolution of this ADC in percent of full-scale range. In other words, what is the smallestpercentage of input signal change it is able to resolve?
file i03822
Question 36
Suppose a FOUNDATION Fieldbus pressure transmitter is connected to measure the pressure of naturalgas inside a pipeline. The expected range of pressure inside this vessel is 0 to 600 PSI.
Determine the proper configuration parameters for this Fieldbus instrument’s Analog Input (AI) block:
L Type
XD Scale
OUT Scale
file i01218
20

Question 37
Suppose a FOUNDATION Fieldbus differential pressure transmitter is connected to measure thepressure drop created by an orifice plate, proportional to the square of fluid flow rate through the orifice. Ata flow rate of 400 GPM, the orifice produces a pressure differential of 135 inches water column.
Determine the proper configuration parameters for this Fieldbus instrument’s Analog Input (AI) block:
L Type
XD Scale
OUT Scale
file i01216
Question 38
Suppose a FOUNDATION Fieldbus pressure transmitter is connected to the hydraulic line supplyingfluid pressure to a ram, for the purpose of measuring the ram’s exerted force based on sensed pressure. Recallthat the relationship between force and fluid pressure for a piston is F = PA, where F is force in pounds,A is surface area of the piston in square inches, and P is fluid pressure in PSI. Recall as well that the areafor a circular object is given by the formula A = πr2.
Supposing the ram’s piston has a diameter of exactly 2 inches, determine the proper configurationparameters for this Fieldbus instrument’s Analog Input (AI) block, assuming we wish this transmitter toreport ram force over a range of 0 to 4700 pounds.
L Type
XD Scale
OUT Scale
file i01222
Question 39
Suppose a FOUNDATION Fieldbus pressure transmitter is connected to the bottom of a vesselcontaining a liquid half as dense as water, for the purpose of measuring liquid height inside the vesselbased on hydrostatic pressure. For every foot of liquid height, 6 inches water column pressure is sensed bythe transmitter.
Determine the proper configuration parameters for this Fieldbus instrument’s Analog Input (AI) block,assuming we wish this transmitter to report liquid height over a range of 0 to 18 feet:
L Type
XD Scale
OUT Scale
file i01217
21

Question 40
Suppose a FOUNDATION Fieldbus pressure transmitter is connected to the bottom of a water storagetank, for the purpose of measuring water volume stored inside the tank based on hydrostatic pressure. Thetank is shaped like a vertical cylinder, 10 feet in diameter and 20 feet high.
Determine the proper configuration parameters for this Fieldbus instrument’s Analog Input (AI) block,assuming we wish this transmitter to report liquid height over a range of 0 to 15 feet, expressed in units ofcubic feet:
L Type
XD Scale
OUT Scale
file i01220
Question 41
Suppose a FOUNDATION Fieldbus pressure transmitter is connected to the bottom of a liquid storagevessel for the purpose of measuring liquid height based on hydrostatic pressure. This transmitter happensto be configured with the following Analog Input (AI) block parameters:
L Type IndirectXD Scale 38 to 183.488 inches WCOUT Scale 0 to 14 feet
Calculate the height reported by this transmitter when it senses a hydrostatic pressure of 71.8 inchesWC.
Calculate the hydrostatic pressure sensed by this transmitter when it reports a liquid height of 9.3 feet.
file i01221
22

Answers
Answer 1
Here are two possible formulae for entry into cell R2C5:
= ((R2C1 - 4) / 16) * 12 + 3
= R2C3 * 12 + 3
One very practical use for this type of spreadsheet program is to create practice problems for yourself,so that you may practice instrument input/output range calculations.
Answer 2
Shaft speed Output voltage(RPM) (volts DC)
100 0.67350 2.3500 3.3750 5.0890 5.9975 6.51230 8.21410 9.41500 10.00
Answer 3
Input pressure Percent of span Output signalapplied (PSI) (%) (mA)
0 0 412.5 25 825 50 12
37.5 75 1650 100 20
Answer 4
Input pressure Percent of span Output signalapplied (PSI) (%) (mA)
0 0 450 25 8100 50 12150 75 16200 100 20
23

Answer 5
Input current Percent of range Output pressure(mA) (%) (PSI)
4 0 35.6 10 4.27.2 20 5.48 25 6
8.8 30 6.610.4 40 7.812 50 9
13.6 60 10.215.2 70 11.416 75 12
16.8 80 12.618.4 90 13.820 100 15
Follow-up question: explain the procedure for starting with a current value in milliamps and calculatingthe equivalent percentage.
Answer 6
Input signal Percent of span Output pressureapplied (mA) (%) (PSI)
9.6 35 7.216.8 80 12.619.2 95 14.4
Answer 7
Measured level Percent of span Output signal(feet) (%) (mA)1.6 80 16.8
0.3875 19.375 7.10.8 40 10.4
Answer 8
Measured level Percent of span Output signal(feet) (%) (PSI)3.2 64 10.68
0.4167 8.333 42.5 50 92.4 48 8.76
3.458 69.17 11.30.9 18 5.16
24

Answer 9
Input pressure Percent of span Output signalapplied (” W.C.) (%) (mA)
2.5 5 4.816.5 33 9.2830.5 61 13.76
Answer 10
Input pressure Percent of span Output signalapplied (” Hg) (%) (mA)
24 12 5.9238 19 7.04
96.25 48.13 11.7
Answer 11
Input pressure Percent of span Output signal Output signal Output signalapplied (” Hg) (%) ideal (mA) low (mA) high (mA)
10 L 0 3 2.94 3.065 H 25 6 5.94 6.0620 H 50 9 8.94 9.0635 H 75 12 11.94 12.0650 H 100 15 14.94 15.06
Answer 12
Input pressure Percent of span Output signalapplied (”W.C.) (%) (PSI)
0 50 9−30 35 7.2
−16.67 41.67 866.67 83.33 1330 65 10.8−80 10 4.2
25

Answer 13
Measured flow Pickup signal Percent of output Output signal(GPM) frequency (Hz) span (%) (mA)
250 412.5 50 12412 679.8 82.4 17.18
184.8 305 36.97 9.915472.7 780 94.55 19.13315 519.8 63 14.08245 404.3 49 11.84
187.5 309.4 37.5 10375 618.8 75 16
f = kQ
Where,f = Frequency in Hertz (pulses per second)k = Calibration factor in pulses per gallonQ = Volumetric flow rate in gallons per second
f =kQ
60
Where,f = Frequency in Hertz (pulses per second)k = Calibration factor in pulses per gallonQ = Volumetric flow rate in gallons per minute
Answer 14
Simulated flow Input frequency Percent of span Output signalrate (GPM) applied (Hz) (%) (mA)
97 32.33 16.17 6.587150 50 25 8360 120 60 13.6400 133.3 66.6 14.67
Answer 15
Simulated flow Input frequency Percent of span Output signalrate (GPM) applied (Hz) (%) (mA)
51 68 17 6.72130 173.33 43.33 10.933135 180 45 11.2300 400 100 20
26
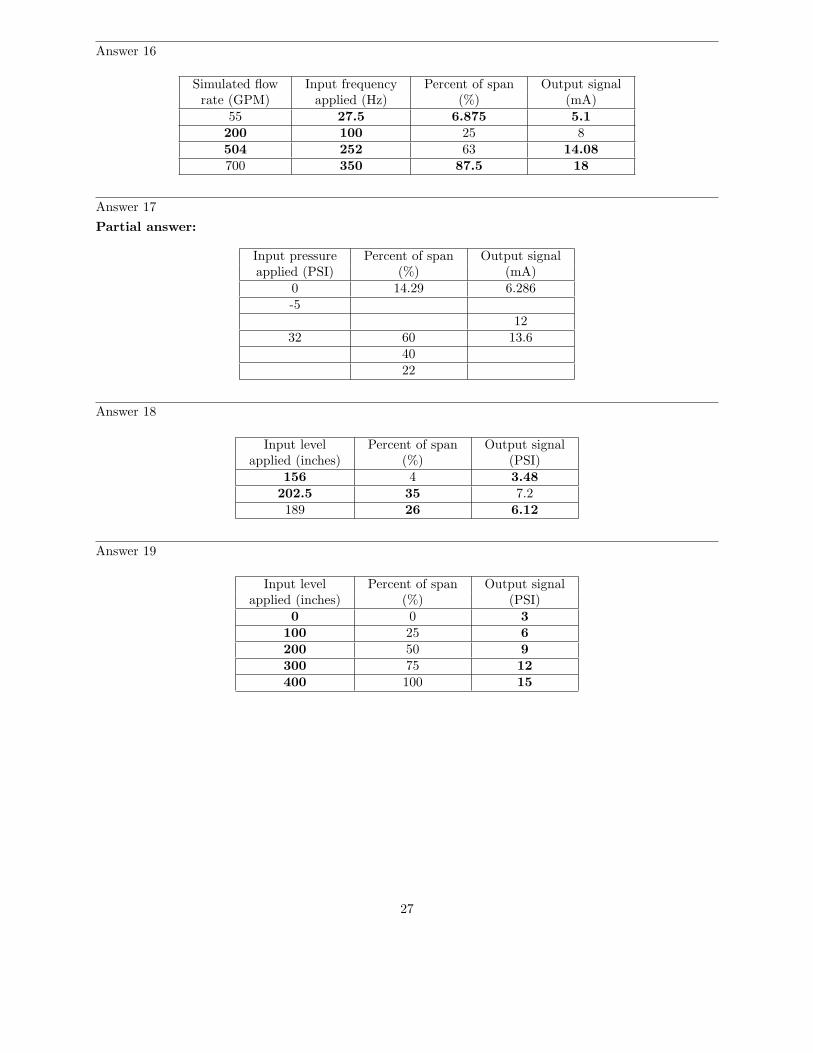
Answer 16
Simulated flow Input frequency Percent of span Output signalrate (GPM) applied (Hz) (%) (mA)
55 27.5 6.875 5.1200 100 25 8504 252 63 14.08700 350 87.5 18
Answer 17
Partial answer:
Input pressure Percent of span Output signalapplied (PSI) (%) (mA)
0 14.29 6.286-5
1232 60 13.6
4022
Answer 18
Input level Percent of span Output signalapplied (inches) (%) (PSI)
156 4 3.48202.5 35 7.2189 26 6.12
Answer 19
Input level Percent of span Output signalapplied (inches) (%) (PSI)
0 0 3100 25 6200 50 9300 75 12400 100 15
27

Answer 20
Measured level Percent of span Output signal(inches) (%) (mA)
47 20 7.244.38 12.5 666.25 75 1660 57.14 13.14
64.28 69.38 15.151.9 34 9.44
Answer 21
Input temp Percent of span Output signalapplied (deg F) (%) (mA)
50 0 487.5 25 8125 50 12
162.5 75 16200 100 20
Answer 22
Input temp Percent of span Output signalapplied (deg F) (%) (mA)
0 0 4375 25 8750 50 121125 75 161500 100 20
Answer 23
Measured temp Percent of span Output signal(oF) (%) (mA)120 86.96 17.91-45 15.22 6.43516.6 42 10.72-22.5 25 8-29.69 21.88 7.547.94 55.63 12.9
28

Answer 24
Partial answer:
Input signal Percent of input Percent of output Output signal(PSI) span (%) span (%) (PSI)
513 83.33 91.29 13.95
5030
803.27 2.25 15 4.8
712
Answer 25
Count = 180 (rounding low) or 181 (rounding high)
Answer 26
Partial answer:
DC input voltage Binary count Hex count Decimal count0.0 volts 000000001.0 volts 00110011 512.2 volts 01110000 70 1123.51 volts 10110011 B3 1794.0 volts 11001100 CC 2045.0 volts 11111111 FF
Answer 27
• The digital output (in hexadecimal) at 0.0 volts analog input = 000
• The digital output (in hexadecimal) at 5.0 volts analog input = FFF
• The digital output (in hexadecimal) at 2.1 volts analog input = 6B7 or 6B8
• The analog input corresponding to a digital output of 2D0 = 0.8791 volts
• The analog input corresponding to a digital output of F14 = 4.713 volts
Answer 28
• The digital output (in hexadecimal) at 0.0 volts analog input = 0000
• The digital output (in hexadecimal) at 10.0 volts analog input = FFFF
• The digital output (in hexadecimal) at 3.4 volts analog input = 5709 or 570A
• The analog input corresponding to a digital output of 3D6A = 2.399 volts
• The analog input corresponding to a digital output of C005 = 7.501 volts
29

Answer 29
Input voltage Percent of span Counts Counts(volts) (%) (decimal) (hexadecimal)
0 0 0 0002.5 25 1023 or 1024 3FF or 4005.0 50 2047 or 2048 7FF or 8007.5 75 3071 or 3072 BFF or C0010 100 4095 FFF
Answer 30
Calibration table for process variable signal (ADC)
Measurement Digital output0 GPM $0000
100 GPM $8000200 GPM $FFFF
Calibration table for output signal (DAC)
Measurement Digital output$0000 0 PSI$2666 9 PSI$3FFF 15 PSI
Answer 31
Input voltage Percent of span Counts Counts(volts) (%) (decimal) (hexadecimal)
0 0 0 00002.5 25 16383 or 16384 3FFF or 40005.0 50 32767 or 32768 7FFF or 80007.5 75 49151 or 49152 BFFF or C00010 100 65535 FFFF
Answer 32
Input pressure Percent of span Counts Counts(PSI) (%) (decimal) (hexadecimal)
0 0 0 00027 36 5897 or 5898 1709 or 170A
46.5 62 10157 or 10158 27AD or 27AE66.75 89 14580 or 14581 38F4 or 38F571.25 95 15563 or 15564 3CCB or 3CCC
Answer 33
This is a graded question – no answers or hints given!
30

Answer 34
Input level Percent of span Counts Counts(inches) (%) (decimal) (hexadecimal)
36.5 11 112 or 113 070 or 07162.0 28 286 or 287 11E or 11F102.5 55 562 or 563 232 or 233129.5 73 746 or 747 2EA or 2EB158.0 92 941 or 942 3AD or 3AE
Answer 35
Partial answer:
Input voltage Percent of span Counts Counts(volts) (%) (decimal) (hexadecimal)
1.6 32 1310 or 131173.8 302240 666
3.18 A2F
Answer 36
L Type DirectXD Scale 0 to 600 PSIOUT Scale 0 to 600 PSI
Note that the OUT Scale parameter is redundant in this application. So long as L Type is set to “Direct”the transmitter will report whatever its transducer senses, regardless of the OUT Scale parameters.
Answer 37
L Type Indirect Square RootXD Scale 0 to 135 inches WCOUT Scale 0 to 400 GPM
Answer 38
L Type IndirectXD Scale 0 to 1496.1 PSIOUT Scale 0 to 4700 pounds
Answer 39
L Type IndirectXD Scale 0 to 108 inches WCOUT Scale 0 to 18 feet
31

Answer 40
L Type IndirectXD Scale 0 to 180 inches WCOUT Scale 0 to 1178.1 cubic feet
Answer 41
Calculate the height reported by this transmitter when it senses a hydrostatic pressure of 71.8 inchesWC. Height = 3.2525 feet
Calculate the hydrostatic pressure sensed by this transmitter when it reports a liquid height of 9.3 feet.Pressure = 134.65 inches WC
32