Embed Size (px)
Citation preview

Instructor R. ZamoraInstructor R. Zamora
AP Environmental ScienceAP Environmental Science
Edinburg North High SchoolEdinburg North High School

Core Case StudyCore Case StudySouthern Sea Otters:
Are They Back From the Brink of Extinction?Historical abundance
and distribution: 1 million along NA Pacific Coast
Habitat: Kelp ForestsHabits: Use tools to
eat shellfish

By early 1900s, hunted to near extinctionBy early 1900s, hunted to near extinctionFurFurViewed as competitors for shellfishViewed as competitors for shellfish kelp forests disappearedkelp forests disappeared
Keystone speciesKeystone speciesDepredates herbivorous invertebrates (e.g., sea Depredates herbivorous invertebrates (e.g., sea
urchins)urchins) Maintains ecologically and economically important kelpsMaintains ecologically and economically important kelps
Recovery of otter populations Recovery of otter populations recovery of kelp forests and overall diversityrecovery of kelp forests and overall diversity upsets commercial and recreational shellfishersupsets commercial and recreational shellfishers
Focus of this chapter, Focus of this chapter, Population dynamicsPopulation dynamics – – study of how populations change in their study of how populations change in their distribution, numbers, age structure, and density.distribution, numbers, age structure, and density.

Focus QuestionsWhat are the major characteristics of
populations?How do populations respond to changes in
environmental conditions?How do species differ in their reproductive
patterns?

Population Dynamics and Carrying CapacityPopulation Distribution
Three patterns of distribution or dispersion: Clumping – most common Uniform – when there is intense competition for
resources Random – least common

Four reasons for clumping distributions Resources vary from place to place Living in groups provides protection against
predators Living in groups gives some predators a better
chance at getting food Mating or caring for young

Changes in Population Size: Entrances and ExitsPopulation size is influenced by:
Births Deaths Immigration Emigration
EmigrationDeathsnImmigratio Births Population in Change

Age structure: Young Populations Can Grow FastRate of population change depends on age structure
– proportion of individuals at various ages. Usually described by three main categories:
Pre-reproductive ages (juvenile or immature) Reproductive ages (adult) Post-reproductive (senescent)
Senescents
Adults
Immatures Growing
Pop.StablePop.
Decreasing Pop.

Limits on Population Growth: Biotic Potential vs. Environmental ResistanceNo pop. can grow indefinitely limits to growth
in nature (lesson from one of nature’s four sustainability principles)
Pops. vary in their biotic potential – capacity for growth. Intrinsic rate of increase (r) – rate at which a pop
would grow if it had unlimited resources. Populations with high r:
Reproduce early in life Have short generation times Can reproduce many times Have many offspring each time they reproduce
Example: House fly 5.6 x 10⁶ descendants in 13-moExample: Bacteria w. generation time of 20-min 0.3-
m deep layer over the earth in 36-h

There is a size limit to growth imposed by limiting factors. Limiting factors: water, light, living space,
nutrients, competition, predation, and disease.Environmental resistance – all factors that limit
growth of a pop Negative, or corrective feedback
Biotic potential and environmental resistance lead to carry capacity (K) – the maximum population size that a particular habitat can sustain indefinitely w/o degrading the habitat.

Exponential and Logistic Population Growth: J-curves and S-curvesWith ample resources a pop can grow rapidly,
but as resources become limited, its growth rate slows and levels off.
With few, or no limitations populations grow exponentially (exponential growth) at a fixed rate (e.g., 2%). N-t plot produces a J-shaped curve
Logistic growth involves rapid growth followed by a steady decline w/ time until pop size levels off. Decrease occurs as pop experiences environmental
resistance N-t plot produces a S-shaped (or sigmoid) curve

Figure 8-3. No population can continue to increase in size indefinitely.

Figure 8-4. Logistic growth of sheep after being introduced to the island of Tasmania

Brown tree snake Multiplied
exponentially Up to 5000 km-2
Venomous Caused more than
2000 power outages Caused the extinction
of 8 out of 11 of Guam’s forests birds.
Figure 8-5. Brown tree snake was accidentally introduced to Guam during WWII.
http://www.npswapa.org/gallery/album59/Brown_tree_snake_Boiga_irregularis_USGS_Photograph

What influence would a decline in population size of a keystone species have on community composition? Decrease in populations of species dependent on
the keystone species. Increase in species that move in to occupy part or
all of vacant niches.

Exceeding Carrying Capacity: Move, Change Habits, or Decline in SizeThe transition from
exponential growth to logistic growth may not be smooth. Occurs because of a
reproductive lag time. Dieback, or crash
ensues (Fig. 8-6)Figure 8-6. Exponential growth, overshoot, and population crash after introduction to St. Paul Island in Bearing Sea in 1910.

Carrying capacity if an area or volume is not fixed. Habitat may be degraded by the population that
exceeded K. Also, K varies temporally increasing or decreasing
seasonally or year to year. Weather Climate Other factors
K for a population man increase by developing adaptive traits through natural selection.
Population may migrate when K has been exceeded.
Humans are not exempt from population overshoot and dieback. Ireland, 1845, 1 million died, 3 million migrated Polynesians on Eater Island, pop crashed after using up
most of island trees Earth’s carrying capacity for humans has been extended
by technological, social, and cultural changes.

Population Density and Population Change: Effects of CrowdingPopulation density – the number of individuals in a
population found in a particular area or volume. Pop density can affect how rapidly it can grow or
decline. Some control factors are not affected by population
density.Density-dependent factors can control population
size increase as the density increases. Competition, predation, parasitism, and diseases (e.g.,
bubonic plague in the 14th century) Tend to regulate a pop at a fairly constant size, often
near KDensity independent factors control independently
of pop density. Mostly abiotic
Examples: freezes, floods, hurricanes, fire, pollution, and habitat destruction

Types of Population Change Curves in NatureFour general patterns:
Stable – size fluctuates slightly above and below K Characteristic of species in stable environments
Irruptive – explosive growth to a high peak and then crash. Characteristic of short-lived, rapidly reproducing species Linked to seasonal changes in weather and nutrient availability
Cyclic – regular cycles of increase and decrease Rise and fall of lemmings every 3-4 years Lynx and snowshoe hare, 10-yr
(Fig 8-7) Top-down pop regulation Bottom-up regulation
Irregular – no pattern in change of population size
Figure 8-7
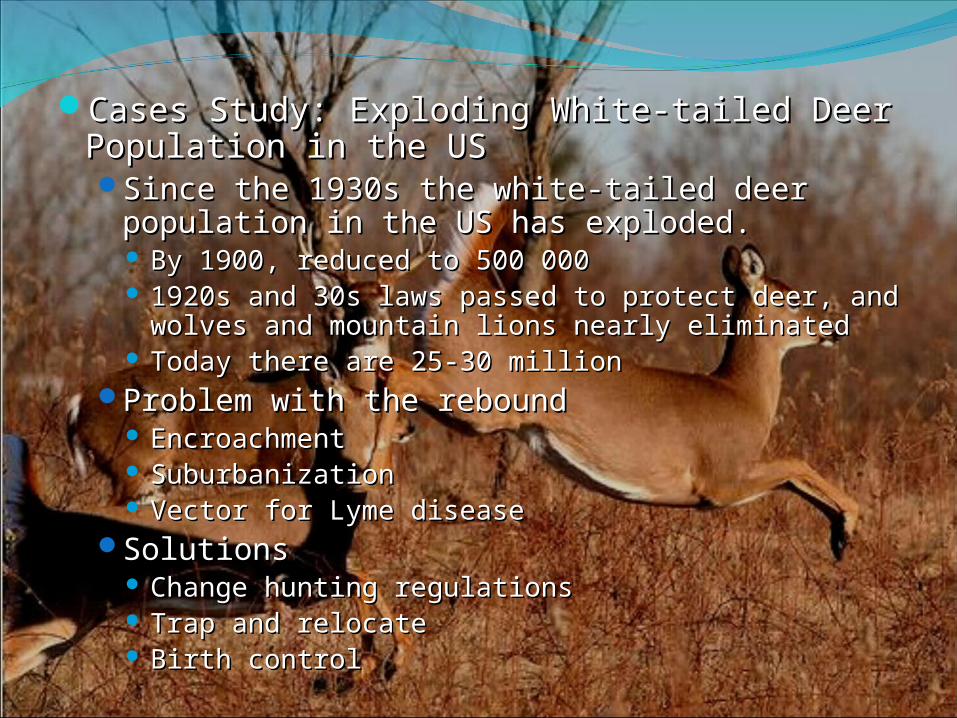
Cases Study: Exploding White-tailed Deer Cases Study: Exploding White-tailed Deer Population in the USPopulation in the USSince the 1930s the white-tailed deer Since the 1930s the white-tailed deer
population in the US has exploded.population in the US has exploded. By 1900, reduced to 500 000By 1900, reduced to 500 000 1920s and 30s laws passed to protect deer, and 1920s and 30s laws passed to protect deer, and
wolves and mountain lions nearly eliminatedwolves and mountain lions nearly eliminated Today there are 25-30 millionToday there are 25-30 million
Problem with the reboundProblem with the rebound EncroachmentEncroachment SuburbanizationSuburbanization Vector for Lyme diseaseVector for Lyme disease
SolutionsSolutions Change hunting regulationsChange hunting regulations Trap and relocateTrap and relocate Birth controlBirth control

Reproductive PatternsWays to reproduce: Sexual Partners Not
Always NeededAsexual Reproduction
Produces clones Common in taxa such as bacteria, plants and some
animals such as corals.Sexual Reproduction
Mixes genetic material of two parents producing offspring w/ genetic traits of each parent.

Disadvantages of sexual reproduction First, males don’t give
birth; female has to produce twice as many offspring to break even.
Second, increased change of genetic errors separation and recombination of chromosomes.
Third, courtship and mating is expensive (time and energy budgets), can cause disease, and injury may be inflicted in males that combat for mates.
Advantages Provides genetic diversity
in offspring Males of some species can
help raise young
Figure 8-8. Courtship display

Reproductive Patterns: Opportunists and CompetitorsSpecies differ in reproductive strategies to help ensure
survival.
(instead opportunists) (good competitors)

Most species have reproductive patterns between extreme r- and K- selected species.
Reproductive patterns may give a species a temporary advantage, but the ultimate population regulator is available habitat.
Figure 8-9. Positions of r-selected and K-selected species on the sigmoid population growth curve.

Survivorship CurvesA representation of age
structure that shows the percentage of members surviving at different ages (Fig. 8-11) There are three
generalized curves: late loss, early loss, and constant loss.
A life table shows projected life expectancy and probability of death for individuals at each age in a survivorship curve.
Figure 8-11. Survivorship curves for populations of different species.

The next chapter applies the principles of The next chapter applies the principles of population dynamics discussed in this chapter population dynamics discussed in this chapter to the growth of human population and its to the growth of human population and its environmental impact.environmental impact.
The principle of population dynamics are also The principle of population dynamics are also used to help us harvest fish and wildlife used to help us harvest fish and wildlife resources more sustainably.resources more sustainably.
The problems to be faced are vast and complex, but come down to The problems to be faced are vast and complex, but come down to this: 6.7 billion people are breeding exponentially. The process of this: 6.7 billion people are breeding exponentially. The process of fulfilling their wants and needs is stripping earth of its biotic fulfilling their wants and needs is stripping earth of its biotic capacity to support life; a climactic burst of consumption by a single capacity to support life; a climactic burst of consumption by a single species is overwhelming the skies, earth, waters, and fauna.species is overwhelming the skies, earth, waters, and fauna.
-Paul Hawken-Paul Hawken
Figure 9-1. Crowded Figure 9-1. Crowded street in China.street in China.