Embed Size (px)
Citation preview

Instructions for use
Title RELATIONSHIP BETWEEN RESPIRATION RATE AND BODY SIZE IN MARINE PLANKTON ANIMALS AS AFUNCTION OF THE TEMPERATURE OF HABITAT
Author(s) IKEDA, Tsutomu
Citation 北海道大學水産學部研究彙報 = BULLETIN OF THE FACULTY OF FISHERIES HOKKAIDO UNIVERSITY,21(2): 91-112
Issue Date 1970-08
Doc URL http://hdl.handle.net/2115/23417
Type bulletin
File Information 21(2)_P91-112.pdf
Hokkaido University Collection of Scholarly and Academic Papers : HUSCAP
RELATIONSIDP BETWEEN RESPIRATION RATE AND BODY
SIZE IN MARINE PLANKTON ANIMALS AS A FUNCTION OF
THE TEMPERATURE OF HABITAT
Tsutomu IKEDA *
It is generally known that the rate of oxygen consumption (metabolic rate) per unit body weight of animals increases with the decrease in body size of the animals. This concept was initiated from the finding of the "surface law" by Sarrus & Rameaux (1839), and many studies on this problem have been done on mammals and birds ever since (refer to the reviews of Krogh, 1916; Benedict, 1938; Kleiber, 1947; Prosser, 1961a). A detailed study on this subject (Kleiber, 1947) has shown that the metabolic rate is proportional to a given power function of body weight rather than to body surface. Weymouth et al. (1944) showed that this relation-, ship is also applicable to poikilothermal animals according to experiments on a kelp crab, Pugettia producta. Zeuthen (1947), working on the marine micro-fauna, found a similar relationship. The review of Zeuthen (1953) extended this concept to organisms from bacteria to large mammals.
In regard to plankton animals, Raymont & Gauld (1951) first suggested that the rate of oxygen consumption in copepods is proportional to their body surface. This was confirmed by Gauld & Raymont (1953), Raymont (1959), Conover (1959) and Berner (1962). Conover (1960), working on copepods, amphipods and euphausiids, and Rajagopal (1962), working on a hydromedusa, ctenophores, copepods, decapods and a tunicate, stated that the log respiration is well correlated to the log dry body weight of animals. Recently this relationship was reported on copepods by Haq (1967) and Comita (1968), and on euphausiids by Small, Hebard & McIntire (1966), Small & Hebard (1967), Paranjape (1967) and Pearcy et al. (1969).
The present investigation was made in an attempt to obtain the relationship between the rate of oxygen consumption (respiration) and the body size (weight) in various marine plankton animal groups from three different areas, boreal, temperate and tropical seas.
Before going further, the author wishes to express his sincere thanks to Prof. S. Motoda, Faculty of Fisheries, Hokkaido University, for his continuing guidance and encouragement. Thanks are also due to Assoc. Prof. T. Kawamura and Dr. T. Minoda, Faculty of Fisheries, Hokkaido University, for their generosity in giving many valuable suggestions during the work. The author is especially grateful to Prof. T. Tsujita and Assoc. Prof. S. Nishizawa, Faculty of Fisheries, Hokkaido
* Lahoratory of Planktology, Faculty of Fisheries, H.0kkaido University (':[tmii#l~71<~~$~'lIif§:.!f9jJ~.~)
-91-
Bull. Fac. Fi8h., Hokkaido Univ. [XXI, 2
University, for their critical reading of the manuscript.
Methods and materials
Animals: Sampling of animals and experiments were carried out on board the "Oshoro Maru" during Cruise 30 to the Tropical Pacific Ocean and the Gulf of Carpentaria, November 1968-January 1969 (tropical species), Cruise 32 to the Bering Sea, June-August 1969 (boreal species), Cruise 33 to the Southeast of
~ " '. Boreal species ~"'" "~.i
)r··"···Temperate. fi{ro' water species
1)
fl ... .... . ~ ..... ., A !: \.. Tropical species V(i.-~~~ ~. ----~ '~~ ... ~,
••••• _. } • 'It.
40
20
o
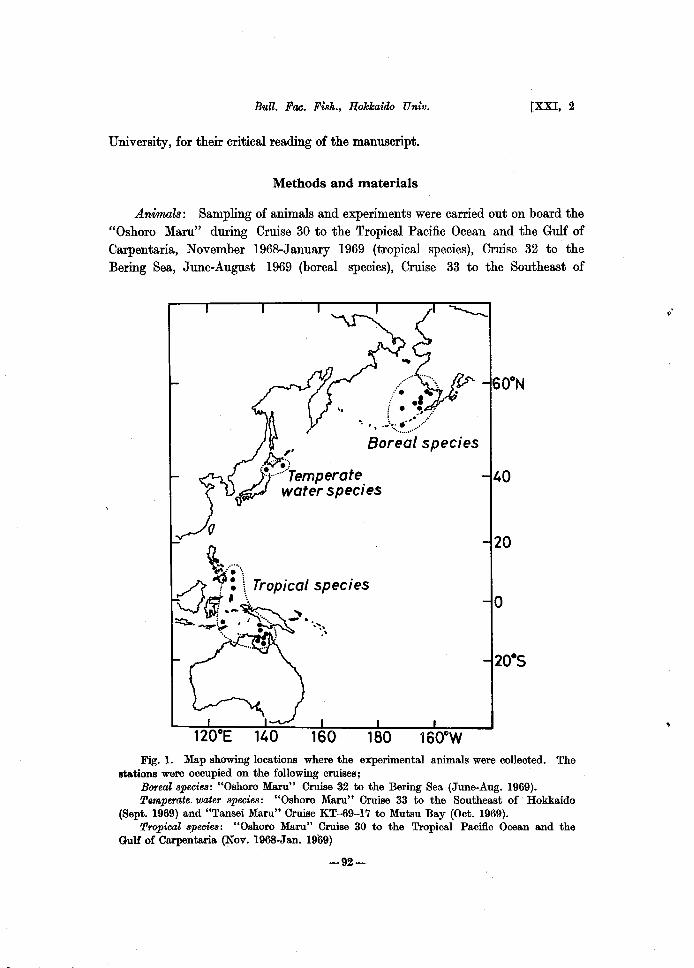
Fig. 1. Map showing locations where the experimental animals were collected. The stations were occupied on the following cruises;
Boreal species: "Oshoro Maru" Cruise 32 to the Bering Sea (June-Aug. 1969). T,mperate. water 8pecie8: "Oshoro Maru" Cruise 33 to the Southeast of' Hokkaido
(Sept. 1969) and "Tansei Maru" Cruise KT-69-17 to Mutsu Bay (Oct. 1969). TropiaaZ 8pecies: "Oshoro Maru" Cruise 30 to the Tropical Pacific Ocean and the
Gulf of Carpentaria (Nov. 1968-Jan. 1969)
-92-
1970] T. IKEDA: Respiration in zooplankton
Hokkaido, September 1969 (temperate water species). An additional work was done on Cruise KT-69-17 of the "Tansei Maru" to Mutsu Bay, October 1969 (temperate water species) (Fig. 1).
The animals were collected with a specially designed tow net (Ikeda, 1970). The net was gently towed for a few minutes in the surface layer (about 0-10 m) by the slow wind shift of the drifting ship so as to avoid doing damage to the animals caught. The samples were sorted in the ship's laboratory through the use of a large bore pipette (0.8 mm in dia.), and transferred to 1 I glass bottles filled with surface sea water. The glass bottles were put in a wooden water tank and the animals were maintained in darkness. Fresh surface sea water was continuously circulating through the tank. Mter 1-2 days, the animals were subjected to the measurements described below. A total of 77 species for all four cruises, covering almost all systematic marine zooplankton groups, were used for experimentation (Table 1).
Table 1. Systematic list of the plankton animals experimented
Boreal species (23 species) Coelenterata
* Sarsia mirabilis L. AGASSIZ Aglantha digitale (MOLLER)
Ctenophora * Hormiphora palmata CHUN
Pteropoda * Clione limaoina lim.acina (PHIPPS)
Limaoina helicina helicina (PHIPPS) Polychaeta
* Tomopteris (Tomopteris) septentrionalis STEENSTRUP
Copepoda CaZanus cristatus KROYER, V Calanus plumchrus MARUKA W A, V CaZanus glaciaZis YASHNOV, IV V EU(}/1,lanus bungii bungii JOHNSON, 9 Pseuaowlanus elongatus (BOECK), 9 ~
* Pareuchaeta japonioo (MARUKA W A), 9 * Candada co1Jumbiae CAMPBELL, 9 * Tortanus discaudatus
(THOMPSON & SCOTT), 9 ~ Amphipoda
* Hyperiagalba(MONTAGU), 9 ~ * Hyperia sp., 9 * Euthemisto libellula (MANDT), 9 ~
Euphausiacea Thysanoessa raschii (M. SARS)
HANSEN, 9 ~ Thysanoessa inermis (KROYER)
HANSEN, juv., 9 Decapoda
* Penaeu8 sp.
Brachyuran zoea larva Chaetognatha . * Sagitta elegans VERRILL
Pisces * Eumicrotremu8 orbis orbis
. (GONTHER), juv. Temperate water species (13 species)
Cephalopoda * ldiosepius (Idiosepion)
pygmaeus paradoxu8 (ORTMANN) Copepoda
Calanus padfi(;U8 BRODSKY, ~ Mysidacea
Hypererythrops sp. Cumacea
Diastylis sp., 9 Isopoda
Aega sp. Amphipoda
* Hyperia sp., 9 ~ * Hyperia sp., juv.
Euphausiacea Euphausia paoifioo HANSEN, 9 ~
Decapoda * Lucifer typU8 H. MILNE EDWARDS,
9~ * Leptochela graoilis STIMPSON, juv. * Crangon aJfinis DE HAAN, juv.
Brachyuran megalopa larva Brachyuran zoea larva
Tropical species (41 species) Heteropoda
* Firoloida desmaresti LESUEUR
-93-
Bull. Fae. Fish., Hokkaido Univ. [XXI, 2
Table 1. Continued
Pteropoda Oreseis aciC'Ula clava RANG
* Hydromyles globulosa (RANG) * Clione sp.
Cephalopoda * Octopus
Polychaeta * Lepidasthenia grimaldi (MARENZELLER)
Trochophora larva Ostracoda
Oypridina hilgendorfii G. W. MOLLER Pyrocypris sp.
Copepoda Oalanus gracili8 (DANA), !? Oalanus vulgaris (DANA), !? Eucalanu8 crassus GIES BRECHT, !? Eucalanus monachus GIESBRECHT, !? Eucalanu8 mucronatus GIESBRECHT, Ii!
* EuchireZla amoena GIESBRECHT, Ii! * Euchaeta marina (PRESTANDREA), !? * Euchaeta plana MORI, 6 * Oandacia aethiopica DANA, Ii! * Labidocera aeuta (DANA), Ii! 6 * Labidocera detruncata (DANA), Ii! * Labidocera sp., Ii!
Acartia spinicauda GIESBRECHT, Ii! * Sa;pphirina gemma DANA, 6
Cumacea
Iphinoe sp., Ii! Iphirwe sp., juv.
Amphipoda * Orchomene sp. * Synopia ultramarina DANA, Ii! (?) * Phronima sp. * Brachyscelu8 latipes STEBBING, !?
Euphausiacea * Euphausia mutica HANSEN, 6
Decapoda * Lysmata sp.
Macruran post mysis larva Macruran mysis larva Brachyuran megalopa larva Brachyuran zoea larva
Chaetognatha * Sagitta enflata GRASSI * Sagitta robusta DONCASTER
Thaliacea Thalia democratica (FORSKAL),
solitary salpa Thalia democratica (FORSKAL),
chain salpa Pisces
* Trachurus japonicus (TEMMINCK & SCHLEGEL), juv.
* Upeneus sp., juv. * Ohelidonichthys sp., juv.
* regarded as carnivores indicated by preceding authors or by direct observation of feeding by the present author
Respiration rate: The procedure of the water bottle method was the same as the one used by Ikeda (1970). On small animals several individuals closely matching in size were used in a single bottle. Oannibalism was frequently observed on some tropical carnivorous species when placed in a crowded entourage. To prevent this, the number of animals in an experimental bottle was kept small and when cannibalism occurred during the incubation the results were discarded.
It is known that the respiration of marine animals is markedly lowered if the oxygen concentration in the medium water decreases below a certain level. Critical concentration is higher in active animals than in inert animals. Data on· marine animals indicate that critical oxygen concentration is about 50% saturation, though it differs with species fairly (Hall, 1929; Marshall et al., 1935; Weymouth et al., 1944; Zeuthen, 1947; Fry, 1957; Nicol, 1960; Wolvekamp & Waterman, 1960; Prosser, 196180; Miyauchi & Irie, 1966; Nimura & Inoue, 1969). In the present experiments the duration of incubation was adjusted so as the oxygen concentration at the end of incubation was kept above 70% saturation. Usually 24 hours' incubation for boreal species and 12 hours' incubation for temperate and tropical species with adequate density of animals were chosen.
-94-
.,
1970]
3.5
3.0 .......
~.c 0' 2.5 ~o .Q.§ '§ § 2.0 ._, Q.N UlO
&.3 1.5
T. IKEDA: Respiration in zOQplankton
__ e _e-___ .--
2 3 4 5 6 7 8 9 Time after capture( days)
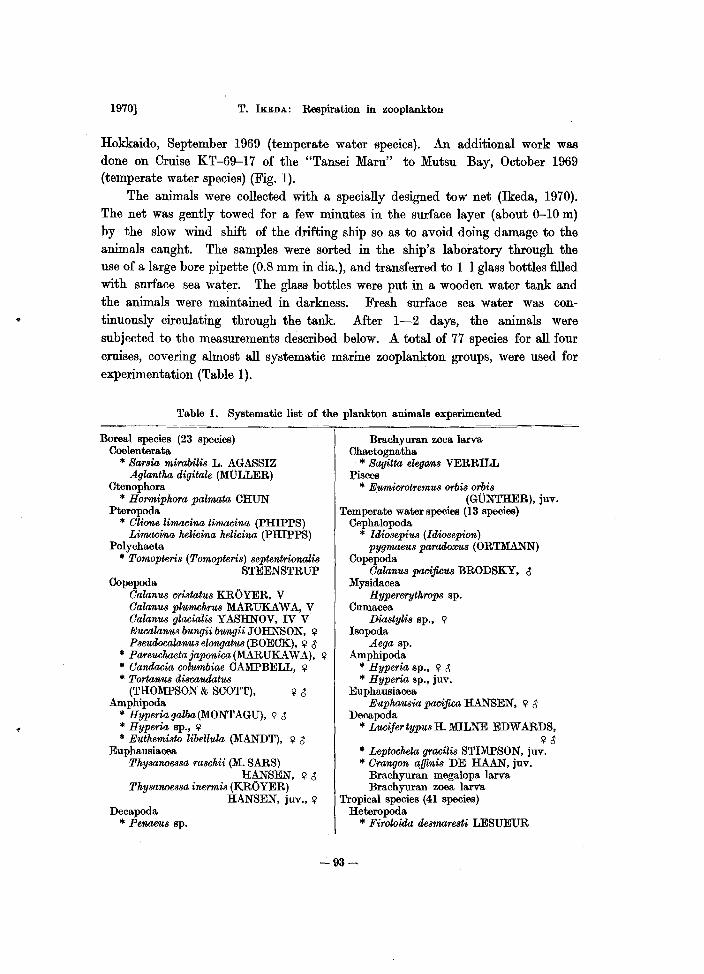
Fig. 2. Changes in respiration rate of Oalanus cristatus (stage V) and Thysanoe8sa inermis (female) in experimental jars at temperatures of 9.7-12.2°C during 9 days after capture from the sea. The animals were collected at 55°01'N 165°28'W, July 22, 1969
It is a common experience among workers that animals show an abnormally high respiration rate just after capture from the sea (Marshall et al., 1935; Conover, 1956; Berner, 1962). Fig. 2 shows observed variations in respiration rate in Calanus cristatus (stage V) and Thysanoessa inermis (female) during the course from just after the capture till the end of a 9-day culture period. The rates obtained by incubation immediately after capture were nearly two times as high as those obtained after several days of successive incubation. In the present experiments the respiration rate was measured on the animals kept in darkness for 1-2 days after their capture.
The effect of nutritional conditions on the respiration rate in various plankton animals is little known. An experiment on C. cristatus (Ikeda, 1970) showed that the rate was not lowered by starving the animals for at least one week.
Table 2. Experiments on the effect of an antibiotic (dihydrostreptomycin sulfate, 50 mg/i) on the respiration rate of OalamJ,8 plumchrus at 9.7-1O.5°C. The animals were collected at 56°13'N 162°35'W, July 25, 1969
No. and stage pJ 02/animaI;hr pJ O./mg dry wt./hr
---------------------~------------j~----------~--------------
No antibiotic added
Antibiotic added
6, stage V 6, stage V 6, stage V 6, stage V
-95-
0.74 0.66 0.65 0.56
0.87 0.91 0.69 0.66
BuU. Fac. Fisk., HokkaiOO Univ. [XXI, 2
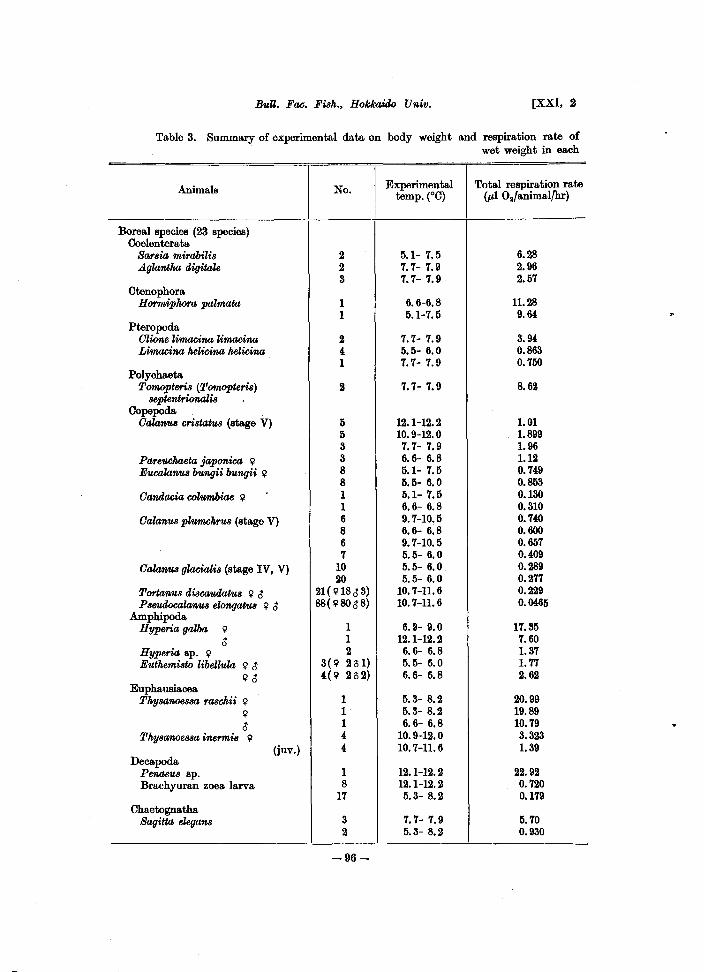
Table 3. Summary of experimental data on body weight and respiration rate of wet weight in each
Animals No. Experimental Total respiration rate temp. (OC) (pI Ozfanimal/hr)
Boreal species (23 species) Coelenterata
Sar8ia mirabilis 2 5.1- 7.5 6.28 Aglantka digitale 2 7.7- 7.9 2.96
3 7.7- 7.9 2.57 Ctenophora
Hormiphora palmata 1 6.6-6.8 11.28 1 5.1-7.5 9.64
Pteropoda Olione limacina limacina 2 7.7- 7.9 3.94 Limacina helicina helieina 4 5.5- 6.0 0.863
1 7.7- 7.9 0.750 Polychaeta
Tomopteris (Tomopteri8) 2 7.7- 7.9 8.62 septentrionalis
Copepoda Oalanus eri8tatu8 (stage V) 5 12.1-12.2 1.01
5 10.9-12.0 1.899 3 7.7- 7.9 1. 96
Pareuckaeta japonica 9 3 6.6- 6.8 1.12 Eucalanus bungii bungii 9 8 5.1- 7.5 0.749
8 5.5- 6.0 0.853 Oandacia oolumbiae 9 1 5.1- 7.5 0.130
1 6.6- 6.8 0.310 Oalanus plumckr'Us (stage V) 6 9.7-10.5 0.740
8 6.6- 6.8 0.600 6 9.7-10.5 0.657 7 5.5- 6.0 0.409
Oalanus glacialis (stage IV, V) 10 5.5- 6.0 0.289 20 5.5- 6.0 0.277
Tortanus discaudatus 9 0 21(918 0 3) 10.7-11.6 0.229 P8eudocalanus elongatUB 9 0 88(980 0 8) 10.7-11.6 0.0465
Aropbipoda Hyperia galba 9 1 6.9- 9.0 17.35
0 1 12.1-12.2 7.60 Hyperia sp. 9 2 6.6- 6.8 1. 37 Euthemisto libellula 9 0 3(9 2(1) 5.5- 6.0 1.77
1i10 4(9 2(2) 6.6- 6.8 2.62 Euphausiacea
Tkyaanoesaa rasehU 9 1 5.3- 8.2 20.99 9 1 5.3- 8.2 19.89 0 1 6.6- 6.8 10.79
Thyaanoes8a inermi8 9 4 10.9-12.0 3.323
Decapoda (juv.) 4 10.7-11.6 1.39
Penaeu8 Bp. 1 12.1-12.2 22.92 Brachyuran zoea larva 8 12.1-12.2 0.720
17 5.3- 8.2 0.179 Chaetognatha
Sagitta elegans 3 7.7- 7.9 5.70 2 5.3- 8.2 0.930
-96-
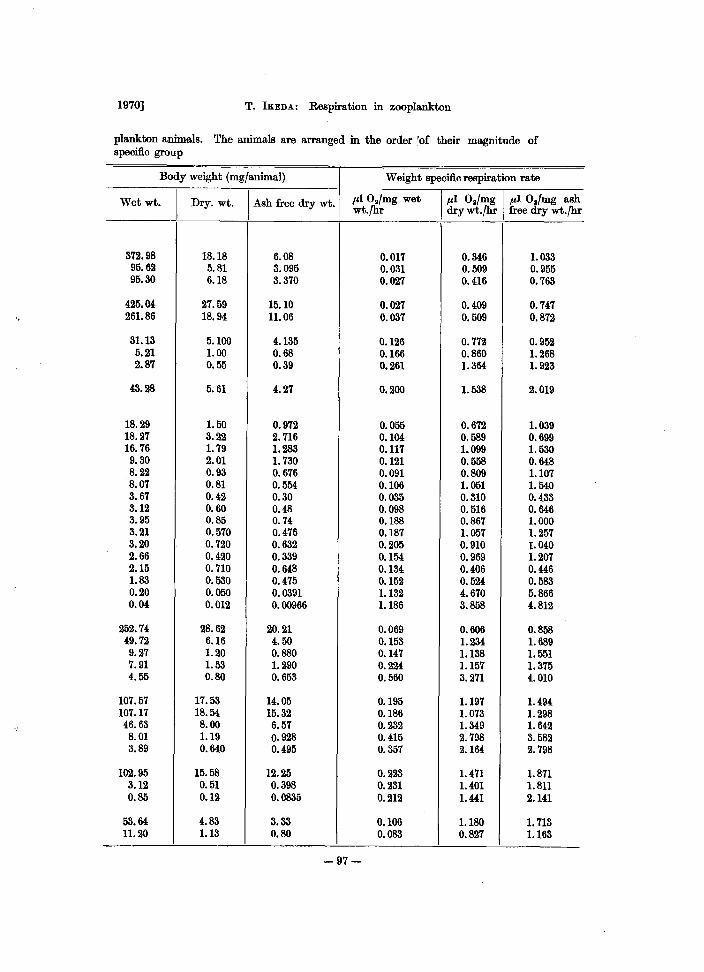
1970] T. IKEDA: Respiration in zooplankton
plankton animals. The animals are arranged in the order 'of their magnitude of specific group
Body weight (mg/animal) Weight specific respiration rate
Wetwt. I
Dry. wt. I Ash free dry wt. .a1 O./mg wet 1.a1 O./mg 1.a1 O.!mg ash wt·fhr dry wt.fhr free dry wt.fhr
372.98 18.18 6.08 0.017 0.346 1.033 95.62 5.81 3.095 0.031 0.509 0.955 95.30 6.18 3.370 0.027 0.416 0.763
425.04 27.59 15.10 0.027 0.409 0.747 261.86 18.94 11.06 0.037 0.509 0.872
31.13 5.100 4.135 0.126 0.772 0.952 5.21 1.00 0.68 0.166 0.860 1.268 2.87 0.55 0.39 0.261 1.364 1. 923
43.28 5.61 4.27 0.200 1.538 2.019
18.29 1.50 0.972 0.055 0.672 1.039 18.27 3.22 2.716 0.104 0.589 0.699 16.76 1. 79 1.283 0.117 1.099 1. 530 9.30 2.01 1. 730 0.121 0.558 0.648 8.22 0.93 0.676 0.091 0.809 1.107 8.07 0.81 0.554 0.106 1.051 1.540 3.67 0.42 0.30 0.035 0.310 0.433 3.12 0.60 0.48 0.098 0.516 0.646 3.95 0.85 0.74 0.188 0.867 1.000 3.21 0.570 0.476 0.187 1. 057 1.257 3.20 0.720 0.632 0.205 0.910 1.040 2.66 0.420 0.339 0.154 0.969 1.207 2.15 0.710 0.648 0.134 0.406 0.446 1.83 0.530 0.475 0.152 0.524 0.583 0.20 0.050 0.0391 1.132 4.670 5.866 0.04 0.012 0.00966 1.186 3.858 4.812
252.74 28.62 20.21 0.069 0.606 0.858 49.72 6.16 4.50 0.153 1.234 1. 689 9.27 1.20 0.880 0.147 1.138 1.551 7.91 1.53 1.290 0.224 1.157 1.375 4.55 0.80 0.653 0.560 3.271 4.010
107.57 17.53 14.05 0.195 1.197 1.494 107.17 18.54 15.32 0.186 1.073 1.298 46.63 8.00 6.57 0.232 1.349 1. 642 8.01 1.19 0.928 0.415 2.798 3.582 3.89 0.640 0.495 0.357 2.164 2.798
102.95 15.58 12.25 0.223 1.471 1.871 3.12 0.51 0.398 0.231 1.401 1.811 0.85 0.12 0.0835 0.212 1.441 2.141
53.64 4.83 3.33 0.106 1.180 1. 713 11.20 1.13 0.80 0.083 0.827 1.163
-97-
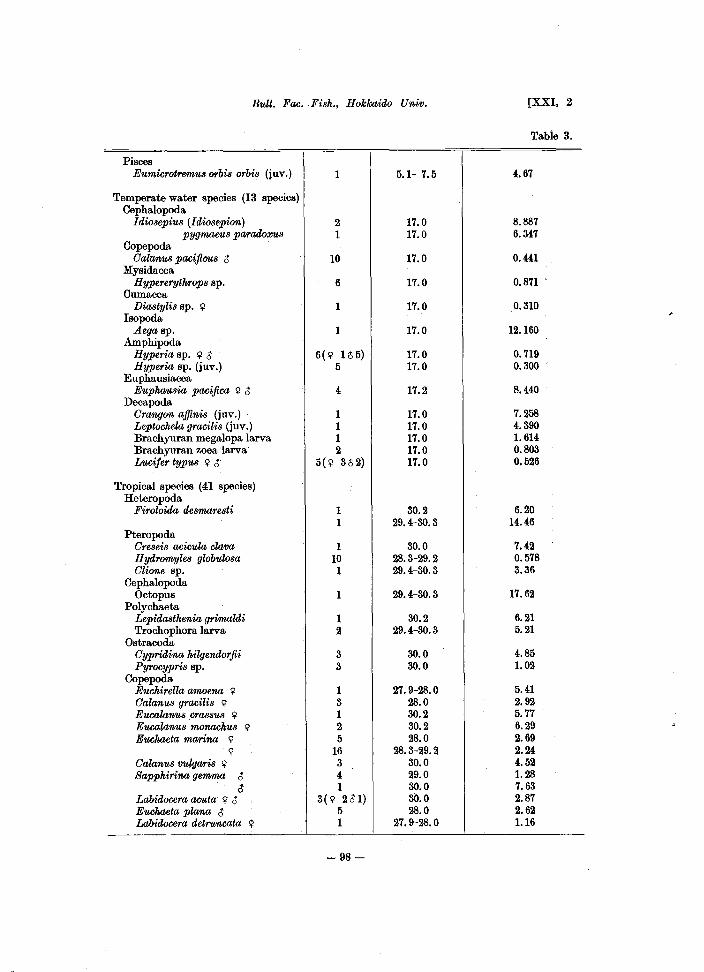
Bull. Fao.Fish., Hokkaido Univ.
Pisces Eumicrotremus orbis orbis (juv.)
Temperate water species (13 species) Cephalopoda
Idiosepius (1 diosepioo) pygmaeus paradoX'UB
Copepoda Oalu,'l/,UB pacijicus 6
Mysidacea Hypererythrops sp.
Cumacea Diastylis sp. ~
Isopoda Aegasp.
Amphipoda Hyperia sp. ~ 6 Hyperia sp. (juv.)
Euphausiacea Euphausia paoifica ~ 6
Decapoda Orangon affinis (iuv.) Leptochela graoilis (iuv.) Brachyuran megalopa larva Brachyuran zoea larva Lucifer typus ~ 6
Tropical species (41 species) Heteropoda
Firoloida desmaresti
Pteropoda Oreseis acicula clava Hydromyles globulosa Olione sp.
Cephalopoda Octopus
Polychaeta Lepidasthenia grimaldi Trochophoralarva
Ostracoda Oypridina hilgeooorfii Pyrocypris sp.
Copepoda Euchirella amoena ~ Oalanus gracili8 ~ Eucalanu8 crasSU8 ~ Eucalanu8 monachus ~ Euchaeta marina ~
~ Oalanus vulgaris ~ Sapphirina gemma 6
6 Labidoeera aouta ~ 6 Euehaeta plana 6 Labidoeera detruncata ~
1
2 1
10
6
1
1
6(~ 1(5) 5
4
1 1 1 2
5(~ 3(2)
1 1
1 10 1
1
1 2
3 3
1 3 1 2 5
16 3 4 1
3(~ 261) 5 1
-98-
5.1- 7.5
17.0 17.0
17.0
17.0
17.0
17.0
17.0 17.0
17.2
17.0 17.0 17.0 17.0 17.0
30.2 29.4-30.3
30.0 28.3-29.2 29.4-30.3
29.4-30.3
30.2 29.4-30.3
30.0 30.0
27.9-28.0 28.0 30.2 30.2 28.0
28.3-29.2 30.0 29.0 30.0 30.0 28.0
27.9-28.0
[XXI, 2
Table 3.
4.67
8.887 6.347
0.441
0.871
0.310
12.160
0.719 0.300
8.440
7.258 4.390 1. 614 0.803 0.526
6.20 14.46
7.42 0.578 3.36
17.62
6.21 5.21
4.85 1.02
5.41 2.92 5.77 6.29 2.69 2.24 4.52 1.28 7.63 2.87 2.62 1.16
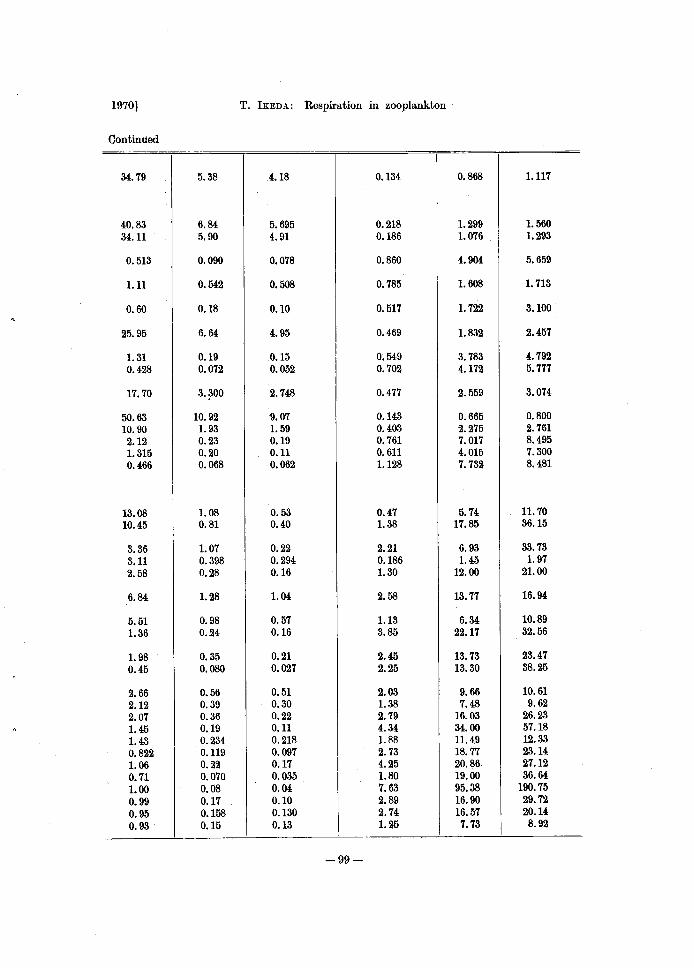
1970] T. IKEDA: Respiration in zooplankton·
Continued
34.79 5.38 4.18 0.134 0.868 1.117
40.83 6.84 5.695 0.218 1.299 1.560 34.11 5.90 4.91 0.186 1.076 1.293
0.513 0.090 0.078 0.860 4.904 5.659
1.11 0.542 0.508 0.785 1.608 1. 713
0.60 0.18 0.10 0.517 1. 722 3.100
25.95 6.64 4.95 0.469 1.832 2.457
1. 31 0.19 0.15 0.549 3.783 4.792 0.428 0.072 0.052 0.702 4.172 5.777
17.70 3.~00 2.748 0.477 2.559 3.074
50.63 10.92 9.07 0.143 0.665 0.800 10.90 1. 93 1. 59 0.403 2.275 2.761 2.12 0.23 0.19 0.761 7.017 8.495 1.315 0.20 0.11 0.611 4.015 7.300 0.466 0.068 0.062 1.128 7.732 8.481
13.08 1. 08 0.53 0.47 5.74 11.70 10.45 0.81 0.40 1.38 17.85 36.15
3.36 1.07 0.22 2.21 6.93 33.73 3.11 0.398 0.294 0.186 1.45 1. 97 2.58 0.28 0.16 1.30 12.00 21.00
6.84 1.28 1. 04 2.58 13.77 16.94
5.51 0.98 0.57 1.13 6.34 10.89 1.36 0.24 0.16 3.85 22.17 32.56
1. 98 0.35 0.21 2.45 13.73 23.47 0.45 0.080 0.027 2.25 13.30 38.25
2.66 0.56 0.51 2.03 9.66 10.61 2.12 0.39 0.30 1.38 7.48 9.62 2.07 0.36 0.22 2.79 16.03 26.23 1.45 0.19 0.11 4.34 34.00 57.18 1.43 0.234 0.218 1. 88 11.49 12.33 0.822 0.119 0.097 2.73 18.77 23.14 1.06 0.22 0.17 4.25 20.86 27.12 0.71 0.070 0.035 1.80 19.00 36.64 1.00 0.08 0.04 7~63 95.38 190.75 0.99 0.17 0.10 2.89 16.90 29.72 0.95 0.158 0.130 2.74 16.57 20.14 0.93 0.15 0.13 1.25 7.73 8.92
-99-
Bull. Fac. Fish., Hokkaido Univ.
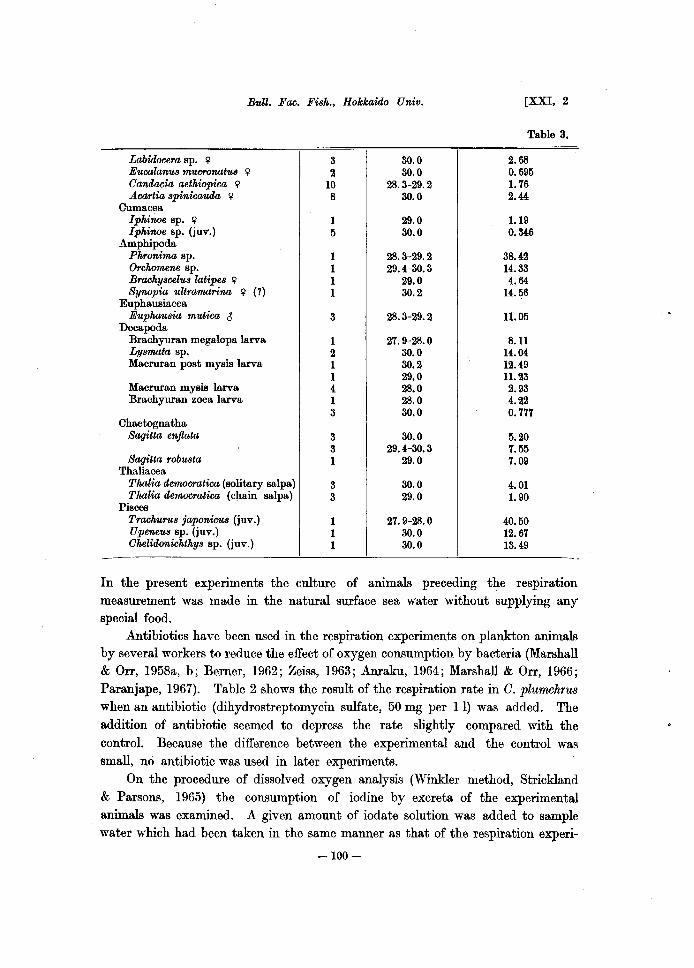
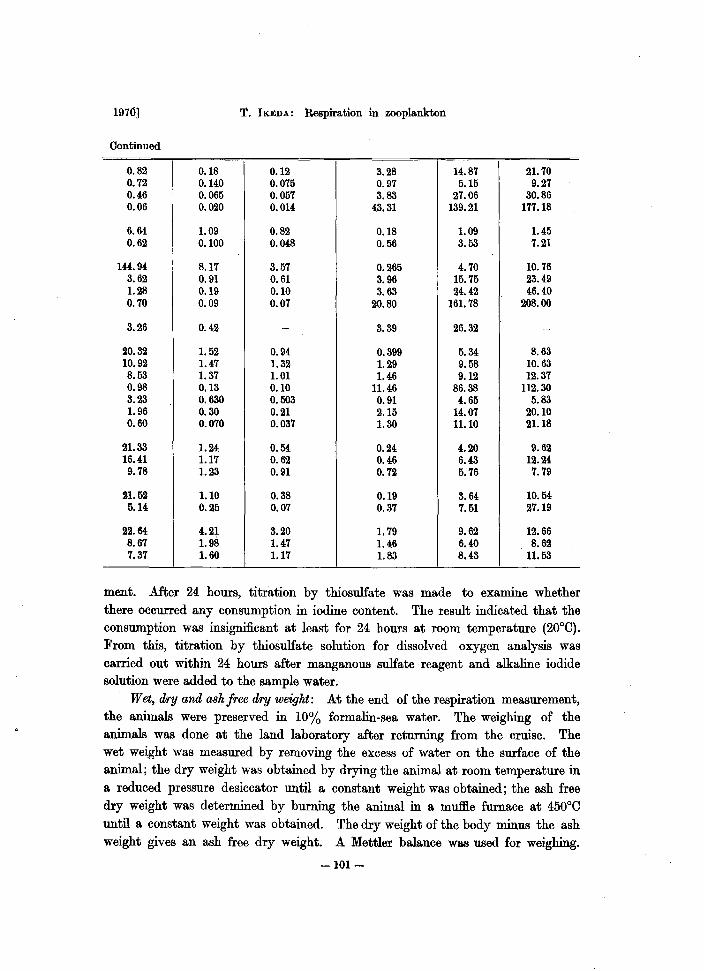
Labidocera Bp. !j! 3 30.0 Eucalanus mUcronatu8 !j! 2 30.0 Candacia aethiopica !j! 10 28.3-29.2 Acartia 8pinicauda !j! 8 30.0
Cumacea Iphinoe Bp. !j! 1 29.0 Iphinoe Bp. (juv.) 5 30.0
Amphipoda Phronima Bp. 1 28.3-29.2 Orcoomene Bp. 1 29.4-30.3 Brachyscelus latipes !j! 1 29.0 Synopia ultramarina !j! (1) 1 30.2
EuphauBiacea Euphau8ia mutica 6 3 28.3-29.2
Decapoda Brachyuran megalopa larva 1 27.9-28.0 Ly8mata Bp. 2 30.0 Macmran POBt mYBiB larva 1 30.2
1 29.0 Macruran mYBis larva 4 28.0 Brachyuran zoea larva 1 28.0
3 30.0 Chaetognatha
Sagitta enflata 3 30.0 3 29.4-30.3
Sagitta robusta 1 29.0 Thaliacea
Thalia democratica (solitary salpa) 3 30.0 Thalia democratica (chain salpa) 3 29.0
Pisces Trachuru8 japonwus (juv.) 1 27.9-28.0 Upeneu8 sp. (juv.) 1 30.0 ChelirlonichthY8 sp. (iuv.) 1 30.0
[XXI, 2
Table 3.
2.68 0.695 1. 76 2.44
1.19 0.346
38.42 14.33 4.64
14.56
11.05
8.11 14.04 12.49 11.23 2.93 4.22 0.777
5.20 7.55 7.09
4.01 1. 90
40.50 12.67 13.49
In the present experiments the culture of animals preceding the respiration measurement was made in the natural surface sea water without supplying any special food.
Antibiotics have been used in the respiration experiments on plankton animals by several workers to reduce the effect of oxygen consumption by bacteria (Marshall & Orr, 1958a, b; Berner, 1962; Zeiss, 1963; Anraku, 1964; Marshall & Orr, 1966; Paranjape, 1967). Table 2 shows the result of the respiration rate in C. plumchrus when an antibiotic (dihydrostreptomycin sulfate, 50 mg per 11) was added. The addition of antibiotic seemed to depress the rate slightly compared with the control. Because the difference between the experimental and the control was small, no antibiotic was used in later experiments.
On the procedure of dissolved oxygen analysis (Winkler method, Strickland & Parsons, 1965) the consumption of iodine by excreta of the experimental animals was examined. A given amount of iodate solution was added to sample water which had been taken in the same manner as that of the respiration experi-
-100-
1970] T. IKEDA: Respiration in zooplankton
Continued.
0.82 0.18 0.12 3.28 14.87 21. 70 0.72 0.140 0.075 0.97 5.15 9.27 0.46 0.065 0.057 3.83 27.06 30.86 0.06 0.020 0.014 43.31 139.21 177.18
6.64 1.09 0.82 0.18 1.09 1.45 0.62 0.100 0.048 0.56 3.53 7.21
144.94 8.17 3.57 0.265 4.70 10.76 3.62 0.91 0.61 3.96 15.75 23.49 1.28 0.19 0.10 3.63 24.42 46.40 0.70 0.09 0.07 20.80 161. 78 208.00
3.26 0.42 - 3.39 26.32 -
20.32 1. 52 0.94 0.399 5.34 8.63 10.92 1.47 1.32 1.29 9.58 10.63 8.53 1.37 1.01 1.46 9.12 12.37 0.98 0.13 0.10 11.46 86.38 112.30 3.23 0.630 0.503 0.91 4.65 5.83 1. 96 0.30 0.21 2.15 14.07 20.10 0.60 0.070 0.037 1.30 11.10 21.18
21.33 1.24 0.54 0.24 4.20 9.62 16.41 1.17 0.62 0.46 6.43 12.24 9.78 1.23 0.91 0.72 5.76 7.79
21.52 1.10 0.38 0.19 3.64 10.54 5.14 0.25 0.07 0.37 7.51 27.19
22.64 4.21 3.20 1. 79 9.62 12.66 8.67 1. 98 1.47 1.46 6.40 8.62 7.37 1.60 1.17 1.83 8.43 11.53
ment. Mter 24 hours, titration by thiosulfate was made to examine whether there occurred any consumption in iodine content. The result indicated that the consumption was insignificant at least for 24 hours at room temperature (20°C). From this, titration by thiosulfate solution for dissolved oxygen analysis was carried out within 24 hours after manganous sulfate reagent and alkaline iodide solution were added to the sample water.
Wet, dry and ash free dry weight: At the end of the respiration measurement, the animals were preserved in 10% formalin-sea water. The weighing of the animals was done at the land laboratory after returning from the cruise. The wet weight was measured by removing the excess of water on the surface of the animal; the dry weight was obtained by drying the animal at room temperature in a reduced pressure desiccator until a constant weight was obtained; the ash free dry weight was determined by burning the animal in a muffie furnace at 450°C until a constant weight was obtained. The dry weight of the body minus the ash weight gives an ash free dry weight. A Mettler balance was used for weighing.
-101-
Bull. Fat;. FiBk., Ilolckaido Univ. [XXI, 2
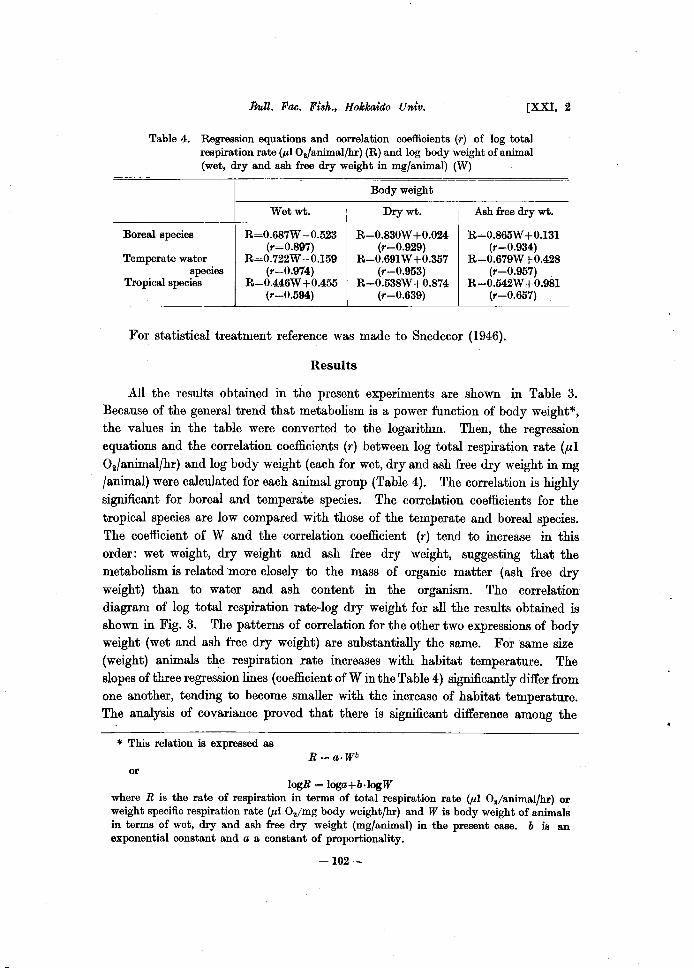
Table 4. Regression equations and correlation coefficients (r) of log total respiration rate (Ill O./animalfhr) (R) and log body weight of animal (wet, dry and ash free dry weight in mg/animal) (W)
Boreal species
Temperate water species
Tropical species
Wetwt.
R=0.687W -0.523 (r=0.897)
R=0.722W -0.159 (r=0.974)
R=0.446W +0.455 (r=0.594)
Body weight
Drywt.
R=0.830W +0.024 (r=0.929)
R=0.691W +0.357 (r=0.953)
R=0.538W +0.874 (r=0.639)
Ash free dry wt.
R=0.865W +0.131 (r=O.934)
R=0.679W +0.428 (r=0.957)
R=0.542W +0.981 (r=0.657)
For statistical treatment reference was made to Snedecor (1946).
Results
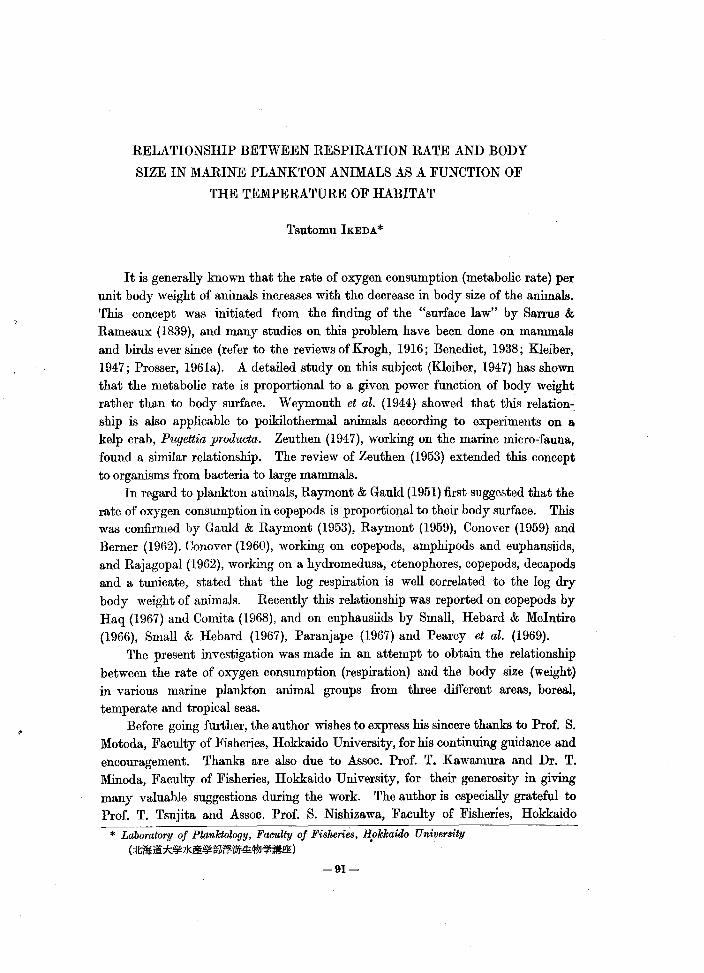
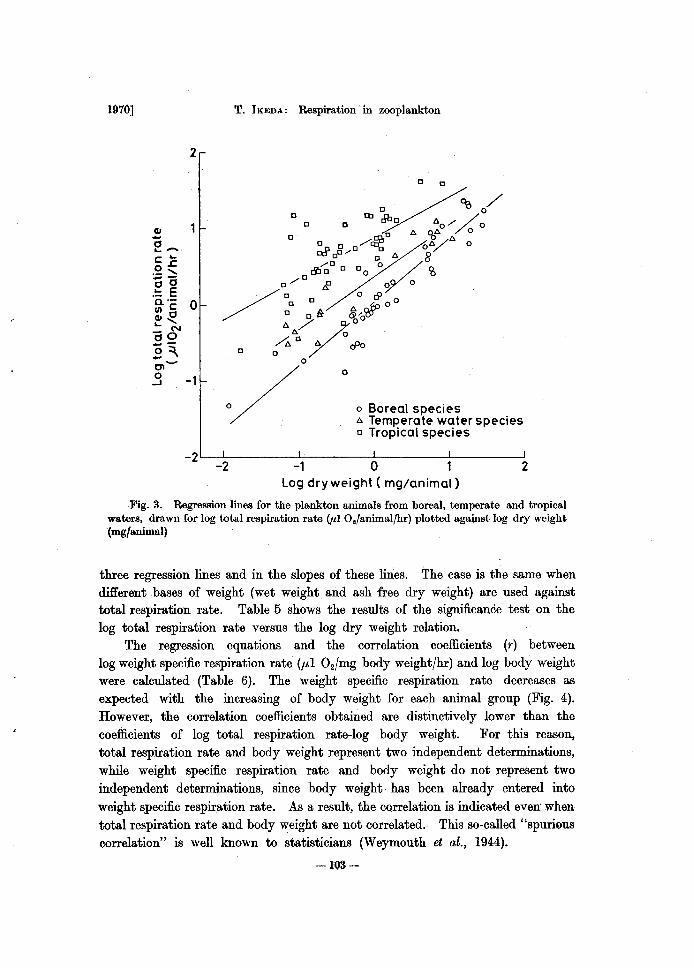
All the results obtained in the present experiments are shown in Table 3. Because of the general trend that metabolism is a power function of body weight*, the values in the table were converted to the logarithm. Then, the regression equations and the correlation coefficients (r) between log total respiration rate CuI 02/animal/hr) and log body weight (each for wet, dry and ash free dry weight in mg /animal) were calculated for each animal group (Table 4). The correlation is highly significant for boreal and temperate species. The correlation coefficients for the tropical species are low compared with those of the temperate and boreal species. The coefficient of Wand the correlation coefficient (r) tend to increase in this order: wet weight, dry weight and ash free dry weight, suggesting that the metabolism is related more closely to the mass of organic matter (ash free dry weight) than to water and ash content in the organism. The correlation diagram of log total respiration rate-log dry weight for all the results obtained is shown in Fig. 3. The patterns of correlation for the other two expressions of body weight (wet and ash free dry weight) are substantially the same. For same size (weight) animals the respiration rate increases with habitat temperature. The slopes of three regression lines (coefficient of W in the Table 4) significantly differ from one another, tending to become smaller with the increase of habitat temperature. The analysis of covariance proved that there is significant difference among the
* This relation is expressed as R = a·Wb
or logR = loga+b.logW
where R is the rate of respiration in terms of total respiration rate <Ill O./animal/hr) or weight specific respiration rate <Ill O./mg body weightfhr) and W is body weight of animals in terms of wet, dry and ash free dry weight (mg/animal) in the present case. b is an exponential constant and a a constant of proportionality.
-102-
1970]
2
T. IKEDA: Respiration' in zooplankton
o o
o
o
o Boreal species A Temperate water species o Tropical species
_2L-~ ______ ~ ________ L-______ -L ______ ~
~ ~ 0 2 log dry weight ( mg/animal)
Fig. 3. Regression lines for the plankton animals from boreal, temperate and tropical waters, drawn for log total respiration rate (PI O./animalfhr) plotted against log dry weight (mg/animal)
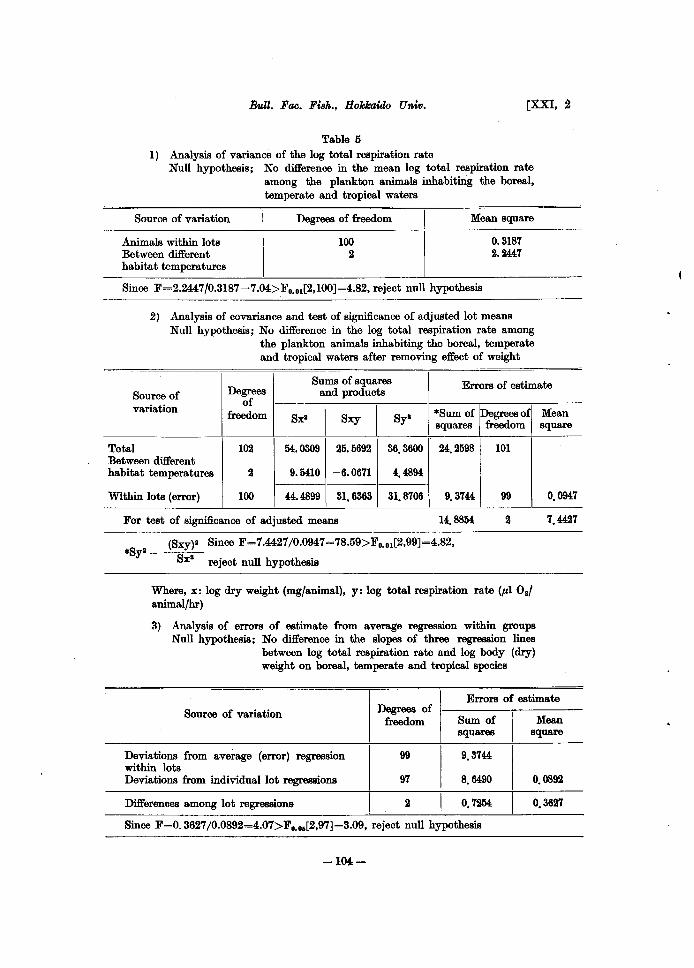
three regression lines and in the slopes of these lines. The case is the same when different bases of weight (wet weight and ash free dry weight) are used against total respiration rate. Table 5 shows the results of the significance test on the log total respiration rate versus the log dry weight relation.
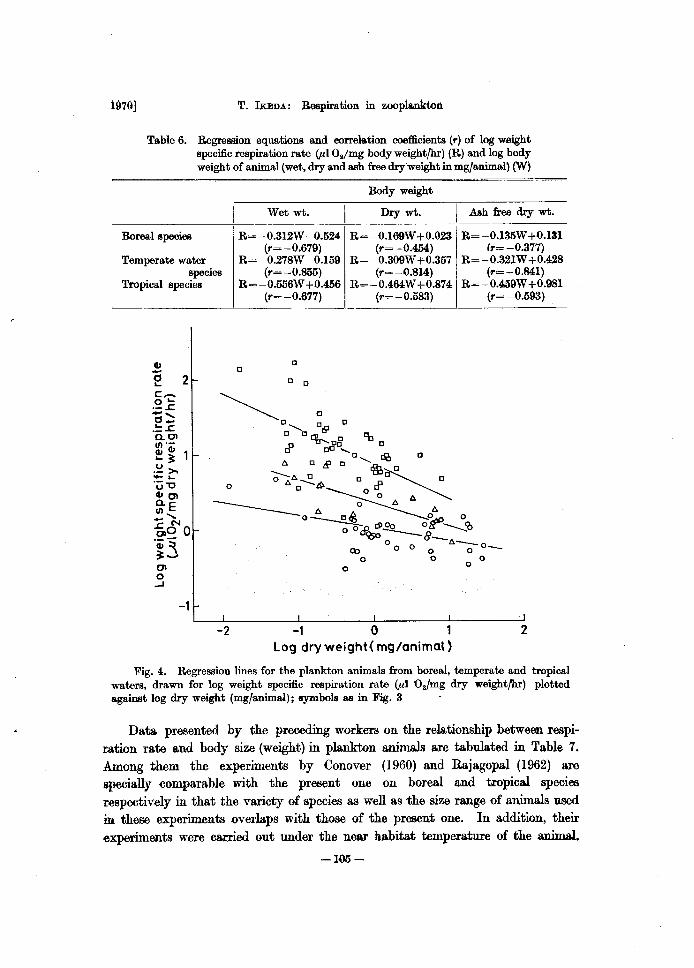
The regression equations and the correlation coefficients (r) between log weight specific respiration rate CuI 02/mg body weight/hr) and log body weight were calculated (Table 6). The weight specific respiration rate decreases as expected with the increasing of body weight for each animal group (Fig. 4). However, the correlation coefficients obtained are distinctively lower than the coefficients of log total respiration rate-log body weight. For this reason, total respiration rate and body weight represent two independent determinations, while weight specific respiration rate and body weight do not represent two independent determinations, since body weight has been already entered into weight specific respiration rate. As a result, the correlation is indicated even: when total respiration rate and body weight are not correlated. This so-called "spurious correlation" is well known to statisticians (Weymouth et al., 1944).
-103-
BvJt. 1'ac. FiBh., Ilokkaido uni". [XXI, 2
Table 5 I) Analysis of variance of the log total respiration rate
Null hypothesis; No difference in the mean log total respiration rate among the plankton animals inhabiting the boreal, temperate and tropical waters
Source of variation
Animals within lots Between different habitat temperatures
Degrees of freedom
100 2
Mean square
0.3187 2.2447
Since F=2.2447/0.3187=7.04>Fo.01[2,IOO]=4.82, reject null hypothesis
2) Analysis of covariance and test of significance of adjusted lot means Null hypothesis; No difference in the log total respiration rate among
the plankton animals inhabiting the boreal, temperate and tropical waters after removing effect of weight
Degrees Sums of squares Errors of estimate
and products Source of variation
of
I I freedom Sx· Sxy Sy· *Sum of iDegreeS ofj
squares freedom
Total 102 54.0309 25.5692 36.3600 24.2598 101 Between different habitat temperatures 2 9.5410 -6.0671 4.4894
Within lots (error) 100 44.4899 31.6363 31.8706 9.3744 99
For test of significance of adjusted means 14.8854 2
(Sxy)" Since F=7.4427/0.0947=78.59>Fo•01[2,99]=4.82, *Syl- ---
Sx· reject null hypothesis
Where, x: log dry weight (mg/animal), y: log total respiration rate (",10.1 animal/hr)
3) Analysis of errors of estimate from average regression within groups Null hypothesis; No difference in the slopes of three regression lines
between log total respiration rate and log body (dry) weight on boreal, temperate and tropical species
Mean square
0.0947
7.4427
Errors of estimate Source of variation Degrees of
I freedom Sum of Mean
squares square
Deviations from average (error) regression 99 9.3744 within lots Deviations from individual lot regreB8ions 97 8.6490 0.0892
Differences among lot regressions 2 o. 7254 0.3627
Since F=O.3627/0.0892=4.07>Fo•o.[2,97]=3.09, reject null hypothesis
-104:-
1970] T. IKEDA: Respiration in zooplankton
Ta.ble 6. Regression equations and correla.tion coefficients (r) of log weight specific respiration rate (piOI/mg body weightfhr) (R) and log body weight of animal (wet, dry a.nd ash free dry'weight in mg/a.nimal) (W)
Body weight
Wet wt. I Dry wt. I Ash free dry wt.
Boreal species R= - 0.312W -0.524 R= -O.l69W +0.023 R= -O.135W +0.131 (r=-0.679) (r=-0.454) (r=-0.377)
Temperate water R=-0.278W -0.159 R= -0.309W +0.357 R= -0.321W +0.428 species (r=-O.855) (r=-0.814) (r=-0.841)
Tropical .species R= -0.556W +0.456 R= -0.464W +0.874 R= -0.459W +0.981 (r=-0.677) (r=-0.583) (r=-0.593)
--,
IJ o
o 0
-1
-2 -1 o 2 Log dry weight( mg/animat )
Fig. 4. Regression lines for the plankton animals from boreal, temperate and tropical waters, drawn for log weight specific respiration rate (Pt O./mg dry weightfhr) plotted against log dry weight (mg/animal); symbols as in Fig. 3
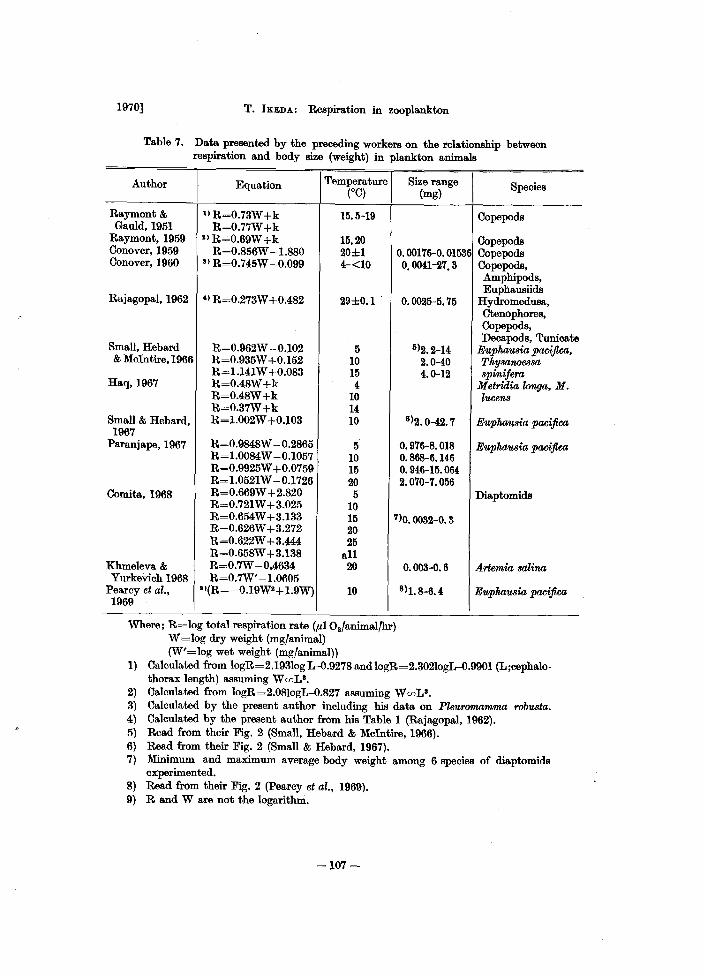
Data presented by the preceding workers on the rela.tionship between respiration rate and body size (weight) in plankton animals are tabula.ted in Table 7. Among them the experiments by Conover (1960) and Rajagopal (1962) are .specially comparable with the present one on boreal and tropical speoies respectively in that the variety of speoies as well as the size ra.nge of animals used in these experiments overlaps with those of the present one. In addition, their experiments were oarried out under the near habitat temperature of the animal.
-100-
Bull. Fac. Fish., Hokkaido Univ. [XXI, 2
The present regression equations for boreal and tropical species differ fairly from each comparable equations made by Conover (1960) and Rajagopal (1962) respectively. However, analyses of covariance indicate that there is no difference in each pair of data. That is, null hypothesis that there is no difference in the mean log weight specific respiration rate in each pair of data is accepted in each case at P=0.05 (variance ratio F=0.13; FO•06 [1,80] = 3.96 in the case of Conover's data versus the present one on boreal species, and F=1.85; FO•06 [1,56]=4.02 in the case of Rajagopal's data versus the present one on tropical species). The regression lines from different temperatures on a given species (e.g., Small, Hebard & McIntire, 1966; Haq, 1967; Paranjape, 1967; Comita, 1968; in the Table 7) cannot be compared easily with the present results, because in a given species the Q10 for respiration rate varies with body size and with the habitat temperature to which the animals are adapted (Rao & Bullock, 1954), and the speed of temperature change and the length of time spent at a new temperature affect the Q10 also (Bullock, 1955).
Preservation of the animals in formalin aqueou.s solution in the present experiments wou.ld have caused underestimation of body weight. However, the loss would be about 10% at most (Lovegrove, 1966; Hopkins, 1968).
Discussion
It is generally accepted that the respiration rate in poikilotherms is dependent upon the temperature of their habitat. Fox (1936) first compared the rate of oxygen consumption of marine animals (echinoderms, annelids, crustaceans and lamellibranches) from cold water (5-7°0) with the same groups from warm waters (7-15°C). He found that the rate of warm water species was higher than that of the cold water species at the normal temperature of their habitats. Similar investigations have been carried out by several workers mainly for the purpose of obtaining knowledge on the mechanisms of metabolic compensation (adaptation) which permits the wide distribution of the organisms. They compared the MT (metabolism-temperature) curves from the organisms distributed in different latitudes (refer to Scholander et al., 1953; Bullock, 1955; Prosser, 1955, 1961b). The results of Scholander et al. (1953) in particular showed on tropical (30°0) and arctic (0°0) aquatic poikilotherms (fishes and crustaceans) that the regression lines between log total respiration rate and log wet weight on fishes and crustaceans had the same slope (0.85) so that the two lines ran parallel with each other. The arctic forms showed a considerable metabolic adaptation in that their rates were only one fourth to one sixth of the rates of the tropical forms, resulting in the Q10 values of 1.6-1.8. In the present experiments, however, the Q10 varies with body weight, becoming smaller with the increasing body weight (Table 8). Rao &
-106-
1970] T. IKEDA: Respiration in zooplankton
Table 7. Data presented by the preceding workers on the relationship between respiration and body size (weight) in plankton animals
Author I
Equation I Temperature Size range
I (°0) (mg)
Raymont & llR=0.73W+k 15.5-19 Gauld,1951 R=O.77W+k
Raymont, 1959 2) R=0.69W +k 15,20 Conover, 1959 R=0.856W -1.880 20±l 0.00176-0.01536 Conover, 1960 8) R=0.745W -0.099 4-<10 0.0041-27.3
Rajagopal, 1962 &) R=0.273W +0.482 29±0.1 0.0025-5.75
Small, Hebard R=0.962W -0.102 5 5)2.2-14 & McIntire, 1966 R=0.935W +0.152 10 2.0-40
R=1.l41W +0.083 15 4.0-12 Haq, 1967 R=0.48W+k 4
R=0.48W+k 10 R=0.37W+k 14
Small & Hebard, R=I.002W +0.103 10 6)2.0-42.7 1967
Paranjape, 1967 R=0.9848W --0.2865 5 0.916-8.018 R=1.0084W -0.1057 10 0.868-6.146 R=0.9925W +0.0759 15 0.946-15.064 R=1.0521W -0.1726 20 2.070-7.056
Comita, 1968 R=0.669W +2.820 5 R=0.721W +3.025 10 R=0.654W +3.133 15 7)0. 0032-0. 3 R=0.626W +3.272 20 R=0.622W +3.444 25 R=0.658W +3.138 all
Khmeleva& R=0.7W -0.4634 20 0.003-0.6 Yurkevich 1968 R=O.7W' -1.0605
Pearcy et al., 9)(R= -0.19W2+ 1.9W) 10 8)1. 8-6. 4 1969
Where; R=log total respiration rate (fIIO./animal/hr) W =log dry weight (mg/animal) (W'=log wet weight (mg/animal))
Species
Copepoda
Copepoda Copepods Copepoda, Amphipods, Euphausiids
HydromeduBa, Ctenophores, Copepods, Decapods, Tunicate
Euphausia, pacifica, Thysarwe8sa spinifera
Metridia, longa, M. lucens
Euphausia pacifica
Euphausia pacifica
Diaptomids
Anemia, salina
Euphausia pacifica
1) Calculated from logR=2.193Iog L-O.9278 and logR=2.302IogL-O.9901 (L ;cephalo-thorax length) assuming W(f)La.
2) Calculated from logR=2.08IogL-O.827 assuming W(f)Ls. 3) Calculated by the present author including his data on Pleuromamma robu8ta. 4) Calculated by the present author from his Table 1 (Rajagopal, 1962). 5) Read from their Fig. 2 (Small, Hebard & McIntire, 1966). 6) Read. from their Fig. 2 (Small & Hebard, 1967). 7) Minimum and maximum average body weight among 6 species of diaptomids
experimented. 8) Read from their Fig. 2 (pearcy et al., 1969). 9) Rand W are not the logarithm.
-107-
Bull. Faa. Fisk.. Hok1caWo Unif!.
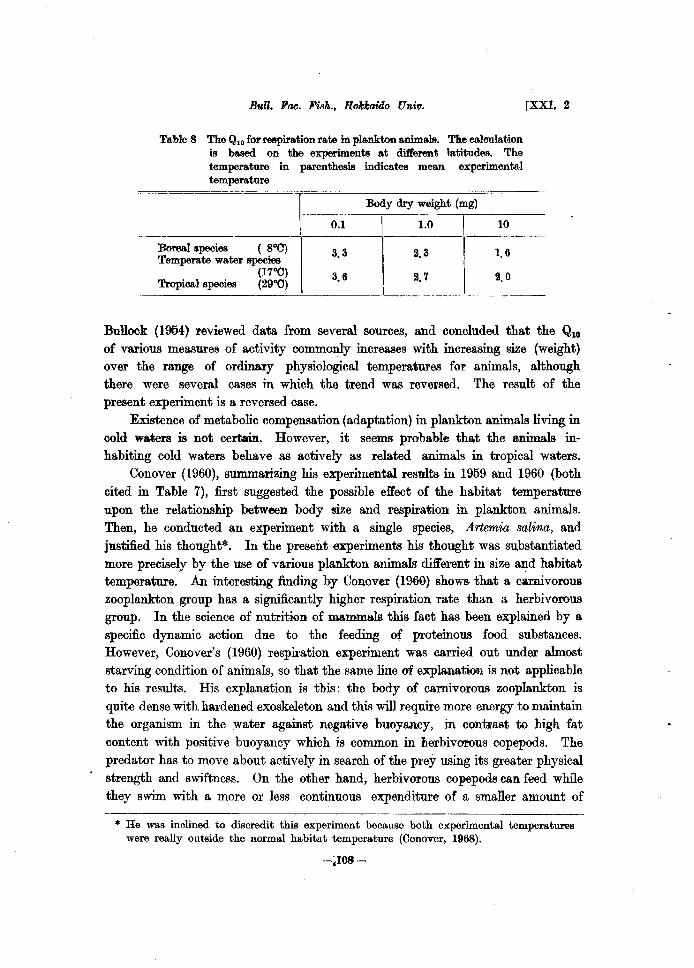
Table 8 The Ql0 for re8piration rate in plankton a.nimals. The calculation is based on the experiments at different latitudes. The temperature in parenthesis indicates mean experimental temperature
:Body dry weight (mg)
0.1 1.0 10
Boreal species ( 8"0) 3.3 2.3 1.6 Temperate water species (17°C) 3.6 2. 7 2.0
Tropical species (29"0)
[XXI. 2
Bullock (1954) reviewed data from several sources, and concluded that the QI0
of various measures of activity commonly increases with increasing size (weight) over the range of ordinary physiological temperatures for animals, although there were several cases in which the trend was reversed. The result of the present experiment is a reversed case.
Existence of metabolic compensation (adaptation) in plankton animals living in oold wa.ters is not certain. However, it seems probable that the animals inhabiting cold waters behave as actively as related animals in tropical waters.
Conover (1960), summarizing his experimental results in 1959 and 1960 (both cited in Table 7), fust suggested the possible effect of the habita.t temperature upon the relationslrip between body size and respiration in plankton animals. Then, he conducted an experiment with a single species, Artemia salina, and justified Iris thought*. In the present experiments his thought was substantiated more precisely by the use of various plankton animals different in size and habitat temperature. An interesting finding by Conover (lWO} shows that a carnivorous zooplankton group has a significantly higher respiration rate than a herbivorous group. In the science of nutrition of ma.mmals this fact has been explained by a specific dynamic action due to the feeding of proteinous food substances. However, Conover's (1960) respiration experiment was carried out under almost starving condition of animals, so that the same line of explanation is not applicable to his results. His explanation is this: the body of carnivorous zooplankton is quite dense with hardened exoskeleton and this will require more energy to maintain the organism in the water against negative buoyancy, in contrast to high fat content with positive buoyancy which is common in herbivorous copepods. The predator has to move about actively in search of the prey using its greater physical strength and swiftness. On the other hand, herbivorous copepoda can feed while they swim with a more or less continuous expenditure of a smaner amount of
* He was inclined to discredit this experiment because both experimental temperatures were really outside the normal habitat temperature (Conover, 1968).
-.108-
1970} T. IKEDA: Respiration in zooplankton
-1
-2 -1 0 1 2 Log dry weight( mg/animal)
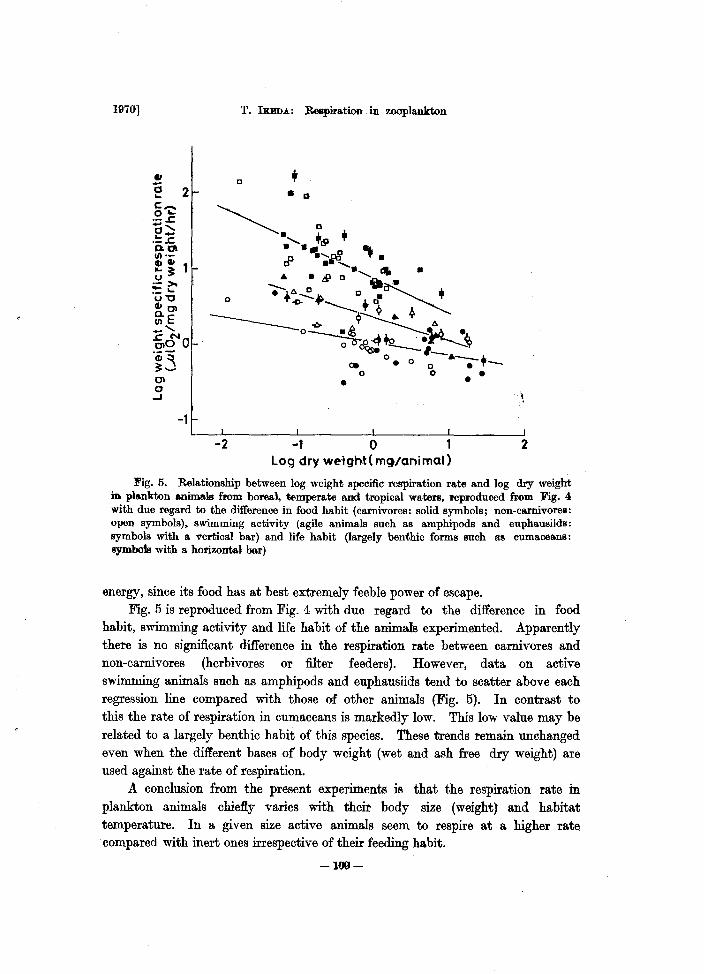
Fig. 5. Relationship between log weight specific respiration rate and log dry weight in plankton a.nimals from boreal, temperate and tropical waters, reproduced from Fig. 4 with due regard to the difference in food habit (carnivores: solid symbols; non-ca.rnivores: open symbols), swimming activity (agile animals such as amphipods and euphausiids: symbols with a vertical bar) and life habit (largely benthic forms such ttl!! eumaceans: symbols with a horizontal her)
energy, since its food has at best extremely feeble power of escape. Fig_ 5 is reproduced from Fig_ 4 with due regard to the difference in food
habit, swimming activity and life habit of the animals experimented. Apparently there is no significant difference in the respiration ra.te between carnivores and non-carnivores (herbivores or filter feeders). However, data on active swimming animals such as amphipods and euphausiids tend to scatter above each regression line compared with those of other animals (Fig. 5). In contrast to this the rate of respiration in cumaceans is markedly low. This low value may be related to a largely benthic habit of this species. These trends remain unchanged even when the different bases of body weight (wet and ash free dry weight) are used against the rate of respiration.
A conclusion from the present experiments is that the respiration rate in plankton animals chiefly varies with their body size (weight) and habitat temperature. In a given size active animals seem to respire at a higher rate compared with inert ones irrespective of their feeding habit.
-109-
Bull. Far;. Fish., Hokkaido Univ. [XXI, 2
Summary
(1) On 77 species of plankton animals, covering almost all systematic marine zooplankton species, inhabiting the boreal, temperate and tropical waters, the respiration rate was measured by the water bottle method at each habitat temperature.
(2) The regression equations of log total respiration rate (,u1 02/animal/hr) against log body weight (each for wet, dry and ash free dry weight in mg/animal), and of log weight specific respiration rate (,u1 02/mg body weight/hr) against log body weight were obtained on three animal groups: boreal species, temperate water species and tropical species.
(3) Total respiration rate generally increased and weight specific one decreased with increasing body weight. Statistical tests showed that the correlation coefficients were highly significant in each group.
(4) The remainder term also increased with increasing habitat temperature accompanied by a slight decrease (in the case of total respiration rate) or by a slight increase (in the case of weight specific respiration rate) in the inclination of the regression line. In other words, the respiration rate in terms of total respiration rate or weight specific respiration rate in a given size animal is higher in tropical species than in boreal species, and the rate in temperate water species is intermediate. The calculated QIO for the respiration rate decreases with increasing body weight.
(5) Similar data by the preceding worke~s were tabulated and shortly discussed in comparison with the results of the present experiments. Although there was a fairly wide difference between the regression equations of the present experiments and the comparable tabulated one, the significance test showed little difference among those data which were used to calculate the regression equations.
(6) The effect due to the specific difference in feeding behavior, swimming activity and life habits of plankton animals on the respiration rate was briefly discussed; as far as the size range studied is concerned, no significant difference in the respiration rate was found due to the difference in feeding behavior. Visibly active animals such as euphausiids and amphipods seem to respire at some higher rate compared with the other inert animals studied. The rate is markedly low in largely benthic forms, such as cumaceans.
(7) The main source of difference in the respiration rate other than body size of animals seems to be the habitat temperature. The change in the respiration rate due to this source is highly significant at least for plankton animals that fall within the size range examined in the present experiments.
-110-
1970] T. IKEDA: Respiration in zooplankton
References
Anraku, M. (1964). Influence of the Cape Cod Canal on the hydrography and on the copepoda in Buzzards Bay and Cape Cod Bay, Massachusetts. II. Respiration and feeding. Limnol. Oceanogr., 9, 195-206.
Benedict, F.G. (1938). Vital energetics. A study in comparative basal metabolism. Pub. 503. 215p, Carnegie Inst., Washington D.C.
Berner, A. (1962). Feeding and respiration in the copepod Temora longicO'fnis (Muller). J. mar. biol. Ass. U.K., 42, 625-640.
Bullock, T.R. (1955). Compensation for temperature in the metabolism and activity of poikilotherms. Biol. Rev., 30, 311-342.
Comita, G.W. (1968). Oxygen consumption in Diaptomus. Limnol. Oceanogr., 13, 51-57. Conover, R.J. (1956). Oceanography of Long Island Sound, 1952-1954. VI. Biology of
Acartia clausi and A. tonsa. Bull. Bingham Oceanogr. Coll., 15, 156-233. ---- (1959). Regional and seasonal variation in the respiratory rate of marine
copepods. Limnol. Oceanogr., 4, 259-268. (1960). The feeding behavior and respiration of some marine planktonic
Crustacea. Biol. Bull., 119, 399-415. ---- (1968). Zooplankton-life in a nutritionally dilute environment. Amer. Zoologist,
8, 107-118. Fox, H. M. (1936). The activity and metabolism of poikilothermal animals in different
latitudes. I. Proc. Zool. Soc. London, 945-955. Fry, F.E.J. (1957). The aquatic respiration of fish. The physiology of fishes. vol. 1, 1-63.
(Ed. by Brown, M.E.), 447p, Academic Press, New York. Gauld, D.T. & Raymont, J.E.G. (1953). The respiration of some planktonic copepods. II.
The effect of temperature. J. mar. bioI. Ass. U.K., 31, 447-460. Hall, F.G. (1929). The influence of varying oxygen tensions upon the rate of oxygen
consumption in marine fishes. Amer. J. Physiol., 88, 212-218. Haq, S.M. (1967). Nutritional physiology of Metridia lucens and M. Ionga from the Gulf of
Maine. Limnol. Oceanogr., 12, 40-51. Hopkins, T.L. (1968). Carbon and nitrogen content of fresh and preserved Nematoscelis
difficilis, a euphausiid crustacean. J. Cons. perm. into Explor. Mer, 31, 300-304. Ikeda, T. (1970). Changes in respiration rate and in composition of organic matter in
Calanus cristatus under starvation (in preparation). Khmeleva, N.N. & Yurkevich, G.N. (1968). Energy metabolism of Anemia salina (L.)
in relation to that of other crustaceans. DoH. Akad. Nauk SSSR, 183, 978-981. [English translation: DoH. BioI. Sci., 183 (1-6), 724-726. (1968).]
Kleiber, M. (1947). Body size and metabolic rate. Physiol. Rev., 27, 511-541. Krogh, A. (1916). The respiratory exchange of animals and man. 173p, Longmans, Green
and Co., London. Lovegrove, T. (1966). The determination of the dry weight of plankton and the effect of
various factors on the values obtained. Some contemporary studies in marine science. 429-467. (Ed. by Barnes, R.), 716p, George Allen and Unwin Ltd, London.
Marshall, S.M., Nicholls, A.G. & Orr, A.P. (1935). On the biology of Calanus finmarchicus. VI. Oxygen consumption in relation to environmental conditions. J. mar. bioI. Ass. U.K., 20, 1-27.
Marshall, S.M. & Orr, A.P. (1958a). Some uses of antibiotics in physiological experiments in sea water. J. mar. Res., 17, 345-346.
------ (1958b). On the biology of Calanus finmarchicus. X. Seasonal changes in oxygen consumption. J. mar. bioI. Ass. U.K., 37, 459-472.
-------- (1966). Respiration and feeding in some small copepods. J. mar. bioI. Ass. U.K., 46, 513-530.
Miyauchi, T. & Irie, H. (1966). Relation between the oxygen consumption and the shell
-111-
Bttll. Fac. Fi,d., Ho/rJw,iilo Univ. [ttl,2
movement of the pearl oyster, Ptena. mtU"tensii, in the sea water of low oxygen tension. Bull. Fac. Fish. Nagasaki Univ., 21, 139-144.
Nicol, J.A.C. (1960). The biology of marine animals. 707p, Sir Isaac Pitman and Sons Ltd., London.
Nimura, Y. & Inoue, M. (1969). Oxygen uptake rate of the Japanese spiny lobster as related to the environmental oxygen concentration. Bull. Jap. Boc. Sci. Fish., 35, 852-86l.
Paranjape, M.A. (1967). Molting and respiration of euphausiida. J. FiBh. Res. Bd. Oan., 24, 1229-1240.
Pearcy, W.G., Theilacker, G.R. & La.sker, R. (1969). Oxygen consumption of EupM~ia pacifica: The lack of a diel rhythm or light-dark effect, with a comparison of experimental techniques. Lim'IWl. Oceanogr., 14, 219-223.
Prosser, C.L. (1955). Physiological variation in animals. Bioi. Rev., 30, 229-262. --- (1961a). Oxygen: Respiration and metabolism. Oomparative animal physiology.
(2nd ed.). 153-197. (Ed. by Prosser, C.L. & Brown, F.A.), 688p, W.B. Saunders Co., Philadelphia and London.
(196Ib). Temperature. Oomparative animal physiology. (2nd 00.). 238-284. (Ed. by ProBBer, C.L. & Brown, F.A.), 688p, W.B. Saunders Co., Philadelphia and London.
Rajagopal, P.K. (1962). Respiration of some marine planktonic organisms. Proc. Indian AMil. Sci., Be,.. B., 55, 76-81.
Rao, K.P. & Bullock, T.R. (1954). Ql0 as a function of size and habitat temperature in poikilotherms. Ame,.. Nat., 88, 33--44.
Raymont, J.E.G. (1959). The respiration of BOme planktonic copepoda. III. The oxygen requirements of BOme American species. Lim'IWl. OtJea1Wgr., 4, 479-491.
Raymont, J.E.G. & Gauld, D.T. (1951). The respiration of BOrne planktonic copepods. J. mar. biol. A88. U.K., 29, 681-693.
Sarrus & Rameaux. (1839). Bulletin de l'acatUmie rqyale de medicine. 3, 1094. (Cited by Kleiber, M., 1947).
Scholander, P.F., Flagg, W., Walters, V. & Irving, L. (1953). Climatic adaptation in arctic and tropical poikilotherms. pa'g8iol. Zool., 26, 67-92.
SmaJI, L.F. & Hebal"d, J.F. (1967). Respiration of a vertically migrating marine crustacean Eupha9UIia pacifica &nsen. Limool. Ocea»agr., 12, 272-280.
Small, L.F., Hebard, J.F. & Mcintire, C.D. (1966). Respiration in euphausiida. Nature, 211, 1210-1211.
Snedecor, G.W. (1946). Statistical methods. (4th ed.). 485p, The Iowa State College Press, Ame •.
Strickland, J.D.H. & Parsons, T.R. (1965). A manual of sea water analysis. (2nd ed.). Bull. FiBk. Res. Bd. Oan., 125, 2<>3p.
Weymouth, F.W., Crismon, J.M., Hall, V.E., Belding, H.S. & Field, J. (1944). Total aootissue respiration in relation to body weight. A comparison of the kelp crab with other crustaceans and with mammals. Physiol. Zool., 17, 50-71.
Wolvekamp, H.P. & Waterman, T.H. (1960). Respiration. The plI,yliology of Orustacea. vol. I, 35-100. (Ed. by Waterman, T.H.), 67Op, Academic PreBB, New York and London.
Zeiss, F.R., Jr. (1963). Effects of population densities on zooplankton respiration rates. Lim1W1. OceaMgr., 8, 110-115.
Zeuthen, E. (1947). Body size and metabolic rate in the animal kingdom with special regard to the marine micro-fauna. Oampt.-rend. Lab. Carlsberg, Ser. cnim., 26, 17-161.
--- (1953). Oxygoo. uptake as related to body size in organisms. Quart. Rev. BioI., 28, 1-12.
-112-