Embed Size (px)
Citation preview
Clayton, P.J et al. (2017) Case study in the use of shear wave velocity techniques to investigate liquefaction potential of
Waikato soils for the Hamilton section of the Waikato expressway Proc. 20th NZGS Geotechnical Symposium. Eds. GJ Alexander & CY Chin, Napier
1
Case study in the use of shear wave velocity techniques to investigate
liquefaction potential of Waikato soils for the Hamilton section of the
Waikato expressway
P J Clayton
Beca Infrastructure, Auckland, NZ.
[email protected] (Corresponding author)
I Yong
Beca Infrastructure, Auckland, NZ. [email protected]
L Wotherspoon
University of Auckland, Auckland, NZ. [email protected]
Keywords: pumice, shearwave velocity, aging, liquefaction, MEVR.
ABSTRACT
The four-lane, 21.8 kilometre long, Hamilton Section of the Waikato Expressway is the largest
roading project undertaken in this region’s history and one of the larger projects currently being
undertaken in New Zealand. Many of the seventeen expressway bridges in the Hamilton
Section are underlain by saturated Pleistocene sandy alluvial soils. Conventional CPT/SPT
penetration resistance based methods generally indicate a liquefaction potential for these soils that
extends to considerable depth. Some researchers have however suggested that conventional
penetrometer based methods may overestimate the liquefaction potential in these soils due to their
age and pumice content. In recognition of this effect liquefaction assessment on this project has
been undertaken utilising shear wave velocity as the primary indicator of liquefaction triggering
and for the derivation of liquefied shear strength. Recognising the less well developed state of
both the acquisition of shear wave data and the associated liquefaction assessment methodology
the design team undertook a number of measures to validate data and approaches. Side by side
downhole/crosshole tests provide the opportunity to consider the repeatability of Vs testing as
well as side by side CPT, DMT and shear wave measurements (crosshole and downhole) as well
as paleoliquefaction investigation (discussed in companion paper – Clayton et al,, (2017)) provide
the opportunity to compare and contrast the liquefaction potential indicated by these various
methods in these specific soils.
1 INTRODUCTION
The City Edge Alliance (The Alliance) has been commissioned to undertake detailed design for
the 21.8 kilometre long Hamilton Section of the Waikato Expressway in the North island of New
Zealand. The Alliance is made up of the New Zealand Transport Agency, Fletcher Construction,
Higgins, Beca and Coffey. The Alliance approach was adopted to maximise the potential for full
integration of the traditional roles of client, designer and constructor for the benefit of the project,
enabling a collective approach and risk sharing. Within the geotechnical sphere of the project,
this has been further enhanced through a Geotechnical Steering Group with representatives from
the designer, constructor and client. This Group enabled consideration of ‘best for project’
approaches and thereby the ability to look at approaches and methods that would not normally
occur within more traditional contracts.
Clayton. P.J et al. (2017). Case study in the use of paleoliquefaction techniques to investigate liquefaction potential of Waikato soils for the Hamilton section of the Waikato expressway
2
Much of the route passes through a geomorphic region known as the Hamilton Lowlands which
is characterised by late Pleistocene alluvial sandy deposits and a relatively high water table.
Conventional penetrometer based liquefaction assessment within these soils indicate a
liquefaction potential that extends to considerable depth, however recent research into the effect
of aging and particle crushing suggest that the liquefaction risk may be overestimated by such
methods. This paper compares the assessed liquefaction potential based on CPT, downhole and
crosshole shear wave velocity methods. Measured to estimated velocity ratio (MEVR) is used to
discuss possible reasons for the differences between liquefaction resistance indicated by
penetrometer and Vs based methods in these soils.
2 BACKGROUND
A number of researchers have noted that conventional penetrometer based liquefaction
assessment methods can over predict liquefaction triggering in some soils (Orense, 2013). The
over prediction has been attributed to the effects of particle crushing and/or aging.
2.1 Particle Crushing
Particle crushing has been reported during CPT testing in pumiceous soils (Wesley et al., 1998).
Where significant crushing occurs during penetrometer testing the relative density may be
underestimated and hence liquefaction potential overestimated.
2.2 Age Effects
Over time granular soils tend to gain strength through a number of mechanisms. Creep between
particles may lead to a denser state of packing and/or cementation may develop. A number of
researchers (Andrus et al. 2009) have noted that the cementation that develops may arise from a
number of mechanisms, some of which are relatively weak. It is thought that these comparatively
weaker bonds may contribute to liquefaction resistance but may not be fully recognised by large
strain penetrometer based methods leading to an underestimation of the liquefaction potential of
older soils by penetrometer based methods.
2.3 Role of Shear Wave Based Liquefaction Assessment
Methods based on shear wave velocity have been suggested as being more appropriate for
liquefaction assessment in the aged and/or pumiceous soils of the Waikato as small strain methods
do not subject the soil to stresses high enough to result in significant particle crushing or
disruption of weaker bonds (Clayton & Johnson 2013). While considered more appropriate, shear
wave velocity based methods are not as well developed as penetrometer based methods and the
project team had concerns about the reliability of shear wave velocity (Vs) measurement methods.
To address concerns about the reliability of Vs measurement paired tests were undertaken at 10
locations along the route in a range of ground conditions including stiff silts/dense sands of the
Piako Group and relatively loose sands of the Hinuera Formation utilising a number of different
methods including crosshole, downhole true interval and (a lesser number of) downhole pseudo
interval. Results were also compared to those of a paleoliquefaction study, which is the subject of
a companion paper (Clayton et al., 2017)
3 GEOLOGY, GROUNDWATER AND SEISMICITY
Refer to companion paper (Clayton et al., 2017) for details of geology/soil conditions, ground
water and seismicity within the study area.
Clayton. P.J et al. (2017). Case study in the use of paleoliquefaction techniques to investigate liquefaction potential of Waikato soils for the Hamilton section of the Waikato expressway
3
4 METHODS OF ASSESSMENT
4.1 CPT Testing
Cone Penetrometer Tests (CPT) were regularly undertaken along the route with multiple tests at
each bridge abutment. CPT were utilised to refine stratigraphy, inform saturation and groundwater
level in highly permeable soils, and to provide correlation to fines content and soil behaviour
index (Ic). The latter utilised specific correlations for some units (Wong & Clayton, 2017). Where
paired testing was undertaken, using a combination of co-located CPT, seismic dilatometer
(sDMT), Crosshole Seismic Tests (CST), these tests were undertaken around 2m apart in a
triangular formation to avoid disturbance related effects.
4.2 Shear wave velocity
Shear wave velocity testing was undertaken utilising a variety of methods including seismic cone
penetrometer (sCPT), sDMT & CST methods. For this study the sDMT tests utilised a true
interval approach utilising two geophones/accelerometers located 0.5m apart and a surface source
(sledgehammer striking timber sleeper). Stacking was undertaken where low signal to noise (S/N)
ratio occurred. Internal validation was undertaken by comparing left hand and right hand polarised
tests. Tests were typically undertaken at 0.5m intervals vertically. Direct-push crosshole tests
(CST) (Wotherspoon et al., 2015) were also undertaken. A source and a receiver sensor were
advanced separately into the ground to the same depth using standard CPT rods and two small-
scale cone penetrometer rigs. At each depth testing was performed using a hammer impact source
applied to the top of the source rod, with at least three separate tests performed at each depth and
stacked to increase signal-to-noise ratio.
5 INTERPRETATION METHODOLOGY
The interpretation methodology adopted for this comparison is summarised below in Table 1
Table 1 interpretation methodology
Test
Method
Methodology for
susceptibility
Methodology for Triggering
assessment
Methodology for
Liquefied shear strength
CPT Based on Ic with Ic
cutoff calibrated to
Atterburg tests on
samples from paired
borehole. Refer to
Young and Clayton
(2017).
Following approach
published by Boulanger and
Idriss (2014).Fines content
correlated to Ic with
calibration using laboratory
grading tests on paired
borehole samples.
Following approach
published by Idriss and
Boulanger (2014).
All Vs
methods
Based on Ic from paired
CPT with calibrated Ic
Cutoff as per CPT based
assessment.
Based on Kayen et al.
(2013) Fines content
correlated to Ic from paired
CPT, calibrated as per CPT
based assessment.
Based on Ozener (2012)
6 ANALYSIS RESULTS
6.1 Profile comparisons
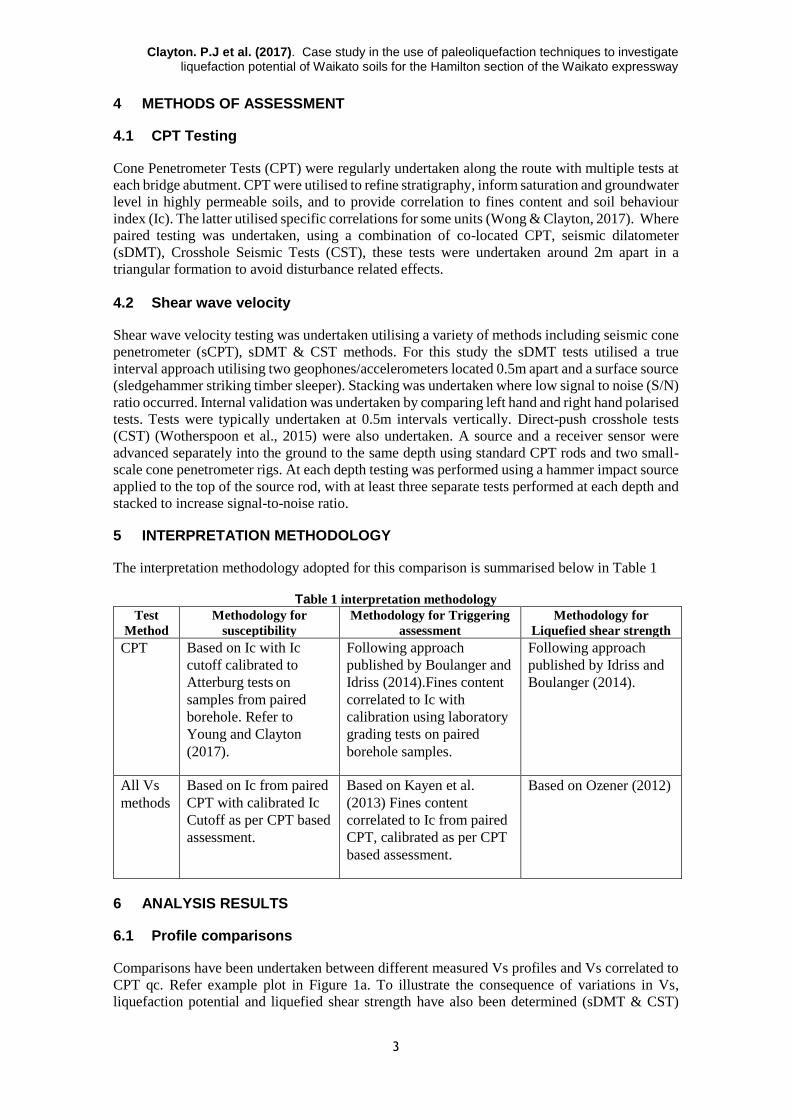
Comparisons have been undertaken between different measured Vs profiles and Vs correlated to
CPT qc. Refer example plot in Figure 1a. To illustrate the consequence of variations in Vs,
liquefaction potential and liquefied shear strength have also been determined (sDMT & CST)
Clayton. P.J et al. (2017). Case study in the use of paleoliquefaction techniques to investigate liquefaction potential of Waikato soils for the Hamilton section of the Waikato expressway
4
utilising methodology published by researchers (Kayen et al. 2013) and (Ozener 2012). For
comparison analysis direct from CPT (Idriss and Boulanger 2014) is also presented. Refer Figures
1b&c.
Figures 1a, 1b&1c: Plot of measured and estimated (correlated) shear wave velocity vs
depth, FOSliq vs depth and liquefied shear strength vs depth.
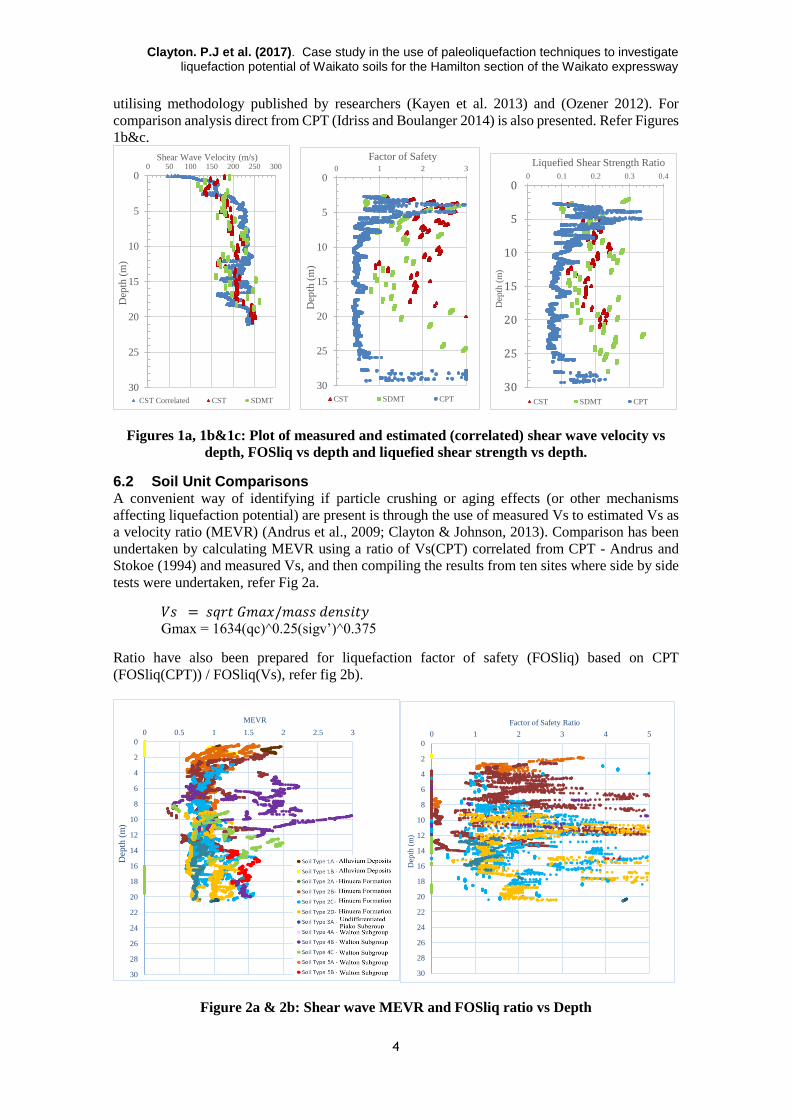
6.2 Soil Unit Comparisons A convenient way of identifying if particle crushing or aging effects (or other mechanisms
affecting liquefaction potential) are present is through the use of measured Vs to estimated Vs as
a velocity ratio (MEVR) (Andrus et al., 2009; Clayton & Johnson, 2013). Comparison has been
undertaken by calculating MEVR using a ratio of Vs(CPT) correlated from CPT - Andrus and
Stokoe (1994) and measured Vs, and then compiling the results from ten sites where side by side
tests were undertaken, refer Fig 2a.
𝑉𝑠 = 𝑠𝑞𝑟𝑡 𝐺𝑚𝑎𝑥/𝑚𝑎𝑠𝑠 𝑑𝑒𝑛𝑠𝑖𝑡𝑦 Gmax = 1634(qc)^0.25(sigv’)^0.375
Ratio have also been prepared for liquefaction factor of safety (FOSliq) based on CPT
(FOSliq(CPT)) / FOSliq(Vs), refer fig 2b).
Figure 2a & 2b: Shear wave MEVR and FOSliq ratio vs Depth
0
5
10
15
20
25
30
0 50 100 150 200 250 300
Dep
th (
m)
Shear Wave Velocity (m/s)
CST Correlated CST SDMT
0
5
10
15
20
25
30
0 1 2 3
Dep
th (
m)
Factor of Safety
CST SDMT CPT
0
5
10
15
20
25
30
0 0.1 0.2 0.3 0.4
Dep
th (
m)
Liquefied Shear Strength Ratio
CST SDMT CPT
0
2
4
6
8
10
12
14
16
18
20
22
24
26
28
30
0 0.5 1 1.5 2 2.5 3
Dep
th (
m)
MEVR
0
2
4
6
8
10
12
14
16
18
20
22
24
26
28
30
0 1 2 3 4 5
Dep
th (
m)
Factor of Safety Ratio
Clayton. P.J et al. (2017). Case study in the use of paleoliquefaction techniques to investigate liquefaction potential of Waikato soils for the Hamilton section of the Waikato expressway
5
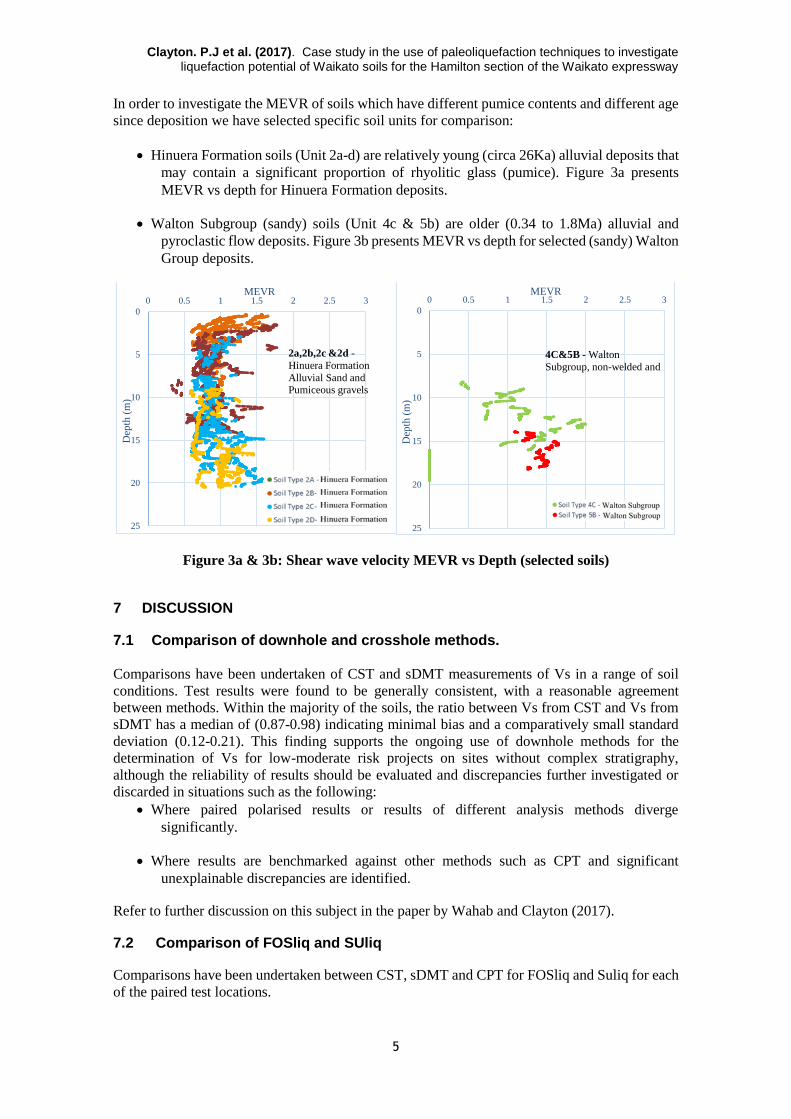
In order to investigate the MEVR of soils which have different pumice contents and different age
since deposition we have selected specific soil units for comparison:
• Hinuera Formation soils (Unit 2a-d) are relatively young (circa 26Ka) alluvial deposits that
may contain a significant proportion of rhyolitic glass (pumice). Figure 3a presents
MEVR vs depth for Hinuera Formation deposits.
• Walton Subgroup (sandy) soils (Unit 4c & 5b) are older (0.34 to 1.8Ma) alluvial and
pyroclastic flow deposits. Figure 3b presents MEVR vs depth for selected (sandy) Walton
Group deposits.
Figure 3a & 3b: Shear wave velocity MEVR vs Depth (selected soils)
7 DISCUSSION
7.1 Comparison of downhole and crosshole methods.
Comparisons have been undertaken of CST and sDMT measurements of Vs in a range of soil
conditions. Test results were found to be generally consistent, with a reasonable agreement
between methods. Within the majority of the soils, the ratio between Vs from CST and Vs from
sDMT has a median of (0.87-0.98) indicating minimal bias and a comparatively small standard
deviation (0.12-0.21). This finding supports the ongoing use of downhole methods for the
determination of Vs for low-moderate risk projects on sites without complex stratigraphy,
although the reliability of results should be evaluated and discrepancies further investigated or
discarded in situations such as the following:
• Where paired polarised results or results of different analysis methods diverge
significantly.
• Where results are benchmarked against other methods such as CPT and significant
unexplainable discrepancies are identified.
Refer to further discussion on this subject in the paper by Wahab and Clayton (2017).
7.2 Comparison of FOSliq and SUliq
Comparisons have been undertaken between CST, sDMT and CPT for FOSliq and Suliq for each
of the paired test locations.
0
5
10
15
20
25
0 0.5 1 1.5 2 2.5 3
Dep
th (
m)
MEVR
2a,2b,2c &2d -
Hinuera Formation
Alluvial Sand and Pumiceous gravels
0
5
10
15
20
25
0 0.5 1 1.5 2 2.5 3
Dep
th (
m)
MEVR
4C&5B - Walton
Subgroup, non-welded and
Clayton. P.J et al. (2017). Case study in the use of paleoliquefaction techniques to investigate liquefaction potential of Waikato soils for the Hamilton section of the Waikato expressway
6
7.2.1 Comparisons between CST, sDMT and CPT for FOSliq
The following general observations can be made:
• The variation between FOSliq between CST, sDMT & CPT is greater than the variation in
Vs noted in 6.1. This can be attributed to the nonlinearity of CRR with respect to Vs,
particularly at higher Vs.
• There appears to be a mismatch between the correlated Vs from CPT and the calculated
FOSliq. Where MEVR =1, FOSliq from Vs is > FOSliq from CPT.
7.2.2 Comparisons between CST, sDMT and CPT for Suliq.
The following general observations can be made:
• The variation in Suliq between CST, sDMT & CPT is relatively small in comparison to for
FOSliq, although in the case presented many of the data points derived from Vs would
be irrelevant form an engineering point of view as FOSliq>1.0
7.3 Comparison between Vs and CPT
Comparisons have also been undertaken to investigate how variations between measured and
correlated Vs (MEVR) vary between soil types, possible explanations for this variance are
provided.
7.3.1 Hinuera Formation MEVR
Fig 2a presents MEVR from CST and CPT vs depth. The MEVR plot shows three zones:
An upper zone (surface to 3m) where the MEVR is in the range of 0.8 to 1.5. This appears to
indicate the presence of a consistent ‘crust’ of high velocity material not recognised by the CPT.
This zone, potentially significant for the design of lightweight structures may result from a
number of possible mechanisms including negative pore pressure in the capillary zone or weak
cementation e.g. ‘limonite’ in aerobic zone.
An intermediate zone where the MEVR remains relatively constant at around 0.8 to 0.9. A MEVR
of 1.0 indicates an ideal Vs to CPTqc correlation, however with the correlation used in this study
(reference) the MEVR of young, shallow sandy soil deposits typically yield a MEVR in the 0.8
to 0.9 range and in fact a MEVR ratio in these soils (and for the correlation used) of 0.8 to 0.9
corresponds to a FOSliq ratio of around 1.
A deeper zone (10m to 20m) where the MEVR increases from around 0.9 to 1.5. The high MEVR
in this zone may result from a number of possible mechanisms including:
• Particle crushing during CPT probing. Noting that crushing is more likely under greater
confinement at depth.
• Older deposits at depth. Considered less likely as the Hinuera formation deposits are
relatively young and were emplaced relatively rapidly with deeper deposits not
significantly older.
7.3.2 Walton Subgroup MEVR.
Fig 3b presents MEVR from CST and CPT vs depth. The MEVR plot shows a range of 0.7 to 2.0
throughout but typically between 1.2 and 1.7. This relatively high MEVR may result from a
number of possible mechanisms including:
Clayton. P.J et al. (2017). Case study in the use of paleoliquefaction techniques to investigate liquefaction potential of Waikato soils for the Hamilton section of the Waikato expressway
7
• Aging effects - The Walton Subgroup has an age of 0.34 to1.8Ma. Based on Andrus et al,
(2009) this age might be expected to correlate to a MEVR of approximately 1.35 to 1.45
which is comparable to that observed.
• Particle crushing – Pumice is present within soil units 4C and 5B, but in no higher
concentrations that the Hinuera Unit 2 deposits discussed in 6.3.1 above, but which show
a significantly lower MEVR.
8 CONCLUSIONS
As part of the geotechnical investigation for the Hamilton section of the Waikato Expressway a
number of co-located crosshole (CST) and downhole (sDMT) shear wave velocity tests were
undertaken. The CST were undertaken to support the adoption of shear wave velocity based
liquefaction potential and liquefied shear strength assessment in the commonly pumiceous soils
present along the alignment. A paleoliquefaction study was also undertaken as part of the
validation of this approach, this study is documented separately in a companion paper. Having
ten co-located sets of CPT, CST & sDMT provided an opportunity to undertake a number of
comparisons. Initially we compared crosshole and downhole tests and found that results were
generally in good agreement which supports the ongoing use of downhole test methods for low
to moderate risk projects. The study then compared the Vs data from the CST to correlated Vs
from the co-located CPT, generating MEVR (measured to estimated velocity ratio) for individual
soil layers. Interpretation of the MEVR within the pumiceous comparatively young (circa 26ka)
Hinuera Formation has lead to the following conclusions:
• Within the Hinuera formation there appears to be a near surface zone or crust with elevated
MEVR. This zone is unlikely to differ significantly in composition from underlying soils,
partial crushing is therefore unlikely and the theory of superposition rules out aging
effects. Postulated causes include weak cementation (e.g. limonite) related to unsaturated
weathering or negative pore pressure within the partially saturated zone.
• Below the near surface zone to a depth of around 10m MEVR is low suggesting that particle
crushing or aging effects are negligible in this zone. FOSliq by Vs and CPT are similar
in this zone.
• Below a depth of around 10m MEVR increases. A possible explanation of this observation
is particle crushing increasing with the level of confinement. The age difference between
mid and lower Hinuera formation is considered unlikely to justify the observed increase
in MEVR.
The apparent potential for particle crushing at greater depths supports the use of shear wave
velocity based liquefaction assessment in these soils. The high MEVR within the significantly
older Walton Subgroup (0.34 to 1.8Ma) supports a conclusion that aging effects may be
significant for these soils and that the use of either an age correction factor with penetrometer
methods or where suitable data is available, direct shear wave velocity based liquefaction
assessment.
9 ACKNOWLEDGEMENTS
The authors wish to thank the New Zealand Transport Agency for their permission to publish this
paper and in particular the valuable contributions from Stuart Finlan. The authors would also like
to acknowledge The City Edge Alliance, the Project Geotechnical Steering Group, Beca
Clayton. P.J et al. (2017). Case study in the use of paleoliquefaction techniques to investigate liquefaction potential of Waikato soils for the Hamilton section of the Waikato expressway
8
colleagues and the significant contribution by Dylan Bai and Jamie Chen, who are currently
studying for a Bachelor’s of Engineering (Honours), at the University of Auckland.
REFERENCES
Andrus, R., Hayati, H., and Mohanan, N. (2009). Correcting Liquefaction Resistance for Aged
Sands Using Measured to Estimated Velocity Ratio. J. Geotech. Geoenviron.
Eng., 135(6), 735–744.
Boulanger, R. W., and Idriss, I. M. (2014). CPT and SPT based liquefaction triggering
procedures. Report No. UCD/CGM-14/01, Center for Geotechnical
Modeling, Department of Civil and Environmental Engineering, University of
California, Davis, CA, 134 pp.
Kayen, R., Moss R., Thompson E., Seed R., Cetin K., Der Kiureghian A., Tanaka Y., Tokimatsu,
K. (2013). Shearwave velocity–based probabilistic and deterministic
assessment of seismic soil liquefaction potential. J. Geotech. Geoenviron.
Eng., 139(3): 407–419.
Clayton, P.J., Yong, I., Green, R.A., Bastin, S.H., (2017). Case study in the use of
paleoliquefaction techniques to investigate liquefaction potential of Waikato
soils for the Hamilton section of the Waikato expressway Proceedings 29th
NZGS Geotechnical Symposium. Eds. GJ Alexander & CY Chin, Napier.
Clayton, P.J., Johnson,J.,T., (2013) Liquefaction Resistance and Possible Aging Effects in
Selected Pleistocene Soils of the Upper North Island Proc. 19th NZGS
Geotechnical Symposium, Queenstown.
Orense, R.P., Pender, M.J., (2013) Liquefaction characteristics of crushable pumice sand,
Proceeding of the 18th International Conference on Soil Mechanics and
Geotechnical Engineering. 2–6 September, Paris. pp 1559–1562
Özener, P., (2012). Estimation of residual shear strength ratios of liquefied soil deposits from
shear wave velocity. Earthquake Engineering and Engineering Vibration,
10.1007/s11803-012-0134-0, 461-484. Pender et al. (2013);
Wesley L.D., Meyer V. & Pender M.J. 1998. Cone penetrometer tests in pumice sand. NZ
Geomechanics News, June 1998, 57-61.
Wotherspoon LM, Cox BR, Stokoe II KH, Ashfield DJ, Phillips RA (2015): Utilizing direction-
push crosshole testing to assess the effectiveness of soil stiffening caused by
installation of stone columns and Rammed Aggregate Piers, 6th International
Conference on Earthquake Geotechnical Engineering, 1-4 November 2015,
Christchurch, New Zealand
Yong, I., Clayton, P.J., (2017). Application of soil specific correction factors for liquefaction
assessment: case study in Waikato soils for the Hamilton section of the
Waikato expressway. Proceedings 29th NZGS Geotechnical Symposium. Eds.
GJ Alexander & CY Chin, Napier.