Embed Size (px)
Citation preview
Instructional Design
Project Excel Pivot Table Lesson
By: Matt Goff
Submitted to: Dr. Yu-Hui Ching
7/29/2011
EdTech 503 (Summer 2011)
2
Table of Contents
Synthesis Reflection Paper ............................................................................................................. 4
Part 1. Topic .................................................................................................................................... 5
1a. Goal statement ..................................................................................................................... 5
1b. Audience description .......................................................................................................... 5
1c. Rationale .............................................................................................................................. 5
Part 2. Analysis Report ................................................................................................................... 6
2a1: Needs assessment survey .................................................................................................. 6
2a2: Needs assessment data ...................................................................................................... 6
2b1: Learning context description ........................................................................................... 8
2b2: Transfer context description ........................................................................................... 9
2c: Description of Learners ...................................................................................................... 9
2d: Task Analysis Flow Chart ............................................................................................... 11
Part 3. Planning ............................................................................................................................. 13
3a: List of instructional objectives......................................................................................... 13
3b: Objectives matrix table .................................................................................................... 13
3c: ARCS Table ....................................................................................................................... 14
Part 4. Instructor Guide ................................................................................................................. 16
Introduction ............................................................................................................................. 16
Body .......................................................................................................................................... 16
Conclusion ............................................................................................................................... 17
Conduct Assessment ............................................................................................................... 17
Part 5. Learner Content ................................................................................................................. 18
5a: Learning materials ........................................................................................................... 18
5b: Assessment materials ....................................................................................................... 22
5c: Technology tool rationale ................................................................................................. 23
Part 6: Formative Evaluation Plan ................................................................................................ 23
6a: Expert Review Plan .......................................................................................................... 23
6b: One-to-One Evaluation .................................................................................................... 24
6c: Small Group Evaluation ................................................................................................... 24
6d: Field Trial .......................................................................................................................... 25
Part 7. Formative Evaluation Report ............................................................................................ 25

3
7a: Evaluation survey ............................................................................................................. 25
7b: Report of expert review ................................................................................................... 26
7c: Designer’s response to review .......................................................................................... 26
Part 8. Standards Grid ................................................................................................................... 27
Professional Standards Addressed (AECT) ......................................................................... 27
References ..................................................................................................................................... 33

4
Synthesis Reflection Paper
I have discovered Instructional Design (ID) is more than simply planning out and putting
together learning materials. At first, I was surprised at how involved the design process really is.
I knew the process was important, but I had no idea of the level of detail required for a well-
designed lesson. In the past, I just “knew” what to do and created the material for the lesson.
Now, I “know” better. I am also grateful to my peers for reviewing my work and providing
helpful feedback. ID is like building a house. You have to have a strong and expansive
foundation in place before you begin erecting the framework of the walls, the trusses, and other
structural components. There must also be a plan laying out the order in which the parts are
assembled.
I had designed lessons and courses before, but I used pre-developed procedures that
allowed me to do course design at an accelerated rate. This course has made me appreciate the
effort in developing those procedures. It is important to truly understand the learning goals and
the desired outcomes before you begin developing learning materials. I also appreciate the
personalized approach needed to address different learning styles. One must understand the
learners before they can create curriculum. Establishing a need for instruction sounds obvious,
but in reality, there is much more to discovering that need than simply making the decision to
proceed. Knowing who the stakeholders are and the purpose of the instruction is paramount.
I learned about who instructional designers are and what important knowledge they must
have to be successful. As I worked through each step of this project, I started to realize I may
want to continue on an instructional design track. I spent many years in business and I have
always enjoyed project management. Instructional design is no different than any of the project
management models I have encountered. There is usually an analysis, a design, a development,
an implementation, and an evaluation phase in any well designed project. Each phase in the
instructional design process is interdependent. Each phase should also be conducted in order.
Skipping a step may lead to time-consuming mistakes. I also learned the framework of
instructional design relies on more than just cookie cutter processes. Building a house doesn’t
just require knowledge about construction, but also about wiring, plumbing, painting, and other
specialized skills. The same can be said for instructional design. It relies on communication,
systems, learning, developmental, and instructional theories (Smith and Ragan, 2005, p.33).
This project is just one of many opportunities for me to hone my new skills learned in
this class. Going forward, I plan to apply this knowledge to my professional career as an
educator. In fact there is a strong possibility I may become a designer, or a distance education
specialist, or an academic project manager. All of these positions are appealing to me. In the
meantime, I plan to incorporate what I have learned into my online classrooms. This course has
taught me how to look at my own lessons more objectively. I have already started the process of
redesigning many of the lessons in my courses. Eventually, I will take on the task of
restructuring the courses themselves in an effort to capture the attention and sustain the interests
of my students. I may have to wait until I am finished with the MIT program though. There is no
doubt I still have much more to learn and if I make changes too early I will find myself in a
continuous redevelopment phase.
Reference: Smith, P. L. & Ragan, T. J. (2005). Instructional Design: Third Edition. Hoboken, NJ:
John Wiley & Sons, Inc.
5
Part 1. Topic
1a. Goal statement
Given a set of data, learners will synthesize the data using the pivot table function in Excel and
present the results in a chart.
1b. Audience description
The learners are second year community college students predominantly comprised of students
on track to earn an associate degree in business or paralegal studies who are enrolled in a
Computers in Business online course. The course focuses on intermediate skills in the use and
integration of the Microsoft Office application software.
1c. Rationale
Many businesses and legal organizations maintain records and process large amounts of data.
Microsoft Excel is a popular software application used to manage these records and data. Most
employers express great value in having their employees proficient in the use of this software.
The Computers in Business course addresses the needs of local businesses and legal
organizations by preparing students for employment. It also satisfies the degree requirements of
graduating business and paralegal students.
The creation and use of pivot tables is one of the more useful tools in managing data and
presenting information with Excel. Pivot tables allow for easy isolation and querying of
extensive amounts of data. Users are able to geographically switch the placement of rows and
columns of data into more discernable categories and subcategories. From those categories, users
can create useful reports or identify trends and patterns from the creation of customized charts.
The overall instruction strategy is approximately 90% supplantive even though the students are
typically generative. Online learners are normally highly motivated and are comfortable with
technology. These particular learners have ample prior computer knowledge before enrolling in
the course and they are generally in charge of their own learning. Online instructors are normally
more of a facilitator of knowledge rather than a giver of knowledge.
The course subject matter is broken down into manageable tasks and is specific to the skills
needed for employment. A certain level of mastery is required and the goals are pretty uniform.
This course will utilize procedural instructional strategies because the goal of the instruction is to
teach the learner the procedures involved in creating a pivot table, synthesize it, and present the
results in a chart.
6
Part 2. Analysis Report
2a1: Needs assessment survey
Before a student can take this course, they must meet certain requirements. Those requirements
include being a second-year student with substantial business and computer knowledge. They
must also have a computer or have access to one. However, if there were qualifying questions to
be asked about the lesson, the following would be considered:
What is your comfort level with an online class?
What activities do you feel you learn best in an online course?
Why did you take the course online rather than face-to-face?
How comfortable are you using Microsoft Excel?
What is your understanding of what a pivot table does and is used for?
Have you used a pivot table before?
What is your comfort level with using pivot tables?
How much experience do you have using computers and Microsoft Office applications?
What motivated you to take the course, to learn Excel, and to use pivot tables?
What do you hope to gain by learning this lesson?
How soon before you will apply this skill?
Basic questions would be:
Do you have a computer with the appropriate input and output devices?
Does the computer have the required software and connection to the internet?
I am not allowed to ask students about disabilities unless they disclose the disability to me or the
Disability Services.
The course itself is required for students hoping to graduate with a business, management, or
paralegal degree. This is required by articulation agreements with other colleges in the state. A
business advisory committee and a paralegal advisory committee made up of local professionals
also advised the course should be in the curriculum.
2a2: Needs assessment data
The lesson on pivot tables fits the course outcomes and meets the needs of students. Instead of a
needs assessment survey, supportive information was gathered from a forum. Students
participated in a form that required they watch a stock screencast video about pivot tables. The
students were encouraged to discuss the video and whether they might use this skill. The students
expressed a great deal of interest in the lesson. They felt this skill would be valuable and very
useful. A couple students felt a step-by-step assignment would be very interesting and beneficial.
7
The forum posts (written verbatim from students) are as follows:
1. I would use these in a presentation of a company; it would be great in monthly, quarterly,
yearly reports to keep the some uniform reports.
2. The pivot table seems like a great tool. As an accounting student, I find this to be
valuable.
3. The pivot table gives the user the ability to look at the same data in different ways,
something I think limits Access, because once entered in Access, it’s difficult to change
(at least for me it was). The pivot table would be useful when you need to present a
portion or another view of relevant information. For example: in Unit D, we created a
worksheet in Excel displaying revenue and expenses. The pivot table would allow the
user to select the fields that would be pertinent to the presentation.
4. They pivot tables would have been an interesting assignment, and I think they would be
very useful for the compilation and compare of data - especially in companies that have
many offices and branches.
5. I agree, these probably would have been interesting assignments to do. I am very glad
that we have the whole week to work on our projects though, and we could always do one
of the assignments out of the book just to get a more hands-on feel for these features. I
might do that when I have a little more free time, I actually enjoyed doing the step-by-
step projects. Have a good summer!
6. I agree that the video's were a little difficult to understand as well, but it definitely easier
to do it rather than to watch a video on how to do it. the impression that I got is that a
pivot table is quite similar to a query. It would have been easier to learn in a step by step
assignment.
7. Implementing the use of a pivot table would definitely be valuable when working with a
large amount of data. It looks as if it expedites the entire process by focusing on just one
field, if that’s what your intentions are. And like the video stated, it will definitely assist
you in recognizing the trends of the data. Personally, this would be ideal for yearly sales
report.
8. You would use a pivot table if you had a really large amount of data and you needed to
rearrange the information in order to see it in a different order. Pivot tables can also help
if you want to compare certain categories of information to others without having to
scroll through all of the information to find it. I would definitely find a use for this at my
job.
9. I would use a pivot table to analyze a large volume of legal cases. This would be a great
tool for seeing what types of cases are won/lost the most/least, in what states, by male or
female attorneys, etc.
10. After watching the video on pivot tables, I think that this type of table would be good for
a large corporation that has offices in many cities and states. It would allow them to keep
track of all financial and other relevant data for each branch office and be able to
8
compare them with the same data from other branch offices. Pivot tables would also be
useful for preparing any type of financial reports, especially end of the year reports. I
would rather have done an assignment on pivot tables than the lookup table. It looked
harder.
11. I've never used a pivot table before but it looks like it would simplify finding complicated
information and putting it into a table. I could use this for my grandmothers store to
show her the inventory she's sold and the revenue from it.
12. I would use the pivot table to easily run reports on the different clients we have in the law
firm I work for. We practice criminal, juvenile and federal law. We also have cases that
are assigned to us through the state and retained cases. This would be very useful to be
able to run a report for all the different categories of cases we handle.
13. Pivot Tables-Wow, this will help so much when creating inventory. I also like that if you
own multiple businesses this tool will help to combine info from all the locations. This is
really neat and is another tool that would have been nice to learn more about. I am
excited to try it.
2b1: Learning context description
The teacher is very committed and dedicated to the learners. The teacher is open to all forms of
instruction, especially online education. The teacher is enthusiastic about the subject matter and
the lesson. This lesson curriculum is a “learn by doing” practicum and it fits with the teacher’s
teaching style. There will be step-by-step instructions, screen capture examples, and a screencast
tutorial.
The learners are required to have access to a suitable computer and a high-speed internet
connection. Students are also required to have the Microsoft Windows version of the Microsoft
Office Professional application software installed on their computer. The MAC version does not
have the capabilities required for the course. The 2010 version of the application software is
preferred, but the 2007 version will suffice. On campus computer labs are available with suitable
computers and software if students do not have personal access to the required hardware and
software.
This lesson is offered in an online course using Angel course management software. The course
is four credit hours and is presented in ten week terms. It is offered in the fall and in the spring.
There is also a face-to-face version of the course offered only in the fall. The spring course was
added due to increasing demand from the paralegal program. There was a large push to make the
paralegal program completely online and that was a major contributor to the creation of the
online course.
The learners are required to take the course in order to fulfill their degree requirements. The
majority of the students are attending college to obtain job skills or improve their education to
assist them when seeking employment. Just over 2% of the students are transferring to a four-
year college or university. There were 141 students enrolled in the course over the last two years.
9
31.4%
7.3% 38.7%
8.0%
14.6%
Students
Accounting
General Ed
Management
Marketing
Paralegal
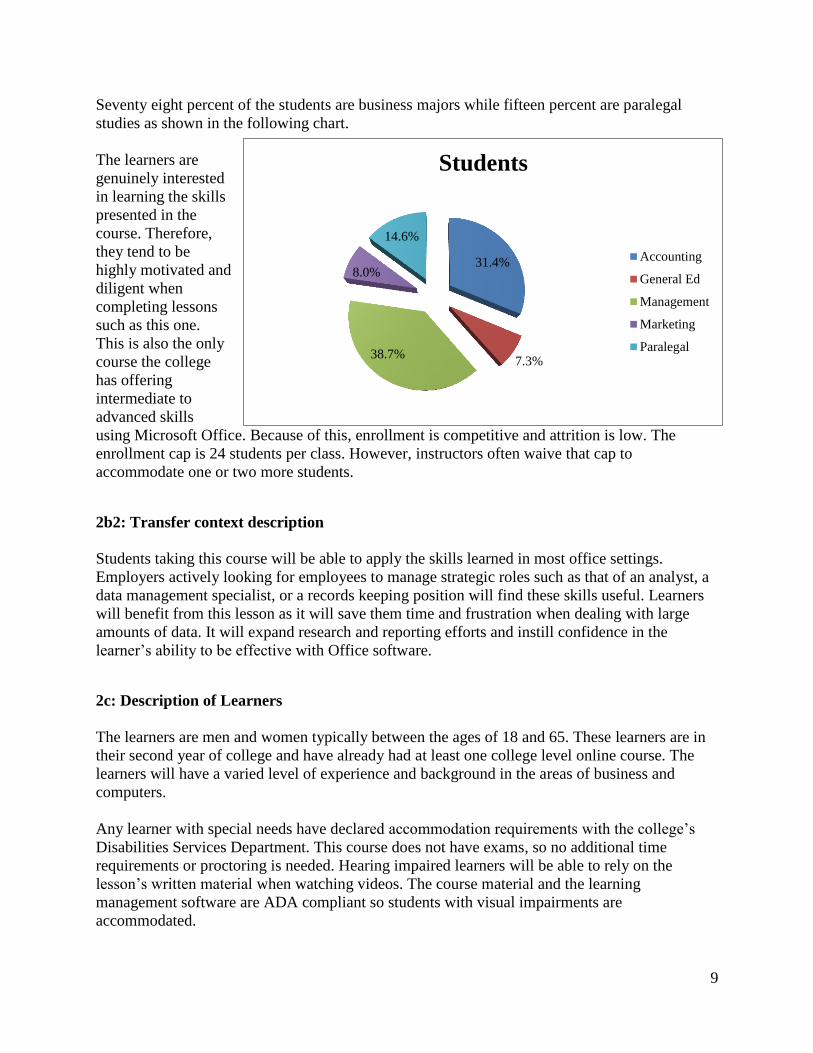
Seventy eight percent of the students are business majors while fifteen percent are paralegal
studies as shown in the following chart.
The learners are
genuinely interested
in learning the skills
presented in the
course. Therefore,
they tend to be
highly motivated and
diligent when
completing lessons
such as this one.
This is also the only
course the college
has offering
intermediate to
advanced skills
using Microsoft Office. Because of this, enrollment is competitive and attrition is low. The
enrollment cap is 24 students per class. However, instructors often waive that cap to
accommodate one or two more students.
2b2: Transfer context description
Students taking this course will be able to apply the skills learned in most office settings.
Employers actively looking for employees to manage strategic roles such as that of an analyst, a
data management specialist, or a records keeping position will find these skills useful. Learners
will benefit from this lesson as it will save them time and frustration when dealing with large
amounts of data. It will expand research and reporting efforts and instill confidence in the
learner’s ability to be effective with Office software.
2c: Description of Learners
The learners are men and women typically between the ages of 18 and 65. These learners are in
their second year of college and have already had at least one college level online course. The
learners will have a varied level of experience and background in the areas of business and
computers.
Any learner with special needs have declared accommodation requirements with the college’s
Disabilities Services Department. This course does not have exams, so no additional time
requirements or proctoring is needed. Hearing impaired learners will be able to rely on the
lesson’s written material when watching videos. The course material and the learning
management software are ADA compliant so students with visual impairments are
accommodated.
10
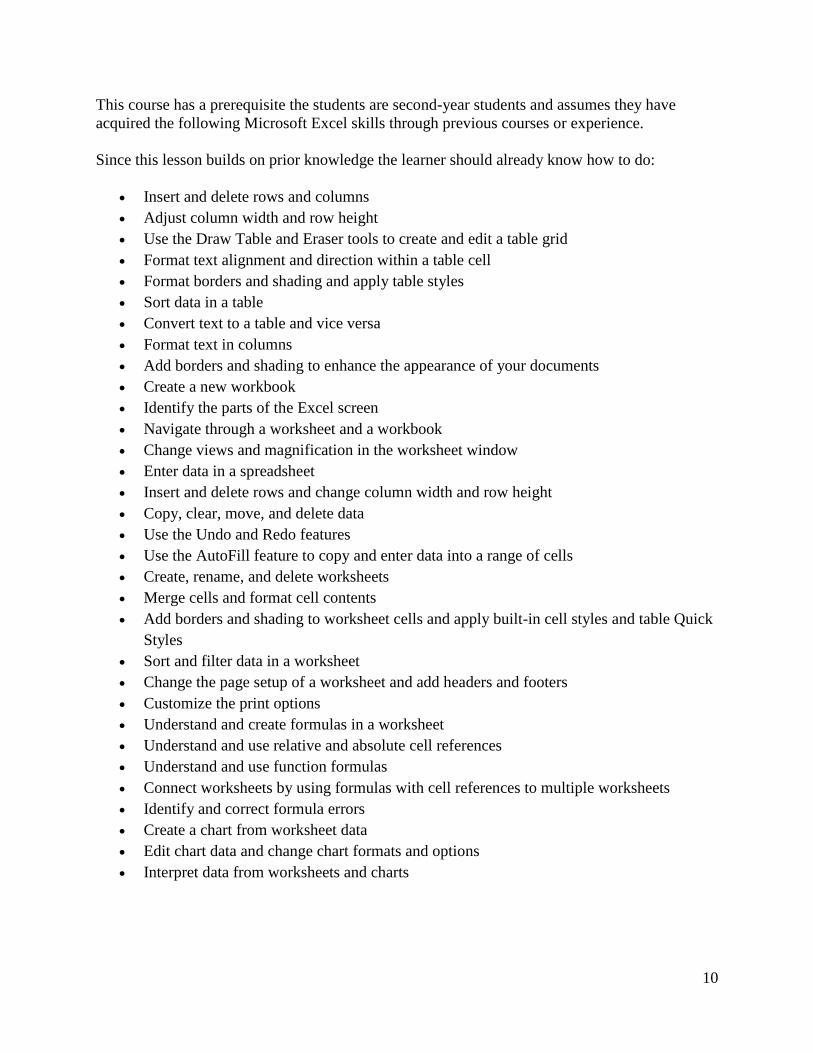
This course has a prerequisite the students are second-year students and assumes they have
acquired the following Microsoft Excel skills through previous courses or experience.
Since this lesson builds on prior knowledge the learner should already know how to do:
Insert and delete rows and columns
Adjust column width and row height
Use the Draw Table and Eraser tools to create and edit a table grid
Format text alignment and direction within a table cell
Format borders and shading and apply table styles
Sort data in a table
Convert text to a table and vice versa
Format text in columns
Add borders and shading to enhance the appearance of your documents
Create a new workbook
Identify the parts of the Excel screen
Navigate through a worksheet and a workbook
Change views and magnification in the worksheet window
Enter data in a spreadsheet
Insert and delete rows and change column width and row height
Copy, clear, move, and delete data
Use the Undo and Redo features
Use the AutoFill feature to copy and enter data into a range of cells
Create, rename, and delete worksheets
Merge cells and format cell contents
Add borders and shading to worksheet cells and apply built-in cell styles and table Quick
Styles
Sort and filter data in a worksheet
Change the page setup of a worksheet and add headers and footers
Customize the print options
Understand and create formulas in a worksheet
Understand and use relative and absolute cell references
Understand and use function formulas
Connect worksheets by using formulas with cell references to multiple worksheets
Identify and correct formula errors
Create a chart from worksheet data
Edit chart data and change chart formats and options
Interpret data from worksheets and charts
11
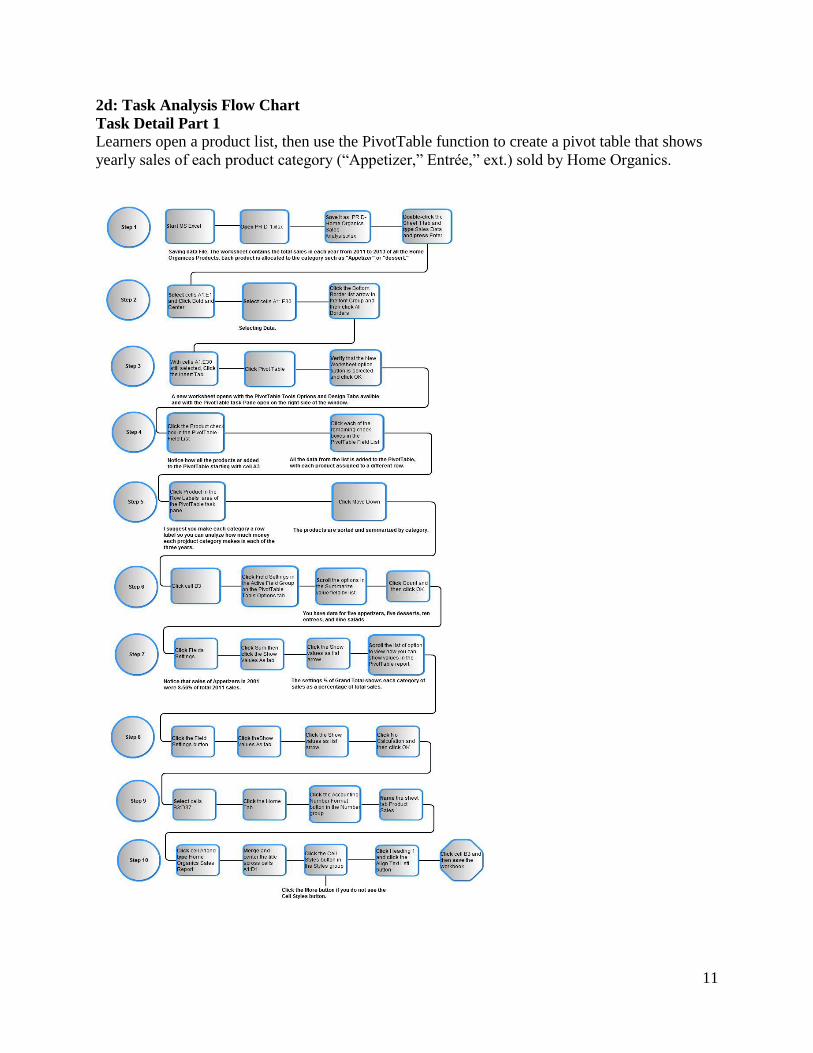
2d: Task Analysis Flow Chart
Task Detail Part 1
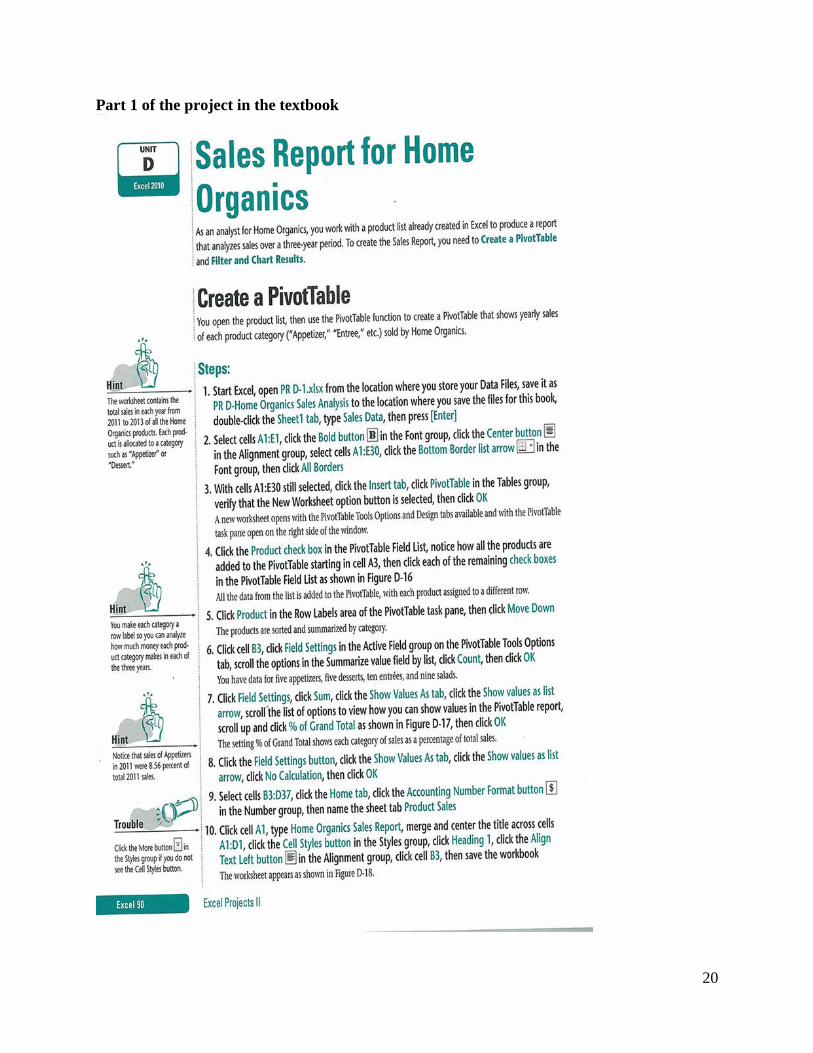
Learners open a product list, then use the PivotTable function to create a pivot table that shows
yearly sales of each product category (“Appetizer,” Entrée,” ext.) sold by Home Organics.
12
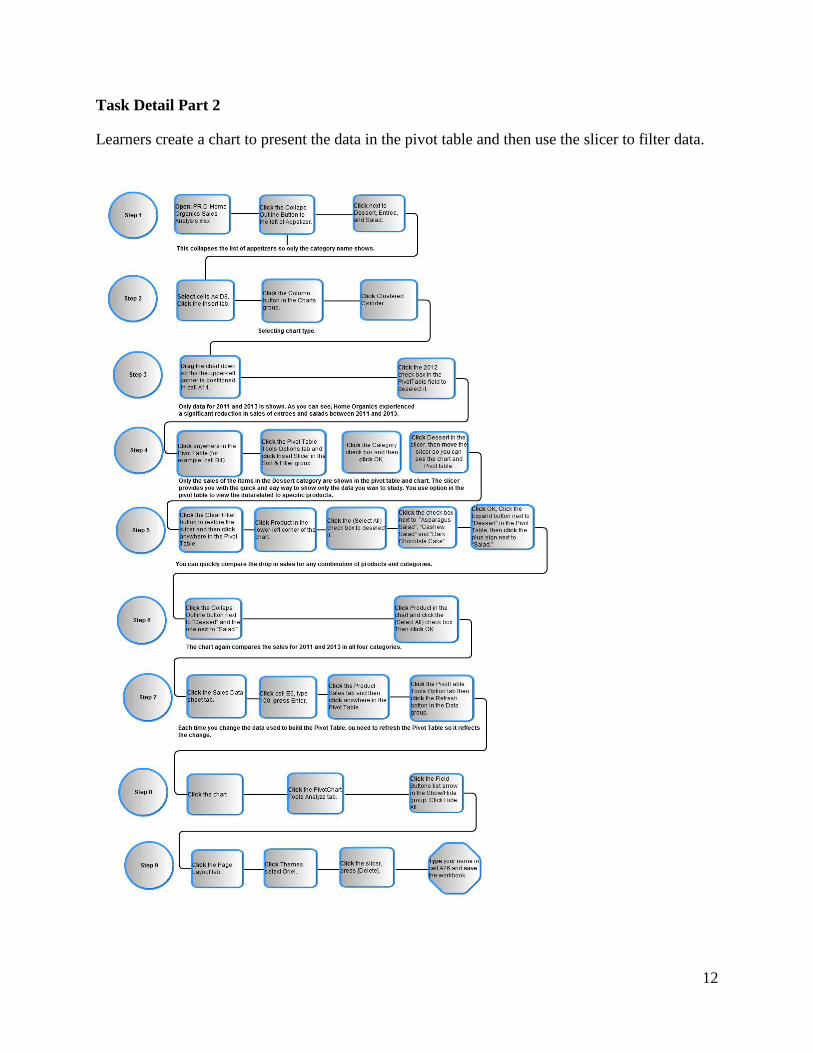
Task Detail Part 2
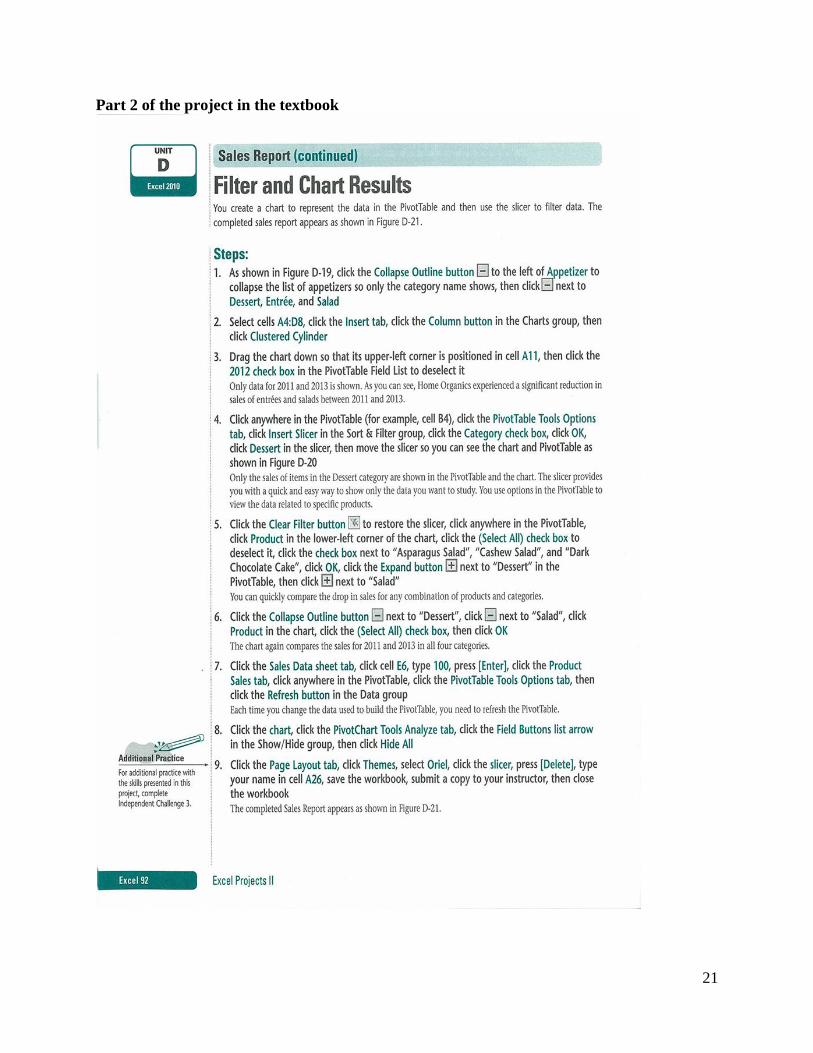
Learners create a chart to present the data in the pivot table and then use the slicer to filter data.
13
Part 3. Planning
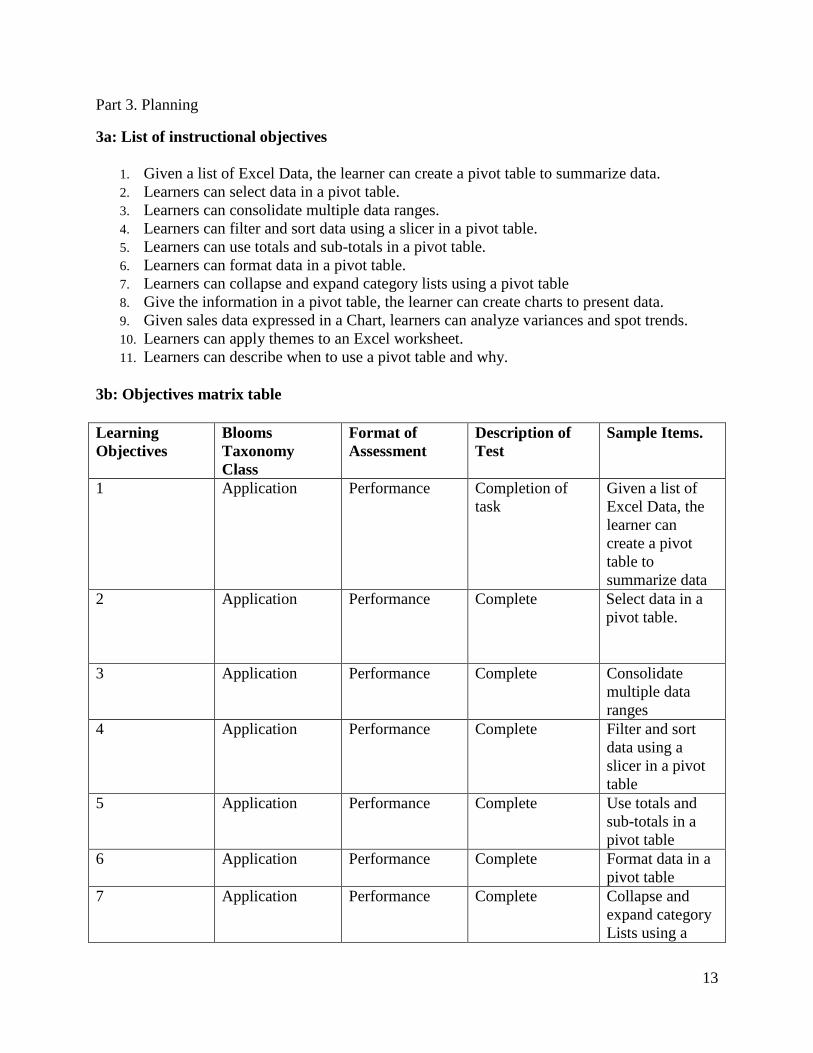
3a: List of instructional objectives
1. Given a list of Excel Data, the learner can create a pivot table to summarize data.
2. Learners can select data in a pivot table.
3. Learners can consolidate multiple data ranges.
4. Learners can filter and sort data using a slicer in a pivot table.
5. Learners can use totals and sub-totals in a pivot table.
6. Learners can format data in a pivot table.
7. Learners can collapse and expand category lists using a pivot table
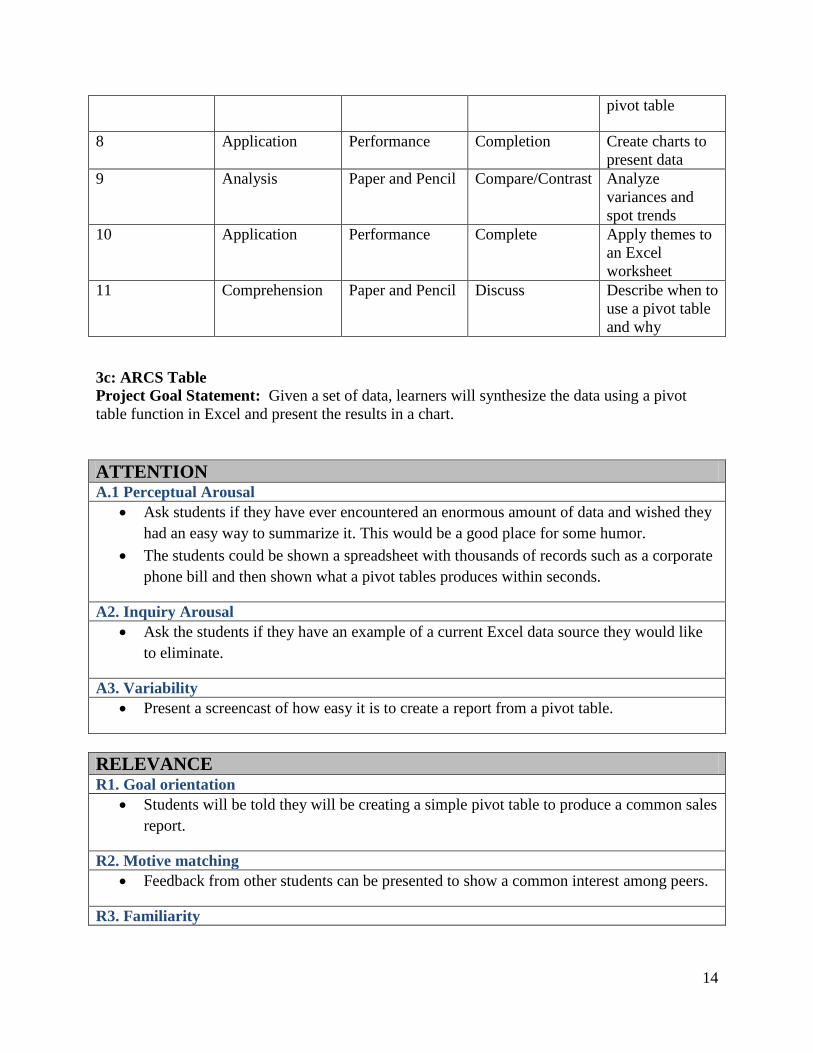
8. Give the information in a pivot table, the learner can create charts to present data.
9. Given sales data expressed in a Chart, learners can analyze variances and spot trends.
10. Learners can apply themes to an Excel worksheet.
11. Learners can describe when to use a pivot table and why.
3b: Objectives matrix table
Learning
Objectives
Blooms
Taxonomy
Class
Format of
Assessment
Description of
Test
Sample Items.
1 Application Performance Completion of
task
Given a list of
Excel Data, the
learner can
create a pivot
table to
summarize data
2 Application Performance Complete Select data in a
pivot table.
3 Application Performance Complete Consolidate
multiple data
ranges
4 Application Performance Complete Filter and sort
data using a
slicer in a pivot
table
5 Application Performance Complete Use totals and
sub-totals in a
pivot table
6 Application Performance Complete Format data in a
pivot table
7 Application Performance Complete Collapse and
expand category
Lists using a
14
pivot table
8 Application Performance Completion Create charts to
present data
9 Analysis Paper and Pencil Compare/Contrast Analyze
variances and
spot trends
10 Application Performance Complete Apply themes to
an Excel
worksheet
11 Comprehension Paper and Pencil Discuss Describe when to
use a pivot table
and why
3c: ARCS Table
Project Goal Statement: Given a set of data, learners will synthesize the data using a pivot
table function in Excel and present the results in a chart.
ATTENTION A.1 Perceptual Arousal
Ask students if they have ever encountered an enormous amount of data and wished they
had an easy way to summarize it. This would be a good place for some humor.
The students could be shown a spreadsheet with thousands of records such as a corporate
phone bill and then shown what a pivot tables produces within seconds.
A2. Inquiry Arousal
Ask the students if they have an example of a current Excel data source they would like
to eliminate.
A3. Variability
Present a screencast of how easy it is to create a report from a pivot table.
RELEVANCE R1. Goal orientation
Students will be told they will be creating a simple pivot table to produce a common sales
report.
R2. Motive matching
Feedback from other students can be presented to show a common interest among peers.
R3. Familiarity
15
Relate the lesson to previous lessons they have already completed.
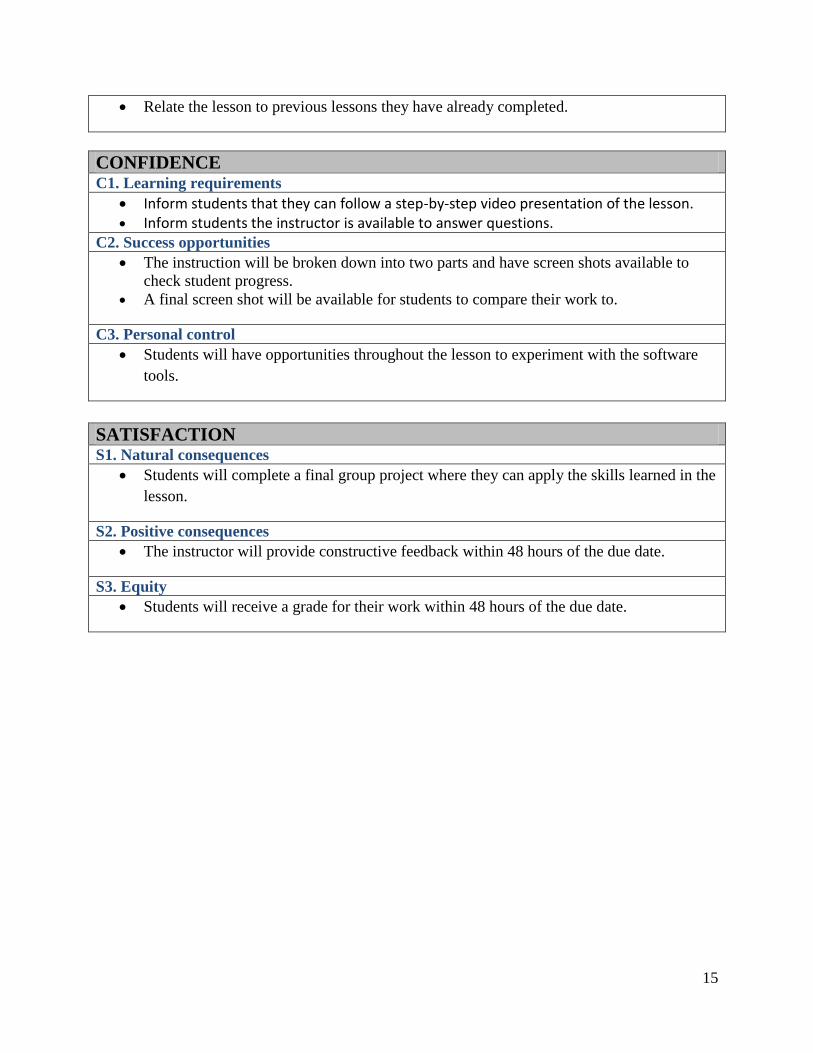
CONFIDENCE C1. Learning requirements
Inform students that they can follow a step-by-step video presentation of the lesson. Inform students the instructor is available to answer questions.
C2. Success opportunities
The instruction will be broken down into two parts and have screen shots available to
check student progress.
A final screen shot will be available for students to compare their work to.
C3. Personal control
Students will have opportunities throughout the lesson to experiment with the software
tools.
SATISFACTION S1. Natural consequences
Students will complete a final group project where they can apply the skills learned in the
lesson.
S2. Positive consequences
The instructor will provide constructive feedback within 48 hours of the due date.
S3. Equity
Students will receive a grade for their work within 48 hours of the due date.
16
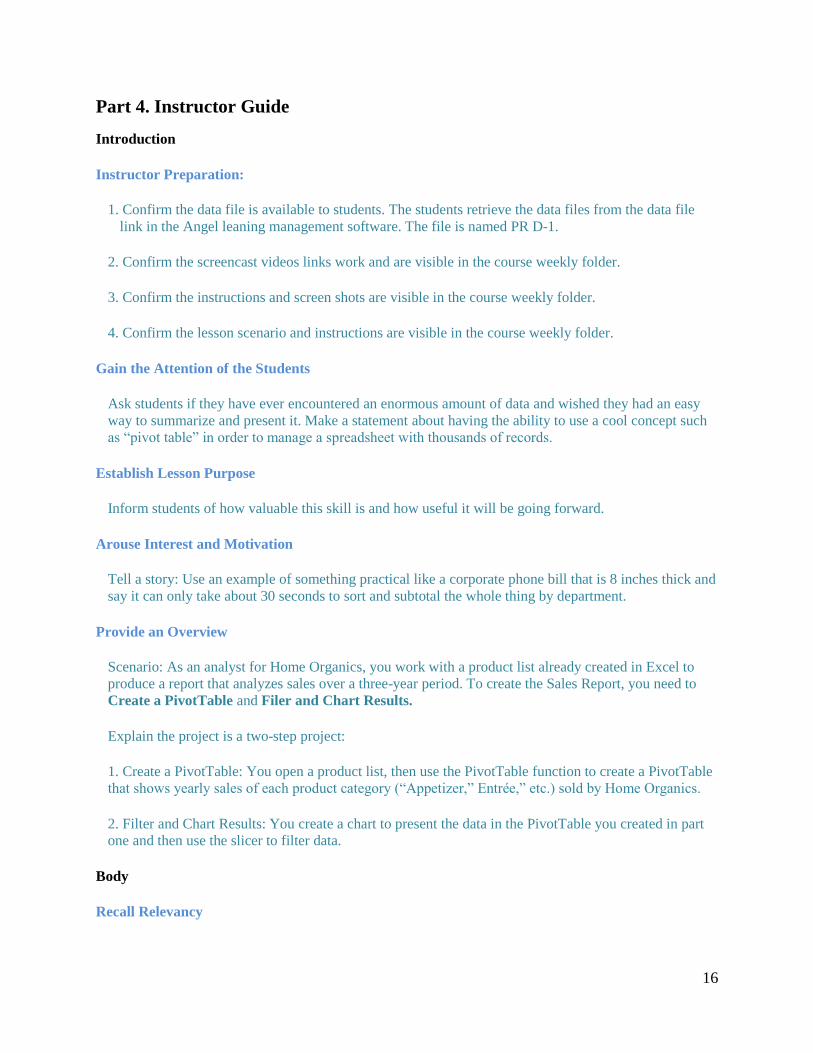
Part 4. Instructor Guide
Introduction
Instructor Preparation:
1. Confirm the data file is available to students. The students retrieve the data files from the data file
link in the Angel leaning management software. The file is named PR D-1.
2. Confirm the screencast videos links work and are visible in the course weekly folder.
3. Confirm the instructions and screen shots are visible in the course weekly folder.
4. Confirm the lesson scenario and instructions are visible in the course weekly folder.
Gain the Attention of the Students
Ask students if they have ever encountered an enormous amount of data and wished they had an easy
way to summarize and present it. Make a statement about having the ability to use a cool concept such
as “pivot table” in order to manage a spreadsheet with thousands of records.
Establish Lesson Purpose
Inform students of how valuable this skill is and how useful it will be going forward.
Arouse Interest and Motivation
Tell a story: Use an example of something practical like a corporate phone bill that is 8 inches thick and
say it can only take about 30 seconds to sort and subtotal the whole thing by department.
Provide an Overview
Scenario: As an analyst for Home Organics, you work with a product list already created in Excel to
produce a report that analyzes sales over a three-year period. To create the Sales Report, you need to
Create a PivotTable and Filer and Chart Results.
Explain the project is a two-step project:
1. Create a PivotTable: You open a product list, then use the PivotTable function to create a PivotTable
that shows yearly sales of each product category (“Appetizer,” Entrée,” etc.) sold by Home Organics.
2. Filter and Chart Results: You create a chart to present the data in the PivotTable you created in part
one and then use the slicer to filter data.
Body
Recall Relevancy
17
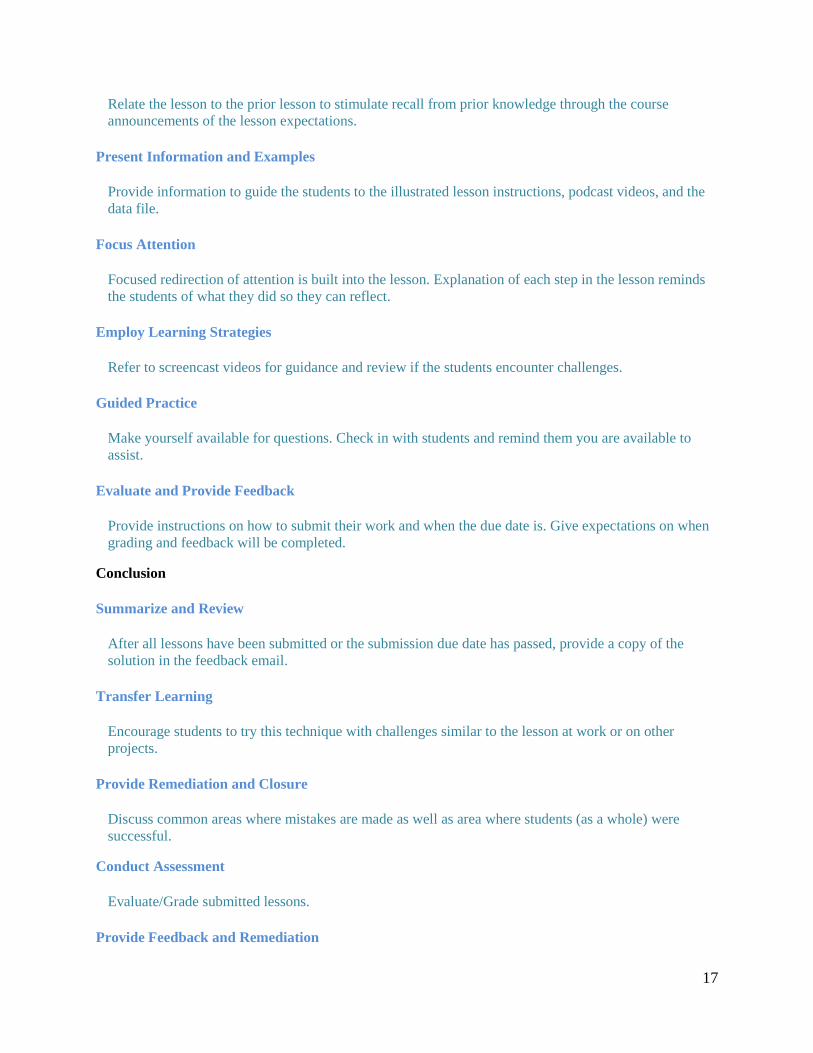
Relate the lesson to the prior lesson to stimulate recall from prior knowledge through the course
announcements of the lesson expectations.
Present Information and Examples
Provide information to guide the students to the illustrated lesson instructions, podcast videos, and the
data file.
Focus Attention
Focused redirection of attention is built into the lesson. Explanation of each step in the lesson reminds
the students of what they did so they can reflect.
Employ Learning Strategies
Refer to screencast videos for guidance and review if the students encounter challenges.
Guided Practice
Make yourself available for questions. Check in with students and remind them you are available to
assist.
Evaluate and Provide Feedback
Provide instructions on how to submit their work and when the due date is. Give expectations on when
grading and feedback will be completed.
Conclusion
Summarize and Review
After all lessons have been submitted or the submission due date has passed, provide a copy of the
solution in the feedback email.
Transfer Learning
Encourage students to try this technique with challenges similar to the lesson at work or on other
projects.
Provide Remediation and Closure
Discuss common areas where mistakes are made as well as area where students (as a whole) were
successful.
Conduct Assessment
Evaluate/Grade submitted lessons.
Provide Feedback and Remediation
18
Provide feedback with details on what was missed, suggestions on how to do it correctly, and what the
correct result is.
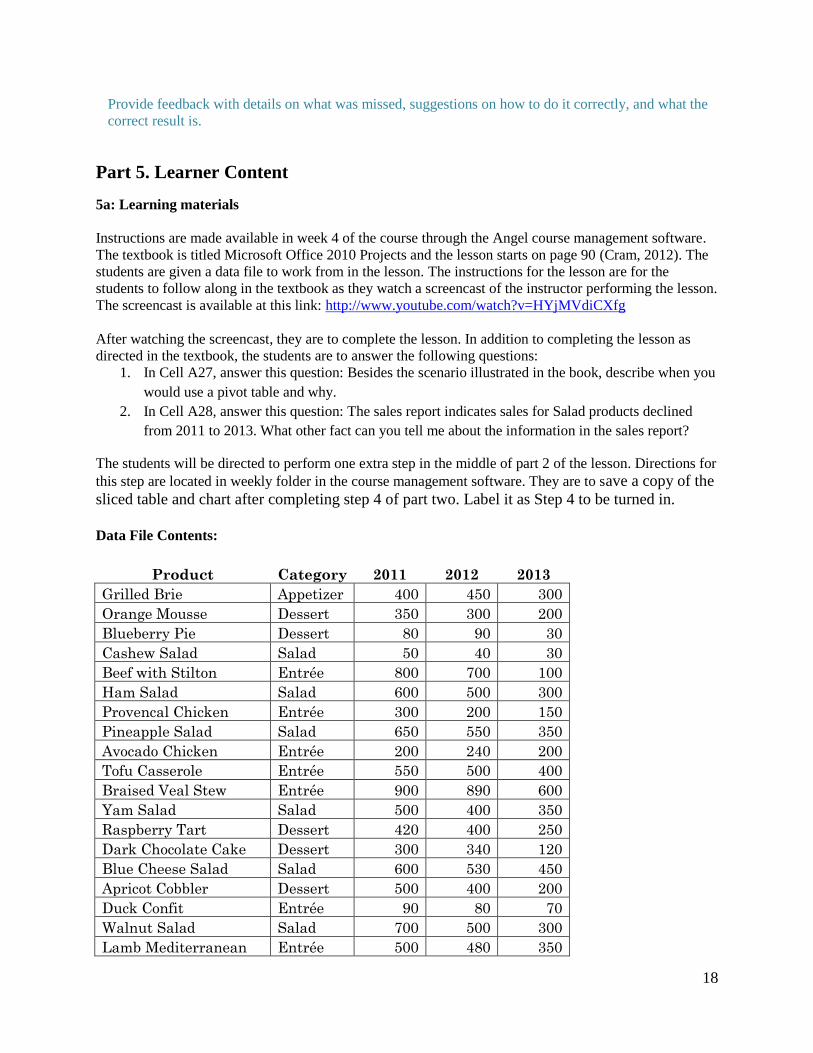
Part 5. Learner Content
5a: Learning materials
Instructions are made available in week 4 of the course through the Angel course management software.
The textbook is titled Microsoft Office 2010 Projects and the lesson starts on page 90 (Cram, 2012). The
students are given a data file to work from in the lesson. The instructions for the lesson are for the
students to follow along in the textbook as they watch a screencast of the instructor performing the lesson.
The screencast is available at this link: http://www.youtube.com/watch?v=HYjMVdiCXfg
After watching the screencast, they are to complete the lesson. In addition to completing the lesson as
directed in the textbook, the students are to answer the following questions:
1. In Cell A27, answer this question: Besides the scenario illustrated in the book, describe when you
would use a pivot table and why.
2. In Cell A28, answer this question: The sales report indicates sales for Salad products declined
from 2011 to 2013. What other fact can you tell me about the information in the sales report?
The students will be directed to perform one extra step in the middle of part 2 of the lesson. Directions for
this step are located in weekly folder in the course management software. They are to save a copy of the
sliced table and chart after completing step 4 of part two. Label it as Step 4 to be turned in.
Data File Contents:
Product Category 2011 2012 2013
Grilled Brie Appetizer 400 450 300
Orange Mousse Dessert 350 300 200
Blueberry Pie Dessert 80 90 30
Cashew Salad Salad 50 40 30
Beef with Stilton Entrée 800 700 100
Ham Salad Salad 600 500 300
Provencal Chicken Entrée 300 200 150
Pineapple Salad Salad 650 550 350
Avocado Chicken Entrée 200 240 200
Tofu Casserole Entrée 550 500 400
Braised Veal Stew Entrée 900 890 600
Yam Salad Salad 500 400 350
Raspberry Tart Dessert 420 400 250
Dark Chocolate Cake Dessert 300 340 120
Blue Cheese Salad Salad 600 530 450
Apricot Cobbler Dessert 500 400 200
Duck Confit Entrée 90 80 70
Walnut Salad Salad 700 500 300
Lamb Mediterranean Entrée 500 480 350

19
Olive Salad Salad 600 590 420
Smoked Salmon Wrap Appetizer 220 280 90
Mahi Mahi Entrée 400 500 200
Asparagus Salad Salad 400 300 100
Roast Chicken Entrée 350 200 90
Kale Salad Salad 120 100 30
Pork with Grapefruit Entrée 290 250 200
Leek Fritters Appetizer 100 60 40
Quince Pate Appetizer 90 80 40
Parmesan Mushrooms Appetizer 150 120 60
20
Part 1 of the project in the textbook
21
Part 2 of the project in the textbook
22
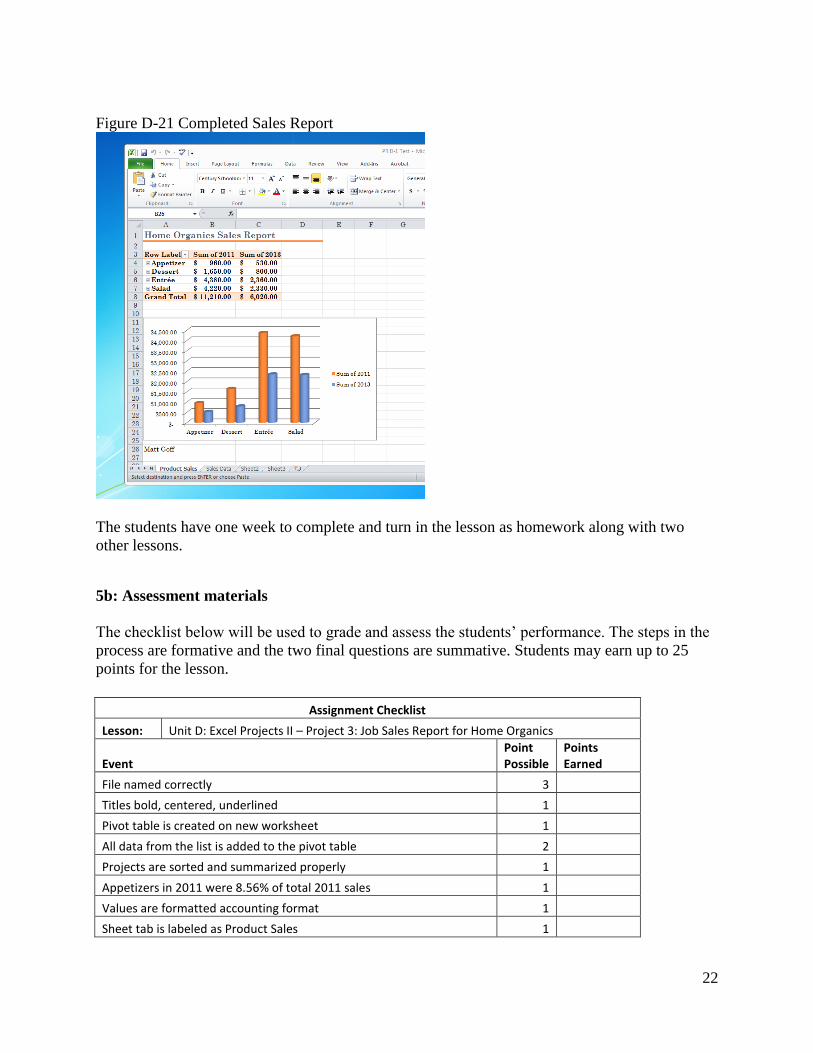
Figure D-21 Completed Sales Report
The students have one week to complete and turn in the lesson as homework along with two
other lessons.
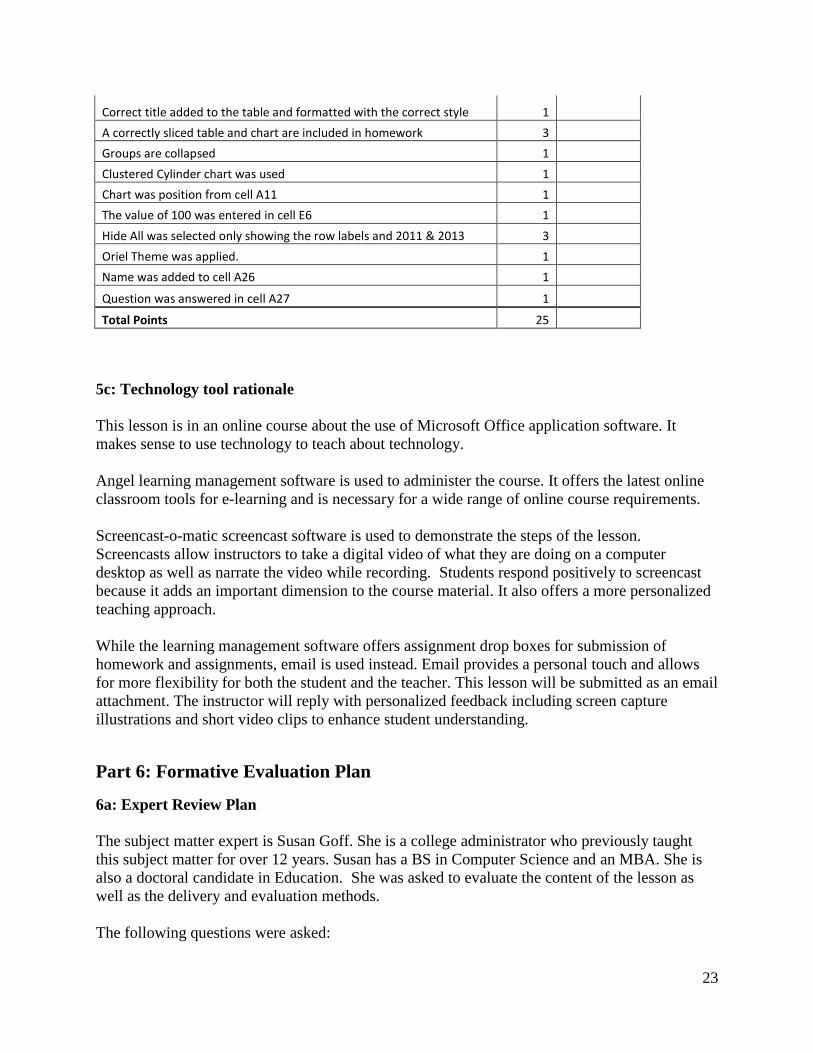
5b: Assessment materials
The checklist below will be used to grade and assess the students’ performance. The steps in the
process are formative and the two final questions are summative. Students may earn up to 25
points for the lesson.
Assignment Checklist
Lesson: Unit D: Excel Projects II – Project 3: Job Sales Report for Home Organics
Event Point Possible
Points Earned
File named correctly 3
Titles bold, centered, underlined 1
Pivot table is created on new worksheet 1
All data from the list is added to the pivot table 2
Projects are sorted and summarized properly 1
Appetizers in 2011 were 8.56% of total 2011 sales 1
Values are formatted accounting format 1
Sheet tab is labeled as Product Sales 1
23
Correct title added to the table and formatted with the correct style 1
A correctly sliced table and chart are included in homework 3
Groups are collapsed 1
Clustered Cylinder chart was used 1
Chart was position from cell A11 1
The value of 100 was entered in cell E6 1
Hide All was selected only showing the row labels and 2011 & 2013 3
Oriel Theme was applied. 1
Name was added to cell A26 1
Question was answered in cell A27 1
Total Points 25
5c: Technology tool rationale
This lesson is in an online course about the use of Microsoft Office application software. It
makes sense to use technology to teach about technology.
Angel learning management software is used to administer the course. It offers the latest online
classroom tools for e-learning and is necessary for a wide range of online course requirements.
Screencast-o-matic screencast software is used to demonstrate the steps of the lesson.
Screencasts allow instructors to take a digital video of what they are doing on a computer
desktop as well as narrate the video while recording. Students respond positively to screencast
because it adds an important dimension to the course material. It also offers a more personalized
teaching approach.
While the learning management software offers assignment drop boxes for submission of
homework and assignments, email is used instead. Email provides a personal touch and allows
for more flexibility for both the student and the teacher. This lesson will be submitted as an email
attachment. The instructor will reply with personalized feedback including screen capture
illustrations and short video clips to enhance student understanding.
Part 6: Formative Evaluation Plan
6a: Expert Review Plan
The subject matter expert is Susan Goff. She is a college administrator who previously taught
this subject matter for over 12 years. Susan has a BS in Computer Science and an MBA. She is
also a doctoral candidate in Education. She was asked to evaluate the content of the lesson as
well as the delivery and evaluation methods.
The following questions were asked:
24
Is the lesson engaging to students?
Is the purpose and expectations clearly stated?
Is the content appropriate for the level of students?
Are there any technical problems with the process?
Are the lesson components appropriate and consistent with the learning outcomes?
Are the delivery methods appropriate?
Are the formative and summative evaluation methods effective?
Are there appropriate reiterative and feedback methods used?
What other changes or suggestions do you have?
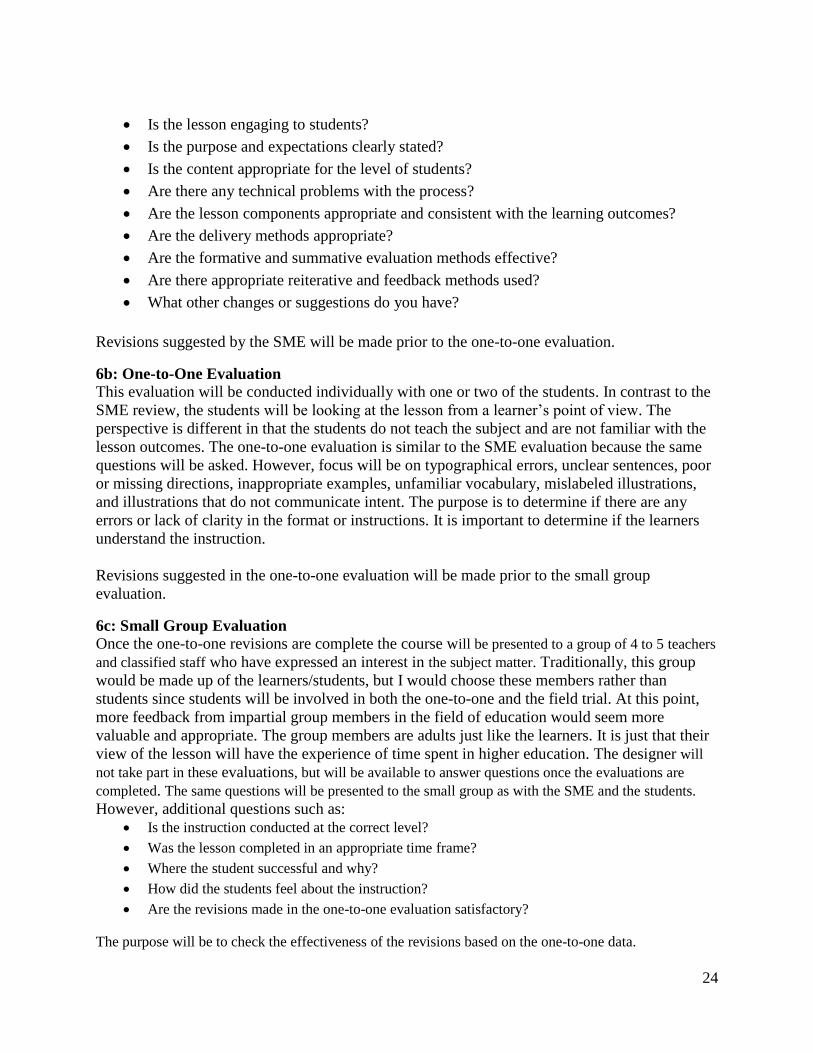
Revisions suggested by the SME will be made prior to the one-to-one evaluation.
6b: One-to-One Evaluation This evaluation will be conducted individually with one or two of the students. In contrast to the
SME review, the students will be looking at the lesson from a learner’s point of view. The
perspective is different in that the students do not teach the subject and are not familiar with the
lesson outcomes. The one-to-one evaluation is similar to the SME evaluation because the same
questions will be asked. However, focus will be on typographical errors, unclear sentences, poor
or missing directions, inappropriate examples, unfamiliar vocabulary, mislabeled illustrations,
and illustrations that do not communicate intent. The purpose is to determine if there are any
errors or lack of clarity in the format or instructions. It is important to determine if the learners
understand the instruction.
Revisions suggested in the one-to-one evaluation will be made prior to the small group
evaluation.
6c: Small Group Evaluation Once the one-to-one revisions are complete the course will be presented to a group of 4 to 5 teachers
and classified staff who have expressed an interest in the subject matter. Traditionally, this group
would be made up of the learners/students, but I would choose these members rather than
students since students will be involved in both the one-to-one and the field trial. At this point,
more feedback from impartial group members in the field of education would seem more
valuable and appropriate. The group members are adults just like the learners. It is just that their
view of the lesson will have the experience of time spent in higher education. The designer will
not take part in these evaluations, but will be available to answer questions once the evaluations are
completed. The same questions will be presented to the small group as with the SME and the students.
However, additional questions such as:
Is the instruction conducted at the correct level?
Was the lesson completed in an appropriate time frame?
Where the student successful and why?
How did the students feel about the instruction?
Are the revisions made in the one-to-one evaluation satisfactory?
The purpose will be to check the effectiveness of the revisions based on the one-to-one data.
25
6d: Field Trial
Once revisions have been made from the small group evaluation, the lesson will be presented to
the students in the course by the SME. The purpose for the field trial is to determine the
effectiveness and clarity of the instruction. The students will also be asked what they thought of
the lesson. The lesson will only be graded on participation, but the formative review of the
process and the summative review of the outcomes will be made by the SME. The SME will
make final revisions as necessary. The purpose is to observe the lesson in a realistic
environment.
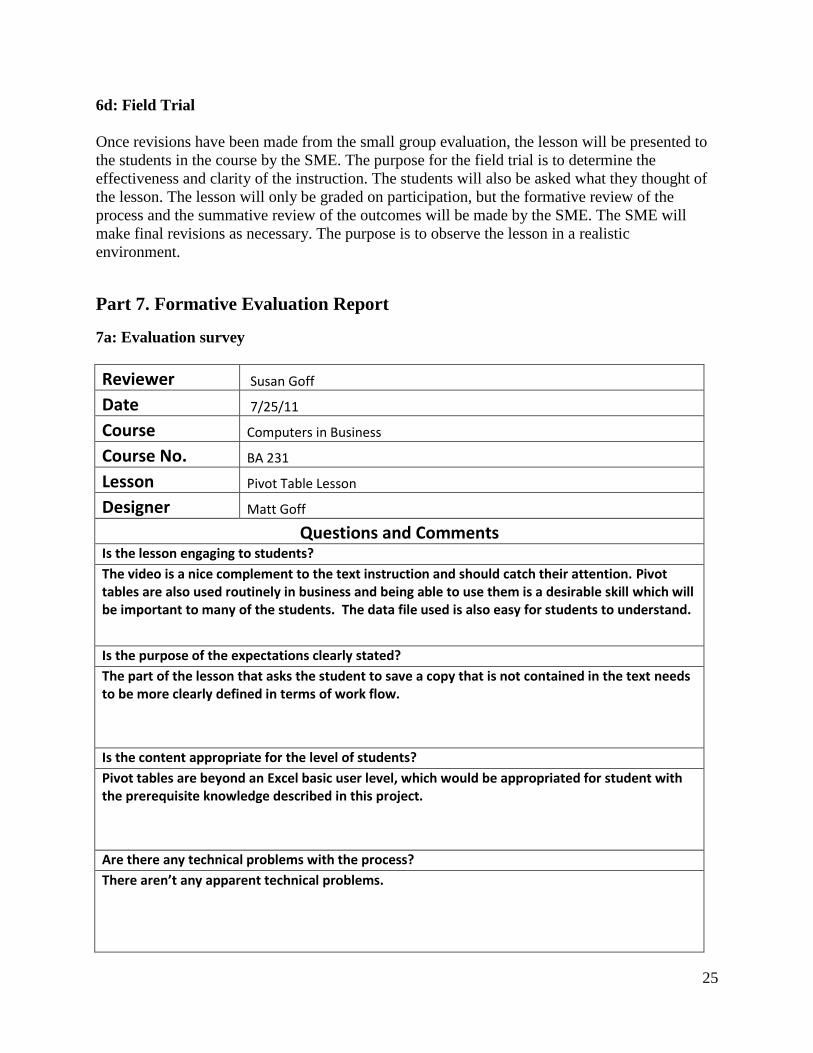
Part 7. Formative Evaluation Report
7a: Evaluation survey
Reviewer Susan Goff
Date 7/25/11
Course Computers in Business
Course No. BA 231
Lesson Pivot Table Lesson
Designer Matt Goff
Questions and Comments Is the lesson engaging to students?
The video is a nice complement to the text instruction and should catch their attention. Pivot tables are also used routinely in business and being able to use them is a desirable skill which will be important to many of the students. The data file used is also easy for students to understand.
Is the purpose of the expectations clearly stated?
The part of the lesson that asks the student to save a copy that is not contained in the text needs to be more clearly defined in terms of work flow.
Is the content appropriate for the level of students?
Pivot tables are beyond an Excel basic user level, which would be appropriated for student with the prerequisite knowledge described in this project.
Are there any technical problems with the process?
There aren’t any apparent technical problems.
26
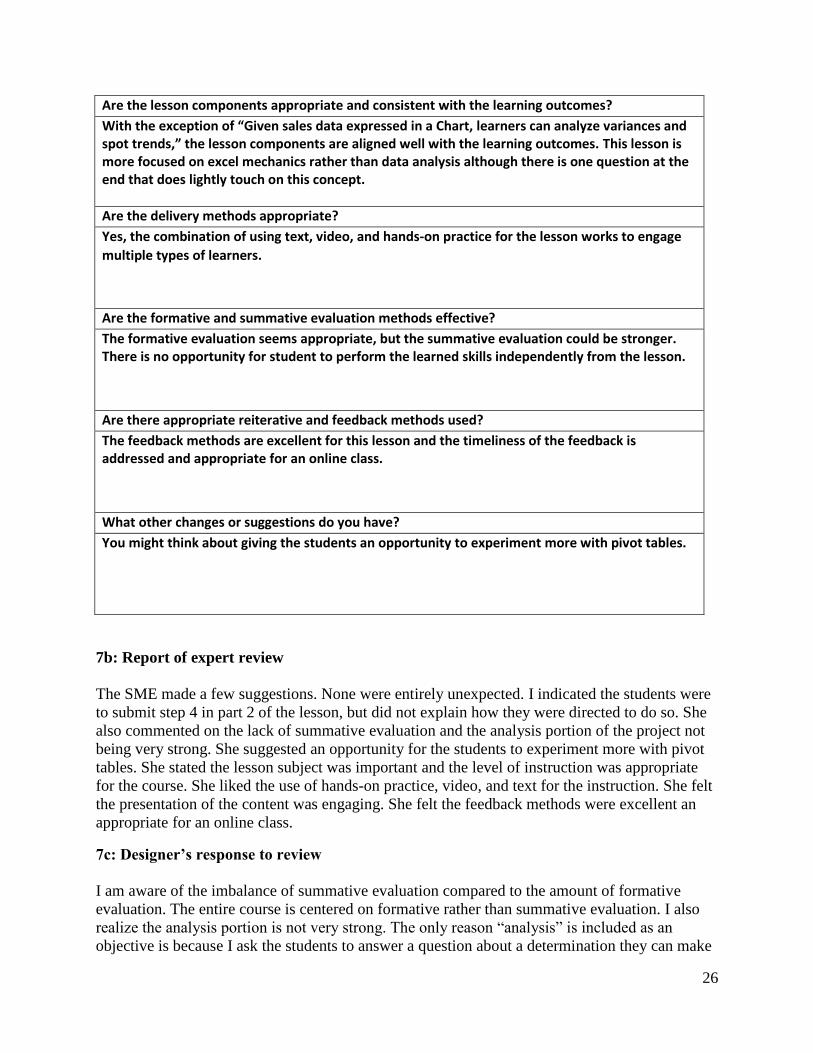
Are the lesson components appropriate and consistent with the learning outcomes?
With the exception of “Given sales data expressed in a Chart, learners can analyze variances and spot trends,” the lesson components are aligned well with the learning outcomes. This lesson is more focused on excel mechanics rather than data analysis although there is one question at the end that does lightly touch on this concept.
Are the delivery methods appropriate?
Yes, the combination of using text, video, and hands-on practice for the lesson works to engage
multiple types of learners.
Are the formative and summative evaluation methods effective?
The formative evaluation seems appropriate, but the summative evaluation could be stronger. There is no opportunity for student to perform the learned skills independently from the lesson.
Are there appropriate reiterative and feedback methods used?
The feedback methods are excellent for this lesson and the timeliness of the feedback is addressed and appropriate for an online class.
What other changes or suggestions do you have?
You might think about giving the students an opportunity to experiment more with pivot tables.
7b: Report of expert review
The SME made a few suggestions. None were entirely unexpected. I indicated the students were
to submit step 4 in part 2 of the lesson, but did not explain how they were directed to do so. She
also commented on the lack of summative evaluation and the analysis portion of the project not
being very strong. She suggested an opportunity for the students to experiment more with pivot
tables. She stated the lesson subject was important and the level of instruction was appropriate
for the course. She liked the use of hands-on practice, video, and text for the instruction. She felt
the presentation of the content was engaging. She felt the feedback methods were excellent an
appropriate for an online class.
7c: Designer’s response to review
I am aware of the imbalance of summative evaluation compared to the amount of formative
evaluation. The entire course is centered on formative rather than summative evaluation. I also
realize the analysis portion is not very strong. The only reason “analysis” is included as an
objective is because I ask the students to answer a question about a determination they can make

27
by looking at the information presented in the report. I like the question because it asks the
students to think. I could remove the outcome, but I felt it was safe to leave the outcome there
because the students actually have to analyze something. Because this is only one lesson in an
entire course, it is difficult to see that the students have a summative final project where they are
expected to demonstrate the skills they have learned in many of the lessons. I have changed the
wording above to indicate where the directions are located for the students to turn in step 4 of
part 2. I was not clear before. Overall, I was pleased with the SME review. I felt like a chef
serving his food to a food critic.
Part 8. Standards Grid
Professional Standards Addressed (AECT)
The following standards, developed by the Association for Educational Communications and
Technology (AECT), and used in the accreditation process established by the National Council
for Accreditation of Teacher Education (NCATE), are addressed to some degree in this course.
The numbers of the standards correspond to the numbers next to the course tasks show on the list
of assignments. Not all standards are addressed explicitly through student work.
Assignments meeting standard in whole or part
Standard 1: DESIGN
1.1 Instructional Systems Design
(ISD) X
ID Project
1.1.1 Analyzing X ID Project
1.1.2 Designing X ID Project
1.1.3 Developing X ID Project
1.1.4 Implementing X ID Project
1.1.5 Evaluating X Selected Discussion Forums; ID Project
1.2 Message Design
1.3 Instructional Strategies X ID Project
1.4 Learner Characteristics X ID Project
Standard 2: DEVELOPMENT
2.0 (includes 2.0.1 to 2.0.8) X ID Project
2.1 Print Technologies X Reading Quiz; ID Projects
2.2 Audiovisual Technologies
2.3 Computer-Based Technologies X (all assignments)
2.4 Integrated Technologies
Standard 3: UTILIZATION
3.0 (includes 3.0.1 & 3.0.2)
3.1 Media Utilization X (all assignments)
3.2 Diffusion of Innovations
3.3 Implementation and
Institutionalization X
ID Project
3.4 Policies and Regulations
Standard 4: MANAGEMENT

28
4.0 (includes 4.0.1 & 4.0.3)
4.1 Project Management
4.2 Resource Management
4.3 Delivery System Management
4.4 Information Management
Standard 5: EVALUATION
5.1 Problem Analysis X
5.2 Criterion-Referenced
Measurement X
ID Project
5.3 Formative and Summative
Evaluation X
ID Project
5.4 Long-Range Planning
COURSE GOALS & OBJECTIVES
The overall goal for the course is for each student to consider and use the systematic process of
instructional design to create an instructional product. To achieve this goal, students will engage
in activities that promote reflective practice, emphasize realistic contexts, and employ a number
of communications technologies. Following the course, students will be able to:
1. Discuss the historical development of the practice of instructional design with regard to
factors that led to its development and the rationale for its use
2. Describe at least two reasons why instructional design models are useful
3. Identify at least six instructional design models and classify them according to their use
4. Compare and contrast the major elements of three theories of learning as they relate to
instructional design
5. Define “instructional design.”
6. Define the word “systematic” as it relates to instructional design
7. Define “learning” and synthesize its definition with the practice of instructional design
8. Relate the design of instruction to the term “educational (or “instructional”) technology”
9. Describe the major components of the instructional design process and the functions of
models in the design process
29
10. Provide a succinct summary of various learning contexts (declarative knowledge,
conceptual, declarative, principle, problem-solving, cognitive, attitudinal, and
psychomotor)
11. Build an instructional design product that integrates major aspects of the systematic
process and make this available on the web.
a. Describe the rationale for and processes associated with needs, learner, context,
goal, and task analyses
i. Create and conduct various aspects of a front-end analysis
ii. Identify methods and materials for communicating subject matter that are
contextually relevant
b. Describe the rationale for and processes associated with creating design
documents (objectives, motivation, etc.)
i. Construct clear instructional goals and objectives
ii. Develop a motivational design for a specific instructional task
iii. Develop assessments that accurately measure performance objectives
c. Select and implement instructional strategies for selected learning tasks
i. Select appropriate media tools that support instructional design decisions
d. Describe the rationale and processes associated with the formative evaluation of
instructional products
i. Create a plan for formative evaluation
12. Identify and use technology resources to enable and empower learners with diverse
backgrounds, characteristics, and abilities.
13. Apply state and national content standards to the development of instructional products
14. Meet selected professional standards developed by the Association for Educational
Communications and Technology
15. Use various technological tools for instructional and professional communication
30
AECT STANDARDS (Applicable to EDTECH 503)
1.0 Design
1.1 Instructional Systems Design
1.1.a Utilize and implement design principles which specify optimal conditions for
learning.
1.1.b Identify a variety of instructional systems design models and apply at least one
model.
1.1.1 Analyzing
1.1.1.a Write appropriate objectives for specific content and outcome levels.
1.1.1.b Analyze instructional tasks, content, and context.
1.1.2 Designing
1.1.2.a Create a plan for a topic of a content area (e.g., a thematic unit, a text chapter, an
interdisciplinary unit) to demonstrate application of the principles of macro-level design.
1.1.2.b Create instructional plans (micro-level design) that address the needs of all
learners, including appropriate accommodations for learners with special needs.
1.1.2.d Incorporate contemporary instructional technology processes in the development
of interactive lessons that promote student learning.
1.1.3 Developing
1.1.3.a Produce instructional materials which require the use of multiple media (e.g.,
computers, video, projection).
1.1.3.b Demonstrate personal skill development with at least one: computer authoring
application, video tool, or electronic communication application.
1.1.4 Implementing
1.1.4.a Use instructional plans and materials which they have produced in contextualized
instructional settings (e.g., practica, field experiences, training) that address the needs of
all learners, including appropriate accommodations for learners with special needs.
1.1.5 Evaluating
1.1.5.a Utilize a variety of assessment measures to determine the adequacy of learning
and instruction.
1.1.5.b Demonstrate the use of formative and summative evaluation within practice and
contextualized field experiences.
1.1.5.c Demonstrate congruency among goals/objectives, instructional strategies, and
assessment measures.
1.3 Instructional Strategies
1.3.a Select instructional strategies appropriate for a variety of learner characteristics and
learning situations.
31
1.3.b Identify at least one instructional model and demonstrate appropriate
contextualized application within practice and field experiences.
1.3.c Analyze their selection of instructional strategies and/or models as influenced by the
learning situation, nature of the specific content, and type of learner objective.
1.3.d Select motivational strategies appropriate for the target learners, task, and learning
situation.
1.4 Learner Characteristics
1.4.a Identify a broad range of observed and hypothetical learner characteristics for their
particular area(s) of preparation.
1.4.b Describe and/or document specific learner characteristics which influence the
selection of instructional strategies.
1.4.c Describe and/or document specific learner characteristics which influence the
implementation of instructional strategies.
2.0 Development
2.0.1 Select appropriate media to produce effective learning environments using
technology resources.
2.0.2 Use appropriate analog and digital productivity tools to develop instructional and
professional products.
2.0.3 Apply instructional design principles to select appropriate technological tools for
the development of instructional and professional products.
2.0.4 Apply appropriate learning and psychological theories to the selection of
appropriate technological tools and to the development of instructional and professional
products.
2.0.5 Apply appropriate evaluation strategies and techniques for assessing effectiveness
of instructional and professional products.
2.0.6 Use the results of evaluation methods and techniques to revise and update
instructional and professional products.
2.0.7 Contribute to a professional portfolio by developing and selecting a variety of
productions for inclusion in the portfolio.
2.1 Print Technologies
2.1.3 Use presentation application software to produce presentations and supplementary
materials for instructional and professional purposes.
2.1.4 Produce instructional and professional products using various aspects of integrated
application programs.
2.3 Computer-Based Technologies
2.3.2 Design, produce, and use digital information with computer-based technologies.
32
3.0 Utilization
3.1 Media Utilization
3.1.1 Identify key factors in selecting and using technologies appropriate for learning
situations specified in the instructional design process.
3.1.2 Use educational communications and instructional technology (SMETS) resources
in a variety of learning contexts.
3.3 Implementation and Institutionalization
3.3.1 Use appropriate instructional materials and strategies in various learning contexts.
3.3.2 Identify and apply techniques for integrating SMETS innovations in various
learning contexts.
3.3.3 Identify strategies to maintain use after initial adoption.
4.0 Management
(none specifically addressed in 503)
5.0 Evaluation
5.1 Problem Analysis
5.1.1 Identify and apply problem analysis skills in appropriate school media and
educational technology (SMET) contexts (e.g., conduct needs assessments, identify and
define problems, identify constraints, identify resources, define learner characteristics,
define goals and objectives in instructional systems design, media development and
utilization, program management, and evaluation).
5.2 Criterion-referenced Measurement
5.2.1 Develop and apply criterion-referenced measures in a variety of SMET contexts.
5.3 Formative and Summative Evaluation
5.3.1 Develop and apply formative and summative evaluation strategies in a variety of
SMET contexts.
SMET = School Media & Educational Technologies

33
References
Cram, C. (2012). Office Suites - Microsoft Office 2010: Illustrated Projects (1st ed.). Boston,
MA: Cengage Learning.
Smith, P. L. & Ragan, T. J. (2005). Instructional Design: Third Edition. Hoboken, NJ: John Wiley &
Sons, Inc.