Embed Size (px)
Citation preview

2 This document was submitted and shared by trading community to help other traders through www.algotrading-investment.com
Instruction (Manual) Document
This part should be filled by author before your submission.
1. Information about Author
Your Surname N/A
Your First Name N/A
Your Country N/A
Your Email Address [email protected]
Your ID on our website ATI
Your website www.algotrading-investment.com
2. Information for the submitted materials
Title of the submitted instruction or manual Golden Ratio and Financial Trading
Language of Instruction English
Key words (at least 3) Forex, Stock, Investment, Stock market, futures market, technical analysis, Harmonic Pattern, Elliott Wave, Fibonacci retracement, Fibonacci expansion, EFW Index, Equilibrium fractal wave, Golden ratio, Fibonacci ratio
Date of Completion 20 February 2018
Version of this Document 1.1
3. If it is about any trading platform or any of our products (leave empty if you don’t use)
Name of Trading Platform Any trading platform
Trading Platform version
Name of Product
Product version
3 This document was submitted and shared by trading community to help other traders through www.algotrading-investment.com
Golden Ratio and Financial Trading
www.algotrading-investment.com
20 Feb 2018
Written By Young Ho Seo
Finance Engineer and Quantitative Trader
4 This document was submitted and shared by trading community to help other traders through www.algotrading-investment.com
Introduction to Golden Ratio 0.618 for financial trading
When I look back, even during my math class in the university, the golden ratio or Fibonacci
number was not so popular topics. However, I still remember that a particular technique
called a “Golden Section Search” was taught along with Newton’s method. Well, just like
many of the students, I forgot about this technique after passing the exam. Many years later,
the term “Golden ratio” keep coming back more and more during my research with financial
market data (If you are not sure what the Golden ratio is, please check the appendix at the
end of this article.) I realized that the importance of Golden ratio might be far more significant
than what the financial trader think. Firstly, many geometry or shape found in nature
including trees, leaves, flowers, etc, are often built upon the golden ratio and the derived
ratios (i.e. Fibonacci ratios). Even there were some interesting research showing the
relationship between the golden ratio and beauty. Now you can tell that the frequent
occurrence of the golden ratio is natural phenomenon. What do you think about the financial
market? As you know, financial market is made by man. Would the golden ratio play an
important role in the financial market? If so, it would be quite surprising. The truth is yes. The
Golden ratio 0.618 and other derived ratios (i.e. Fibonacci ratios) like 0.382 and 0.500 are
considered as important. In fact, the belief about the Golden ratio was there for more than
85 years. I am referring to the work by Ralph Nelson Elliott in 1938. The use of golden ratio
for the financial market can go back even more. Whether you are user of the golden ratio and
the Fibonacci ratio for your financial trading (see appendix), you will be kept surprising
reading this article until the end. We have built a scientific tool to reveal the precise structure
of the financial market. The scientific tool can not only extract the useful information for your
financial trading but also it can be used to make some interesting inference about the financial
market. Now to start with, let us understand how to use the golden ratio and Fibonacci ratio
for the financial trading first.
5 This document was submitted and shared by trading community to help other traders through www.algotrading-investment.com
How to use the Golden Ratio and Fibonacci Ratio for financial trading
The most common way to apply the golden ratio and Fibonacci ratio is to use two price swing
points in your chart. To identify the two swing points, you can simply use the peak trough
analysis provided on our website. It is free of charge for use and for sharing
(http://algotrading-investment.com). You can have a multiple options to identify the swing
point in your chart. However, there are automated tools (the peak trough analysis) for the
task, we will not discuss too much on how to detect the swings points manually.
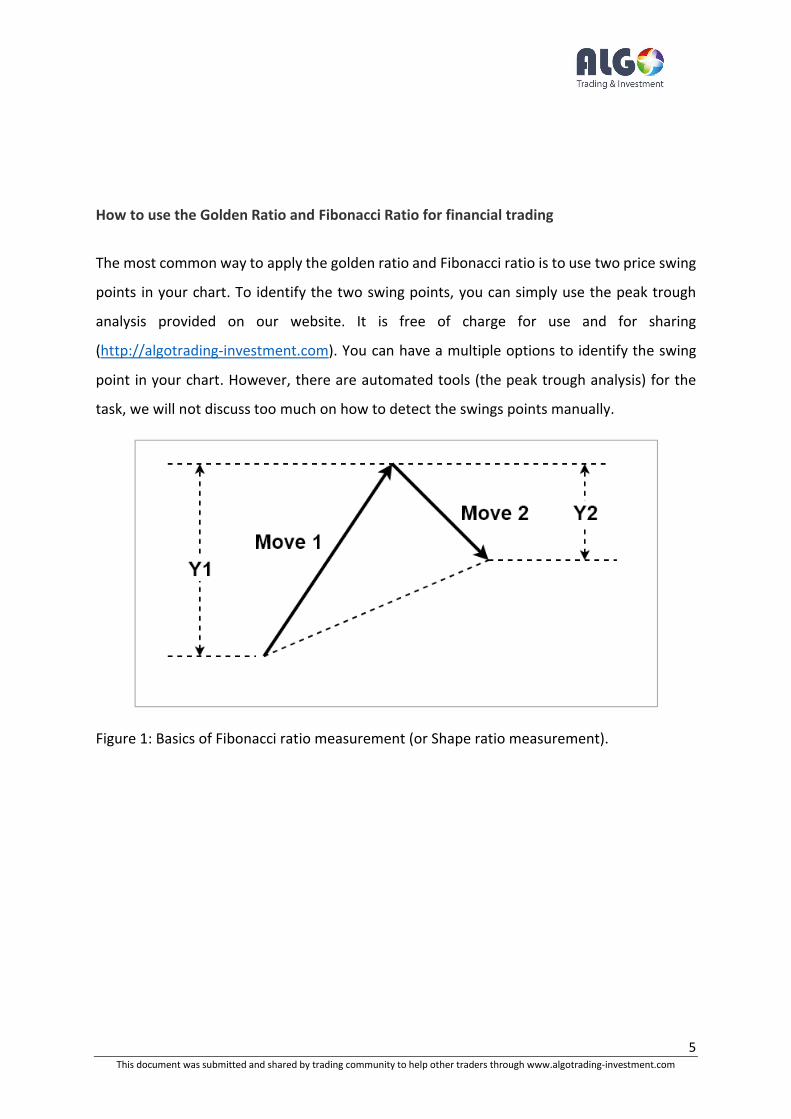
Figure 1: Basics of Fibonacci ratio measurement (or Shape ratio measurement).
6 This document was submitted and shared by trading community to help other traders through www.algotrading-investment.com
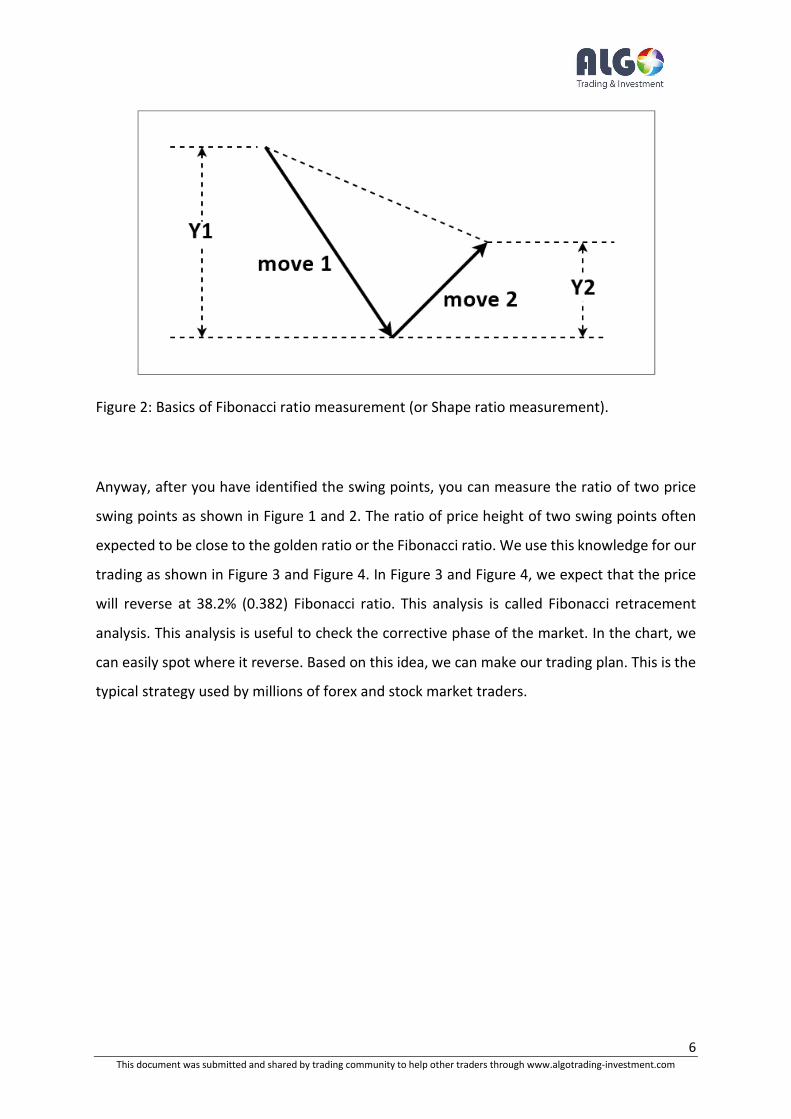
Figure 2: Basics of Fibonacci ratio measurement (or Shape ratio measurement).
Anyway, after you have identified the swing points, you can measure the ratio of two price
swing points as shown in Figure 1 and 2. The ratio of price height of two swing points often
expected to be close to the golden ratio or the Fibonacci ratio. We use this knowledge for our
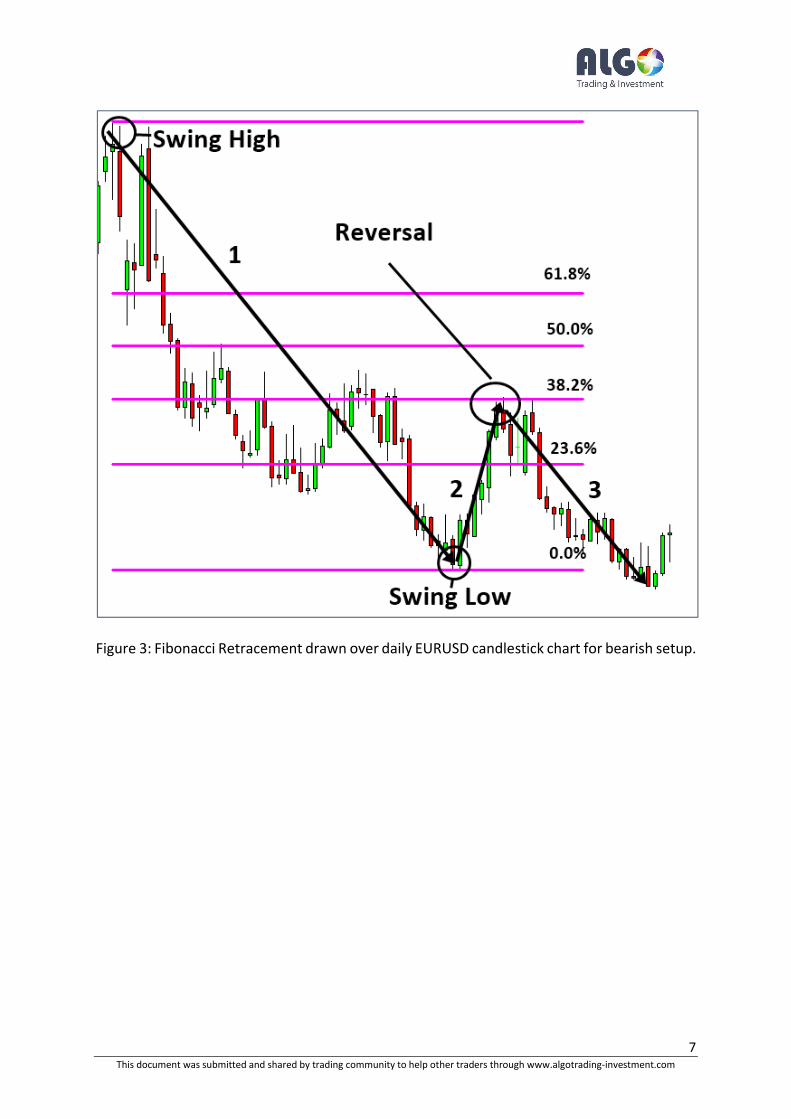
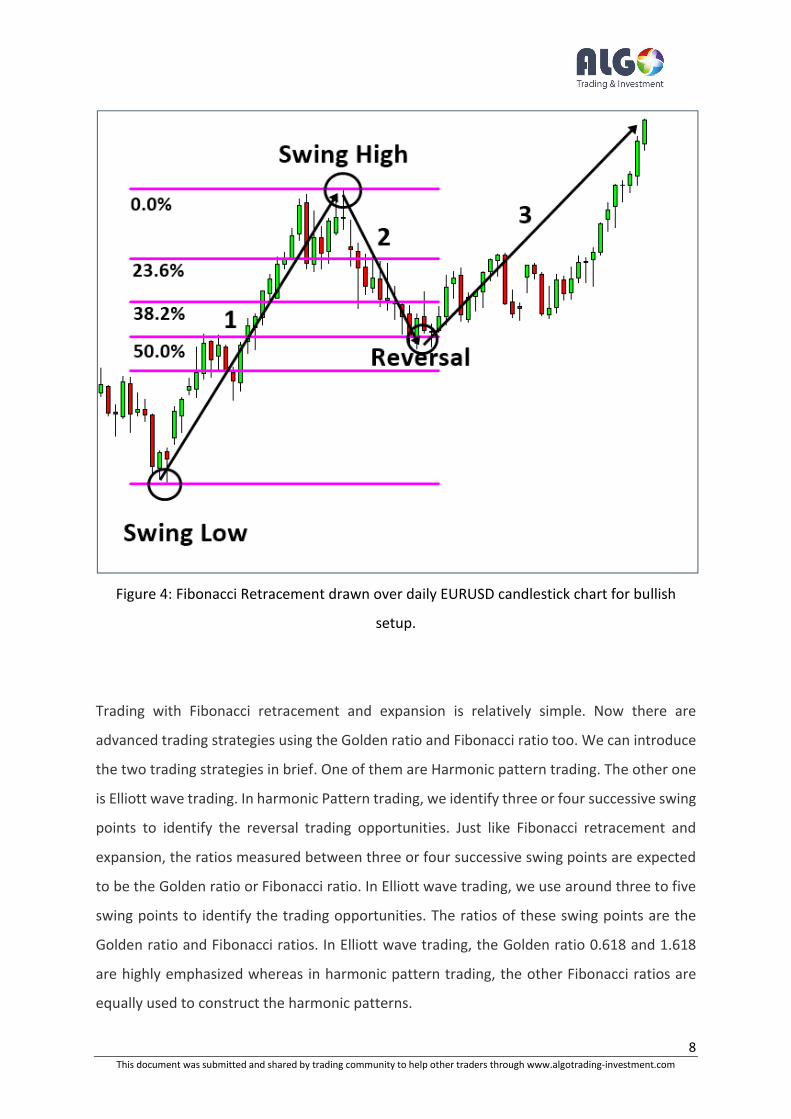
trading as shown in Figure 3 and Figure 4. In Figure 3 and Figure 4, we expect that the price
will reverse at 38.2% (0.382) Fibonacci ratio. This analysis is called Fibonacci retracement
analysis. This analysis is useful to check the corrective phase of the market. In the chart, we
can easily spot where it reverse. Based on this idea, we can make our trading plan. This is the
typical strategy used by millions of forex and stock market traders.
7 This document was submitted and shared by trading community to help other traders through www.algotrading-investment.com
Figure 3: Fibonacci Retracement drawn over daily EURUSD candlestick chart for bearish setup.
8 This document was submitted and shared by trading community to help other traders through www.algotrading-investment.com
Figure 4: Fibonacci Retracement drawn over daily EURUSD candlestick chart for bullish
setup.
Trading with Fibonacci retracement and expansion is relatively simple. Now there are
advanced trading strategies using the Golden ratio and Fibonacci ratio too. We can introduce
the two trading strategies in brief. One of them are Harmonic pattern trading. The other one
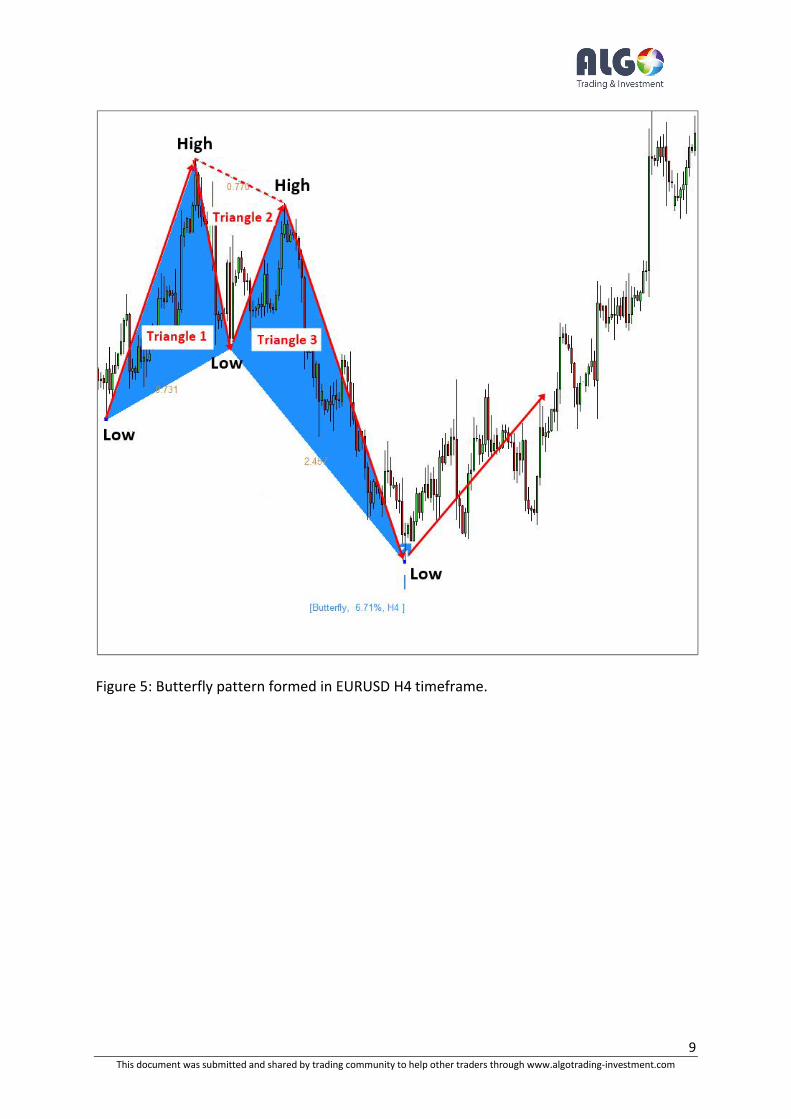
is Elliott wave trading. In harmonic Pattern trading, we identify three or four successive swing
points to identify the reversal trading opportunities. Just like Fibonacci retracement and
expansion, the ratios measured between three or four successive swing points are expected
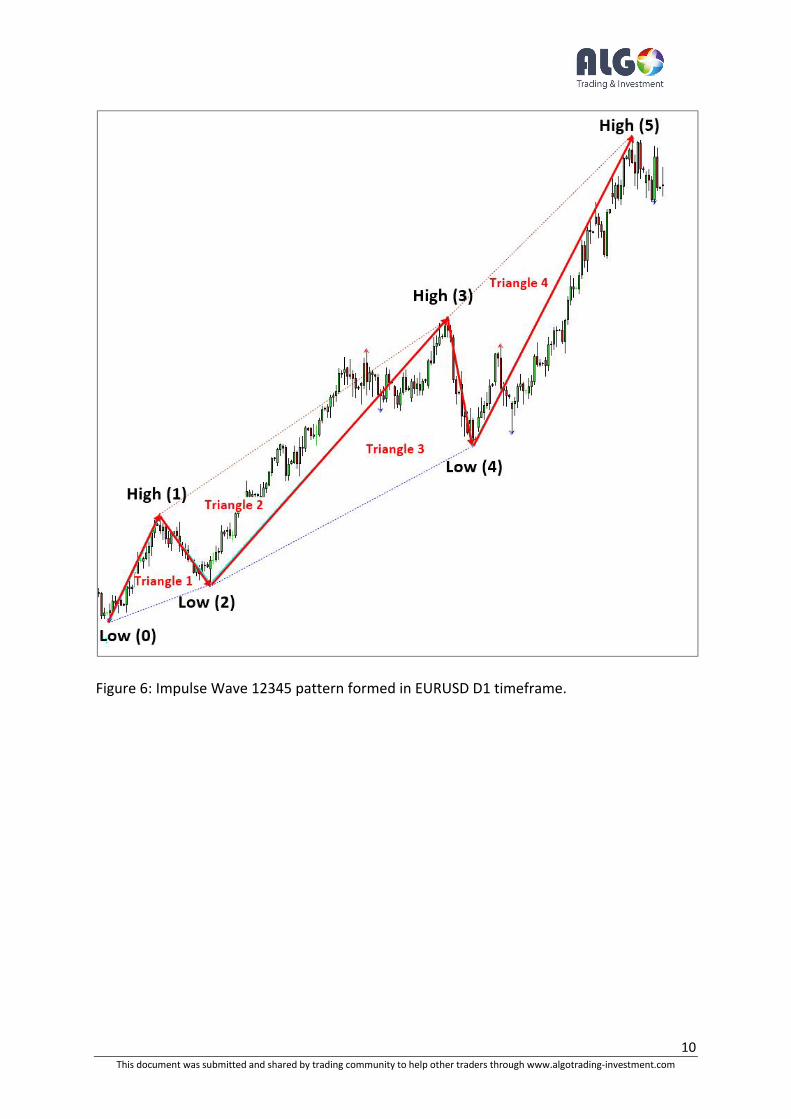
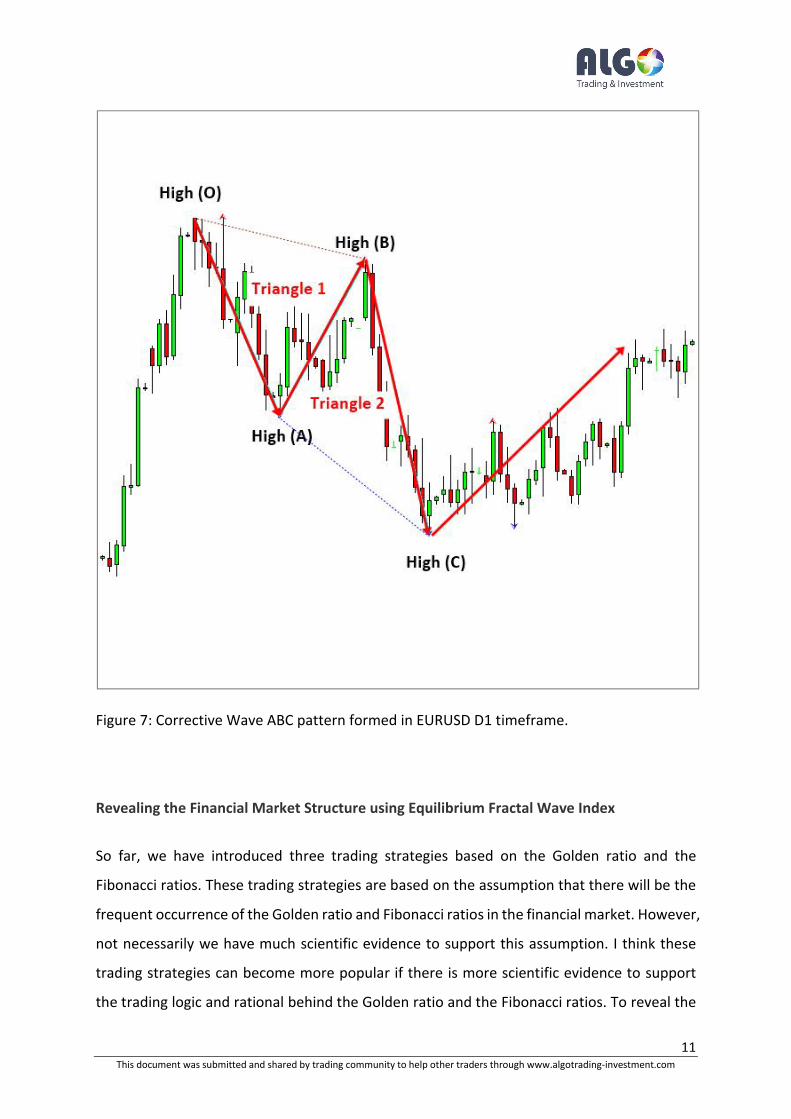
to be the Golden ratio or Fibonacci ratio. In Elliott wave trading, we use around three to five
swing points to identify the trading opportunities. The ratios of these swing points are the
Golden ratio and Fibonacci ratios. In Elliott wave trading, the Golden ratio 0.618 and 1.618
are highly emphasized whereas in harmonic pattern trading, the other Fibonacci ratios are
equally used to construct the harmonic patterns.
9 This document was submitted and shared by trading community to help other traders through www.algotrading-investment.com
Figure 5: Butterfly pattern formed in EURUSD H4 timeframe.
10 This document was submitted and shared by trading community to help other traders through www.algotrading-investment.com
Figure 6: Impulse Wave 12345 pattern formed in EURUSD D1 timeframe.
11 This document was submitted and shared by trading community to help other traders through www.algotrading-investment.com
Figure 7: Corrective Wave ABC pattern formed in EURUSD D1 timeframe.
Revealing the Financial Market Structure using Equilibrium Fractal Wave Index
So far, we have introduced three trading strategies based on the Golden ratio and the
Fibonacci ratios. These trading strategies are based on the assumption that there will be the
frequent occurrence of the Golden ratio and Fibonacci ratios in the financial market. However,
not necessarily we have much scientific evidence to support this assumption. I think these
trading strategies can become more popular if there is more scientific evidence to support
the trading logic and rational behind the Golden ratio and the Fibonacci ratios. To reveal the

12 This document was submitted and shared by trading community to help other traders through www.algotrading-investment.com
financial market structure precisely, we have made a scientific framework called Equilibrium
fractal wave. To reveal the market structure, we need to understand what ratios the market
is made up including both Fibonacci ratios and non-Fibonacci ratio. Using the framework of
the Fibonacci ratio analysis can limit our understanding since we can only study Fibonacci
ratios. Therefore, we use the generic term called “Equilibrium Fractal Wave” to describe the
price geometry made up from the two price swing points (or three points) in your chart as
shown in Figure 1 and Figure 2.
By definition, an equilibrium fractal wave is a simple triangle made up from two price swing
points. It is precisely identical to the triangle introduced in Figure 1 and Figure 2. We refer to
the ratio (Y2/Y1) as the shape ratio in equilibrium fractal wave. The shape ratio represents
the shape of each equilibrium fractal wave and it is an identifier used to reveal the market
structure. The shape ratio can include any ratios including Fibonacci ratios and non-Fibonacci
ratios in our study.
Figure 8: One unit (or one cycle) of equilibrium fractal wave.
13 This document was submitted and shared by trading community to help other traders through www.algotrading-investment.com
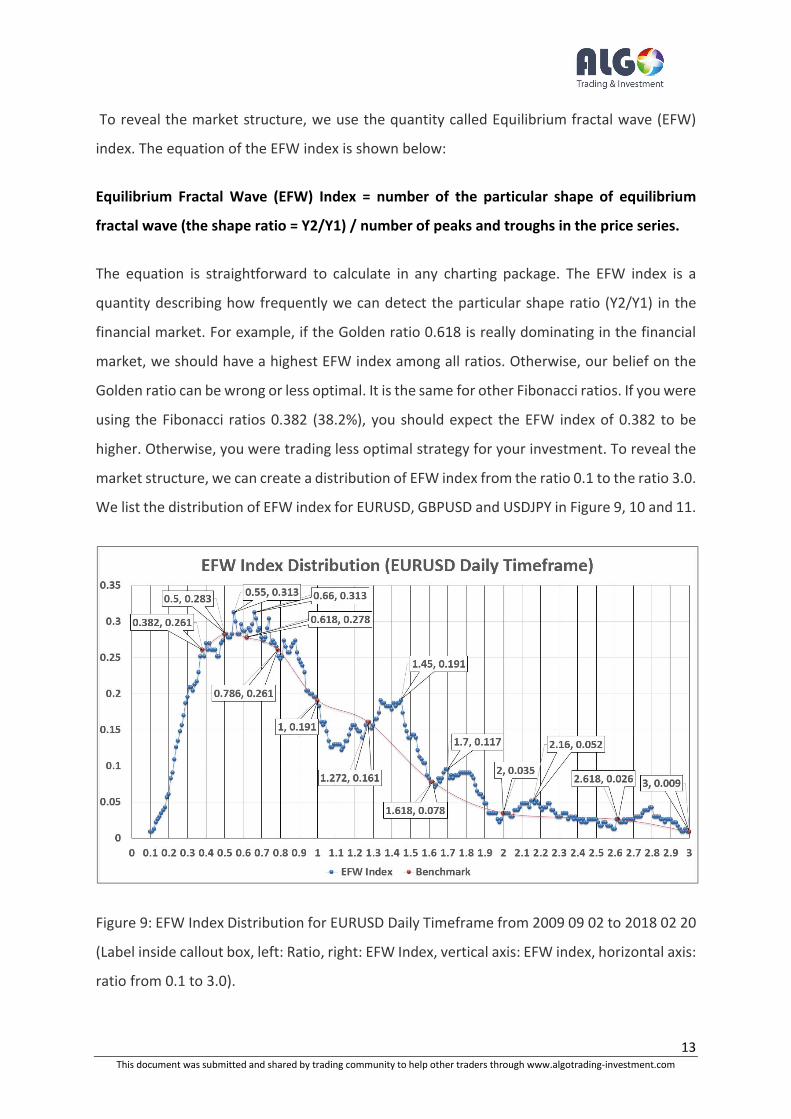
To reveal the market structure, we use the quantity called Equilibrium fractal wave (EFW)
index. The equation of the EFW index is shown below:
Equilibrium Fractal Wave (EFW) Index = number of the particular shape of equilibrium
fractal wave (the shape ratio = Y2/Y1) / number of peaks and troughs in the price series.
The equation is straightforward to calculate in any charting package. The EFW index is a
quantity describing how frequently we can detect the particular shape ratio (Y2/Y1) in the
financial market. For example, if the Golden ratio 0.618 is really dominating in the financial
market, we should have a highest EFW index among all ratios. Otherwise, our belief on the
Golden ratio can be wrong or less optimal. It is the same for other Fibonacci ratios. If you were
using the Fibonacci ratios 0.382 (38.2%), you should expect the EFW index of 0.382 to be
higher. Otherwise, you were trading less optimal strategy for your investment. To reveal the
market structure, we can create a distribution of EFW index from the ratio 0.1 to the ratio 3.0.
We list the distribution of EFW index for EURUSD, GBPUSD and USDJPY in Figure 9, 10 and 11.
Figure 9: EFW Index Distribution for EURUSD Daily Timeframe from 2009 09 02 to 2018 02 20
(Label inside callout box, left: Ratio, right: EFW Index, vertical axis: EFW index, horizontal axis:
ratio from 0.1 to 3.0).
14 This document was submitted and shared by trading community to help other traders through www.algotrading-investment.com
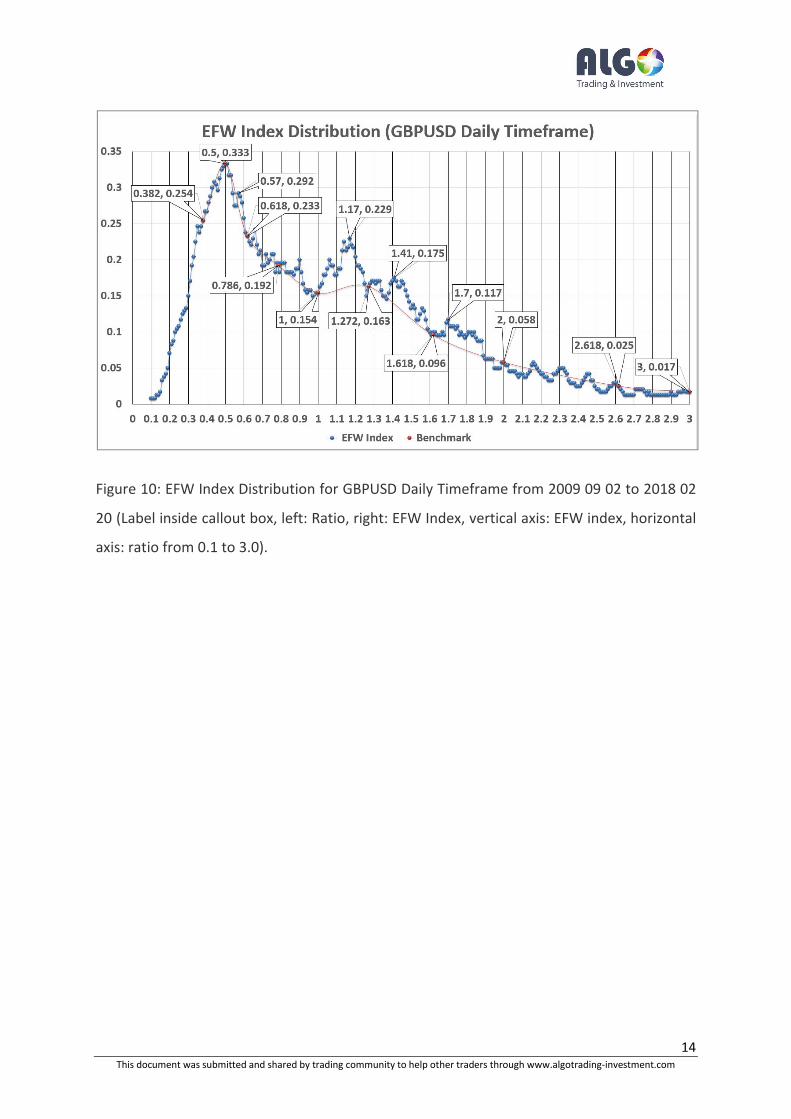
Figure 10: EFW Index Distribution for GBPUSD Daily Timeframe from 2009 09 02 to 2018 02
20 (Label inside callout box, left: Ratio, right: EFW Index, vertical axis: EFW index, horizontal
axis: ratio from 0.1 to 3.0).
15 This document was submitted and shared by trading community to help other traders through www.algotrading-investment.com
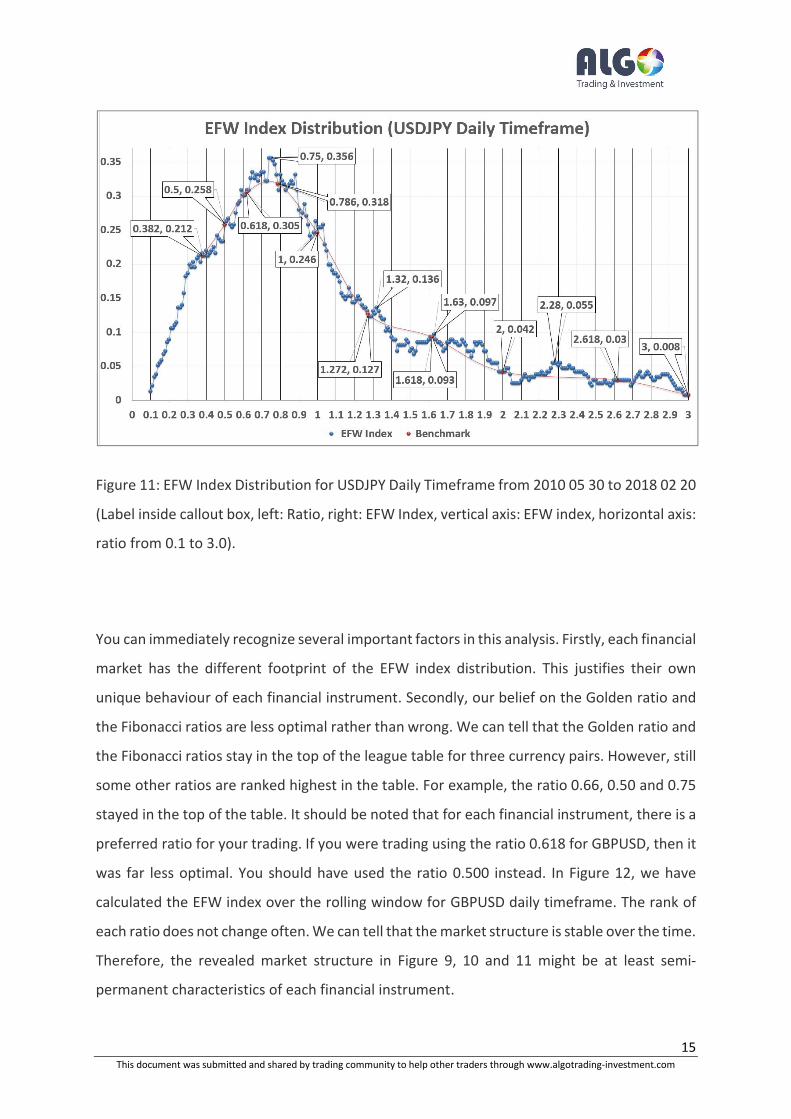
Figure 11: EFW Index Distribution for USDJPY Daily Timeframe from 2010 05 30 to 2018 02 20
(Label inside callout box, left: Ratio, right: EFW Index, vertical axis: EFW index, horizontal axis:
ratio from 0.1 to 3.0).
You can immediately recognize several important factors in this analysis. Firstly, each financial
market has the different footprint of the EFW index distribution. This justifies their own
unique behaviour of each financial instrument. Secondly, our belief on the Golden ratio and
the Fibonacci ratios are less optimal rather than wrong. We can tell that the Golden ratio and
the Fibonacci ratios stay in the top of the league table for three currency pairs. However, still
some other ratios are ranked highest in the table. For example, the ratio 0.66, 0.50 and 0.75
stayed in the top of the table. It should be noted that for each financial instrument, there is a
preferred ratio for your trading. If you were trading using the ratio 0.618 for GBPUSD, then it
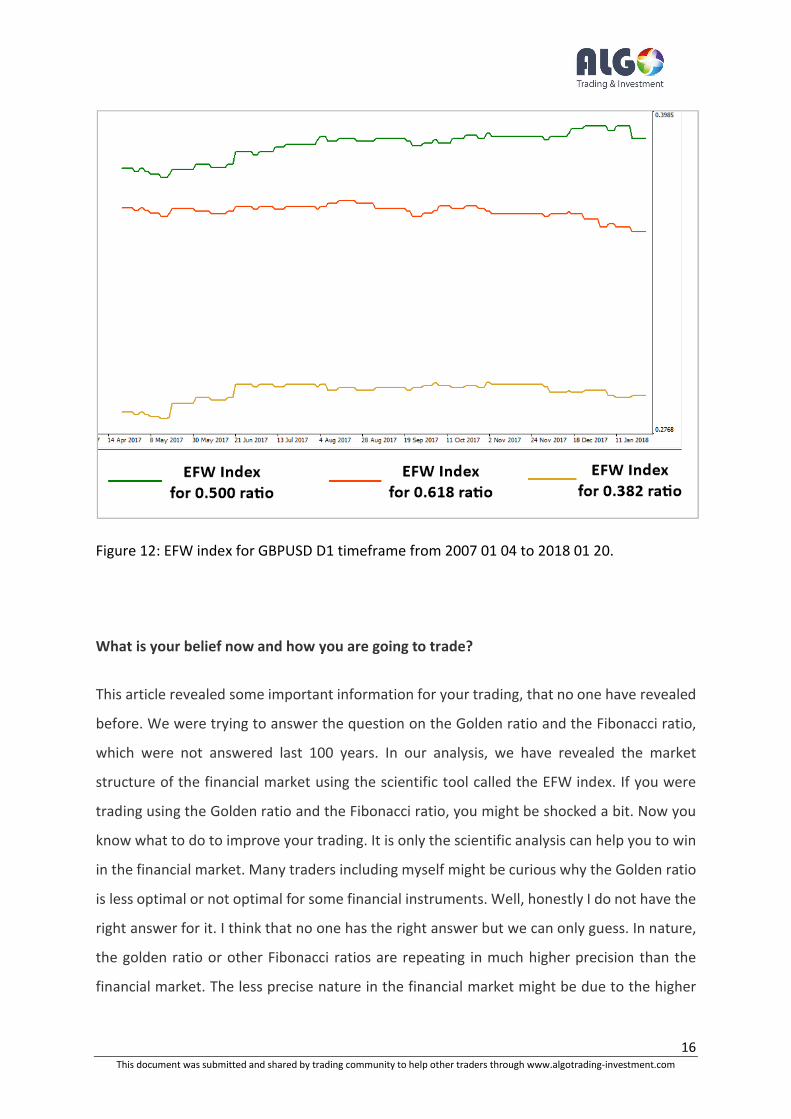
was far less optimal. You should have used the ratio 0.500 instead. In Figure 12, we have
calculated the EFW index over the rolling window for GBPUSD daily timeframe. The rank of
each ratio does not change often. We can tell that the market structure is stable over the time.
Therefore, the revealed market structure in Figure 9, 10 and 11 might be at least semi-
permanent characteristics of each financial instrument.
16 This document was submitted and shared by trading community to help other traders through www.algotrading-investment.com
Figure 12: EFW index for GBPUSD D1 timeframe from 2007 01 04 to 2018 01 20.
What is your belief now and how you are going to trade?
This article revealed some important information for your trading, that no one have revealed
before. We were trying to answer the question on the Golden ratio and the Fibonacci ratio,
which were not answered last 100 years. In our analysis, we have revealed the market
structure of the financial market using the scientific tool called the EFW index. If you were
trading using the Golden ratio and the Fibonacci ratio, you might be shocked a bit. Now you
know what to do to improve your trading. It is only the scientific analysis can help you to win
in the financial market. Many traders including myself might be curious why the Golden ratio
is less optimal or not optimal for some financial instruments. Well, honestly I do not have the
right answer for it. I think that no one has the right answer but we can only guess. In nature,
the golden ratio or other Fibonacci ratios are repeating in much higher precision than the
financial market. The less precise nature in the financial market might be due to the higher
17 This document was submitted and shared by trading community to help other traders through www.algotrading-investment.com
noise in the financial market because of too many diverse players. Another possible
explanation might be that the profitability of the Golden ratio and some Fibonacci ratios might
be exhausted because too many of us were using them every day. Therefore, the EFW index
distribution in Figure 9, 10 and 11 might be showing the distorted image of the financial
market. Please feel free to write me on [email protected] if you have a
better explanation about why the Golden ratio is less or not optimal for the financial market.
18 This document was submitted and shared by trading community to help other traders through www.algotrading-investment.com
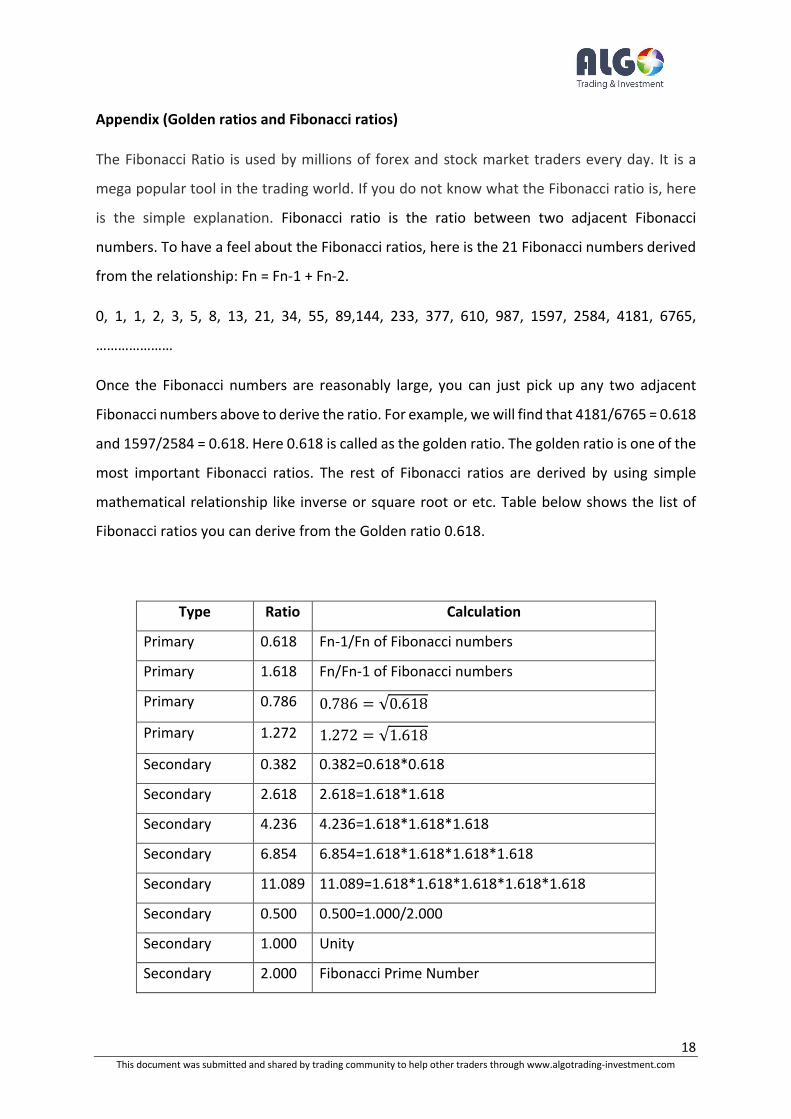
Appendix (Golden ratios and Fibonacci ratios)
The Fibonacci Ratio is used by millions of forex and stock market traders every day. It is a
mega popular tool in the trading world. If you do not know what the Fibonacci ratio is, here
is the simple explanation. Fibonacci ratio is the ratio between two adjacent Fibonacci
numbers. To have a feel about the Fibonacci ratios, here is the 21 Fibonacci numbers derived
from the relationship: Fn = Fn-1 + Fn-2.
0, 1, 1, 2, 3, 5, 8, 13, 21, 34, 55, 89,144, 233, 377, 610, 987, 1597, 2584, 4181, 6765,
…………………
Once the Fibonacci numbers are reasonably large, you can just pick up any two adjacent
Fibonacci numbers above to derive the ratio. For example, we will find that 4181/6765 = 0.618
and 1597/2584 = 0.618. Here 0.618 is called as the golden ratio. The golden ratio is one of the
most important Fibonacci ratios. The rest of Fibonacci ratios are derived by using simple
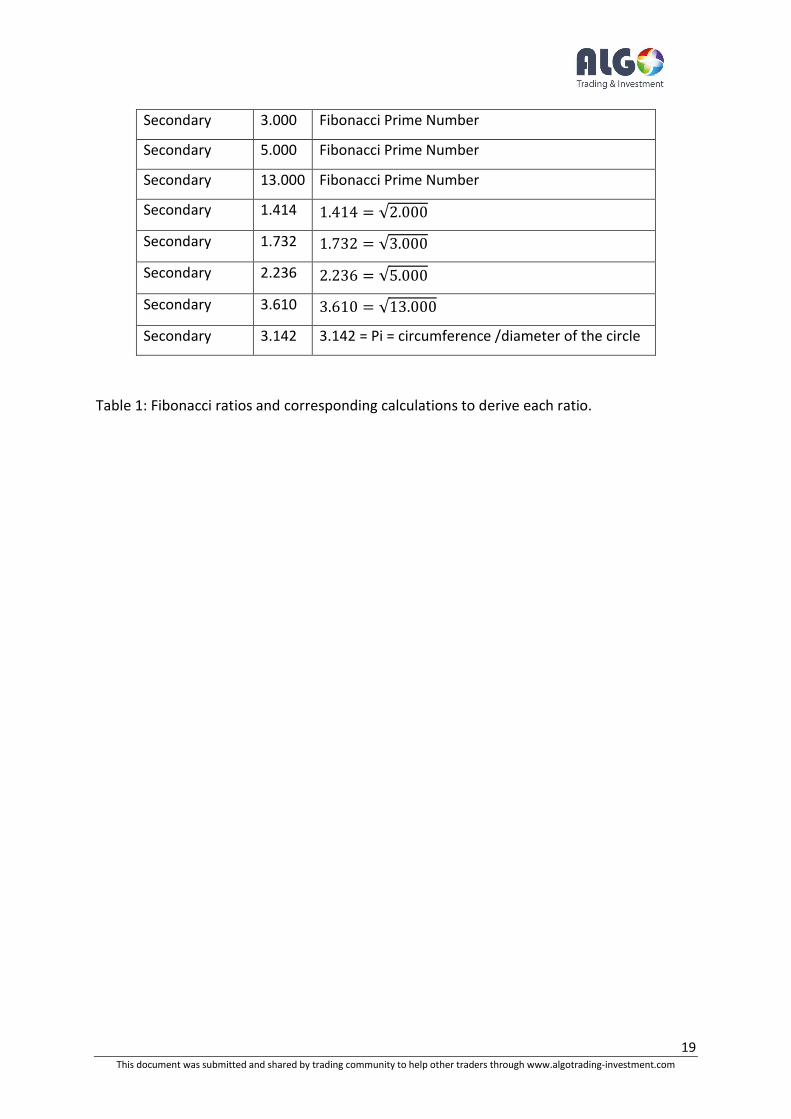
mathematical relationship like inverse or square root or etc. Table below shows the list of
Fibonacci ratios you can derive from the Golden ratio 0.618.
Type Ratio Calculation
Primary 0.618 Fn-1/Fn of Fibonacci numbers
Primary 1.618 Fn/Fn-1 of Fibonacci numbers
Primary 0.786 0.786 = √0.618
Primary 1.272 1.272 = √1.618
Secondary 0.382 0.382=0.618*0.618
Secondary 2.618 2.618=1.618*1.618
Secondary 4.236 4.236=1.618*1.618*1.618
Secondary 6.854 6.854=1.618*1.618*1.618*1.618
Secondary 11.089 11.089=1.618*1.618*1.618*1.618*1.618
Secondary 0.500 0.500=1.000/2.000
Secondary 1.000 Unity
Secondary 2.000 Fibonacci Prime Number
19 This document was submitted and shared by trading community to help other traders through www.algotrading-investment.com
Secondary 3.000 Fibonacci Prime Number
Secondary 5.000 Fibonacci Prime Number
Secondary 13.000 Fibonacci Prime Number
Secondary 1.414 1.414 = √2.000
Secondary 1.732 1.732 = √3.000
Secondary 2.236 2.236 = √5.000
Secondary 3.610 3.610 = √13.000
Secondary 3.142 3.142 = Pi = circumference /diameter of the circle
Table 1: Fibonacci ratios and corresponding calculations to derive each ratio.


![Naidu — The Golden Mean [Golden Ratio]](https://img.pdfslide.us/doc/110x75/577d22831a28ab4e1e9791fa/naidu-the-golden-mean-golden-ratio.jpg)