Embed Size (px)
Citation preview

A Lean Environmental Benchmarking (LEB) method for the Management of Cutting Tools
AbstractManufacturing companies are striving hard to remain competitive hence, they rely on a number of resources to meet customers’ expectations, among which cutting tools are included. This paper addresses the problems faced in the management of cutting tools activities. Production managers have highlighted the lack of procedures containing metrics and targets that would show them whether their company is able to perform an efficient management, and if it is capable of supporting the deployment process. In this context, this paper presents a novel Lean Environmental Benchmarking (LEB) method for performing a diagnosis of practices and performances to support the implementation of a cutting tool management strategy and/or the effective management of these assets. Strategic, technical and logistical aspects are addressed, particularly, with regard to management focused on lean manufacturing and environmental aspects. Field studies were performed in nine Brazilian companies in the metal-mechanical sector to validate the LEB method proposed. The LEB method helped the participant organisations clarify the various activities that involved the management of their cutting tools, while the field studies indicated that all nine organisations had a great concern regarding the preservations of the environment, and also an effective utilisation of resources spent for machining components.
Keywords: Benchmarking, Lean Management, Cutting Tools, Environmental Friendly Manufacturing, Diagnostics, Cutting Tool Management, Lean Environmental Benchmarking
1. Introduction
Manufacturing organisations around the globe are witnessing a phenomenal transformation in the industrial paradigm. The metal-mechanic sector plays a significant role and provides an impetus to the industrial growth of any economy (Sharma et al., 2015). Among the currently existing manufacturing processes, machining is one of the most important activities in the metal-mechanic sector as investments in new technologies such as machines and cutting tools are essential for organisations in this industry to remain competitive (Karjalainen et al., 2005). In the paradigm shift from small-scale production to mass production, for example, the research and development of new materials capable of cutting high hardness metals in large volumes, and therefore with lower processing times, were of paramount importance. With the use of conventional machines only, companies adapted to the extent that a task was performed. Later, with the arrival of computer numeric control (CNC) machines, computer integrated manufacturing (CIM), among other technologies, machining times generally decreased and productivity increased (Singh, 2013; Karjalainen et al, 2005). Consequently, there was a significant increase in the variety of new cutting tools, tooling support and consumed tools, which resulted in a considerable increase of information to be managed (Denkena et al., 2014).
According to Marczinski (2002), cutting tools represent 3% to 5% of production costs. However, if transforming resources, including cutting tools, are not effectively managed, these costs may increase to up to 30% of the overall production cost. In this context, ensuring the availability and utilization of cutting tools, tool management influences production performance significantly (Denkena et al., 2014). Among the objectives of tool management are the exploitation of tool performance, the reduction of idle time caused by the tools, and the management of tool logistics and procurement (Eversheim et al., 1991). Tool management enables and ensures that the correct tools are in the appropriate machines at the required time, avoiding unnecessary delays and

stoppages (Meseguer and Gonzalez, 2012). Thus, cutting tool management is a strategy that seeks to contribute to all activities related to the effective and efficient use of tools within industries.
Veeramani et al. (1992) reported that the problem of cutting tool management was brought to forefront by the emergence of CIM. Svinjarević et al. (2007) highlight that cutting tool management has proven to be beneficial for manufacturing companies, particularly those which specialize in metal cutting processes. Their study reported that cutting tool management in manufacturing companies resulted in the reduction of cutting tools in stock, reduction of employees engaged in managing the tooling, quicker access to the necessary cutting tools and data, and simplicity in tool order and supply. In this line, researchers have focused on exploring and improving specific activities of tool management that include loading (Ho and Hsieh, 2005) and its sub-activity of tool-allocation (Matta et al., 2004) as well as scheduling (Meseguer and Gonzalez, 2012; Turkcan et al., 2003; Fathi and Barnette, 2002) and its sub-activities of tool magazine capacity, tool availability, duplication or use of alterative tools (Kim et al., 2003) and tool replacement due to wear (Choi and Kim, 2001; Sheikh 1999). For these tool management activities to succeed, however, it is imperative to establish adequate strategies and activities as well as to comply with the prerequisites and the steps that are needed for the effective management of cutting tools. Thus, an important stage related to the management of cutting tools is the initial phase of the implementation of this strategy. This phase involves the recognition of the current situation through a diagnosis and as part of the starting point for planning the deployment, seeking to ensure the application of the concepts adjusted to the conditions of the manufacturing environment. The application of cutting tool management in FMSs (Flexible Manufacturing Systems)/automated environments has been studied by a number of researchers such as Veeramani et al. (1992), Arezoo et al. (2000), Meseguer and Gonzalez (2012), and more recently by Sun et al. (2016). Nevertheless, scholarly research specifically focused on the implementation of the cutting tool management strategy is almost non-existent. Consequently, organisations lack methods to effectively implement this strategy.
This paper therefore theoretically contributes by filling this research gap through the proposal of a novel method for the diagnosis that precedes the process of implementing the management of cutting tools strategy, and continuous improvement, in order to ensure a better planning and monitoring of the implementation of this strategy in companies. The proposed method not only considers the operational dimension in the form of its strategic, technical, and logistic aspects but also the environmental dimension. The environmental dimension has been integrated as a part of the proposed method since it has nowadays become of paramount importance for manufacturers due to stricter environmental regulations and demands from customers for greener products and services (Garza-Reyes, 2015a; Garza-Reyes, 2015b). This is certainly the case for manufacturers in the metal-mechanic sector (Severo et al., 2015; Severo et al., 2012). The proposed method is based on the lean benchmarking approach (Seibel, 2004), and is hence focused on lean manufacturing and environmental principles, which in this case are applied to the management of cutting tools. The lean environmental benchmarking method presented in this paper can be adopted by manufacturing organisations, especially metal-mechanic companies, to support the implementation of a tool management strategy. This is considered the main practical contribution of this paper.
2. Literature review
2.1 Lean manufacturing in the machine tool industryMost manufacturing industries around the globe are implementing operational and quality
improvement programmes to improve their performance and compete more effectively against their business rivals. The metal-mechanic sector is no different as it constantly seeks to deploy improvements in their key processes to cope up with competitive pressures (Eswaramoorthi et al. 2011). The successful application of lean in the manufacturing industry is well documented in academic literature (e.g. Garza-Reyes et al., 2012; Shah and Ward, 2003; Martínez Sánchez and

Pérez Pérez, 2001). Although these studies present evidence of the successful application of lean in different manufacturing industries and companies, the surveyed literature indicates that the implementation of lean principles in the metal-mechanic sector is limited. Eswaramoorthi et al. (2011) conducted a survey of the Indian machine tool industries and reported that lean implementation in this industry was still at an infant stage compared to other industries. Like many other manufacturing industries, the metal-mechanic industry has been striving hard to remain competitive (Sharma et al., 2015). Shagluf et al. (2015) highlighted that machine tool accuracy is critical for high value manufacturing hence optimum maintenance and calibration management is highly desirable. Among the limited research focused on the application of lean in the metal-mechanic sector, Sharma et al.’s (2015) study focused on developing a framework for analysing the interaction among the major criteria of lean manufacturing in the machine tool industry. Similarly, the application of lean manufacturing techniques for the reduction of cycle time in a machining process in an automotive manufacturing plant is reported in the work of Venkataraman et al. (2014). Their study showed a reduction of manufacturing lead time by 14%, reduction of defects, improved process capability and quick response to customer demand through smaller lots. This evidence shows that lean has been successfully applied in machining processes. However, literature is still limited in this domain, emphasizing the need for gathering more evidence.
2.2 Lean benchmarkingThe growing popularity of lean therefore demanded its benchmarking as it becomes difficult to
gauge which organisation has really embraced the lean philosophy and where it stands in comparison with other lean manufacturing organisations (Knuf, 2000). Some researchers have therefore attempted to address the lean benchmarking problem. Comm and Mathaisel (2000) developed an eight‐step approach to assess and benchmark lean practices in the production and operation of military aerospace products. In this direction, Kumar and Kumar (2016) presented the application of Graph Theory and Matrix Approach (GTMA) to identify the relative importance of different lean attributes in a lean environment using qualitative and quantitative factors. Their study applied the GTMA approach to prioritise the lean manufacturing attributes based on their relative importance. A lean benchmarking process to monitor carbon efficiency was proposed by Wu et al., (2013). Recently, Dal Forno et al. (2016) presented the benchmarking of the lean product development process by means of case studies in large companies in Brazil. It is evident from these studies that lean benchmarking has attracted the attention of researchers and practitioners; however, the application of lean benchmarking in organisations that perform machining operations is scarce (Seibel, 2004).
2.3 Lean and the environmentSeveral researchers have recently argued about the integration of the environmental aspects
with operational and quality improvement methods and tools (Chugani et al., 2016; Garza-Reyes, 2015a; Garza-Reyes, 2015b; Garza-Reyes et al., 2014; Dües et al. 2013; Duarte and Cruz-Machado, 2013; Mollenkopf et al. 2010; and others). Mollenkopf et al. (2010) stated that lean companies deploying continuous improvement techniques seem to be more likely to accept environmental innovations. This was also confirmed by Garza-Reyes (2015a), who reported that the move towards greener operations and products has forced companies to seek alternatives to balance efficiency gains and environmental friendliness in their operations and products. The conceptual integration of these two paradigms has also been attempted by few researchers such as Cherrafi et al. (2016), Garza-Reyes et al. (2014) and Dües et al. (2013), who explored the synergies and divergences between the lean and green paradigm. Duarte and Cruz-Machado (2013) examined how different business models can contribute to modelling a lean and green approach for an organisation. More recently, Chugani et al. (2016) presented a systematic review of green impact of lean, Six Sigma, and Lean Six Sigma, and highlighted the fact that environmental aspects can be well integrated with these operational and quality improvement tools. These studies show that the integration of lean and green has become a necessity of the current business times.

In the particular case of lean and green in the manufacturing sector, Garza-Reyes (2015a) found that most of the attempted integrations of these two approaches have been concentrated in this industry, where over twenty models have been proposed and/or applied to simultaneously improve both operational and environmental aspects of specific manufacturing processes. However, despite this relatively high amount of research, none of these models have been further amalgamated and enhanced with benchmarking principles to specifically aid in the implementation of a tool management programme. Therefore, the LEB method for tool management proposed in this paper presents an extension and novel application of the green lean paradigm.
3. Research methodology
3.1 Theoretical development of the Lean Environmental Benchmarking (LEB) methodThe Lean Environmental Benchmarking (LEB) method proposed in this paper was developed
based on the benchmarking concept, taking advantage of the structure and form of analysis of the Lean Benchmarking (LB) method (Seibel, 2004). The method seeks to be used as a diagnosis procedure of practices and performances that precede the process of implementation and continuous improvement of the management of cutting tools. One of the procedures that the LB method uses was proposed by Hanson et al. (1994), which consists of quadrants combining a range of practices and performances. The LB method (Seibel, 2004) is a diagnosis method that generates information to support the strategic planning of the implementation of lean manufacturing in a company. The LB method has been applied in many case studies in companies of different sectors (Seibel, 2004), and presents a structure applicable to the management of cutting tools.
For the application of the LEB method, three different areas were established that are involved in the management of cutting tools: strategic planning, technical planning, and logistics planning. For the definition of the indicators (and their descriptions) in each of these three areas, the following sources were considered: (a) the literature on the management of cutting tools; (b) lean manufacturing techniques and environmental aspects related to the management of cutting tools.
3.2 Selection of case companies for LEB validationCompanies that possessed experience and expertise in the area of cutting tool management were
preferably sought to participate in the study. The reason for this was to verify, in practice: (a) the activities that the companies were developing; (b) how they were applying cutting tool management and what results they have obtained; and (c) the opinion of professionals working in these companies, who had experience in the management of cutting tools, about the proposed LEB method in order to validate it and set it as a diagnostic instrument to be used by companies of different sizes.
As a result, from 16 Brazilian companies initially selected and invited to participate in the study, 9 (56.25%) agreed to take part in the study. Regarding their size, 78% were large companies, whereas 22% were medium-size enterprises. With respect to some general profile characteristics of the participating organisations, the number of employees varied from 350 to 23,800. All of the companies were ISO 9001 certified, and only one did not have the ISO 14001 certification, which relates to environmental management. The companies that manufactured automotive parts, which represented 67% of those included in the study, were also certified with ISO TS-16949. This certification is a standard for quality management systems based on providing continuous improvement by focusing on defect prevention and the reduction of variation and waste in the supply chains of the automotive sector. As for the production layout of the machining processes, most companies (89%) had cellular layouts. In relation to machine tools, 100% of the participating companies used conventional machines in addition to CNC machines. The main machining processes employed by the companies surveyed were: turning, milling, drilling, boring, reaming, threading, broaching, grinding, honing, laser cutting, and polishing.

Regarding the main economic characteristics of the companies, considering those that informed, the annual turnover ranged from 30 to 237 million US dollars ($), of which 45% corresponded to Brazilian capital and 55% multinational capital. The average export of the companies, considering those that reported, was 25.17%. Likewise, for companies that reported, the annual budget for the purchase of cutting tools for 12 months ranged from 150,000 to 6 million US dollars ($), and consumption with machine tools, also considering the last 12 months, ranged from 500,000 to 1.5 million US dollars ($). Some characteristics of the participant companies are shown in Table 4.
[Insert Table 4 here]
4. The LEB method
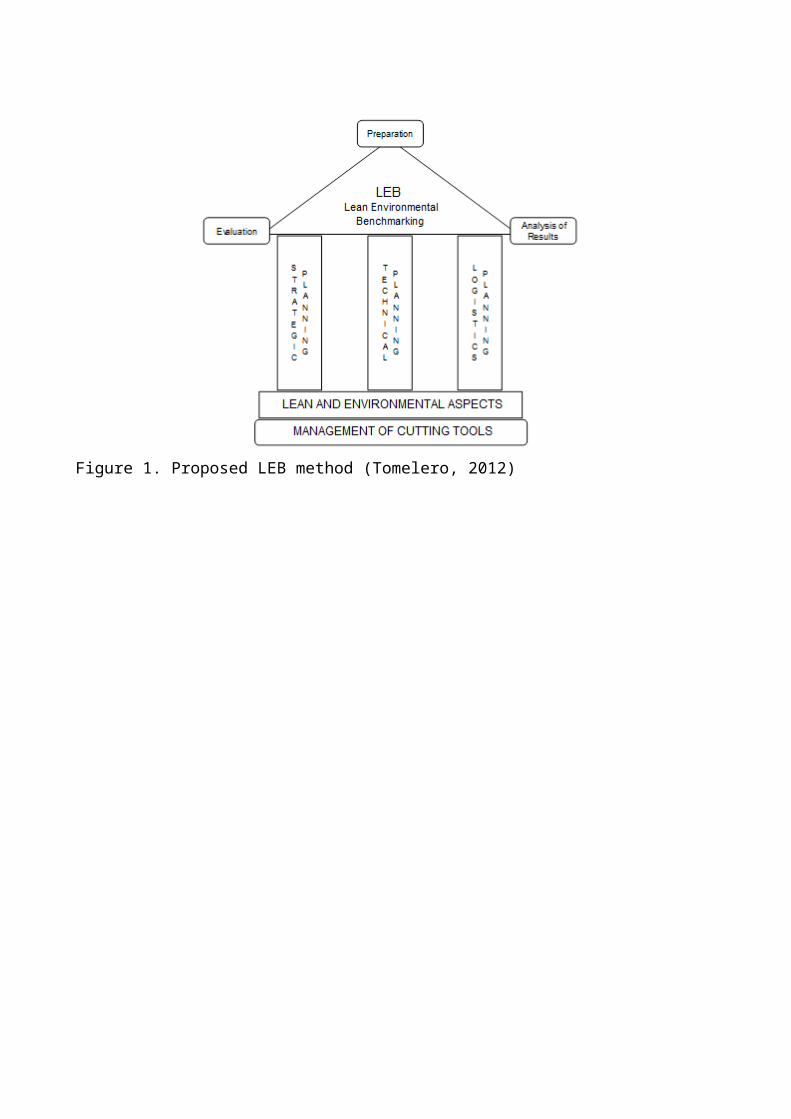
The LEB method provides a set of basic pieces of information on practices and performances to help companies working with cutting tools in their production facilities to conduct the planning, deployment and continuous improvement of the management of cutting tools. As shown in Figure 1, the proposed LEB method is divided into three stages: (1) preparation, (2) evaluation, and (3) analysis of results. These steps are subsequently supported by three different areas involving cutting tool management (i.e. strategic planning, technical planning, and logistics planning), and are based on lean manufacturing techniques and environmental aspects related to lean. It is worth mentioning that the proposal of the LEB method is not to communicate to companies how they should carry out the activities related to the management of cutting tools, but in diagnosing whether companies actually perform those activities or not, and verifying their performance resulting from the application of those activities.
[Insert Figure 1 here]
The preparation stage involves the formation of the working group and the setting up of all the necessary conditions to start with the diagnosis. In the evaluation stage, 35 indicators that make up the LEB method are measured, by means of a data collection instrument that comes in the form of a questionnaire. According to OECD (2011), indicators are an established mean of defining, verifying, and improving performance. Indicators are related to the area of the problem being considered. For instance, Panizollo (1998), Martínez Sánchez and Pérez Pérez (2001) and Netland (2016) used indicators referring to lean production, whereas Veleva and Ellenbecker (2001), OECD (2011) and Tan et al. (2015) used indicators focusing on sustainable aspects. In this work, indicators proposed by Seibel (2004) to quantify lean practices and performance were used. Some of those indicators were already used in companies, whereas other indicators were obtained from publications (e.g. Martínez Sánchez and Pérez Pérez, 2001). Since this work seeks to gauge companies not only with regard to their leanness, but also their concern with cutting tool management and sustainability, additional indicators were included by the authors, namely: “Selection of Cutting Tools that use Minimum Quantity Lubrication (MQL)” and “Disposal and Recycling of Cutting Tools.” The technique of MQL corresponds to the significant reduction in the use of cutting fluids in machining processes, seeking to reduce temperature and increase lubrication in machining, and at the same time reduce the amount of fluid used, which certainly contributes to the environment.
4.1 Indicators that comprise the LEB methodIn order to evaluate the companies in relation to the management of cutting tools, a study of 35
indicators was proposed, divided into the following variables: strategic planning (SP), technical planning (TP) and logistics planning (LP), see Figure 1. In turn, these were divided into Performances and Practices as shown in Tables 1, 2, and 3.
In the evaluation of each indicator, a scoring system ranging from 1 to 5 is used, wherein: score 1 is equivalent to a basic level (20%), score 2 corresponds to 40%, score 3 corresponds to an intermediate level (60%), score 4 corresponds to 80%, and score 5 corresponds to excellence (100%) of practice or performance.
The results from the scores of performance for each indicator of the three variables comprising the LEB method are then calculated. After obtaining these percentages, the partial indices of practice and performance for each studied variable are calculated by simple average, as well as the final indices, according to Figure 2. The partial indices of each variable are then used to build the radar and bar charts, whereas the final indices are used in the practice versus performance chart. All these graphs are used in the stage of analysis of the results, where the practices and performance of each surveyed company will be evaluated.
[Insert Table 1 here]
[Insert Table 2 here]
[Insert Table 3 here]
[Insert Figure 2]
A description of the indicators is given in Appendix A. Those indicators that are not described in the appendix are depicted in the discussion in Section 5.
5. Application of lean environmental benchmarking (LEB) method and discussion
5.1 Steps of the study and application of LEB Method The six steps of the LEB method applied to the participating companies are described below:
First step:The initial step involved the selection of participating companies.
Second step:After selecting the companies, they were contacted by email or telephone to formally introduce them the research and its goals, and inviting them to participate in it.
Third step:This step involved the empirical application of the LEB method in the companies. In-person interviews were conducted in all the participating companies. During the interviews, an introduction to the LEB method, the explanation of the steps, as well as questions for each indicator, were carried out directly with the people responsible for the management of the cutting tools. In most companies, more than one professional were interviewed, each responsible for managing some activities involving machine tools. The information obtained was recorded in a handwritten form. In total, 21 people were interviewed. The interviewees occupied managerial, leadership/supervision and/or operational positions at different levels. Such procedure also enabled, through observation, visualizing companies performing the activities related to the management of cutting tools. This methodology also helped to increase confidence in the results obtained. The average time of the interviews was 2.5 hours.
Fourth step:After the interviews, the collected information related to each indicator that comprises the LEB method was analysed in order to evaluate each indicator according to the information collected from each company. The score for each indicator was stored in a Microsoft Excel file to perform the compilation of the results and generate the charts used to analyse the performance of the companies. Table 5 contains the scores given by a professional from one of the participating companies, their corresponding individual percentages, and the partial percentages for practices and performances. These ware calculated by simple average.
[Insert Table 5 here]Fifth step:After the compilation of the results for each company surveyed, the LEB method together with the results of the analysis (an Excel file containing the score of each indicator and the generated charts), were sent to each of those responsible for the management of cutting tools in the companies that answered the requested information during the interview. With the LEB method and the results of the analysis, the people responsible of each company executed, according to the available time, the reading and analysis of the LEB method, making sure that the scores given for each indicator corresponded to what the company was applying.
Sixth step:After the analysis carried out in the fifth step, each company contacted the authors stating whether they agreed with the results. If the company disagreed with the result, the feedback from the company was used to identify the specific aspects that caused the disagreement (e.g. a wrong score given to an indicator).
Figure 3 presents, for each company that participated in the study, the overall results in terms of practices and performance, and the position of the quadrant where they were ranked. Each company was positioned in one of the following quadrants:
(a) Quadrant I: high practice (>60%) and high performance (>60%); (b) Quadrant II: high practice (>60%) and low performance (<60%); (c) Quadrant III: low practice (<60%) and high performance (>60%);(d) Quadrant IV: low practice (<60%) and low performance (<60%).
The best companies are positioned in quadrant I, whereas those with the worst performances are positioned in quadrant IV. Companies in quadrant II are considered promising in the work by Hanson et al. (1994), and they consider that companies in quadrant III as those that "will not go the distance".
As shown by Figure 3, 89% (8) of the companies were positioned in quadrant I, whereas only 11% (1) was position within quadrant III. The average rating of the companies was in quadrant I, identified by the green square symbol having the result of 73% of practices and 78% of performance. Company E (classified as a medium-sized company) had the highest rate of practices (92%), and the company that obtained the highest performance index (89%) was G. For medium companies, the average of practices was 73.5%, whereas the average of performance was 74%. For large companies, the average of practices was 73.4%, and the average of performance was 79.3%.
The results indicating that most companies fell positioned in quadrant I was expected as the study sought to apply the LEB method in organisations that already had some degree of maturity and knowledge in managing cutting tools as well as had also implemented some activities for their

effective management. This explained the absence of companies with poor performance, i.e. positioned in quadrants II or IV, and also the result of only one company positioned in quadrant III.
[Insert Figure 3 here]
The results showing that most companies are positioned in quadrant I indicated that these were on the right path to achieve excellence in the management of cutting tools. Companies positioned in quadrant III had a situation in which there was a good performance in relation to processes arising from substantial internal effort. In this case, there may be two most likely scenarios: (a) there was an environment with high operating costs resulting from the inefficiencies of the production process, and a good performance was achieved at a high internal cost; or (b) the environment was supported by the dedication above normal from people engaged with the company's goals, but they were demanded beyond what it was necessary to sustain a high performance.
For companies positioned in quadrant III to improve their results and achieve higher levels of practices and performance, and thus obtain a better ranking, they needed to invest in adopting practices and improve those that were being developed, according to what it was considered in the indicators that comprised the LEB method. Consequently, better performance results could be achieved.
The higher the quadrant in which a company is positioned, i.e. in the direction I to IV, production costs tend to be higher. As a company does not perform activities involving the management of cutting tools disorganisation becomes evident. Thus, disturbances occur on the shop floor, leading to increased production times and a higher than necessary consumption of cutting tools. In this way, production costs of these companies become larger compared to those of their competitors, reducing their level of competitiveness in the context of the current economy.
There may be companies in Brazil that fall in quadrant IV. Potential companies with such results may mostly be small organisations, which often do not have an infrastructure with employees and resources at the same level as medium and large-size companies. However, it should be mentioned that some small businesses may have better results as they may have a smaller amount of cutting tools and a structure with less machines and people to manage. One possible cause for companies to be positioned in quadrant IV is the neglect of cutting tools management and not taking into account their importance and influence in their production system costs as a whole. This may be a consequence of their unawareness of the management of cutting tools. A company that is positioned in quadrant IV generally has high production costs, which may lead to its stagnation and possible closure.
When stratifying these average values in practices and each performance for each variable that comprises the LEB method, the radar chart shown in Figure 4 is obtained.
[Insert Figure 4 here]
The result obtained by the companies participating in this study is represented by the blue line in the chart. The red line (corresponding to 60%) is the minimum required performance that enables the use of techniques and concepts of management of cutting tools. Analysing the radar chart, it is noticed that all the points are positioned externally to the hexagon formed by the red line, i.e. the average of the partial results of practices and performance of the companies for each surveyed variable was above 60%, showing the good results for the companies studied.
The radar chart analysis also indicates that the best result of the average of companies referred to the Performance of Strategic Planning, with 85%. As a contribution to achieving this value, it is

highlighted that almost 100% of the companies implemented activities related to environmental aspects (achieved score 5). Concern for the environment and the attempt to achieve the best use of the resources spent in the machining processes have led companies to work intensively on the maximum use and proper disposal of cutting fluids after they reach their end of life, as well as disposal, recycling, reuse, and remanufacturing of the cutting tools used in their production processes.
The worst results were obtained on the practices of strategic planning and technical planning, both with 70%. Even though this is a good result, the aspects that contributed more significantly to the companies obtaining this percentage was the lack of the following practices: conducting research and tests for the use of cutting tools with MQL (indicator SP-05); excessive amount of suppliers (indicator SP-02); lack of a machining database containing information needed to manage cutting tools, and being
integrated with all sectors involved (indicator TP-01); lack of a formal coding model for tools and fixtures that identifies tool characteristics (indicator
TP-02); lack of formal documents with records of the strategies adopted by companies, containing a
description of the activities, responsibilities and procedures.
5.2 Analysis of the variables that comprise the LEB methodThe first variable analysed is Strategic Planning where, observing the chart in Figure 5 showing
the practices adopted by the companies, most indicators have values equal or superior to 60%, and the same takes place with the performance indicators.
[Insert Figure 5 here]
For the indicator SP-01 (Performance and Target Indicators), all companies developed and measured performance indicators, but for the most part they did not cover all areas involved in the management of cutting tools. The main indicators measured refer to the control of tool failure, tool cost per part produced, causes of machine stops, and monthly tool consumption for each cell and/or machining production line. In order for companies to obtain an excellent result, it would be interesting for it to form a group for assessing the tool management activity, which must have a member of each sector related to the management of cutting tools.
In the indicator SP-02 (Supplier Relationship), all companies had and applied criteria for the process of purchasing new cutting tools, such as quality and delivery time, where most of them (89%) always request three different budgets, one for each supplier. 67% of the companies developed strategic alliances with suppliers, where the main strategy is the use of a tool dispenser from one or more tool suppliers. As for the number of tool suppliers, 67% had more than 10 suppliers, 22% had between 6 and 10, and 11% had less than 5 suppliers. For companies to achieve an excellent result it is important that they seek to work with a small number of suppliers, which can meet the needs of the company regarding the cutting tools, and seek to develop strategic alliances with these suppliers so that both parties benefit.
For the SP-07 indicator (Disposal and Recycling of Cutting Tools), for all companies surveyed 100% of the tools were given the correct destination after the end of their useful life. Among the ways to perform this activity, 78% of the companies sold as scrap the tools that were no longer used, and/or sold them to their suppliers. 11% of the companies made auctions to other companies that manufacture their own products, or for companies that sold these types of tools. 11% of the companies conducted auctions and also sold the tools as scrap to suppliers.

For the SP-09 indicator (Remanufacture of Cutting Tools), in all the studied companies, when applicable and economically feasible, 100% of the tools were remanufactured. Some of the companies remanufactured internally some of their cutting tools, whereas in some cases the remanufacture of these was outsourced. It is interesting to note that in one of the companies there was an outsourced company installed inside the factory to regrind the tools, thus reducing the time of sending and returning them.
In the SP-12 indicator (Rationalization of Cutting Tools), most companies (56%) provided more than 90% of the cutting tools used in the company just-in-time, from inventory to production, and the supply was considered just-in-time when the tool stayed for up to one day without being used, next to or in the magazine of the machine tool. In all the companies there was intermediary inventory of ready-to-use tool assemblies alongside machine tools, so that there were no production stops due to the lack of tools. The number of assemblies varied depending on the product and quantity machined. Each company had a different strategy for making rounds in the machining cells or lines to bring in new and reground tools, and to collect tools that needed maintenance. Therefore, in companies with a score 5 (56%), no assembly remained for more than one day at the side of the machine tool without being used.
44% of the companies did not score 5, which was caused by the presence of individual tools or assemblies remaining next to the machine tool or in the tool magazine without being used for a significant period of time, reaching more than two months in one of the surveyed companies. In only one studied company, in some cells Kanban was used for interchangeable inserts and drills, in which each tool had a label describing the minimum and maximum quantity. Once a week the Kanban was checked to decide whether the tool needed to be replaced.
The second analysis referred to indicators of the Technical Planning variable. Observing the chart in Figure 6, regarding the practices adopted by companies, there was a higher percentage of scores below 60%. On the other hand, most of the scores were equal or higher than 60% among the performance indicators.
[Insert Figure 6 here]
In the TP-06 indicator (Reduction of Costs with Cutting Tools for Each Part Produced), companies with score 2 did not control the cost of tools per part, but eventually performed tests for possible tool replacements, analysing acquisition cost and useful life, and the improvements achieved were recorded in a database. Companies with scores of 4 or 5 had a formal group that often performed a critical analysis of tool cost reduction per part and carried out tests for possible tool replacements. Only in companies that had score 5 the group was guided by continuous reduction targets. It should be highlighted the strategy adopted by one of the companies, where several Kaizen events were carried out with employees from different areas involved in the machining of parts, and 8% of the profit obtained with the improvements implemented in the company was divided among the participating employees.
In order for companies to obtain an excellent result in this indicator it was recommended to analyse and improve the machining processes, seeking to reduce the cost of cutting tools per part, leading to the reduction of manufacturing costs. To maximise the return of the time and effort spent in these activities, it was recommended that actions were performed initially on the items of greater expense per part produced. Through a complete and up-to-date database the costs per part can be determined.
In the TP-08 indicator (Index of Cutting Tool Failures), considering all tools that underwent failure in one month, and dividing them by the total amount used during this period, and calculating

the average of the last 12 months, 11% of the studied companies had an index of tool failures higher than 0.3%, while 22% of the companies had an index between 0.2% and 0.3%, 56% between 0.1% and 0.2%, and 11% of the companies had this indicator between 0.05% and 0.1%. The main causes of tool failures reported by most of the companies were due to errors in the generation of CNC programmes, machine tool problems such as vibrations, poor fixturing, operators with insufficient experience, collisions during the process, and parts from suppliers with dimensions or hardness different from the design specification.
Through logs and annotations of the tools that had failed, along with an analysis of the causes of failures, preventive measures can be developed to avoid new failures, these include: (a) proper selection of tools and cutting parameters; (b) use or not lubricating fluids; (c) determination of the useful tool life so that wear present at the end of life does not compromise the integrity of the tool; (d) use of error-proof devices (Poka-yokes) such as monitoring cutting forces through power consumption and acoustic emissions or vibrations. Total Productive Maintenance (TPM) can also significantly contribute to the prevention of tool failures, correcting possible problems related to machine tools.
The third and final analysis referred to indicators of the Logistics Planning variable. On the left-hand side of the chart shown in Figure 7 (practices), there was a percentage of scores below 60%, which was equivalent to that obtained in the variable Strategic Planning, but lower when compared with the variable Technical Planning. Similarly to the other variables, in Logistics Planning most scores were greater than or equal to 60%, and the same happened to the performance indicators.
[Insert Figure 7 here]
For the LP-01 indicator (Storage of Cutting Tools), companies that had scored 5 always used a formal strategy for storing all tools. In most companies that scored 4 (67%), they always used a non-formal strategy to store all the tools. And 11% of the companies that had score 2 eventually used a non-formal strategy for storing a proportion of the tools. 89% of the surveyed companies had an intermediate inventory of tool assemblies next to each machine tool, ready for use, where the variety and quantity of tools depended on the need of each machine tool. This strategy was widely used because it avoided long production stops due to the lack of pre-set tools. Only one of the companies did not apply this strategy yet, but was carrying out a few tests on some machines.
33% of the studied companies stored their tools in the central inventory only on an individual
basis (i.e. no assemblies). In the rest of the companies (67%), the tools were stored in the central inventory both individually and through ready-to-use assemblies. In one of the companies the individual components of a cutting tool were paid only when they were used. Another company had the inventory of tools managed by a supplier installed inside the company, and the tools were paid only when they were used. The company’s paid tools were a maximum of four tool assemblies of each type, that was, one in the magazine of the machine tool, one next to the machine tool, and two others that could be in the pre-setting area or in a third party for maintenance. For companies to achieve better results in this indicator it is necessary to have a formal tool storage strategy, and continuously use it for all the tools.
In the LP-02 indicator (Planning and Control of Inventory of Cutting Tools), 11% of the companies did not make planning decisions and control of tool inventory (e.g. definitions of the maximum and minimum quantity levels for all the tools), using only the experience of the stockman for inventory items. The rest of the companies (89%) made inventory planning and control decisions using supporting software and updated data on all inventory items. These companies had well-defined maximum and minimum inventory levels for all items, but one of them did not have

this information recorded in the company’s management software, but performed control via Kanban through which the purchase of new tools was checked every day.
For the LP-11 indicator (Percentage of Setup Time), for the companies that scored 5 (33%) the setup time was less than 5% of the time available of the machine tools, and the average was calculated over the last 12 months. In companies with scores 3, 2 or 1, this time was between 10% and 20%, 20% and 30%, and more than 30% of the time available of the machine tools. In order for companies to achieve an excellent result in this indicator, it was recommended to carry out external setup activities (i.e. preparation of the machine tool while it was processing the part), and also to develop techniques and devices to reduce setup time.
In the LP-12 indicator (Degree of Obsolescence of Cutting Tools), considering all items and assemblies of obsolete tools, including those stored in the central inventory and those in the current inventory, companies that had scored 5 (45%) had a quantity of less than 5%. The companies that scored 4 (11%) had a quantity between 5% and 10%, and companies with score 3 (44%) had a quantity between 10% and 20% of the items and assemblies of tools considered obsolete. Most obsolete tools in the companies were special tools for products that were no longer manufactured.
In order for a company to achieve excellence in this indicator, it is important to carry out activities such as the creation of procedures that regulate the process of excluding an item in the company, to apply Concurrent Engineering in order to take advantage of the obsolete tools available in the company in the manufacture of new products, and also try to reduce their variety. When it is no longer possible to reuse the cutting tools, they can be sold to other companies or as scrap, and can also be renegotiated with the supplier or customer for which the parts were made with the tools.
6. Conclusions
This paper presented a method for the diagnosis that precedes the process of implementing the management of a cutting tools strategy. The paper thus offers machine tool organisations with an approach that they can employ to improve the management of their cutting tools and hence their operations. This is considered the main practical contribution of this paper.
The theoretical contribution of this paper is also significant. Besides the proposal of the method and its reported application, the paper also contributes to the cutting tool management and lean theories by providing further research on the implementation of the cutting tool management strategy and application of lean to the improvement of machining processes. As previously established, these two subjects were found to have been limitedly explored in the academic literature. The research presented in this paper will not only facilitate the understanding and further research in these promising fields, but also stimulate scholars to further study the improvement of machining processes and enhance the implementation of the cutting tool management strategy by evoking lean principles. Through a better understanding of this, managers of machine tool organisations will also be able to formulate more effective strategies for the improvement of their operations using the cutting tool management strategy and lean manufacturing.
In terms of the application of the proposed LEB method, this helped the participant organisations clarify the various activities that involved the management of cutting tools. From this, it can be concluded that the adoption of best practices leads to obtaining better production performance, that is, from the good results of practices. Consequently, there were also good performance results.
An interesting finding of this research is that companies often have different working methods for each activity regarding the management of cutting tools, but most of them lead to good results. This is because the way each company performs each activity depends on the type of product that

the company produces, size of production batches, type of shop floor layout, which management software the company uses, among other factors. Thus, the LEB method is not intended to check how the company performs each activity, but whether the company does it, because, as already pointed out, there are various ways to perform and manage the same activity.
With regard to the environmental aspects related to the management of cutting tools, which include the treatment of cutting fluids, disposal, recycling, reuse, and remanufacturing of cutting tools, disposal of chips, and also the use of tools with Minimum Quantity Lubrication (MQL), and tools for dry machining, with the exception of the latter two, the companies reported positive results, showing that there is great concern regarding the preservation of the environment, as well as a better use of the resources used in the machining of parts.
In addition to a diagnosis of the three areas that comprise the management of cutting tools, namely: Strategic Planning, Technical Planning, and Logistics Planning, the proposed LEB method guides companies in terms of what activities they need to develop and what results they need to accomplish, in order to achieve excellence on the management of cutting tools.
Finally, although the proposed LEB method yielded positive results to the studied organisations in terms of providing them with a diagnosis regarding the performance of their management of cutting tools, further research must be conducted to test the method in different industrial settings and organisations. This will further validate the effectiveness and applicability of the method in different industrial situations (e.g. different organisations’ sizes, product types, processes, maturity in terms of continuous improvement and implementation of improvement programmes, countries, etc.). Therefore, the collection of further evidence through a multiple case study approach is part of the future research agenda proposed from this paper. Finally, since the proposed LEB method intends to facilitate the implementation of a cutting tool management strategy based on lean practices, future research can also investigate the application of this method in relation to important organisational barriers to the implementation of lean, e.g. short strategic vision, lack of commitment in employees’ management, resistance to change, among others (Bortolotti et al., 2015; Taylor et al., 2013). This will provide light on the effectiveness of the proposed LEB method in the absence or presence of these barriers.
[Insert Appendix A here]References
Arezoo, B., Ridgway, K. and Al-Ahmari, A. M. A. (2000). Selection of cutting tools and conditions
of machining operations using an expert system. Computers in Industry, 42(1), 43-58.Bortolotti, T., Boscari, S. and Danese, P. (2015). Successful lean implementation: Organizational
culture and soft lean practices. International Journal of Production Economics, 160, 182–201.
Choi, Y.C. and Kim, Y.D. (2001). Tool replacement policies for a machining centre producing multiple types of products with distinct due dates. International Journal of Production Research, 39(5), 907–921.
Cherrafi, A., Elfezazi, S., Govindan, K., Garza-Reyes, J. A., Benhida, K., & Mokhlis, A. (2016). A framework for the integration of Green and Lean Six Sigma for superior sustainability performance, International Journal of Production Research, 1-35.
Chugani, N., Kumar, V., Garza-Reyes, J.A., Rocha-Lona, L. and Upadhyay, A. (2016). Investigating the green impact of Lean, Six Sigma, and Lean Six Sigma: a systematic literature review, International Journal of Lean Six Sigma, 8 (1), DOI: 10.1108/IJLSS-11-2015-0043 (in press).
Comm, C.L. and Mathaisel, D.F. (2000). A paradigm for benchmarking lean initiatives for quality improvement. Benchmarking: An International Journal, 7(2), 118-128.

Dal Forno, A.J., Forcellini, F.A., Kipper, L.M. and Pereira, F.A. (2016). Method for evaluation via benchmarking of the lean product development process: Multiple case studies at Brazilian companies. Benchmarking: An International Journal, 23(4), 792-816.
Denkena, B., Krüger, M. and Schmidt, J. (2014). Condition-based tool management for small batch production. International Journal of Advanced Manufacturing Technology, 74, 471–480.
Duarte, S. and Cruz-Machado, V. (2013). Modelling lean and green: a review from business models. International Journal of Lean Six Sigma, 4(3), 228-250.
Dües, C. M., Tan, K. H. and Lim, M. (2013). Green as the new Lean: how to use Lean practices as a catalyst to greening your supply chain. Journal of Cleaner Production, 40, 93-100.
Eswaramoorthi, M., Kathiresan, G. R., Prasad, P.S.S. and Mohanram, P.V. (2011). A survey on lean practices in Indian machine tool industries. International Journal of Advanced Manufacturing Technology, 52(9-12), 1091-1101.
Eversheim W., Kals, H.J.J., König, W., van Luttervelt C.-A., Milberg, J., Storr, A., Tönshoff, H.K., Weck, M., Weule, H. and Zdeblick, W.J. (1991). Tool management: the present and the future. CIRP Annals Manufacturing Technology, 40(2), 631–639
Fathi, Y. and Barnette, K.W. (2002). Heuristic procedures for the parallel machine problem with tool switches. International Journal of Production Research, 40(1), 151–164.
Garza-Reyes, J.A., Oraifige, I., Soriano-Meier, H., Forrester, P.L., Harmanto, D. (2012). The development of a lean park homes production process using process flow and simulation methods. Journal of Manufacturing Technology Management, 23(2), 178-197.
Garza-Reyes, J.A., Jacques, G.W., Lim, M. K., Kumar, V. and Rocha-Lona, L. (2014). Lean and Green–Synergies, Differences, Limitations, and the Need for Six Sigma. In Advances in Production Management Systems. Innovative and Knowledge-Based Production Management in a Global-Local World (pp. 71-81). Springer Berlin Heidelberg.
Garza-Reyes, J.A. (2015a). Lean and Green–a systematic review of the state of the art literature. Journal of Cleaner Production, 102, 18-29.
Garza-Reyes, J.A. (2015b). Green Lean and the need for Six Sigma. International Journal of Lean Six Sigma, 6(3), 226-248.
Hanson, P., Voss, C., Blackmon, K., and Claxton, T. (1994). Made in Europe: A Four Nations Best Practice Study. London: IBM Consulting Group and London Business School.
Ho, Y.C. and Hsieh, H.W. (2005). A part-and-tool assignment method for the workload balance between machines and the minimisation of tool shortage occurrences in a FMS. International Journal of Production Research, 43(9), 1831–1860.
Karjalainen, J., Miettinen, I. and Mikkola, T. (2005). Productivity drivers in machine and metal product manufacturing. Production Planning and Control, 16(8), 743-751.
Kim, Y.D., Lee, G.C., Lim, S.K. and Choi, S.K. (2003). Tool requirements planning in a flexible manufacturing system: minimizing tool costs subject to a makespan constraint. International Journal of Production Research, 41(14), 3339–3357.
Knuf, J. (2000). Benchmarking the lean enterprise: organizational learning at work. Journal of Management in Engineering, 16(4), 58-71.
Kumar, R. and Kumar, V. (2016). Evaluation and benchmarking of lean manufacturing system environment: A graph theoretic approach. Uncertain Supply Chain Management, 4(2), 147-160.
Marczinski, G. (2002). Integrated tool management. Modern Machine Shop, 75(6), 78-81. Martínez Sánchez, A. and Pérez Pérez, M. (2001). Lean indicators and manufacturing strategies.
International Journal of Operations and Production Management, 21(11), 1433-1452.Matta, A., Tolio, T. and Tontini, F. (2004). Tool management in flexible manufacturing systems
with network part program. International Journal of Production Research, 42(17), 3707–3730.
Meseguer, A. and Gonzalez, F. (2012). A methodology for cutting-tool management through the integration of CAPP and scheduling. International Journal of Production Research, 46(6), 1685-1707.

Mollenkopf, D., Stolze, H., Tate, W., and Ueltschy, M. (2010). Green, lean, and global supply chains. International Journal of Physical Distribution and Logistics Management, 40 (1/2), 14-41.
Netland, T. H. (2016). Critical success factors for implementing lean production: the effect of contingencies, International Journal of Production Research, 54(8), 2433-2448.
OECD (2011). OECD Sustainable Manufacturing Toolkit - Start-up Guide: Seven Steps to Environmental Excellence. US Department of Commerce.
Panizzolo, R. (1998). Applying the lessons learned from 27 lean manufacturers. The relevance of relationships management. International Journal of Production Economics, 55, 223-240.
Seibel, S. (2004). A Benchmarking Model Based on the World Class Manufacturing System for Evaluating Practices and Performance of the Brazilian Export Industry”, Doctoral Thesis in Production Engineering, Universidade Federal de Santa Catarina, Florianopolis, Brazil (in Portuguese).
Severo, E.A., Ferro de Guimarães, J.C., Henri Dorion, E.C.H., and Nodari, C.H. (2015). Cleaner production, environmental sustainability and organizational performance: an empirical study in the Brazilian Metal-Mechanic industry. Journal of Cleaner Production, 96, 118-125.
Severo, E.A., Dorion, E.C.H., Olea, P.M., Camargo, M.E, Nodari, C., and da Cruz, M.R. (2012). Cleaner production: Cases of the metal-mechanic automotive cluster of Serra Gaucha, Brazil. African Journal of Business Management, 6(37), 10232-10237.
Shagluf, A., Longstaff, A.P. and Fletcher, S. (2015). A Preliminary Study of Applying Lean Six Sigma Methods to Machine Tool Measurement, In: Second International Conference on Sustainable Design and Manufacturing, 12th-14th April 2015, Seville, Spain.
Shah, R. and Ward, P.T. (2003). Lean manufacturing: context, practice bundles, and performance. Journal of Operations Management, 21(2), 129-149.
Sharma, V., Dixit, A.R., Qadri, M.A. and Kumar, S. (2015). An interpretive hierarchical model for lean implementation in machine tool sector. International Journal of Productivity and Quality Management, 15(3), 381-406.
Sheikh, A.K. (1999). Optimal tool replacement and resetting strategies in automated manufacturing systems. International Journal of Production Research, 37(4), 917–937.
Singh, R. (2013), Recent Advancement in Manufacturing Processes, Special Issue, Materials Science Forum, 751, 94.
Sun, P., Zhang, C., Jiang, P. and Cao, W. (2016). Cutting-tool delivery method in the context of industrial product service systems. Concurrent Engineering; Research and Applications, 24(2), 178-190.
Svinjarević, G., Stoić, A. and Kopač, J. (2007). Implementation of cutting tool management system. Journal of Achievements in Materials and Manufacturing Engineering, 23(1), 99-102.
Tan, H.X, Yeo, Z., Ng, R., Tjandra, T.B. and Song, B. (2015). A sustainability indicator framework for Singapore small and medium-sized manufacturing enterprises. Procedia of CIRP, 29, 132-137.
Taylor, A., Taylor, M. and McSweeney, A. (2013). To-wards greater understanding of success and survival of lean systems. International Journal of Production Research, 51(22), 6607–6630
Tomelero, R.L. (2012). Lean environmental benchmarking: a method for diagnosing practices and performances applied to tool management. Master Thesis in Mechanical Engineering, Universidade Federal de Santa Catarina, Florianopolis, Brazil (in Portuguese),
Turkcan, A., Akturk, M.S. and Storer, S.H. (2003). Non-identical parallel CNC machine scheduling. International Journal of Production Research, 41(1), 2143–2168.
Veeramani, D., Upton, D. M. and Barash, M. M. (1992). Cutting-tool management in computer-integrated manufacturing. International Journal of Flexible Manufacturing Systems, 4(3-4), 237-265.
Veleva, V. and Ellenbecker, M. (2001). Indicators of sustainable production: framework and methodology. Journal of Cleaner Production, 9, 519-549.

Venkataraman, K., Ramnath, B.V., Kumar, V.M. and Elanchezhian, C. (2014). Application of Value Stream Mapping for Reduction of Cycle Time in a Machining Process. Procedia Materials Science, 6, 1187-1196.
Wu, P., Pienaar, J. and O'Brien, D. (2013). Developing a lean benchmarking process to monitor the carbon efficiency in precast concrete factories-a case study in Singapore. College Publishing. 8(2), 133-152.
Figure 1. Proposed LEB method (Tomelero, 2012)

Figure 2. Final results of practices and performance (Tomelero, 2012)
Study of Strategic Planning (SP)
Study of Technical Planning (TP)
Study of Logistics Planning (LP)
% PR SP
% PF SP
% PR TP
% PF TP
% PR LP
% PF LP
% Final Practice (PR) % Final Performance (PF)

Figure 3. General chart of practices x performance of the surveyed companies (Tomelero, 2012)

Figure 4. Radar chart with the average values in practices and performance for the surveyed companies (Tomelero, 2012)

Figure 5. Bar chart of the average grade of the surveyed companies for each indicator variable of strategic planning (Tomelero, 2012)

Figure 6. Bar chart of the average grade of the surveyed companies for each indicator variable of technical planning (Tomelero, 2012)

Figure 7. Bar chart of the average grade of the surveyed companies for each indicator variable of logistics planning (Tomelero, 2012)
Table 1: Indicators of strategic planning that comprise the LEB method (adapted from Tomelero, 2012)Indicators of Strategic Planning
Practices Description
SP-01 Performance and Target Indicators Measures the development of performance and target indicators for the activity of cutting tool management.
SP-02 Relationship with Suppliers Assesses the existence of criteria for buying new cutting tools and strategic alliances with suppliers.
SP-03 Outsourcing Assesses the studies and establishment of criteria for outsourcing activities.
SP-04 Strategy of Environmental Management Measures the existence of a strategy for managing the environmental aspects related to the use of cutting tools.
SP-05 Selection of Cutting Tools that use Minimum Quantity Lubrication (MQL)
Measures the research for the selection, development, and testing to replace in partnership with toolmakers, cutting tools that use MQL.
Performances Description
SP-06 Treatment of Machining Cutting Fluid Measures the amount of cutting fluids that are disposed properly after becoming unusable.
SP-07 Disposal and Recycling of Cutting Tools Measures the number of cutting tools that are disposed and recycled appropriately after the end of their useful life.
SP-08 Reuse of Cutting Tools Measures the amount of cutting tools that are reused within the company for manufacturing other products.
SP-09 Remanufacture of Cutting Tools Measures the amount of cutting tools that undergo remanufacturing operations.
SP-10 Inventory of Cutting Tools and Machines Measures the frequency at which inventories are held and in what quantity of cutting tools and machines.

SP-11 Standardization of Cutting Tools Measures the variety of cutting tools used by the company for each feature to be machined, for each component.
SP-12 Rationalisation of Cutting Tools Measures the amount of cutting tools that are provided just in time, from inventory to production.
SP-13 Index of Orders Received on Time Measures the delivery timeliness of purchase orders and outsourcing services of cutting tools.
Table 2: Indicators of technical planning that comprise the LEB method (adapted from Tomelero, 2012)Indicators of Technical Planning
Practices Description
TP-01 Machining DatabaseAssesses the existence of a machining database containing relevant information concerning cutting tool management activities.
TP-02 Identification of Cutting Tools and Fixtures Assesses the existence of coding models to identify the cutting tools and fixturing devices.
TP-03 Selection of Cutting Tools, Machine Tools, and Cutting Conditions
Assesses whether there is a strategy to select individual cutting tools, assembly of cutting tools, machines, and machining parameters.
TP-04 Definition of Tool Life Assesses the existence of a strategy with criteria to define the life of each cutting tool.
TP-05 Control, Analysis, and Prevention of Failures of Cutting Tools
Assesses the execution of control, analysis, and prevention of tool failures.
TP-06 Reduction of Costs with Cutting Tools for Each Part Produced
Assesses the execution of analysis and improvement of machining processes, aimed at reducing the cutting tool costs per part produced.
Performances Description
TP-07 Percentage of Identified Cutting Tools Measures the amount of cutting tools and fixturing devices that are correctly identified by the company.
TP-08 Index of Cutting Tool FailuresMeasures the amount of cutting tools that fail during the processing of products relative to the total of cutting tools within the plant.
TP-09 Unexpected Stops Due to Cutting Tool Failures
Measures the frequency with which production is halted due to tool failure.
TP-10 Maintenance and Data Update of Cutting Tools
Measures the amount of cutting tools that have data stored and updated, relevant to the production system.
Table 3: Indicators of logistics planning that comprise the LEB method (adapted from Tomelero, 2012)Indicators of Logistics Planning
Practices Description
LP-01 Storage of Cutting Tools Assesses the existence of a strategy for the storage of cutting tools.
LP-02 Planning and Control of Inventory of Cutting Tools
Assesses decision-making on planning and control of the cutting tools inventory, and in what amount the tools are stored.
LP-03 Allocation of Cutting ToolsAssesses the existence of a strategy for the allocation of components and assemblies of tools next to the machine tools.
LP-04 Setup, Assembly, and Disassembly of Cutting Tools
Identifies the practice of a program for setup, assembly, and disassembly adequate to the cutting tools before and after their use in production.
LP-05 Inspection and Management of Cutting Tools
Assesses the existence of a strategy for inspection and maintenance of cutting tools.
LP-06 Strategy of Moving the Cutting ToolsAssesses the existence of a strategy for handling the cutting tools between the inventory or tool room and the circulating inventory.
LP-07 Rapid Exchange of Cutting Tools Assesses the development of practices related to the reduction of machine set-up times.
Performances Description
LP-08 Percentage of Storage of Cutting Tools Measures how much of the inventory of cutting tools is known and stored in an appropriate manner by the company.
LP-09 Index of Unexpected StopsMeasures the frequency in which production is interrupted or not performed within the prescribed period due to no knowledge of the location and availability of cutting tools.
LP-10 Traceability of Cutting Tools
Measures knowledge in real time of the location of a particular item or assembly of cutting tools while they are in the inventory, in the circulating inventory or even being reconditioned by a third party.
LP-11 Percentage of Setup TimeMeasures how much of the available total time of machine tools is spent with the setup activity for the entry of new batches.
LP-12 Degree of Obsolescence of Cutting Tools Measures the amount of obsolete cutting tools that the company has in inventory.
Table 4. Some characteristics of the surveyed companies (adapted from Tomelero, 2012)
Company Number of employees
Implemented ISO standards
Layout of machining processes
Number of conventional
machines
Number of CNC
machines
A964 ISO 9001, ISO TS-
16949 and ISO 14001 Manufacturing Cells Not informed Not informed
Manufactured products: starting boosters, hydraulic clutch actuators, alternator bearings, tensioners, planetary, wheel hubs.
B2,800 ISO 9001, ISO TS-
16949 and ISO 14001 Manufacturing Cells 200 180
Manufactured products: Automotive parts, air compressors, motor pumps, washing machines, tools.
C23,800 ISO 9001 and ISO
14001Manufacturing Cells and
Production Line Not informed Not informed
Manufactured products: electric motors, electrical panels, drives, controls, paints and varnishes, generators, transformers, hydraulic turbines.
D9,000 ISO 9001, ISO TS-
16949 and ISO 14001
Flow shop, Manufacturing Cells and
Production LineNot informed Not informed
Manufactured products: automotive parts, iron fittings, steel shot.
E350 ISO 9001, ISO TS-
16949 and ISO 14001 Production Line 8 450
Manufactured products: internal combustion engines.
FNot
informedISO 9001, ISO TS-
16949 and ISO 14001Manufacturing Cells and
Production Line Not informed Not informed
Manufactured products: passenger and freight vehicles.
G> 500 ISO 9001, ISO TS-
16949 and ISO 14001 Manufacturing Cells 175 55
Manufactured products: Servo drives, gear pumps and motors, pistons, planetary gear units, sensors, valves and hydraulic cylinders.
H700 ISO 9001 and ISO
14001 Manufacturing Cells 20 40
Manufactured products: machining centers, special machine tools, transfer systems, flexible systems, assembly machines.
I492 ISO 9001 Manufacturing Cells 18 10
Manufactured products: bulk unloading platforms, forklift equipment, forestry cranes, dock levelers,

hand forklifts, truck lifts.
Table 5: Scores filled out by a professional of one of the companies, and calculated partial percentages of practices and performances for the indicators of strategic, technical, and logistics planning
Indicator of Strategic PlanningPractices Score Individual
PercentagePartial
PercentageSP-01 Performance and Target Indicators 3 60%
60%
SP-02 Relationship with Suppliers 3 60%SP-03 Outsourcing 4 80%SP-04 Strategy of Environmental Management 4 80%
SP-05 Selection of Cutting Tools that use Minimum Quantity Lubrication (MQL)
1 20%
Performances Score Individual Percentage
Partial Percentage
SP-06 Treatment of Machining Cutting Fluid 5 100%
83%
SP-07 Disposal and Recycling of Cutting Tools 5 100%SP-08 Reuse of Cutting Tools 5 100%SP-09 Remanufacture of Cutting Tools 5 100%SP-10 Inventory of Cutting Tools and Machines 5 100%SP-11 Standardization of Cutting Tools 3 60%SP-12 Rationalisation of Cutting Tools 3 60%SP-13 Index of Orders Received on Time 2 40%
Indicators of Technical PlanningPractices Score Individual
PercentagePartial
PercentageTP-01 Machining Database 4 80%
47%
TP-02 Identification of Cutting Tools and Fixtures 1 20%
TP-03 Selection of Cutting Tools, Machine Tools, and Cutting Conditions
3 60%
TP-04 Definition of Tool Life 1 20%
TP-05 Control, Analysis, and Prevention of Failures of Cutting Tools
3 60%
TP-06 Reduction of Costs with Cutting Tools for Each Part Produced
2 40%
Performances Score Individual Percentage
Partial Percentage
TP-07 Percentage of Identified Cutting Tools 5 100%
70%
TP-08 Index of Cutting Tool Failures 3 60%
TP-09 Unexpected Stops Due to Cutting Tool Failures
1 20%
TP-10 Maintenance and Data Update of Cutting Tools
5 100%
Indicators of Logistics PlanningPractices Score Individual
PercentagePartial
PercentageLP-01 Storage of Cutting Tools 4 80%
83%
LP-02 Planning and Control of Inventory of Cutting Tools
5 100%
LP-03 Allocation of Cutting Tools 3 60%
LP-04 Setup, Assembly, and Disassembly of Cutting Tools
4 80%
LP-05 Inspection and Management of Cutting Tools 4 80%LP-06 Strategy of Moving the Cutting Tools 4 80%LP-07 Rapid Exchange of Cutting Tools 5 100%
Performances Score Individual Percentage
Partial Percentage
LP-08 Percentage of Storage of Cutting Tools 5 100%
72%LP-09 Index of Unexpected Stops 5 100%LP-10 Traceability of Cutting Tools 1 20%LP-11 Percentage of Setup Time 2 40%LP-12 Degree of Obsolescence of Cutting Tools 5 100%
Appendix A: Indicators comprising the LEB method
SP-03: Outsourcing - Outsourcing of machining tool management activities such as regrinding, new coating application, pre-setting, supplies/logistics and process engineering, has been an alternative to companies that do not have specialized personnel, and also for keeping the main focus on the company’s core business, in search for greater productivity and higher product quality. This practice, as well as which services and quantities of tools that can be outsourced depend on each company according to its structure, product and characteristics of the manufacturing process.
SP-04: Strategy of Environmental Management - This indicator seeks to verify if the company has a strategy for the management of environmental aspects related to the use of cutting tools, such as the treatment of lubricant fluids, selection of tools that use MQL, as well as tools for dry machining, disposal of chips, disposal and recycling of the tools after the end of their useful life, reuse of tools (e.g. obsolete tools), tool remanufacturing (e.g. regrinding, new coatings).
SP-05: Selection of Cutting Tools that use Minimum Quantity Lubrication (MQL) - The complete elimination of lubricant fluids is the ideal situation from an environmental and occupational health point of view. Despite pressures for the elimination of lubricants, in many situations it is not economically or technically possible to eliminate them. This indicator therefore measures whether the company seeks to carry out research for the selection, development and testing to replace, in partnership with tool manufacturers, tools that use MQL, and also use tools for dry machining, whenever possible.
SP-06: Treatment of Lubricant Fluids - This indicator verifies the amount of lubricant fluids that are properly disposed of. The amount of these fluids that require adequate recycling or disposal presents a potential risk to man and the environment. The reuse of a lubricant as many times as possible and more efficient controls of the quality of the lubricant during its use have been stimulated by the increasing costs involved in its treatment for disposal. However, even with an efficient filtration and recovery system, its continuous use generates a contamination accumulation until it reaches a limit that hinders its use, requiring the application of legal and technical procedures for the disposal of fluids that are not suitable for use.
SP-08: Reuse of Cutting Tools - This indicator seeks to verify the amount of tools that are reused within the company. For certain machining applications, some tools may be discarded because they no longer have the capability to provide the surface quality that the part requires, but that does not mean that the tool has reached the end of its life. This same tool can be used for processing other products that do not require a better finishing or, for example, rough grinding operations within the company itself, or even by other companies in the manufacture of their products. The reuse of obsolete tools is also an important aspect, mainly in the reduction of costs with the acquisition of new tools.
SP-10: Inventory of Cutting Tools and Machines - The purpose of this indicator is to verify the frequency at which inventories are checked and in what quantity of tools and machines. The verification of the quantity and variety of tools and machines that the company possesses is of

fundamental importance in the performance of the activities of the sectors involved with the management of cutting tools. This is because it allows evaluating goals and performance indicators to discover problems related to inventory control such as tools not placed in their correct storage location, as well as the existence of obsolete tools, which in many cases can reach 50% of the company's tool inventory.
SP-11: Standardization of Cutting Tools - This indicator seeks to verify the variety of tools used by the company (materials, geometries and coatings) in relation to each feature (e.g. hole, pocket, groove) in each part. A high variety of tools occurs because they are not considered in the product design stages and also because of inadequate tool selection methods, making it a major problem in the management of cutting tools.
SP-13: Index of Orders Received on Time - The objective of this indicator is to verify the number of purchase orders and outsourcing services (e.g. regrinding, application of new coatings) that are delivered on time by suppliers or third parties. This index is very important for evaluating the performance of suppliers and subcontractors. When this performance is lower than expected, new strategies and supply and service partnerships can be developed with the same or new suppliers.
TP-01: Machining Database - The purpose of this indicator is to verify if the company has a machining database available, containing relevant information regarding the cutting tool management activities, such as tools and devices registration, cutting parameters, inventory control, flow control, etc.
TP-02: Identification of Cutting Tools and Fixtures - This indicator seeks to evaluate if the company has some coding model to identify the tools and fixtures. The identification code characterizes each tool as an individual element, enabling obtaining numerous tool data such as its location in the inventory or in the production process, standard and number, material, dimensions, tool life, etc. That is, all the information that is relevant for efficient tool management. A code should leave no doubt and usually consists of a series of alphanumeric characters. Some companies use the code adopted by the vendor itself. The form of identification depends on the strategy of each company, and can come from the manufacturer with the code already engraved in the tool or the packaging, and it can be through bar code, electronic identification devices, etc.
TP-03: Selection of Cutting Tools, Machine Tools and Cutting Conditions - This indicator seeks to verify if the company has a strategy to carry out the selection of individual tools, tool assemblies, machines and cutting parameters, according to established criteria, such as the use of recommended values in manufacturer's catalogues or optimisation of these values, production feedback, and process capability calculations.
TP-04: Definition of Tool Life - The objective of this indicator is to verify if the company has a strategy with criteria to define the end of the life of each tool. Various end-of-life criteria can be adopted, e.g. flank or crater wear, poor surface finish, chip change, machining forces, number of machined parts, vibrations, burrs, temperature increases, etc.
TP-05: Control, Analysis and Prevention of Failures of Cutting Tools - This indicator seeks to verify if the company performs the control, analysis and prevention of tool failures. Tool failure is one of the most serious disturbances that occur in the machining process. In addition to generating a disruption of the production flow, the failures generate costs for the loss of the tool itself, discarding and replacement with a new tool, damage to the tool holder and the machine tool, and the generation of waste, which can be in large quantities if the failure is not detected quickly.

TP-07: Percentage of Identified Cutting Tools - The purpose of this indicator is to verify the amount of tools and fixturing devices that are correctly identified by the company. Proper identification, together with a computerized and up-to-date database, results in knowledge of the varieties and available quantities of tools and fixturing devices in the company, benefiting all sectors involved in the management of cutting tools in decision making. An efficient identification also ensures the knowledge of the exact location in the factory and the technical data of each tool and fixture.
TP-09: Unexpected Stops Due to Cutting Tool Failures - This indicator seeks to check how often production is interrupted due to tool failures, leading to high production delays, low productivity and high manufacturing costs. In lean production systems, where a proactive attitude is adopted, such stops cannot be tolerated, but even so they can occur due to unexpected and non-controllable events such as peaks in energy and parts with oversized material received from suppliers. In order to verify this indicator, all the production stops caused by tool failures must be considered. TP-10: Maintenance and Data Update of Cutting Tools - The purpose of this indicator is to verify the amount of tools that have stored and updated data, which are relevant to the entire production system. It is important that the knowledge developed inside the company is securely stored in physical or electronic documents so that future employees can access and use them, not losing them during the exchange of employees. Maintenance and update of documents such as cutting tool drawings are fundamental to avoid various problems and long machine stops. All changes to the process should be updated in the documentation as soon as possible, so that everyone involved takes appropriate actions.
LP-03: Allocation of Cutting Tools - This indicator verifies if the company has strategies for allocating components and tool assemblies to machine tools. Some examples of strategies are: providing the necessary cutting tools to the machine at the beginning of the day or shift and collecting them for maintenance at the end of the day or shift; after using a group of tools that will no longer be used during the day, collect them for maintenance and use them in the manufacture of other parts; use intermediate inventory next to machine tools and replenish with new or reground tools as they are consumed. The strategy adopted depends on the characteristics of the company's production system, such as type of layout, variety of parts, batch size of manufactured parts and variety and quantity of tools used by the company.
LP-04: Setup, Assembly, and Disassembly of Cutting Tools - This indicator is responsible for identifying the practice of a setup programme, assembly and disassembly of the cutting tools before and after use. The pre-setting activity is part of the inventory turnover area, which is composed of tools that have already been taken out of the main stock of new and used tools that are in use or in preparation for use. In setup, an analysis is performed of the general condition of the cutting tools and fixturing devices after assembly and disassembly, carrying out measurements, checking for wear and cracks, sending the correct values to the machines, generation of reports and, if necessary, tool balancing. This practice contributes greatly to avoid disturbances in the production process, such as failures and production delays, as well as helping to ensure the desired quality of the product.
LP-05: Inspection and Management of Cutting Tools - This indicator seeks to identify if the company has a strategy for inspecting and maintaining cutting tools. The practice of inspecting incoming tools (which may be wrong or defective) contributes to avoid future planning problems and disturbances on the shop floor. Maintenance activities such as cleaning, regrinding and application of new coatings, which, depending on the size of the company, can be carried out internally or by third parties, are extremely important for a better use of tool resources. A tool inspection and maintenance programme can manage internal and third party activities, and should contain procedures and routines for each activity with information such as dates, identification,

quantities, person responsible, etc. In companies with a significant amount of tools, maintenance activities can be supported by Kanban.
LP-06: Strategy of Moving the Cutting Tools - The objective of this indicator is to verify the existence of a strategy of moving the cutting tools between the inventory or tool room and the circulating inventory. In planning and control of the flow of cutting tools on the factory floor, which involves replenishments and collections of the tools from the machine tools, it is necessary to organise their transportation, controlling types, quantities, places, dates and times of delivery and collection of each tool, thus ensuring that there is no excess or shortage of tools next to the machine tools. The implementation of control via Kanban can present good results, for example, in the reduction of machine shutdown due to lack of tools, the rationalisation of the tools on the shop floor, and obtaining the history of setup and consumption of tools.
LP-07: Rapid Exchange of Cutting Tools - For this indicator the objective is to evaluate the development of practices related to the reduction of the setup times. The rapid exchange of tools provides speed of response to the system, enables small batch manufacturing and pulled production, contributing to the establishment of a continuous flow and the reduction of inventories. In lean production systems the ideal set-up time would be zero, however, when it is not possible to eliminate it, it is important to work on the continuous reduction of setups.
LP-08: Percentage of Storage of Cutting Tools - This indicator verifies how much of the inventory of tools is known and stored properly by the company. Proper storage together with a computerized and up-to-date database facilitates knowledge of the varieties and available quantities of tools in the company, benefiting all sectors involved in the management of cutting tools in decision making. One of the main gains from knowing the place of storage of all the tools is the significant reduction in the times of search for tools, which leads to an increase in production rates and reduction of manufacturing costs. LP-09: Index of Unexpected Stops - This indicator seeks to verify the frequency with which production is interrupted or not realised in the established period, due to the lack of knowledge of the location and availability of the cutting tools, which leads to high production delays, resulting in low productivity and high manufacturing costs. This indicator can be improved by a strategy of identification and adequate storage of the tools, and for its determination all production stops that were caused by not knowing the location and availability of the tools should be considered.
LP-10: Traceability of Cutting Tools – The objective of this indicator is to verify whether the company knows in real time the location of a certain individual item or tool assemblies being in inventory, in circulating inventory or even in reconditioning through a third party. An item can be traced through software, which can be commercial or developed by the company itself, containing information of each item, such as its code, quantity and location, and serial number when the tool has a high cost. The lack of traceability can interfere with tool storage, with an increase in items to avoid a possible tool shortage, and also in the occurrence of individual inventories of cutting tools next to the machine tool.