Embed Size (px)
Citation preview

1
REG
ION
S A
ND
NET
WO
RK
S R
egio
nal I
mpa
ct o
f Priv
ate
and
Publ
ic In
vest
men
t
Instituto Superior Técnico / Masters in Civil Engineering – Regions and Networks 2010/2011
Instituto Superior Técnico Masters in Civil Engineering
REGIÕES E REDES
(REGIONS AND NETWORKS)
Theme 3: Regional Economic Impact of Private and Public Investment Introductory Lecture
Prof. José Manuel Viegas

2
REG
ION
S A
ND
NET
WO
RK
S R
egio
nal I
mpa
ct o
f Priv
ate
and
Publ
ic In
vest
men
t
Instituto Superior Técnico / Masters in Civil Engineering – Regions and Networks 2010/2011
OUTLINE (I)
Regional economics Fundamental concepts Modeling regional economic growth
Methods for regional economic analysis Measure the economic development of one region Comparison of two or more regions Measure the economic flows between regions (Input-Output Matrix) Accessibility indicators
Public investment and economic development Public investment on Portuguese highways during the 90s The case of Beira Interior

3
REG
ION
S A
ND
NET
WO
RK
S R
egio
nal I
mpa
ct o
f Priv
ate
and
Publ
ic In
vest
men
t
Instituto Superior Técnico / Masters in Civil Engineering – Regions and Networks 2010/2011
OUTLINE (II)
Moving from projects of investment towards programs of investment Differences between a project and a program
The Portuguese National Strategic Reference Framework (QREN) The Example of German Federal Transport Plan
‘Soft’ instruments for ROI and ICTs The need for ‘soft’ instruments to enhance return on investment (ROI) Information as a valuable asset (inform private investors of
opportunities) Examples of ‘soft instruments’: information network, operational support
from national and regional authorities, others The importance of Information and Communication Technologies (ICT)

4
REG
ION
S A
ND
NET
WO
RK
S R
egio
nal I
mpa
ct o
f Priv
ate
and
Publ
ic In
vest
men
t
Instituto Superior Técnico / Masters in Civil Engineering – Regions and Networks 2010/2011
Regional economics – some basics (I) Economic growth
Increase in the amount and/or value of the goods and services produced by an economy over time.
It is conventionally measured as the percent rate of increase in real gross domestic product, or real GDP (i.e. inflation adjusted terms).
Economic development Development of economic wealth of countries or regions for the well-being
of their inhabitants. Differently to economic growth, economic development involves other
aspects: Literacy rates, life expectancy, poverty rates, among others. GDP is a specific measure of economic welfare that does not take into
account important aspects such as leisure time, environmental quality, freedom, or social justice.

5
REG
ION
S A
ND
NET
WO
RK
S R
egio
nal I
mpa
ct o
f Priv
ate
and
Publ
ic In
vest
men
t
Instituto Superior Técnico / Masters in Civil Engineering – Regions and Networks 2010/2011
Regional economics – some basics (II) Investment
It is the process of exchanging income during one period of time for something that is expected to produce earnings in future periods. Productive investment occurs when that something has a sustained capacity to produce a valuable output
Public Investment is performed by governments and, in theory, is possible when total production exceeds total consumption Because investment increases an economy’s capacity to produce, it is an important
factor for economic growth Private investment (by individuals or companies) can be applied in the means of
production or it can be purely financial investment (which is partly circulated by the financial system into the productive sectors)
Foreign Direct Investment (FDI) occurs when a company from one country makes a physical investment into building a factory (for example) in another country. Important indicator since it is also an indicator of the ‘well-being’ of the economy as
whole (e.g., stable economy, no corruption, good administration, etc.)

6
REG
ION
S A
ND
NET
WO
RK
S R
egio
nal I
mpa
ct o
f Priv
ate
and
Publ
ic In
vest
men
t
Instituto Superior Técnico / Masters in Civil Engineering – Regions and Networks 2010/2011
Regional economics and investment - Models of regional economic growth (I)
What is a model of economic growth? It is a “production function” that relates some measure of output, such
as GDP, to the inputs required to produce. For example, it is possible to relate GDP to the size of the labor force (L),
capital stock (K) and to various other ‘factors of production’. Symbolic equation:
Factors of production (or productive inputs) Prod. Factor Indicator to measuring each variable Labor Man.hours by sector of production Capital Euros Land Square kilometers of valuable land classified by type of use Technology Number of engineers Entrepreneurship Rate of company creation
,...)T,L,K(FY =

7
REG
ION
S A
ND
NET
WO
RK
S R
egio
nal I
mpa
ct o
f Priv
ate
and
Publ
ic In
vest
men
t
Instituto Superior Técnico / Masters in Civil Engineering – Regions and Networks 2010/2011
Regional economics and investment - Models of regional economic growth (II)
Harrod-Domar model The model was developed independently by Sir Roy F. Harrod in 1939 and
Evsey Domar in 1946. It is used in development economics to explain an economy's growth rate
in terms of the level of saving and productivity of capital (taken as the only factor of productivity).
KIKISsY
KY
KY
KY
cKY
)K(fY
∂−=Δ
==
=∂∂
⇒=∂
∂
=∂∂
=
02
2
Output Y is a function of capital stock K. The marginal product of capital is constant c, i.e. the production
function exhibits constant returns to scale. Since the marginal product of capital is constant, it equals the
constant ratio Y/K The product of the savings rate (s) and output (Y) equals saving
(S), which equals investment (I) The change in the capital stock K equals investment I less the
depreciation of the capital stock.

8
REG
ION
S A
ND
NET
WO
RK
S R
egio
nal I
mpa
ct o
f Priv
ate
and
Publ
ic In
vest
men
t
Instituto Superior Técnico / Masters in Civil Engineering – Regions and Networks 2010/2011
Regional economics and investment - Models of regional economic growth (III)
Assumptions (limitations) of the Harrod-Domar model Behavioral assumption
People tend to save a certain proportion of extra income, constantly over time Production structure is constant
Technical assumptions Investment generates additional output, a fact that can be established. The effects of technological development (i.e., labor productivity) are not
included No economies of scale
Equilibrium condition: Planned saving must equal planned investment in every period if the income
level of the period is to be sustained.

9
REG
ION
S A
ND
NET
WO
RK
S R
egio
nal I
mpa
ct o
f Priv
ate
and
Publ
ic In
vest
men
t
Instituto Superior Técnico / Masters in Civil Engineering – Regions and Networks 2010/2011
Regional economics and investment - Models of regional economic growth (IV)
Neo-classical models (exogenous growth model) An extension of the Harrod-Domar model by including labor Major contributors: Robert Solow and T.W.Swan (1956)
Factors of production: n = population growth rate d = depreciation k = capital per worker y = output/income per worker L = labor force s = saving rate
Labor productivity is constant No impacts from technological development ‘Endogenous growth models’ include technology and R&D expenditure
)t,L,K(fY =

10
REG
ION
S A
ND
NET
WO
RK
S R
egio
nal I
mpa
ct o
f Priv
ate
and
Publ
ic In
vest
men
t
Instituto Superior Técnico / Masters in Civil Engineering – Regions and Networks 2010/2011
Methods for regional economic analysis
TIME - SPACE (Intra-) Regional Inter-regional
Aggregates Flows Aggregate Comparisons Flows
Static / Cross-sectional GDP/GRP Regional
Input-Output
Location Quotient
Interregional Input-Output
Comparative Static Analysis
Regional Multipliers
Interregional Multipliers
Comparative Cross-sectional Analysis
Regional Rates of Change
Shift & Share Analysis
Multi-period Analysis Regional Cohort Analysis
Inter-Regional Cohort Migration Analysis
(Source: Gunter Krumme, http://faculty.washington.edu/krumme/systems/spatemp.html)
11
REG
ION
S A
ND
NET
WO
RK
S R
egio
nal I
mpa
ct o
f Priv
ate
and
Publ
ic In
vest
men
t
Instituto Superior Técnico / Masters in Civil Engineering – Regions and Networks 2010/2011
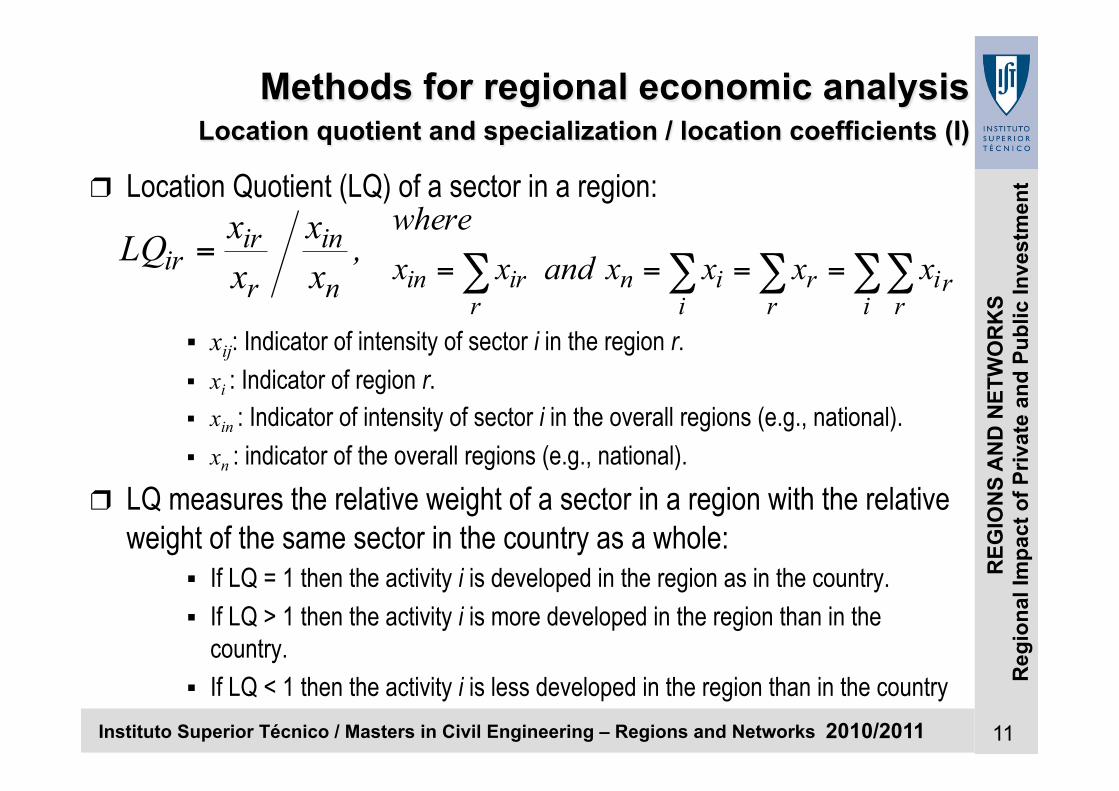
Methods for regional economic analysis Location quotient and specialization / location coefficients (I)
Location Quotient (LQ) of a sector in a region:
xij: Indicator of intensity of sector i in the region r. xi : Indicator of region r. xin : Indicator of intensity of sector i in the overall regions (e.g., national). xn : indicator of the overall regions (e.g., national).
LQ measures the relative weight of a sector in a region with the relative weight of the same sector in the country as a whole:
If LQ = 1 then the activity i is developed in the region as in the country. If LQ > 1 then the activity i is more developed in the region than in the
country. If LQ < 1 then the activity i is less developed in the region than in the country
,xx
xxLQ
n
in
r
irir = ∑∑∑∑∑ ====
i rri
rr
iin
ririn xxxxandxx
where

12
REG
ION
S A
ND
NET
WO
RK
S R
egio
nal I
mpa
ct o
f Priv
ate
and
Publ
ic In
vest
men
t
Instituto Superior Técnico / Masters in Civil Engineering – Regions and Networks 2010/2011
Methods for regional economic analysis Location quotient and specialization / location coefficients (II)
Coefficient of Specialization (CS) of a region: (varies between 0 and 1)
CS measures the sector specialization of the region:
If CS = 0 then the region r is not specialized concerning the national distribution of activities (i.e., the sector-based structure of the region is identical to the sector-based structure of the country).
If CS = 1 then the region r is specialized (i.e., in other words the sector-based structure of the region differs totally from the corresponding national).
∑ −=i n
in
r
irr x
xxxCS
21
Weight of sector i in
region
Weight of sector i in
country

13
REG
ION
S A
ND
NET
WO
RK
S R
egio
nal I
mpa
ct o
f Priv
ate
and
Publ
ic In
vest
men
t
Instituto Superior Técnico / Masters in Civil Engineering – Regions and Networks 2010/2011
Methods for regional economic analysis Location quotient and specialization / location coefficients (III)
Coefficient of location (CL) of a region: (oscillates between 0 and 1)
CL measures how the sector is distributed in the region
If CL = 0, then for all sectors the relative national weight of the region is identical to its weight in the economy as a whole
If CL = 1, then some sectors are very concentrated in that region and other sectors are (almost) absent from that region
∑ −=i n
r
in
irr x
xxxCL
21
Weight of region r in country, for
sector i
Weight of region r in country, in total

14
REG
ION
S A
ND
NET
WO
RK
S R
egio
nal I
mpa
ct o
f Priv
ate
and
Publ
ic In
vest
men
t
Instituto Superior Técnico / Masters in Civil Engineering – Regions and Networks 2010/2011
Methods for regional economic analysis – Input-Output Matrix (I)
Origin Economic analysis developed by the 20th-century Russian-born U.S.
economist Wassily W. Leontief. Overall understanding
the interdependence of an economy’s various productive sectors is observed by viewing the product of each industry both as a commodity demanded for final consumption and as a factor in the production of itself and other goods.
Certain simplifying assumptions are made, such as the productive resources will always be combined in the same proportions to produce any amount of a final product.
Output: determine the total quantities of various goods that must be produced to obtain a given amount for final consumption.

15
REG
ION
S A
ND
NET
WO
RK
S R
egio
nal I
mpa
ct o
f Priv
ate
and
Publ
ic In
vest
men
t
Instituto Superior Técnico / Masters in Civil Engineering – Regions and Networks 2010/2011
Methods for regional economic analysis – Input-Output Matrix (II)
How it looks and it is structured:
Source: OECD (2006), Input-output analysis in an increasingly globalised world (http://www.oecd.org/dataoecd/6/34/37349386.pdf)

16
REG
ION
S A
ND
NET
WO
RK
S R
egio
nal I
mpa
ct o
f Priv
ate
and
Publ
ic In
vest
men
t
Instituto Superior Técnico / Masters in Civil Engineering – Regions and Networks 2010/2011
Methods for regional economic analysis – Input-Output Matrix (III)
How it looks and is structured:
Source: OECD (2006), Input-output analysis in an increasingly globalised world (http://www.oecd.org/dataoecd/6/34/37349386.pdf)
1st Section Flows of Intermediate Goods between domestic
suppliers and domestic users.
2nd Section– Imported Products
3rd Section Value Added
4th Section Supply of goods not consumed by
domestic industry
5th Section– taxes, subsidies, etc.

17
REG
ION
S A
ND
NET
WO
RK
S R
egio
nal I
mpa
ct o
f Priv
ate
and
Publ
ic In
vest
men
t
Instituto Superior Técnico / Masters in Civil Engineering – Regions and Networks 2010/2011
Methods for regional economic analysis – Input-Output Matrix (IV)
Inter-regional input-output matrix:
(Source: Simões Lopes, A. (1995), Desenvolvimento Regional – 4ª edição , ed. Fundação Calouste Gulbenkian, Lisboa.)
Sub-Region Export Total
OutputSub-Region Sector 1 2 3 1 2 3 A B
1 - 20 20 - 30 - 20 10 - 100
2 10 - 40 - - 10 40 - - 100
3 30 - - - 10 - 30 - - 70
1 - - - - 10 - - 40 20 70
2 20 - - 10 - 30 10 70 50 190
3 - 10 - 20 40 40 - 30 140
A 40 20 10 - 30 - - - - 100
B - 50 - 60 60 20 - 10 - 200
Imports - - - 10 20 - - - - 30
Total Input 100 100 70 100 200 100 100 160 70 1000
A B Final Demand
A
B
Worker's Income

18
REG
ION
S A
ND
NET
WO
RK
S R
egio
nal I
mpa
ct o
f Priv
ate
and
Publ
ic In
vest
men
t
Instituto Superior Técnico / Masters in Civil Engineering – Regions and Networks 2010/2011
Methods for regional economic analysis – Input-Output Matrix (V)
How it works Input-output models are most commonly used to trace individual
changes in final demand through the economy over short periods of time.
Technical Coefficients (Leontief Coefficients), aij:
Multiplier concept It is a numerical coefficient which relates the change of a component of
aggregate demand (such as the export demand for a region's products) to a consequent change in output (or income or employment).
).x(jx,x/xai
ijjjijij ∑== sector toinputtotaltheiswhere

19
REG
ION
S A
ND
NET
WO
RK
S R
egio
nal I
mpa
ct o
f Priv
ate
and
Publ
ic In
vest
men
t
Instituto Superior Técnico / Masters in Civil Engineering – Regions and Networks 2010/2011
Methods for regional economic analysis – Input-Output Matrix (VI)
Input-Output multipliers (aka Leontief Multipliers) X = AX +Y X – AX = Y X (I – A) = Y X = Y / (I – A) divide both sides by (I-A), thus enabling you to cancel the (I-A) on the left-hand side X = (I – A)-1Y Where X = total output of n sectors.
A = matrix of technology input coefficients (aka Leontief coefficients or direct requirement coefficients matrix).
Y = vector of final demand. I = identity matrix, with 1s along the main diagonal and zeros elsewhere.

20
REG
ION
S A
ND
NET
WO
RK
S R
egio
nal I
mpa
ct o
f Priv
ate
and
Publ
ic In
vest
men
t
Instituto Superior Técnico / Masters in Civil Engineering – Regions and Networks 2010/2011
Methods for regional economic analysis – Input-Output Matrix (VII)
How it works Output (production) Multiplier, mj
C=(I – A)-1 is the input-output multiplier matrix. It is an output multiplier that we can convert it into an employment (or income or value added) multiplier (refer to next slides).
It is calculated by where cij belongs to the matrix C. The idea is that a one dollar change in some autonomous component of
aggregate Demand leads to more than one dollar change in new output.
∑=iijj cm

21
REG
ION
S A
ND
NET
WO
RK
S R
egio
nal I
mpa
ct o
f Priv
ate
and
Publ
ic In
vest
men
t
Instituto Superior Técnico / Masters in Civil Engineering – Regions and Networks 2010/2011
Methods for regional economic analysis – Input-Output Matrix (VIII)
How it works Income Multiplier To calculate the income multiplier, a row (input) is introduced in the IO matrix (not
shown in the example before) and is analyzed as one additional industry sector. The corresponding output is the household consumption (or final private consumption).
Totals do not match necessarily, since some of the household consumption does not come from salaries but from other sources of income (e.g., pensions, dividends, etc.).
One additional row is introduced in the matrix A (Leontief coefficients) that refers to the household incomes (i.e., salaries, employees’ compensations and so on). The direct income coefficient is the ratio of household income in column j to total input in column j and is taken directly from the household income row.
The input-output multiplier matrix is obtained as for the output multiplier and includes one row for income and one column for household consumption
Income multipliers show the increase in income from employment throughout the economy that results from a change of 1 of income from employment in each industry.

22
REG
ION
S A
ND
NET
WO
RK
S R
egio
nal I
mpa
ct o
f Priv
ate
and
Publ
ic In
vest
men
t
Instituto Superior Técnico / Masters in Civil Engineering – Regions and Networks 2010/2011
Methods for regional economic analysis – Input-Output Matrix (IX)
How it works Employment Multiplier
The employment multipliers show the total increases in employment throughout the economy which result from an increase in final demand which is enough to create one additional full-time employment in one industry j.
The analysis uses the same approach as before, but additionally requires Full-Time Employment Equivalent (FTE) data to convert final consumption and income of household into number of FTE. This data is required in the format of the number of FTE’s by the industry sectors of an economy, and is derived using data from the national statistics.
Note this data usually covers employees only and therefore does not cover self-employed persons. Care must taken when interpreting multiplier analysis of industries that contain a large number of self-employed persons.

23
REG
ION
S A
ND
NET
WO
RK
S R
egio
nal I
mpa
ct o
f Priv
ate
and
Publ
ic In
vest
men
t
Instituto Superior Técnico / Masters in Civil Engineering – Regions and Networks 2010/2011
Methods for regional economic analysis – Shift-share analysis (I)
Shift/share analysis is a technique sometimes used for retrospectively decomposing changes, usually in employment, in a set of urban areas or regions. Regional scientists widely use the technique to examine the sources of employment growth or decline in some region.
Shift-share analysis decomposes employment growth (or decline) in a region over a given time period into three components: 1. a national growth effect, which is that part of the change in total employment in a
region ascribed to the rate of growth of employment in the nation as a whole, 2. an industry mix effect, which is the amount of change the region would have
experienced had each of its industries grown at their national rates, less the national growth effect, and
3. a competitive effect, which is the difference between the actual change in employment and the employment change to be expected if each industrial sector grew at the national rate.
The sum of these three effects equals the actual change in total employment within a region over a prescribed time period.

24
REG
ION
S A
ND
NET
WO
RK
S R
egio
nal I
mpa
ct o
f Priv
ate
and
Publ
ic In
vest
men
t
Instituto Superior Técnico / Masters in Civil Engineering – Regions and Networks 2010/2011
Methods for regional economic analysis – Shift-share analysis (II)
Change in employment in the study area’s ith activity from time t to time t+n can be measured as follows:
Where e is the total employment in our area,
E is the total employment in the reference area (usually the country), i is some activity in the region and the reference area.
Share change
Industry mix change
Shift change

25
REG
ION
S A
ND
NET
WO
RK
S R
egio
nal I
mpa
ct o
f Priv
ate
and
Publ
ic In
vest
men
t
Instituto Superior Técnico / Masters in Civil Engineering – Regions and Networks 2010/2011
Methods for regional economic analysis – Equity and Accessibility indicators (I)
Lorenz Curve The Lorenz Curve represents
a cumulative probability distribution function
It is often used to represent income distribution, where it shows for the bottom x% of households, what percentage y% of the total income they have
Gini Coefficient The Gini coefficient is the area between the line of perfect equality and the
observed Lorenz curve, as a percentage of the area between the line of perfect equality and the line of perfect inequality. The higher the coefficient, the more unequal the distribution is.

26
REG
ION
S A
ND
NET
WO
RK
S R
egio
nal I
mpa
ct o
f Priv
ate
and
Publ
ic In
vest
men
t
Instituto Superior Técnico / Masters in Civil Engineering – Regions and Networks 2010/2011
Methods for regional economic analysis – Equity and Accessibility indicators (II)
Indicators of accessibility of one region Measure the potential of interaction of the base region with all
destinations that can be reached within some travel time that is defined a priori
We present two indicators of demographic and economic accessibility
( ) ∑=
=N1,j
jki PTAD
( ) ∑=
=N1,j
jki TAE GDP
and
, considering that tij ≤ Tk
Where: ADi = Indicator of demographic accessibility of region i; AEi = Indicator of economic accessibility of region i;; i = base region; j = possible destinations;
ti,j = travel time between i and j ; Tk = Maximum travel time (arbitrary); Pj = total inhabitants of destination j; GDPj = Gross domestic product of destination j, expressed in monetary units.
27
REG
ION
S A
ND
NET
WO
RK
S R
egio
nal I
mpa
ct o
f Priv
ate
and
Publ
ic In
vest
men
t
Instituto Superior Técnico / Masters in Civil Engineering – Regions and Networks 2010/2011
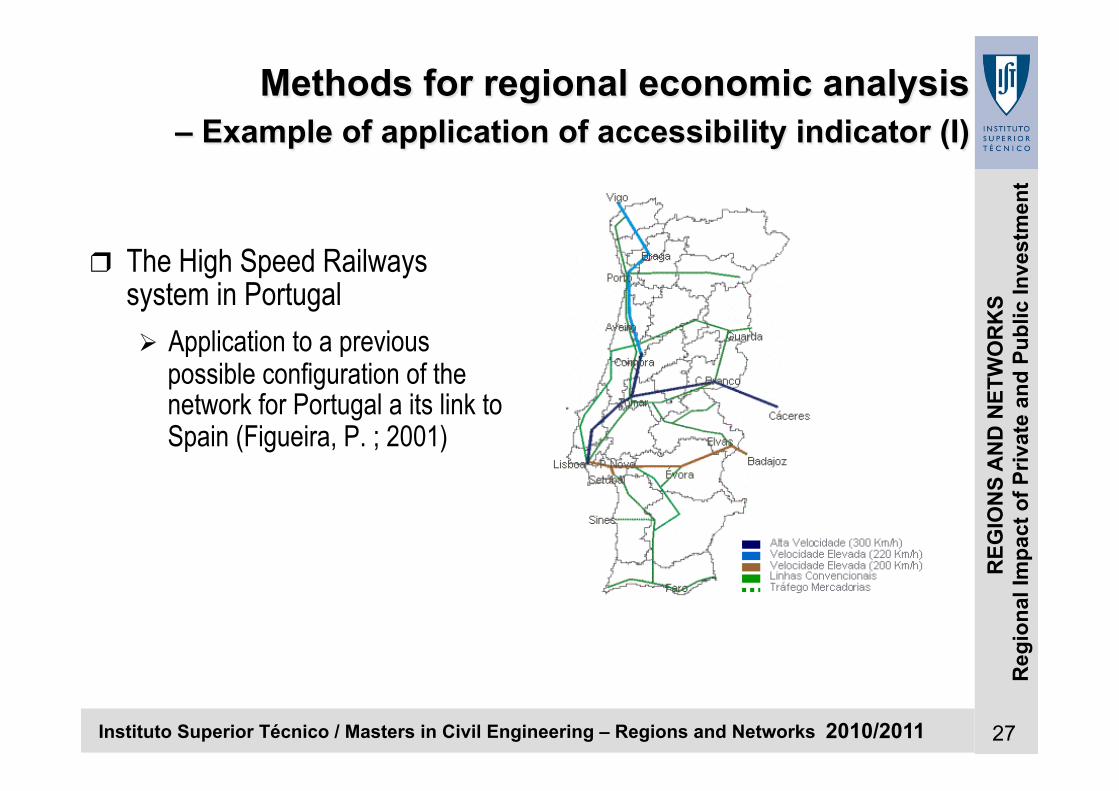
Methods for regional economic analysis – Example of application of accessibility indicator (I)
The High Speed Railways system in Portugal Application to a previous
possible configuration of the network for Portugal a its link to Spain (Figueira, P. ; 2001)

28
REG
ION
S A
ND
NET
WO
RK
S R
egio
nal I
mpa
ct o
f Priv
ate
and
Publ
ic In
vest
men
t
Instituto Superior Técnico / Masters in Civil Engineering – Regions and Networks 2010/2011
Methods for regional economic analysis – Example of application of accessibility indicator (II)
Demographic accessibility (absolut values for Iberic Peninsule) (Figueira, P. ; 2001)
AD for 3h (inhab.) – Present (2001)
AD For 3h (inhab.) – Forecast
with High Speed Rail
AD For 3h (inhab.) – Forecast
without High Speed Rail
Legend (106 Inhabitants) 3,5 – 6,5 6,5 – 9,0
9,0 – 11
11– 14 14 – 19
19 – 25,5

29
REG
ION
S A
ND
NET
WO
RK
S R
egio
nal I
mpa
ct o
f Priv
ate
and
Publ
ic In
vest
men
t
Instituto Superior Técnico / Masters in Civil Engineering – Regions and Networks 2010/2011
Methods for regional economic analysis – Example of application of equity indicator
Lorenz Curve and Gini Coefficient for AD (3h), for 3 scenarios (Figueira, P. ; 2001)
0%
10%
20%
30%
40%
50%
60%
70%
80%
90%
100%
0% 14% 27% 41% 54% 68% 81% 95%
Regiões
Acessibilid
ade De
mográfica Cu
mula6
va
Distribuição "Ideal" Cenário Actual Cenário Futuro CAV Cenário Futuro SAV
Gini (Actual) = 0,165
Gini (FSAV) = 0,209 Gini (FCAV) = 0,198

30
REG
ION
S A
ND
NET
WO
RK
S R
egio
nal I
mpa
ct o
f Priv
ate
and
Publ
ic In
vest
men
t
Instituto Superior Técnico / Masters in Civil Engineering – Regions and Networks 2010/2011
Investment in Public infrastructure and economic development (I)
Pure configurations of sources of investment in infrastructure Fully funded by the state Fully funded by a private party (concessionaire) Private-public partnership (PPP)
Expectations of multiplier effects of Investment in public infrastructure Direct output in industries that provide inputs for construction (civil works, metal
mechanics, etc.) Indirect output in other industries through increase of private consumption (strongly
depends on the economic context) Employment (direct and indirect)

31
REG
ION
S A
ND
NET
WO
RK
S R
egio
nal I
mpa
ct o
f Priv
ate
and
Publ
ic In
vest
men
t
Instituto Superior Técnico / Masters in Civil Engineering – Regions and Networks 2010/2011
Investment in Public infrastructure and economic development (II)
Infrastructures are public goods (or semi-public) and generate benefits as they reduce the production costs of those who are able to use them
Traditionally, recurrent public investment on the construction of transport infrastructures Main arguments are related to the competitiveness of companies, but also to
enhancement of freight and passenger mobility However, investment on infrastructure is not sufficient to promote or sustain the
economic development of the regions they are located in. Other aspects are more important: economic context of the region, prices of basic production factors, and innovation capacity Infrastructures are facilitators for economic development Complementary actions/initiatives are fundamental to promote and sustain expected
development

32
REG
ION
S A
ND
NET
WO
RK
S R
egio
nal I
mpa
ct o
f Priv
ate
and
Publ
ic In
vest
men
t
Instituto Superior Técnico / Masters in Civil Engineering – Regions and Networks 2010/2011
Investment in Public infrastructure and economic development (III)
The case of economic spillovers of public investment on the construction of PRN2000 in Portugal during the 90s Estimation of the multiplier effects of highway construction on the Portuguese Economy
(Pereira and Andraz (2005) in Review of Development Economics, 9(2), 177–196): one euro in public investment increases output in the long term by 9.5 euros. elasticity of private investment with respect to aggregate public investment is 0.639, which
corresponds to a marginal product of 8.1 euros for each euro in public investment. elasticity of employment with respect to aggregate public investment is 0.079. This figure
suggests that 230 additional jobs are created in the long-term for each additional one million euros in public investment in transportation infrastructures.
Regional asymmetries: Public investment in transportation infrastructures has markedly contributed to the concentration
of economic activity in Lisbon (“macrocephaly of the country) (Pereira and Andraz (2005) in The Annals of Regional Science., 40, 803-817).
Still, one cannot forget the context of private consumption euphoria and perception of wealth of Portuguese consumers (high levels of trust in the economy)
Difficult to separate the economic growth (GDP) from this climate of economy booming

33
REG
ION
S A
ND
NET
WO
RK
S R
egio
nal I
mpa
ct o
f Priv
ate
and
Publ
ic In
vest
men
t
Instituto Superior Técnico / Masters in Civil Engineering – Regions and Networks 2010/2011
Investment in Public infrastructure and economic development– Beira Interior (I)
Transport infrastructure is usually identified as key factor for development of regions, not only for the value they add to existing resources but also by the attractiveness for others coming from the outside.
However, it does not by itself generate development, which also depends on local dynamics.

34
REG
ION
S A
ND
NET
WO
RK
S R
egio
nal I
mpa
ct o
f Priv
ate
and
Publ
ic In
vest
men
t
Instituto Superior Técnico / Masters in Civil Engineering – Regions and Networks 2010/2011
Investment in Public infrastructure and economic development– Beira Interior (II)
0
5.000.000
10.000.000
15.000.000
20.000.000
25.000.000
30.000.000
0 60 minutos
120 minutos
180 minutos
240 minutos
300 minutos
Espanha
Portugal
0
5.000.000
10.000.000
15.000.000
20.000.000
25.000.000
30.000.000
0 60 minutos 120 minutos 180 minutos 240 minutos 300 minutos
Espanha
Portugal
0
5.000.000
10.000.000
15.000.000
20.000.000
25.000.000
30.000.000
0 60 minutos 120 minutos 180 minutos 240 minutos 300 minutos
Espanha
Portugal
Total population (Portugal and Spain) with accessibility to Covilhã for different isochrones.
2006
1992
2020

35
REG
ION
S A
ND
NET
WO
RK
S R
egio
nal I
mpa
ct o
f Priv
ate
and
Publ
ic In
vest
men
t
Instituto Superior Técnico / Masters in Civil Engineering – Regions and Networks 2010/2011
Investment in Public infrastructure and economic development– Beira Interior (III)
Covilhã accessibility in 1992 and 2006 scenario, for a limit of 3 hours
Covilhã accessibility in 2020 and asymptotic of up to 5 hours travel scenarios

36
REG
ION
S A
ND
NET
WO
RK
S R
egio
nal I
mpa
ct o
f Priv
ate
and
Publ
ic In
vest
men
t
Instituto Superior Técnico / Masters in Civil Engineering – Regions and Networks 2010/2011
Investment in Public infrastructure and economic development– Beira Interior (IV)
Accumulated asymptotic accessibility of Beira Interior Cities and Litoral Cities in inhabitants/ travel time
0
5.000.000
10.000.000
15.000.000
20.000.000
25.000.000
30.000.000
35.000.000
0 60 minutos 120minutos
180minutos
240minutos
300minutos
Castelo BrancoCovilhãGuardaLeiriaMáximoMínimo

37
REG
ION
S A
ND
NET
WO
RK
S R
egio
nal I
mpa
ct o
f Priv
ate
and
Publ
ic In
vest
men
t
Instituto Superior Técnico / Masters in Civil Engineering – Regions and Networks 2010/2011
FROM PROJECT TO PROGRAM (I)
A project consists of a temporary endeavor undertaken to create a unique product,
service or result. Is a collaborative enterprise, frequently involving research or design, that is
carefully planned to achieve a particular aim. A program the process of managing multiple ongoing inter-dependent projects. emphasizes on coordinating and prioritizing resources across projects, entities
and stakeholders to ensure that resources are managed from a global focus, and return on investments are maximized.

38
REG
ION
S A
ND
NET
WO
RK
S R
egio
nal I
mpa
ct o
f Priv
ate
and
Publ
ic In
vest
men
t
Instituto Superior Técnico / Masters in Civil Engineering – Regions and Networks 2010/2011
FROM PROJECT TO PROGRAM (II)
Differences of Outreach A project is unique and is of definite duration. A program is ongoing and
implemented within an institution to consistently achieve certain results Program Management includes activities to manage a business program
and may include management of projects to step-wise improve program performance levels.
In the course of achieving required results, programs will normally understand related business constraints and determine the processes required to achieve results based on resources allocated.
Improvement of processes is a continuous operation that very much contrasts a program from a project.

39
REG
ION
S A
ND
NET
WO
RK
S R
egio
nal I
mpa
ct o
f Priv
ate
and
Publ
ic In
vest
men
t
Instituto Superior Técnico / Masters in Civil Engineering – Regions and Networks 2010/2011
FROM PROJECT TO PROGRAM - The case of Portuguese investments
In Portugal, some tradition of Infrastructure Plans (Roads, Ports) and more recently of Development Plans (PDR, QREN)
The former only contemplate the locations and attributes of the various pieces of infrastructure, and the latter also bring in other areas of public investment (education and training, health facilities, etc) But in all cases these Plans only cover public investments, giving no
guidelines or priorities for attraction / selection of private investments which would maximize synergy with the planned public investments

40
REG
ION
S A
ND
NET
WO
RK
S R
egio
nal I
mpa
ct o
f Priv
ate
and
Publ
ic In
vest
men
t
Instituto Superior Técnico / Masters in Civil Engineering – Regions and Networks 2010/2011
FROM PROJECT TO PROGRAM – GERMAN FEDERAL TRANSPORT PLAN EXAMPLE (I)
In Germany transport planning is done on three levels: Communes (5000), states (16), and the federal government. Only the latter level, which comprises investments with country-wide relevance is addressed by the Federal Transport Plan.
The Federal Transport Plan (BVWP) is developed and implemented by the Federal Ministry of Transport (20 years rolling program). Proposals on the investment projects are done by the states. The ministry has the task to select amongst the many proposals the best projects and set up the Federal Transport Plan.
The Federal Transport Plan included the following effects: Reduction of transport costs, maintenance of transport infrastructures, improvement of transport security, spatial impacts, environmental impacts and other effects.

41
REG
ION
S A
ND
NET
WO
RK
S R
egio
nal I
mpa
ct o
f Priv
ate
and
Publ
ic In
vest
men
t
Instituto Superior Técnico / Masters in Civil Engineering – Regions and Networks 2010/2011
FROM PROJECT TO PROGRAM – GERMAN FEDERAL TRANSPORT PLAN EXAMPLE (II)
The plan assess and rank over 1300 projects proposed by the states of Germany. The heart of the procedure is based in a cost-benefit analysis (CBA), which
assesses the impacts of the proposed projects. For two scenarios: The Reference Scenario reflects the situation in 2015 without any of the
proposed projects, while the Plan Scenario includes the proposed projects. Combined ranking considering C/B analysis and SPA effects

42
REG
ION
S A
ND
NET
WO
RK
S R
egio
nal I
mpa
ct o
f Priv
ate
and
Publ
ic In
vest
men
t
Instituto Superior Técnico / Masters in Civil Engineering – Regions and Networks 2010/2011
FROM PROJECT TO PROGRAM – GERMAN FEDERAL TRANSPORT PLAN EXAMPLE (III)
Overview on SPA methodology Diagram of fixed projects

43
REG
ION
S A
ND
NET
WO
RK
S R
egio
nal I
mpa
ct o
f Priv
ate
and
Publ
ic In
vest
men
t
Instituto Superior Técnico / Masters in Civil Engineering – Regions and Networks 2010/2011
‘SOFT’ MECHANISMS AND ICTs
There is a need for soft mechanisms to maximize the return on investments by attracting private investment to ‘not-so-visible’ opportunities generated by public investment infrastructures
What are soft mechanisms Information for stakeholders Operational support from national and regional authorities Presentation of Success Cases from other countries The importance of Information and Communication Technologies
(ICT)

44
REG
ION
S A
ND
NET
WO
RK
S R
egio
nal I
mpa
ct o
f Priv
ate
and
Publ
ic In
vest
men
t
Instituto Superior Técnico / Masters in Civil Engineering – Regions and Networks 2010/2011
Assignment for Theme 3
Each group has to choose a rapidly growing (or decaying) region and analyze the underlying reasons for the region’s growth and resilience, or economic decay. Some questions and aspects you should consider: What lessons can you draw from your case-study for other regions? What are the sources of growth (or decay)? Were there any restructuring of the region? Industrial? Innovation clusters? Were there any public or private investments? Which were the critical investments? Although history and context are important, there are also real processes and actions that
you can look at to help us think about planning development and policy interventions elsewhere.
The lessons may not be applicable in all places, but we can draw lessons for regions with similar institutional context and environments.
During the paper (and presentation), the students will indicate how they have analyzed the region's economic development (and history) by drawing on some of the theories and techniques covered in class. Students will be encouraged to use cases that they are already familiar with.

45
REG
ION
S A
ND
NET
WO
RK
S R
egio
nal I
mpa
ct o
f Priv
ate
and
Publ
ic In
vest
men
t
Instituto Superior Técnico / Masters in Civil Engineering – Regions and Networks 2010/2011
Assignment for Theme 3
Some examples of regions that experienced fast economic growth over the last two or three decades. Barcelona/Catalunya (Spain) Glasgow (UK) Pittsburg (USA) Lille (France) Ireland Slovenia

46
REG
ION
S A
ND
NET
WO
RK
S R
egio
nal I
mpa
ct o
f Priv
ate
and
Publ
ic In
vest
men
t
Instituto Superior Técnico / Masters in Civil Engineering – Regions and Networks 2010/2011
BIBLIOGRAPHY
Group 1 – Clusters and Regional Development – Case Studies Boari, C. (2001) Industrial Clusters, Focal Firms, and Economic
Dynamism: A Perspective from Italy, Washington, USA, World Bank Institute, Nº37186, (http://siteresources.worldbank.org/WBI/Resources/wbi37186.pdf access in Nov., 28th, 2008).
Longhi, C. (1999) Networks, Collective Learning and Technology Development in Innovative High Technology Regions: The Case of Sophia-Antipolis. Regional Studies, 33, 333-342.
Powers, P. (2006) Building the Austin technology cluster: the role of government and community collaboration in the human capital, Digital Regions Conference, Austin, Texas, (http://www.kc.frb.org/PUBLICAT/NewGovernance04/Powers04.pdf access in Nov., 28th, 2008).

47
REG
ION
S A
ND
NET
WO
RK
S R
egio
nal I
mpa
ct o
f Priv
ate
and
Publ
ic In
vest
men
t
Instituto Superior Técnico / Masters in Civil Engineering – Regions and Networks 2010/2011
BIBLIOGRAPHY
Group 2 – Regional economics – growth models and factors of production Cooke, P. & Leydesdorff, L. (2006) “Regional Development in the
Knowledge-Based Economy: The Construction of Advantage”, The Journal of Technology Transfer, 31, 5-15.
Perreira, A., Andraz, J. (2006) “Public investment in transportation infrastructures and regional asymmetries in Portugal”, The annals of Regional Sciences, vol. 40 (pp-803-817)

48
REG
ION
S A
ND
NET
WO
RK
S R
egio
nal I
mpa
ct o
f Priv
ate
and
Publ
ic In
vest
men
t
Instituto Superior Técnico / Masters in Civil Engineering – Regions and Networks 2010/2011
BIBLIOGRAPHY
Group 3 – High Speed Railways –Cost-Benefit Analysis of project investment Randolph, S., Haveman, J., Egan, T. (2008), “California High-Speed
Rail Economic Benefits and Impacts in the San Francisco Bay Area”, Report from the Bay Area Council Economic Institute, San Francisco, US.
Kantor, S. (2008), “ The Economic Impact of the California High-Speed Rail in the Sacramento/Central Valley Area “, University of California, Merced,. US.

49
REG
ION
S A
ND
NET
WO
RK
S R
egio
nal I
mpa
ct o
f Priv
ate
and
Publ
ic In
vest
men
t
Instituto Superior Técnico / Masters in Civil Engineering – Regions and Networks 2010/2011
BIBLIOGRAPHY
Group 4 – Economic development and ICTs Castells, M. (1998) “Information Technology, Globalization and Social
Development”. UNRISD Conference on Information Technologies and Social Development,. Palais des Nations, Geneva.
Castells, M. (2000), “Materials for an exploratory theory of the network society”, British Journal of Sociology Vol. No. 51 Issue No. 1 (January/March) pp. 5–24