Embed Size (px)
Citation preview
INSTITUTIONS, FINANCIAL MARKETS AND FIRM DEBT
MATURITY
ASLI DEMIRGUC-KUNT VOJISLAV MAKSIMOVIC*
JUNE 1998
First Draft: APRIL 1996
* The authors are at the World Bank and the University of Maryland, respectively. We would like to thank Jerry Caprio, Ross Levine, Tim Opler, Fabio Schiantarelli, Mary Shirley, and Sheridan Titman for helpful comments and Jim Kuhn for help with the data. We are also grateful to that participants of the World Bank Conference on Term Finance in June 1996 and of the 1997 Western Finance Association Meetings in San Diego. The views expressed here are the authors' own and not necessarily those of the World Bank or its member countries.
2
INSTITUTIONS, FINANCIAL MARKETS AND FIRM DEBT MATURITY
ABSTRACT
We examine firm debt maturity in thirty countries during the period 1980-1991. In countries with active stock markets, large firms have more long-term debt. Stock market activity is not correlated with debt levels of small firms. By contrast, in countries with a large banking sector, small firms have less short-term debt and their debt is of longer maturity. Variation in the size of the banking sector is uncorrelated with the capital structures of large firms. Government subsidies to industry are positively related and inflation is negatively related to the use of long-term debt. We also find evidence of maturity matching.

3
Conflicts of interest between a firm’s insiders and outside investors are important determinants of the
firm’s ability to obtain capital. These conflicts can be mitigated by the appropriate choice of securities
or contracts between the firm and its investors.1 An extensive theoretical literature in corporate
finance shows that optimal choice of securities for this purpose depends on the information available
to investors, and their ability to monitor compliance and to enforce their legal rights.2 Since both the
amount of information available to investors and their ability to protect their investment depends on
both financial and legal institutions, firms’ financial structures should differ systematically across
countries. However, little is known about how observed differences in the institutional and legal
environments across countries affect the financing choices of firms.
In this paper we examine how differences in financial and legal institutions affect the use of debt, and
in particular, the choice of debt maturity by firms in a sample of thirty countries in the period 1980-
1991. The sample includes both developed and developing countries, and countries with both
common-law and civil-law legal systems. We ask four questions.
First, are there any systematic differences in the maturity of debt claims issued by firms in different
countries? Second, if there are, can such differences be accounted for by the characteristics of the
firms in each country? Third, can the differences in the use of debt be explained by institutional
differences, particularly in the development of markets and the enforceability of contracts?
Differences in the use of debt could occur if institutional arrangements in each country facilitate the
use of particular securities to control the opportunistic behavior by firms’ insiders. Finally, is there
1 The starting point for the analysis of the role of financial securities in the resolution of conflicts between different classes of stakeholders are the papers by Jensen and Meckling (1976), Myers (1977) and Myers and Majluf (1984). Jensen and Meckling (1976) define the firm itself as a “nexus of contracts.” 2 Diamond (1991, 1993) and Rajan (1992) discuss the choice of maturity structures and the choice of whether to borrow from an intermediary who has an advantage in monitoring or from the market. For recent examples of optimal financial structures when investors can observe the firm’s cash flows but cannot enforce legal rights to these cash flows see Hart and Moore (1995) and Bolton and Scharfstein (1993). For reviews of the literature see Ravid (1996) and Harris and Raviv (1990).

4
evidence that some firms, especially small firms, obtain less long-term debt financing in countries
with less-developed financial systems?
Several authors have explored the effect of the institutional environment on firm financing choices in
specific countries. Hoshi, Kashyap and Scharfstein (1990) have shown that membership in industrial
groups linked to banks reduces financial constraints on Japanese firms. Calomiris (1993) has
examined the effect of differences between the banking systems of the United States and Germany on
firm financing. Rajan and Zingales (1995) explore capital-structure decisions of firms in seven
developed countries, and Demirguc-Kunt and Maksimovic (1995) have considered financing choices
in a sample of ten developing countries.
Recently, Barclay and Smith (1995) and Stohs and Mauer (1996) have examined term financing in
the United States. There have been fewer cross-sectional studies of the effect of financial and legal
institutions on firm financing. Demirguc-Kunt and Maksimovic (1996a) have explored the relation
between firm growth and access to external finance for a sample of both developed and developing
countries. They show that the proportion of firms in each country that grow at rates that exceed those
that can be financed internally is correlated with the perceived effectiveness of the country’s legal
system and several indicators of financial-market and institutional development.3 Demirguc-Kunt and
Maksimovic (1996a) use only one indicator of the effectiveness of a country’s legal system. In a
comparative study of legal systems, La Porta, Lopez-de-Silanes, Shleifer and Vishny (1996) argue
that the legal tradition on which a country’s legal system is based, as well as several specific
protections, are also important in determining whether investors can enforce their claims on the firm’s
assets. Their paper classifies the legal systems of a sample of countries according to their legal
tradition and whether or not they grant investors those specific protections. In our tests below, we use
3 Rajan and Zingales (1996) examine the effect of the development of financial institutions on industry growth in a sample of countries. Demirguc-Kunt and Maksimovic (1996b) have explored complementarities in stock market and banking-sector development on financing decision of firms in a cross-country sample of firms.
5
their classification of legal systems to supplement an index measuring the effectiveness of each
country’s legal system.
The rest of the paper is organized as follows. In Section 1 we take a preliminary look at the
differences in term financing between countries. In Section 2 we discuss possible explanations for the
differences advanced in the literature. Section 3 introduces the data and presents summary statistics.
Section 4 reports cross-sectional empirical tests of financial maturity across countries. Section 5
concludes.
1. CROSS-COUNTRY COMPARISON OF TERM FINANCING
Financial theory suggests that a major factor in a firm’s choice of capital structure is the existence of
agency costs. The extent to which these costs can be controlled by appropriate financial contracts
depends both on the characteristics of firms and the institutional environment in which the contracting
takes place. Thus, since countries have very different institutional systems and firm characteristics, in
a cross-country sample the observed financial structures should vary systematically across both
countries and firms.
We can obtain an initial assessment of the extent of these differences by comparing the long-term and
short-term indebtedness of firms for a sample of countries at different levels of economic
development. Our sample consists of firms in nineteen developed economies and eleven developing
countries for the period 1980-1991. The developed countries in our sample are Austria, Australia,
Belgium, Canada, Finland, France, Germany, Hong Kong, Italy, Japan, the Netherlands, New
Zealand, Norway, Sweden, Singapore, Spain, Switzerland, the United Kingdom, and the United
Neither of these addresses the question of debt maturity or the quality of enforcement of contracts by the legal systems in each country.
6
States. The developing countries are Brazil, India, Jordan, Korea, Malaysia, Mexico, Pakistan, South
Africa, Thailand, Turkey, and Zimbabwe.4
For the developed economies we obtain firm-level data from Global Vantage. We include all the
countries in the database for which there are more than 40 firms available.5 The firm-level data for
developing countries are from the International Finance Corporation’s (IFC) database. They consist
of financial-statement data for approximately one hundred largest publicly traded corporations in
these economies. (The IFC data are described in detail, together with primary sources, in Singh,
Hamid, Salimi and Nakano, 1992.6 ) For both databases, the number of firms available in each
country, the years available and the calculation of each variable we use are described in the
Appendix.
Insert Figure 1 here
Figure 1 displays the average ratios of long-term liabilities (measured as total liabilities less current
liabilities) to total assets for firms in our sample for each of the thirty countries. The developing
countries in our sample are denoted by the darker outline. Norway has the highest ratio of long-term
debt to assets, whereas Zimbabwe has the lowest, at about one fifth of Norway’s. There is a marked
clustering of developing countries at the bottom of the range, indicating that firms in these countries
do not employ as much long-term debt financing. This pattern is confirmed in Figure 2, which
displays the ratio of long-term to total liabilities in our sample of countries. As a proportion of total
debt, firms in developing countries use less long-term debt.
4 The selection of countries and the variables discussed in this section are described in detail in Section 3 below. 5 Outliers, many of them obvious data errors, were removed prior to analysis. To standardize the procedure, for each variable we computed the interval between the 95th percentile and the 5th percentile observations. Outliers were defined as observations that did not lie within a band centered on the median observation and having a width twelve times the length of the computed interval. Fewer than one percent of observations were eliminated in this way.
7
Insert Figure 2 here
The differences in financing patterns across countries reflect differences in institutions and
contracting environments across countries. However, firms with different characteristics have
different access to financial markets and institutions even within the same economy. In particular,
smaller firms are likely to have higher monitoring costs than larger firms, relative to the amount of
the loan. We expect these differences to be reflected in different financing patterns. Figure 3 depicts
the ratios of short-term, long-term and total indebtedness and the ratio of long-term to total debt by
firm size. The firms in each country in the sample are divided into quartiles by value of total assets,
and the average debt ratios of each quartile, calculated across countries, is reported. Inspection of the
figure reveals that there are marked and consistent differences across quartiles in the use of long-term
debt. Large firms report higher ratios of long-term debt to total assets and long-term debt to total
liabilities. By contrast, there do not appear to be differences in the ratios of short-term debt to total
assets across firm-size quartiles.
Insert Figure 3 here
The figures indicate that there are differences in financing patterns for countries at different levels of
development and for large and small firms. The most pronounced differences are in the use of long-
term debt contracts.7 In principle, greater reliance on long-term debt in more developed countries
6 Singh, Hamid, Salimi and Nakano (1992) does not list the primary sources for the data for Brazil, which were gathered after that technical report was prepared. The data were collected from the publications of the Vargas Foundation of Brazil. 7 A more formal measure of the covariation of the level of development and long-term corporate indebtedness can be obtained by regressing long-term debt to total assets on Gross Domestic Product per capita. For large firms this variable "explains" 44% of the covariation in long-term financing over the sample period. The size of the coefficient indicates that differences in the GDP per capita in our sample are associated with very different levels of long-term debt. Thus, a relatively small $1000 increase in the GDP per capita (the difference between, say, Pakistan and Thailand) translates into an increment of 0.09 in the value of the ratio of long term debt to total assets. Increases of $10,000 in the GDP per capita (the difference between, say, Pakistan and Singapore) translates into an increase of 0.09 in long-term leverage, whereas differences between some of the richest and poorest countries in the sample (the difference of approximately $20,000 between, say, Pakistan and Norway) is associated with an impressive increase of 0.18 in the value of the ratio of long-term debt to total assets. The
8
could be attributable to differences in the type of assets owned by firms in developed and developing
countries. Thus, if firms in developed countries own more fixed assets, which have longer maturity,
then the differences in capital structures can be explained by simple maturity matching. We explore
this possibility by plotting the average ratio of net fixed assets to fixed assets for the sample of firms
in Figure 4.
Insert Figure 4 here
Inspection of Figure 4 shows that firms in several developing countries have higher ratios of net fixed
assets to total assets than firms in many developed countries. Thus, simple maturity matching cannot
explain the variation in long-term financing.
In the remainder of the paper we take a closer look at the differences in the financing of firms across
countries and test whether it can be explained by firm characteristics, and the characteristics of
contracting environments, and financial institutions.
2. MARKETS, INSTITUTIONS AND DEBT MATURITY
In order for a firm to obtain outside financing, in particular loans, the firm must credibly commit to
respect contracts with investors that control opportunistic behavior. The type of contracts that permit
commitment in any particular case depend both on firm characteristics and on the institutions in the
economy that facilitate monitoring and enforcement of financial contracts.8
When the legal system is inefficient or costly to use, short-term debt is more likely to be employed
than long-term debt. As Diamond (1991, 1993) and Rajan (1992) have argued, short-term financing
makes it more difficult for borrowers to expropriate creditors. Shorter maturity limits the period
during which an opportunistic firm can exploit its creditors without being in default. It allows the
results of corresponding regression of the LTD/TA of small firms on GDP per capita are qualitatively similar. Together with dummies, GDP per capita "explains" 41% of the variation.
9
creditors to review the firm’s decisions more frequently and, if necessary, to vary the terms of the
financing before sufficient losses have accumulated to make default by the borrower optimal. Thus,
we would expect an inverse relation between the inefficiency of a country’s legal system and the use
of long-term debt.9 To the extent that there are fixed litigation costs in enforcing contracts, long-term
debt is likely to be used most heavily by large firms. The fixed costs also make the use of long-term
debt, particularly by small firms, less responsive to small year-to-year changes in the economic
environment.
Governments can facilitate the issuance of long-term debt by maintaining a predictable value of the
currency. High, and in particular, variable rates of inflation make it costly for investors and firms to
contract. This contracting problem caused by inflation is compounded when the legal resolution of
disputes is subject to delay.10 The government can also promote the use of long-term financing
directly by granting implicit loan guarantees when it adopts a policy of subsidizing loss-making firms
or sectors.11
Two types of institutions, financial intermediaries and stock-markets, directly influence the financial
structures of firms. A prime function of financial intermediaries, such as banks, is that of monitoring
borrowers. As Diamond (1984) argues, intermediaries have economies of scale in obtaining
information. Intermediaries also have greater incentives to use the collected information to discipline
8 Smith and Warner (1979) explore the relation between firm characteristics and bond covenants. 9 This presupposes the existence of a trade-off between the use of long-term and short-term debt. As pointed out by Diamond (1991), short-term financing gives creditors excessive control over the firm’s actions. In particular, they may force the firm to abandon valuable long-run projects that benefit the owners if they do not sufficiently benefit the short-term creditors. This situation is most likely to occur if the benefits received by the owners cannot be assigned contractually to the creditors. 10 In principle debt contracts can be indexed. For example, in Brazil all contracts specify a government price index used to adjust the nominal payments for inflation. This solution is not fully satisfactory in practice. During the sample period the indices may have been subject to risk of adjustments made for political reasons. Furthermore, the judicial system does not index judgments, which are subject to appeal and other delays. Perhaps not coincidentally, Table 1 reveals that Brazilian firms have little long-term debt. 11 Governments can also encourage the development of longer-maturity public debt markets by choosing to issue public debt with long maturities. A market in long-term government debt gives investors information about the risk-free term structure. We are grateful to the referee for bringing this aspect of the debt management policy of the New Zealand government to our attention.
10
borrowers than small investors subject to free-rider problems.12 Thus, we would expect that a
developed banking sector would facilitate access to external finance, particularly among smaller
firms. The implications for debt maturity of firms are less clearcut. A developed banking sector leads
to an increase in the availability of short-term financing, since this form of financing enables
intermediaries to use their comparative advantage in monitoring. However, banks’ economies of scale
and their ability to monitor covenants also permit them to offer long-term loans that would not be
available in a market without intermediaries. Which of these tendencies predominates is an empirical
question.
Developed stock markets provide opportunities for diversification by entrepreneurs. Thus, in
countries with developed stock markets, there is an incentive for firms to substitute from long-term
debt to equity. However, stock markets also affect transmission of information that is useful to
creditors. As Grossman (1976) and Grossman and Stiglitz (1980) demonstrate, prices quoted in
financial markets at least partially reveal information that more informed investors possess. This
revelation of information makes lending to a publicly quoted firm less risky. As a result, the existence
of active stock markets increases the ability of firms to obtain long-term credit. On the other hand, the
additional liquidity that stock markets provide, makes it easier for informed shareholders to escape
the consequences of failed gambles, and therefore encourage risk-taking behavior costly to
shareholders.13 Which of these effects predominates is an empirical question. Initial evidence by
Demirguc-Kunt and Maksimovic (1996b) suggests that the informational effect is stronger and that in
countries with developing financial markets debt-equity ratios increase with an increase in stock
market size and activity.
The amount of long-term and short-term debt that is optimal even when financial markets are perfect
in general depends on the opportunities that the firm’s insiders have for diverting resources and on
12 See also Fama (1985) for a discussion of the role of banks.
11
the assets which the firm has to serve as collateral. Thus, theory predicts that firms whose principal
asset is the present value of growth opportunities do not optimally borrow against that asset (Myers
(1977)). By contrast, firms with a large quantity of fixed assets already in place do not distort their
incentive value when they borrow. The fixed assets also facilitate borrowing by serving as collateral.
Barclay and Smith (1995) find that these predictions of the theory are supported in the US. We
expect that in an international context, the observed financial structure choices depend on these
considerations and also on the institutional factors discussed above. We next investigate the relation
empirically.
3. FIRMS AND COUNTRIES IN OUR SAMPLE
3.1. Economic Variables
In Table I we summarize some important facts about the economic development of the countries in
our sample.14 The Gross Domestic Product per capita (GDP/Cap) is a broad indicator of differences in
wealth in each country. In 1991, (GDP/Cap) in the sample ranged from $27,492 in Switzerland to
$359 in Pakistan. Thus, the sample includes some of the richest and poorest countries in the world.
Three additional macro-economic indicators are presented in Table I. The average annual growth rate
of the Gross Domestic Product over the sample period is an indicator of the financing needs of firms.
On an individual firm level, the growth is a proxy for the investment opportunity set faced by firms
(Smith and Watts (1992)) and its effect on the optimal financing of projects (Myers (1977)). The
average inflation rate over the sample period, shown in the third column, provides both an indicator
of the government’s management of the economy and evidence on whether the local currency
13 The incentives of stock-market investors to monitor the firm depend on the ownership structure. See Admati, Pfleiderer and Zechner (1994).
12
provides a stable measure of value to be used in long-term contracting. There are major variations in
the average rate of inflation in the sample countries. The average annual rate of inflation is highest in
Brazil, at 327.6% , and lowest in Japan, at 1.5% per annum.
Insert Table I
The final economic indicator shown in Table I is a measure of the government’s subsidies to the
corporate sector in each country. Government subsidies affect financial-structure decisions because
implicit or explicit backing of corporations by the government distorts market incentives and permits
some firms to obtain long-term loans on favorable terms.15 Our measure of the government’s
subsidies is the level of government grants as a percentage of the Gross Domestic Product. More
precisely, we measure the sum of grants on current account by the public authorities to (i) private
industries and public corporations and (ii) government enterprises to compensate for the losses which
are the consequence of policies of the public authorities.16 As the last column of Table I reveals, the
level of government subsidies is significant is some countries, and exceeds 10% of the GDP in the
case of Brazil.
3.2. Legal and Financial Institutions
We explore the relation between firms’ financing choices and the state of development of both the
legal and financial institutions in our sample of countries. The principal indicators of legal and
financial development are given in Table II.
Insert Table II
14 The sources for the variables discussed in this section are given in the Appendix. 15 The Dome Petroleum Harvard Business School case provides a graphic illustration of the effect of implicit government loan guarantees on financial structure Their effect is qualitatively similar to that of deposit insurance in the banking sector. For a discussion of deposit guarantees see Kane (1989). 16 Thus, this variable measures realized expenditures but not direct instructions to business or the level of exante commitments made by each government. Over a period, we would expect a correlation between commitments and expenditures.

13
Legal Institutions
As an indicator of the efficiency of the legal system in each country, we use a commercially available
index of the level of law and order in each country, Law&Order. This index, prepared by the
International Country Risk Guide, is scored on a scale 0-6 and aggregates annual reports by a panel of
more than a hundred analysts. It measures the extent to which citizens of a country are willing to
accept the established institutions to make and implement laws and to adjudicate disputes. Low levels
of the index denote less reliance on the legal system to mediate disputes. A second indicator, the
index of legal efficiency, produced by Business International Corporation, is also presented for
comparison. This second indicator is an index of the efficiency and integrity of the legal environment
as it affects business, and in particular foreign firms. This index is scored from zero to ten, with lower
scores indicating lower efficiency.
La Porta, Lopez-de-Silanes, Shleifer and Vishny (1996) (LLSV) have argued that legal systems based
on common law offer investors different protections than those based on civil law.17 Such differences
translate into differences in the optimal contracts between firms and investors. To test for this relation
we follow LLSV in defining an indicator variable, Common, which is one if the country’s legal
system is based on common law and zero if it based on civil law. As Table II reveals, the legal
systems of thirteen countries in our sample are based on common law and those of seventeen
countries are based on civil law.
Financial structure choices should also be affected by the specific provisions of each country’s
commercial laws. To investigate further the effect of differences in legal systems we use the
indicators of creditor and shareholder rights compiled and discussed in detail in LLSV. They classify
countries according to whether they provide creditors with the following five specific protections:
14
First, whether the bankruptcy laws prohibit an automatic stay on assets, which would prevent
automatic liquidations of insolvent firms by secured creditors. The existence of an automatic stay
gives managers and shareholders of a distressed firm greater bargaining power over secured
creditors.18 Second, whether secured creditors are permitted to repossess their collateral in bankruptcy
or whether some third party claims, such as those of the government or the employees, take priority.
Third, whether the bankruptcy law prohibits borrowers from unilaterally obtaining court protection
from creditor demands. If distressed borrowers can obtain such protection unilaterally, their
bargaining power is increased. Fourth, whether creditors can dismiss managers and replace them with
administrators when a firm becomes bankrupt. In addition, LLSV note whether or not the law of each
country requires all firms to maintain a reserve of equity capital. In countries where this requirement
exists, firms that do not fulfill it may be dissolved.
In principle, the creditor rights identified are important in defining feasible contracts between firms
and investors. However, there need be no direct statistical relation between the existence of a specific
right and a specific financial contract, such as long-term debt, even when that right is important in
enforcing the contract. For example, if the existence of a specific right is necessary, but not sufficient,
to make a financial contract enforceable, the statistical relation between that right and the use of the
contract will be weak. The relation between a particular creditor protection and particular debt
contract is also affected by the existence of spillover effects of the creditor protection on other
contracts. For example, strong creditor rights increase the incentives of financial institutions to
monitor firms, thereby also making stock investments in those firms more attractive. The size of these
spillovers depends on the development of the stock market and financial institutions and on the
precise provisions of the investor-protection laws. Spillovers also work in the opposite direction. In
17 Watson (1974) discusses differences in legal traditions based on common law and on civil law. 18 Note that this provision also benefits unsecured creditors over secured creditors.
15
some, but not all, countries, financial intermediaries hold both the stocks and debt of corporations.19
As a result, intermediaries with an equity stake in a firm should be willing to make loans even when
creditor protection is relatively weak.
With these caveats in mind, our examination of the relations between specific creditor protections and
financial structure is exploratory in nature. We give each country a score on an empirically defined
“index of creditor rights” based on whether its laws grant creditors the legal protections identified
above. Specifically, we give each country a score of one for each of the following conditions that its
bankruptcy law satisfies: (i) does not permit an automatic stay on assets, (ii) does not allow
borrowers to unilaterally seek bankruptcy protection, (iii) assures secured creditors the right to
collateral and (iv) does not grant the managers tenure pending resolution of bankruptcy. If
corporations are required to maintain a capital reserve, then the size of that reserve as a proportion of
assets is added to the index. The index is presented in Table 2. Scores range from a high of 4 to a low
of 0.1. In addition to using our empirical index of creditor rights, in the regressions below we also test
separately for the effect of each component of the creditor-rights index.
We proxy for the rights of shareholders using an index developed by LLSV. This index is scored on a
scale of one to five. It is obtained by adding a score of one for each of the following elements
fulfilled: (i) if shareholders are allowed to vote by mail, (ii) if they are not required to deposit their
shares with a trustee prior to voting, (iii) if the law allows cumulative voting for directors , (iv) if the
law gives minority shareholders special protection, and (v) if the minimum percentage of share capital
that entitles a shareholder to call for an extraordinary general meeting is less than or equal to 10
percent. This index measures the costs faced by minority investors who want to influence decision-
making within the firm, and is presented, for completeness, in Table II.
19 Hauswald (1996) examines how ownership of both stock and equity by intermediaries alters their incentives to reorganize firms in distress.
16
The index is subject to the same caveats as the index of creditor rights presented earlier. Whether the
costs faced by small shareholders when exercising their rights are important in determining firms’
financial structure decisions will depend on whether there also exist large investors or financial
intermediaries that can enforce investor rights. If these large investors exist, then costs faced by small
outside investors are not material in determining financing patterns.20
Financial Institutions
Access to publicly traded equity markets is measured by the ratio of stock market capitalization to
Gross Domestic Product (MCap/GDP).21 Within our sample there is considerable variation in this
ratio, ranging from 1.35 in South Africa to 0.04 in Pakistan. Interestingly, in some of the more
developed countries, such as Italy, the MCap/GDP is lower than is some of the developing countries,
such as Malaysia (0.15 compared to 0.88, respectively).22
In addition to size, we also measure the activity in the stock markets of each country. The activity
level of the equity markets is measured by the turnover ratio (TOR), computed by dividing the total
value traded by the market capitalization. Higher values of the turnover ratio indicate a higher level of
liquidity. As noted above, a high turnover also increases the incentives for investors to become
informed. Thus, a high turnover facilitates external monitoring of corporations. This variable was
found to be a good indicator of stock market development by Demirguc-Kunt and Levine (1995) and
Demirguc-Kunt and Maksimovic (1996a,b).
Access to financial intermediaries by firms is measured by the ratio of the domestic assets of deposit
banks to the Gross Domestic Product, Bank/GDP. Again, there are wide variations across countries,
20 Both indices are additive and linear. Thus, we do not the possibility that these factors may not be equally important or that they may interact in a more complicated way. 21 See Demirguc-Kunt and Levine (1995) for a discussion of alternative indices of stock market development. The statistics on financial markets and intermediaries quoted in this paragraph are compiled in that paper. 22 For a discussion of the determinants of market size see Pagano (1993) and Allen and Gale (1994).
17
both within the developed countries (for example, Japan has a ratio of 2.3 while the US has a ratio of
0.94) and developing countries (compare Malaysia at 1.37 with Turkey at 0.46).23
3.3. Firm-Specific Characteristics
An important consideration in the choice of financial structure by firms is the reduction of agency
costs. The particular types of agency costs to which the firm is exposed and their magnitude will in
general vary from firm to firm. Thus, the observed differences in financial structures in our sample of
countries depend in part on the characteristics of the population of firms in each economy. We control
for the differences in firm characteristics between countries by introducing firm-specific variables that
are suggested by theory and that are empirically useful in explaining financial structure decisions of
individual firms in a subset of our sample (Demirguc-Kunt and Maksimovic (1995)).
Two of the firm-specific variables we use are descriptors of the firm’s operating characteristics. The
ratio of net fixed assets of firms to their total assets (NFA/TA) is an indicator of the structure of the
firm’s assets. Fixed assets can be used as collateral. Thus, firms with a high ratio of fixed assets
should have greater borrowing capacity. Moreover, since firms have been found to match the maturity
of assets with that of liabilities in the US (Stohs and Mauer (1995)), NFA/TA should be correlated
with long-term leverage for firms in our sample. Our second firm-specific variable is a descriptor of
the firm’s operating cycle: the ratio of net sales to net fixed assets (NS/NFA). A firm with high
NS/NFA is more likely to need short-term financing to support sales. It is likely to generate short-
term assets, such as accounts receivable and notes from its customers. Thus, if firms match the
maturity of their assets and liabilities, a high ratio of sales to assets will be associated with short-term
indebtedness.
23 Comparable data on "other financial institutions," such as development banks and finance companies, is harder to obtain. For 19 countries in our sample, including several developing countries, we obtained the sum of the deposits of all deposit-taking financial institutions that do not offer checking or demand accounts (Lines 42a-f from IMF’s International Financial Statistics). The correlation between the size of these "other financial
18
Two variables measure the cash constraints of firms. A high ratio of dividends to total assets, Div/TA
suggests that the firm has a cash surplus relative to its investment needs. Firms in this position would
be expected to reduce their leverage. The second indicator of liquidity is the ratio of the firms’
earnings before interest and taxes to its total assets (Profit). Several studies have found a strong
negative relation between this variable and leverage, both in the US (e.g., Spence (1985) and in
developing countries (Demirguc-Kunt and Maksimovic (1995a)).24
The use of accounting data requires that accounting rules are similar enough that the numbers are
comparable across countries. Fitzgerald, Stickler and Watts (1979) compare the principal reporting
requirements across countries. A direct comparison across countries of the key requirements shows
that the principles on which they based are similar enough in stated intent so as to make them
comparable. However, as Ball (1995) points out, countries differ in the extent that their accounting
systems emphasize the importance of public disclosures useful to investors. Accounting systems in
the Anglo-Saxon common-law tradition tend to emphasize the importance of strict matching of
revenues and expenses, whereas systems in the Continental European tradition place a greater stress
on conservatism, and allow corporations to smooth profits using hidden reserves.25 These differences
in the way principles are applied may translate into significant differences in the timing of when
profits are reported.26
institutions" relative to GDP and Bank/GDP for the 19 countries in our sub-sample is 0.24, which is not significant (p=0.32). Thus, there is no evidence that Bank/GDP is a proxy for other financial institutions. 24 Firms’ capital structures also depend on the tax advantages of debt and equity financing. See Swoboda and Zechner (1995) for a comparative discussion of tax systems. Several factors make the effect of tax incentives on the capital structures of firms difficult to quantify. The complexity of tax systems, with both federal and local taxes, makes it difficult to compare the benefits of debt across a large sample of countries. As shown by Graham, Lemmon, and Schallheim (1996), effective tax rates may significantly differ from statutory tax rates. Moreover, our focus is not on the total amount of debt that a firm has, but on the composition of the firm’s debt and the ratio of long-term to short-term debt. The implications of different tax systems for the composition of debt and for debt maturity are not clearcut. As a result, we do not include tax variables in our cross-sectional regressions. 25 See Watts and Zimmerman (1986) for an analysis of how accounting systems are shaped by the market for accounting information and the politics of accounting. 26 See Ball’s (1995) discussion of the decision by Diamler-Benz to report its profits using U.S. rules.
19
Because we use averages over time in forming the variables for our regressions, our research design
shields us from some of the problems posed by these differences in emphasis and timing. However, a
significant concern in interpreting the financial statements from the sample of countries pertains to
differences arising from different levels of inflation and the difference in how inflation is treated in
financial statements. This problem is likely to be most severe for Brazil, Mexico and Turkey, which,
as Table 1 shows, had the highest rates of inflation during the sample period. Whereas in most
countries in the sample fixed assets are stated at their historical cost, the financial statements of firms
in Mexico and Brazil were adjusted during part or the whole of the sample period. Since 1984, listed
firms in Mexico have been required to use current replacement costs for valuing inventories and
property, plant and equipment. Other non-monetary assets and stockholders’ equity are restated using
specified consumer price indices. Any gains or losses resulting from inflation adjustments are
reported in the income statement. The financial accounts of Brazilian firms have been adjusted for
inflation throughout the sample period, although specific requirements were modified in 1987 and
again in 1989. Permanent assets and shareholder equity are adjusted using specified government
indices. As in the case of Mexico, the adjustment was reflected in the income statement. However,
observers noted that the increases in the specified index did not fully reflect the realized inflation.
Turkey, which had the third highest average inflation rate, 24%, did not permit inflation- adjusted
accounting (Price Waterhouse (1993a)). The high average return on assets reported by Turkish firms
may be caused by this underreporting. Thus care must be exercised in comparing the results for Brazil
and Turkey with those of other countries in the sample.
The preliminary evidence presented in the figures above suggests that the financing decisions of large
and small firms are differently determined. Accordingly, we analyze them separately in the
regressions reported below. For each economy we divide our panel of firms into quartiles based on
asset size. We define as “large firms” the firms in the largest quartile in their respective country.
These firms are likely to have the best access to financial markets and institutions in their respective
20
countries. In selecting the sample of “small firms” in each country, we have attempted to maintain
comparability of firm sizes across countries. Since what is perceived as a “small firm” differs across
countries, to obtain a standardized size we divide firm asset size by the country’s GDP. By this
measure, the smallest firms in the dataset for each of the developing countries are of approximately
similar size. For these countries, we defined as “small firms” those firms in the smallest quartile in
their respective countries. For every other country in the sample, “small firms” are firms in that
quartile of firms in each country which most closely approximates in size the smallest quartile of
firms in the developing countries, where size is measured by the ratio of firm’s assets to the
economy’s Gross Domestic Product. For each country, the firm-specific variables are constructed by
taking equally weighted averages of the annual values for the whole period for the sub-samples of
large and small firms separately.27
Insert Table IIIA and IIIB here
We present correlations matrices for the variables in Table III. Simple correlations between country
means of the variables of interest (LTD/TA, STD/TA and LTD/TD) and the explanatory variables
are shown in Table IIIA for large and small firms separately. The two variables measuring for the
effectiveness of the legal system, Law&Order and Legal, are significantly correlated with all of our
financial-structure variables. The effectiveness of the legal system is highly correlated with greater
reliance on long-term debt and smaller reliance on short-term debt. The signs of the correlations
between the financial-structure variables and the Gross Domestic Product per capita parallel those
between the financial-structure variables and the legal-effectiveness variables. However, the
correlations with the legal effectiveness variables are higher and more statistically significant. Of the
other legal variables, the most interesting correlations are with the creditor-rights index. High scores
on the index of creditor rights are associated with a greater reliance on short-term debt over long-term
debt and lower absolute levels of the ratio of long-term debt to total debt. This is consistent with the
27 Weighting by firm size does not alter the results.
21
argument by Diamond (1991) that lenders that engage in monitoring have an incentive to make short-
maturity loans. The correlations between the financial-structure variables and two other legal
variables, the index of shareholder rights and the dummy for common law, are of smaller magnitude.
Finally, correlations involving the institutional and firm-specific control variables show less evidence
of statistical significance.
Panel IIIB explores the raw correlations between the explanatory variables using data for all firms in
the sample, regardless of size. The legal-effectiveness variables, Law&Order and Legal, are highly
positively correlated with income per capita, and with the existence of a large banking sector. The
relation between these variables and the other institutional variables is mixed. However, firms in
countries with an effective legal system, as measured by both these variables, tend to have a lower
ratio of net fixed assets to total assets, to be on the average less profitable and to pay out lower
dividends than firms in countries with less effective legal systems.
The three legal variables that measure specific characteristics of the legal system show fewer
significant correlations. As pointed out by LLSV, countries with a common-law tradition have better
shareholder and creditor rights. However, in these countries the correlation with shareholder rights is
stronger, indicating a relative predilection for protecting shareholders. This may be one of the
explanations for the positive correlation that we observe between the common-law dummy variable
and MCap/GDP and the negative correlation between this dummy and Bank/GDP.
Inspection of the table also reveals that countries with large banking systems tend to have higher
ratios of market capitalization to Gross Domestic Product. This finding has also been reported by
Levine and Demirguc-Kunt (1995). Large banking systems are also negatively correlated with
inflation. Finally, it is interesting to note that firms in countries with larger banking systems have
lower ratios of net fixed assets to total assets. This would be consistent with the hypothesis that
22
financial intermediaries have a greater willingness to lend against short-term assets, perhaps as a
result of their ability to monitor corporations.
Table IV presents summary statistics for the variables we use in the regressions reported below.
Insert Table IV here
4. DETERMINANTS OF FINANCIAL STRUCTURE
Differences in the legal systems and financial institutions between countries affect the borrowing of
firms in developed and developing countries in two ways. First, these differences affect the absolute
levels of long-term and short-term borrowing. Second, they create incentives to alter the mix of long-
term and short-term debt. Accordingly, we analyze both the ratio of long-term to total debt and the
levels of long-term and short-term debt relative to total assets.
Significant changes in the legal systems of countries from year to year are rare, and the indicators of
investors’ legal protections do not vary over time. As a result, in our investigation of the determinants
of financial structure we rely primarily on cross-sectional analysis across countries, taking as our
observations the time-series country means of each variable.28
The first specification, estimated using OLS and White’s adjustment for heteroscedasticity, is
reported in columns (1) and (4) of Panels A-C of Tables V. The dependent variables in the three
panels are the ratios of long-term and short-term debt to total assets, and long-term debt to total debt
28 We have also estimated panel regressions in which each financial structure variable of interest is regressed on the explanatory variables and country and year dummies. This specification is potentially misspecified because it treats cross-sectional and time-series variation equally. Moreover, annual observations may not be independent. However, it has the advantage of using all the data, and was reported in an earlier version of this paper. Below we note some additional insights suggested by the panel.
23
respectively. The explanatory variables are the firm-specific characteristics and descriptors of the
legal system and financial institutions.
We follow the conventional approach of interpreting a significant positive (negative) coefficient in
the regressions reported below as evidence of a positive (negative) relation between the dependent
variable and the corresponding explanatory variable. This approach enables us to describe
associations within our sample. As pointed out by Barclay, Marx and Smith (1997), claims that these
relations are more general require specific restrictions on the functional form describing how the
firm’s value depends on the explanatory variables.
A potential problem in explaining differences in financial structures across nations by institutional
factors is that some of these institutions may themselves be influenced by firms’ financing decisions
or by the development of other institutions. At the country level it is unlikely that the major legal and
financial institutions develop completely independently. In such cases, a causal interpretation requires
a model of dependence between institutions.
In the present context a key concern is whether a country’s financial institutions are an independent
determinant of firms’ financial structures. While an individual firm takes the size of the banking
sector as given, its size is affected by the aggregate of the decisions of all firms. More importantly,
characteristics of the legal system that facilitate enforceable contracts between firms and their
creditors also facilitate contracting between banks and other borrowers.
In our second statistical specification we allow for the possibility that the size of a country banking
sector is influenced by the financing choices of firms and a country’s legal system. We use a two-
stage estimator to control for this dependence. In the first stage we obtain a predicted size of the
banking sector, given the country’s level of development and its legal system. In the second stage we
24
replace Bank/GDP by its predicted value in the cross-sectional regressions (columns (2) and (5) of
Table V).29
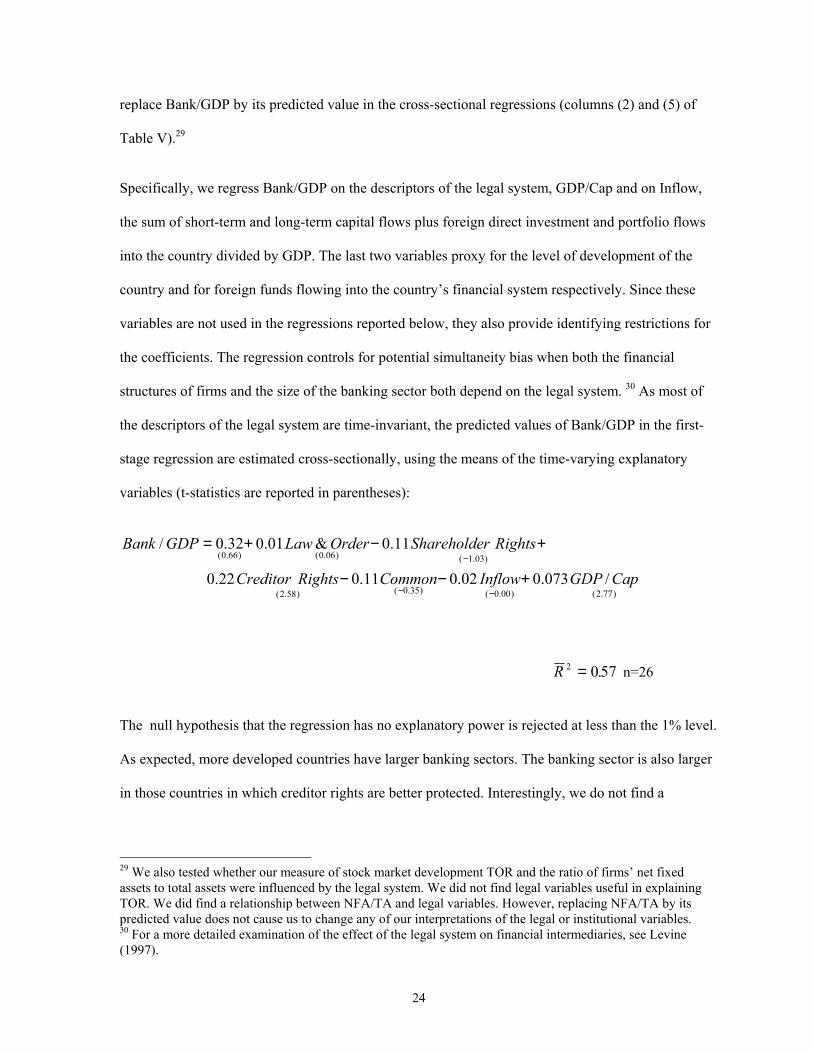
Specifically, we regress Bank/GDP on the descriptors of the legal system, GDP/Cap and on Inflow,
the sum of short-term and long-term capital flows plus foreign direct investment and portfolio flows
into the country divided by GDP. The last two variables proxy for the level of development of the
country and for foreign funds flowing into the country’s financial system respectively. Since these
variables are not used in the regressions reported below, they also provide identifying restrictions for
the coefficients. The regression controls for potential simultaneity bias when both the financial
structures of firms and the size of the banking sector both depend on the legal system. 30 As most of
the descriptors of the legal system are time-invariant, the predicted values of Bank/GDP in the first-
stage regression are estimated cross-sectionally, using the means of the time-varying explanatory
variables (t-statistics are reported in parentheses):
)77.2()00.0()35.0()58.2(
)03.1()06.0()66.0(
/073.002.011.022.0
11.0&01.032.0/
CapGDPInflowCommonRightsCreditor
RightsrShareholdeOrderLawGDPBank
+−−
+−+=
−−
−
R 2 057= . n=26
The null hypothesis that the regression has no explanatory power is rejected at less than the 1% level.
As expected, more developed countries have larger banking sectors. The banking sector is also larger
in those countries in which creditor rights are better protected. Interestingly, we do not find a
29 We also tested whether our measure of stock market development TOR and the ratio of firms’ net fixed assets to total assets were influenced by the legal system. We did not find legal variables useful in explaining TOR. We did find a relationship between NFA/TA and legal variables. However, replacing NFA/TA by its predicted value does not cause us to change any of our interpretations of the legal or institutional variables. 30 For a more detailed examination of the effect of the legal system on financial intermediaries, see Levine (1997).
25
relationship between Bank/GDP and the efficiency of the legal system or any of the other descriptors
of the legal system.31
4.1. Long-Term Debt
Panel A of Table V presents OLS regressions explaining the ratio of long-term debt to total assets
(LTD/TA) for the largest and smallest quartiles of firms in each country over the sample period.
Insert Table V here
Two results pertaining to the legal environment are of particular interest. First, reliance on long-term
debt by large firms is clearly higher in countries with an effective legal system.32 This effect is also
economically very significant. The magnitude of the coefficient in the cross-sectional regressions
suggests that the marginal effect of the difference between a very efficient legal system (e.g.,
Switzerland) and an inefficient one (e.g., Turkey) is to increase the ratio of large firms’ long-term
assets to total assets by 0.25. For small firms the coefficient of Law&Order is only significant in the
OLS specification. Second, there is only limited evidence that indices of specific protections or
common-law traditions affect firm’s long-term indebtedness. Thus, for example, while both large and
small firms in common-law countries have less debt, once we adjust for the endogeneity of the
banking system, this effect disappears. Interestingly, high values of the index of creditor rights are not
correlated with the use of long-term debt. We explore the role of creditor rights in more detail below.
31 Causality may also run in the other direction: financial and non-financial firms influence commercial laws. The incentives for such behavior in a general equilibrium context have not been explored and are beyond the scope of this paper. 32 In the reported equations the efficiency of the legal system is measured by the variable Law&Order. The variable Legal is not used since this index is targeted towards foreign firms. When this variable is entered instead of Law&Order , its coefficient was of the same sign, although not always signficant, and if so, at a lower level.

26
Of the financial-institution variables, for large firms the only significant coefficient is that of the stock
market’s turnover ratio, TOR.33 Thus, for large firms an active stock market is associated with higher
long-term leverage, However, the marginal effect of the variation of stock market activity on long-
term debt of large firms is relatively smaller than that of the efficiency of the legal system. Comparing
countries with relatively high turnover (such as the US or Thailand) and countries with low turnover
(such as Pakistan) indicates that the higher turnover in the former increases long-term debt by about
5%.
The coefficient of the size of the banking sector is not significant in the large-firm equations. By
contrast, for small firms the coefficients of the banking variable exhibit an interesting pattern. The
size of the banking sector by itself is not significant. However, when the predicted values of
Bank/GDP are used instead of actual values in column (5), the coefficient changes sign and is
significant at the 10% level. Since creditor rights are an important determinant of the predicted
Bank/GDP, this provides some evidence that strong rights promote access to long-term credit for
small firms, albeit indirectly by increasing the size of the banking system. This is consistent with the
hypothesis that small firms are “marginal” and that their long-term borrowing is correlated with year-
to-year changes in the size of the banking sector. Large firms are likely to be infra-marginal
borrowers, whose needs are satisfied even when the banking system is undeveloped. By contrast,
small firms are more likely to be marginal borrowers, so that the size of the banking system
determines their access to bank finance.
Four of the control variables are also significant for both large and small firms: Extensive government
subsidies are associated with a high ratio of long-term debt to assets. High average rates of inflation
are negatively associated with the use of long-term debt for both large and small firms: an increase of
5% in the inflation rate reduces the ratio of long-term to total assets by approximately 1.25%. High
33 The stock market size variable MCap/GDP is not included in the reported specifications since it is not significant. This is consistent with the results in Demirguc-Kunt and Maksimovic (1996a).

27
average net fixed asset to total asset ratios are associated with a higher ratio of long-term debt to total
assets. This is consistent with the notion that fixed assets serve as good collateral for long-term debt.34
Profitable firms have more long-term debt.
Taken together, the results suggest that for large firms the observed variation in the levels of long-
term debt across countries is related to the effectiveness of the legal system and the liquidity of the
stock market. For all firms the availability of collateral, high profitability, a low rate of inflation and a
high level of government subsidies are associated with long-term financing. There is some evidence
that increased creditor protection increases the amount of long-term debt used by large firms
indirectly, by increasing the size of the banking sector.35
4.2. Short-term Debt
Panel B of Table V examines cross-country variation in the use of short-term debt. For large firms,
the coefficients of the two legal-efficiency variables and the common-law dummy are significant.
Large firms in countries with more effective legal systems have less short-term debt. This effect is
economically significant and is of the same order as the positive effect of legal efficiency on long-
term debt. However, we do not find that the use of short-term debt by small firms is affected either by
the effectiveness of the legal system or by whether or not the legal system is based on common law.
34 Div/TA is not significant when entered into the regression equation. To conserve degrees of freedom, it was dropped from subsequent regressions. To investigate the role of asset composition we have tried adding an additional variable, the mean standard deviation of firm-level cash flows in each country to the specification. They were also insignificant and are not reported. 35 We have also estimated these equations using a panel that allows for both time-series and cross-sectional variation. The results suggest that year-to-year within-country variations in the explanatory variables affect large and small firms differently. Within countries, changes in the use of long-term debt by large firms are related to changes in the efficiency of the legal system, the level of government subsidies and the activity level in the stock market. These factors were not associated with changes in the use of long-term debt by small firms in the panel regressions. A likely explanation for this difference is that small firms, which have less access to financial markets, governmental subsidies and the legal system, are less likely to be affected by marginal improvements in financial markets and the legal system and changes in the level of subsidies. This is consistent with the additional finding that within-country variation in long-term borrowing by small firms was more strongly related to yearly changes in the size of the banking sector. By contrast, the cross-sectional differences between countries that we measure in the paper are likely to be of a greater magnitude. Thus, they affect small firms as well as large firms.
28
The other indices of shareholder or creditor rights do not help explain the use of short-term debt for
either large or small firms.
Only one of the coefficients of financial system variables is statistically significant. Small firms in
countries with a large banking sector have less short-term debt. However, this effect disappears when
the Bank/GDP variable is replaced by its predicted value. Cross-country variation in the stock market
or in values of the indices of investor protection does not help explain differences in the usage of
short-term debt. Similarly, the indicator of government subsidies as a fraction of the Gross Domestic
Product does not improve the explanatory power of the regressions.
Inspection of columns (2) and (4) reveals that several firm-specific variables help explain short-term
leverage. One of these variables, the ratio of net sales to net fixed assets (NS/NFA) is positively
associated with short-term borrowing for both small and large firms. A high ratio of net fixed assets
to total assets is associated with lower levels of short-term borrowing for large firms. This is
consistent with the notion that such firms more easily match the maturity of borrowing with the
maturity of their assets. Thus, large firms with fixed assets borrow long-term in preference to short-
term borrowing. Interestingly, more profitable large firms have more short-term debt, whereas we do
not obtain a similar significant relation for small firms. Small firms that grow fast rely more heavily
on short-term debt. This finding is consistent with Myers’ (1977) hypothesis that growth options are
not financed using long-term debt.36
4.3. Debt Maturity
36 In unreported regressions we have regressed TD/TA on our explanatory variables. For large firms, the coefficient on Law & Order is not significant, suggesting that for these firms the total amount of debt does not vary with the efficiency of the legal system. In both our specifications, the coefficients on the Shareholder Rights index, TOR, Bank/GDP, Profit and of the ratio of government subsidies to GDP are positive and significant. The coefficients on the common-law dummy and inflation were negative and significant. For small firms the results were less clearcut, with only two coefficients significant in both specifications: The coefficient on the rate of inflation is negative and significant and the coefficient of the ratio of government subsidies to GDP is positive and significant.
29
We explore how the maturity of the firm’s liabilities varies across countries in Panel C. As our
indicator of maturity, we utilize the ratio of long-term liabilities to total liabilities. The specifications
used parallel the regressions reported in Panels A and B.
The results of cross-country regressions of debt maturity on firm-specific and institutional variables
are consistent with the results for long-term and short-term debt reported above. We find evidence
that the higher the quality of legal institutions, the greater the proportion of long-term financing,
particularly in the case of large firms. The indicator of the legal system’s efficiency in settling
disputes, Law&Order, is positive and significant at the 1% level in the large-firm equation. The
predicted ratio of long-term to total debt is higher by about 0.35-0.4 in countries with the most
efficient legal systems than in countries with the least efficient systems. There is less evidence that
this Law&Order is important for small firms – the coefficient is positive significant at the 5% level in
the small firm OLS equation, but the effect disappears when predicted values of Bank/GDP are used.
Consistent with the previously reported results, large firms in countries with active stock markets
have longer maturity of debt. There is less evidence that the level of market activity is related to debt
maturity of smaller firms. Similarly, the evidence about the effect of the banking system on debt
maturity of small firms is mixed. When the predicted values of Bank/GDP are used as an explanatory
variable, the maturity of debt of small firms in countries is positively related to the size of the banking
sector. The predicted ratio of long-term debt to total debt increases by approximately 30% in a
country whose banking system is in the lower end of the range (say, New Zealand) compared to a
country at the high end (Japan). Together with the finding that small firms in countries with large
banking systems have less short-term debt, this finding suggests that a large banking sector enables
small firms to extend the maturity of their debt. However, the coefficient of Bank/GDP is only
significant at the five-percent level in only one of the two specifications.
30
The coefficients of several of the control variables are of interest. The coefficient of inflation is
negative and highly significant for both large and small firms. High ratios of net fixed assets to total
assets are positively associated with long-maturity of debt for large firms. High levels of government
subsidies are positively associated with longer debt maturity for small firms.
4.4. Specific Legal Protections
In Table V we find no evidence that the index of creditor rights helps predict either short-term and
long-term leverage or debt maturity. In this subsection we explore the relation between creditor rights
and debt levels in more detail. First, we replace the creditor-rights index by all its individual
components in the large-firm and small-firm cross-sectional equations in Panels A-C of Table V.
Columns (1) and (4) of Table VI show the coefficients of the individual components of the index in
these equations for large and small firms respectively. In columns (2) and (5) we replace the creditor-
rights index by each component in turn. Finally, in columns (3) and (6) the index is replaced by each
component in turn, but this time Bank/GDP is replaced by its predicted value.
Insert Table VI here
Inspection of Table VI reveals that the variation in most of the components of the creditor rights
index in this sample is not significantly related to the debt composition decisions of large firms. The
one exception is variation in the right of secured creditors to be paid first in bankruptcy. This right is
associated with increased short-term borrowing and a significantly shorter maturity of debt for large
firms. The interpretation of a significant partial correlation between any single legal protection and
the use of a financial contract must be tentative because the importance of the protection varies in
different systems. Moreover, because we are estimating a series of regressions, the statistical
significance of any single coefficient may be overstated. However, the signs of the coefficients of the
right of secured creditors to be paid first in bankruptcy are consistent with the proposition that short-
term lenders have a greater incentive to monitor borrowers and benefit most from an ability to
31
repossess secured assets, as suggested by Diamond (1991). Interestingly, the rights of secured
creditors are not similarly correlated with the financing decisions of small firms.37
Table VI also provides evidence that small firms in countries where there exists an automatic stay on
the assets of bankrupt firms have more long-term debt and a higher ratio of long-term debt to short-
term debt. There is no evidence that these firms are substituting long-term for short-term debt. Again,
an interpretation must be tentative. In bankruptcy, an automatic stay benefits borrowers at the
expense of secured creditors. As a result, small firms may wish to borrow more if the automatic stay
credibly commits lenders not to expropriate them in the event that they become financially distressed.
5. CONCLUSIONS
We examine maturity of firms’ liabilities in thirty developed and developing countries during the
period 1980-1991. We find systematic differences in the use of long-term debt between developed
and developing countries and small and large firms. In developed countries firms have more long-
term debt and a greater proportion of their total debt is held as long-term debt. This is true regardless
of firm size across our sample of countries. This difference cannot be explained by matching of
maturities of assets and liabilities as firms in developing countries have higher proportions of net
fixed assets to total assets. Also, large firms have more long-term debt as a proportion of total assets
and debt compared to smaller firms. We attempt to explain the observed cross-country variation in
leverage and maturity of liabilities by differences in the legal systems, financial institutions, and
government subsidies, as well as firm characteristics and macroeconomic factors, such as the rate of
inflation and the economy’s growth rate.
We find strong evidence that large firms in countries with legal systems perceived to be effective
have more long-term debt relative to assets and that their debt is of longer maturity. Large firms in
37 Note that is some countries, such as the United States, trade creditors possess rights that other secured creditors do not possess. Thus, systematic differences in the amount of trade credit used by large and small
32
countries with effective legal systems have lower short-term liabilities, suggesting that such firms are
substituting long-term debt for short-term debt. For small firms, evidence of a relation between the
effectiveness of the legal system and the ratio of long-term debt to assets is weaker. We also do not
find evidence of lower short-term liabilities by small firms in countries with more effective legal
systems, perhaps because small firms tend to use less long-term debt than large firms. These
conclusions are consistent with the findings of Demirguc-Kunt and Maksimovic (1996a) that a higher
proportion of firms in countries with effective legal systems finance their growth externally.
We also test the hypothesis that the tradition on which a country’s legal system is based influences
the optimal financing of firms in that country. We find limited evidence that both large and small
firms in countries with a common-law tradition use less long-term debt, relative to their assets, than
firms in countries with a civil-law tradition. There is also limited evidence that large firms in
common-law countries also use less short-term debt. The maturity of debt of large firms in common-
law and civil-law countries does not differ significantly, whereas it is longer for small firms.
The structure of financial institutions is also an important determinant of firms’ financing choices.
Consistent with Demirguc-Kunt and Maksimovic’s (1996a) results on external financing of
investment, we find that whereas the variation in the size of the stock market relative to the country’s
economy is not correlated with financing patterns, variation in the level of activity of the stock
market does have explanatory power for large firms. In countries with active stock markets, large
firms have more long-term debt and debt of longer maturity. Neither the level of activity nor the size
of the market is correlated with financing choices of small firms. By contrast, in countries with a large
banking sector, small firms have less short-term debt and their debt is of longer maturity. Variation in
the size of the banking sector does not have a corresponding correlation with the capital structures of
large firms. At the margin, large banking sectors enable smaller firms to substitute long-term debt for
short-term debt.
firms would confound our results.
33
We also find that the magnitude of government subsidies to industry is positively related to the use of
long-term debt by both large and small firms, perhaps as a result of implicit guarantees. Inflation is
negatively related to the use of long-term debt. Variation in several of the firm-specific characteristics
is also related to the use of debt of different maturities. In particular, high ratios of net fixed assets to
total assets are positively related to the use of long-term debt by both large and small firms and less
short-term borrowing by large firms only. This finding suggests that large firms can more easily use
their fixed assets to obtain long-term debt. By contrast, high ratios of sales to fixed assets are
associated with more extensive use of short-term debt. This would be consistent with maturity
matching if firms with high ratios of sales to fixed assets also have high ratios of accounts receivable
to fixed assets.
In sum, the underlying legal and institutional differences explain a large portion of the variation in the
use of long-term debt. While we have identified relations between financial institutions and legal
system origin and efficiency, on the one hand, and financial structures of firms on the other, we have
been not been able to consistently relate specific investor protections with firm financing. This is not
surprising, since the constraints that specific features of the legal system impose on contracting by
firms and investors depend on the characteristics of the financial system in each country. The exact
way in which this happens is an open research question.
The paper has several policy implications. First, it provides evidence confirming that firms in
developing countries have less long term debt, even after accounting for their characteristics. Second,
the paper shows that this lack of term financing is mainly due to institutional differences, such as the
extent of government subsidies, different levels of development of stock markets and banks, and
differences in the underlying legal infrastructure. Third, the results indicate that while policies that
help develop countries’ legal and financial infrastructure might be effective in increasing the access
of firms to long-term debt, different policies would be necessary to lengthen the debt maturity of
large and small firms. Improvements in legal effectiveness seem to benefit all firms, although this

34
result is much less significant for the smallest firms, which have limited access to the legal system.
Similarly, policies that would help improve the functioning and liquidity of stock markets, would
again benefit mostly the large firms. In contrast, policies that would lead to improvements in the
development of the banking system would improve the access of smaller firms to long-term credit.

35
REFERENCES
Admati, A.R., P. Pfleiderer and J. Zechner, 1994, Large Shareholder Activism, Risk Sharing and Financial Market Equilibrium, Journal of Political Economy 102, 1097-1131.
Allen, F., and D. Gale, 1994, Limited market participation and volatility of asset prices, American Economic Review 84, 933-955.
Ball, R., 1995, Making Accounting More International, Journal of Applied Corporate Finance 8, 19-29.
Barclay, M.J. and C.W. Smith, Jr., 1995, The maturity of corporate debt, Journal of Finance 50, 609-631.
Barclay, M.J, L.M. Marx, and C.W. Smith, Jr., 1997, Leverage and Maturity as Strategic Complements, University of Rochester mimeo.
Barro, R.J., 1991, Economic Growth in a Cross Section of Countries, Quarterly Journal of Economics 106, 407-43.
Bolton, P. and D.S. Scharfstein, 1993, Optimal Debt Structure with Multiple Creditors, LSE Capital Markets Group Discussion Paper No. 161.
Calomiris, C., 1993, Corporate Finance Benefits from Universal Banking: Germany and the United States, 1870-1914,” NBER Working Paper, no. 4408.
Demirguc-Kunt A., and R. Levine, 1996, Stock market Development and Financial Intermediaries: Stylized Facts, World Bank Economic Review, 10(2) 291-321.
Demirguc-Kunt, A. and V. Maksimovic, 1995, Capital Structures in Developing Countries: Evidence from Ten Country Cases, Policy Research Working Paper, The World Bank.
Demirguc-Kunt, A. and V. Maksimovic, 1996a, Financial Constraints, Uses of Funds and firm Growth: An International Comparison, Policy Research Working Paper, The World Bank.
Demirguc-Kunt, A. and V. Maksimovic, 1996b, Stock Market Development and Firm Financing Choices, World Bank Economic Review, 10(2) 341-369.
Diamond, D.W., 1984, Financial Intermediation and Delegated Monitoring, Review of Economic Studies 51, 393-414.
Diamond, D.W., 1991a, Debt maturity and liquidity risk, Quarterly Journal of Economics 106, 709-737.
Diamond, D.W., 1991b, Monitoring and reputation: the choice between bank loans and directly placed debt, Journal of Political Economy 99, 689-721.
Diamond, D.W., 1993, Seniority and Maturity of Debt Contracts, Journal of Financial Economics 33, 341-368.

36
Diamond, D.W., 1996, Liquidity, banks and markets, Policy Research Working Paper No 1566, The World Bank.
Fama, E.F., 1985, What is different about banks? Journal of Monetary Economics 15, 29-36.
Fitzgerald, R.D., A.D. Stickler, and T.R. Watts, 1979, International survey of accounting principles and reporting practices, Price Waterhouse International, distributed by Butterworths, Ontario, Canada.
Flannery, M. J.,, 1986, Asymmetric Information and Risky Debt Maturity Choice, Journal of Finance 41, 19-37.
Graham, J., M. Lemmon, and J. Schallheim, 1996, Debt, Leases and the Endogeneity of Corporate Tax Status, Working Paper, University of Utah, Salt Lake City, UT.
Grossman, S.J., 1976, On the Efficiency of Competitive Stock Markets Where Trades Have Diverse Information. Journal of Finance 31, 573-85.
Grossman, S.J. and Stiglitz, J.E., 1980, On the Impossibility of Informationally Efficient Markets, American Economic Review 70, 393-408.
Harris, M., and A. Raviv, 1990, Capital Structure and the Informational Role of Debt, Journal of Finance 45, 321-349.
Hart, O. and J. Moore, 1995, Debt and Seniority: An Analysis of Hard Claims in Constraining Management, American Economic Review 85, 567-87.
Hauswald, R.B.H., 1996, Banking Systems, Bankruptcy Arrangements and Institutional Complementarity, University of Maryland Working Paper.
Hoshi, Kashyap and Scharfstein, 1990, The Role of Banks in Reducing the Costs of Financial Distress in Japan, Journal of Financial Economics 27, 67-88.
Hodder J.E. and L. W. Senbet, 1990, International Capital Structure Equilibrium, Journal of Finance 45, 1495-1516.
Jensen, M.C., and W. Meckling, 1976, Theory of the Firm: Managerial Behavior, Agency Costs, and Capital Structure, Journal of Financial Economics, 3, 305-360.
Kane, E.J., 1989, The S&L insurance mess: How did it happen? Washington, D.C.: Urban Institute Press.
KPMG Marwick Dreyfus, 1989, Banking and Finance in Brazil, (KPMG, Sao Paulo, Brazil)
La Porta, R., F. Lopez-de-Silanes, A. Shleifer and R. Vishny, 1996, Law and Finance, Harvard University and University of Chicago mimeo.
Lee, M. and J. Zechner, 1984, Debt, Taxes, and International Equilibrium, Journal of International Money and Finance 3, 343-55.
37
Maksimovic, V., 1988, Capital structure in repeated oligopolies, Rand Journal of Economics 19, 389-408.
Maksimovic, V. and S. Titman, 1990, Financial policy and reputation for product quality, Review of Financial Studies 4, 175-200.
Myers, S.C., 1977, Determinants of corporate borrowing, Journal of Financial Economics 5, 147-175.
Myers, S. C. and N. S. Majluf, 1984, Corporate Financing and Investment Decisions when Firms Have Information that Investors Do Not Have, Journal of Financial Economics, 13, 187-221.
Pagano, M., 1993, The flotation of companies on the stock market, European Economic Review, 1101-1125.
Price Waterhouse, 1993, Doing Business in Turkey, (Price Waterhouse, Istanbul, Turkey).
Rajan, R.G., 1992, Insiders and outsiders: the choice between informed and arm’s length debt, Journal of Finance 47, 1367-1400.
Rajan, R. and L. Zingales, 1995, Is there an optimal capital structure? Evidence from international data, Journal of Finance,50, 1421-1460.
Rajan, R. and L. Zingales, 1996, Financial Dependence and Growth, University of Chicago mimeo.
Ravid, S.A., 1996, Debt Maturity – A Survey, Financial Markets, Institutions and Instruments, 5, 1-69.
Singh, A., J. Hamid, B. Salimi and Y. Nakano, 1992, Corporate financial structures in developing countries, International Finance Corporation, Technical paper, No. 1.
Smith, C.W., Jr., and J.B. Warner, 1979, On Financial Contracting: An Analysis of Bond Covenants Journal of Financial Economics 7, 117-61.
Smith, C.W., Jr., and R.L.. Watts, 1992, The investment opportunity set and corporate financing, dividend and compensation policies, Journal of Financial Economics 32, 263-292..
Spence, A.M., 1985, Capital Structure and the Corporation's Product Market Environment in Friedman, B.M., (ed.), Corporate Capital Structures in the United States, National Bureau of Economic Research Project Report series, Chicago and London: University of Chicago Press.
Stohs, M. H. and D.C. Mauer, 1996, The determinants of corporate debt maturity structure, Journal of Business, forthcoming.
Swoboda, P., and J. Zechner, 1995, Financial Structure and the Tax System, in R.A. Jarrow, V. Maksimovic and W.T. Ziemba eds., Handbook of Finance, North-Holland, Amsterdam.
Watson, A., 1974, Legal Transplants, Charlottesville, VA: University of Virginia Press.
Watts, R.L. and J.L. Zimmerman, 1986, Positive Accounting Theory, Englewood Cliffs, N.J.: Prentice-Hall.

38
Williamson, O.E., 1988, Corporate Finance and Corporate Governance, Journal of Finance 43, 567-91.
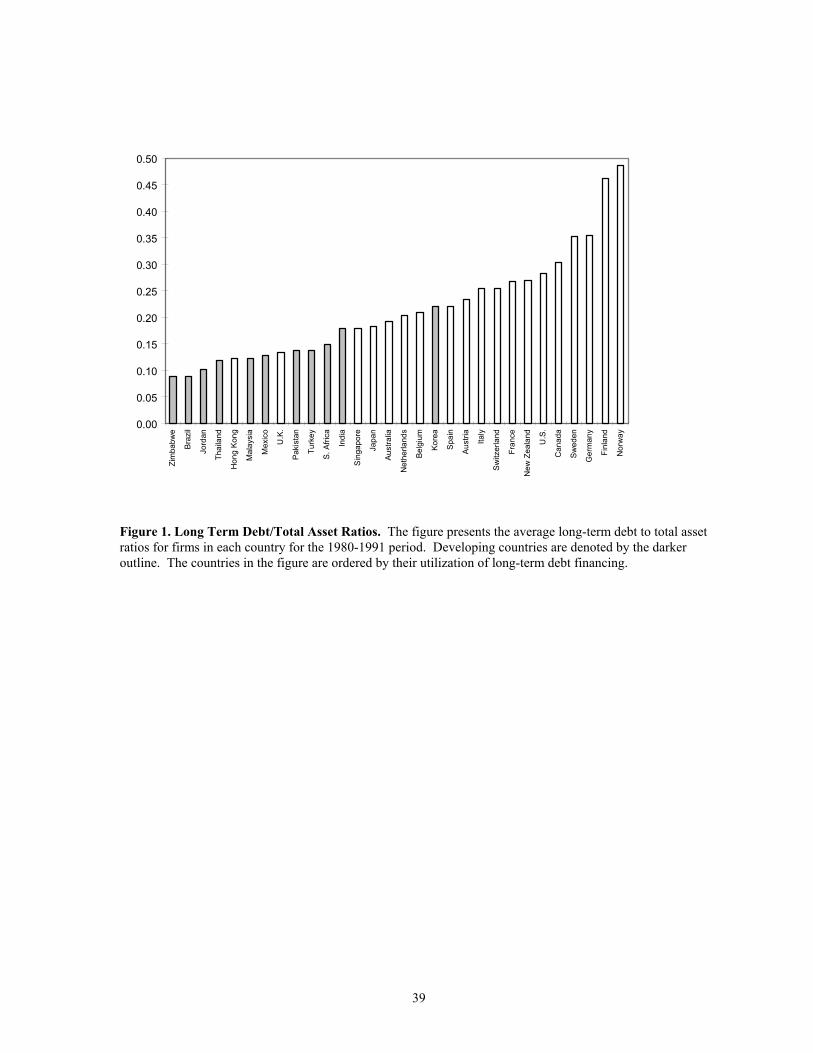
39
0.00
0.05
0.10
0.15
0.20
0.25
0.30
0.35
0.40
0.45
0.50Zi
mba
bwe
Braz
il
Jord
an
Thai
land
Hon
g Ko
ng
Mal
aysi
a
Mex
ico
U.K
.
Paki
stan
Turk
ey
S. A
frica
Indi
a
Sing
apor
e
Japa
n
Aust
ralia
Net
herla
nds
Belg
ium
Kore
a
Spai
n
Aust
ria
Italy
Switz
erla
nd
Fran
ce
New
Zea
land
U.S
.
Can
ada
Swed
en
Ger
man
y
Finl
and
Nor
way
Figure 1. Long Term Debt/Total Asset Ratios. The figure presents the average long-term debt to total asset ratios for firms in each country for the 1980-1991 period. Developing countries are denoted by the darker outline. The countries in the figure are ordered by their utilization of long-term debt financing.
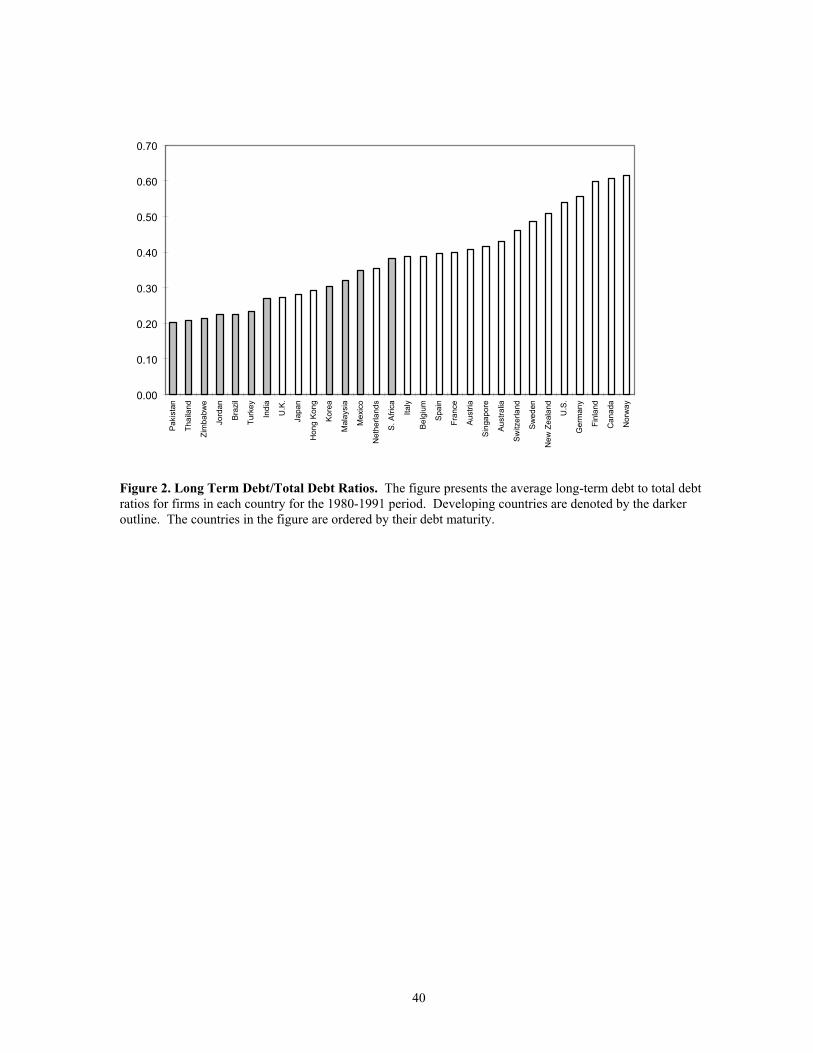
40
0.00
0.10
0.20
0.30
0.40
0.50
0.60
0.70
Paki
stan
Thai
land
Zim
babw
e
Jord
an
Braz
il
Turk
ey
Indi
a
U.K
.
Japa
n
Hon
g Ko
ng
Kore
a
Mal
aysi
a
Mex
ico
Net
herla
nds
S. A
frica
Italy
Belg
ium
Spai
n
Fran
ce
Aust
ria
Sing
apor
e
Aust
ralia
Switz
erla
nd
Swed
en
New
Zea
land
U.S
.
Ger
man
y
Finl
and
Can
ada
Nor
way
Figure 2. Long Term Debt/Total Debt Ratios. The figure presents the average long-term debt to total debt ratios for firms in each country for the 1980-1991 period. Developing countries are denoted by the darker outline. The countries in the figure are ordered by their debt maturity.
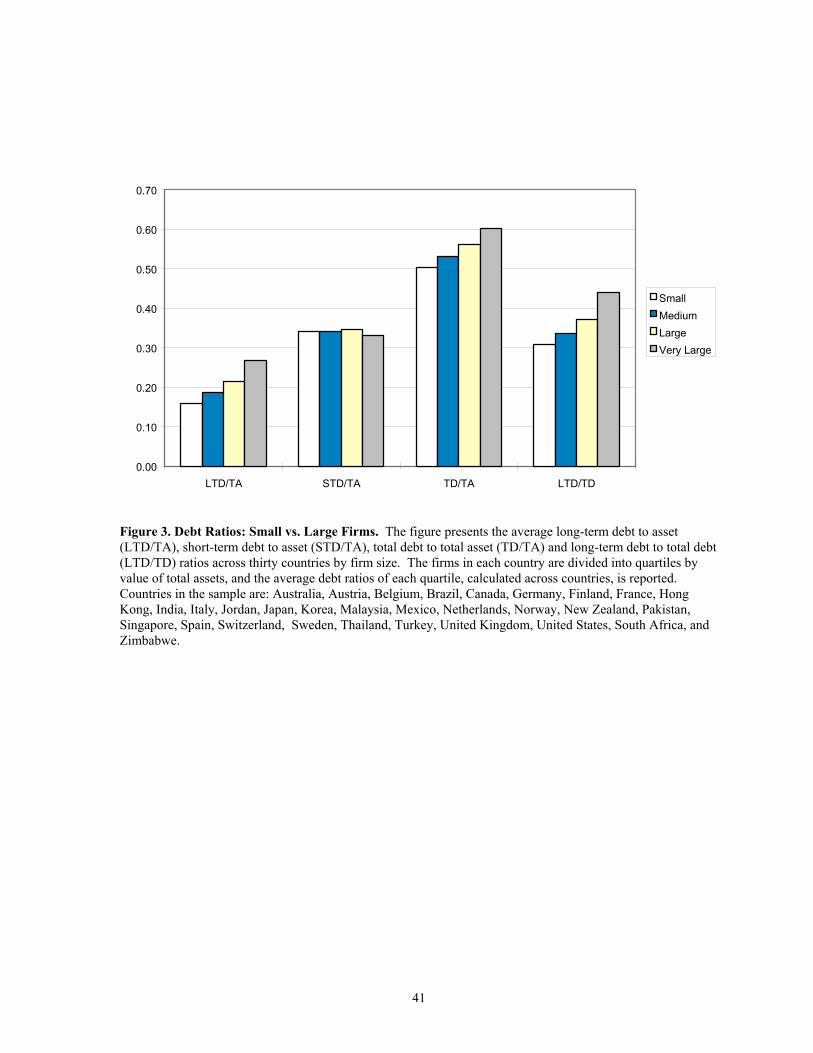
41
0.00
0.10
0.20
0.30
0.40
0.50
0.60
0.70
LTD/TA STD/TA TD/TA LTD/TD
SmallMediumLarge Very Large
Figure 3. Debt Ratios: Small vs. Large Firms. The figure presents the average long-term debt to asset (LTD/TA), short-term debt to asset (STD/TA), total debt to total asset (TD/TA) and long-term debt to total debt (LTD/TD) ratios across thirty countries by firm size. The firms in each country are divided into quartiles by value of total assets, and the average debt ratios of each quartile, calculated across countries, is reported. Countries in the sample are: Australia, Austria, Belgium, Brazil, Canada, Germany, Finland, France, Hong Kong, India, Italy, Jordan, Japan, Korea, Malaysia, Mexico, Netherlands, Norway, New Zealand, Pakistan, Singapore, Spain, Switzerland, Sweden, Thailand, Turkey, United Kingdom, United States, South Africa, and Zimbabwe.
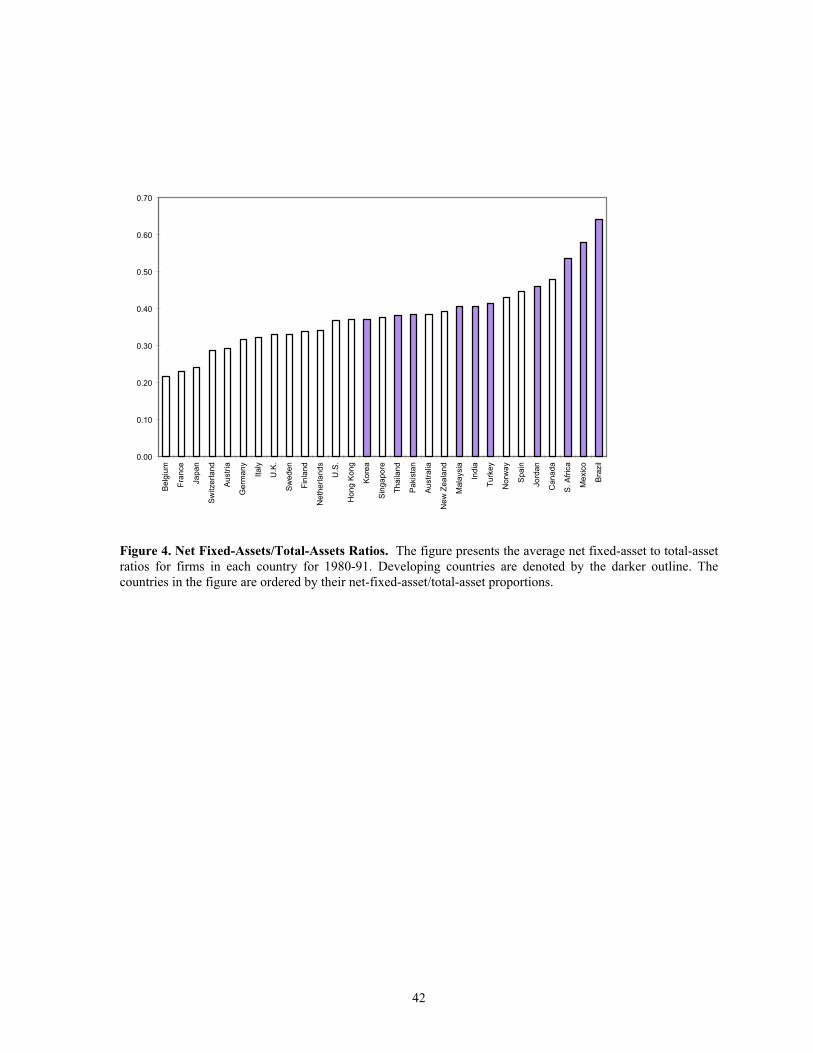
42
0.00
0.10
0.20
0.30
0.40
0.50
0.60
0.70
Belg
ium
Fran
ce
Japa
n
Switz
erla
nd
Aust
ria
Ger
man
y
Italy
U.K
.
Swed
en
Finl
and
Net
herla
nds
U.S
.
Hon
g Ko
ng
Kore
a
Sing
apor
e
Thai
land
Paki
stan
Aust
ralia
New
Zea
land
Mal
aysi
a
Indi
a
Turk
ey
Nor
way
Spai
n
Jord
an
Can
ada
S. A
frica
Mex
ico
Braz
il
Figure 4. Net Fixed-Assets/Total-Assets Ratios. The figure presents the average net fixed-asset to total-asset ratios for firms in each country for 1980-91. Developing countries are denoted by the darker outline. The countries in the figure are ordered by their net-fixed-asset/total-asset proportions.
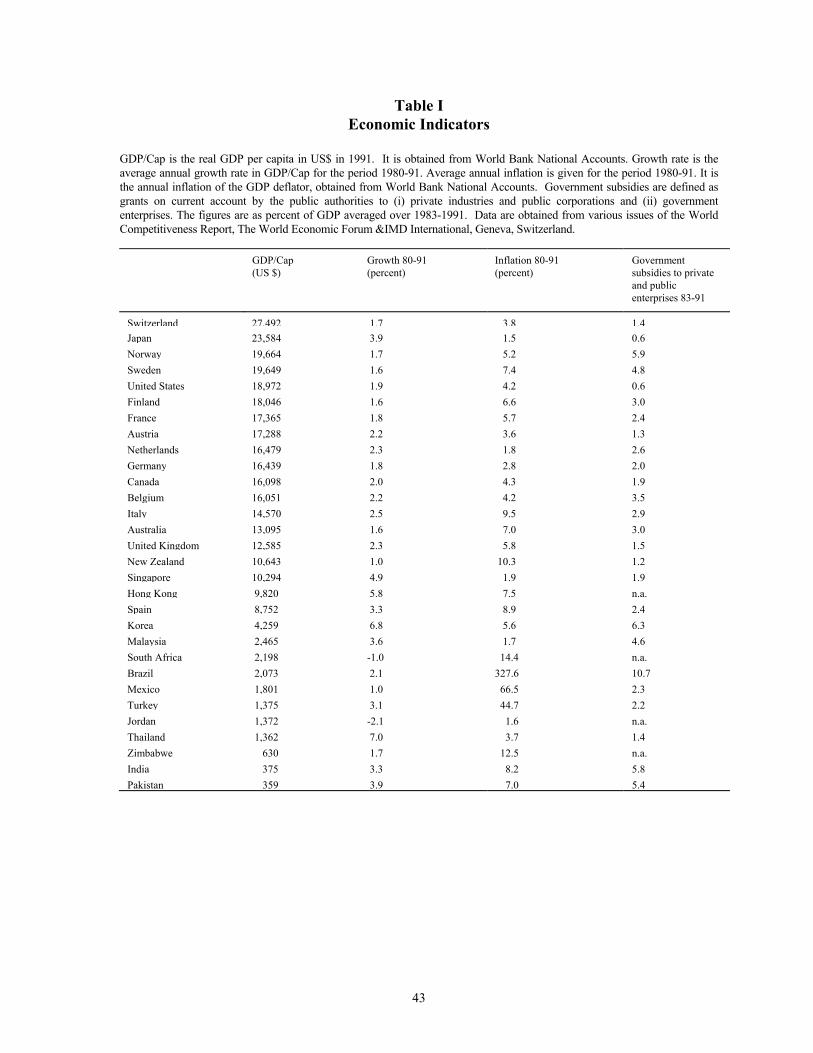
43
Table I Economic Indicators
GDP/Cap is the real GDP per capita in US$ in 1991. It is obtained from World Bank National Accounts. Growth rate is the average annual growth rate in GDP/Cap for the period 1980-91. Average annual inflation is given for the period 1980-91. It is the annual inflation of the GDP deflator, obtained from World Bank National Accounts. Government subsidies are defined as grants on current account by the public authorities to (i) private industries and public corporations and (ii) government enterprises. The figures are as percent of GDP averaged over 1983-1991. Data are obtained from various issues of the World Competitiveness Report, The World Economic Forum &IMD International, Geneva, Switzerland.
GDP/Cap (US $)
Growth 80-91 (percent)
Inflation 80-91 (percent)
Government subsidies to private and public enterprises 83-91
Switzerland 27,492 1.7 3.8 1.4Japan 23,584 3.9 1.5 0.6 Norway 19,664 1.7 5.2 5.9 Sweden 19,649 1.6 7.4 4.8 United States 18,972 1.9 4.2 0.6 Finland 18,046 1.6 6.6 3.0 France 17,365 1.8 5.7 2.4 Austria 17,288 2.2 3.6 1.3 Netherlands 16,479 2.3 1.8 2.6 Germany 16,439 1.8 2.8 2.0 Canada 16,098 2.0 4.3 1.9 Belgium 16,051 2.2 4.2 3.5 Italy 14,570 2.5 9.5 2.9 Australia 13,095 1.6 7.0 3.0 United Kingdom 12,585 2.3 5.8 1.5 New Zealand 10,643 1.0 10.3 1.2 Singapore 10,294 4.9 1.9 1.9 Hong Kong 9,820 5.8 7.5 n.a. Spain 8,752 3.3 8.9 2.4 Korea 4,259 6.8 5.6 6.3 Malaysia 2,465 3.6 1.7 4.6 South Africa 2,198 -1.0 14.4 n.a. Brazil 2,073 2.1 327.6 10.7 Mexico 1,801 1.0 66.5 2.3 Turkey 1,375 3.1 44.7 2.2 Jordan 1,372 -2.1 1.6 n.a. Thailand 1,362 7.0 3.7 1.4 Zimbabwe 630 1.7 12.5 n.a. India 375 3.3 8.2 5.8 Pakistan 359 3.9 7.0 5.4
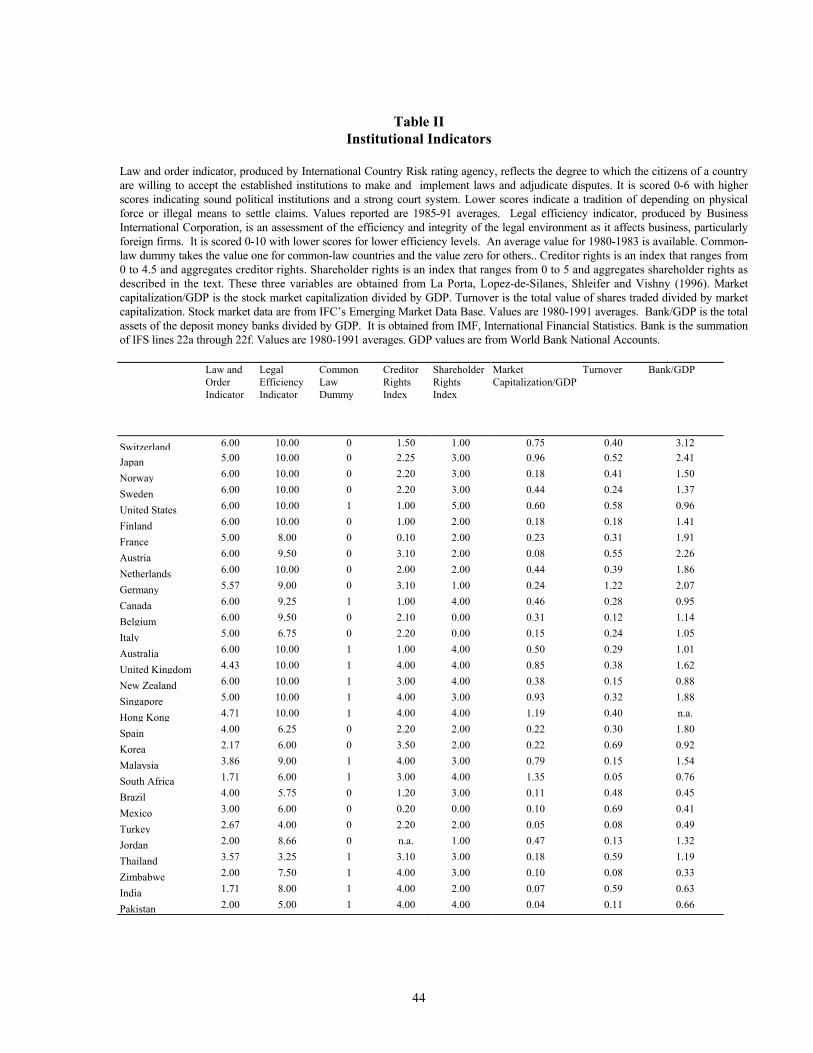
44
Table II
Institutional Indicators
Law and order indicator, produced by International Country Risk rating agency, reflects the degree to which the citizens of a country are willing to accept the established institutions to make and implement laws and adjudicate disputes. It is scored 0-6 with higher scores indicating sound political institutions and a strong court system. Lower scores indicate a tradition of depending on physical force or illegal means to settle claims. Values reported are 1985-91 averages. Legal efficiency indicator, produced by Business International Corporation, is an assessment of the efficiency and integrity of the legal environment as it affects business, particularly foreign firms. It is scored 0-10 with lower scores for lower efficiency levels. An average value for 1980-1983 is available. Common-law dummy takes the value one for common-law countries and the value zero for others.. Creditor rights is an index that ranges from 0 to 4.5 and aggregates creditor rights. Shareholder rights is an index that ranges from 0 to 5 and aggregates shareholder rights as described in the text. These three variables are obtained from La Porta, Lopez-de-Silanes, Shleifer and Vishny (1996). Market capitalization/GDP is the stock market capitalization divided by GDP. Turnover is the total value of shares traded divided by market capitalization. Stock market data are from IFC’s Emerging Market Data Base. Values are 1980-1991 averages. Bank/GDP is the total assets of the deposit money banks divided by GDP. It is obtained from IMF, International Financial Statistics. Bank is the summation of IFS lines 22a through 22f. Values are 1980-1991 averages. GDP values are from World Bank National Accounts. Law and
Order Indicator
Legal Efficiency Indicator
Common Law Dummy
Creditor Rights Index
Shareholder Rights Index
Market Capitalization/GDP
Turnover Bank/GDP
Switzerland 6.00 10.00 0 1.50 1.00 0.75 0.40 3.12
Japan 5.00 10.00 0 2.25 3.00 0.96 0.52 2.41
Norway 6.00 10.00 0 2.20 3.00 0.18 0.41 1.50
Sweden 6.00 10.00 0 2.20 3.00 0.44 0.24 1.37
United States 6.00 10.00 1 1.00 5.00 0.60 0.58 0.96
Finland 6.00 10.00 0 1.00 2.00 0.18 0.18 1.41
France 5.00 8.00 0 0.10 2.00 0.23 0.31 1.91
Austria 6.00 9.50 0 3.10 2.00 0.08 0.55 2.26
Netherlands 6.00 10.00 0 2.00 2.00 0.44 0.39 1.86
Germany 5.57 9.00 0 3.10 1.00 0.24 1.22 2.07
Canada 6.00 9.25 1 1.00 4.00 0.46 0.28 0.95
Belgium 6.00 9.50 0 2.10 0.00 0.31 0.12 1.14
Italy 5.00 6.75 0 2.20 0.00 0.15 0.24 1.05
Australia 6.00 10.00 1 1.00 4.00 0.50 0.29 1.01
United Kingdom 4.43 10.00 1 4.00 4.00 0.85 0.38 1.62
New Zealand 6.00 10.00 1 3.00 4.00 0.38 0.15 0.88
Singapore 5.00 10.00 1 4.00 3.00 0.93 0.32 1.88
Hong Kong 4.71 10.00 1 4.00 4.00 1.19 0.40 n.a.
Spain 4.00 6.25 0 2.20 2.00 0.22 0.30 1.80
Korea 2.17 6.00 0 3.50 2.00 0.22 0.69 0.92
Malaysia 3.86 9.00 1 4.00 3.00 0.79 0.15 1.54
South Africa 1.71 6.00 1 3.00 4.00 1.35 0.05 0.76
Brazil 4.00 5.75 0 1.20 3.00 0.11 0.48 0.45
Mexico 3.00 6.00 0 0.20 0.00 0.10 0.69 0.41
Turkey 2.67 4.00 0 2.20 2.00 0.05 0.08 0.49
Jordan 2.00 8.66 0 n.a. 1.00 0.47 0.13 1.32
Thailand 3.57 3.25 1 3.10 3.00 0.18 0.59 1.19
Zimbabwe 2.00 7.50 1 4.00 3.00 0.10 0.08 0.33
India 1.71 8.00 1 4.00 2.00 0.07 0.59 0.63
Pakistan 2.00 5.00 1 4.00 4.00 0.04 0.11 0.66
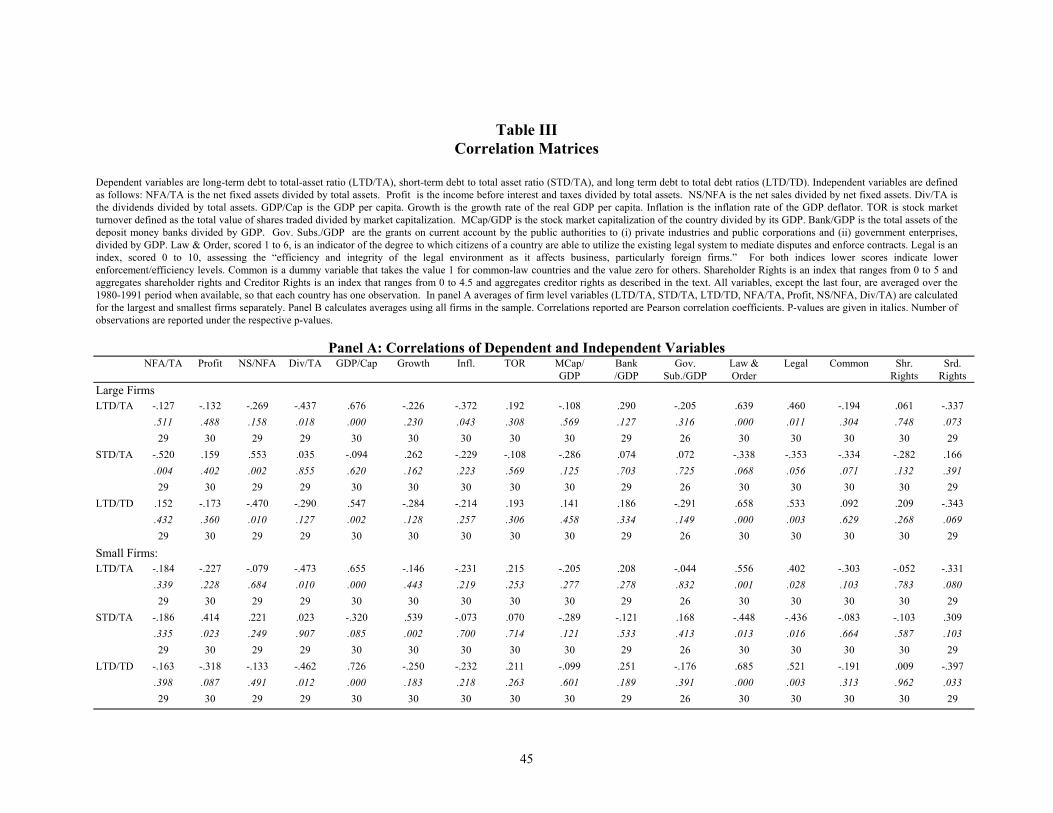
45
Table III Correlation Matrices
Dependent variables are long-term debt to total-asset ratio (LTD/TA), short-term debt to total asset ratio (STD/TA), and long term debt to total debt ratios (LTD/TD). Independent variables are defined as follows: NFA/TA is the net fixed assets divided by total assets. Profit is the income before interest and taxes divided by total assets. NS/NFA is the net sales divided by net fixed assets. Div/TA is the dividends divided by total assets. GDP/Cap is the GDP per capita. Growth is the growth rate of the real GDP per capita. Inflation is the inflation rate of the GDP deflator. TOR is stock market turnover defined as the total value of shares traded divided by market capitalization. MCap/GDP is the stock market capitalization of the country divided by its GDP. Bank/GDP is the total assets of the deposit money banks divided by GDP. Gov. Subs./GDP are the grants on current account by the public authorities to (i) private industries and public corporations and (ii) government enterprises, divided by GDP. Law & Order, scored 1 to 6, is an indicator of the degree to which citizens of a country are able to utilize the existing legal system to mediate disputes and enforce contracts. Legal is an index, scored 0 to 10, assessing the “efficiency and integrity of the legal environment as it affects business, particularly foreign firms.” For both indices lower scores indicate lower enforcement/efficiency levels. Common is a dummy variable that takes the value 1 for common-law countries and the value zero for others. Shareholder Rights is an index that ranges from 0 to 5 and aggregates shareholder rights and Creditor Rights is an index that ranges from 0 to 4.5 and aggregates creditor rights as described in the text. All variables, except the last four, are averaged over the 1980-1991 period when available, so that each country has one observation. In panel A averages of firm level variables (LTD/TA, STD/TA, LTD/TD, NFA/TA, Profit, NS/NFA, Div/TA) are calculated for the largest and smallest firms separately. Panel B calculates averages using all firms in the sample. Correlations reported are Pearson correlation coefficients. P-values are given in italics. Number of observations are reported under the respective p-values.
Panel A: Correlations of Dependent and Independent Variables NFA/TA Profit NS/NFA Div/TA GDP/Cap Growth Infl. TOR MCap/
GDP Bank /GDP
Gov. Sub./GDP
Law & Order
Legal Common Shr. Rights
Srd. Rights
Large Firms LTD/TA -.127 -.132 -.269 -.437 .676 -.226 -.372 .192 -.108 .290 -.205 .639 .460 -.194 .061 -.337
.511 .488 .158 .018 .000 .230 .043 .308 .569 .127 .316 .000 .011 .304 .748 .073 29 30 29 29 30 30 30 30 30 29 26 30 30 30 30 29
STD/TA -.520 .159 .553 .035 -.094 .262 -.229 -.108 -.286 .074 .072 -.338 -.353 -.334 -.282 .166 .004 .402 .002 .855 .620 .162 .223 .569 .125 .703 .725 .068 .056 .071 .132 .391 29 30 29 29 30 30 30 30 30 29 26 30 30 30 30 29
LTD/TD .152 -.173 -.470 -.290 .547 -.284 -.214 .193 .141 .186 -.291 .658 .533 .092 .209 -.343 .432 .360 .010 .127 .002 .128 .257 .306 .458 .334 .149 .000 .003 .629 .268 .069 29 30 29 29 30 30 30 30 30 29 26 30 30 30 30 29
Small Firms: LTD/TA -.184 -.227 -.079 -.473 .655 -.146 -.231 .215 -.205 .208 -.044 .556 .402 -.303 -.052 -.331
.339 .228 .684 .010 .000 .443 .219 .253 .277 .278 .832 .001 .028 .103 .783 .080 29 30 29 29 30 30 30 30 30 29 26 30 30 30 30 29
STD/TA -.186 .414 .221 .023 -.320 .539 -.073 .070 -.289 -.121 .168 -.448 -.436 -.083 -.103 .309 .335 .023 .249 .907 .085 .002 .700 .714 .121 .533 .413 .013 .016 .664 .587 .103 29 30 29 29 30 30 30 30 30 29 26 30 30 30 30 29
LTD/TD -.163 -.318 -.133 -.462 .726 -.250 -.232 .211 -.099 .251 -.176 .685 .521 -.191 .009 -.397 .398 .087 .491 .012 .000 .183 .218 .263 .601 .189 .391 .000 .003 .313 .962 .033 29 30 29 29 30 30 30 30 30 29 26 30 30 30 30 29
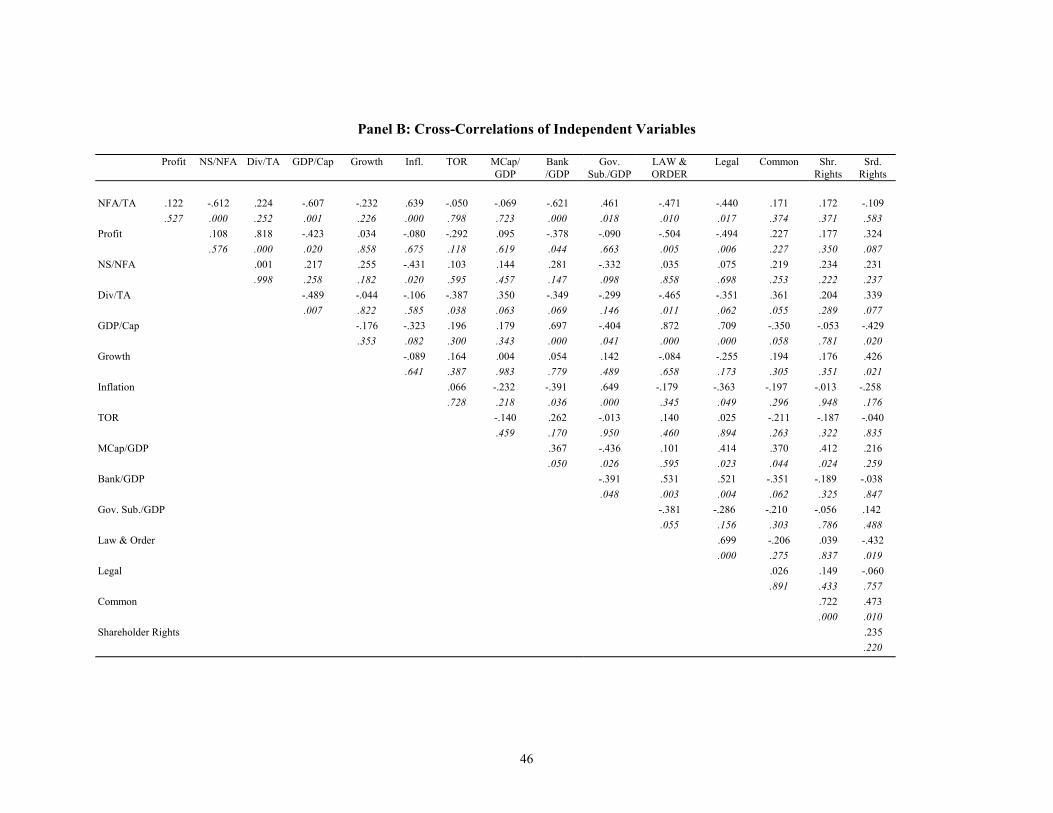
46
Panel B: Cross-Correlations of Independent Variables
Profit NS/NFA Div/TA GDP/Cap Growth Infl. TOR MCap/ GDP
Bank /GDP
Gov. Sub./GDP
LAW & ORDER
Legal Common Shr. Rights
Srd. Rights
NFA/TA .122 -.612 .224 -.607 -.232 .639 -.050 -.069 -.621 .461 -.471 -.440 .171 .172 -.109
.527 .000 .252 .001 .226 .000 .798 .723 .000 .018 .010 .017 .374 .371 .583 Profit .108 .818 -.423 .034 -.080 -.292 .095 -.378 -.090 -.504 -.494 .227 .177 .324
.576 .000 .020 .858 .675 .118 .619 .044 .663 .005 .006 .227 .350 .087 NS/NFA .001 .217 .255 -.431 .103 .144 .281 -.332 .035 .075 .219 .234 .231
.998 .258 .182 .020 .595 .457 .147 .098 .858 .698 .253 .222 .237 Div/TA -.489 -.044 -.106 -.387 .350 -.349 -.299 -.465 -.351 .361 .204 .339
.007 .822 .585 .038 .063 .069 .146 .011 .062 .055 .289 .077 GDP/Cap -.176 -.323 .196 .179 .697 -.404 .872 .709 -.350 -.053 -.429
.353 .082 .300 .343 .000 .041 .000 .000 .058 .781 .020 Growth -.089 .164 .004 .054 .142 -.084 -.255 .194 .176 .426
.641 .387 .983 .779 .489 .658 .173 .305 .351 .021 Inflation .066 -.232 -.391 .649 -.179 -.363 -.197 -.013 -.258
.728 .218 .036 .000 .345 .049 .296 .948 .176 TOR -.140 .262 -.013 .140 .025 -.211 -.187 -.040
.459 .170 .950 .460 .894 .263 .322 .835 MCap/GDP .367 -.436 .101 .414 .370 .412 .216
.050 .026 .595 .023 .044 .024 .259 Bank/GDP -.391 .531 .521 -.351 -.189 -.038 .048 .003 .004 .062 .325 .847 Gov. Sub./GDP -.381 -.286 -.210 -.056 .142 .055 .156 .303 .786 .488 Law & Order .699 -.206 .039 -.432 .000 .275 .837 .019 Legal .026 .149 -.060
.891 .433 .757 Common .722 .473
.000 .010 Shareholder Rights .235
.220
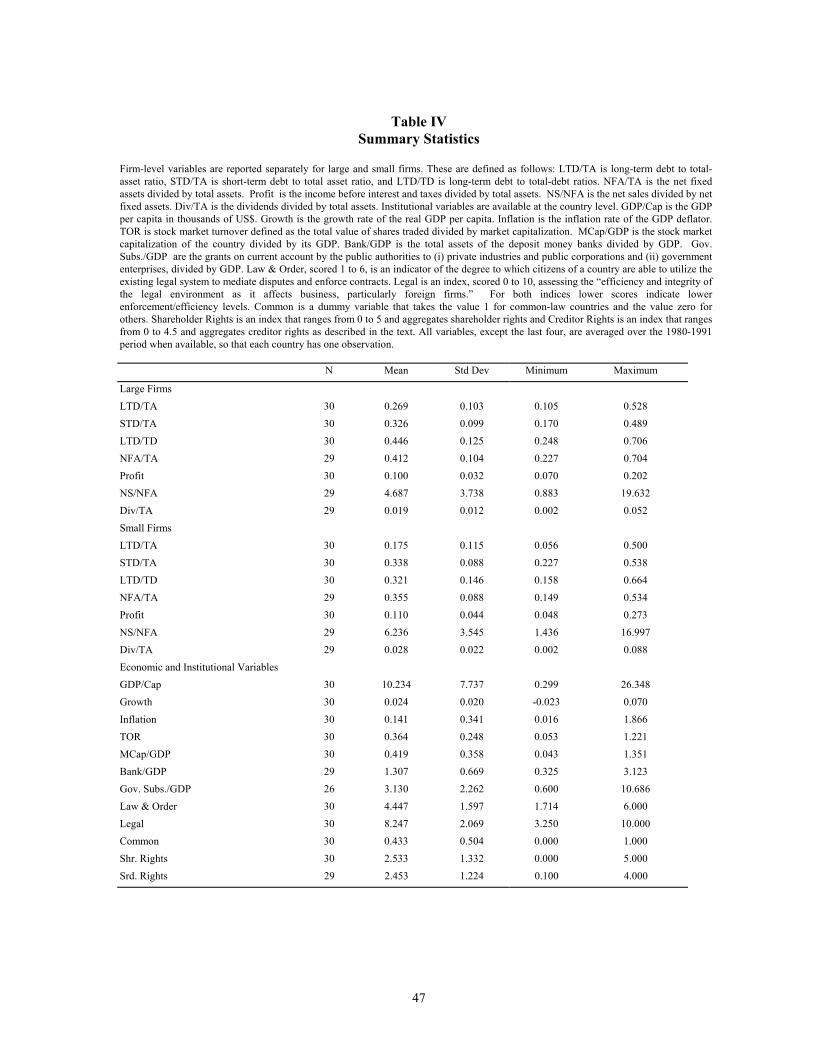
47
Table IV
Summary Statistics Firm-level variables are reported separately for large and small firms. These are defined as follows: LTD/TA is long-term debt to total-asset ratio, STD/TA is short-term debt to total asset ratio, and LTD/TD is long-term debt to total-debt ratios. NFA/TA is the net fixed assets divided by total assets. Profit is the income before interest and taxes divided by total assets. NS/NFA is the net sales divided by net fixed assets. Div/TA is the dividends divided by total assets. Institutional variables are available at the country level. GDP/Cap is the GDP per capita in thousands of US$. Growth is the growth rate of the real GDP per capita. Inflation is the inflation rate of the GDP deflator. TOR is stock market turnover defined as the total value of shares traded divided by market capitalization. MCap/GDP is the stock market capitalization of the country divided by its GDP. Bank/GDP is the total assets of the deposit money banks divided by GDP. Gov. Subs./GDP are the grants on current account by the public authorities to (i) private industries and public corporations and (ii) government enterprises, divided by GDP. Law & Order, scored 1 to 6, is an indicator of the degree to which citizens of a country are able to utilize the existing legal system to mediate disputes and enforce contracts. Legal is an index, scored 0 to 10, assessing the “efficiency and integrity of the legal environment as it affects business, particularly foreign firms.” For both indices lower scores indicate lower enforcement/efficiency levels. Common is a dummy variable that takes the value 1 for common-law countries and the value zero for others. Shareholder Rights is an index that ranges from 0 to 5 and aggregates shareholder rights and Creditor Rights is an index that ranges from 0 to 4.5 and aggregates creditor rights as described in the text. All variables, except the last four, are averaged over the 1980-1991 period when available, so that each country has one observation.
N Mean Std Dev Minimum Maximum
Large Firms LTD/TA 30 0.269 0.103 0.105 0.528 STD/TA 30 0.326 0.099 0.170 0.489 LTD/TD 30 0.446 0.125 0.248 0.706 NFA/TA 29 0.412 0.104 0.227 0.704 Profit 30 0.100 0.032 0.070 0.202 NS/NFA 29 4.687 3.738 0.883 19.632 Div/TA 29 0.019 0.012 0.002 0.052 Small Firms LTD/TA 30 0.175 0.115 0.056 0.500 STD/TA 30 0.338 0.088 0.227 0.538 LTD/TD 30 0.321 0.146 0.158 0.664 NFA/TA 29 0.355 0.088 0.149 0.534 Profit 30 0.110 0.044 0.048 0.273 NS/NFA 29 6.236 3.545 1.436 16.997 Div/TA 29 0.028 0.022 0.002 0.088 Economic and Institutional Variables GDP/Cap 30 10.234 7.737 0.299 26.348 Growth 30 0.024 0.020 -0.023 0.070 Inflation 30 0.141 0.341 0.016 1.866 TOR 30 0.364 0.248 0.053 1.221 MCap/GDP 30 0.419 0.358 0.043 1.351 Bank/GDP 29 1.307 0.669 0.325 3.123 Gov. Subs./GDP 26 3.130 2.262 0.600 10.686 Law & Order 30 4.447 1.597 1.714 6.000 Legal 30 8.247 2.069 3.250 10.000 Common 30 0.433 0.504 0.000 1.000 Shr. Rights 30 2.533 1.332 0.000 5.000 Srd. Rights 29 2.453 1.224 0.100 4.000
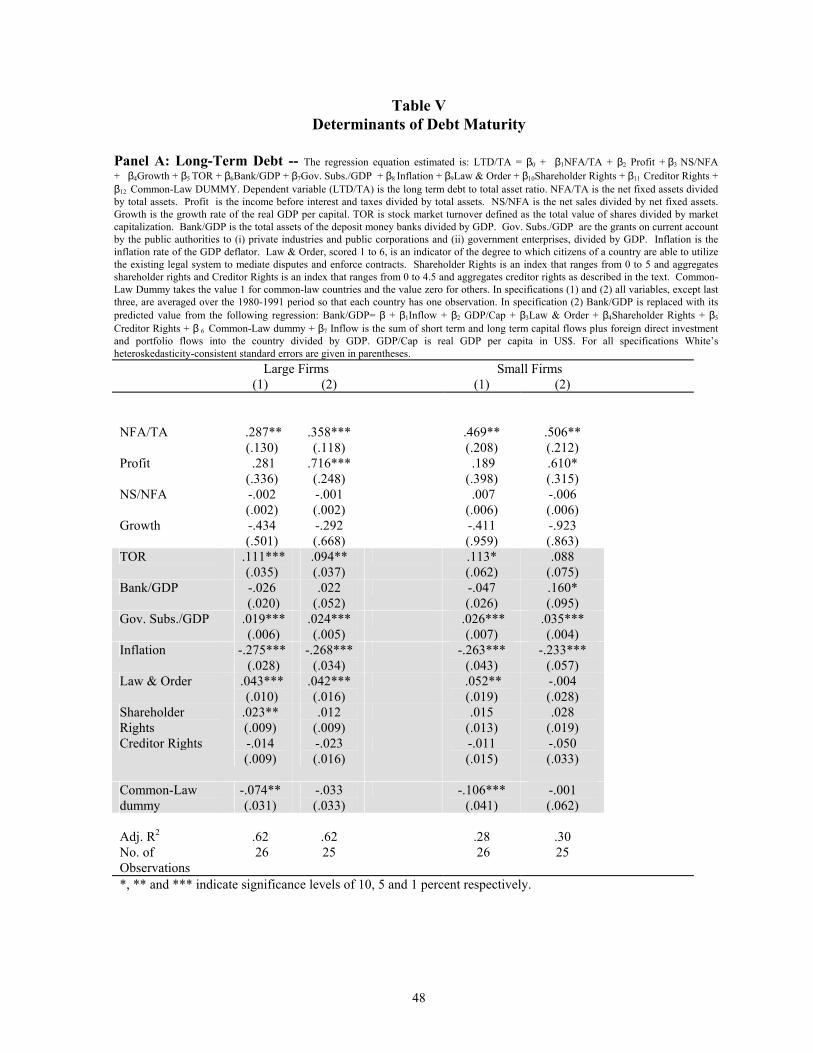
48
Table V Determinants of Debt Maturity
Panel A: Long-Term Debt -- The regression equation estimated is: LTD/TA = β0 + β1NFA/TA + β2 Profit + β3 NS/NFA + β4Growth + β5 TOR + β6Bank/GDP + β7Gov. Subs./GDP + β8 Inflation + β9Law & Order + β10Shareholder Rights + β11 Creditor Rights + β12 Common-Law DUMMY. Dependent variable (LTD/TA) is the long term debt to total asset ratio. NFA/TA is the net fixed assets divided by total assets. Profit is the income before interest and taxes divided by total assets. NS/NFA is the net sales divided by net fixed assets. Growth is the growth rate of the real GDP per capital. TOR is stock market turnover defined as the total value of shares divided by market capitalization. Bank/GDP is the total assets of the deposit money banks divided by GDP. Gov. Subs./GDP are the grants on current account by the public authorities to (i) private industries and public corporations and (ii) government enterprises, divided by GDP. Inflation is the inflation rate of the GDP deflator. Law & Order, scored 1 to 6, is an indicator of the degree to which citizens of a country are able to utilize the existing legal system to mediate disputes and enforce contracts. Shareholder Rights is an index that ranges from 0 to 5 and aggregates shareholder rights and Creditor Rights is an index that ranges from 0 to 4.5 and aggregates creditor rights as described in the text. Common-Law Dummy takes the value 1 for common-law countries and the value zero for others. In specifications (1) and (2) all variables, except last three, are averaged over the 1980-1991 period so that each country has one observation. In specification (2) Bank/GDP is replaced with its predicted value from the following regression: Bank/GDP= β + β1Inflow + β2 GDP/Cap + β3Law & Order + β4Shareholder Rights + β5
Creditor Rights + β 6 Common-Law dummy + β7 Inflow is the sum of short term and long term capital flows plus foreign direct investment and portfolio flows into the country divided by GDP. GDP/Cap is real GDP per capita in US$. For all specifications White’s heteroskedasticity-consistent standard errors are given in parentheses. Large Firms Small Firms (1) (2) (1) (2)
NFA/TA .287** (.130)
.358*** (.118)
.469** (.208)
.506** (.212)
Profit .281 (.336)
.716*** (.248)
.189 (.398)
.610* (.315)
NS/NFA -.002 (.002)
-.001 (.002)
.007 (.006)
-.006 (.006)
Growth -.434 (.501)
-.292 (.668)
-.411 (.959)
-.923 (.863)
TOR .111*** (.035)
.094** (.037)
.113* (.062)
.088 (.075)
Bank/GDP -.026 (.020)
.022 (.052)
-.047 (.026)
.160* (.095)
Gov. Subs./GDP .019*** (.006)
.024*** (.005)
.026*** (.007)
.035*** (.004)
Inflation -.275*** (.028)
-.268*** (.034)
-.263*** (.043)
-.233*** (.057)
Law & Order .043*** (.010)
.042*** (.016)
.052** (.019)
-.004 (.028)
Shareholder Rights
.023** (.009)
.012 (.009)
.015 (.013)
.028 (.019)
Creditor Rights -.014 (.009)
-.023 (.016)
-.011 (.015)
-.050 (.033)
Common-Law dummy
-.074** (.031)
-.033 (.033)
-.106*** (.041)
-.001 (.062)
Adj. R2 .62 .62 .28 .30 No. of Observations
26 25 26 25
*, ** and *** indicate significance levels of 10, 5 and 1 percent respectively.
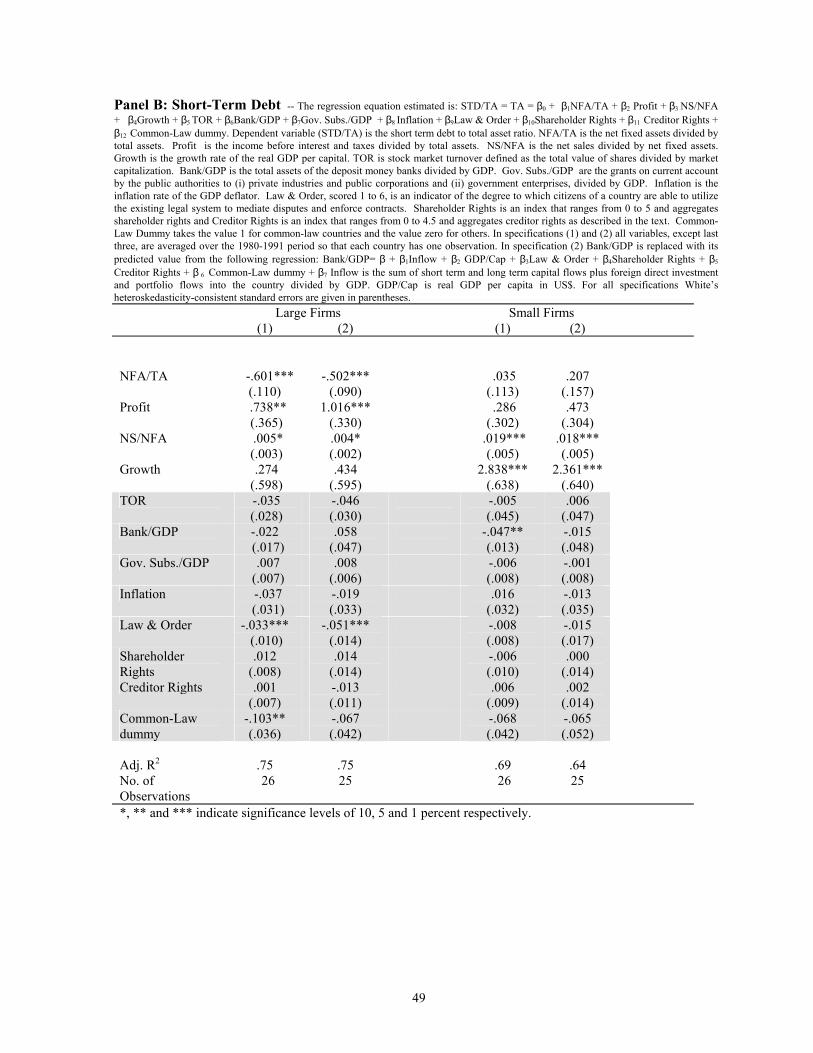
49
Panel B: Short-Term Debt -- The regression equation estimated is: STD/TA = TA = β0 + β1NFA/TA + β2 Profit + β3 NS/NFA + β4Growth + β5 TOR + β6Bank/GDP + β7Gov. Subs./GDP + β8 Inflation + β9Law & Order + β10Shareholder Rights + β11 Creditor Rights + β12 Common-Law dummy. Dependent variable (STD/TA) is the short term debt to total asset ratio. NFA/TA is the net fixed assets divided by total assets. Profit is the income before interest and taxes divided by total assets. NS/NFA is the net sales divided by net fixed assets. Growth is the growth rate of the real GDP per capital. TOR is stock market turnover defined as the total value of shares divided by market capitalization. Bank/GDP is the total assets of the deposit money banks divided by GDP. Gov. Subs./GDP are the grants on current account by the public authorities to (i) private industries and public corporations and (ii) government enterprises, divided by GDP. Inflation is the inflation rate of the GDP deflator. Law & Order, scored 1 to 6, is an indicator of the degree to which citizens of a country are able to utilize the existing legal system to mediate disputes and enforce contracts. Shareholder Rights is an index that ranges from 0 to 5 and aggregates shareholder rights and Creditor Rights is an index that ranges from 0 to 4.5 and aggregates creditor rights as described in the text. Common-Law Dummy takes the value 1 for common-law countries and the value zero for others. In specifications (1) and (2) all variables, except last three, are averaged over the 1980-1991 period so that each country has one observation. In specification (2) Bank/GDP is replaced with its predicted value from the following regression: Bank/GDP= β + β1Inflow + β2 GDP/Cap + β3Law & Order + β4Shareholder Rights + β5
Creditor Rights + β 6 Common-Law dummy + β7 Inflow is the sum of short term and long term capital flows plus foreign direct investment and portfolio flows into the country divided by GDP. GDP/Cap is real GDP per capita in US$. For all specifications White’s heteroskedasticity-consistent standard errors are given in parentheses. Large Firms Small Firms (1) (2) (1) (2)
NFA/TA -.601*** (.110)
-.502*** (.090)
.035 (.113)
.207 (.157)
Profit .738** (.365)
1.016*** (.330)
.286 (.302)
.473 (.304)
NS/NFA .005* (.003)
.004* (.002)
.019*** (.005)
.018*** (.005)
Growth .274 (.598)
.434 (.595)
2.838*** (.638)
2.361*** (.640)
TOR -.035 (.028)
-.046 (.030)
-.005 (.045)
.006 (.047)
Bank/GDP -.022 (.017)
.058 (.047)
-.047** (.013)
-.015 (.048)
Gov. Subs./GDP .007 (.007)
.008 (.006)
-.006 (.008)
-.001 (.008)
Inflation -.037 (.031)
-.019 (.033)
.016 (.032)
-.013 (.035)
Law & Order -.033*** (.010)
-.051*** (.014)
-.008 (.008)
-.015 (.017)
Shareholder Rights
.012 (.008)
.014 (.014)
-.006 (.010)
.000 (.014)
Creditor Rights .001 (.007)
-.013 (.011)
.006 (.009)
.002 (.014)
Common-Law dummy
-.103** (.036)
-.067 (.042)
-.068 (.042)
-.065 (.052)
Adj. R2 .75 .75 .69 .64 No. of Observations
26 25 26 25
*, ** and *** indicate significance levels of 10, 5 and 1 percent respectively.
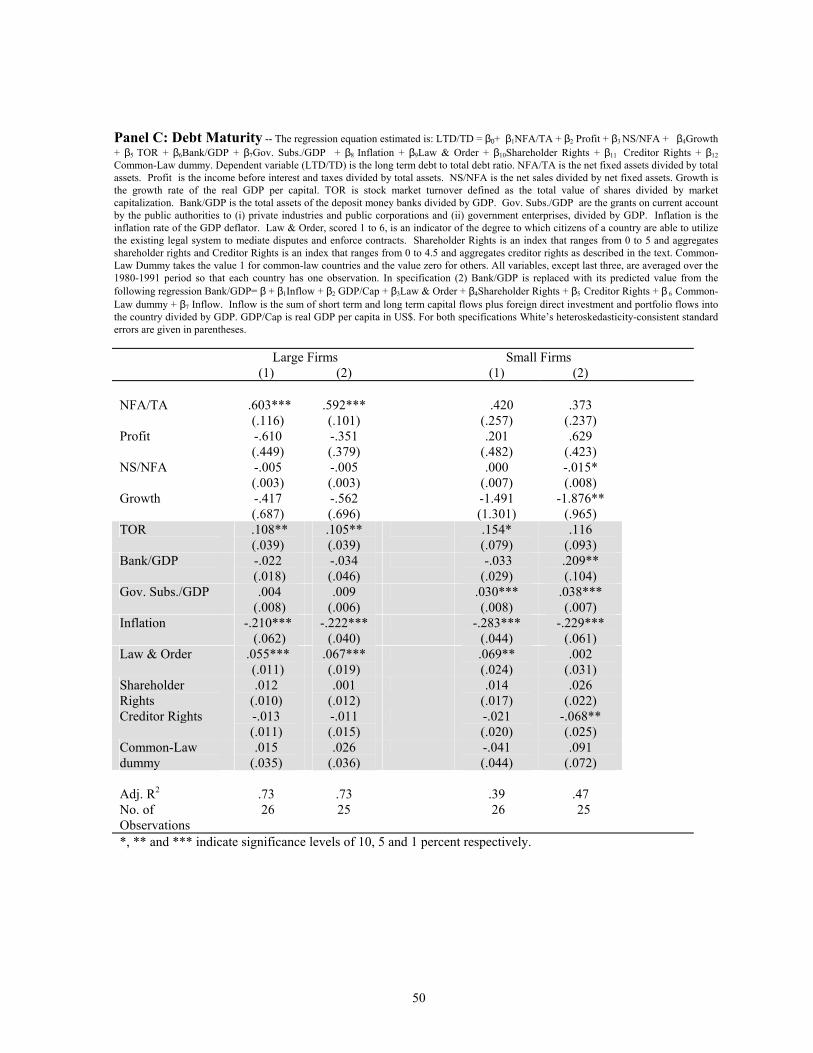
50
Panel C: Debt Maturity -- The regression equation estimated is: LTD/TD = β0+ β1NFA/TA + β2 Profit + β3 NS/NFA + β4Growth + β5 TOR + β6Bank/GDP + β7Gov. Subs./GDP + β8 Inflation + β9Law & Order + β10Shareholder Rights + β11 Creditor Rights + β12
Common-Law dummy. Dependent variable (LTD/TD) is the long term debt to total debt ratio. NFA/TA is the net fixed assets divided by total assets. Profit is the income before interest and taxes divided by total assets. NS/NFA is the net sales divided by net fixed assets. Growth is the growth rate of the real GDP per capital. TOR is stock market turnover defined as the total value of shares divided by market capitalization. Bank/GDP is the total assets of the deposit money banks divided by GDP. Gov. Subs./GDP are the grants on current account by the public authorities to (i) private industries and public corporations and (ii) government enterprises, divided by GDP. Inflation is the inflation rate of the GDP deflator. Law & Order, scored 1 to 6, is an indicator of the degree to which citizens of a country are able to utilize the existing legal system to mediate disputes and enforce contracts. Shareholder Rights is an index that ranges from 0 to 5 and aggregates shareholder rights and Creditor Rights is an index that ranges from 0 to 4.5 and aggregates creditor rights as described in the text. Common-Law Dummy takes the value 1 for common-law countries and the value zero for others. All variables, except last three, are averaged over the 1980-1991 period so that each country has one observation. In specification (2) Bank/GDP is replaced with its predicted value from the following regression Bank/GDP= β + β1Inflow + β2 GDP/Cap + β3Law & Order + β4Shareholder Rights + β5 Creditor Rights + β 6 Common-Law dummy + β7 Inflow. Inflow is the sum of short term and long term capital flows plus foreign direct investment and portfolio flows into the country divided by GDP. GDP/Cap is real GDP per capita in US$. For both specifications White’s heteroskedasticity-consistent standard errors are given in parentheses.
Large Firms Small Firms (1) (2) (1) (2) NFA/TA .603***
(.116) .592*** (.101)
.420 (.257)
.373 (.237)
Profit -.610 (.449)
-.351 (.379)
.201 (.482)
.629 (.423)
NS/NFA -.005 (.003)
-.005 (.003)
.000 (.007)
-.015* (.008)
Growth -.417 (.687)
-.562 (.696)
-1.491 (1.301)
-1.876** (.965)
TOR .108** (.039)
.105** (.039)
.154* (.079)
.116 (.093)
Bank/GDP -.022 (.018)
-.034 (.046)
-.033 (.029)
.209** (.104)
Gov. Subs./GDP .004 (.008)
.009 (.006)
.030*** (.008)
.038*** (.007)
Inflation -.210*** (.062)
-.222*** (.040)
-.283*** (.044)
-.229*** (.061)
Law & Order .055*** (.011)
.067*** (.019)
.069** (.024)
.002 (.031)
Shareholder Rights
.012 (.010)
.001 (.012)
.014 (.017)
.026 (.022)
Creditor Rights -.013 (.011)
-.011 (.015)
-.021 (.020)
-.068** (.025)
Common-Law dummy
.015 (.035)
.026 (.036)
-.041 (.044)
.091 (.072)
Adj. R2 .73 .73 .39 .47 No. of Observations
26 25 26 25
*, ** and *** indicate significance levels of 10, 5 and 1 percent respectively.
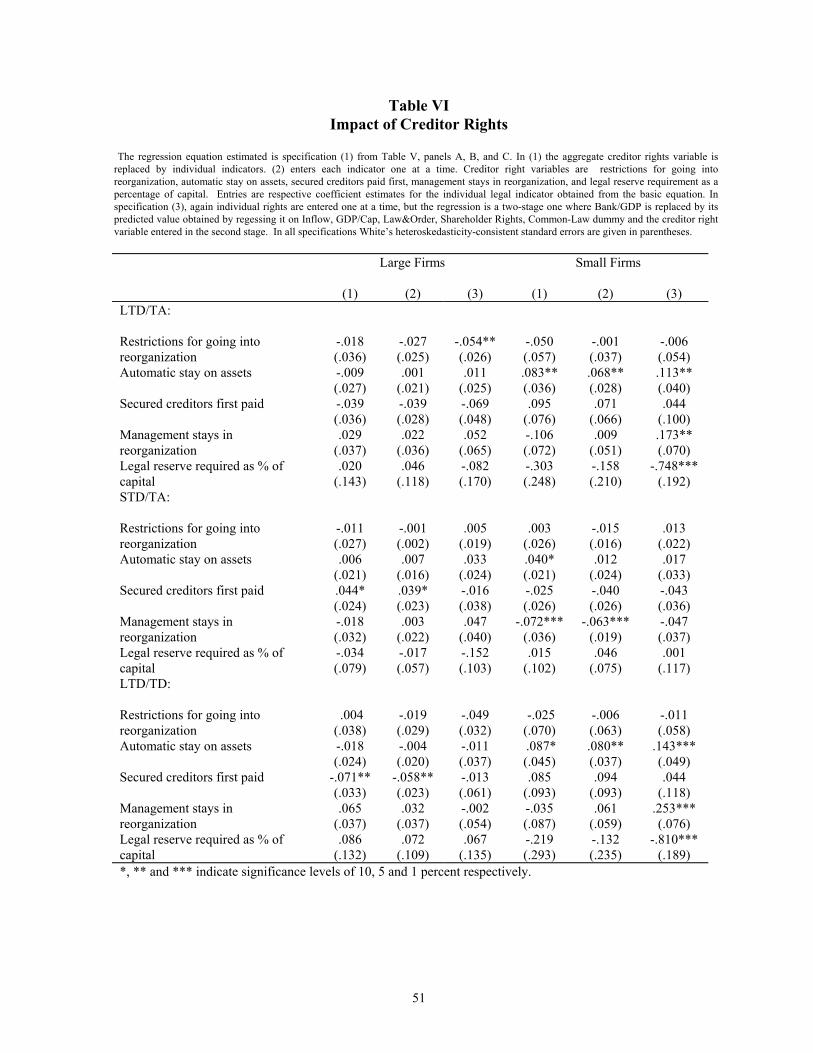
51
Table VI Impact of Creditor Rights
The regression equation estimated is specification (1) from Table V, panels A, B, and C. In (1) the aggregate creditor rights variable is replaced by individual indicators. (2) enters each indicator one at a time. Creditor right variables are restrictions for going into reorganization, automatic stay on assets, secured creditors paid first, management stays in reorganization, and legal reserve requirement as a percentage of capital. Entries are respective coefficient estimates for the individual legal indicator obtained from the basic equation. In specification (3), again individual rights are entered one at a time, but the regression is a two-stage one where Bank/GDP is replaced by its predicted value obtained by regessing it on Inflow, GDP/Cap, Law&Order, Shareholder Rights, Common-Law dummy and the creditor right variable entered in the second stage. In all specifications White’s heteroskedasticity-consistent standard errors are given in parentheses. Large Firms
Small Firms
(1) (2) (3) (1) (2) (3) LTD/TA:
Restrictions for going into reorganization
-.018 (.036)
-.027 (.025)
-.054** (.026)
-.050 (.057)
-.001 (.037)
-.006 (.054)
Automatic stay on assets -.009 (.027)
.001 (.021)
.011 (.025)
.083** (.036)
.068** (.028)
.113** (.040)
Secured creditors first paid -.039 (.036)
-.039 (.028)
-.069 (.048)
.095 (.076)
.071 (.066)
.044 (.100)
Management stays in reorganization
.029 (.037)
.022 (.036)
.052 (.065)
-.106 (.072)
.009 (.051)
.173** (.070)
Legal reserve required as % of capital
.020 (.143)
.046 (.118)
-.082 (.170)
-.303 (.248)
-.158 (.210)
-.748*** (.192)
STD/TA:
Restrictions for going into reorganization
-.011 (.027)
-.001 (.002)
.005 (.019)
.003 (.026)
-.015 (.016)
.013 (.022)
Automatic stay on assets .006 (.021)
.007 (.016)
.033 (.024)
.040* (.021)
.012 (.024)
.017 (.033)
Secured creditors first paid .044* (.024)
.039* (.023)
-.016 (.038)
-.025 (.026)
-.040 (.026)
-.043 (.036)
Management stays in reorganization
-.018 (.032)
.003 (.022)
.047 (.040)
-.072*** (.036)
-.063*** (.019)
-.047 (.037)
Legal reserve required as % of capital
-.034 (.079)
-.017 (.057)
-.152 (.103)
.015 (.102)
.046 (.075)
.001 (.117)
LTD/TD:
Restrictions for going into reorganization
.004 (.038)
-.019 (.029)
-.049 (.032)
-.025 (.070)
-.006 (.063)
-.011 (.058)
Automatic stay on assets -.018 (.024)
-.004 (.020)
-.011 (.037)
.087* (.045)
.080** (.037)
.143*** (.049)
Secured creditors first paid -.071** (.033)
-.058** (.023)
-.013 (.061)
.085 (.093)
.094 (.093)
.044 (.118)
Management stays in reorganization
.065 (.037)
.032 (.037)
-.002 (.054)
-.035 (.087)
.061 (.059)
.253*** (.076)
Legal reserve required as % of capital
.086 (.132)
.072 (.109)
.067 (.135)
-.219 (.293)
-.132 (.235)
-.810*** (.189)
*, ** and *** indicate significance levels of 10, 5 and 1 percent respectively.
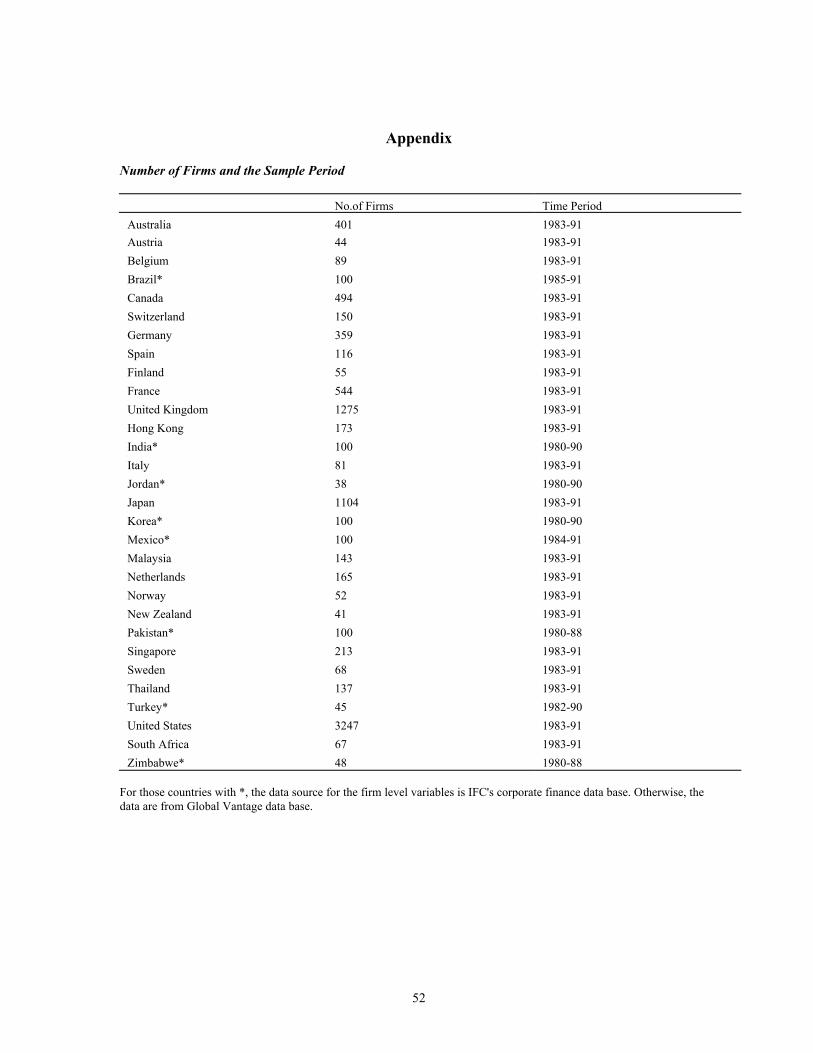
52
Appendix Number of Firms and the Sample Period
No.of Firms Time Period Australia 401 1983-91 Austria 44 1983-91 Belgium 89 1983-91 Brazil* 100 1985-91 Canada 494 1983-91 Switzerland 150 1983-91 Germany 359 1983-91 Spain 116 1983-91 Finland 55 1983-91 France 544 1983-91 United Kingdom 1275 1983-91 Hong Kong 173 1983-91 India* 100 1980-90 Italy 81 1983-91 Jordan* 38 1980-90 Japan 1104 1983-91 Korea* 100 1980-90 Mexico* 100 1984-91 Malaysia 143 1983-91 Netherlands 165 1983-91 Norway 52 1983-91 New Zealand 41 1983-91 Pakistan* 100 1980-88 Singapore 213 1983-91 Sweden 68 1983-91 Thailand 137 1983-91 Turkey* 45 1982-90 United States 3247 1983-91 South Africa 67 1983-91 Zimbabwe* 48 1980-88
For those countries with *, the data source for the firm level variables is IFC's corporate finance data base. Otherwise, the data are from Global Vantage data base.
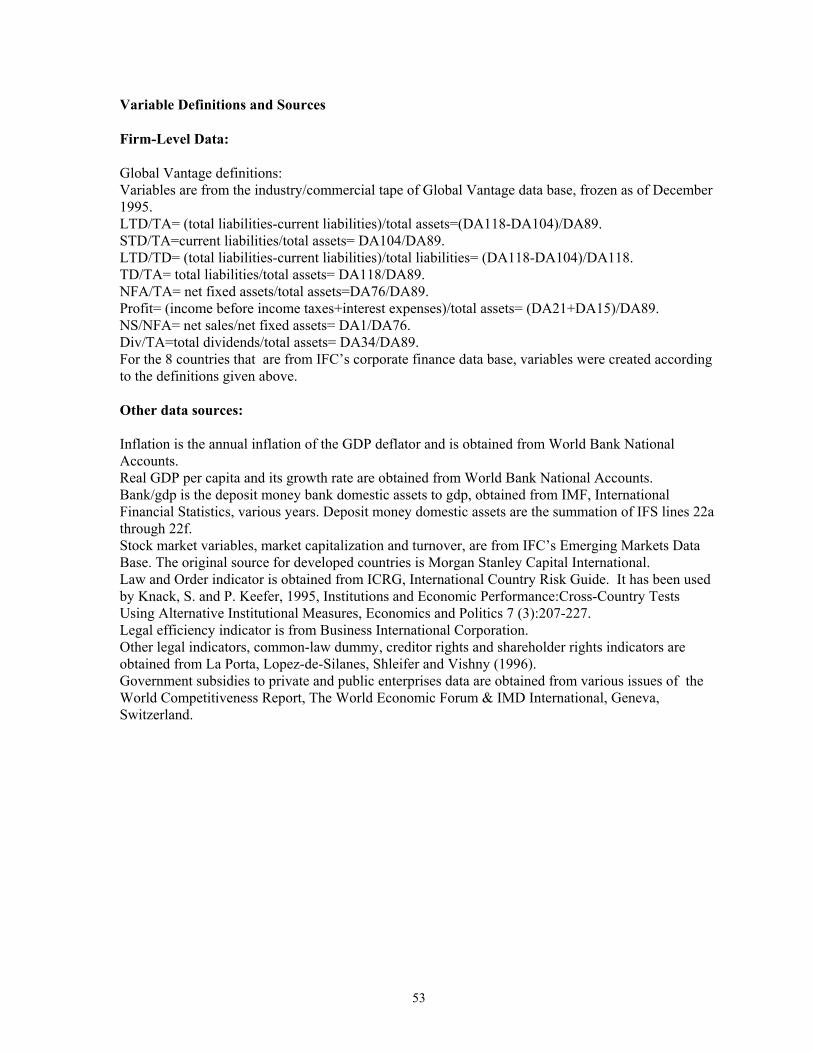
53
Variable Definitions and Sources Firm-Level Data: Global Vantage definitions: Variables are from the industry/commercial tape of Global Vantage data base, frozen as of December 1995. LTD/TA= (total liabilities-current liabilities)/total assets=(DA118-DA104)/DA89. STD/TA=current liabilities/total assets= DA104/DA89. LTD/TD= (total liabilities-current liabilities)/total liabilities= (DA118-DA104)/DA118. TD/TA= total liabilities/total assets= DA118/DA89. NFA/TA= net fixed assets/total assets=DA76/DA89. Profit= (income before income taxes+interest expenses)/total assets= (DA21+DA15)/DA89. NS/NFA= net sales/net fixed assets= DA1/DA76. Div/TA=total dividends/total assets= DA34/DA89. For the 8 countries that are from IFC’s corporate finance data base, variables were created according to the definitions given above. Other data sources: Inflation is the annual inflation of the GDP deflator and is obtained from World Bank National Accounts. Real GDP per capita and its growth rate are obtained from World Bank National Accounts. Bank/gdp is the deposit money bank domestic assets to gdp, obtained from IMF, International Financial Statistics, various years. Deposit money domestic assets are the summation of IFS lines 22a through 22f. Stock market variables, market capitalization and turnover, are from IFC’s Emerging Markets Data Base. The original source for developed countries is Morgan Stanley Capital International. Law and Order indicator is obtained from ICRG, International Country Risk Guide. It has been used by Knack, S. and P. Keefer, 1995, Institutions and Economic Performance:Cross-Country Tests Using Alternative Institutional Measures, Economics and Politics 7 (3):207-227. Legal efficiency indicator is from Business International Corporation. Other legal indicators, common-law dummy, creditor rights and shareholder rights indicators are obtained from La Porta, Lopez-de-Silanes, Shleifer and Vishny (1996). Government subsidies to private and public enterprises data are obtained from various issues of the World Competitiveness Report, The World Economic Forum & IMD International, Geneva, Switzerland.