Embed Size (px)
Citation preview

CE
UeT
DC
olle
ctio
n
[Type text]
Institutions and Economic Prosperity:
The Case of Botswana
By Tebo Ratsiripe-Sekgwa
Submitted to Central European University Department of Political Science in
partial fulfillment of the requirements for the degree of Master of Political
Science
Supervisor: Prof. Attila Folsz
Budapest, Hungary
(2013)

CE
UeT
DC
olle
ctio
n
[Type text]
Abstract
Although many theories exist on how to attain it, economic prosperity remains a
challenge for much of Sub-Saharan Africa. Such theories include that of geography, culture,
trade, factor endowments (human and physical capital), policy and institutions. Through a
detailed historical case study based on primary and secondary literature, this paper studies
how one of the few Sub-Saharan African countries to raise itself out of poverty, Botswana,
was able to attain economic prosperity. The case is studied from an institutional perspective,
but also considers the alternative hypotheses of geography, culture, trade, factor endowments
and policy. Much literature has been written on the country presenting different explanations
for the source of its economic success, in light of the many failures in Sub-Saharan Africa.
Thus, this paper seeks to validate these arguments for Botswana’s economic progress.
Although evidence was not found to support factor endowments, the results of this study
validate institutions, geography, culture, trade, and policy hypotheses. In Botswana, political
and economic institutions worked with elements of geography such as natural resource
endowments; cultural aspects such as cooperation of different ethnic groups; negotiating
favorable commodity prices when trading; and adoption of good policies that broadly benefit
the population. As such, the research concludes that institutions matter for economic
prosperity, but not exclusively.

CE
UeT
DC
olle
ctio
n
i
INTRODUCTION ....................................................................................................................... 1
CHAPTER 1 THEORIES OF ECONOMIC PROSPERITY ....................................................... 5
1.1 STRUCTURAL EXPLANATIONS: GEOGRAPHY, FACTOR ENDOWMENT, AND TRADE .................. 5
1.1.1 GEOGRAPHY ................................................................................................................................... 5
1.1.2 FACTOR ENDOWMENT (HUMAN AND PHYSICAL CAPITAL) ........................................................... 6
1.1.3 TRADE ............................................................................................................................................ 7
1.2 CULTURE EXPLANATION ........................................................................................................ 8
1.3 POLICY EXPLANATION ........................................................................................................... 8
1.4 SHORTCOMINGS OF THE STRUCTURAL, CULTURAL, AND POLICY EXPLANATIONS ....................... 9
1.4.1 PITFALLS OF ARGUMENTS BASED ON GEOGRAPHY ....................................................................... 9
1.4.2 PITFALLS OF ARGUMENTS BASED ON FACTOR ENDOWMENT (HUMAN AND PHYSICAL CAPITAL)
.............................................................................................................................................................. 10
1.4.3 PITFALLS OF ARGUMENTS BASED ON CULTURE .......................................................................... 11
1.4.4 PITFALLS OF ARGUMENTS BASED ON TRADE .............................................................................. 12
1.4.5 PITFALLS OF ARGUMENTS BASED ON POLICIES ........................................................................... 12
1.5 HISTORICAL INSTITUTIONALISM AND QUALITY OF INSTITUTIONS EXPLANATIONS .................... 13
1.5.1 HISTORICAL INSTITUTIONALISM .................................................................................................. 13
1.5.2 QUALITY OF INSTITUTIONS .......................................................................................................... 17
1.5.3 INCENTIVES FOR DEVELOPMENT .................................................................................................. 17
1.6 IMPLICATIONS ...................................................................................................................... 19
BOTSWANA (PRE COLONIAL – 1998)................................................................................. 21
CHAPTER 2 PRE-COLONIAL AND COLONIAL POLITICAL AND ECONOMIC HISTORY22
2.1 THE PRE-COLONIAL STATES AND INCLUSIVE POLITICAL AND ECONOMIC INSTITUTIONS .......... 22
2.1.2 THE ROLE OF CULTURE: COOPERATION ...................................................................................... 24
2.2 BRITISH COLONIALISM.......................................................................................................... 25
2.2.1 LIMITED IMPACT OF COLONIALISM .............................................................................................. 25
2.3 POLITICAL AND ECONOMIC HISTORY UNDER COLONIALISM .................................................... 27
2.3.1 SURVIVAL OF THE CHIEFTAINCY AND SECURE PROPERTY RIGHTS ............................................. 27
2.3.2 TRANSITION TO INDEPENDENCE AND CREATION OF A LEGITIMATE STATE WITH CONSTRAINTS
ON ELITES .............................................................................................................................................. 30
2.3.3 CREATION OF A POLITICALLY CENTRALIZED STATE AND DEMOCRACY ..................................... 31
CHAPTER 3 INDEPENDENCE AND POST COLONIAL POLITICAL ECONOMY .............. 34
3.1 POOR HUMAN AND PHYSICAL CAPITAL BUT RAPID ECONOMIC GROWTH ................................. 34
3.1.2 THE BEEF AND MINERAL SECTORS, AND CONSTRAINTS ON ELITES ................................... 35
3.2 ELEMENTS OF SUCCESS AND FAILURE ................................................................................... 39

CE
UeT
DC
olle
ctio
n
ii
CONCLUSION ......................................................................................................................... 44
REFERENCES ......................................................................................................................... 49
APPENDIX ............................................................................................................................... 53
TABLE 5 BOTSWANA COMPARISONS: POPULATION, GDP PER CAPITA, AND REAL GROWTH OF
GDP PER CAPITA 1966-1999 ...................................................................................................... 53
TABLE 6 BOTSWANA COMPARISONS REAL GROWTH OF GDP PER CAPITA, 1966 TO 1996 .......... 53
TABLE 7 NUMBER OF SEATS BY POLITICAL PARTY, 1965-1999 .................................................. 54
FIGURE 4 SOUTHERN AFRICA IN THE 1970S ............................................................................... 55
FIGURE 5 MAP OF BOTSWANA IN 2013 ....................................................................................... 55
TABLE 8 SUB-SAHARAN AFRICA GDP (PPP) PER CAPITA (USD) (2000-2005) ............................. 56
TABLE 9 SUB-SAHARAN AFRICA GDP (PPP) PER CAPITA (USD) (2006-2012) ............................. 57
TABLE 10 FORMER BRITISH COLONIES IN AFRICA GDP (PPP) PER CAPITA (USD)(2000-2012) . 58
FIGURE 6 GDP COMPOSITION BY SECTOR 2002, 2007 & 2012 .................................................... 59
TABLE 11 GDP COMPOSITION BY SECTOR 1995-2002 ................................................................ 59
TABLE 12 GDP COMPOSITION BY SECTOR 2003-2012 ................................................................ 60

CE
UeT
DC
olle
ctio
n
1
Introduction Although many theories exist on how to attain it, economic prosperity has been a
challenge for much of Sub-Saharan Africa. Such theories include that of geography, culture,
trade, factor endowments and policy (Bloom et al. 1998, Diamond, 1998, Hjort 2010,
Harrison & Huntington 2000, Hayward and Kemmelmeier 2011, Gullup, Sachs & Mekkinger
1999, Glaeser et al. 2004, Greif 1994, Olsson & Hibbs 2005, O’Toole 2007, Ravenhill 2005,
Sachs 2001, Sachs, 2003). More recently, the foremost theory has been that of institutions
(Acemoglu and Robinson 2012, Acemoglu and Robinson 2006b, Acemoglu et al. 2001,
Easterly and Levine 2003, Evans 2004, Hall and Jones, 1999, Rodrik et al. 2004). This paper
will study the case from an institutional perspective, while also considering the alternative
hypotheses of geography, culture, trade, factor endowments and policy. Given that Sub-
Saharan African is one of the poorest locations in the world, this research seeks to examine
these theories through a historical case study; by looking at one of the few countries in the
region to raise itself out of poverty: Botswana.
So why is the case of Botswana exceptional? Botswana is one of the few countries in
the modern age to have sustained rapid economic growth for decades; even outperforming the
East Asian tigers (Leith 2005, Leith 2000). Botswana was also Africa’s poorest country at
independence in 1966, but has transformed itself into one of its wealthiest (Dunning, 2005,
pg. 460). Between 1965 and 1998, Botswana had on average the fastest economic growth rate
in the world. During this period, the GDP per capita of the country grew at an annual rate of
7.7 percent (Acemoglu, Johnson and Robinson 2001 in Rodrik 2003, pg. 80). In this phase of
rapid economic growth between 1965 and 1998, Botswana went from being one of the least
developed countries in the world, to a middle income country, and has maintained this level
of economic prosperity. Botswana has also maintained its status as Africa’s longest
continuous multi-party democracy. It is also rich in minerals and has avoided the resource
CE
UeT
DC
olle
ctio
n
2
curse that plagued other Sub-Saharan African countries such as Nigeria, Democratic Republic
of Congo (DRC) etc. (Pegg 2010).
In addition, the country did not start out with favorable conditions at independence in
1966. At independence, it was the second poorest country in the world and the least
prosperous in Africa, with poor human and physical capital (Dunning, 2005, pg. 460). Its
GDP per capita in 1966, stood at $69 (Hjort, 2010, pg. 693,). By 1998, it had attained a GDP
per capita of $5 796; which was almost four times the African average (Acemoglu, Johnson
and Robinson in Rodrik 2003, pg. 92). In 2012, its GDP per capita had grown to $16 792, and
it had established itself as an upper middle income country (IMF, 2012). At independence, its
economy relied on beef exports which were the main source of income in the early years
(Darkoh and Mbaiwa 2002). The discovery of diamonds and addition of mineral revenue in
the 1970s resulted in economic growth reaching double digits at an annual growth rate of 12
to 13 percent (Hjort, 2010, pg. 693). However, the political and economic elites did not
expropriate the resources. Instead, the rents were invested and transformed into other forms
of wealth (Lange 2004).
Much literature has been written on Botswana presenting different explanations for
the source of the country’s economic success, in light of the many failures in Sub-Saharan
Africa (Acemoglu and Robinson 2001 in Rodrik 2003, Acemoglu and Robinson 2012,
Daniele 2011, Hillbom 2008, Hjort 2010, Lange 2004, Leith 2005, Pegg, 2010, Poteete
2009). This paper contributes to the literature by confirming the validity of some of these
arguments. As such, the main question of this thesis is as follows: why was Botswana, unlike
other Sub-Saharan African countries, able to develop so spectacularly? The first hypothesis
is that it was due to its institutions. Accordingly, the second question is as follows: why was
Botswana, unlike other Sub-Saharan nations, able to develop and consolidate good
institutions? The second hypothesis is that it was due to a fortunate mix of structural factors

CE
UeT
DC
olle
ctio
n
3
and legacies. Additionally, this research will also seek to determine if other Sub-Saharan
African countries can learn from the experience of Botswana. Therefore, the third question is
as follows: are there generalizable lessons that can be drawn from this case?
The paper will be a primary and secondary literature based analysis of Botswana’s
economic progress between 1965 and 1998. Therefore, most of the statistics and data utilized
will cover this time period. The paper will mainly follow Acemoglu and Robinson (2012)
typology of theories of economic prosperity that includes historical institutionalism,
geography, culture, and policy. To complement this typology, theories of trade, quality of
institutions and factor endowment will be added for a more comprehensive assessment of the
case.
The research method of the thesis will be a detailed historical case study that
combines academic and government literature with statistical data. The literature used will
include academic journals, books, and official government documents. The academic journals
and books will assist with getting an overview of general arguments presented by scholars,
for both the sources of economic prosperity, and how Botswana was able to attain it. The
government documents will give insight into government policy and provide official data and
statistics. Additional statistical data will also be collected from other sources such as the
World Bank and IMF for analysis of the country’s economic progress. The case of Botswana
will then be used to demonstrate the applicability of the theories of economic prosperity, in
one of the few Sub-Saharan countries to raise itself out of poverty.
Chapter 1 will first present the theories of economic prosperity divided into structural
explanations and other theories such as culture and policy. Structural explanations include:
geography, factor endowments, and trade. The chapter will then move on to discuss the
shortcomings of these theories followed by a presentation of the historical Institutionalism

CE
UeT
DC
olle
ctio
n
4
and quality of institutions theories and their criticism. This first chapter will then conclude by
discussing the main ideas drawn from the theoretical chapter, to be used in the analysis of the
case. Chapter 2 and 3 will be a presentation and analysis of the case of Botswana. Chapter 2
will focus on the pre-colonial, colonial, and transition to independence years to give us an
understanding of how political and economic institutions survived colonialism, and supported
elements of trade and culture. The chapter ends with the events leading up to the country’s
independence to give insight into how these political and economic institutions were
integrated into the post-colonial democratic system. Chapter 3 discusses how well established
political and economic institutions were able to support elements of geography, culture, trade
and policy hypotheses to turn Sub-Saharan Africa’s poorest country, into one of its richest.
The thesis then concludes by summarizing and presenting the major findings from the
analysis of the case study.
The results of the thesis confirm that the economic success of the country between
1965 and 1998, when it raised itself out of poverty, was due to a combination of elements of
the theories of economic prosperity; supported by inclusive political and economic
institutions of democracy and secure property rights. These political and economic
institutions worked with elements of geography such as natural resource abundance; cultural
aspects such as cooperation of different ethnic groups; negotiating favorable commodity
prices when trading; and adoption of good policies that broadly benefit the population. As
such, supported by institutions of democracy and secure property rights, elements of
geography, culture, trade, and policy hypotheses all worked together, to turn Africa’s poorest
country, into one of its wealthiest. Therefore, the case of Botswana demonstrates that even
the poorest Sub-Saharan countries, can transform themselves into economically prosperous
nations; although other countries cannot be expected to easily replicate its economic
achievements, given that Botswana had unique institutional conditions at independence.
CE
UeT
DC
olle
ctio
n
5
CHAPTER 1 Theories of Economic Prosperity Scholars have put forth various explanations for sources of economic prosperity. This
chapter will consider some of these arguments, while mainly following the typology of
Acemoglu and Robinson (2012), which includes structural, culture, policy and institutional
hypotheses. Structural explanations of determinants of economic prosperity consist of that of
geography, factor endowment (such as human and physical capital), and trade; other
alternative explanations include that of culture, policies as well as institutions.
1.1 Structural Explanations: Geography, Factor Endowment, and Trade
1.1.1 Geography
The general idea behind the geography viewpoint of underdevelopment can be
summarized in the words of Montesquieu who stated:
You will find in the Northern climates peoples who have few vices, enough virtues, and much
sincerity and frankness. As you move towards the countries of the south, you will believe you
have moved from morality itself: the liveliest passions will increase crime… [t]he heat of the
climate can be so excessive that the body there will be absolutely without strength. So,
prostration will pass even to the spirit: no curiosity, no noble enterprise, no generous
sentiment; inclinations will all be passive there; laziness there will be happiness…
(Montesquieu (1748) 1989, pg. 234)
This old version of the geography perspective Easterly and Levine (2003) state was used by
some to explain why countries of the south have failed to attain economic prosperity.
Therefore, hot weather in the south was said to make the inhabitants lazy and unmotivated to
work. Acemoglu and Robinson (2012) state that the modern supporters of the geography
viewpoint argue that tropical location, landlocked location, and commodity dependence
negatively affect a country’s potential for economic success (Gullup, Sachs & Mekkinger,
1999, Sachs 2001, Sachs, 2003). Thus, Africa’s tropical location is said to be hindering its
economic progress (Bloom et al. 1998). In addition, another version of this viewpoint
maintains that some regions have superior grain species and had people who developed a
resistance to animal based germs, were able to attain a head start in technological innovation

CE
UeT
DC
olle
ctio
n
6
(Diamond, 1998). Thus, this modern version of the geographic perspective adds that tropical
diseases, such as malaria, affect people’s productivity; while tropical soils are not suitable for
agriculture. As such, Acemoglu and Robinson maintain that global inequality as suggested by
ecologist and evolutionary biologist Jared Diamond is said to be caused by differences in
plants and animal species, which affected agricultural productivity. While areas such as the
Fertile Crescent in the Middle East had animals available for domestication, others such as
the Americas had none before the Europeans arrived, and African cattle were infested with
germs carried by tsetse flies, which affected their distribution. This resulted in societies
transitioning from hunting and gathering to farming first in areas where animals could easily
be domesticated, such as the Fertile Crescent. Transitioning to farming led to increase in
population, specialization of labor, trade, urbanization, and political progress. In societies that
switched to farming, technological innovation followed. Thus, differences in availability of
animals for domestication and plant species affected productivity in farming; which resulted
in dissimilar progress in technological change and wealth (Olsson et al. 2005).
1.1.2 Factor Endowment (Human and Physical Capital)
Other structural arguments include that of human and physical capital accumulation.
The explanation put forth for human and physical capital has been presented by scholars such
as Glaeser et al. (2004). They consider what they state are the two main arguments for
economic development: institutions and human and physical capital, and support the latter.
Their argument is that human and physical capitals improve institutions. This view holds that
nations differ in their supply of human and physical capital, but these can be acquired through
good policies adopted by even dictators; which would eventually result in improved
institutions and economic development. Glaeser et al. maintain that this perspective explains
the experiences of South Korea, Taiwan, and the People’s Republic of China (PRC) that grew

CE
UeT
DC
olle
ctio
n
7
rapidly under dictatorships; before Taiwan and South Korea eventually turned into
democracies.
1.1.3 Trade
Trade has also been presented as a reason why countries are unable to attain economic
prosperity (O’Toole 2007, Ravenhill 2005). O’ Toole (2007) maintains that one of the most
influential structuralists was economist Raul Presbisch, who highlighted the unfair exchange
in international trade in causing underdevopment. This view maintained that the world was
divided into a center and periphery. The center was the industrialized nations while the
periphery was made up of countries that produced agricultural goods and raw materials. This
division was a result of colonial history (Ravenhill 2005). Prebisch argued that industrial
products produced by the center countries had a higher value than the raw material and
agricultural goods from the periphery. This meant that periphery countries were at a
disadvantage when trading with the center, as the prices of imports from the industrial nations
often rose or stayed the same; while the prices for the goods produced by the periphery
declined. Therefore, periphery countries needed to export more to get the same amount of
imports from the center in the long run. As such, free trade was said to be not beneficial to
countries exporting raw materials and agricultural goods. Consequently, Prebisch maintained
that the current structure of the economy would result in a surplus of labor as sectors such as
agriculture, would lose people because of the need to control production costs; due to the
unfair trade. This is said to result in low incomes given that the workers in the periphery
countries would not be easily absorbed by other sectors; thus, this unbalanced exchange in
international trade would lead to underdevelopment. As a result, the gap between the rich and
poor countries would get bigger, and the periphery would not be able to catch up, because of
deteriorating terms of trade. Consequently, Presbisch advocated that countries needed to
change the structure of their economies by creating their own industries, and relying less on

CE
UeT
DC
olle
ctio
n
8
primary goods; thus, import substitution industrialization and regional trade were encouraged.
The state was also to play a major role in this economic transformation (Ravenhill 2005).
O’ Toole maintains that from the structuralist approach developed dependency
theories, that accepted the center and periphery idea, but blamed underdevelopment on
external factors. While structuralits argued that the problem of unfair trade could be solved
through internal structural changes, dependency theorists maintained that underdevelopment
was caused by external factors, such as policies of industrialized nations. As such, the center
countries wanted to maintain a cheap supply of primary goods and labor from the periphery
for their industrial products; to keep themselves prosperous at the expense of the periphery.
Thus, these theories maintained that the rich center countries benefited from keeping the poor
periphery countries underdeveloped. Periphery countries could not stop this given that this
would result in economic sanctions or military intervention; as such, these theories maintain
that revolutionary ways might be necessary to keep the rich nations from underdeveloping the
poor.
1.2 Culture Explanation
Another common argument for what influences economic prosperity is that of culture.
This culture theory can be traced back to German sociologist Max Weber. Acemoglu and
Robinson (2012) and Hayward and Kemmelmeier (2011) state that Weber maintained that the
Protestant Reformation and work ethic was key to the success of modern industrial societies
of Western Europe. However, its modern version does not focus on religion alone, but also
includes other factors such as beliefs, values, and ethics (Greif 1994, Harrison & Huntington
2000, Hayward and Kemmelmeier 2011).
1.3 Policy Explanation
Another common alternative hypothesis is that of policies, that maintains that people
or their leaders do not know how to make poor countries rich. Acemoglu and Robinson

CE
UeT
DC
olle
ctio
n
9
(2012) maintain that this view is held by most economists, and holds that the science of
economics needs to focus on the utilization of scarce means to attain the right social ends.
The policy hypothesis holds that when market failures are not properly dealt with, the country
will become poorer. As such, world inequality is said to result from the fact that poor nations
have many market failures, and economists as well as policy makers follow the wrong advice,
or do not know how to fix the failures. Easterly and Levine (2003) add that the creation of
international financial institutions is often meant to address these issues. They state, “[t]his
perspective is clearly imbedded in the policy recommendations adopted by major multilateral
institutions. Indeed, a motivating factor for creating international financial institutions is to
facilitate the adoption of sound national policies that foster economic development (Easterly
and Levine, 2003, pg. 11).” As such, poor countries are said to have not economically
developed, because of bad economic policies. Rich countries are thus better off because they
have adopted better policies, and are able to effectively address market failures.
1.4 Shortcomings of the Structural, Cultural, and Policy Explanations
1.4.1 Pitfalls of Arguments Based on Geography
As maintained by Acemoglu and Robinson (2012), the geography theory has some
flaws. One of the main arguments presented by this hypothesis is that temperate climates are
better for economic development than tropic or semitropical ones, and this continues to have
advocates such as economist Jeffrey Sachs; however, they maintain that this is contradicted
by the rapid economic advance of countries such as Botswana, which has a hot climate. They
also maintain that the argument for tropical diseases affecting economic prosperity is also not
supported by historical facts. They give the example of 19th
Century England which had an
unhealthy population; however, once the government invested in proper treatment of the
water supply and a good health system, health and life expectancy increased. As such,
people’s health was not the reason for England’s economic progress, but the results of its

CE
UeT
DC
olle
ctio
n
10
previous political and economic changes. Therefore, “[d]isease is largely a consequence of
poverty and of governments being unable or unwilling to undertake the public health
measures necessary to eradicate them” (Acemoglu and Robinson, (2012) pg. 51) Another part
of the geography argument is that tropical regions cannot have productive agriculture.
Although they concede that there is some merit in the argument, soil quality is said to not be
the main reason for agricultural productivity. Instead, it is the incentives the government
provides, and the ownership structure of the land. Also, they state that the level of agricultural
productivity can no longer be used as a measure of poverty in the modern world; given that
the inequality in the contemporary world resulted from differences in industrial technologies
and manufacturing, not agricultural performance.
In addition, Acemoglu and Robinson maintain Diamond’s version of the geography
argument also fails to explain world inequality. For instance, Diamond states that the Spanish
were able to conquer the Americas because they had been farming longer; which resulted in
them attaining superior technologies. This idea they state implies that once the civilizations of
the Americas had been exposed to all the species and technologies brought by the Spanish,
they would have rapidly gotten as rich as their conquerors. Yet, the conquered civilizations
became poorer rather than richer. As such, they maintain that modern inequality cannot be
explained in these terms. Rather, modern inequality comes from the uneven distribution of
industrial technologies, not agricultural productivity.
1.4.2 Pitfalls of Arguments Based on Factor Endowment (Human and Physical Capital)
According to Acemoglu and Robinson (2012), the argument for human and physical
capital also has its merits as well as faults. They assert that institutions determine whether or
not the society will have better technology and education, which are necessary for economic
prosperity. As such, educating the people works best when first provided with the inclusive
institutions that will get the best out of the people.

CE
UeT
DC
olle
ctio
n
11
1.4.3 Pitfalls of Arguments Based on Culture
As also mentioned by Acemoglu and Robinson (2012), the culture theory has some
merits in terms of explaining modern inequality; although it is also faulty. They state that
social norms which are part of culture are important, because they are difficult to change and
are sometimes useful for understanding institutional differences. However, advocates of this
theory are said to over emphasize religion, national ethics, and values which are not
important for comprehending modern world inequality. Acemoglu and Robinson maintain
that supporters of this theory believe that Africans are poor because of a poor work ethic,
prevalent primitive ideas such as magic, and they refuse to adopt Western technology.
They state that factors such as how much people in a society trust each other and
cooperate are significant; however, they are a result of institutions rather than an independent
cause. Max Weber’s argument for the protestant work ethic spearheading economic
prosperity is also said to have some defects. Although protestant countries such as England
and Netherlands were the first to experience modern economic success, they state that it does
not necessarily mean religion was the key factor. They give the example of France, which is a
predominately catholic country that quickly caught up, and modern East Asian success stories
that demonstrate that religion has little to do with economic advance. However, they state that
one may also turn to the Middle East which has very poor non oil producing Muslim
countries to support Weber’s hypothesis. Supporters of Weber’s theory could highlight that
even the oil producing Muslim Middle Eastern countries have failed to diversify their
economies; thus, they could conclude that religion is a factor in economic development.
However, if one accepted this conclusion, they argue that they would be ignoring other more
important factors that determine economic prosperity; such as the history of these nations.
According to Acemoglu and Robinson, how these countries developed was heavily
influenced by their colonial history. These countries were part of the Ottoman Empire before
they were eventually taken over by English and French colonizers; who left them with

CE
UeT
DC
olle
ctio
n
12
hierarchical, authoritarian political systems, and few economic institutions that can support
economic development. Therefore, how these countries are today is largely influenced by
historical institutions.
1.4.4 Pitfalls of Arguments Based on Trade
O’ Toole (2007) maintains that structuralist ideas have been criticized by economists
in industrialized countries who argued that international trade would equalize incomes of
countries in the long term. However, he states that some economists have found the opposite
to be true; confirming the structuralist arguments. The structuralist argument that the terms of
trade for developing countries will decline overtime is also said to be not as straight forward
for all countries. In addition, he mentions that dependency theories have also been criticized
as evidence does not always shows that the stronger the ties between the rich and the poor
country, the more underdeveloped the periphery nation will get. Opponents of dependency
theories he states suggest that without access to markets and foreign capital that can come
from the wealthy countries, poor countries would lack the investment and foreign exchange
needed to grow.
1.4.5 Pitfalls of Arguments Based on Policies
While Acemoglu and Robinson (2012) concede that there are cases were leaders
adopted disastrous economic policies, they state that this cannot explain world inequality.
Rather than the poor policies adopted by leaders, the difference is said to be caused by
institutional constraints the leaders and elites have to deal with. They give the example of
Africa, were leaders have continued to enrich themselves at the expense of their people
supported by institutions of insecure property rights and authoritanism. They assert that they
do this because the institutional set up allows them to get away with it, or because they can
keep themselves in power by buying the support of followers. Thus, the policy hypothesis is
said to have defects as it fails to explain the origins of prosperity in the world, and cannot tell

CE
UeT
DC
olle
ctio
n
13
us why other countries have institutions and policies that do not favor the majority of the
population. In order to understand world inequality, they maintain that we must first
comprehend the role played by history and politics in shaping modern societies.
1.5 Historical Institutionalism and Quality of Institutions Explanations
1.5.1 Historical Institutionalism
If we are to study economic prosperity, therefore, we must understand the historical
political and economic developments that can explain modern inequality. One such
hypothesis considers the role of historical political and economic institutions in determining
economic prosperity (Acemoglu and Robinson 2012). These institutions are divided into
extractive and inclusive ones.
According to Acemoglu and Robinson, extractive economic institutions lack law and
order, have insecure property rights, entry barriers for new business, and have regulations that
prevent properly functioning markets or even playing field. Extractive political institutions
are said to concentrate power in the hands of few elites and lack constraints or checks and
balances. As such, these countries tend be authoritarian regimes. According to the
Democracy Index (2011) provided by the Economist Intelligence Unit, authoritarian regimes
tend to be complete dictatorships and sometimes with some institutions of democracy in
existence, but not effective. If there are any elections, they are frequently not free and fair,
and civil liberties are infringed upon. The media is usually state owned or under people loyal
to the government in power. Criticism of the regime is repressed with censorship prevalent,
and an independent judiciary is nonexistent.
Acemoglu and Robinson state that extractive political and economic institutions often
come together; given that the unconstrained elites are able to use their political power to
economically dominate the rest of the society. As such, extractive economic institutions often
depend on extractive political institutions for their survival. On the other hand, inclusive

CE
UeT
DC
olle
ctio
n
14
political institutions they state allow for rule of law, are pluralistic, have a certain level of
political centralization to enforce the rule of law, and have sufficient checks and balances.
Therefore, nations with inclusive political institution tend to be democracies. However, one
needs to note that there are different types of democracies. Using the Democracy Index’s
definition, full democracies have political freedoms and civil liberties supported by a political
culture that encourages democracy. The government functions well and the media is
independent and diverse. The judiciary is also independent and its rulings are enforced.
Flawed democracies have free and fair elections; although there can be other issues such as
violation of media freedom. Basic civil liberties are also respected, but there are problems
with an underdeveloped political culture, governance, and low political participation.
However, Acemoglu and Robinson maintain that for inclusive political institutions to be
effective there must also be sufficient state or political centralization. Therefore, instead of a
dictatorship to attain economic prosperity, what is necessary is political or state
centralization. The state needs to be able to play its role as the enforcer of law and order,
provider of public services, and encourager as well as regulator of economic activity. If the
state cannot attain sufficient political centralization, the society is said to become unstable
and economic development stagnates.
Inclusive economic institutions they state have secure property rights, sufficient law
and order, regulations that support the market, relatively free of barriers for new businesses,
enforce contracts, and provide sufficient access to education and other opportunities for the
citizens. However, the most important of these factors is secure property rights. As stated by
Adam Smith:
Commerce and manufacturers can seldom flourish long in any state which does not enjoy a
regular administration of justice; in which the people do not feel themselves secure in the
possession of their property; in which the faith of contracts is not supported by law; and in
which the authority of the state is not supposed to be regularly employed in enforcing the
payment of debts from all those who are able to pay. Commerce and manufactures, in short,

CE
UeT
DC
olle
ctio
n
15
can seldom flourish in any state in which there is not a certain degree of confidence in the
justice of government…In a rude state of society… [t]he individuals who hoard whatever
money they can save, and who conceal their hoard, do so from a distrust of the justice of
government, from fear that if it was known that they had a hoard…they would quickly be
plundered (1863, pg. 413).
Thus, secure property rights are important for economic prosperity because they make people
more willing to invest and be productive. Acemoglu and Robinson assert that if people
believe that they will benefit from their hard work, they will have incentive to invest and
innovate. On the other hand, when property rights are not secure, it is said that people will
have less motivation to work and invest; given that there will be reason to believe that their
output could be taken away, completely taxed away or expropriated. As such, secure property
rights are said to be central to economic prosperity. However, secure property rights can
come in different forms. As stated by Rodrik et al. (2004), “…when investors believe their
property rights are protected, the economy ends up richer. But nothing is implied about the
actual form property rights should take. We cannot necessary deduce that enacting a private
property regime would produce superior results compared to alternative forms of property
rights (pg. 157).” Therefore, institutions of secure property rights differ depending on the
location.
In addition, the political and economic history of countries is important in order to
comprehend their failure or success in attaining economic prosperity. Acemoglu et al. (2001)
highlight the significance of historical institutions in bringing about economic success by
examining countries that were European colonies. They argue that differences in colonial
experiences, could explain the varying degrees of institutional success at bringing about
economic development. Acemoglu et al. state, “Europeans adopted very different
colonization strategies, with different associated institutions. In one extreme, as in the case of
the U.S., Australia and New Zealand, they went and settled in the colonies and set-up
institutions that enforced the rule of law and encouraged investment. In the other extreme, as
in the Congo or the Gold Coast, they set up extractive states with the intention of transferring

CE
UeT
DC
olle
ctio
n
16
resources rapidly to the metropole. These institutions were detrimental to investment and
economic progress” (Acemoglu et al., 2001, pg. 1395). As such, the institutions the countries
were left with after colonization affected their potential to develop economically. They add
that the types of institutions installed were based on the ability to settle in the location. For
those countries that Europeans could not settle due to high mortality rates, the areas were
turned into extractive states. The type of institutions installed during colonialism affected
potential incomes of these countries. However, this is not to say that institutions are already
predetermined by colonial history, and cannot be changed or improved; as Acemoglu and
Robinson (2012) add that extractive political and economic institutions can be transformed
into inclusive ones.
The fact that there are more authoritarian than democratic regimes in Africa also
shows that extractive institutions from colonialism are still persistent (Democracy Index
2011). This is due to the fact that elites who are replaced under extractive institutions are
often replaced by people who then continue to take advantage of the society as well; because
of the few constraints on their power that they inherit through the extractive institutions
(Acemoglu and Robinson 2006b). As such, the new elites are said to have no motivation to
change the extractive political and economic institutions. Thus, they maintain that the main
barrier to attaining inclusive institutions is due to resistance from political and economic
elites; who stand to lose by changing from extractive to inclusive institutions. Economic
elites are said to fear losing their monopolies or sources of income; while political elites do
not want to lose their privileged political status and monopoly on power. While both play a
major role in blocking economic progress, Acemoglu and Robinson maintain that political
elites are the most effective at suppressing the emergence of inclusive institutions.

CE
UeT
DC
olle
ctio
n
17
1.5.2 Quality of Institutions
Another argument presented for institutions is that their quality matters for economic
prosperity. Rodrik et al. (2004) maintain that the quality of institutions is essential; however,
other factors such as geography and trade have an indirect effect on the quality of the
institutions. In addition, they argue that “…there is growing evidence that desirable
institutional arrangements have a large element of context specificity, arising in differences
from historical trajectories, geography, political economy, or other initial conditions (pg.
157).” As such, institutions need not be transplanted from one country to another. Institutions
that work best in another country may not necessary work well in others (Evans 2004). Thus,
Evans (2004) also promotes a deliberative approach to development that emphasizes public
discussion and exchange of ideas, when setting goals and allocating public goods.
However, even the institutional explanations for economic prosperity have their
weaknesses. Some have highlighted that good institutions could be endogenous; meaning
they could be as much a result of economic prosperity as much as they are the cause
(Przeworski, 2004). Although Glaeser et al. (2004) concede that institutions matter, they also
argue that measures of institutions have conceptual flaws, and that researchers should focus
more on specific issues that can be utilized by policy makers. Easterly and Levine (2003) also
recognize the importance of making institutional quality indicators more useful for officials
who can make laws and regulations. They maintain this can be done by presenting more
detailed historical case studies.
1.5.3 Incentives for Development
In addition, Acemoglu and Robinson 2006 and Knutsen 2011 maintain that political
elites that often bring countries out of poverty are often pressured into doing so by elements
beyond their control, such as an external security threat. The type of security threats the elites
face often determines whether or not they will pursue the necessary institutional development
that leads to economic prosperity. Political elites faced with a severe external security threat

CE
UeT
DC
olle
ctio
n
18
such as a foreign army, are more likely to foster good for growth policies; while those faced
with an internal security threat, promote bad economic policies to survive. Knutsen and
Acemoglu and Robinson concur that external security threats make political elites pursue
good for growth institutional changes and policies. Acemoglu and Robinson maintain that
“…external threats may be an important determinant of whether elites want to block technical
and institutional change... [w]ith a more powerful external threat or a more developed
perpetrator, the ruler will be ‘forced’ to allow innovation so as to reduce the likelihood of an
invasion” (2006, p. 124-125). As such, when the threat comes from outside, the political
elites will most likely adopt good economic policies and the necessary institutions in order to
maintain their grip on power. Knutsen also supports this point of view, as he provides an
explanation for the success of the Asian authoritarian regimes by stating, “A strong and
modern military apparatus requires a relatively developed economy and effective state
institutions, and the external threats therefore provided incentives for these regimes to
develop their economies and state-institutional apparatuses” (2011, p. 417). As such, external
security threats reduce incentives to block economic prosperity.
However, in the absence of an external security threat, the political elites have little
motivation to grow the economy; in fact, when faced with an internal security threat, they are
more likely to promote bad economic policies, and deny institutional improvement.
Acemoglu and Robinson argue that political elites will “…block beneficial economic and
institutional change when they are afraid that these changes will destabilize the existing
system and make it more likely that they will lose political power and future rents (2006,
p.115)”. Thus, the inclusive institutions necessary for economic development will often be
blocked to prevent the rulers from being political and economic losers. Similarly, Knutsen
mentions internal security threats as an incentive for blocking institutional improvement. He
states that this sought of behavior can be explained through a statement once made by the
CE
UeT
DC
olle
ctio
n
19
Zaire (modern day DRC) dictator Mobutu Sese Seko to Rwandan President Habyarimana;
whose regime was under attack from RPF rebels. Mobutu Sese Seko stated “I’ve been in
power in Zaire for thirty years, and I never built one road. Now they are driving down your
roads to get you” (Knutsen 2011, p. 418). As such, the Zaire dictator was well aware of the
fact that promoting policies good for growth such as improving his country’s infrastructure,
would not extend the longevity of his regime; as it would give an advantage to rebel groups
that wanted to topple him. Therefore, this anti development behavior is worsened by the fact
that most African dictatorships face internal security threats to their hold on political and
economic power. As stated by Knutsen, “African dictators have not had to fear external
invasion as much as internal groups seeking to grab power. The main threats to most of
Africa’s strongmen have arguably come from within the juridical borders of their own states,
often from leaders of rival ethnic groups. On a conflict-torn continent, only a handful of wars
have been traditional interstate wars…” (2011, pg. 429). Thus, the resistance to adopt
inclusive institutions is said to be perpetuated by internal security threats to the political and
economic power of the elites.
However, external and internal threats alone are not the only reasons for promoting or
blocking economic prosperity. Acemoglu and Robinson (2006) maintain that high
competition in a democracy can also be an incentive for political elites to encourage
economic development in order to not lose elections. Elites are also unlikely to block
development when they feel secure in power. On the other hand, if there is little competition
and their power is threatened, elites will tend to block economic development.
1.6 Implications
Although institutions are crucial, this alone is not sufficient to bring about economic
prosperity. Rather, it is a combination of elements of these different alternative explanations;
supported by inclusive political and economic institutions such as the elite power

CE
UeT
DC
olle
ctio
n
20
constraining democracy; as well as established secure property rights. These inclusive
institutions support elements of geography such as natural resource endowments; cultural
aspects such as cooperation of different ethnic groups; ability to negotiate favorable export
prices when trading; and adoption of good policies that broadly benefit the population. As
such, institutions matter for economic prosperity, but not exclusively.

CE
UeT
DC
olle
ctio
n
21
Botswana (Pre Colonial – 1998) Sub-Saharan Africa is one of the poorest locations in the world; yet, it has been host
to one of the few countries in the modern age to sustain rapid economic growth for decades:
Botswana (Acemoglu, Johnson and Robinson in Rodrik 2003, Hjort 2010, Leith 2005). The
Republic of Botswana is a landlocked country in Sub-Saharan Africa with a population of 2
038 228 (Government Statistician, 2011). The country is also Africa’s longest continuous
multi-party democracy. At independence in 1966, its economy relied on beef exports which
were the main source of income in the early years (Darkoh and Mbaiwa 2002). Diamonds
were discovered in the 1970s, and have fueled its growth and development; as the resource
rents were successfully transformed into other forms of wealth (Lange 2004). In addition, the
country has also avoided the resource curse that plagued other African countries such as
Nigeria, Democratic Republic of Congo (DRC) etc. (Pegg 2010).
Between 1965 and 1998, Botswana had on average the fastest economic growth rate
in the world. During this period, the GDP per capita of the country grew at an annual rate of
7.7 percent (Acemoglu, Johnson and Robinson 2001 in Rodrik 2003, pg. 80). Given the
aforementioned, this paper will focus on these years of rapid economic growth, in order to
analyze the country’s accomplishments during this time period. However, to comprehend the
developments during the years between 1965 and 1998, we must first examine the nation’s
previous political and economic history by going back to the pre-colonial years. In spite of
this economic success, Botswana did not start out with favorable conditions. When it got its
independence from Britain in 1966, it was the second poorest country in the world and the
poorest in Africa (Dunning, 2005, pg. 460). Its GDP per capita in 1966, stood at $69 (Hjort,
2010, pg. 693,). By 1998, it had attained a GDP per capita of $5 796; which was almost four
times the African average (Acemoglu, Johnson and Robinson in Rodrik 2003, pg. 92). In
2012, its GDP per capita had grown to $16 792, and it had established itself as an upper
middle income country (IMF, 2012). The following chapters 2 and 3 seek to demonstrate and

CE
UeT
DC
olle
ctio
n
22
argue that Botswana was able to achieve this spectacular economic success by continued
cooperation among the Tswana tribes and minority ethnic groups since the pre-colonial years;
state legitimacy with centralized political institutions of the chieftaincy surviving
colonialism, and integrated into the post-independence nation; continued respect of property
rights originating in the pre-colonial era; political centralization at the national level after
colonialism; and democracy as well as good governance and policies after independence.
Chapter 2 Pre-Colonial and Colonial Political and Economic History
2.1 The Pre-Colonial States and Inclusive Political and Economic Institutions
In the eighteenth century, the Tswana tribes moved from what is now modern day
South Africa to what would later be named Bechuanaland during British colonial rule and
Botswana at independence in 1966. They were able to conquer the indigenous inhabitants of
these lands: San and other tribes, and integrate them into the Tswana society. In this early
period of their history, the Tswana states were traders, already had centralized political
institutions, secure property rights, and there was cooperation with minorities as well as
between the Tswana states.
In this pre-colonial era, the Tswana tribes had a history of commerce that thrived
under secure property rights. They lived in large towns with Shoshong having a population
of 30 000 in 1886, and acted as the center of the eastern Kalahari trade; second only to Cape
Town in the region of Southern Africa. The Tswana controlled the trans-Kalahari trade routes
between the Cape and Zambezia, which meant the tribes were exporting ivory, cattle, skins,
and ostrich feather to the south by the 1840s. This brought in some modest wealth to the
Tswana. For instance, Shoshong had nine stores for trading, and one of them alone could
make up to fifty thousand pounds (Hjort, 2010, pg. 701). By the nineteenth century, the
Tswana had also developed contract systems. Using credit was also a common feature in the
Tswana tribes; as commoners lent to each other, especially the rich to the poor. One such

CE
UeT
DC
olle
ctio
n
23
system was that of mafisa, in which the wealthy could lend their cattle to the poor in
exchange for labor. If the person defaulted, they could be taken to the chief, who would then
act as a judge. As such, rule of law was in place, and this commerce thrived as the Tswana
states had inclusive politically centralized states, and respected property rights.
The Tswana also had politically centralized states with the chief as the head,
minorities were integrated into the society, and property rights were secure. At this time, they
were divided into four different classes: royalty, commoners, settlers, and serfs. However, the
Tswana did not stay in the towns throughout the year. During the rainy seasons, the people
went to the agricultural areas with their cattle, and returned to the town during the dry season;
which allowed for a hierarchical and centralized power structure to develop. In the Tswana
tribes, the chief was the main political figure, and there was an established political hierarchy;
with some of the chief’s powers delegated to the relatives, officials, and ward headmen.
Therefore, the Tswana states were some of the most politically centralized in the region, with
some tribal capitals having up to five levels of political authority.
There was also a kgotla or public assembly location. The kgotla had several purposes
as it was used as a court for the chief, and a public advisory council in which commoners
could make their concerns heard, and criticize the chief. As such, this allowed for ordinary
people to play a key role in the political process, and constrain the political power of the
chiefs. The Tswana tribes also had multiple kgotlas, with the main one being that of the chief.
At the kgotla, all adult males including those from minority ethnic groups could contribute to
the debate. As such, the political institutions of the Tswana allowed for cooperation and
integration of minority ethnic groups into the society. Decisions on which laws to adopt were
often reached collectively. Councilors for the kgotla were appointed based on merit, and there
were also other advisory forums beyond the kgotla.

CE
UeT
DC
olle
ctio
n
24
In addition, secure property rights also flourished in this pre-colonial era. Although
land was collectively owned, the chief allocated land for residential and grazing purposes to
all his people. At this time, only customary land existed, and it could not be taken away once
it was allocated to a family. The land was also passed on from generation to generation
through inheritance, and could be lent or transferred to others. Also, women were allowed to
own fields and cattle. Cattle were private property; however, major owners were the
aristocracy and the chief. Although the land was collectively owned unlike the privately
owned cattle, the land rights were still secure as property rights can come in different forms
(Rodrik et al. 2004).
2.1.2 The Role of Culture: Cooperation
The nineteenth century was troublesome for the Tswana states as they defended their
land against aggressors, but the Tswana states cooperated to fight off these external threats.
The Tswana tribes faced a major challenge in a period of great instability, migrations and
conflict caused by the expansionist Zulu kingdom under Shaka Zulu. This conflict period
known as the difaqane began in 1818, and continued on until the 1830s. However, this was
not the end of their problems, as they soon faced another threat in the Boers, who began to
move into Tswana territory. The Boer advance into Tswana land was finally stopped by the
Tswana tribes at the battle of Dimane in 1852. Faced with these external threats, cooperation
between the Tswana tribes was high; as they fought off their common enemies; which created
a sense of unity among the Tswana states. After these conflicts, it was not long before the
Tswana tribes eventually had to face the issue of colonialism. Although the Tswana tribes
had successful fought off foreign threats, they did not have standing armies; thus, the political
elites recognized the need for assistance against the Boers, if they are to hold on to their lands
and power, and looked towards the British for help.

CE
UeT
DC
olle
ctio
n
25
2.2 British Colonialism
2.2.1 Limited Impact of Colonialism
After the conflict with the Boers, the Tswana worked to keep their lands away from them.
To protect the Tswana lands, chief Sechele went to Cape Town in 1853 to request that the
British protect the Tswana against the Boers. However, the British saw little importance in
colonizing Tswana lands. In addition to the chief’s pleas, the London Missionary Society
(LMS) located in the Tswana lands attempted to assist as well; as they also lobbied the
British to protect the area, although to no avail. However, the situation changed for the
British in 1885 after minerals such as diamonds were discovered in Kimberley in 1867, and
gold was found on the Witwatersrand in 1884-85. With the Germans taking over South West
Africa (modern day Namibia) in 1884, the British now had the opportunity to use the Tswana
land as a strategic colony. As such, Britain created British Bechuanaland and the
Bechuanaland Protectorate in 1885 to stop further expansion by the Germans and the Boers.
Given that the Tswana lands were colonized for strategic reasons, and not for resources, the
country avoided being turned into an extractive state mentioned by Acemoglu et al. (2001).
The fact that the country was colonized to stop the German and Boer expansion meant
that it would later avoid being turned into either a settler or extractive state. British
Bechuanaland was later integrated into South Africa in 1895, while the Bechuanaland
Protectorate is now modern day Botswana. However, both British Bechuanaland and
Bechuanaland Protectorate were administered at first from Vryburg, and eventually Mafeking
(modern day Mafikeng, South Africa) in British Bechuanaland. The Bechuanaland
Protectorate was not made a settlement for Europeans; with only a few settlers in the border
areas. The protectorate was generally left alone with little commercial and administrative
investment. Few funds were used for investment or development. This is demonstrated by the
fact that 75 percent of the money spent during colonialism, was for administrative costs
(Acemoglu, Johnson, and Robinson in Rodrik 2003, pg. 96). The attitude the British had

CE
UeT
DC
olle
ctio
n
26
towards the protectorate can be summarized in the words of High Commissioner Rey who
stated:
We have no interest in the country to the north of the Molope [the Bechuanaland
Protectorate], except as a road to the interior; we might therefore confine ourselves for the
present to preventing that part of the Protectorate being occupied by either filibusters or
foreign powers doing as little in the way of administration or settlement as possible
(Acemoglu and Robinson, 2012 pg. 405).
As such, the British had little interest in completely colonizing Bechuanaland Protectorate.
Thus, they attempted to make the country as independent as possible, while still keeping it as
a colony. The British did not focus on the country because they were not aware it had
exploitable resources that would later be discovered after independence. Therefore, the
impact of colonialism on the country was limited, and it avoided being turned into an
extractive or settler state.
Although the country had not been turned into an extractive state, the Tswana still had
to fight off being transformed into a settler one by continued cooperation with each other. By
1895, the Bechuanaland Protectorate was under threat of annexation. Cecil Rhodes began
taking over land that became Northern and Southern Rhodesia (modern day Zambia and
Zimbabwe respectively); with Bechuanaland Protectorate as his next objective for seizure.
However, Bechuanaland Protectorate represented by three Tswana chiefs, Khama, Sebele and
Bathoen reacted, and convinced the British to prevent annexation by Rhodes. Therefore, the
Tswana political elites at the time feared being political losers, as they viewed being turned
into a settler state, as a threat to their hold on power. Consequently, they worked to block any
changes that could result in them losing more control over their territories, such as being
incooperated into the surrounding settler states. As such, through cooperation, Bechuanaland
Protectorate sheltered its political institutions that remained relatively unaffected by colonial
rule; as the chiefs continued to rule as usual.

CE
UeT
DC
olle
ctio
n
27
2.3 Political and Economic History under Colonialism
2.3.1 Survival of the Chieftaincy and Secure Property Rights
During the colonial era, the chiefs continued to rule their people with limited interference
from British, and property rights were still respected. Thus, the political and economic
institutions survived colonialism and were reinforced by cooperation among the different
Tswana states; however, there were still some changes made to the structure of the economy
with the introduction of taxes.
The country was officially under British rule; however, the native chiefs were allowed
to govern their people as usual, with the British High Commissioner mostly exercising
authority over the Europeans. As stated by Hjort (2010):
Botswana was largely neglected by the British; on 30 May 1890 an Order-in-Council
was issued for the High Commissioner instructing him ‘to confine the exercise of
authority and application of law, as far as possible, to whites, leaving the native chiefs
and those living under their authority almost entirely alone’. As a result, the
traditional state institutions and the authority of the chiefs and their advisers remained
intact throughout the colonial period.
Therefore, even during colonialism, the traditional political institutional organization of the
Tswana remained the same. The chief was also still the main political figure. During
colonialism, the chiefs continued to allocate most of the land (customary) (Mathuba, 2003).
However, it was no longer just customary land that existed as the land was divided into three:
Native land (now customary), Crown land (now state), and freehold; with most of the people
still allocated customary land by the chiefs. Each family was entitled to land for residential,
grazing and arable farming. These property rights were secure and transferable. As stated by
Mathuba (2003):
Customary land was allocated free and each family was entitled to land for residential,
livestock grazing and arable farming. The families were given exclusive rights to
residential and arable land and these rights were secure, inheritable and transferable.
The customary land rights did not lapse with time. Grazing land was used
communally by those who had livestock. The farmers were allowed to drill boreholes
or open wells and had exclusive rights to such developments only (pg. 4-5).
As such, institutions of secure property rights were in place before and during British rule,
and continued to flourish long after colonialism. In the nineteenth century, the only element
CE
UeT
DC
olle
ctio
n
28
missing from the land property rights idea compared to the modern one was the ability to sell
land; although this has remained the same in modern day Botswana, as most of the land still
cannot be legally sold; however, it can be transferred to others. As such, in modern day
Botswana, only the buildings on customary land can be sold, but not the land itself. However,
with the creation of freehold land in the colonial era, the owners of this type of land
continued to have exclusive rights to it, and could sell it. Therefore, freehold land is
individually owned. As in the pre-colonial era, the people could not be forced to give up their
land once it had been allocated to them. Once a family built itself a home in the allocated
land, it remained property of that family, and was passed on to later generations though
inheritance. These economic institutions were also inclusive as secure property rights also
applied to women. Women were allowed to own land such as fields that their husbands could
not control. People were also allowed to transfer or lend their land to others. Therefore,
incentives to invest in land already existed. Women could also own cattle, which was an asset
that even the chief could not control. In addition, young adults were also eventually allowed
to own their own cattle. The individual ownership of cattle allowed for the creation of a cattle
market during the twentieth century. Exporting cattle to Kimberley was one of the main
sources of income for the Tswana in the 1880s, and would become a crucial sector in the
early years after independence. The institutions of secure property rights continued to prosper
as they were extended to other areas as well. For instance, in the 1930s, boreholes were also
recognized as private property. As such, by independence, institutions of secure property
rights were well established.
With the introduction of taxes by the British, the thriving retail market gave the
colonial power more income than it expected. The Tswana chiefs were among some of the
few native leaders who had been given the power to collect taxes, and share some of the
profits. A hut tax of one pound was established in 1899. The addition of a native tax of three

CE
UeT
DC
olle
ctio
n
29
shillings increased the tax amount in 1919. These taxes were introduced to make Batswana
join the labor market. In order to pay the taxes, Batswana joined the labor market at
Witwatersrand in South Africa. In 1930, 4,012 Batswana were working in South Africa
(Acemoglu, Johnson and Robinson in Rodrik 2003, pg. 96). Also in the 1930s, local farmers
produced 90% of the required cereals for consumption, and the country was self sufficient in
food production (Hillbom, 2008, pg. 197). However, half of the males between 15 and 44
were employed outside Bechuanaland Protectorate by 1943 (Acemoglu, Johnson and
Robinson in Rodrik 2003, pg. 96). Consequently, local food production decreased and stood
at 50 percent by 1980, and the government has been unsuccessful at returning the country to
self sufficiency (Hillbom, 2008, pg. 197). Therefore, trade has also not been beneficial to
these import competing industries such as local food production; given that locals now had to
compete with imports from countries such as South Africa. As stated by Hillbom (2008),
“[t]he country is today totally dependent on SACU [Southern African Customs Union] for
[food] imports… (pg. 197).” However, trade has not been entirely unbeneficial as it has had
positive results for export oriented sectors such as beef and minerals. Therefore, although the
country was able to protect its political institutions of the chieftaincy and economic
institutions of secure property rights, the structure of its economy was still affected.
In addition, even though political institutions such as the chieftaincy, and inclusive as
well as centralized power structures in the tribes remained the same during the colonial
period, the British did make some attempts to fully colonize the country, and alter the
political institutions of the chieftaincy. From 1934, the British attempted to establish and
solidify their authority over the chiefs and their territories. However, the chiefs continued to
block any political institutional changes to avoid losing any more control over their
territories. For instance, some chiefs such as Tshekedi Khama and Bathoen challenged these
actions in court. Although they eventual lost the case, the cooperation among the chiefs in

CE
UeT
DC
olle
ctio
n
30
opposition to the new policies, and the break out of the Second World War, ensured that they
were never implemented.
2.3.2 Transition to Independence and Creation of a Legitimate State with Constraints
on Elites
With the end of the Second World War, the British had originally planned to
eventually incooperate the protectorate into South Africa; however, with the National Party
taking over in 1948 in South Africa, this became less viable. In 1948, the man who would
later become the first president of independent Botswana, Seretse Khama, was also exiled
from the Protectorate for marrying a white woman while studying in Britain. Seretse Khama
was the hereditary chief of one of the largest Tswana tribes: the Ngwato. His interracial
marriage enraged the South African government, and forced Seretse Khama to remain in
Britain until 1956, when he and his regent uncle abdicated their claims to the throne.
Upon his return, he took an active role in the country’s politics. He joined the Joint
Advisory Council that had been formed by the British in 1951 combining the old African and
European Councils. In 1960, the first political party in Botswana was formed: Bechuanaland
(Botswana) People’s Party (BPP). However, the BPP had an anti-colonial agenda. This
allowed Seretse Khama and others to form an opposing party: Bechuanaland (Botswana)
Democratic Party (BDP). In the early 1960s, the BPP got most of its support from the urban
groups and workers, which were very few at the time. On the other hand, the BDP was made
up of teachers, civil servants and most importantly chiefs; thus, it appealed more to the rural
Tswana, who made up most of the population. The presence of chiefs in the BDP, including
Seretse Khama, meant that most Batswana viewed it as a legitimate governing body; as such,
the political and economic elites being the chiefs and their allies, knew they did not have to
fear being political losers after independence; given that the chiefs could rely on the support
of their tribes, even in a new system of democracy. Therefore, transitioning to democracy did
not come as threat to their hold on political power. When the first election was held in 1965,

CE
UeT
DC
olle
ctio
n
31
the BDP won comfortably, and continued to win subsequent elections as demonstrated in
figure 1 below.
Figure 1 Share of Votes in Parliamentary Elections
Source: Poteete (2009)
Although they have won all elections, democracy constrained the power of political
elites and made them adopt good policies. For instance, the BDP has been responsive to
possibilities of losing power. In 1974, it introduced a successful Accelerated Rural
Development Program that invested in infrastructure for rural areas; after the Botswana
National Front (BNF) had won several seats in the assembly of 1969. In 1994, the BDP also
reduced the voting age from 21 to 18, and allowed for Batswana outside the country to vote
after it lost ground in elections. This was especially important given that many Batswana still
worked in South Africa; as a result of the changes in the structure of the economy during
colonialism.
2.3.3 Creation of a Politically Centralized State and Democracy
In 1961, the British finally decided to abandon the plan to incooperate the
Bechuanaland Protectorate into South Africa. Consequently, in 1962, the capital and

CE
UeT
DC
olle
ctio
n
32
administration center of the Protectorate was moved from Mafikeng, South Africa to
Gaborone, in transition to independence. During this transition period, Seretse Khama’s
leadership proved to be crucial as he worked to take away centralization from the chieftaincy
level, to the national. The chiefs allowed for this as they could still keep their political power
in the new democratic state, and were used to a political system that constrained their power.
During the constitutional negotiations with the British, Khama, who was a hereditary
chief himself, worked to create a centralized state by stripping powers of the chiefs. The
constitutional negotiations resulted in the creation of an assembly that included the speaker,
attorney general with no voting rights, 31 members of parliament, and 4 members elected by
the president. The president was chosen by the national assembly and had executive power.
The constituencies were modeled after the British first past the post system. People running
for the assembly also had to announce which presidential candidate they supported. In
addition to the assembly, a House of Chiefs was also created and included chiefs of the eight
Tswana tribes; as well as four representatives of minority ethnic groups, and three members
elected by the House of Chiefs. As such, minority ethnic groups continued to be included in
the political process. The House of Chiefs was not given any legislative power. In fact, the
chiefs were stripped of most of their power including allocation of land. New institutions
such as landboards, councils and development committees were created to take over some of
the powers that used to be vested with the chiefs. In addition, the president was eventually
given the power to remove a chief. Instead of impeding government authority, the role of the
chiefs was changed to one that compliments the state; as they serve as government agents in
rural areas, which further strengthened the legitimacy of the new state. The political
institutions of the chieftaincy were thus integrated into the modern ones, and remain key
organs of the modern state (Morapedi, 2010).

CE
UeT
DC
olle
ctio
n
33
As such, the chiefs could still play a role in the management of the new state; thus,
keeping some of their political power, with the option to increase it by running for the
assembly. However, the members of the House of Chiefs were restricted from being part of
the assembly, unless they first resigned from the chieftaincy; although this was also not a
good enough reason to block transition to democracy, given that they could always rely on
their tribes to vote them into office. They were also already used to a system that constrained
their power as the kgotla allowed for political participation of commoners in the political
process, and criticism of the chiefs.

CE
UeT
DC
olle
ctio
n
34
Chapter 3 Independence and Post Colonial Political Economy In 1966, the British gave the Bechuanaland Protectorate its independence without
conflict, and Seretse Khama became its president. At the time of its independence, the
country had no army with only a small police paramilitary unit that was incapable of dealing
with security threats posed by powerful perpetrators in South Africa and Southern Rhodesia,
which eventually led to the creation of the Botswana Defense Force (BDF) in 1977; it had a
weak bureaucracy and middle class; it was one of the poorest countries in world with a GDP
per capita of $69; and had little in terms of assets as well as infrastructure (Henk 2006, Hjort,
2010, pg. 693). Apart from the lack of physical capital, the country also lacked human
capital. The only sector present was that of cattle exports, and the political and economic
elites, who were the main owners of cattle, promoted it to great effect; although it was
eventually replaced by mining. With the political and economic elites determined to promote
economic prosperity without fear of being political and economic losers, a market based
strategy with a strong role for the government was pursued; with heavy investment on
development of infrastructure, health and human capital.
3.1 Poor Human and Physical Capital but Rapid Economic Growth
At independence, the country faced many challenges including the lack of
infrastructure and educated people. Botswana only had 12 km of paved road, 22 Batswana
university graduates, and 100 secondary graduates (Acemoglu, Johnson and Robinson in
Rodrik 2003, pg. 100). In addition, there were only two secondary schools that offered full
five year courses, and the education system was generally poor, with huge classes and high
failure rates. With lack of educated people, the civil service was in dire need of human
capital. In 1964, the civil service was made up of only 607 people, and 502 of them were
expatriates (Eriksen, 2011, pg. 266). In 1969, all newly elected members of parliament had 3
years or more years of education; with 90 percent of the population having less education
(Ulriksen, 2012, pg. 1493). Given that few Batswana were educated, only one quarter of the

CE
UeT
DC
olle
ctio
n
35
civil service was made up of Batswana in 1965. Seretse khama was well aware of the
dangerous of localizing the civil service before qualified Batswana were available; therefore,
locals were not employed unless they were qualified. Most importantly, the economy was
able to grow rapidly even with most of the population uneducated, and with poor
infrastructure. As such, although human and physical capital is important, Botswana
demonstrates that it does not always need to come before inclusive political and economic
institutions, in order to attain economic prosperity. In the case of Botswana, one of the main
elements in its economic success at independence was the ability to maintain its inclusive
economic institutions of secure property rights; as the political and economic elites could
increase their incomes with the only sector in the country: beef and beef products exports.
3.1.2 The Beef and Mineral Sectors, and Constraints on Elites
The only sector in the country was that of beef and beef products exports which the
political and economic elites had a vested interest in developing; given that they were major
cattle owners themselves. As such, this sector played a crucial role once the country was
independent. The sector expanded rapidly after independence, and was later joined by the
more profitable mineral sector; however, with the elites feeling secure in power, democracy
constraining their actions, and secure property rights well established, expropriation was
avoided; thus, the result was reinvestment of rents.
In the 1960s, cattle, beef, and livestock products made up 75 percent of income from
exports, and about 90 percent of the population lived in rural areas (Ulriksen, 2012, pg.
1493). This sector was well supported by the elites as the policies adopted were often
favorable to cattle ranchers. For instance, drought relief and feeding schemes were introduced
to provide temporary safety nets for farmers. Another example is a policy that supported
cattle ranchers called the Tribal Lands Grazing Policy (TGLP), which was introduced in
1975; giving large cattle owners rights to commercial land in order to expand their output. By

CE
UeT
DC
olle
ctio
n
36
the 1970s, the government already had a budget surplus. The income from the agricultural
sector during the 1960s and 1970s increased as the government had negotiated favorable beef
prices to the ECC market that were above the world average, invested in improving the
sector, and there were good weather cycles. The government had also created the Botswana
Meat Commission (BMC), which was a marketing board that bought cattle, set prices, and
sold beef to other markets in the region and around the world. However, the marketing board
was not used to expropriate farmers as most political and economic elites were large cattle
owners, including the opposition. Therefore, the opposition also had an interest in developing
the agricultural sector, and did not try to stop expansion of this sector. In fact, 77 percent of
the people elected to be members of parliament in 1969 owned more than 50 cattle (Ulriksen,
2012, pg. 1493). This meant that the political and economic elites benefited from continuation
of secure property rights; as cattle had always been private property. As such, they could
increase their incomes through the cattle products export sector, and did not have to fear
losing their rents by continuing with institutions of secure property rights; rather, they could
only benefit. Although the distribution of cattle was unequal and few farmers controlled
arable production, this sector did not benefit the elites alone; given that most Batswana
owned cattle or at least benefited from them in some way. As such, the economic institutions
of secure property rights that emerged after colonialism continued to be inclusive; as both the
elites and most of the population benefited from them. However, the discovery of diamonds
meant that there was another possible and more profitable source of income for the elites.
The government encouraged mining companies to look for minerals in the country
after independence. This resulted in the discovery of diamonds, copper, nickel, and coal. The
most important of these minerals were the industrial and gem quality diamonds discovered in
Letlhakane and Jwaneng. An important decision that had been made by Seretse Khama and
the BDP after independence in 1967 was that all minerals found in Botswana would no
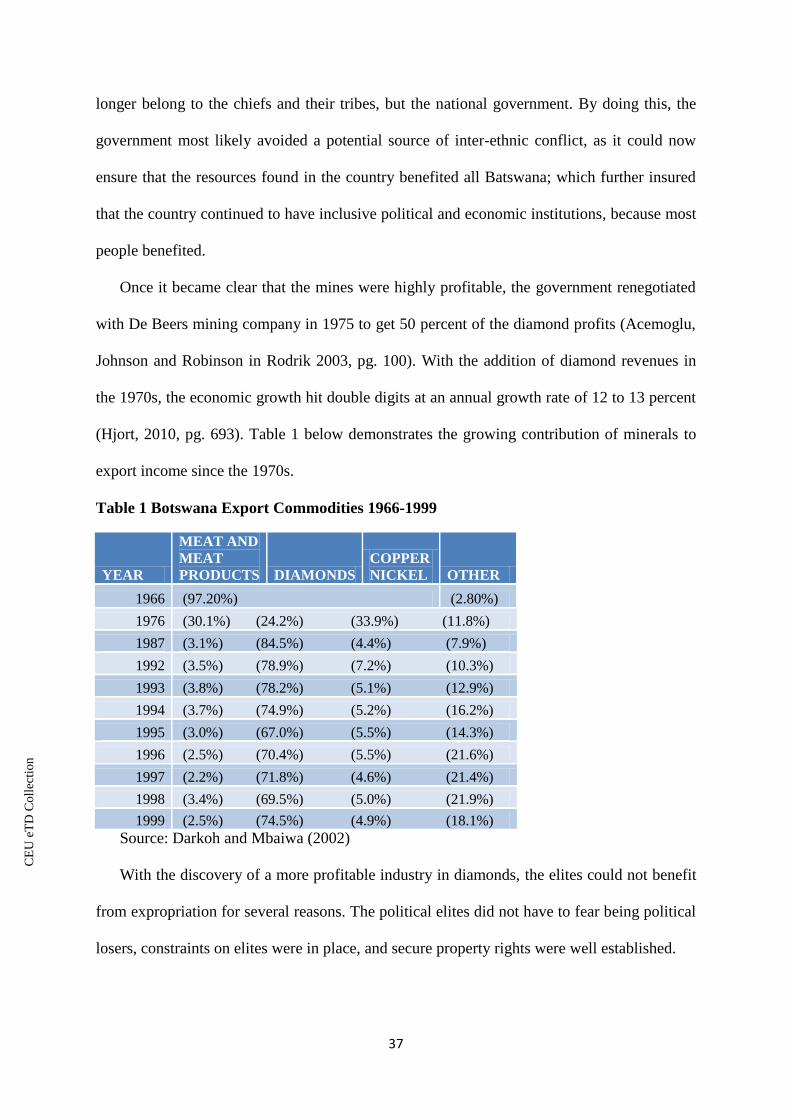
CE
UeT
DC
olle
ctio
n
37
longer belong to the chiefs and their tribes, but the national government. By doing this, the
government most likely avoided a potential source of inter-ethnic conflict, as it could now
ensure that the resources found in the country benefited all Batswana; which further insured
that the country continued to have inclusive political and economic institutions, because most
people benefited.
Once it became clear that the mines were highly profitable, the government renegotiated
with De Beers mining company in 1975 to get 50 percent of the diamond profits (Acemoglu,
Johnson and Robinson in Rodrik 2003, pg. 100). With the addition of diamond revenues in
the 1970s, the economic growth hit double digits at an annual growth rate of 12 to 13 percent
(Hjort, 2010, pg. 693). Table 1 below demonstrates the growing contribution of minerals to
export income since the 1970s.
Table 1 Botswana Export Commodities 1966-1999
YEAR
MEAT AND
MEAT
PRODUCTS DIAMONDS
COPPER
NICKEL OTHER
1966 (97.20%) (2.80%)
1976 (30.1%) (24.2%) (33.9%) (11.8%)
1987 (3.1%) (84.5%) (4.4%) (7.9%)
1992 (3.5%) (78.9%) (7.2%) (10.3%)
1993 (3.8%) (78.2%) (5.1%) (12.9%)
1994 (3.7%) (74.9%) (5.2%) (16.2%)
1995 (3.0%) (67.0%) (5.5%) (14.3%)
1996 (2.5%) (70.4%) (5.5%) (21.6%)
1997 (2.2%) (71.8%) (4.6%) (21.4%)
1998 (3.4%) (69.5%) (5.0%) (21.9%)
1999 (2.5%) (74.5%) (4.9%) (18.1%)
Source: Darkoh and Mbaiwa (2002)
With the discovery of a more profitable industry in diamonds, the elites could not benefit
from expropriation for several reasons. The political elites did not have to fear being political
losers, constraints on elites were in place, and secure property rights were well established.

CE
UeT
DC
olle
ctio
n
38
The legitimacy of the state and broad coalition gained by having the chiefs in the ruling
party, meant that the political elites felt secure in power. As such, they did not feel threatened
by growth. In addition, constraints on political elites brought by democracy meant that they
could not easily adopt bad policies without risking turning their broad coalition against
themselves. As such, they did not have the option of expropriating the diamond wealth.
Consequently, the wealth brought in by the diamonds only reinforced the existing political
institutions of democracy and economic institutions of secure property rights. Thus, by the
time diamond revenues came in, the country already had established inclusive political and
economic institutions, that allowed for mineral revenue to be reinvested for the benefit of the
majority of the population.
The government used the rents well to invest heavily in infrastructure, health and
education. In 1972, 86.6 percent of Batswana working for the government had primary school
education or less (Poteete, 2009, pg. 559). The government continued to use expatriates,
international advisors, and consultants until well qualified Batswana were available.
Therefore, secondary and tertiary education was initially among government priorities, as
both the mining and the bureaucracy needed skilled staff. At first, revenue from diamonds
was low, but it began to replace agriculture as the main sector from the 1980s. As diamond
revenue accumulated, the money was used to invest in the government budget and welfare
policies. As a result, the government successfully reinvested mineral rents by turning them
into other forms of wealth, through welfare policies (Lange 2004, Ulriksen 2012). As such,
the partnership between the government and the De Beers mining company turned out to be
fruitful.

CE
UeT
DC
olle
ctio
n
39
3.2 Elements of Success and Failure
However, not all was a success, as the country did not make substantial gains in
industrialization, despite its wealth. The country made attempts to switch to an industrialized
economy with relatively little success and had problems with inequality.
Development initiatives such as the Botswana Development Corporation (BDC) and
Financial Assistance policy were introduced in 1970 and 1982 respectively. These were
created to assist with industrial ventures. The country did not opt for import substitution
industrialization, which could be the reason why it failed to significantly industrialize;
although its avoidance could also account for why it was able to sustain high economic
growth. Therefore, by avoiding developing the industrial sector at the expense of others,
Botswana was able to continue growing rapidly. With the country having favorable
commodity prices and substantial income from minerals, it was also not under pressure to
rapidly industrialize through import substitution. Instead, it opted for subsidized loans for the
citizens to start up their own industrial projects. Although the plans to industrialize the
country have not been successful on a large scale, manufacturing has kept pace with the
growth, stabilizing at around 5 percent of the GDP (Poteete, 2009, pg. 552). Figure 2 below
demonstrates the growing role of the mining sector, relative stability of other sectors
including manufacturing, and decline of agriculture as contributors to the GDP overtime.

CE
UeT
DC
olle
ctio
n
40
Figure 2 Sectoral Contribution to Botswana’s GDP
Source: Poteete (2009)
The BDC’s ventures have also not been a complete waste, as it has successfully developed
other sectors such as real estate and finance; which have made up for its other unprofitable
ventures in agriculture and industry.
More recently, in 2011, the mining sector declined by 12.5 percent, while non mining
sectors grew by 11.6 percent (Ministry of Finance, 2013, pg. 3). The fastest growing sectors
in 2011 were construction, general government, and trade, hotels and restaurants which grew
in real terms by more than 10 percent (Ministry of Finance, 2013, pg. 3) In addition, although
the Botswana economy was negatively affected by the recent global economic crisis, it was
able to recover as the effects were cushioned by large reserves; which were enough to cover
28 months of imports of goods and services in 2007 (Ministry of Finance, 2008, pg. 5). By
2012, the foreign exchange reserves could only cover13 months of importation of goods and
services (Ministry of Finance, 2013, pg. 4). Additionally, due to the global economic
recession, in 2008, GDP (PPP) per capita stood at $14 920, but dropped to $14 167 in 2009
(IMF, 2012). However, between 2010 and 2012, the GDP (PPP) capita recovered as it grew

CE
UeT
DC
olle
ctio
n
41
from $15 183 to $16 792 respectively (IMF, 2012). In a comparative perspective, in 2012,
Botswana had the highest GDP per capita among the former British colonies in Africa (IMF,
2012). Compared to Sub-Saharan Africa, it had the fourth highest GDP (PPP) per capita in
2012, out of the forty four countries (IMF, 2012). Although it has been flourishing compared
to most former African British colonies and Sub-Saharan Africa, it remains to be seen how
successful the government will be at addressing challenges such as inequality and
industrialization.
The country also failed to significantly reduce inequality as demonstrated by Table 2;
although it did make some progress.
Table 2 GINI Coefficients for Total Income, Botswana
RIDS, 1974/75 HIES, 1985/86 HIES, 1993/94
National 0.56 0.54
Urban 0.54 0.54
Rural 0.52 0.48 0.43
Source: Leith (2000)
Therefore, while the poor may be better off than before, so are the affluent people. However,
despite these setbacks, the country has not failed at all its objectives.
Although it had failed to significantly industrialize and reduce inequality, the
politically centralized state had success in improving infrastructure, education, health and
other sectors of the economy. The construction sector had boomed as modern housing was
built in the 1980s and 1990s, electricity and means of distributing it were also done locally,
and the telecommunications industry had grown rapidly. The construction was mainly in
providing public services such roads, water supplies, schools, administrative buildings and
clinics. The success of some of these efforts is demonstrated in table 3 below.
Table 3 Health Services
1980 1985 1990 1994
Doctors per 100,000 15 17 18 24

CE
UeT
DC
olle
ctio
n
42
Nurses per 100,000 124 156 216 217
Hospital beds 2060 2554 3211 3245
Source: Leith (2000)
By 1998, the country had also expanded its provision of public services as 88 percent of
Batswana already lived within 8 km of health facilities, and 97 percent had safe drinking
water (Uriksen, 2011, pg. 267). Investment in education which started in the 1960s had also
been successful as demonstrated by Table 4 below.
Table 4 Education Enrolments
(thousands)
1965 1970 1975 1980 1985 1990 1995
Primary 66.1 83 116.3 171.9 223.6 283.5 319.1
Secondary 1.3 3.9 12.1 18.3 32.2 56.9 104.7
University 0.083 0.14 0.465 0.928 1.773 3.677 5.501
Source: Leith (2000)
By 2010, the literacy rate stood at 84.5 percent, which was over 12 percent higher
than the Sub-Saharan average of 72 percent (World Bank, 2013). Therefore, the country had
successfully invested in human and physical capital, and had an effective politically
centralized state. Education also continues to be among government priorities as
demonstrated by the figure 3 below.
Figure 3
Ministry of Education and
Skills Development
23%
Ministry of Local
Government and Rural
Development 13%
Ministry of Health
12%
Ministry of Defense,
Justice and Security
11%
Others 41%
Recurrent Budget Allocation

CE
UeT
DC
olle
ctio
n
43
Source: Ministry of Finance and Development Planning (2013)
As stated by the Ministry of Finance and Development Planning, “As usual, the largest share
of P7.93 billion goes to the Ministry of Education and Skills Development to continue
building human capital” (Ministry of Finance and Development Planning, 2013, pg. 2). As
such, the government has continued with its human capital accumulation. It has also
continued to invest in rural development and health as the two hold the second and third
largest budget shares respectively. The government has used its revenues well as it usually
had a surplus, had large reserves and had not needed structural adjustment loans.
Through a legitimate post-colonial state; continued inter-ethnic cooperation; secure
property rights; political centralization; natural resources wealth; democracy and good
policies; by 1998, Botswana had transformed itself into a middle income economy with a
GDP per capita that was almost four times the African average at $5796 (Acemoglu, Johnson
and Robinson in Rodrik 2003, pg 80). This development has continued into the 21st century.
In 2012, its GDP per capita stood at $16 792; meaning it is well established as an upper
middle income economy (IMF 2012). As such, the once second poorest country in the world,
and least prosperous country in Africa, has transformed itself into an economically
prosperous nation, in one of the poorest locations in the world.

CE
UeT
DC
olle
ctio
n
44
Conclusion This paper examined how Botswana was able to attain economic prosperity through a
detailed historical case study. The case considered the role of some of the theories of
economic prosperity such as geography, culture, trade, factor endowments, policy and
institutions. Thus, the thesis looked to determine the validity of these different hypotheses in
explaining Botswana’s economic success. This paper considered the case from an
institutional perspective, and concludes that institutions matter for economic prosperity, but
not exclusively. Therefore, the thesis highlights the validity and importance of most of these
hypotheses for the case of Botswana; although it did not find support for the factor
endowments hypothesis. In Botswana, it was not any single one of these hypotheses working
alone. Rather, it was a combination of elements of these different theories such as
cooperation, natural resource abundance, favorable commodity prices, and good policies that
benefited the majority of the population, supported by inclusive institutions of democracy and
secure property rights.
Chapters 2 demonstrated the importance of political and economic institutions of the
chieftaincy system and secure property rights, and how they worked with elements of culture
such as inter-ethnic cooperation to create a stable trading society needed for economic
prosperity. Secure property rights were well established by the time Botswana gained its
independence; as they were present in the pre-colonial years, and were not affected by
colonialism because the country was a neglected colony. In addition, the elite constraining
traditional and centralized political institutions of the chieftaincy, that encouraged
cooperation with minority ethnic groups, and their participation in the political process, were
also well integrated into the democratic system. To create a politically centralized state, the
chiefs willingly surrendering their powers to the government; however, they did this knowing
that they would still play an active role in the governing of the democratic state, and could

CE
UeT
DC
olle
ctio
n
45
rely on their tribes to vote them into office. This integration of traditional political institutions
into the democratic system, and presence of chiefs in the ruling party, created a broad based
coalition, and a legitimate government that felt secure in power. As such, with a government
that felt secure in power in place, the political elites had incentive to develop the economy
without fear of being political losers. Traditional political institutions that were supportive of
inter-ethnic cooperation, integrated into the democratic system, also ensured the country’s
future as a stable and economically prosperous nation. The voluntary surrender of the chiefs’
powers also demonstrated the effectiveness of the trust and cooperation that had been around
since pre-colonial years, between the Tswana states and minority ethnic groups. This
cooperation and trust continued on into the post-colonial years, because the political
institution that supported it, the chieftaincy, was well integrated into the democratic system.
Chapter 3 showed how political and economic institutions of democracy and secure
property rights helped the country successfully manage natural resource endowments to avoid
the resource curse, made it adopt good policies, and helped it negotiate favorable commodity
prices as well as broadly distribute the rents. When diamond revenue accrued in the 1970s,
the democratic system constrained the power of the elites and forced them to adopt good
policies, as they could not expropriate the resources without risking losing their broad based
coalition. As such, democracy can improve a country’s chances that elites will adopt good
policies. Secure property rights were also well established by this time and government
ownership of the resources ensured that rents were invested for the benefit of the majority of
the population. As stated by Mogae, “If rights to diamonds had been vested in private hands
or with regional interests, concentrated and skewed development would likely have resulted”
(2005, in Hjort 2006, pg. 187). Instead of only the tribe that resides in the location the
minerals are discovered benefiting, state ownership allowed for the rents to be used to
develop the whole country. As such, the discovery of diamonds did not come as a curse, but

CE
UeT
DC
olle
ctio
n
46
was rather a blessing. The rents from the natural resources were essential for the rapid
development of the economy. However, their abundance alone was not a sufficient condition
for economic prosperity. Government ownership of natural resources and reinvest into other
forms of wealth such as human capital, infrastructure, and social services was encouraged by
inclusive political and economic institutions. These policies benefited the majority of the
population, and were effective means of avoiding skewed development and inter-ethnic
conflict.
In addition, continuation of secure property rights by the elites after independence in
order to increase their rents from beef exports was essential, as it helped the majority of the
population, who owned cattle or benefited from them in some way. As such, the case also
shows that elites are more likely to negotiate for favorable commodity prices, when they are
directly involved in the sector, and can profit with secure property rights in place.
Nevertheless, it is also important to note that the country may have benefited more from
international trade, because it successfully negotiated for commodity prices above the world
average. As such, had it not had favorable prices for its commodities, it is unlikely that it
would have profited as much as it did. Therefore, commodity prices were important for
Botswana, but were not adequate conditions for economic prosperity alone either. The
addition of diamond revenue was necessary for economic growth to hit double digits.
Institutions of democracy and secure property rights were also needed to encourage the
adoption of good policies, and effective utilization of the income for the benefit of the
majority of the people.
On the other hand, Chapter 3 also illustrated that although continuous inter-ethnic
cooperation, good policies, favorable commodity prices, and natural resource abundance
were crucial to the development of the country supported by democracy and secure property
rights, factor endowments such as poor human and physical capital, proved not to be
CE
UeT
DC
olle
ctio
n
47
immediately essential for the country’s economic progress. Lack of educated people and
infrastructure was not a recipe for economic stagnation. Botswana lacked both at
independence, but it was still able to raise itself from poverty. As such, the findings of this
paper contradict the factor endowment argument of human and physical capital. However,
this is not to say that human and physical capital is not essential in the long run. Good
infrastructure and an educated population are necessary for modern technological innovation.
Therefore, if Botswana was to become a technological hub, it would need people who are
well educated in the fields of science and technology, and good infrastructure.
As mentioned in the introduction, the main question of this thesis was the following:
why was Botswana, unlike other Sub-Saharan African countries, able to develop so
spectacularly? The first hypothesis was that it was due to its institutions. Accordingly, the
second question was as follows: why was Botswana, unlike other Sub-Saharan nations, able
to develop and consolidate good institutions? The second hypothesis was that it was due to a
fortunate mix of structural factors and legacies. Additionally, this research also looked to
determine if other Sub-Saharan African countries can learn from the experience of Botswana.
Therefore, the third question was as follows: are there generalizable lessons that can be
drawn from this case?
This thesis found support for the institutions hypothesis, specifically historical
institutionalism. However, it also came to the conclusion that geography, culture, policy and
trade hypotheses are also valid. All the aforementioned are applicable for the case of
Botswana, but are not sufficient explanations for the country’s economic prosperity alone. In
other words, in order to adequately explain the case of Botswana, institutions needed
elements of geography (natural resource abundance), culture (cooperation), trade (favorable
commodity prices), and policy. However, not all hypotheses were found to be applicable to
Botswana. Factor endowments such as human and physical capital did not prove to be

CE
UeT
DC
olle
ctio
n
48
immediately essential for the development of the country, as its economy grew rapidly
without them.
Even though economic prosperity has been a challenge for much of Sub-Saharan
Africa, Botswana demonstrates that it is not an unfeasible task. What other Sub-Saharan
nations can draw from Botswana is that even the least developed African countries, can raise
themselves out of poverty. Although Botswana had unique initial institutional conditions,
democracy and secure property rights alone did not guarantee its economic success.
Cooperation between its people was crucial to creating a stable environment suitable for
economic progress. It also needed to adopt good policies and effectively use the income from
the natural resources and commodity exports for the benefit of the majority of the population.
As such, the case of Botswana demonstrates that economic success needs good institutions.
Therefore, institutional development is necessary for economic progress. However, it is
important to note that Botswana had unique institutional conditions at independence; thus,
other countries cannot be expected to easily replicate its spectacular economic growth.
Lastly, even though Botswana has come a long way from being the world’s second poorest
country and Africa’s least prosperous, to one of the wealthiest on the continent, it still has
failed to join the industrialized nations. As such, further research can seek to determine why
economic prosperity in Botswana, did not come with considerable industrialization.

CE
UeT
DC
olle
ctio
n
49
References Acemoglu, D., & Robinson, J. (2012). Why nations fail: The origins of power, prosperity,
and poverty. Crown.
Acemoglu, D., & Robinson, J. (2006b). De facto power and institutional persistence . The
American Economic Review, 96(2), 325-330.
Acemoglu, D., & Robinson, J. (2006). Economic backwardness in political
perspective. American Political Science Review, 115-131.
Acemoglu, D, Johnson, S & Robinson, J (2001). The Colonial Origins of Comparative
Development: An Empirical Investigation, American Economic Review, 1369-1401
Bloom, D., Sachs, J., Collier , P., & Udry, C. (1998). Geography, demography and economic
growth in africa. Brookings Papers on Economic Activity, 207-295.
CIA. (2013). The world factbook CIA.
Darkoh, M., & Mbaiwa, J. (2002). Globalisation and the livestock industry in
botswana. Singapore Journal of Tropical Geography, 23(2), 149-166.
Daniele, V. (2011). Natural resources and the 'quality of economic development. Journal of
Development Studies, 47(4), 545–573.
Dunning, T. (2005). Resource dependence, economic performance, and political
stability. Journal of Conflict Resolution, 49, 451-482.
Diamond, J. (1998). Guns, germs and steel. Vintage.
Easterly, W., & Levine, R. (2003). Tropics, germs, and crops: how endowments influence
economic development. Journal of Monetary Economics, 3–39.
Economist Intelligence Unit. (2011). Democracy index 2011. Retrieved from
http://www.eiu.com/Handlers/WhitepaperHandler.ashx?fi=Democracy_Index_2011_Updated
Eriksen, S. (2011). Regimes, constituencies and the politics of state formation: Zimbabwe
and botswana compared. International Political Science Review, 33(3), 261–278.
Evans, P. (2004). Development as institutional change: The pitfalls of monocropping and the
potentials of deliberation. Studies in Comparative International Development, 38(4), 30-52.
Government Statistician. Census Office, (2011). 2011 population & housing census
Gullup, J., Sachs, J., & Mekkinger , A. (1999). Geography and economic
development. International Regional Science Review, 22(2), 179–232.

CE
UeT
DC
olle
ctio
n
50
Glaeser, E., La Porta, R., Lopez De Silanes, F., & Shleifer, A. (2004). Do institutions cause
growth?. Journal of Economic Growth, 271-30.
Greif, A. (1994). Cultural beliefs and the organization of society: A historical and theoretical
reflection on collectivist and individualist societies. Journal of Political Economy , 103(5),
912-950.
Gyimah-Boadi, E. (2004). Democratic reform in africa: the quality of progress. Lynne
Rienner.
Hall, R., & Jones, C. (1999). Why do some countries produce so much more output per
worker than others?. The Quarterly Journal of Economics, 83-116.
Harrison , L., & Huntington , S. (2000). Culture matters: How values shape human progress .
Basic Books.
Hayward, R., & Kemmelmeier, M. (2011). Weber revisited: A cross-national analysis of
religiosity, religious culture, and economic attitudes. Journal of CrossCultural
Psychology, 42(8), 1406-20.
Henk, D. (2006). Biodiversity and the military in botswana.Armed Forces & Society, 32(2),
273-291.
Hillbom, E. (2008). Diamonds or development? a structural assessment of botswana's forty
years of success. Journal of Modern African Studies,46 (2), 191-214.
Hjort, J. (2010). Pre-colonial culture, post-colonial economic success? the tswana and the
African economic miracle. Economic History Review,63(3), 688-709.
Hjort, J. (2006). Citizen funds and dutch disease in developing countries. Resources
Policy, 31, 183–191.
IMF. (2012, October). World economic outlook database.
Lange, G. (2004). Wealth, natural capital, and sustainable development: Contrasting
examples from botswana and namibia. Environmental & Resource Economics, 29, 257–283.
Leith, J. C. (2005). Why Botswana prospered . McGill-Queen's University Press.
Leith, J. C. (2000, June). Why Botswana prospered. ,University of British Columbia.
Mathuba, B. Ministry of Lands and Housing, (2003). Botswana land policy
Ministry of Finance and Development Planning, (2013). 2013 budget speech. Gaborone:
Government Printing and Publishing Services.
Montesquieu, C. (1989). Montesquieu: The spirit of the laws. Cambridge University Press.
[Originally published 1748]
Morapedi, W. (2010). Demise or resilience? customary law and chieftaincy in twenty-first
century botswana.Journal of Contemporary African Studies, 28(2), 215-230.

CE
UeT
DC
olle
ctio
n
51
Ministry of Finance and Development Planning. Ministry of Finance and Development
Planning, (2008). Budget speech. Gaborone: Government Printer. Ministry of Finance and
Development Planning.
Ministry of Finance and Development Planning, (2013). 2013 budget speech. Gaborone:
Government Printing and Publishing Services.
Olsson, O., Hibbs, D., & , (2005). Biogeography and long-run economic
development. European Economic Review,49, 909 – 938.
O'Toole, G. (2007). Politics latin america. (1 ed.). London: Pearson.
Pegg, S. (2010). Is there a dutch disease in botswana?.Resources Policy, 35, 14–19.
Poteete, A. (2009). Is development path dependent or political? a reinterpretation of mineral-
dependent development in botswana. Journal of Development Studies, 45(4), 544–571.
Przeworski, A. (2004). The last instance: are institutions the primary
cause of economic development?.European Journal of Sociology, 45(2), 165 188.
Knutsen, C. (2010). Investigating the lee thesis: how bad is democracy for Asian
economies?. European Political Science Review, 451–473.
Knutsen, C. (2011). Security threats, enemy-contingent policies, and economic development
in dictatorships. International Interactions: Empirical and Theoretical Research in
International Relations, 414-440.
Ravenhill, John (2005) Global Political Economy. Oxford: Oxford University Press.
Rodrik, D. (2003). In search of prosperity: Analytic naratives on economic growth.
Princeton: Princeton University Press.
Rodrik, D. (2000). Institutions for high-quality growth: What they are and how to acquire
them. Studies in Comparative International Development, 3-31.
Rodrik, D., Subramanian, A., & Trebbi, F. (2004). Institutions rule: The primacy of
institutions over geography and integration in economic development. Journal of Economic
Growth, 131-165.
Sachs, J. (2003). Institutions matter, but not for everything the role of geography and resource
endowments in development shouldn’t be underestimated. Finance & Development
Sachs, J. (2001). Tropical underdevelopment. National Bureau of Economic Research,
Sen, A. (1999). Development and freedom. Oxford: Oxford University Press.
Statistician General Central Statistics Office, (2013). Gross domestic product: Fourth quarter
of 2012 (No: 2013/5). Gaborone:

CE
UeT
DC
olle
ctio
n
52
Smith, A. (1863). An inquiry into the nature and causes of the wealth of nations. Edinburgh:
Adam and Charles Black.
Tebaldi, E., & Elmslie, B. (2008). Institutions, innovation and economic growth. Journal of
Economic Development, 27-53.
Ulriksen, M. (2012). Welfare policy expansion in botswana and mauritius: Explaining the
causes of different welfare regime paths. Comparative Political Studies, 45(12), 1483– 1509.
World Bank. (2013). World development indicators. World Bank.

CE
UeT
DC
olle
ctio
n
53
Appendix
Table 5 Botswana Comparisons: Population, GDP per capita, and real growth of
GDP per capita 1966-1999
Country 1999
Population
(thousands)
1999
GDP/Cap
US$
11 Year
Growth
Rate
22 Year
Growth
Rate
33 Year
Growth
Rate
Botswana 1,610 3,124 4.0% 5.1% 7.0%
Chile 15,020 4,505 5.2% 3.5% 2.1%
China 1,266,840 782 8.0% na na
Hong Kong 6,840 23, 247 1.8% 3.9% 4.6%
Indonesia 209, 260 654 2.7% 3.1% 3.8%
Ireland* 3,750 19,644 5.9% 4.2% 4.1%
Korea 46,860 8,684 5.1% 5.7% 6.1%
Lesotho 2,110 437 2.5% na na
Malaysia 22,710 3,467 4.4% na na
Singapore 3,890 21,837 4.8% 5.0% 6.2%
Thailand 61,810 2,006 4.4% 4.7% 4.6%
Trinidad &
T*
1,290 4,701 1.3% -0.1% 0.8%
Source: Leith (2005)
Notes: US $ GDP per capita calculated current price GDP, converted at average exchange
rate for 1999. Botswana GDP data are for national account years ending 30 June.
*Latest data for GDP data is 1998, hence growth rates are 10 year, 21 year, and 32 year to
1998
Table 6 Botswana Comparisons Real Growth of GDP per capita, 1966 to 1996
Country 1996
Population
1996
GDP/Cap
US$
10 Year
Growth
Rate
20 Year
Growth
Rate
30 Year
Growth
Rate
Botswana 1 490 000 3 296 4.9% 5.2% 8.2%
Chile 14 420 000 4 800 6.2% 4.0% 2.8%
China 1 221 500
000
683 8.7% na na
Hong Kong 6 190 000 24 898 4.6% 5.3% 6.0%
Indonesia 198 340 000 1 146 5.2% 4.5% 5.7%
Ireland 3 520 000 19 526 5.8% 4.3% 4.5%
Korea 45 540 000 10 641 7.2% 6.8% 7.7%
Lesotho* 2 050 000 420 4.9% na na
Malaysia 21 170 000 4 690 5.6% 4.3% na
Singapore 3 040 000 30 942 7.0% 6.4% 7.8%
Thailand 60 000 000 3 007 8.0% 6.1% 6.4%
Trinidad & T 1 310 000 4 177 -0.8% -0.4% 0.8% Source: Leith (2000)
Notes:
* Latest population is for 1995

CE
UeT
DC
olle
ctio
n
54
US$ GDP per capita calculated using latest available current price GDP, converted at average
exchange
rate for 1996.
Botswana GDP data are averaged over adjoining national account years ending June 30, to yield
calendar year.
Table 7 Number of Seats by Political Party, 1965-1999
Political
Party
1965 1969 1974 1979 1984 1989 1994 1999
Botswana
Democratic
Party
(BDP)
28 24 27 29 28 31 31 37
Botswana
National
Front
(BNF)
______ 3 2 2 5 3 13 6
Botswana
People’s
Party
(BPP)
3 3 2 1 1 0 0 0
Others* 0 1 1 0 0 0 0 1
Total 31 31 32 32 34 34 44 44 Source: (Molutsi in Gyimah-Boadi, 2004)
Note: * In 1969 and 1974 the one Member of Parliament belonged to the Botswana Independent
Party. In 1999, the one Member of Parliament belonged to the Botswana Congress Party; a breakaway
party from the BNF.

CE
UeT
DC
olle
ctio
n
55
Figure 4 Southern Africa in the 1970s
Source: Henk (2006)
Figure 5 Map of Botswana in 2013
Source: CIA (2013)

CE
UeT
DC
olle
ctio
n
56
Table 8 Sub-Saharan Africa GDP (PPP) per Capita (USD) (2000-2005)
Country 2000 2001 2002 2003 2004 2005
Angola 2,243.93 2,299.36 2,599.98 2,664.40 2,953.53 3,328.61
Benin 1,151.69 1,212.81 1,247.00 1,281.59 1,314.40 1,371.34
Botswana 8,840.23 9,251.13 10,127.49 10,868.83 12,269.87 12,513.13
Burkina Faso 813.916 862.479 888.804 950.542 928.439 1,013.86
Burundi 407.109 402.925 404.117 411.06 453.083 470.358
Cameroon 1,723.64 1,791.99 1,816.98 1,877.41 1,943.57 1,953.66
Cape Verde 2,029.12 2,174.51 2,284.94 2,401.41 2,357.34 2,602.59
Central
African
Republic 650.938 656.511 650.135 604.585 627.745 657.923
Chad 886.627 987.67 1,062.33 1,136.78 1,513.37 1,648.44
Comoros 973.869 1,007.57 1,044.13 1,069.68 1,072.60 1,128.00
Democratic
Republic of
the Congo 213.198 213.438 217.88 228.491 242.749 261.694
Republic of
Congo 2,889.92 2,981.15 3,078.93 3,079.93 3,472.81 3,566.12
Côte d'Ivoire 1,600.27 1,606.41 1,580.28 1,562.34 1,551.03 1,580.16
Equatorial
Guinea 4,156.61 6,435.88 7,592.78 8,585.36 12,125.22 13,251.95
Eritrea 755.077 807.808 811.151 772.833 788.526 751.395
Ethiopia 475.141 508.289 511.374 498.032 560.329 632.685
Gabon 12,105.14 12,336.37 12,195.71 12,450.63 12,633.84 13,081.16
The Gambia 1,427.77 1,492.77 1,420.36 1,501.42 1,571.10 1,558.62
Ghana 1,442.97 1,503.50 1,559.09 1,631.55 1,928.18 2,030.02
Guinea 865.949 901.534 936.658 949.938 936.172 952.001
Guinea-
Bissau 926.253 943.047 922.407 922.226 923.23 944.249
Kenya 1,216.88 1,270.91 1,268.53 1,304.45 1,335.42 1,398.70
Lesotho 999.52 1,052.06 1,082.61 1,135.42 1,203.51 1,275.95
Liberia 500.243 508.348 528.76 381.563 437.838 446.65
Madagascar 762.906 803.211 694.804 757.162 795.425 833.419
Malawi 558.272 535.112 532.719 561.509 606.484 605.55
Mali 654.084 726.018 746.33 795.006 853.584 914.729
Mauritius 8,476.01 8,803.50 9,017.61 9,500.93 10,185.54 10,488.79
Mozambique 474.896 533.67 580.583 619.385 663.574 711.282
Namibia 4,064.39 4,200.56 4,400.68 4,607.67 5,168.87 5,532.25
Niger 488.547 523.525 543.548 576.268 580.83 624.172
Nigeria 1,129.75 1,216.12 1,457.40 1,597.86 1,773.31 1,795.50
Rwanda 566.508 601.585 673.413 691.171 758.609 855.685
São Tomé and
Príncipe 1,112.47 1,152.08 1,174.94 1,260.75 1,354.57 1,534.10
Senegal 1,385.78 1,443.59 1,437.63 1,524.18 1,581.57 1,678.70
Seychelles 14,096.10 14,074.93 14,210.12 13,645.23 16,714.65 18,356.78
Sierra Leone 506.101 592.027 732.346 785.554 802.099 857.766
South Africa 6,643.11 6,900.04 7,187.79 7,478.36 7,999.87 8,653.71
Swaziland 3,567.11 3,640.67 3,736.07 3,937.28 4,110.61 4,336.25
Tanzania 780.663 824.111 879.599 941.224 1,004.95 1,076.12
Togo 785.823 767.136 751.119 783.922 797.602 864.904
Uganda 770.922 817.356 865.245 912.193 963.277 971.315
Zambia 909.12 951.796 976.706 1,025.30 1,084.08 1,130.41
Zimbabwe 866.476 904.386 832.665 699.083 308.406 473.674
Source: IMF World Economic Outlook Database (October 2012)

CE
UeT
DC
olle
ctio
n
57
Table 9 Sub-Saharan Africa GDP (PPP) per Capita (USD) (2006-2012)
Country 2006 2007 2008 2009 2010 2011 2012
Angola 4,034.31 4,954.20 5,614.74 5,650.77 5,748.94 5,923.85 6,244.13
Benin 1,424.37 1,487.97 1,550.78 1,559.98 1,575.70 1,620.37 1,658.02
Botswana 13,471.56 14,343.67 14,920.27 14,167.56 15,183.79 16,105.21 16,792.93
Burkina Faso 1,079.81 1,122.98 1,179.04 1,188.62 1,261.22 1,302.26 1,384.18
Burundi 501.668 530.324 556.104 566.804 582.152 604.964 625.593
Cameroon 2,025.07 2,095.66 2,137.09 2,138.42 2,176.01 2,259.26 2,345.29
Cape Verde 2,915.08 3,212.32 3,438.44 3,547.84 3,730.33 3,947.20 4,126.22
Central
African
Republic 691.168 723.076 739.113 731.335 744.723 766.535 791.166
Chad 1,662.72 1,672.28 1,695.22 1,648.25 1,841.12 1,866.81 1,986.44
Comoros 1,154.66 1,169.45 1,182.21 1,189.13 1,204.44 1,231.65 1,255.98
Democratic
Republic of
the Congo 276.92 293.968 309.692 311.889 328.865 348.527 368.337
Republic of
Congo 3,800.70 3,740.62 3,922.88 4,132.77 4,426.16 4,543.38 4,708.44
Côte d'Ivoire 1,595.26 1,618.99 1,644.13 1,670.53 1,682.90 1,589.81 1,696.15
Equatorial
Guinea 13,462.09 16,347.50 17,974.75 18,430.02 18,056.80 19,320.55 20,163.61
Eritrea 741.977 749.072 669.4 680.181 683.082 735.459 779.617
Ethiopia 709.795 795.587 881.054 953.191 1,018.75 1,092.28 1,159.92
Gabon 13,329.39 14,125.57 14,559.22 14,271.65 15,197.50 16,313.29 17,338.98
The Gambia 1,575.71 1,639.10 1,735.57 1,818.30 1,892.72 1,943.40 1,891.76
Ghana 2,168.44 2,316.29 2,503.29 2,560.45 2,732.61 3,112.88 3,336.98
Guinea 986.846 1,011.49 1,060.92 1,041.14 1,049.25 1,086.34 1,128.63
Guinea-
Bissau 972.937 1,010.34 1,042.74 1,059.60 1,086.95 1,144.05 1,105.55
Kenya 1,490.41 1,592.98 1,604.91 1,614.61 1,680.77 1,740.58 1,806.82
Lesotho 1,438.25 1,539.78 1,637.38 1,702.97 1,802.74 1,918.23 2,018.08
Liberia 483.114 536.858 554.269 564.748 582.626 627.326 677.249
Madagascar 879.205 935.571 997.537 939.725 931.791 944.47 953.785
Malawi 620.377 679.751 732.148 782.719 821.345 850.819 876.712
Mali 963.454 1,002.46 1,043.03 1,065.86 1,108.75 1,128.04 1,061.75
Mauritius 11,231.12 12,118.31 13,029.33 13,470.52 14,152.03 14,961.51 15,621.60
Mozambique 782.369 846.76 906.534 953.291 1,014.19 1,089.85 1,167.30
Namibia 6,007.48 6,398.79 6,639.78 6,548.39 7,015.65 7,451.19 7,813.62
Niger 661.256 680.75 739.635 717.095 760.951 771.068 869.937
Nigeria 1,915.90 2,052.49 2,164.04 2,272.34 2,419.82 2,582.18 2,734.63
Rwanda 947.771 1,007.92 1,122.02 1,154.43 1,228.51 1,334.31 1,430.40
São Tomé
and Príncipe 1,756.87 1,815.90 1,993.07 2,057.05 2,140.62 2,251.73 2,344.70
Senegal 1,727.97 1,816.62 1,874.25 1,878.59 1,930.09 1,969.96 1,925.30
Seychelles 20,205.91 22,729.54 22,494.12 22,719.36 23,891.46 25,356.68 26,243.07
Sierra Leone 895.396 967.452 1,016.35 1,032.05 1,073.20 1,132.49 1,360.58
South Africa 9,333.84 9,933.76 10,403.63 10,217.46 10,540.87 10,970.31 11,302.21
Swaziland 4,553.71 4,758.69 4,940.26 4,969.47 5,156.34 5,300.69 5,251.36
Tanzania 1,164.01 1,258.23 1,354.69 1,420.38 1,510.53 1,610.02 1,708.49
Togo 906.109 930.221 949.455 970.35 1,000.40 1,048.17 1,094.46
Uganda 1,062.82 1,149.18 1,224.54 1,279.33 1,331.69 1,384.53 1,419.17
Zambia 1,210.60 1,291.19 1,360.99 1,425.19 1,516.53 1,610.70 1,700.70
Zimbabwe 472.621 466.835 387.019 414.869 460.857 514.821 549.439
Source: IMF World Economic Outlook Database (October 2012)

CE
UeT
DC
olle
ctio
n
58
Table 10 Former British Colonies in Africa GDP (PPP) per Capita (USD)(2000-
2012)
Count
ry 2000 2001 2002 2003 2004 2005 2006 2007 2008 2009 2010 2011 2012
Botsw
ana
8,84
0.23
9,25
1.13
10,12
7.49
10,86
8.83
12,26
9.87
12,51
3.13
13,47
1.56
14,34
3.67
14,92
0.27
14,16
7.56
15,18
3.79
16,10
5.21
16,79
2.93
The
Gamb
ia
1,42
7.77
1,49
2.77
1,420.
36
1,501.
42
1,571.
10
1,558.
62
1,575.
71
1,639.
10
1,735.
57
1,818.
30
1,892.
72
1,943.
40
1,891.
76
Ghana
1,44
2.97
1,50
3.50
1,559.
09
1,631.
55
1,928.
18
2,030.
02
2,168.
44
2,316.
29
2,503.
29
2,560.
45
2,732.
61
3,112.
88
3,336.
98
Kenya
1,21
6.88
1,27
0.91
1,268.
53
1,304.
45
1,335.
42
1,398.
70
1,490.
41
1,592.
98
1,604.
91
1,614.
61
1,680.
77
1,740.
58
1,806.
82
Lesot
ho
999.
52
1,05
2.06
1,082.
61
1,135.
42
1,203.
51
1,275.
95
1,438.
25
1,539.
78
1,637.
38
1,702.
97
1,802.
74
1,918.
23
2,018.
08
Mala
wi
558.
272
535.
112
532.7
19
561.5
09
606.4
84
605.5
5
620.3
77
679.7
51
732.1
48
782.7
19
821.3
45
850.8
19
876.7
12
Mauri
tius
8,47
6.01
8,80
3.50
9,017.
61
9,500.
93
10,18
5.54
10,48
8.79
11,23
1.12
12,11
8.31
13,02
9.33
13,47
0.52
14,15
2.03
14,96
1.51
15,62
1.60
Nigeri
a
1,12
9.75
1,21
6.12
1,457.
40
1,597.
86
1,773.
31
1,795.
50
1,915.
90
2,052.
49
2,164.
04
2,272.
34
2,419.
82
2,582.
18
2,734.
63
Sierra
Leone
506.
101
592.
027
732.3
46
785.5
54
802.0
99
857.7
66
895.3
96
967.4
52
1,016.
35
1,032.
05
1,073.
20
1,132.
49
1,360.
58
Sudan
1,28
4.51
1,37
6.63
1,446.
99
1,551.
96
1,627.
74
1,699.
93
1,913.
97
2,154.
41
2,194.
89
2,257.
11
2,277.
52
2,729.
86
2,400.
17
Swazi
land
3,56
7.11
3,64
0.67
3,736.
07
3,937.
28
4,110.
61
4,336.
25
4,553.
71
4,758.
69
4,940.
26
4,969.
47
5,156.
34
5,300.
69
5,251.
36
Tanza
nia
780.
663
824.
111
879.5
99
941.2
24
1,004.
95
1,076.
12
1,164.
01
1,258.
23
1,354.
69
1,420.
38
1,510.
53
1,610.
02
1,708.
49
Ugan
da
770.
922
817.
356
865.2
45
912.1
93
963.2
77
971.3
15
1,062.
82
1,149.
18
1,224.
54
1,279.
33
1,331.
69
1,384.
53
1,419.
17
Zambi
a
909.
12
951.
796
976.7
06
1,025.
30
1,084.
08
1,130.
41
1,210.
60
1,291.
19
1,360.
99
1,425.
19
1,516.
53
1,610.
70
1,700.
70
Source: IMF World Economic Outlook Database (October 2012)

CE
UeT
DC
olle
ctio
n
59
Figure 6 GDP Composition by Sector 2002, 2007 & 2012
Source: Statistician General (2013)
Table 11 GDP Composition by Sector 1995-2002
Year 1995 1996 1997 1998 1999 2000 2001 2002
Agriculture 4.6 3.7 3.5 3.2 3 2.8 2.6 2.4
Mining 30.3 32.1 32.3 29.3 31.5 33.9 32.5 29.3
Manufacturing 5.3 5.6 5.7 6.2 5.6 5.6 5.8 6.1
Water & Electricity 2.1 1.8 1.8 2 1.9 1.7 1.8 2
Construction 6.2 5.9 5.9 6 5.9 5 4.7 6.6
Trade, Hotels & Restaurants 9.7 10.7 9.9 10.3 10.8 10.1 10.7 11.9
Transport & Communication 3.7 3.2 3.4 3.5 3.3 3.3 3.3 3.4
Finance & Business Services 13 12.6 11.5 12.2 10.9 11.1 12 12.5
General Gov 15.2 13.8 15.1 16 15.5 14.6 14.9 15
Social & Personal services 4.3 4 3.8 3.8 3.6 3.5 4 4.4
Taxes less Subsidies 5.5 6.5 7 7.5 8.1 8.4 7.7 6.4
Source: Statistician General (2013)
-5
0
5
10
15
20
25
30
2002
2007
2012

CE
UeT
DC
olle
ctio
n
60
Table 12 GDP Composition by Sector 2003-2012
Year 2003 2004 2005 2006 2007 2008 2009 2010 2011 2012
Agriculture 2.7 2.3 1.8 2 2.2 2.5 2.9 2.9 2.5 2.7
Mining 26.2 25.7 31.7 32.2 29.1 26.1 13.9 24.5 24.7 19.6
Manufacturing 5.7 5.6 4.9 5.3 6.3 5.6 6.4 5.9 5.8 5.9
Water & Electricity 2.1 1.9 1.4 1.3 1.1 0.9 0.4 0.4 0.2 -0.4
Construction 5.7 5.7 4.8 4.8 5.3 4.9 6.2 5.4 6 6.8
Trade, Hotels & Restaurants 12.9 12.2 10.8 11.9 12.3 13.2 15.4 14 14.7 15.3
Transport & Communication 3.4 3.4 3.6 3.8 4 4.4 5.5 4.8 4.9 5.7
Finance & Business Services 12.9 12.7 11.7 11.3 11.4 12.3 13.4 12.4 12.9 14.4
General Gov 15.3 14.6 14.2 13.2 13.2 14.4 17 14.3 13.8 15.1
Social & Personal services 4.7 5 5 5 4.8 5.1 6.4 5.6 5.6 6.2
Taxes less Subsidies 8.4 11 10 9.2 10.2 10.7 12.4 9.7 8.9 8.8
Source: Statistician General (2013)

CE
UeT
DC
olle
ctio
n
61