Embed Size (px)
Citation preview
Inst
itu
tio
nal
Res
ear
ch
THE CURIOUS CASE OF THE UNKNOWN RACE
Teresa WardSr. Research Associate
Charles GilbreathMeta Data Administrator
Bethann NorthupResearch Analyst II
Inst
itu
tio
nal
Res
earc
h
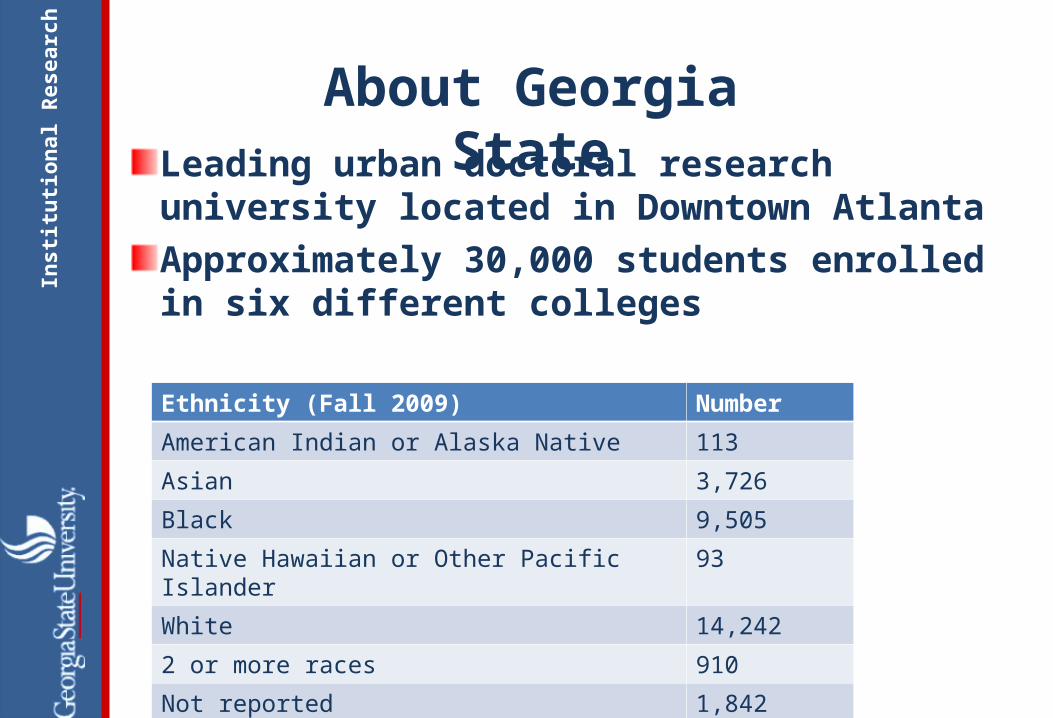
Leading urban doctoral research university located in Downtown AtlantaApproximately 30,000 students enrolled in six different collegesEthnicity (Fall 2009) Number
American Indian or Alaska Native 113
Asian 3,726
Black 9,505
Native Hawaiian or Other Pacific Islander 93
White 14,242
2 or more races 910
Not reported 1,842
About Georgia State
Inst
itu
tio
nal
Res
earc
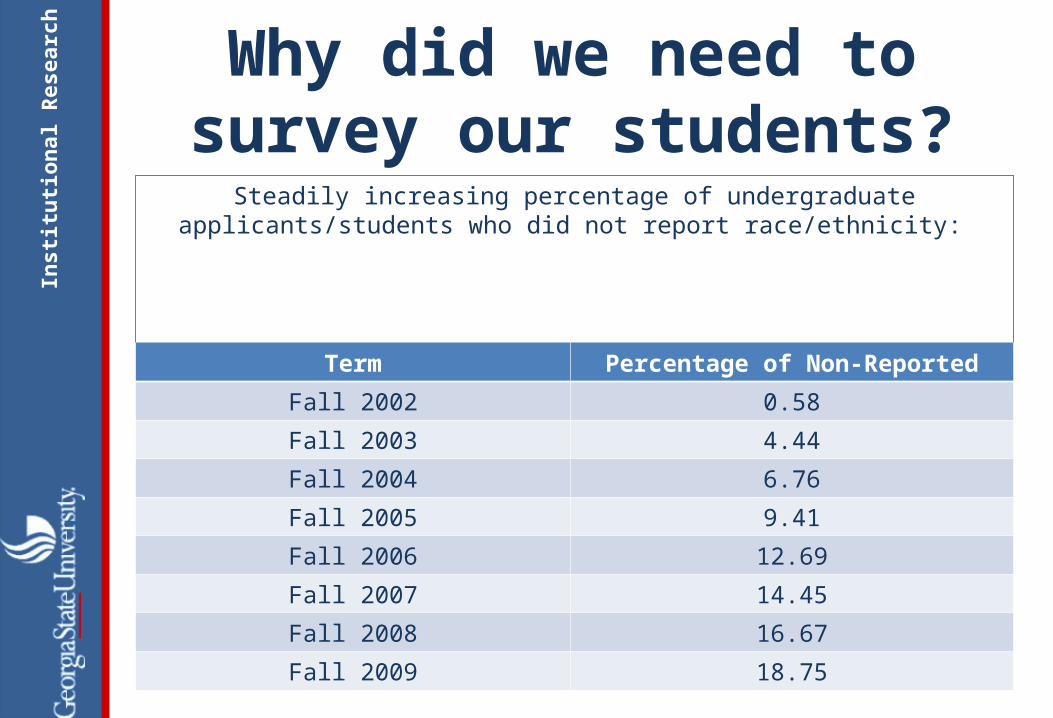
hWhy did we need to survey our
students?Steadily increasing percentage of undergraduate applicants/students who did not
report race/ethnicity:
Term Percentage of Non-Reported
Fall 2002 0.58
Fall 2003 4.44
Fall 2004 6.76
Fall 2005 9.41
Fall 2006 12.69
Fall 2007 14.45
Fall 2008 16.67
Fall 2009 18.75
Inst
itu
tio
nal
Res
earc
h
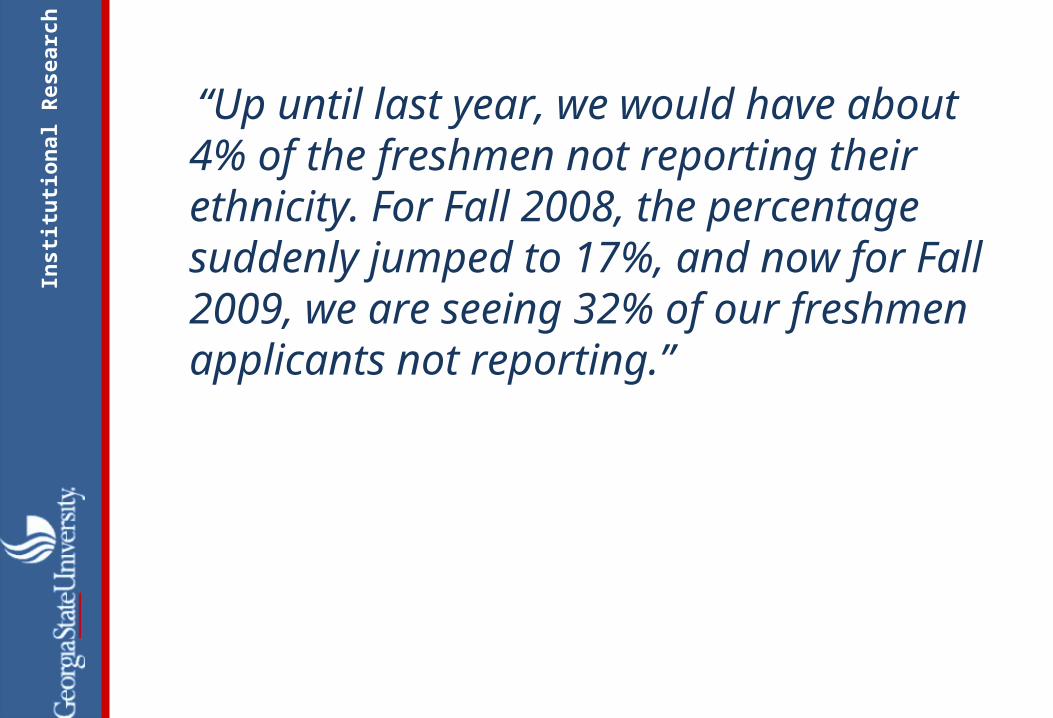
“Up until last year, we would have about 4% of the freshmen not reporting their ethnicity. For Fall 2008, the percentage suddenly jumped to 17%, and now for Fall 2009, we are seeing 32% of our freshmen applicants not reporting.”
Inst
itu
tio
nal
Res
earc
h
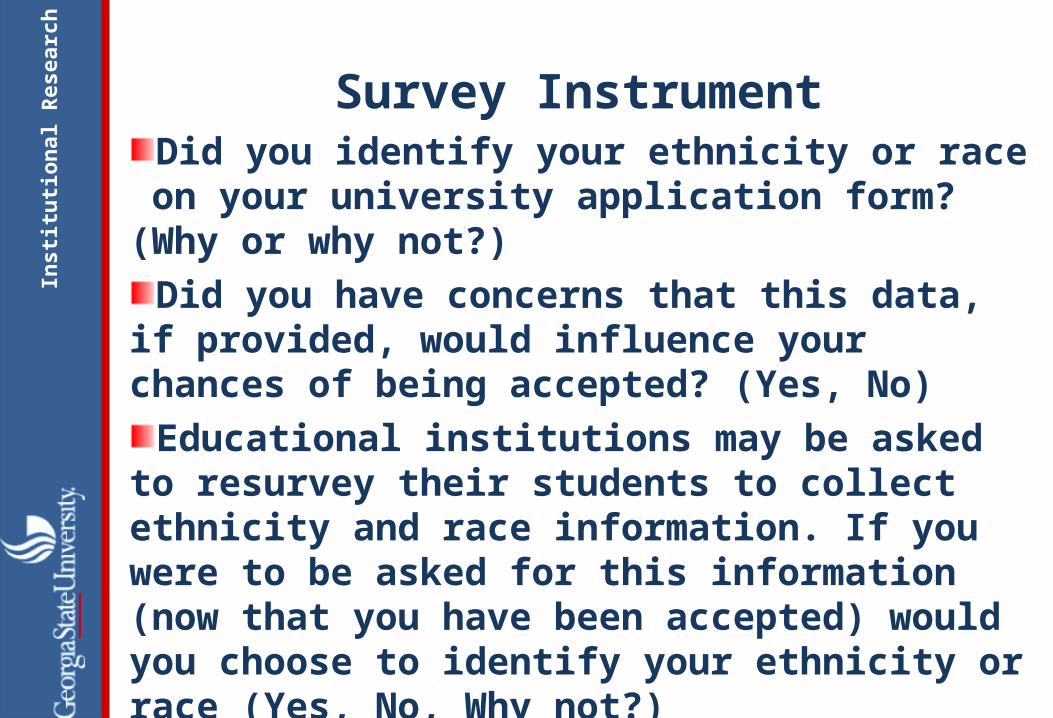
Survey InstrumentDid you identify your ethnicity or race on your
university application form? (Why or why not?)Did you have concerns that this data, if provided, would
influence your chances of being accepted? (Yes, No)Educational institutions may be asked to resurvey their
students to collect ethnicity and race information. If you were to be asked for this information (now that you have been accepted) would you choose to identify your ethnicity or race (Yes, No, Why not?)
How do you think colleges and universities use this data after the admissions process?
Inst
itu
tio
nal
Res
earc
h
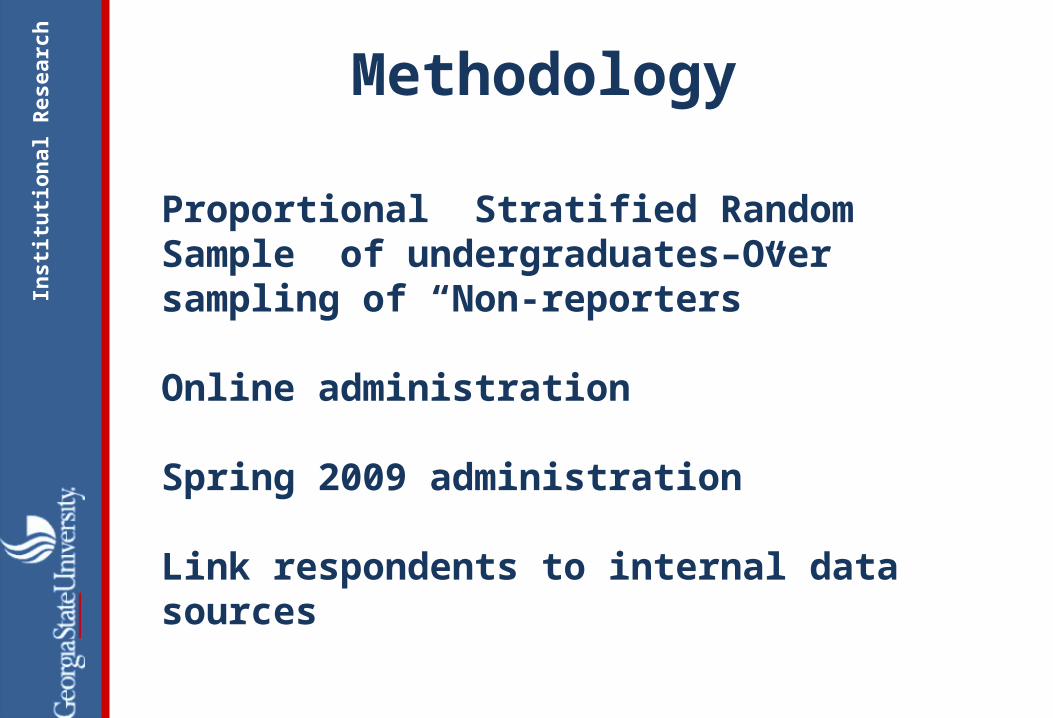
Proportional Stratified Random Sample of undergraduates–Over sampling of “Non-reporters”
Online administration
Spring 2009 administration
Link respondents to internal data sources
Methodology
Inst
itu
tio
nal
Res
earc
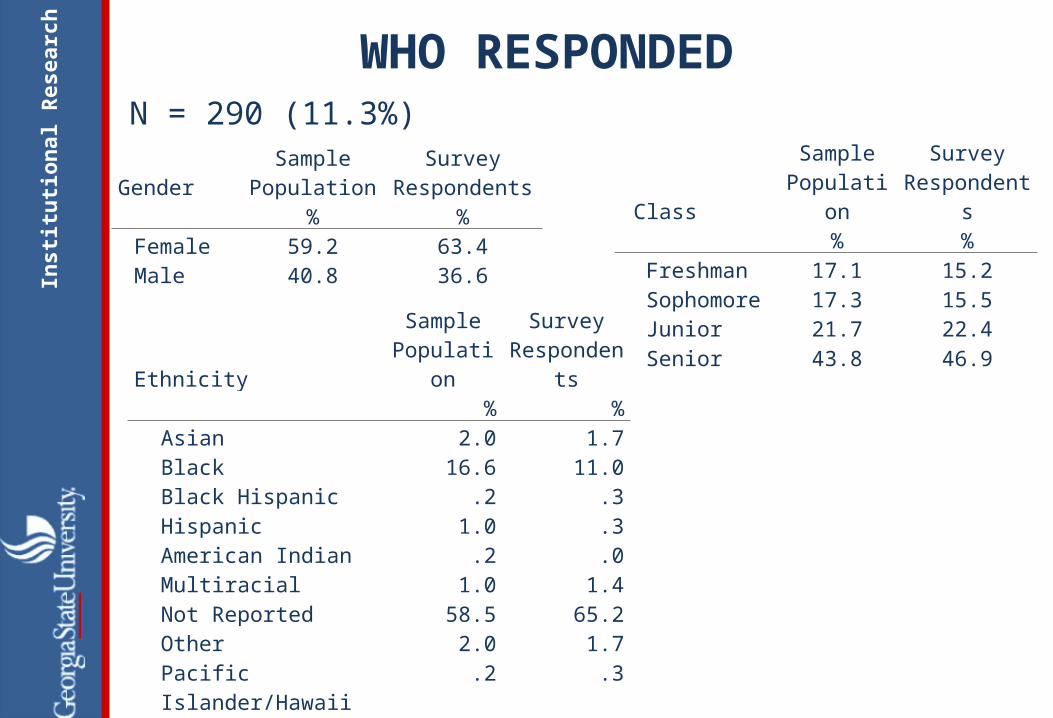
hWHO RESPONDED
N = 290 (11.3%)
ClassSample
PopulationSurvey
Respondents% %
Freshman 17.1 15.2 Sophomore 17.3 15.5 Junior 21.7 22.4 Senior 43.8 46.9
EthnicitySample
PopulationSurvey
Respondents % %
Asian 2.0 1.7 Black 16.6 11.0 Black Hispanic .2 .3 Hispanic 1.0 .3 American Indian .2 .0 Multiracial 1.0 1.4 Not Reported 58.5 65.2 Other 2.0 1.7 Pacific Islander/Hawaii .2 .3 White 18.4 17.9 White Hispanic .2 .0
GenderSample
PopulationSurvey
Respondents % %
Female 59.2 63.4 Male 40.8 36.6
Inst
itu
tio
nal
Res
earc
h
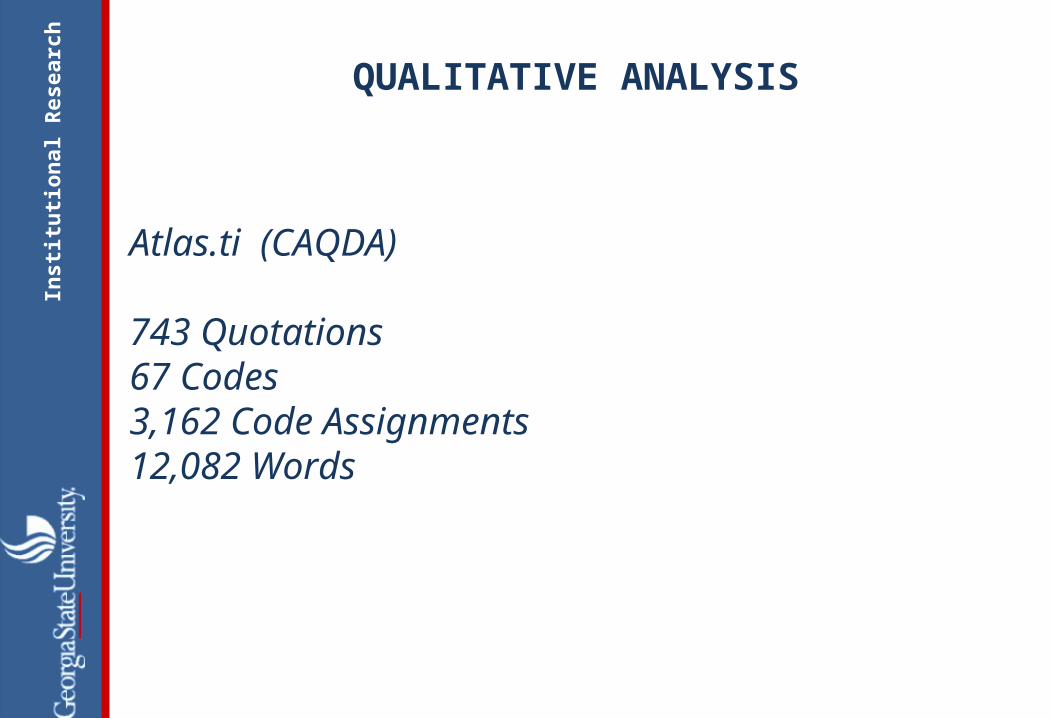
Atlas.ti (CAQDA)
743 Quotations67 Codes3,162 Code Assignments12,082 Words
QUALITATIVE ANALYSIS

Inst
itu
tio
nal
Res
earc
h
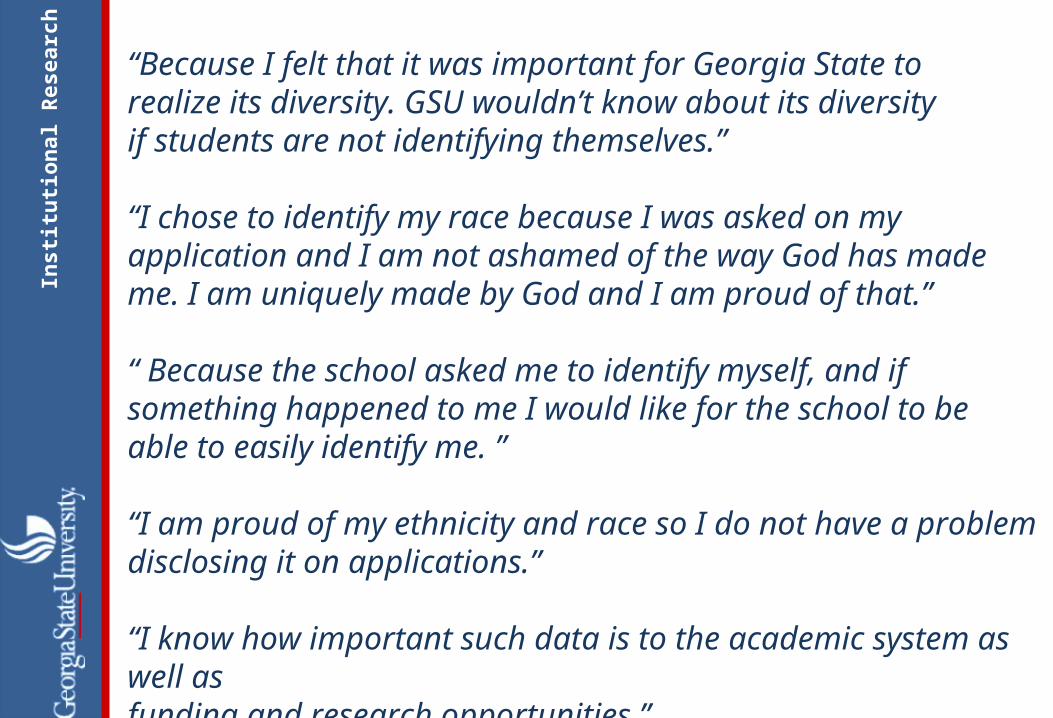
Did you identify your ethnicity or race on your university application form?
RESULTS
Survey N %
Yes 192 72.2
No 74 27.8
YIKES!
University Database
Yes No
N % N %
Asian 5 100.0 0 .0
Black
24 80.0 6 20.0
Black Hispanic 1 100.0 0 .0
Hispanic 1 100.0 0 .0
American Indian 0 .0 0 .0
Multiracial 2 50.0 2 50.0
Not Reported 113 66.9 56 33.1
Other 3 60.0 2 40.0
Pacific Islander/Hawaii
1 100.0 0 .0
White 42 84.0 8 16.0
White Hispanic 0 .0 0 .0
Inst
itu
tio
nal
Res
earc
h“Because I felt that it was important for Georgia State to realize its diversity. GSU wouldn’t know about its diversityif students are not identifying themselves.”
“I chose to identify my race because I was asked on myapplication and I am not ashamed of the way God has mademe. I am uniquely made by God and I am proud of that.”
“ Because the school asked me to identify myself, and ifsomething happened to me I would like for the school to be able to easily identify me. ”
“I am proud of my ethnicity and race so I do not have a problem disclosing it on applications.”
“I know how important such data is to the academic system as well asfunding and research opportunities.”

Inst
itu
tio
nal
Res
earc
h
Yikes!
Most of our “non-reported” group claimed that they did report ethnicity/race. Possible reasons for this inconsistency include:
Inaccurate memory on the part of studentsErrors in data entry (manual / automated)Problems with business practice
Inst
itu
tio
nal
Res
earc
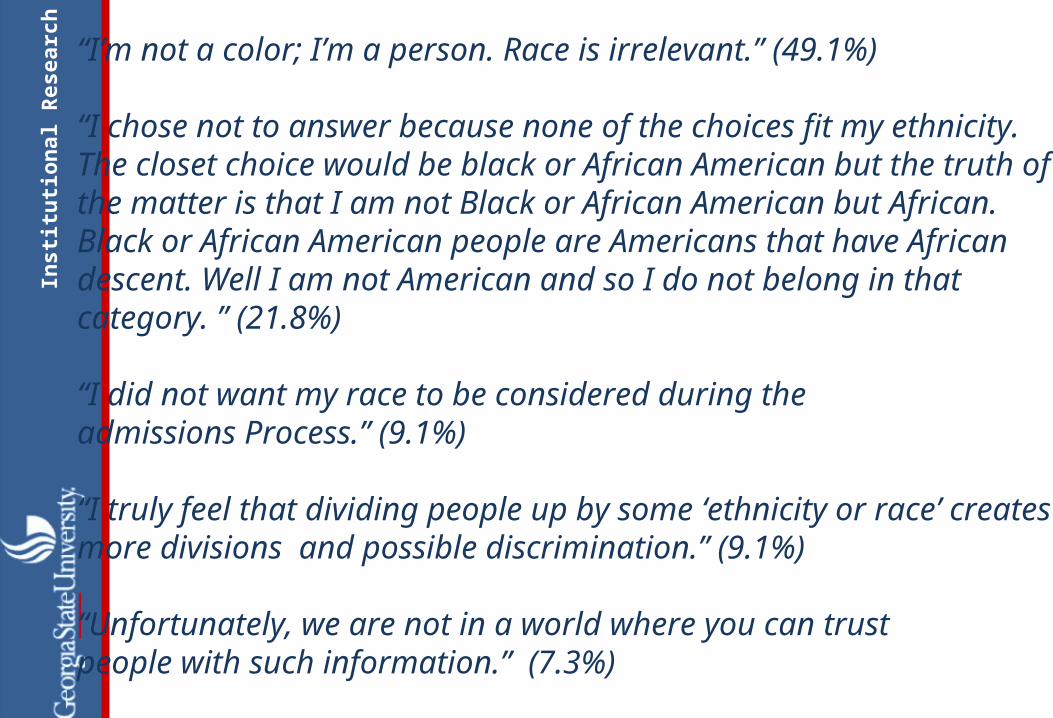
h“I’m not a color; I’m a person. Race is irrelevant.” (49.1%)
“I chose not to answer because none of the choices fit my ethnicity. The closet choice would be black or African American but the truth of the matter is that I am not Black or African American but African. Black or African American people are Americans that have African descent. Well I am not American and so I do not belong in that category. ” (21.8%)
“I did not want my race to be considered during the admissions Process.” (9.1%)
“I truly feel that dividing people up by some ‘ethnicity or race’ creates more divisions and possible discrimination.” (9.1%)
“Unfortunately, we are not in a world where you can trust people with such information.” (7.3%)

Inst
itu
tio
nal
Res
earc
h
Did you have concerns that this data, if provided, would influence your chances of being accepted?
A third (33.3%) answered “Yes.”
“On a subconscious level, it might effect an admissions officer’s choice to decline a minority applicant whose academics are on the fringe of acceptance.”
“I identify my race because I am a minority and I think that it could possibly help me in the long run.”
“Because I am not a minority I thought it may hinder it.”
“I believe schools want diversity, so they will ask students for their race, and accept students accordingly to that information.”
Inst
itu
tio
nal
Res
earc
h
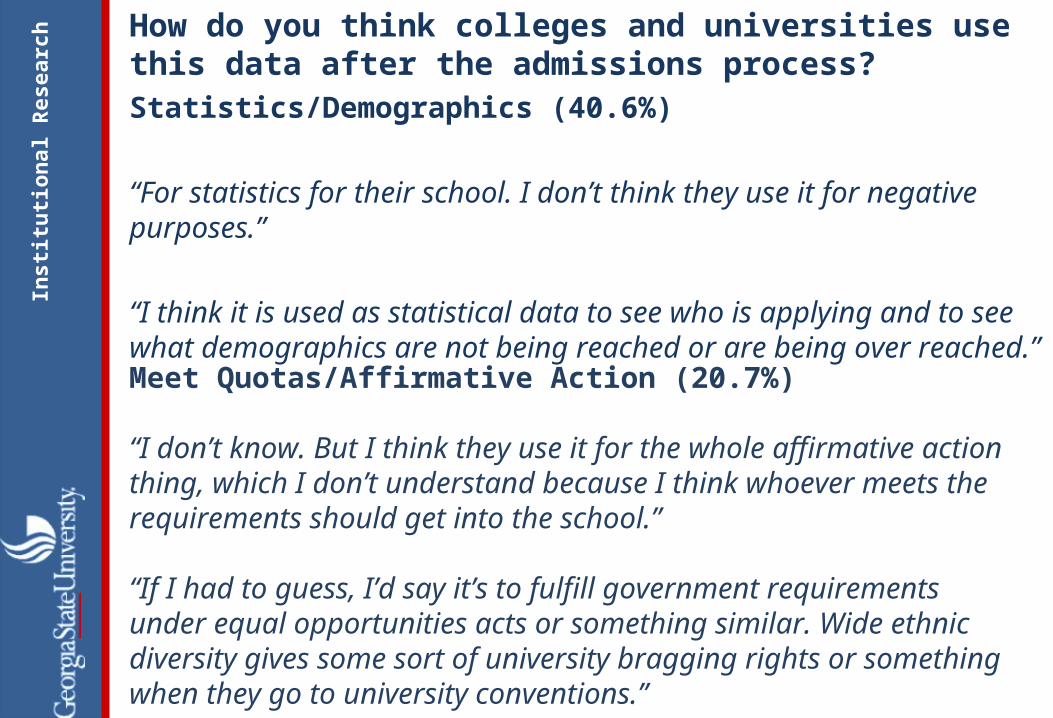
How do you think colleges and universities use this data after the admissions process?Statistics/Demographics (40.6%)
“For statistics for their school. I don’t think they use it for negative purposes.”
“I think it is used as statistical data to see who is applying and to see what demographics are not being reached or are being over reached.”
Meet Quotas/Affirmative Action (20.7%)
“I don’t know. But I think they use it for the whole affirmative action thing, which I don’t understand because I think whoever meets the requirements should get into the school.”
“If I had to guess, I’d say it’s to fulfill government requirements under equal opportunities acts or something similar. Wide ethnic diversity gives some sort of university bragging rights or something when they go to university conventions.”
Inst
itu
tio
nal
Res
earc
h
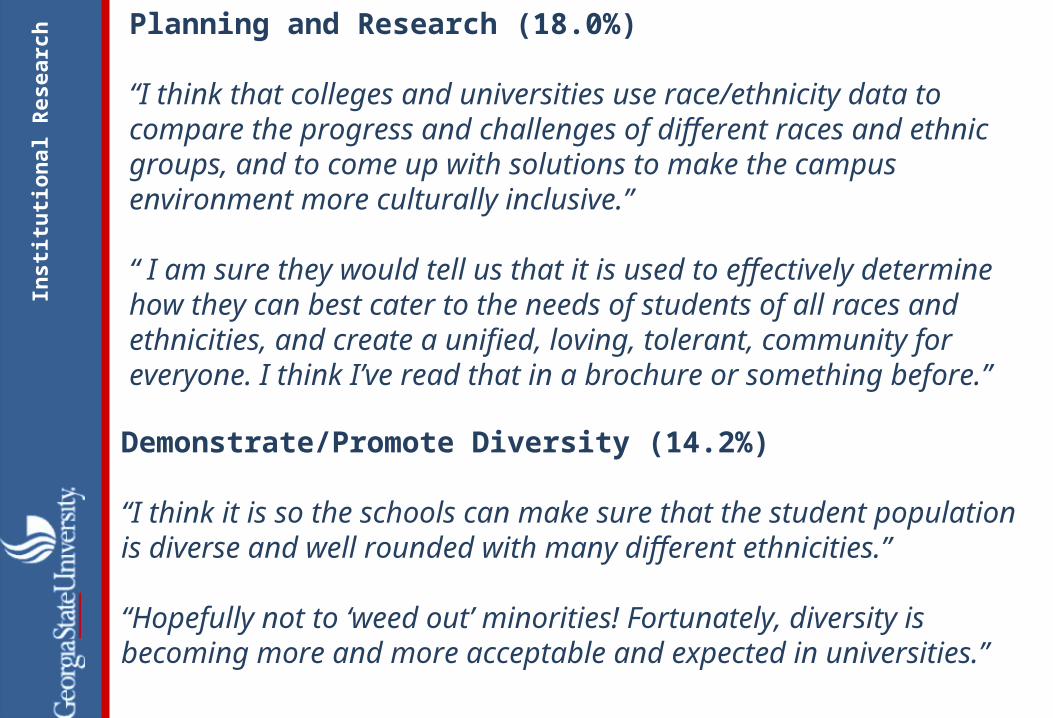
Planning and Research (18.0%)
“I think that colleges and universities use race/ethnicity data to compare the progress and challenges of different races and ethnic groups, and to come up with solutions to make the campus environment more culturally inclusive.”
“ I am sure they would tell us that it is used to effectively determine how they can best cater to the needs of students of all races and ethnicities, and create a unified, loving, tolerant, community for everyone. I think I’ve read that in a brochure or something before.”
Demonstrate/Promote Diversity (14.2%)
“I think it is so the schools can make sure that the student population is diverse and well rounded with many different ethnicities.”
“Hopefully not to ‘weed out’ minorities! Fortunately, diversity is becoming more and more acceptable and expected in universities.”
Inst
itu
tio
nal
Res
earc
h
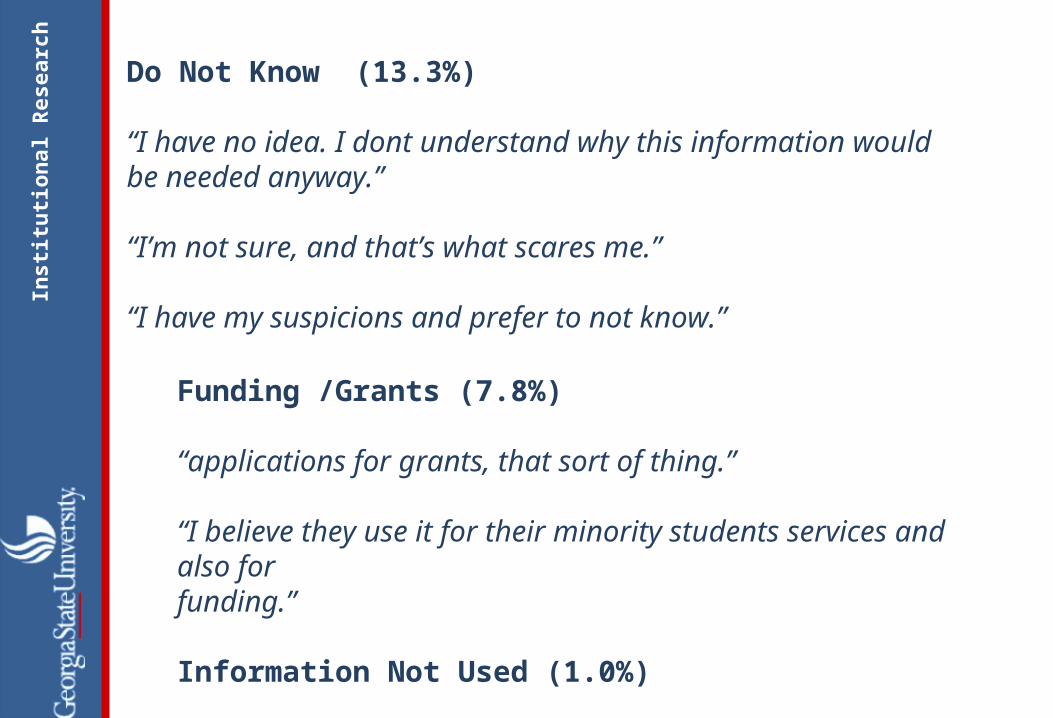
Do Not Know (13.3%) “I have no idea. I dont understand why this information would be needed anyway.”
“I’m not sure, and that’s what scares me.”
“I have my suspicions and prefer to not know.”
Funding /Grants (7.8%) “applications for grants, that sort of thing.”
“I believe they use it for their minority students services and also for funding.”
Information Not Used (1.0%)
Inst
itu
tio
nal
Res
earc
h
If you were to be asked for this information (now that you have been accepted) would you choose to identify your ethnicity or race?
Of the non-reporters who indicated that they DID NOT report their race/ethnicity, 64.9 percent indicated they would NOT identify.
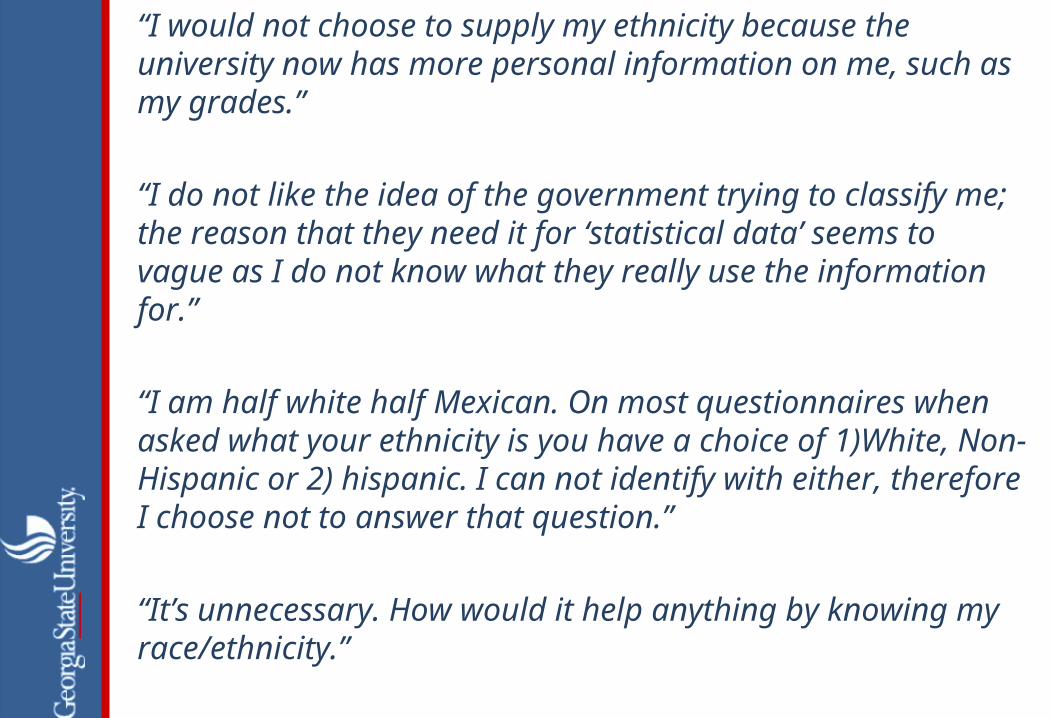
“I would not choose to supply my ethnicity because the university now has more personal information on me, such as my grades.”
“I do not like the idea of the government trying to classify me; the reason that they need it for ‘statistical data’ seems to vague as I do not know what they really use the information for.”
“I am half white half Mexican. On most questionnaires when asked what your ethnicity is you have a choice of 1)White, Non-Hispanic or 2) hispanic. I can not identify with either, therefore I choose not to answer that question.”
“It’s unnecessary. How would it help anything by knowing my race/ethnicity.”
“It shouldn’t matter at all….it’s incredibly sad that in our country stuff like this is still important. “
Inst
itu
tio
nal
Res
earc
h
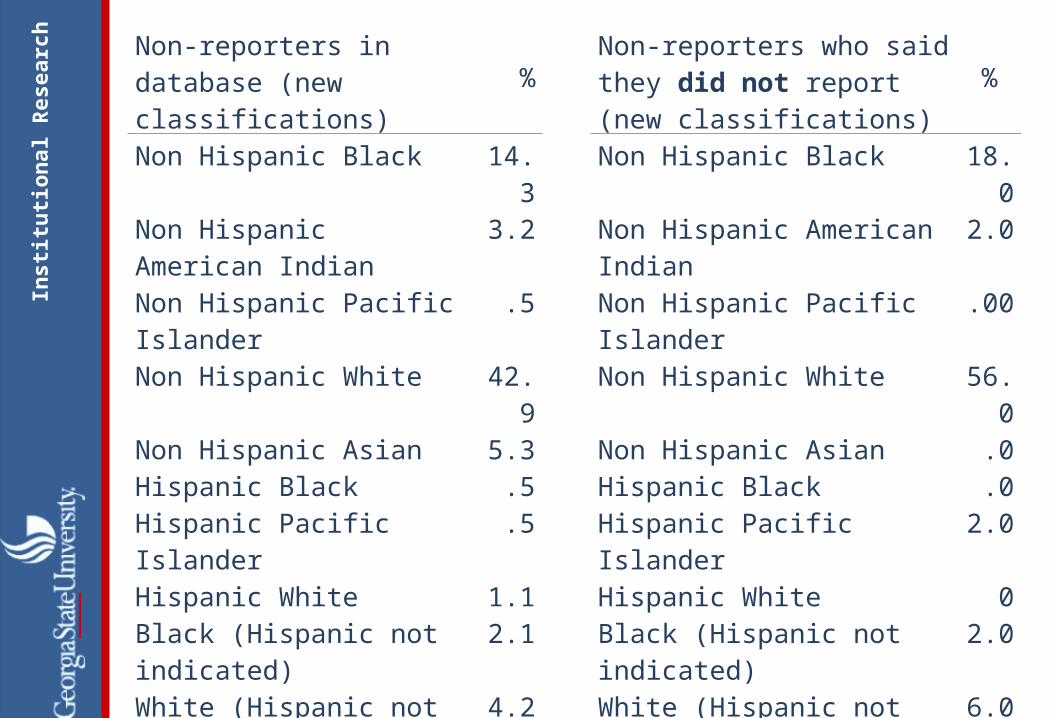
Non-reporters in database (new classifications) %
Non Hispanic Black 14.3Non Hispanic American Indian 3.2Non Hispanic Pacific Islander .5Non Hispanic White 42.9Non Hispanic Asian 5.3Hispanic Black .5Hispanic Pacific Islander .5Hispanic White 1.1Black (Hispanic not indicated) 2.1White (Hispanic not indicated)
4.2
BIPWZ 2.1Other Combinations 3.2Hispanic 2.6Not Hispanic 1.1Did not take the new survey 15.9
Non-reporters who said they did not report (new classifications)
%
Non Hispanic Black 18.0Non Hispanic American Indian 2.0Non Hispanic Pacific Islander .00Non Hispanic White 56.0Non Hispanic Asian .0Hispanic Black .0Hispanic Pacific Islander 2.0Hispanic White 0Black (Hispanic not indicated) 2.0White (Hispanic not indicated) 6.0BIPWZ 8.0Other Combinations 6.0
Inst
itu
tio
nal
Res
earc
h
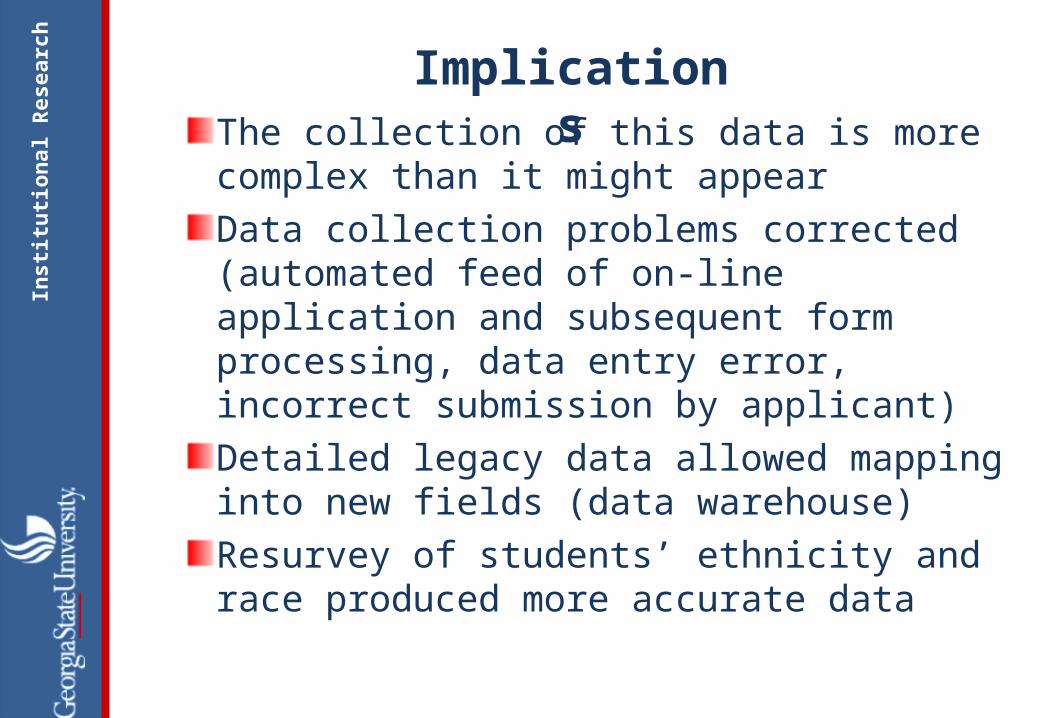
ImplicationsThe collection of this data is more complex than it might appearData collection problems corrected (automated feed of on-line application and subsequent form processing, data entry error, incorrect submission by applicant)Detailed legacy data allowed mapping into new fields (data warehouse)Resurvey of students’ ethnicity and race produced more accurate data
Inst
itu
tio
nal
Res
earc
h
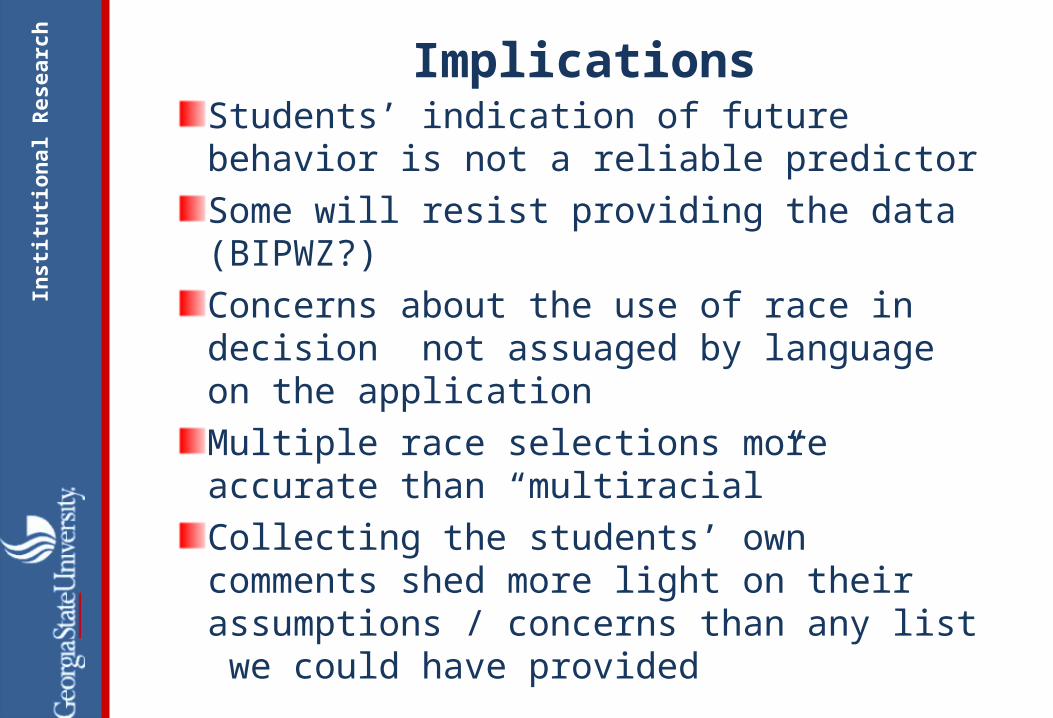
ImplicationsStudents’ indication of future behavior is not a reliable predictorSome will resist providing the data (BIPWZ?)Concerns about the use of race in decision not assuaged by language on the application Multiple race selections more accurate than “multiracial”Collecting the students’ own comments shed more light on their assumptions / concerns than any list we could have provided
Inst
itu
tio
nal
Res
earc
h
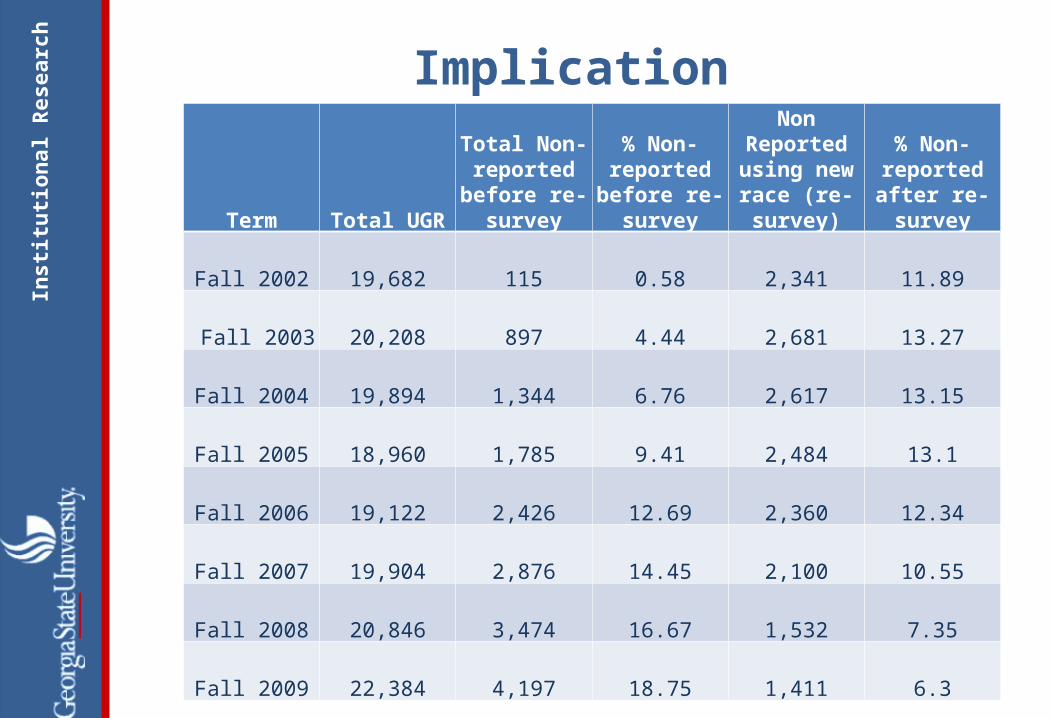
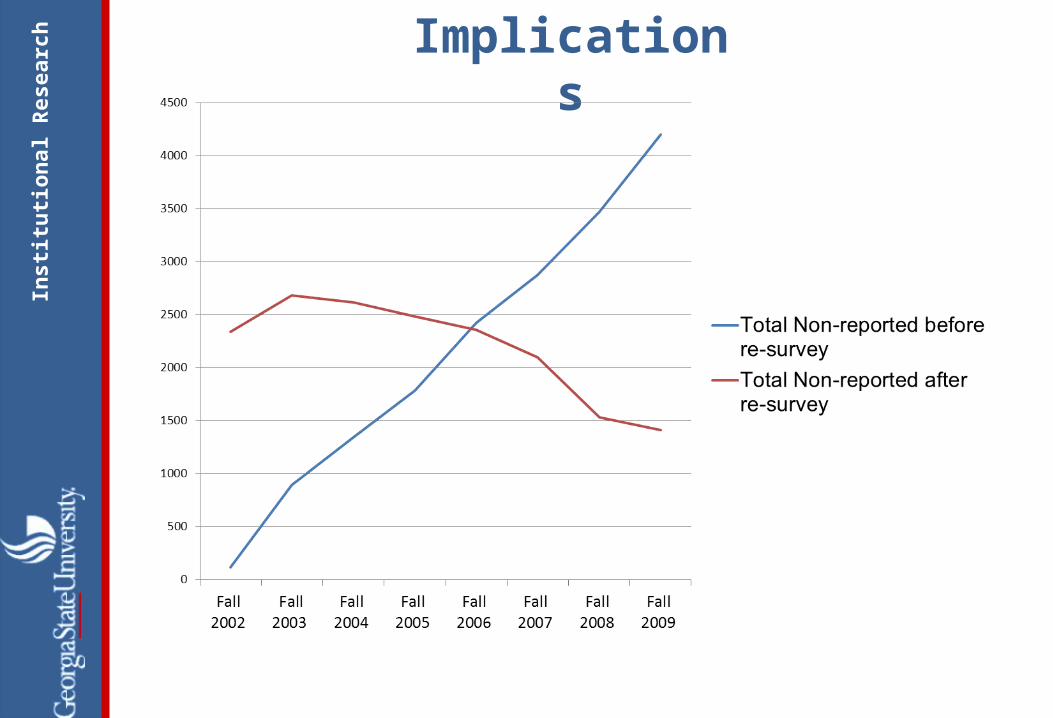
Implications
Term Total UGR
Total Non-reported before re-
survey
% Non-reported before re-
survey
Non Reported using new race (re-survey)
% Non-reported after re-survey
Fall 2002 19,682 115 0.58 2,341 11.89
Fall 2003 20,208 897 4.44 2,681 13.27
Fall 2004 19,894 1,344 6.76 2,617 13.15
Fall 2005 18,960 1,785 9.41 2,484 13.1
Fall 2006 19,122 2,426 12.69 2,360 12.34
Fall 2007 19,904 2,876 14.45 2,100 10.55
Fall 2008 20,846 3,474 16.67 1,532 7.35
Fall 2009 22,384 4,197 18.75 1,411 6.3
Inst
itu
tio
nal
Res
earc
h
Implications
Inst
itu
tio
nal
Res
earc
h
Teresa Ward, Ph.D. [email protected] Gilbreath, M.A. [email protected]
Office of Institutional Research http://www2.gsu.edu/~wwwire/
Georgia State UniversityMay, 2010