Embed Size (px)
Citation preview

Institutional Presentation June/2016
V2

Disclaimer
This release contains forward-looking statements that are exclusively related to the prospects of the business, its operating
and financial results, and prospects for growth. These data are merely projections and, as such, based exclusively on our
management's expectations for the future of the business and its continued access to capital to fund its business plan. These
forward-looking statements substantially depend on changing market conditions, government regulations, competitive
pressures, the performance of the Brazilian economy and the industry, among other factors, as well as the risks shown in our
filed disclosure documents, and are therefore subject to change without prior notice.
As a goal to maintain a correlation with the Financial Statements prepared by its external auditors, the considerations and
comments contained herein are prepared on a consolidated viewpoint of the economic group Hypermarcas, and not
necessarily individualized by the various legal entities that compose the group.
In addition, unaudited information herein reflects management's interpretation of information taken from its financial
statements and their respective adjustments, which were prepared in accordance with market practices and for the sole
purpose of a more detailed and specific analysis of our results. Therefore, these additional points and data must also be
analyzed and interpreted independently by shareholders and market agents, who should carry out their own analysis and
draw their own conclusions from the results reported herein. No data or interpretative analysis provided by our management
should be treated as a guarantee of future performance or results and are merely illustrative of our directors' vision of our
results.
Our management is not responsible for compliance or accuracy of the management financial data discussed in this report.
which must be considered as for informational purposes only, and should not override the analysis of our audited
consolidated financial statements for purposes of a decision to invest in our stock, or for any other purpose.
2

Agenda
• Overview
• Brazil Pharma Market
• Our Business
• Financials
3

Business overview
4
38% 30%
32%
Net Rev: R$3.0 bn
Gross Margin: 74.9%
Rankin
g
Key f
acts
Branded
Prescription
Generics
Consumer
Health
#1 Hypermarcas Aché EMS
#2 Sanofi Sanofi Hypermarcas
#3 Bayer Eurofarma Sanofi
#4 Boehringer Novartis Novartis
#5 Takeda Hypermarcas Teuto
1Q16 LTM
Revenue Breakdown Branded
Prescription¹
Consumer
Health
Generics²
Focus in Brazil Long experience
Fast growing/
resilient market Diversified portfolio
SOURCE: Company financials; IMS Health; Hypermarcas. ¹ Ex-patents. ² Generics includes Branded Generics.

Ownership and listings
¹ April 30, 2016 LTM
² April 28, 2016
³ April 31, 2016
SOURCE: BM&F Bovespa; Hypermarcas 5
Ownership structure Listings
• Sao Paulo Stock Exchange: - HYPE3
- BRHYPEACNOR0
• Indexes with Hypermarcas:
• Ibovespa Index Ranking³: 24/59
• Trade volume¹: 2.6 MM shares/day
• ADR (HYPMY)²: 7.6 MM shares outstanding
• Market Cap³: R$18 B (USD5 B)
20.1%
14.8%
6.0%
59.1%
Igarapava Participações S.A.
Maiorem S.A. de C.V
Other Controlling Shareholders
Free Float
Founder
Free Float
Maiorem
Others

Agenda
• Overview
• Brazil Pharma Market
• Our Business
• Financials
6

Pharma market
SOURCE: IMS Health 7
2014 Trends 2019
1st United States
2nd China
3rd Japan
4th Germany
5th France
6th USD24 bn
7th Italy
1st United States
2nd China
3rd Japan
4th Germany
5th USD36 bn
6th France
7th Italy
• Aging
• Underdeveloped health
system
• Treatments’ low levels
• Generics low
penetration of generics
(25% of market)
• Peak in economically
active population

Large and growing pharmaceutical market (R$ billion)
SOURCE: IMS Health – PPP (March 2016). 8
32.4
35.9
40.0
44.2
2012 2013 2014 2015
CAGR 2012-15: 10.9%

High entry barriers
Regulator
• Long approval
process (3-5 years)
• Strict control of
manufacturers,
products and
retailers
9
Fragmented Distribution
• Continental country
(27 states; >200 people)
• ~70k point of sales
• 18 larger chains
• ~200 distributors
Powerful Local Brands • Powerful local brands
• All generics are branded at retail as
most of the world (ex-US & Canada)
1960 2016
USA Brazil
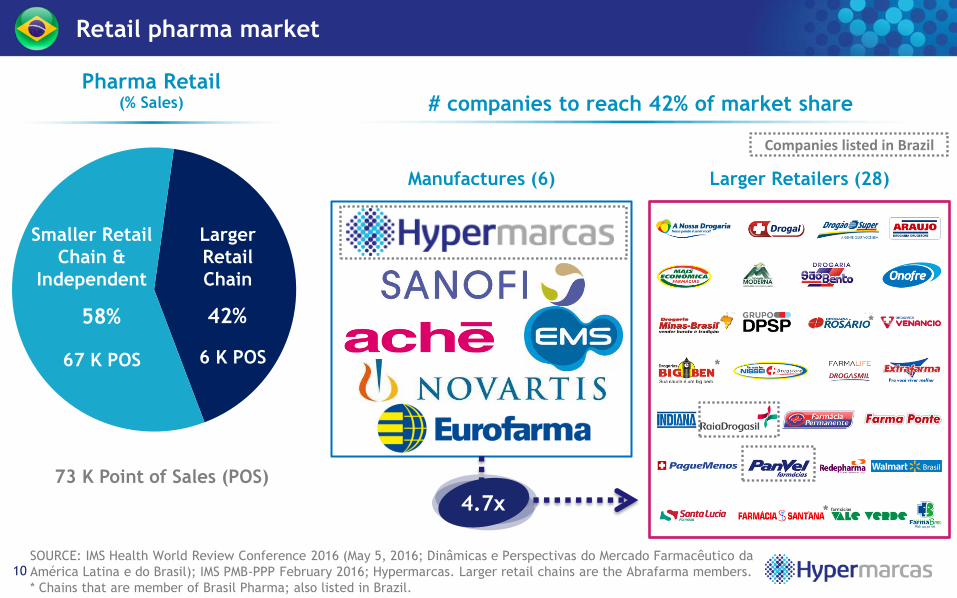
Retail pharma market
# companies to reach 42% of market share Pharma Retail
(% Sales)
42% 58%
Larger
Retail
Chain
Smaller Retail
Chain &
Independent
SOURCE: IMS Health World Review Conference 2016 (May 5, 2016; Dinâmicas e Perspectivas do Mercado Farmacêutico da
América Latina e do Brasil); IMS PMB-PPP February 2016; Hypermarcas. Larger retail chains are the Abrafarma members.
* Chains that are member of Brasil Pharma; also listed in Brazil.
73 K Point of Sales (POS)
10
67 K POS 6 K POS
4.7x
Manufactures (6) Larger Retailers (28)
Companies listed in Brazil
*
*
*

Retail pharma market
11
Business
Segment
Product
Category
Demand
Driver
Market
Size
Patents
Branded
Prescription
Trade
DTC
5%
60%
17%
18%
• RX with/without
prescription retention
• OTX
• Dermocosmetics
R$24.9B Physicians
• OTC
• Nutritionals
• Related products
R$6.9B Consumer
• Innovative patent protected R$2.3B Physicians
• Generics
• Smart Generics R$7.7B Pharmacist
SOURCE: IMS Health Oct. 2015

Low levels of per capita consumption
SOURCE: Organization for Economic Co-operation and Development (OECD), 2012 12
3,484
1,109
1,577
3,289
3,649
4,288
4,811
8,745
OECD Avg.
Brazil
Chile
UK
Japan
France
Germany
USA
Healthcare Expenditure per Country (USD/year)
7.9x

Fast ageing of population
SOURCE: IBGE 13
Population 60+ (MM people)
CAGR
2.8%
14 20
29
42
54
66 74
8% 10%
14%
19%
24%
29%
34%
0%
5%
10%
15%
20%
25%
30%
35%
0
10
20
30
40
50
60
70
80
90
2000 2010 2020 2030 2040 2050 2060
1mm
p.y.

Potential for higher drug consumption
SOURCE: IBGE (Consumer Expenditure Survey 2008-09); Values readjusted by inflation (IPCA) to April 2016. 14
Prescription Drugs Expenditure (R$ per month / family)
205.2
198.2
134.1
99.7
73.1
60.0
46.4
70+
60-69
50-59
40-49
30-39
20-29
10-19
4.3x

Resilient market
SOURCE: IMS Health (PMB-PPP March 2014); IBGE 15
9.7% 10.7%
5.7% 3.5%
12.5%
9.8%
10.5%
12.6%
11.7%
11.6%
7.3%
3.1%
2013 2014 2015 2016 YTD
Pharma
Market
Nominal GDP
Retail Sales

Agenda
• Overview
• Brazil Pharma Market
• Our Business
• Financials
16

Pharma scope
17
Pharmaceuticals
Cosmetics Food
Dermo-
cosmetics
Nutra-
ceuticals
Nutritionals
Nutri-
cionals

Business overview
* Excluding patents
SOURCE: IMS Health – PMB-PPP; Hypermarcas 18
Hypermarcas
Rank
PPP
Share
Growth
Opportunities
Consumer
Health
Generics
Branded
Prescription*
#1
#2
#5
14.7%
14.2%
4.8%
• Launch new product
concepts through brand
extensions
• Improve retail space
• Increase market presence,
especially at retails chains
• Improve portfolio coverage
especially at high value
products
• Leverage on physicians
visit network
• Launch new products
with untapped demand
1Q16 LTM revenue
breakdown
38% 30%
32%
Branded
Prescription
Generics
Consumer
Health

Long experience in the pharma market
19
1950 1970 1980 1990 2000 2010 2020 1960
1970
1953
1970s
1959
Strong brands with leadership in the market,
mainly in OTC, prescription and dermo-
cosmetics
OTC and prescription brands with over 50 years in the market
Most traditional brands in the Brazilian OTC
market.
Leader in branded generics and with an incipient portfolio
of generics, also expertise in the application for the
registration of off-patent medication

Consistent gains in market share
SOURCE: IMS Health – PMB–PF (2015) 20
7.5%
8.0%
8.5%
9.2%
9.9%
10.5%
2010 2011 2012 2013 2014 2015

Increasing importance of innovation
7.7% 8.4%
11.4%
17.7%
2012 2013 2014 2015
21 SOURCE: Company data, 2015. % Revenues from pharmaceutical products launched over the past 3 years.
Innovation (% Net Revenues)

Diversified distribution
22
32%
Direct
channel
Indirect
channel
57%
Distributor/
Wholesaler
Logistics
Operation
Retailer
Warehouse 11%
Distributor
delivers
Hypermarcas
takes
orders
Store SOURCE: Company Data, 2015

Large scale production facility
23
323,000 m2 land 120,000 m2 constructed area 3,700 employees
Distribution
Center
Solids/
Raw
Materials
Quality
Control
Aerosol
Efervecent
Dermo Liquids
Semisolids
Injectables
R&D
Penicilin Solids
Semisolids
Liquids
R&D

High production capacity
SOURCE: Hypermarcas, per year 24
Tablets,
capsules,
coated tablets,
pills and
effervescent
10 billion
Injectable and
ophthalmic
45 million
Aerosols
11 million
Liquids,
creams, oils,
ointments,
lotions and
jellies
276 million

Branded Prescription
25
Products
Strategy
Demand Driver
• Drugs promoted to
Physicians (OTC / RX)
• Intensify therapeutic
classes expansion
• Physician prescription
38% 30%
32%
Branded
Prescription
Generics
Consumer
Health
1Q16 LTM revenue
breakdown

Branded Prescription Leverage on physician visit network
SOURCE: IMS Health (Factory Price); Hypermarcas 26
10.4%
1.1%
9.7%
11.9%
0.6%
2.7%
4.8%
87%
74%
85%
74%
78%
55%
69%
Orthopaedics
Psychiatry
Dermatology
Paediatrics
Cardiology
Gynecology
General Practice
Largest
Specialties Coverage
(% of prescriptions; Value) Market Share Portfolio

Branded Prescription Launch new products with untapped demand
27
Current Pending Approval UnderDevelopment
Target
37%
75%
20%
16%
Addressable Market (Retail) (R$ million)
SOURCE: IMS Health; Hypermarcas
Ps: Share of the market in value that Hypermarcas competes

Branded Prescription Launch new products with untapped demand
28 SOURCE: IMS Health – PMB PF Oct15 YTD
Concept
• Hypovitaminosis D
- Fractures
- Muscular strength
- Cardio diseases
• Treatment dosage
- Supplementation
- Attack dosage 10.4
12.5 14.3 14.9
12.9 15.4
25.0
32.2 31.2
36.7
50.1
1Q13
2Q13
3Q13
4Q13
1Q14
2Q14
3Q14
4Q14
1Q15
2Q15
3Q15
290%
Pills
(Mar-2014)
Sell-Out (R$ million) 2016

Consumer Health
29
Products
Strategy
Demand Driver
• OTC
• Sweeteners
• Intensify brand extensions
• Mass media
38% 30%
32%
Branded
Prescription
Generics
Consumer
Health
1Q16 LTM revenue
breakdown

SOURCE: IMS Health – PMB Oct’15 30
Consumer Health New products concepts through brand extensions
145
171
2014 2015
18%
Mkt share
+ 0.5 p.p.
Sell-Out (R$ million)

31
Consumer Health Improve retail space
Before After
Alphabetical Order
• All drugs (OTC & Prescriptions) were
mixed behind the counter
• OTC is organized per category and
“over the counter”
• Sales increase
• 30% in Value
• 23% in Volume
OTC behind the counter Counter removed

Generics
32
Products
Strategy
Demand Driver
• Generics (Large Chains)
• Smart Generics
(a.k.a. Similars; M&Ps)
• Defend & grow selectively
• Pharmacist
recommendation
38% 30%
32%
Branded
Prescription
Generics
Consumer
Health
1Q16 LTM revenue
breakdown

SOURCE: IMS Health; Hypermarcas 33
52% 50% 38%
33% 31%
29%
15% 19% 33%
Hypermarcas 2014 Hypermarcas 2015 Market
Distribution Breakdown
Large retail chains
Mid-sized chains
Independent
Generics Increase market presence especially at retails chains

Agenda
• Overview
• Brazil Pharma Market
• Our Business
• Financials
34

35
* Calculado com o EBITDA Ajustado dos últimos 12 meses
35
2014 ∆ 2015
Ps.: Margins calculated on total net revenues (except NR ex-3rd parties)
Net Revenues ex-3rd Parties 2,733.4. 100.0% 2,954.7. 100.0% 8.1% - .
Gross Profit 2,091.9. 75.6% 2,210.1. 74.8% 5.7% -0.8 p.p.
Marketing Expenses (729.1) -26,3% 766.0 -25.9% 5.1% 0.4 p.p.
Selling Expenses (360.1) -13.0% (383.5) -13.0% 6.5% - .
G&A Expenses (156.0) -5.6% (157.9) -5.3% 1.3% -0.3 p.p.
Other Expenses (29.4) -1.1% (16.0) -0.5% -45.8% 0.6 p.p.
Depreciation & Amortization 68.6. 2.5% 66.4. 2.2% -3.2% -0.3 p.p.
EBITDA 885.2. 32.0% 950.3. 32.1% 7.3% 0.1 p.p.
Non-Recurring / Non-Cash Exp. 27.1. 1.0% 32.0. 1.1% 18.1% 0.1 p.p.
Adjusted EBITDA 912.3 33.0% 982.3 33.2% 7.7% 0.2 p.p.
Financial Result (411.3) -14.9% (515.9) -17.4% 25.4% -2.5 p.p.
Taxes (67.5) -2.4% (22.5) -0.8% -66.6% 1.6 p.p.
Net Income 337.9 12.2% 345.5 11.7% 2.2% -0.5 p.p.
Continuing Operations P&L (R$ million)

Net Debt Reduction (R$ million)
36
Net Debt / EBITDA* Debt Profile
3.9x
3.1x 2.9x
2.6x
1.7x
-0.7x
2011 2012 2013 2014 2015 LTMProforma
3T15
Gross Debt 2,190.4
Cash (2,054.9)
Net Debt 135.5
Hedge (352.0)
Net Debt after Hedge (216.6)
(540.0)
Net Debt after RB Deal (756.6)
Remaining Proceeds from RB Deal
1Q16
* Until 2015, Adjusted EBITDA (EBITDA before non-recurring expenses and other non-cash expenses)

Company’s Main Tax Shields (1/4)
37
EV/EBITDA P/E Cash flow Returns Net income Possible analysis impacts
Tax Shield Summary
R$ MillionExpense for
Tax onlyTax Rate Cash Value* Origin
Goodwill 2.519 34% 857 - Acquisitions; Amortizable for tax purporses only
- It does NOT impact the PnL, only the Cash Flow
Income Losses 1.192 - Negative pretax due to Goodwill amortization
Federal Credits 630 - Withholding tax from investments
- Credits from Acquisitions
Total 2.678
1,878 639
1,011
291
1,941
Source: Hypermarcas
¹ Federal tax credits are usable to pay any federal tax payment

38
Phone: +55 (11) 3627-4242
http://www.hypermarcas.com.br/ir