Embed Size (px)
Citation preview

i
Institutional Management of Surface Water in England and Wales
by
Sian Frost
A dissertation submitted in partial fulfilment
of the requirements for the award of the degree of
Master of Science
of Loughborough University
AUGUST 2013
Supervisor: Dr Lee Bosher
Water, Engineering and Development Centre
School of Civil and Building Engineering

ii

iii
Certificate of Authorship
I certify that:
(i) I am responsible for the work submitted in this dissertation, and that the
original work is my own except as specified below.
(specify)
(ii) I have not submitted this work to any other institution for the award of a degree
(iii) All *laboratory work, *field-work and *computer programming has been carried
out by me with no outside assistance except as noted below.
(specify)
(iv) All information (including diagrams and tables) or other information which is
copied from, or based on, the work of others has its source clearly
acknowledged in the text at the place where it appears.
Signed:
Date:

iv
Research Dissertation Access Form
Location: WEDC Resources Centre, Loughborough University
Author: Sian Frost
Title: Institutional Management of Surface Water in England and Wales
Status of access: OPEN
Author’s declaration:
I agree to the following conditions:
OPEN This dissertation shall be made available within the WEDC Resources
Centre, and may be borrowed by WEDC staff and students. Pages may
be copied, subject to copyright regulations. It may also be copied by the
British Library for supply to requesting libraries and individuals, subject
to a written assurance that it will not be published in part or in full. The
dissertation may also be made freely available electronically through the
WEDC knowledge base and/or the Learn server subject to the Terms
and Conditions for electronic access described in the Research
Dissertation Notes.
Author’s signature: …………………………….. Date: ………………………
Conditions of access approved by: ……..………………………………………..
(Supervisor’s name)
Supervisor’s signature: ……..………………………………………..

v
Terms and conditions for electronic access:
Depositor’s Declaration
1. I hereby grant to WEDC at Loughborough University a non-exclusive licence on the terms
outlined below. I warrant that:
1.1 I am the creator of all or part of the whole work (including content & layout).
1.2 The work is not in any way a violation or infringement of any copyright, trademark, patent,
or other rights whatsoever of any person.
1.3 That if the work has been commissioned, sponsored or supported by any organisation,
that I have fulfilled all of the obligations required by such contract or agreement.
WEDC’s Rights and Responsibilities
WEDC:
2.1 May distribute copies of the work (including any abstract) worldwide, in electronic format
via any medium for the lifetime of the WEDC Knowledge Base for the purpose of free
access without charge.
2.2 May electronically store, convert or copy the work to ensure its future preservation and
accessibility.
2.3 May incorporate metadata or documentation into public access catalogues for the work.
2.4 Shall retain the right to remove the work for professional or administrative reasons, or if
they are found to violate the legal rights of any person.
2.5 Shall not be under obligation to take legal action on behalf of the author or other rights
holders in the event of infringement of intellectual property rights or any other right in the
material deposited.
2.6 Shall not be under obligation to reproduce, transmit, or display the work in the same
format or software as that in which it was originally created.
Software
3.1 Copyright in additional data, software, user guides and documentation to assist users in
using the work shall belong to WEDC on behalf of Loughborough University and any
other parties that WEDC may choose to enter into an agreement with to produce such
materials.
3.2 While every care will be taken to preserve the physical integrity of the work, WEDC shall
incur no liability, either expressed or implicit, for the work or for loss of or damage to any
of the work or associated data.

vi

vii
Abstract
Drainage has been managed in England and Wales for centuries, but only in the past 20 years
has the focus moved away from land drainage and engineered flood defence, to a more
holistic catchment management. This shift reflects more general concerns with urban flooding,
environmental sustainability, and climate change trends.
Flooding events mean that water is increasingly treated as a responsibility as well as an asset,
and recent legislation attempts to build a hierarchy within the relevant institutions, to manage
surface water and flood risk. This document examines historical influences in the light of
recent statutory changes, and analyses current roles and responsibilities for surface water.
A visual approach is used on a case study area, to track rainfall on its path to the sea. The
interaction of differing liabilities and powers is illustrated and analysed according to ownership,
responsibility and water type.
The conclusions highlight a lack of holistic management, noting discrepancies between
ownership and responsibility, between types of responsibility, and between flood risk and
drainage. There are specific issues in urban areas, including frequent handovers between
drainage bodies, weakening of planning control, and domination by the Environment Agency.
Key recommendations include effective catchment management by tightening planning
regulations, and enhancing stakeholder participation, state involvement and strong
environmental leadership. Finally, fragmented water legislation needs integrating in order to
promote proactive management of this vital commodity, accepting it as both an asset and
liability.

viii
Executive Summary
Introduction Many recent changes have been implemented in legislation regarding flooding in England and
Wales, in an attempt to enhance institutional accountability and efficiency. In order to explore
any current complexities of institutional surface water management, these responsibilities are
to be investigated, analysed and mapped in a clear diagrammatic form.
The aims and objectives of this research are defined as follows:
Aim: To present a visual mapping of the institutional responsibilities for surface water within
the case study areas: illustrating the management of water as it moves from rainfall towards
the sea.
Objectives:
1. To establish the roles, responsibilities and interactions of all surface water stakeholders
2. To track specific theoretical flows of water across a catchment, considering the
implications of runoff and infiltration, as well as constructed drainage, sewers and all
watercourses
3. To illustrate the changes in institutional management as a visual mapping
4. To summarise pertinent background information to facilitate these objectives
To accomplish these objectives, mixed data is drawn from a literature review, policy
investigation, map analysis, field samples, interviews and tracking a planning request.
Literature Review Hydrology demonstrates links between surface and groundwater flooding, between drainage
and flooding, and between pluvial (surface water) and fluvial (river) flooding. However, pluvial
flood management is a relatively new concept in the UK and Local Authorities are still building
knowledge in this area in order to manage flood risk effectively.
Over the centuries, flood management in England and Wales was limited to agricultural
drainage. However in the past 50 years, flood management has changed from field drainage
to a focus on engineered defence – recently shifting to more considered management of
catchments as a whole. Floods, it is now understood, cannot be controlled; rather they require
intelligent adjustments on the part of the population affected by rivers. Rivers should be given
space to flood, and floodplains returned to this purpose rather than developed for housing.
However, evidence indicates that this is still not always the case. Sustainable drainage
supports a holistic approach by creating ‘soft drainage’ to encourage infiltration or storage of
water, rather than rapidly gravitating it towards rivers, and this concept is now implemented for
new buildings.

ix
In order to cope with flood events, resilience techniques such as ‘wet’ or ‘dry’ flood proofing
are used, either to resist the flood itself or to resist the damage caused by water. Post-flood
support can include insurance compensation, which has recently been renegotiated in
England. A longstanding ‘gentlemen’s agreement’ has just been modified to permit a limited
increase in high risk premiums, along with a cross subsidy from low-risk households. Scotland
leads the way in participatory work with insurers, communities, legislators and planners,
successfully linking all aspects of flood management and improving accountability.
Increased urbanisation, land use and agriculture changes will continue to combine with likely
climate changes, to make the management of surface water a key issue for the future.
Methodology This research uses the pluralistic methodology observed from the literature reviewed;
including interviews, policy reviews, and direct observation. The core of the research is a case
study; tracking surface water in several carefully selected locations in the Severn catchment.
Criteria to select urban locations are tabulated and assessed to avoid researcher bias, and
culminate in the selection of Worcester and Shrewsbury as case study locations. Rural
locations are included for completeness, and include the source of the Severn as well as a
border area, to compare Welsh and English influences, Multiple transect route options are
then plotted and examined using online mapping, to choose the widest variety of terrains and
institutional diversity from the four selected locations, leading to analysis in the final diagrams.
Sources of data include a full policy investigation of legislative and strategy data, literature
review, exploring institutional contacts and documents, tracking a development request on a
planning portal, analysing interactive maps, performing physical and theoretical (mapped)
transect walks and conducting interviews with stakeholders. This diverse data should permit a
rich selection of data for presentation and analysis. Drawing tools and online interactive maps
are then used to present findings in mapped illustrations of terrain, transect route, water flow
and a visual analysis of associated institutional responsibilities.
Policy data Policy regarding drainage, water resource and flooding has changed significantly in the past
25 years; notably with privatisation of water supply and sewerage in the 1989 Water Act, and
allocation of local drainage responsibilities between Internal Drainage Boards (IDBs) and
Local Authorities in the 1991 Land Drainage Act. The Environment Act of 1995 then
established the independent Environment Agency whose remit included river management.
An increase in urban flood events, coupled with environmental considerations and
appreciation of catchment management, led to European water directives, which were
encapsulated in the Flood and Water Management Act in 2010. This allocated further
responsibility to Local Authorities, who were directed to manage all local surface water risk,
while the Environment Agency was to supervise all national drainage and flood risk, as well as

x
managing main rivers. A series of flood strategy documents were mandated from both bodies
and all stakeholders were directed to coordinate and share information. This change was
intended to prevent the confusion of recent flood events where accountability for water assets
had been unclear. It should be noted that the Environment Agency retained only permissive
powers, meaning they are permitted, but not obliged to intervene in flood and drainage
supervision.
Sewage is managed by water companies in England and Wales, directing often combined
flows of sewage and stormwater to treatment plants and outflows. The resultant contaminated
flooding has generated upgrades to sewage systems, even though water companies are not
strictly liable for sewage flooding caused by excess rainfall.
Water falling on local roads is the responsibility of local Highways Authorities, with trunk roads
managed by the Highways Agency. Water drained from any road will then pass into storm
sewers, combined sewers, soakaways, or a nearby watercourse.
Planning offers a key opportunity for improving flood management; by regulating development
on floodplains and now including the Environment Agency as statutory consultee. Planning
Policy Statement 25 offers guidance to planners, with the sequential test and exception rules
defining risk based judgements in conjunction with flood zone maps, ostensibly to keep
development away from floodplains. Newer regulations issued in 2012 as the National
Planning Policy Framework, carry a presumption in favour of sustainable development and
appear to define floodplains more subjectively. Sustainable or soft drainage is favoured to
mitigate flood risk, and these infiltration and flood storage techniques are now mandated in
national standards for construction.
Other stakeholders include farmers and private landowners, who enjoy riparian rights for water
passing over their land. These ancient rights regard water as an asset rather than a
responsibility, but landowners may be obliged by a drainage body to effect repairs in the event
of a surface water problem. Peripheral stakeholders include British Waterways, who own and
manage 2600km of canals crossing river basins; and Ofwat, who oversees Water Companies.
Results Data is then gathered in to the results section, with sources including preliminary observations
in sample locations, and interviews with representatives from Worcestershire County Council,
the Environment Agency, Lower Severn Internal Drainage Board, and an agricultural riparian
landowner. Further data is also gathered from tracking a large planning application near a
flood zone. Moving to the case study, theoretical flows are tracked across mapped contours,
followed by physical transect walks following these flows to main rivers. These results are all
detailed and referenced on maps and photographs taken during field work, to make the routes
easier to follow.

xi
Analysis The collated results from fieldwork, mapped routes, policy investigation and interviews are
now interpreted and illustrated in colour coded diagrams and pie charts for each location. The
diagrams demonstrate institutional influences for drainage, flood risk, and supervision
responsibilities, as well as category of ownership and water channel type. These aspects are
all presented against a scaled foundation, detailing all influences for the first 10km of each
route selected. Pie charts are used to demonstrate the breakdown of drainage by responsible
institution, for one entire route for each location.
These diagrams demonstrate a number of points regarding the changing influences along flow
routes. These include noticeable changes as sampling shifts from rural to increasingly urban
settings: institutional influences are different; management type changes more frequently; the
Environment Agency increasingly manages more of the flow; more water is piped
underground; and unchannelled surface water reduces significantly. Other key issues are
visible over all terrains, these include: the continuous split between ownership and
responsibility; multiple drainage handovers between institutions; and the imposition of flood-
risk management on a body which does not fully control drainage.
Conclusion and Recommendations A number of observations suggest a lack of holistic management:
There is a clear distinction between land ownership and the various levels of responsibility;
Responsibility is split between three layers of liability: drainage, flood risk, and supervision;
Local Authorities control flood risk, yet hold only partial control for urban drainage;
Drainage legislation has been updated by flood statutes, without real any attempt to
integrate, or understand the link between the two concepts.
Other issues have been noted specifically in urban areas:
Water Companies and Highways Authorities act as primary drainage bodies in towns
Urban drainage is normally implemented almost entirely underground
Frequent handovers between drainage stakeholders are still common
The Environment Agency plays an increasingly dominant role, leading to a loss of local
knowledge
Loopholes are often exploited by developers, to gain planning permission near floodplains
Key recommendations include the tightening of planning regulations in order to support
effective catchment management; incorporating lessons learned from Scotland around
stakeholder participation, restoring state involvement and encouraging strong environmental
leadership.
Finally, fragmented water legislation needs integrating in order to promote proactive
management of this vital commodity, accepting it as both an asset and liability.

xii
Glossary
Abbreviations ABI Association of British Insurers
ADA Association of Drainage Authorities
ALT Agricultural Land Tribunal
AOD Above Ordnance Datum (In UK normally = Above Sea Level)
ASL Above Sea Level
CFMP Catchment Flood Management Plan
COW Critical Ordinary Watercourse
DCLG Department of Communities and Local Government
Defra Department for Environment, Food and Rural Affairs
DETR Department of Environment, Transport and the Regions
DRR Disaster Risk Reduction
EFRA Environment, Food and Rural Affairs
EA Environment Agency (for England)
EAW Environment Agency in Wales
EIA Environmental Impact Assessment
EU Council of the European Union
FRA Flood Risk Assessment
FRM Flood Risk Management
FRR Flood Risk Regulations 2009
FWMA Flood and Water Management Act 2010
GCC Gloucester County Council
IDB Internal Drainage Board
LA Local Authority
LFDC Local Flood Defence Committee
LLFA Lead Local Flood Authority
LPA Local Planning Authority
MAFF Ministry of Agriculture Fisheries and Food
NFU National Farmers Union
NPPF National Planning Policy Framework
NRA National Rivers Authority
NRW Natural Resources Wales
NWC National Water Council
OS Ordnance Survey
PFRA Preliminary Flood Risk Assessment
PPG25 Planning Policy Guidance note 25
PPS25 Planning Policy Statement 25 Development and Flood Risk

xiii
RFDC Regional Flood Defence Committee
RFRA Regional Flood Risk Appraisal
RLDC Regional Land Drainage Committees
RMA Risk Management Authority
RWA Regional Water Authority
SAB SUDS approving body
SC Shropshire Council
SFRA Strategic Flood Risk Assessment
SuDS Sustainable Drainage System
SWMP Surface Water Management Plan
TBC Tewkesbury Borough Council
UK United Kingdom of Great Britain and Northern Ireland
WCC Worcester County Council
Definitions The following table (Environment Agency, 2012c) defines relevant legislative terms:
Term Definition Source
watercourse Includes all rivers and streams and all ditches,
drains, cuts, culverts, dikes, sluices, sewers (other
than public sewers within the meaning of the Water
Industry Act 1991) and passages, through which
water flows.
Land Drainage Act
1991 [section 72(1)]
ordinary
watercourse
“Watercourse” that does not form part of a “main
river”
Flood and Water
Management Act 2010
main river Watercourse shown as such on a main river map.
Main river maps are held by Defra and Welsh
Government
Water Resources Act
1991 [section 113]
public sewer Sewer for the time being vested in a sewerage
undertaker etc
Water Industry Act
1991
culvert Covered channel or pipe designed to prevent the
obstruction of a watercourse or drainage path by an
artificial construction. There is no definition in current
legislation. This definition will be added to Section 72
of the Land Drainage Act
Flood and Water
Management Act 2010
Paragraph 39

xiv
Table of Contents
Abstract ..................................................................................................................................... vii
Executive Summary ................................................................................................................ viii
Glossary .................................................................................................................................... xii
List of Figures ........................................................................................................................ xviii
List of Tables ............................................................................................................................ xx
List of Boxes ............................................................................................................................. xx
1. Introduction ........................................................................................................................... 1
1.1. The context ................................................................................................................... 1
1.1.1. Background ........................................................................................................... 1
1.1.2. Project definition ................................................................................................... 1
1.1.3. Justification ........................................................................................................... 2
1.2. Problem statement ....................................................................................................... 3
1.3. Aims and objectives ..................................................................................................... 3
1.3.1. Aim ........................................................................................................................ 3
1.3.2. Objectives ............................................................................................................. 3
1.4. Research questions ..................................................................................................... 3
1.5. Expected findings ......................................................................................................... 4
1.6. Unit of analysis ............................................................................................................. 4
1.7. Research beneficiaries ................................................................................................. 5
1.8. Scope of research ........................................................................................................ 5
1.9. Research Methodology ................................................................................................ 5
2. Literature Review ................................................................................................................. 7
2.1. Hydrology of Land Drainage ........................................................................................ 7
2.2. Flood Risk Management .............................................................................................. 9
2.2.1. Engineering approach .......................................................................................... 9
2.2.2. Holistic catchment management ........................................................................ 11
2.3. Floodplain Development ............................................................................................ 13
2.4. Sustainable Drainage Systems (SuDS) ..................................................................... 15
2.5. Resilience ................................................................................................................... 16
2.5.1. Flood-proofing ..................................................................................................... 16
2.5.2. Flood Insurance .................................................................................................. 17
2.6. Institutional Management ........................................................................................... 18

xv
2.7. Lessons from other countries ..................................................................................... 19
2.8. Future Risk ................................................................................................................. 20
2.9. Summary .................................................................................................................... 20
3. Methodology ....................................................................................................................... 21
3.1. Approach .................................................................................................................... 21
3.2. Approach observed from literature review ................................................................. 21
3.3. Case study ................................................................................................................. 22
3.3.1. Reason for case study approach ........................................................................ 22
3.3.2. Selection criteria for case study area ................................................................. 24
3.3.3. Finalising the case study area ............................................................................ 26
3.3.4. Selecting the transect walk routes ...................................................................... 27
3.4. Sources of data .......................................................................................................... 27
3.4.1. Literature review ................................................................................................. 27
3.4.2. Policy review ....................................................................................................... 27
3.4.3. Information issued by institutions ....................................................................... 28
3.4.4. Information from contacts ................................................................................... 28
3.4.5. Theoretical ‘transect walks’ across case study areas ........................................ 29
3.4.6. Tracking planning request - including flood risk advice ..................................... 29
3.4.7. Interviews with stakeholder representatives ...................................................... 29
3.4.8. Transect walks across case study areas ........................................................... 29
3.5. Stakeholder analysis .................................................................................................. 31
3.6. Tools used .................................................................................................................. 31
3.7. Limitations of Methodology ........................................................................................ 32
3.8. Presentation of findings .............................................................................................. 32
4. Policy Investigation ............................................................................................................ 33
4.1. Scope of Review ........................................................................................................ 33
4.2. Legislation .................................................................................................................. 33
4.2.1. Land Drainage Statutes ...................................................................................... 33
4.2.2. Water Resources Statutes.................................................................................. 34
4.2.3. Flood Management Statutes .............................................................................. 36
4.3. Key Institutions ........................................................................................................... 38
4.3.1. Department for Environment, Food and Rural Affairs (Defra) ........................... 39
4.3.2. The Environment Agency (EA) ........................................................................... 40
4.3.3. Local Lead Flood Authorities (LLFA) .................................................................. 41
4.3.4. Internal Drainage Boards (IDB) .......................................................................... 42
4.3.5. Water Companies ............................................................................................... 43
4.3.6. Highways Authorities .......................................................................................... 45

xvi
4.3.7. Local Planning Authorities (LPAs) ...................................................................... 46
4.4. Other Stakeholders .................................................................................................... 50
4.4.1. Landowners and Riparian Rights ....................................................................... 50
4.4.2. Agricultural Influence .......................................................................................... 51
4.4.3. British Waterways ............................................................................................... 51
4.4.4. Ofwat................................................................................................................... 52
4.4.5. Agricultural Land Tribunals ................................................................................. 52
4.5. Division of Responsibilities......................................................................................... 53
4.6. Paradigm changes ..................................................................................................... 53
4.7. Summary .................................................................................................................... 55
5. Results................................................................................................................................ 57
5.1. Preliminary investigations .......................................................................................... 57
5.2. Tracking a planning application ................................................................................. 59
5.3. Interviews ................................................................................................................... 60
5.3.1. Lower Severn Internal Drainage Board (LSIDB) ................................................ 61
5.3.2. Worcestershire County Council (WCC) .............................................................. 61
5.3.3. Agricultural Landowner ....................................................................................... 62
5.3.4. Environment Agency (EA) .................................................................................. 63
5.4. Tracking Surface Water – Transect Walks ................................................................ 64
5.4.1. Methodology and tools ....................................................................................... 64
5.4.2. Sample 1 – Mountain Source, Ceredigion: Mapped Runoff Routes .................. 64
5.4.3. Sample 2– Powys: Theoretical & Physical Transect Walks ............................... 66
5.4.4. Sample 3 – Pontesbury: Theoretical & Physical Transect Walks ...................... 69
5.4.5. Sample 4 – Shrewsbury: Theoretical & Physical Transect Walks ..................... 72
5.4.6. Sample 5 – Worcester: Theoretical & Physical Transect Walks ........................ 75
5.5. Limitations in data ...................................................................................................... 77
5.6. Summary .................................................................................................................... 78
6. Analysis .............................................................................................................................. 79
6.1. Diagram Methodology ................................................................................................ 79
6.2. Data Interpretation ..................................................................................................... 79
6.3. Diagrams .................................................................................................................... 80
6.3.1. Sample 1 – Mountain Source, Ceredigion ......................................................... 80
6.3.2. Sample 2 – Border Hills, Powys ......................................................................... 81
6.3.3. Sample 3 – Upland small town, Pontesbury ...................................................... 83
6.3.4. Sample 4 – Upland town, Shrewsbury ............................................................... 84
6.3.5. Sample 5 – Lowland city, Worcester .................................................................. 86
6.4. Limitations in mapping ............................................................................................... 87

xvii
6.5. Summary .................................................................................................................... 88
7. Conclusion and Recommendations ................................................................................... 89
7.1. Reflections .................................................................................................................. 89
7.1.1. Methodology ....................................................................................................... 90
7.2. Observations .............................................................................................................. 90
7.3. Recommendations ..................................................................................................... 92
References ................................................................................................................................ 93
Bibliography ............................................................................................................................. 102
Appendix I: Interview questions .............................................................................................. 103
1. Environment Agency ................................................................................................ 103
2. WCC Local Authority (delegated to Wychavon District) .......................................... 104
3. SCC Local Authority (Unitary) .................................................................................. 105
4. Lower Severn IDB .................................................................................................... 106
5. Severn Trent ............................................................................................................. 107
6. Agricultural Landowner ............................................................................................ 108
Appendix II : Environment Agency, Planning Advisor role ...................................................... 109
Appendix III: Raw Data for Analysis ........................................................................................ 111
Appendix IV: Raw Data for Pie Charts .................................................................................... 113
Appendix V: Work Plan and Schedule .................................................................................... 115

xviii
List of Figures
Figure 1.1 Shropshire road flooding. Source: SC (2010a)......................................................... 6
Figure 2.1 Source-pathway-receptor model for floods: the greatest control is with the receptor.
Source: Huntingdon and MacDougall (2002) .............................................................................. 9
Figure 2.2 ‘Defended’ flood plain development: New Orleans after Hurricane Katrina, 2005.
Source: Wordpress (2009). ....................................................................................................... 10
Figure 2.3 Flood defences should not be considered in isolation. Source: Fleming (2002b,
p18) ............................................................................................................................................ 11
Figure 2.4 River Quaggy: Wetlands in Sutcliffe Park, Lewisham. Source: Landscape Institute
(2013). ....................................................................................................................................... 12
Figure 2.5 Riverside settlements encroaching on the flood plain. Source: Fleming (2002b,
p16) ............................................................................................................................................ 13
Figure 3.1 Upper Severn catchment, showing water storage. Source: Shaw (1989), annotated
by author. ................................................................................................................................... 23
Figure 3.2 Map of potential case study areas in Severn Basin. Source: From EA (2009a, p8),
annotated by author................................................................................................................... 26
Figure 3.3 Padlocked access to Rad Brook, Shrewsbury. Photograph taken by author, July
2013 ........................................................................................................................................... 32
Figure 4.1 1963 River Authority boundaries. Source: Sewell and Barr (1977, p398) ............ 34
Figure 4.2 Division of responsibility for water management. Source: Brown (2002) ............... 36
Figure 4.3 Responsibilities for Flood Risk. Source: Shropshire Council (2012) ...................... 39
Figure 4.4 River Catchments 2012. Source: EA, (2012b) ....................................................... 40
Figure 4.5 Schedule of required flood risk management activity for LLFAs. Source:
Warwickshire County Council (2011) ........................................................................................ 42
Figure 4.6 Sewerage responsibilities defined. Source: Adapted from Severn Trent Water [n.d].
................................................................................................................................................... 44
Figure 4.7 Headline sewer upgrades from SevernTrent website. Source: Severn Trent Water,
2013 ........................................................................................................................................... 45
Figure 4.8 Managing flood and coastal erosion risks. Source: Adapted from Defra and EA
(2011) ........................................................................................................................................ 46
Figure 5.1. Severn catchment area, showing sample locations. Source: EA (2009a, p38),
annotated. .................................................................................................................................. 57
Figure 5.2 Raised older riverside buildings, Shrewsbury. Photograph taken by author. June
2013 ........................................................................................................................................... 58
Figure 5.3 Riverside Cathedral on raised ground, Worcester. Photograph taken by author, May
2013 ........................................................................................................................................... 58
Figure 5.4. New riverside buildings on low ground, Worcester. Photograph taken by author,
May 2013 ................................................................................................................................... 58

xix
Figure 5.5 Proposed site map, showing contours, site boundary and flood zones. Sources:
EDINA [n.d.], EA [n.d.]a, SC planning portal [n.d.] – combined and annotated by author. ...... 59
Figure 5.6 Map of estimated rain runoff routes from Pen Pumlumon, Ceredigion. Source:
EDINA, [n.d.], annotated. .......................................................................................................... 65
Figure 5.7 Map of estimated rain runoff routes from Pen Pumlumon, Ceredigion, to sea.
Source: EDINA, [n.d.], annotated. ............................................................................................. 65
Figure 5.8 Map of estimated rain runoff routes from Rhos Hill, Powys, towards main rivers.
Source: EDINA, [n.d.], annotated. ............................................................................................. 66
Figure 5.10 Map of estimated rain runoff routes from Rhos Hill, Powys, towards sea. Source:
EDINA, [n.d.], annotated. .......................................................................................................... 67
Figure 5.9 The Werns stream, 1km from its source springs. Whitton, Powys. Photograph
taken by author, July 2013. ....................................................................................................... 67
Figure 5.11. Location of IDBs near Shrewsbury. Source: SC, 2012a ...................................... 69
Figure 5.12 Top of Earl's Hill, starting point for Sample 3. Photograph taken by author, July
2013 ........................................................................................................................................... 70
Figure 5.13 Map of estimated rain runoff routes from Earl's Hill, Pontesbury, towards main
rivers. Source: EDINA, [n.d.], annotated. .................................................................................. 71
Figure 5.14 New houses permanently sandbagged, Pontesbury. Photograph taken by author,
July 2013. .................................................................................................................................. 72
Figure 5.15. Demountable flood defences in Frankwell, Shrewsbury. Source: BBC Shropshire,
2013. .......................................................................................................................................... 72
Figure 5.16. Flood map for Shrewsbury, showing Frankwell and Coleham Head flood
defences. Source: EA [n.d.]a, annotated by author ................................................................. 73
Figure 5.18 Map of estimated rain runoff routes from Woodfield Rd, Shrewsbury, towards
main rivers. Source: EDINA, [n.d.], annotated. ......................................................................... 74
Figure 5.17 The Rad Brook, in west Shrewsbury. Photograph taken by author, July 2013. .... 74
Figure 5.19 Raised path and bank alongside River Severn, north Worcester. Photograph
taken by author, May 2013 ........................................................................................................ 75
Figure 5.20 Map of estimated rain runoff routes from Leopard Hill, Worcester, towards main
rivers. Source: EDINA, [n.d.], annotated. .................................................................................. 76
Figure 5.21 Outfall to Pontesbury Brook, presumed from highway drainage. Photograph taken
by author, July 2013 .................................................................................................................. 77
Figure 6.1 Diagram to demonstrate layers of responsibility, ownership and channel type.
Ceredigion, blue route ............................................................................................................... 80
Figure 6.2 Chart showing drainage responsibilities in km, along entire route. Ceredigion, blue
route ........................................................................................................................................... 81
Figure 6.3 Diagram to demonstrate layers of responsibility, ownership and channel type.
Powys, red route. ....................................................................................................................... 82

xx
Figure 6.4 Chart showing drainage responsibilities in km, along entire route. Powys, red route
................................................................................................................................................... 82
Figure 6.5 Diagram to demonstrate layers of responsibility, ownership and channel type.
Pontesbury, pink route. ............................................................................................................. 83
Figure 6.6 Chart showing drainage responsibilities in km, along entire route. Pontesbury, pink
route ........................................................................................................................................... 84
Figure 6.7 Diagram to demonstrate layers of responsibility, ownership and channel type.
Shrewsbury, blue route. ............................................................................................................ 85
Figure 6.8 Chart showing drainage responsibilities in km, along entire route. Shrewsbury, blue
route. .......................................................................................................................................... 85
Figure 6.9 Diagram to demonstrate layers of responsibility, ownership and channel type.
Worcester, red route. ................................................................................................................. 86
Figure 6.10 Chart showing drainage responsibilities in km, along entire route. Worcester, red
route ........................................................................................................................................... 87
List of Tables
Table 1.1 Concepts mapped to research questions ................................................................... 4
Table 2.1 Options for SuDS techniques. Source: Shropshire Council (2012) ......................... 16
Table 3.1 Criteria for selection of case study area. Sources: Data is collated from council
websites, EDINA [n.d.], EA [n.d.]a, with flood history data from Black and Law (2004). .......... 25
Table 3.2 Contact details for stakeholder interviews. All data from organisational websites and
enquiries. ................................................................................................................................... 28
Table 4.1 Responsibilities for Surface Water Management in England and Wales. Source:
Ofwat (2011) with additional information from Frost (2002)...................................................... 53
Table 4.2 Summary of key policy issues for flood and drainage. ............................................ 55
List of Boxes
Box 3-1: Literature Search Techniques ..................................................................................... 30
Box 5-1: Cross border river and possible administrative confusion .......................................... 68
Box 7-1: Reviewing Aim and Objectives ................................................................................... 89
Box 7-2: Further research suggestions ..................................................................................... 91

1
1. Introduction
"Floods are 'acts of God', but flood losses are largely acts of man." White, 1945
“The institutional and policy frameworks ... represent the rocks on which ... wise
floodplain management founders.” Smith, 2000
This report is structured into six main sections: setting the context in chapter one, then
conducting a literature review to explain background information and establish previous
research findings. The methodology is then explained along with tools and data sources,
before starting on initial data collection with the policy investigation. Field data and maps are
presented in the results chapter, followed by analysis and diagrams, finishing with conclusions
and recommendations in the final chapter.
1.1. The context
1.1.1. Background This topic was inspired by two reports into the 2007 floods in Britain, especially Hull, where it
was observed that responsibilities were unclear for smaller watercourses contributing to
flooding, Coulthard et al. (2007) and Coulthard and Frostick (2010) provided information for
the Pitt Review (Pitt, 2008), exposing the complexity of multiple agencies managing different
areas of the drainage system. During the devastating 2007 floods in Hull, diverse institutions,
all played separate but significant roles in the floods, while not necessarily coordinating well,
especially at times of crisis. It was subsequently suggested that a mapping of surface water
according to responsible institutions could be instructive. It appears from literature reviews and
other inquiries, that no such mapping has yet been devised.
1.1.2. Project definition The aim of this project is therefore to explore the institutional management of surface water
across an urban and rural catchment, to better understand the implications for flood risk
reduction in England and Wales.
Ownership and responsibility for surface water in England and Wales is complex, and has
recently undergone several changes, with the Environment Agency (EA) now playing a leading
role in flood prevention. At the same time both climate trends and land use are changing;
urbanisation and pressure for new houses are encouraging building on flood plains. The pace
of change means that flood prevention is often specific and reactive rather than holistic and
preventative; focusing on river barrier defences rather than integrated catchment management
and overall risk reduction (Goodson, 2011).
2
Flooding is the culmination of a cumulative series of events, and managing the river alone is
often too little and too late. Main watercourses are managed for flood risk by the EA; however,
water flows into rivers from a variety of sources, including roads, (managed by highways
authority/agency), agricultural drains (landowners) minor watercourses and culverts (multiple
drainage bodies) and sewers (water company). It has been observed that during a flood
incident, confusion between responsibilities for different watercourses can create conflicts and
delays in response. More significantly, early and sustainable management of smaller
watercourses could ultimately reduce flood conditions in the main river.
1.1.3. Justification Several of the recommendations in the Pitt review were implemented in to 2010 Floods Act,
including augmenting the role of the EA into a coordinating flood agency.
“The responsibilities for certain drainage assets remain unclear ... This lack of
transparency in ownership and the complexity involved could be reduced by having a
single national organisation with an overarching responsibility for all types of flooding.”
Pitt, 2008
However, the role of the EA remains permissive, and responsibilities for surface water remain
diverse. This research therefore provides a useful exercise in tracking complexities of
institutional responsibilities, and their likely impact on flood risk management. It also offers the
opportunity to review the effect of recent legislative changes in surface water management.
The House of Commons EFRA Select Committee (2008) concluded that institutional factors
played a large part in the landmark 2007 UK floods. They quote written evidence received
from MPs and members of the public on the cause of flooding, including:
Poor maintenance of drains;
Poor watercourse maintenance and lack of dredging;
Landowners unaware of their responsibilities;
Development on the flood plain;
Confusion over responsibility for certain drainage assets;
Finally, disaster risk reduction (DRR) must consider the mitigation of the cumulative aspects of
risk, (Bosher et al., 2009). If water is not regarded as a risk until it reaches the river, this
effectively creates a disincentive for management of smaller water sources. In order to
effectively implement pre-disaster mitigation, flood risk management should be carried out
across the entire catchment, and not simply at the river. The implication of these cumulative
effects on surface water is a key point for investigation.

3
1.2. Problem statement The intention here is to clearly state the problem in order to remain focused during
investigation into a diverse and wide ranging subject. The problem statement is therefore
defined here as follows:
Which institutions in England and Wales are responsible for different types of surface water
and can their interaction be clearly illustrated?
1.3. Aims and objectives
1.3.1. Aim The primary aim is: To present a visual mapping of the institutional responsibilities for surface
water within the case study areas: illustrating movement of a raindrop across the areas of
institutional ownership.
1.3.2. Objectives 5. To establish the roles, responsibilities and interactions of all surface water stakeholders
6. To track specific theoretical flows of water across a catchment, considering the
implications of runoff and infiltration, as well as constructed drainage, sewers and all
watercourses
7. To illustrate the changes in institutional management as a visual mapping
8. To summarise pertinent background information to facilitate these objectives
1.4. Research questions The following research questions have been identified for this project:
What role does each agency play in managing surface water?
How do key stakeholders (such as local authorities, farmers, utilities, highways authorities
or private landowners) manage small watercourses under their control?
How do the respective institutions interact, especially at the boundaries between each
section of drainage or watercourse?
Do planning laws ensure that developers take responsibility for the effect that development
has on urban drainage and consequent flood risk?
Who are the incidental stakeholders and what is their role?
Is surface water managed using short term reactive event management or long term
proactive catchment management?
These have been developed into further detailed research questions, then classified by
concept and summarised in Table 1.1:

4
Table 1.1 Concepts mapped to research questions
1.5. Expected findings Initial research suggests that flood risk management still lacks a holistic approach and is still
localised and reactive. It appears that the approach to planning permission can be flawed in
implementation, and that developers are rarely directed to contribute to improved drainage. It
is therefore hoped to highlight any discrepancies within the planning process, overall
catchment management, and interaction between the different stakeholders and institutions.
It is expected that the cumulative effect of different sources of surface water is not sufficiently
anticipated, and that surface water is not proactively managed. If drainage is regarded simply
as an opportunity to pass water downhill to the next institution, it is likely that flood risk is
managed mainly at the river level.
1.6. Unit of analysis The core of the project is the case study; including theoretical and physical transect walks,
leading to mapping of institutional responsibility for various streams of surface water. Unit of
analysis will generally be the watercourse under examination, along with the institutional
owner concerned with its control. Overall geographical limits will be set by the catchment
boundary of the river Severn.
Concept Questions Data source
Who manages each form of water? Policy reviewIs surface water treated as an economic good or a liability and cost?
Policy review & lit review
How well do the different institutions work together?
Policy review, lit review, interviews
Are the boundaries between institutions clear and mappable?
Policy review & transect walks
Is water simply passed by gravity as quickly as possible to the next institution downstream?
Transect walks
Who gives permission to build in flood plains and with what caveats? Investigate 106 rulings.
Policy review, lit review, interviews
Who pays for the Impact of development on water management? Taxpayers? Developers? Owners?
Policy review, lit review, interviews
National/local interaction
Who manages the overall flood risk, is this EA for the whole country?
Policy review, lit review, interviews
Where do the house holders’ responsibilities start and end?
Policy review
Should there be state subsidies for insurance ? All
Public sector / householder interaction
Water mgt
Institutional interaction
Public/ private sector
5
1.7. Research beneficiaries It would appear that the complexities in water legislation in England and Wales are
contributing to the growing flood risk in the country. A clear illustration of excessive institutional
complexity and lack of cooperation could highlight opportunities for improvement in this area.
This research could therefore play a part in highlighting anomalies in the management of
surface water in England and Wales, which could have value for organisations involved in
flood risk management and DRR strategies in this area.
1.8. Scope of research The intention of this study is to explore the link between surface water management and
institutional ownership. As such, an initial investigation is conducted into legislation, regulatory
guidelines and institutional roles. This policy review is limited to recent legislation, mostly since
the 1930s, which has a direct bearing on current water management policies. The resource
and environmental management of water is noted, but not investigated as closely as drainage
and flooding.
All responsibilities for main rivers are clearly allocated to the EA, and while implications of this
are discussed, main rivers are not investigated in as much detail as drainage and smaller
watercourses, which have more complex management.
The catchment under investigation is limited to the Severn basin in England and Wales, and
while other catchments may be mentioned, they are not examined here. Technical details
such as flood estimation techniques, flood response protocols, or specific engineered
solutions are not within scope.
1.9. Research Methodology Theoretical analysis and information gathering is the primary aspect of the first phase, and
takes the initial form of a literature review. This is followed by the policy investigation,
reviewing statutes, directives, regulations and strategy documents, in order to understand the
relative roles and responsibilities of stakeholder institutions. This policy review forms the
preliminary section of the data collection, and is pivotal to inform subsequent analysis in the
light of institutional responsibilities. Further desk research involves catchment analysis using
Ordnance Survey (OS) maps, where the transect walks in the Severn catchment are planned
and undertaken in a theoretical approach.
Representatives of several stakeholder organisations are interviewed in order to triangulate
data and assess real world application of roles. Physical data gathering implements the
planned transect walks in the field, after which findings are collated and plotted into charts.
Finally, results are presented in a graphical format, along with further analysis of these mixed
data sources to present the different influences on the watercourses identified.

6
Progress is managed and measured according to tasks, using the workplan shown in
Appendix V: Work Plan and Schedule’, updated and adjusted dynamically as worked
progresses.
Figure 1.1 Shropshire road flooding. Source: SC (2010a)

7
2. Literature Review The purpose of this review is to summarise the current state of knowledge in the topic, to
establish any gaps in knowledge, and to build the researcher’s knowledge of the subject. This
has been achieved by analysing strategy papers and books in order to consider a wide
background to the subject of surface water management and institutional factors.
Policy papers have been included here where they inform the debate. However, institutional
information provides primary data to this project, and has been analysed in the separate policy
review in chapter 4.
2.1. Hydrology of Land Drainage In order to understand the behaviour of surface water, it is necessary to note some relevant
hydrological background. Jones (2000) explains that flash floods, or sudden onset floods, are
usually generated by rain falling on saturated ground and are known as pluvial floods. This
form of infiltration excess, or surface run off, occurs when rainfall intensity exceeds infiltration.
Slow onset, or riverine floods, are known as fluvial floods and are caused by swollen rivers
overtopping their banks. Clearly the two are linked: as the faster pluvial flooding moves down
towards the river, the slower fluvial flood develops; watercourses fill the main river, which
eventually overtops its banks. Given the importance of surface water management to this
project, and the clear allocation of responsibility for all main rivers to the Environment Agency
(EA), this research mainly examines the preliminary interaction of rain and surface water
runoff with existing watercourses.
Rowe et al. (1997) describes the proportion of surface water run-off as a function of the
storage characteristics of the soil, the underlying bedrock, and the density of vegetation cover.
Jones (2000) adds that rainfall characteristics combined with the shape of the basin, hillside
properties and channel networks, will define the characteristics of surface water. The speed of
run-off will therefore affect both the likelihood and type of a pluvial flood.
Ibbitt et al. (1997) observe that the direction of rain bearing clouds across a catchment can
have a great effect on peak flows passing downriver. Storms passing along, rather than across
the catchment will create greater stream flows; while rain moving down (rather than up) the
catchment produces a ‘plug’ flow, as the peak flow runs with the current. This is reinforced by
Jones (2000) who adds that the speed of the storm also affects the size of the peak flow. This
is particularly relevant for the River Severn, which suffers from sudden peak flows in
Wales/Shropshire borders, where the current runs in the same direction as the prevailing wind,
and increased hill rainfall travels east from Wales, along with the river (Biggs, 2009), creating
classic flood conditions.
.

8
Ibbitt et al. (1997) detail the infiltration of rainfall as it moves downwards through the soil, until
it reaches an impervious surface, whereupon it will run downhill as a sub-surface flow. As a
result, the ground surface becomes saturated near water channels, and subsurface storm flow
will eventually enter the stream channel. Hence groundwater can also contribute to surface
water, and vice versa. .
There also is an intricate interaction between surface water drainage and river levels, which
can link pluvial and fluvial flooding. Shaw et al. (2011) describe it thus:
“High river levels can reduce the discharge capacity of surface drains because of
reduced hydraulic gradient ... or even back up into drains... Conversely, a surface water
system that conveys water very efficiently may discharge storm water into rivers,
contributing to food risk downstream”.
Observing a direct causal effect from surface water to floods in 2007, Marsh and Hannaford
(2007) explain that:
“An unusual, and very significant, feature of the summer flooding was the high proportion of
damage not attributable to fluvial flooding. Around two-thirds of the properties affected
(>8,000 in Hull alone) were inundated, as drains and sewers were overwhelmed following
the summer storms.
Both the Pitt Review (Pitt 2008) and the Environment, Food and Rural Affairs (EFRA) Select
Committee inquiry on ‘Flooding’ (House of Commons EFRA, 2008) stress the need for
amended institutional and legislative arrangements in order to achieve effective surface water
management. An attempt has been made to address this, by making local authorities
responsible for local flood risk and land drainage in England and Wales (Great Britain. Flood
and Water Management Act 2010). Unfortunately, the concept of pluvial flooding is a
relatively new one in the UK, and few local authorities are in a position to even map the
pluvial flood risks. Shropshire Council (2010) admits that:
Surface water mapping is in its infancy in comparison to fluvial flood risk mapping. As
such, surface water flood maps of Shropshire do not currently exist. Whilst the Level 1
SFRAs for the Districts and Boroughs of Shropshire identified recorded incidents of
surface water flooding within Shropshire, no detailed mapping was undertaken.
Finally, EA (2009) acknowledges a lack of knowledge in pluvial flooding with the words: “Work
continues to improve the understanding and mapping of surface water flood risk”. OFWAT
(2010) likewise explains how OFWAT strives to:
“improve available evidence on the costs and benefits of different solutions for managing
surface water flooding”, and will “promote new methods for incentivising, regulating,
engineering and charging for drainage and surface water flooding risk management”.

9
Shaw et al. (2011, p414) hypothesise that land drainage is so closely related to flood risk
management, that legal responsibility for drainage may in fact be a part of flood management.
In consequence, complex institutional arrangements for drainage can have a detrimental effect
on the planning and responses for flood risk. The link between land drainage and flood risk
management is now well established, therefore needs to be considered in context here.
2.2. Flood Risk Management Johnson and Priest (2008) see the history of flood management as progressing through three
clear phases of: ‘agricultural focused land drainage’, moving to flood defence with an
‘engineered approach’ soon followed by ‘flood risk management’. Myers and Passerini (2000,
pp244-248) describe these phases as: modifying the floods (the structural response),
modifying community susceptibility to flooding (using zoning or warnings), or modifying the
impact of flooding (with insurance or tax breaks). Smith (2000) extends this by dividing
floodplain management into: initial ignorance; interim ‘taming’ (structural) solutions; and finally
learning to live with flooding. All agree that there have recently been two very different
approaches: engineering and holistic catchment management.
2.2.1. Engineering approach Fleming and Frost (2002) describe the prevalence of flood protection engineering in the
1960s, as well as the enhancement of flood estimation methods, with the advent of the rational
method to make run off calculations. These techniques used the source-pathway-receptor
model shown in Figure 2.1, where it was originally felt best to manage the pathway by
controlling the river. At the time, this approach was favoured by engineering companies, who
often had the greatest influence on strategic decision-making. Not until much later were strides
taken toward management of the receptor, by refraining from building on flood plains.
Figure 2.1 Source-pathway-receptor model for floods: the greatest control is with the receptor. Source: Huntingdon and MacDougall (2002)

10
A wealth of papers in the 90s seek to discourage this practice: Ibbitt et al. (1997) note that
once structural defences fail they generally make the situation worse, by creating a sudden
influx of water which has no easy path of retreat. They can even make the overall situation
worse before they fail, by constricting the river flow to the point where levels upstream
increase.
Parker (1995) described this as the ‘escalator effect’, where
“Progressively higher levels of structural flood defence have been provided to protect
against rising flood loss potential associated with floodplain development. Within the
current institutional context, the process is a circular one until the floodplain becomes
completely developed.” (Parker, 1995, p360)
He adds that the downstream flooding is rarely paid for by the organisation causing the
problem. Tobin (1995) sums up the practice of building flood barriers as counterproductive, by
engendering a false sense of security which encourages vulnerable development onto the
flood plain (Figure 2.2), and raising the river levels to create further problems downstream.
Figure 2.2 ‘Defended’ flood plain development: New Orleans after Hurricane Katrina, 2005. Source: Wordpress (2009).
Parker (1995) also noted the arrival during the early 1990s of a growing debate about
‘managed retreat’, or the deliberate process of avoiding the construction of flood defences and
instead permitting the inundation of floodplains.

11
Myers and Passerini (2000) consider the facts that flood are a hazard only after humans
construct a built environment on flood-prone lands. Smith (2000) considers that the true costs
of developing the floodplain is rarely considered, and that education rather than regulation is
the way to break out of the cycle of protect-develop-crisis-concern-protect. He suggests that it
is not the flood plains which need managing, but the people.
Debates such as these made it increasingly clear that the engineered response was
uneconomic and unsustainable, and as stated in Huntingdon and MacDougall (2002), the
natural way to discharge excess river water was to leave space for floodwaters.
“We cannot prevent flooding, we can only strive to prevent its adverse impacts.”
Huntingdon and MacDougall, 2002, (p39).
This paper further suggests that the best way to manage flood risk is to remove critical
buildings and to widen the river corridor to increase flow capacity (p45). This was reflected in
the UK with Defra (2008b) and Defra (2005) in the expressively titled “Making space for
water“, which heralded a new strategic approach to flood risk management in England. At this
point, the ‘conveyance option’ or flood defence philosophy moved towards catchment
management and flood storage.
2.2.2. Holistic catchment management By the early 2000s, Frost and Knight (2002) claim near universal agreement for a holistic
approach to river basin management, and point out that:
“individual flood alleviation schemes cannot be considered in isolation and that what
happens in one part of the catchment will have effects on other areas some distance
away.” Frost and Knight (2002). See Figure 2.3:
Figure 2.3 Flood defences should not be considered in isolation. Source: Fleming (2002b, p18)

12
This movement involves integrated planning for built development, land use patterns, nature
conservation and emergency planning. This change in approach was noted as far back as
1993, in the Ministry for Agriculture, Fisheries and Food’s “Strategy for Flood and Coastal
Defence” (MAFF, 1993), but not generally incorporated into national strategy until early 2000s,
with the Water Framework Directive and Flood and Water Management Act of 2010.
Crichton (2005) demonstrates that non-structural measures, such as planning controls and
sustainable drainage prove a more efficient method for tackling the problem rather than
relieving the symptoms. Frost and Knight (2002) advocate the use of undeveloped land for
flood storage to reduce peak flows downstream. Along with Fleming (2002a) and Rickard
(2002b) they feel this should be regarded as legitimate land use, either within development or
subsidised as agricultural set aside land. Alternatively, English Nature (2001) proposes:
“ encouraging washlands to be considered as a viable flood defence option, together
with investigating the appropriate compensatory payments (such as a washland agri-
environment scheme) that may be paid to land owners“
This is exemplified by the River Quaggy restoration project, (EA [n.d.]), which released the
previously underground river from culverts by converting a local under-utilised park into a
strategic wetland. At high flow, flood waters are allowed to rise back over the park, which can
hold 85,000m2 of water, successfully protecting local houses from flooding (Figure 2.4).
Figure 2.4 River Quaggy: Wetlands in Sutcliffe Park, Lewisham. Source: Landscape Institute (2013).
Rickard (2002b) gives supporting examples of Leigh Barrier on the River Medway, or Lincoln
washlands, which use sluices to fill flood storage. This approach recognises that flood storage
will reduce the overall flow whereas a flood defence will simply pass the peak flow
downstream.
An integrated approach is extolled in ICE (2012), who urge regulatory support for this:

13
“ICE would like to see the advancement of catchment-based approaches for managing
water resources, including best practice in land management. Effective catchment
management planning is a substantial institutional, social and political challenge“
Ellis and Revitt (2010) are encouraged by the number of recent institutional documents
demonstrating the current value placed on catchment management and land-use control.
However, the challenges in this approach are recognised by Potter (2008), who lists a series
of institutional barriers to land use change, such as: complex funding arrangements,
fragmented administrative structures, the demand for multi-agent partnerships, and dismissive
attitudes to an ‘environmental’ approach.
2.3. Floodplain Development Fleming (2002b) looks back at the growth of development on urban flood plains, as cities
increased in size and the demand for building land increased beyond possible supply. The
possibility of occasional flooding seemed at the time to be outweighed by the value of the
development in social and economic terms (Figure 2.5).
.
Figure 2.5 Riverside settlements encroaching on the flood plain. Source: Fleming (2002b, p16)
Since 1995 the EA is statutory consultee to the planning process, in order to include the wider
issues of flood and environmental risk into development. However the economic drivers of

14
floodplain development in England still appear to be paramount. Bosher (2013) assesses
Department for Communities and Local Government Land Use statistics between 1989 and
2010, finding that over those two decades nearly 1 in 10 new dwellings in England is built in
flood prone areas – over 10,000 dwellings in real terms. These figures lead him to the
conclusion that planning regulations have a negligible effect on controlling development on
flood plains. According to Crichton (2005), who quotes similar statistics, Local Planning
Authorities (LPAs) still fail to heed the advice of the EA, and continue to permit development in
flood hazard areas. Porter and Demeritt (2012) attribute this lack of cooperation to the differing
priorities of the EA as compared to LPAs. The EA, with responsibility for flood-risk
management has a significantly narrower focus than LPAs, whose elected officials are
accountable to local voters and are responsible for aspects such as local economic
development, housing provision, and sustainable communities.
The unsound enforcement of planning laws is considered by Parker (2000a, p16), where it
appears that full legislative powers are not always used. This debate is furthered by Monbiot
(2000) who notes that Local Authorities are increasingly playing an enabling rather than
controlling role for developers. He gives many examples where councils are acting in
partnership with developers, and refers to a concept known as ‘offsite planning gain’ where
inducements may legally be offered to councils, to facilitate planning permission. The
Adaptation Sub-Committee of the Committee on Climate Change (2012) feels that the
planning approval process is not sufficiently transparent or accountable. They state that “the
Environment Agency only knew whether or not their advice had been followed in 65% of
planning applications where they had objected.” It is suggested that all too often Local
Authorities did not sufficiently investigate alternatives to building on flood plains, or assess
likely future costs of protection.
As stated within Standard Note 4100, Planning and Flooding, (House of Commons
Library, 2012): “the Environment Agency cannot veto planning applications, so guidance
for planning authorities is particularly important”. This document also refers to the current
“build and protect” policy for flood plains. This phrase is reiterated by Adaptation Sub-
Committee of the Committee on Climate Change (2012), along with a warning that the
current focus on community protection and flood proofing buildings will generate higher
protection costs as risks increase in future. They feel that by 2035 the combination of
climate change and land use trends could virtually double the number of properties at risk
of flooding. Significantly, the committee asserts that:
“Development in the floodplain grew at a faster rate than elsewhere in England over the
past ten years.”
Finally, Rickard, (2002a) makes the point that development on low lying ground not only builds
over the flood plain, but also creates conditions too low for effective sewerage. This raises the

15
risk of contaminated sewage floods, as well as increasing the likelihood of higher groundwater
levels.
2.4. Sustainable Drainage Systems (SuDS) In 1994, Andoh, (1994) linked the integrated management philosophy with a new concept in
water drainage:
“Urban drainage practice and control philosophy until recently has, as result, been
based on solving localised problems either by transferring excessive flows in drainage
systems downstream by upgrading sewer pipes ... Problems of downstream flooding
and pollution and the realisation of the interdependence and interaction of the effects of
the localised control measures, has focused attention, in more recent times, on the need
for an integrated systems approach which looks at urban drainage networks as part of
integrated catchment systems.”
White and Howe, (2002) make the point that:
As development coverage and land use change increases, the natural storage capacity
of the basin may decrease. Furthermore, an intensification in the amount of mainly
impermeable surfaces, results in a higher velocity of runoff from rainfall. Water that
would have previously recharged the water table is now transported quickly into the
nearest watercourse.
Similarly, Reed et al. (1999) state that incremental development increases runoff volumes
incrementally and will aggravate flood risk lower down the river system. They point out that
urbanisation reduces the “beneficial buffering effect of seasonal moisture deficits” and
increases the proportion of the year when floods can take place. The Adaptation Sub-
Committee of the Committee on Climate Change (2012) further suggest that an increase in
surface water flooding due to the prevalence of hard paving in urban areas may grow with
more intense rainfall due to climate change.
White and Howe, (2002) proposed the enhancement of planning controls along with
sustainable drainage systems, or SuDS, These have since been encapsulated in planning
regulations and enforced under the Water Framework Directive 2000, completing the 10 year
evolution of a conceptual, novel idea to a standard design in mainstream urban development,
(Goodson, 2011).
SuDS is defined as a portfolio of surface water mechanisms, which seek to detain water from
gravity channels by means of attenuation, infiltration or temporal storage. These can improve
water quality by infiltration, replenish groundwater storage, or simply delay the downward flow
of runoff water to reduce peak flow levels (Goodson, 2011). Shropshire Council (2010) list

16
SuDS methods to include: green roofs, soakaways, infiltration techniques, wetlands and
rainwater harvesting. These are detailed in Table 2.1:
Table 2.1 Options for SuDS techniques. Source: Shropshire Council (2012)
Similar techniques on a larger scale are proposed by the EA (2012e) for more rural
applications, in ‘Rural Sustainable Drainage Systems’.
2.5. Resilience Resilience can be defined as “the capacity of human and physical systems to cope with and
respond to extreme events” Bosher et al. (2009) and in the case of flooding can take many
forms, from building protection using wet or dry flood proofing, to householder support
services, or flood insurance.
2.5.1. Flood-proofing Flood resistant buildings are considered by Rickard (2002b), who proposes raised living areas,
concrete rather than wood floors, higher level power sockets and wiring, and non-wood
kitchen materials. This uses the technique of ‘wet’ flood proofing – permitting flood water to
flow through the lower levels of the house, and using appropriate design and materials to
resist the effects of water rather than vainly resisting the water itself. The traditional technique

17
of ‘dry’ flood proofing relies on external barriers to resist the intrusion of floodwater into the
house, which can only have limited success, and even when successful can cause structural
damage by the pressure of external water.
2.5.2. Flood Insurance Insurance can offer the benefit of spreading the cost of flooding over time and space, but as
Arnell (2000) points out, this arguably allocates a disproportionate cost for those who choose
to live in low risk areas. He also raises concerns that comprehensive flood insurance, while
protecting householders from loss, can also encourage occupation of flood plains by
emphasising protective measures after construction, rather than wise land use. He considers
the merits of schemes in such countries as the US, where a national flood insurance
programme (NFIP) provides financial protection for communities in existing buildings whilst
restricting cover for newer constructions in high risk areas. By linking the penalties to the
decision maker, flood risk management can directly affect land use control. In France and
Australia there exist similarly linked scheme with insurance which pays householders only if
local land use rulings have been observed. Few countries, however, link land use to insurance
payouts in this way.
Shaw et al. (2011) point out that historically, communities have expected the state to solve
their problems; to reduce the likelihood or consequences of a flood, and to subsidise
insurance. This philosophy now appears to be shifting, a change which exposes tensions
between individual and collective responsibilities, as can be observed in a recent renegotiation
of flood insurance in Britain. Recently the Association of British Insurers (ABI) has been
lobbying the government to share the financial risk of underwriting of cover for householders in
flood prone areas. This fundamentally changes an arrangement that remained in place for
more than 50 years.
Huber (2004) describes the 1961 arrangement as a ‘gentlemen’s agreement’, between
Government and the insurance industry. This agreement divided the responsibility between
the state provided flood defences, and the private companies insuring householders for flood.
The insurers guaranteed that residential properties could insure again flood risk at an
additional premium not exceeding 0.5% on the sum insured, no matter what the risk. However,
increasing flood risk due to climate change trends and land use changes, and several serious
flood years (1998 and 2000), combined with a perceived lack of state investment in flood
protection, led to alarm on the part of the insurance industry, who initiated renegotiations
between with the government.
As a result, a finite term ‘agreement of principles’ was settled in 2002, to include a
commitment from the government to increase flood defence spending and further regulate
land use controls. The insurance industry agreed to insure ‘as many as possible’ residential
properties at a competitive rate but reflecting actual flood risk. This agreement expired in June

18
2013, by which time further flood events had occurred in 2004, 2007 and 2012, so three
working groups were established to continue negotiations with the Association of British
Insurers (ABI), (House of Commons Library, 2013a).
Johnson and Priest’ (2008, p522) consider that the progressive emphasis on non-protective
measures greatly affects this agreement, leading to the conclusion that the insurance industry
is:
“.. likely to remain committed to lobbying for continued investment in structural defences
since these are the factors that will allow them to reduce claims and maximize profit.”
This requirement for flood defences put the insurance sector out of step with current trends in
flood risk management.
Defra Network (2013) announced a new agreement in July 2013:
“The new agreement will cap flood insurance premiums [according to council tax
bands]... To fund this, a new industry-backed levy will enable insurance companies to
cover those at most risk of flooding. All UK household insurers will have to pay into this
pool, creating a fund that can be used to pay claims for people in high-risk homes.”
The Association of British Insurers (ABI, 2013) describes the agreement as:
“..an agreement in principle between UK insurers and the Government to develop a not-
for-profit flood fund – known as Flood Re – to ensure that flood insurance remains
affordable and available to homeowners at high flood risk.”
This renegotiation could be seen as following a gradual trend from state support to individual
responsibility, while walking a fine line to balance political and commercial demands.
2.6. Institutional Management The past 25 years have seen repeated updates in British legislation for drainage and water
supply, now showing a new interest in flooding. These statutes consolidate centuries of
change, from agricultural drainage to the tenets of environmental protection and flood risk
management. In order to drive these principles onward, new hierarchies and layers of control
have been established, in an attempt to rationalise management of surface water (Johnson
and Priest, 2008). The Policy Investigation in chapter 4 further examines how the paradigm
changes discussed above in section 2.2, have culminated in strategic changes in direction for
key institutions.
A number of ethical dilemmas are presented by flooding, as considered by Parker (2000b),
especially the responsibility for protection, warning and safety of the public. Policy decisions
set the framework for this moral responsibility held by landowners, developers, planners,
architects, engineers, government and householders.
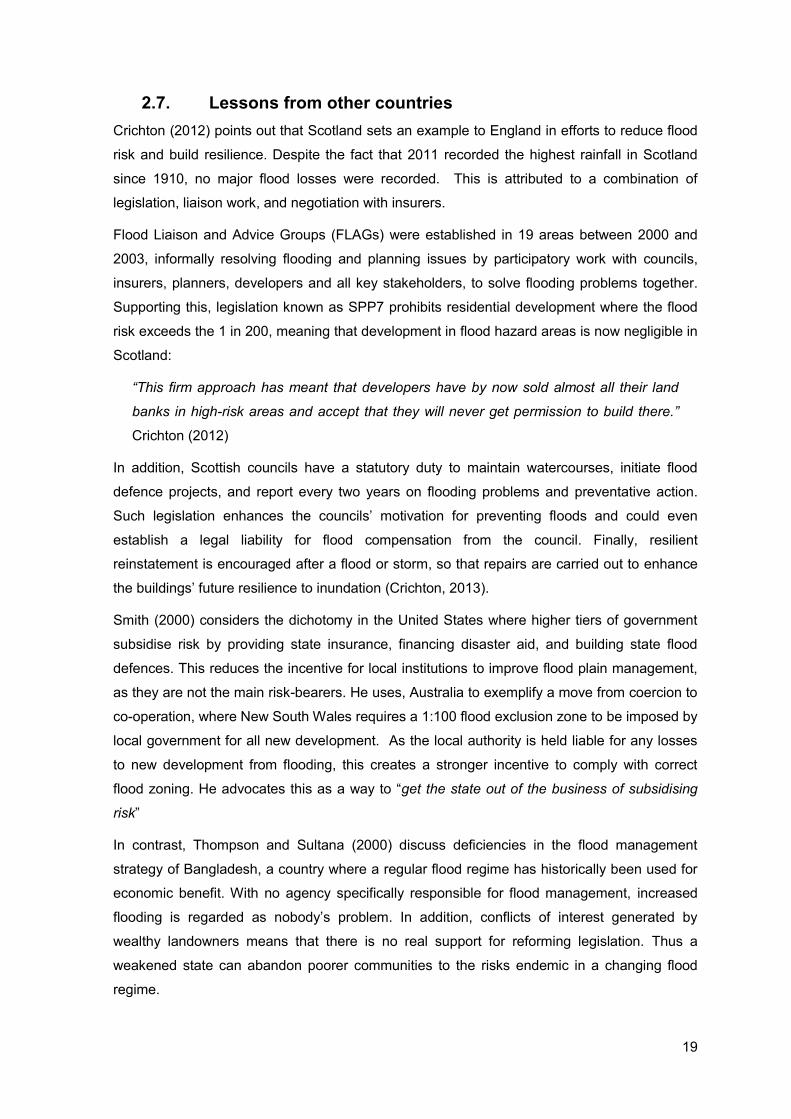
19
2.7. Lessons from other countries Crichton (2012) points out that Scotland sets an example to England in efforts to reduce flood
risk and build resilience. Despite the fact that 2011 recorded the highest rainfall in Scotland
since 1910, no major flood losses were recorded. This is attributed to a combination of
legislation, liaison work, and negotiation with insurers.
Flood Liaison and Advice Groups (FLAGs) were established in 19 areas between 2000 and
2003, informally resolving flooding and planning issues by participatory work with councils,
insurers, planners, developers and all key stakeholders, to solve flooding problems together.
Supporting this, legislation known as SPP7 prohibits residential development where the flood
risk exceeds the 1 in 200, meaning that development in flood hazard areas is now negligible in
Scotland:
“This firm approach has meant that developers have by now sold almost all their land
banks in high-risk areas and accept that they will never get permission to build there.”
Crichton (2012)
In addition, Scottish councils have a statutory duty to maintain watercourses, initiate flood
defence projects, and report every two years on flooding problems and preventative action.
Such legislation enhances the councils’ motivation for preventing floods and could even
establish a legal liability for flood compensation from the council. Finally, resilient
reinstatement is encouraged after a flood or storm, so that repairs are carried out to enhance
the buildings’ future resilience to inundation (Crichton, 2013).
Smith (2000) considers the dichotomy in the United States where higher tiers of government
subsidise risk by providing state insurance, financing disaster aid, and building state flood
defences. This reduces the incentive for local institutions to improve flood plain management,
as they are not the main risk-bearers. He uses, Australia to exemplify a move from coercion to
co-operation, where New South Wales requires a 1:100 flood exclusion zone to be imposed by
local government for all new development. As the local authority is held liable for any losses
to new development from flooding, this creates a stronger incentive to comply with correct
flood zoning. He advocates this as a way to “get the state out of the business of subsidising
risk”
In contrast, Thompson and Sultana (2000) discuss deficiencies in the flood management
strategy of Bangladesh, a country where a regular flood regime has historically been used for
economic benefit. With no agency specifically responsible for flood management, increased
flooding is regarded as nobody’s problem. In addition, conflicts of interest generated by
wealthy landowners means that there is no real support for reforming legislation. Thus a
weakened state can abandon poorer communities to the risks endemic in a changing flood
regime.

20
2.8. Future Risk Pressures caused by increased urbanisation, land use changes and changing patterns in
agriculture have been creating new demands on land use. These are now combined with
changes in climate patterns to stress the river and drainage beyond previous expectations:
“The two main factors affecting floods, the meteorology and the physical conditions in
the river basin, have both varied significantly in the recent past”, (Fleming and Frost,
2002, p6)
Converging evidence on climate change supports the estimation that peak flows over a given
return period could increase 20% in 50 years (NCE, 2001).
According to the Adaptation Sub-Committee of the Committee on Climate Change (2012):
“Current evidence suggests that increases in rainfall intensity and the frequency of high
river flows are likely under a changing climate, leading to an increased risk of surface
water and river flooding in the UK”.
This report makes it clear that flood has been identified by the Government as one of Britain’s
largest current risks. In addition, the Climate Change Risk Assessment (2012) identifies that
flood risk is projected to rise significantly in Britain, from £1.3 billion, to £2.1 - £12 billion by the
2080s.
2.9. Summary The material reviewed considers factors as various as hydrology, flood risk management, land
use changes, climate change and issues from other countries. These give a good basis for
further exploration into the research questions and objectives. The lack of directly relevant
material is noted, and considered indicative of lack of research in this area. Every opportunity
has been taken to explore a diverse range of background knowledge in order to inform this
investigation with the relevant philosophies and technologies in this area.

21
3. Methodology This chapter describes the methodology used within this project, expands on the sources of
data to be used, and compares this approach with those employed by previous researchers in
this field.
3.1. Approach According to Guba and Lincoln (1994) a paradigm is the researcher’s world view, defining a
basic set of beliefs about the nature of the world and establishing the researcher’s place in
that world. Each researcher’s belief set defines their inquiry paradigm, in this case the
methodological question, determining how to investigate the inquiry in hand. This paradigm
may be positivist, denoting a traditionally scientific approach to data, or constructivist,
indicating a more dialectical approach; however it may not encompass both. Given the policy
review aspect of this research, there is a clear positivist approach to the paradigm behind this
project, indicating a mainly quantitative methodology. Maps, legislation, and boundaries of
responsibility are irrefutable evidence and objective data, playing a major part in determining
responsibilities for water management.
Regarding the methodology behind the research, this may be quantitative or qualitative or
even mixed (Guba and Lincoln, 1994), and in this case the methodology is mainly quantitative.
Transect walks, both physical and theoretical, are used to map boundaries of responsibilities:
these are of a quantitative nature, and may be complex in interaction, but still feasible to
illustrate on a map. Interviews are more qualitative in nature and may add richness to the data,
but still contain quantitative data and are used to reinforce findings and triangulate information.
Triangulation will be used to validate data collected by each method, for instance regulations
will be reviewed directly, then an attempt made by interviews or observation to assess the
implementation of regulations in practice. Transect walks will then validate the data gleaned
from previous sources.
An inductive reasoning approach will be taken here, working from the bottom up to gather
information, then to develop generalisations and theories. There is no preconceived theory to
prove, rather an interest in the effect created by multiple institutions managing surface water in
a flood prone area.
3.2. Approach observed from literature review The literature assessed used a variety of data sources, including interviews with key
stakeholders, physical observation, literature reviews, and policy reviews. Key background
material such as Caponera (1992), Sewell and Barr (1977) and Parker and Sewell (1988)
developed policy reviews mainly by consulting legislative and policy documentation.

22
Input to policy decisions includes reviews such as the Pitt Review (Pitt, 2008), which examines
over 1000 written submissions, as well as consulting widely, reviewing other countries and
visiting flood-affected communities. Other source reviews include the “Flooding” report by the
House of Commons EFRA Select Committee (2008), which solicited data from members of
the public and MPs; held a formal inquiry hearing MPs, flood-affectees, and expert witnesses;
as well as visiting flood-washed towns.
Among the more analytical material, Coulthard and Frostick (2010) specify that they draw on
studies and independent reviews (Coulthard et al., 2007), which draw information from primary
stakeholder discussions, reports from the public, statutes and incident reports. Others, such as
Bosher et al. (2009), use mixed sources; interviewing professionals from construction,
planning, insurance, emergency management and local/national government agencies, as well
as assessing questionnaire responses.
The methodology adopted by Watson, et al. (2009) consists of analysing a mix of data
sources: content analysis of policy documents, grey literature and academic publications, plus
observations at planning meetings, and interviews with senior stakeholders. This is supported
by similar methodology used by Porter and Demeritt (2012) who triangulate information from
formal policy documents with semi structured interviews with Environment Agency (EA) staff,
followed by deeper unstructured interviews with local planners.
In general, a pluralistic approach can be observed, combining data from policy reviews,
interviews, written submissions and site visits, and this approach is to be emulated as far as
possible within this project. The transect walk approach appears not to have been used in any
of the literature examined.
3.3. Case study The core of this project is the case study, offering the opportunity to sample data from five
locations within the catchment. This permits examination of many paths of water from different
terrains, logically tracked from precipitation into a river and thence the sea. This track is
mapped onto the responsible bodies, to directly denote institutional management of that water.
The intention of this mapping is to examine the complexity of current management
responsibilities.
3.3.1. Reason for case study approach The case study approach enables a number of runoff paths across the catchment to be
mapped, linking water flows and sources to their respective responsible owners. The
challenge then is to find an explicit method for presenting this relationship mapping. This is
addressed in section 3.8 below.
The River Severn has been chosen partly due to its length; at 290 kilometres it is considered
the longest river in Britain, draining an area of 2,065 km2, and as a consequence its diversity.

23
Changes in flow and demeanour are evident as it flows down from the Welsh hills, into
Shropshire then across the lowlands of Worcestershire and Gloucestershire (Biggs, 2009). It
ultimately evolves into the Severn estuary where it is bridged by the 990m span Severn
Bridge, before flowing into the Bristol Channel and Irish Sea (Encyclopaedia Britannica, [n.d.]).
The river rises at over 800m above sea level, in an area where average rainfall exceeds
2000mm. It has several mountain tributaries before reaching the Montfort gauging station near
Shrewsbury. The drainage area for Montfort is 4325km2, with 50,000Ml of storage developed
in 1968, at Clywedog reservoir (known locally as Llyn Clywedog, see Figure 3.1). However this
reservoir is near the river’s source, where it can provide minimal flood storage, and has a
drainage area of only 49 km2 (Shaw, 1989). These factors all contribute to the diversity and
longstanding flood history of the River Severn, making the catchment an interesting area for
study.
Figure 3.1 Upper Severn catchment, showing water storage. Source: Shaw (1989), annotated by author.

24
At least one town on the Severn is sought for a specific case study area. Preferred aspects of
this location include: regular new development, both industrial and residential; a recent history
of flood events, a wide range of managing entities and diversity of topographical features.
3.3.2. Selection criteria for case study area In order for the final relationship mapping to be meaningful, it is important to select the case
study area carefully. A methodical selection is necessary to avoid the effect of researcher bias,
so a series of selection criteria has been developed and tabulated for comparison.
It has been decided to select an area with a history of flooding, where management of surface
water is taken seriously, in order to explore the institutional link with disaster risk reduction.
For this reason several of the criteria are linked to flooding. The flood history of the area is
included, especially the number of years designated as major flood events. Consideration is
given to current flood protection, and any other factors such as local resilience to flood events.
Topography is related not only to flooding but also to behaviour of watercourses and the effect
of local institutions such as internal drainage boards (which are mainly in the lowlands).
Topography is therefore included as one of the criteria tabulated here.
The response of the local authority to the Flood Risk Regulations of 2009 is considered, both
as indicating a serious approach to surface water management, and denoting a likely flood
risk. The Flood Risk Regulations of 2009 stipulated that the EA and Local Authorities had to
prepare Preliminary Flood Risk Assessments (PFRAs) by December 2011. (see section
4.3.3). The PFRA, is therefore one of the key documents to be expected on a comprehensive
local authority website. Surface Water Management Plans and flood risk maps need only be
produced if flood risk areas are identified in the PFRA. The availability of these additional
documents on a council website is taken as indication both that information is available and
that flood risk is established in this area.
Availability of other information such as maps, contacts, and guidance documents is included
to support these criteria. As evidence of planning regulations is to be one of the threads of
investigation, usability of the local planning portal is considered and added as a selection
factor. Evidence of a local plan is included for the same reason.
Finally, consideration of local partners is observed from PFRA documents, and included to
indicate a variety of stakeholders and potential richness in results.
All these criteria are tabulated for review in Table 3.1 below:

25
Table 3.1 Criteria for selection of case study area. Sources: Data is collated from council websites, EDINA [n.d.], EA [n.d.]a, with flood history data from Black and Law (2004).
WORCESTER SHREWSBURY TELFORD TEWKESBURY
LOCAL
AUTHORITY Worc county council
SHROPSHIRE County
Council
Telford and Wrekin
Council
Gloucestershire County
Council
FLOOD
HISTORY
1990, 2000, 2004,
2007, 2012, 2013
1998, 2000, 2002,
2004, 2007, 2012 2004, 2007 1990, 2004, 2007
LA WEB INFO GOOD OK OK GOOD
WEB DOCS
Many, clearly
referenced
Many, but only with
careful searching Very few on website Many on GCC website
CONTACTS None listed
uk 0345 678 9006
Flooding team : Tel:
01952 384876 Not listed
LOCAL MAPS None on website Good interactive map None on website Link to offsite map
LOCAL PLAN Full details on website
Framework and core
strategy
Core strategy, local
plan and action plan
Local plan 2011, Core
strategy
PLANNING
INFO
search by week, full
docs, slow loading
search by week, full
docs, efficient
search by week, full
docs, efficient
search by week, full
docs, efficient
TOPO-
GRAPHY
Very flat terrain,
historic floodplain
Melverley floodzone.
River loops in city
Flat terrain at Telford.
Main risk at Ironbridge,
in gorge
Flat terrain, confluence
of Severn and Avon,
floodplain
HEIGHT above
sea level
20m above sea level
(ASL)
60m in city; 330m
above Melverley
140m at Telford, 40m
at river in Ironbridge 10m ASL
OTHER LOCAL
COUNCILSSix district councils
Shrewsbury town
council
Tewkesbury Borough
Council
OTHER
FACTORSCanal through town
Melverley is EA flood
point National Growth point
historic community
resilience to floods
LOCAL
PARTNERS Severn Trent. Lower
Severn IDB.
Severn Trent Water.
Dwr Cymru. Severn Trent; Strine IDB
LSIDB; Severn Trent, 6
District councils
DOCUMENTS
ON WEBSITE
Preliminary Flood Risk
Assessmemt (PFRA)
only
Surface water mgt,
Strategic flood risk
assessment, PFRA PFRA only
Strategic flood risk
assessment, PFRA
FLOOD
DEFENCES
Permanent flood
barriers and walls
Temp flood barriers
deployed as needed
Temp flood barriers
deployed as needed
Water plant only,
£205k budget 2013
26
3.3.3. Finalising the case study area Tabulating all the local data available at this stage makes it possible to see the key differences
between areas at a glance. It then becomes clear that Worcester and Tewkesbury are similar
in terms of stakeholders and terrain, both working with an internal drainage board and Severn
Trent Water, and based in low lying areas with broad flood plains (see Figure 3.2). However,
information is more readily available from Worcester, with a good quality website and
comprehensive document archives and it is judged likely that the size of the city will make it
easier to access data, and that the institutional variety will provide more diverse insights.
Figure 3.2 Map of potential case study areas in Severn Basin. Source: From EA (2009a, p8), annotated by author.
Shrewsbury is similarly diverse and well sized, with interactive flood maps and many available
strategic documents. The terrain is extremely varied with hills and major tributaries close to the
west, and the use of demountable flood barriers and necessary protection of historic features
offer further interest. The two larger cities both offer diversity of stakeholders and ongoing
development, while having contrasting terrain and different local authorities. In contrast
Telford, being located in between Shrewsbury and Worcester, offers little additional interest
other than a differing IDB (Strine) and a designation as a national growth point. Given that
river actually passes through Ironbridge, rather than Telford, it is concluded that Telford has
even less to offer than Tewkesbury.

27
It is therefore judged best to focus data gathering on the two larger towns of Shrewsbury and
Worcester, to demonstrate any difference between counties, terrain, and upper/lower reaches
of the river. In addition, two smaller rural investigations will also be conducted, to provide
balance and reflect the full range of terrain cross the catchment. One location is the source of
the Severn, for completeness and mountain terrain, and the other examines the border hills
area between England and Wales, to demonstrate administrative diversity.
3.3.4. Selecting the transect walk routes According to Population Communication Services (PCS) [n.d.], a transect walk is conducted
by following a pre-mapped path through all zones of project interest, in order to observe local
conditions and obtain detailed information. The intention in this project is to observe conditions
along the likely path of travel for surface water. In a typical transect walk this includes social
conditions, but here the main issues are ownership and responsibility boundaries, along with
physical channel conditions.
Ibbitt et al. (1997) and Jones (2000) all note that antecedent storage conditions will affect
runoff, including the shape and slope of catchment, permeability of ground, channel slope and
roughness, and land use. The locations for the transect walks are therefore selected with the
aim of traversing many of these aspects, in order to present a representative sample. Multiple
routes are plotted for each location, in order to provide sufficient samples for a variety of final
diagrams.
3.4. Sources of data The following are proposed as sources of data:
3.4.1. Literature review A literature review is undertaken in order to establish the extent of previous work in this area,
to establish any gaps in information and to structure background data. It is necessary to
understand current thinking on issues such as flood risk management, hydrology, sustainable
drainage, international approaches, flood insurance and development on flood plains. This will
facilitate informed decisions regarding methodology, especially data collection via transect
walks and interview questions. See Box 3-1 for details on search methodology.
3.4.2. Policy review Legislation and policy are a key source of institutional data, therefore an exploration of such
data is undertaken in the form of a policy investigation. This includes recent statutes relating to
water resources, flood management, surface water control and drainage, as well as older
legislation with a bearing on the subject. In addition, regulation and policy documents
regarding planning, highways and waterways are investigated where they have a bearing on
roles and responsibilities towards surface water. A detailed understanding of relevant

28
regulations and recent legislation is necessary in order to appreciate the distinctions between
different institutions and their responsibilities for different aspects of surface water.
3.4.3. Information issued by institutions Information issued directly by institutions, such as flood maps, surface water management
reports, statutes and regulatory documents are an essential source of data for the policy
review and are used to direct data collection.
Information is maintained at a current level by registering for email updates on government
websites, planning portals, and professional bodies. Data from these sources needed careful
reading and triangulation to establish detailed facts, but are often the only source for hard
background information.
3.4.4. Information from contacts Contacts have been established as per Table 3.2 and useful information has been forthcoming
immediately from some contacts. Lower Severn IDB has given full information and references,
Shropshire Flood Manager has shared local documents, and Wychavon District Council (who
deal with drainage on behalf of Worcester Council) has shared useful background information
now that the right person has been located. The EA has responded with an offer for interview
but Severn Trent has failed to reply other than to repeatedly acknowledge receipt and promise
a response within 10 days.
Table 3.2 Contact details for stakeholder interviews. All data from organisational websites and enquiries.
The ensuing interviews should provide enlightening insights from professionals involved in the
sector at an operational level.
ORGANISATION INITIAL EMAIL
INITIAL NUMBER
DATE OF REQUEST RESPONSE TITLE
LAST ACTION
Shropshire Council
[email protected] 30/05/13 yes
Flood and Water Manager, reply 6/6
Worcester Council (Wychavon DC)
[email protected] 07/06/13 yes
Senior Asst Engineer, South Worcester Land drainage partnership reply 24/6
Environment Agency
enquiries:environment-agency.gov.uk
01709 389 201 (Mon-Fri, 8am - 6pm) 08/06/13 yes
Flood & Coastal Risk Management Advisor -- Partnership & Strategic Overview Team reply 27/6
Severn Trent Water
08456 016 616 08/06/13 receipt only None chased 19/6
Lower Severn IDB
01454 413340 08/06/13 yes
Civil Engineer, Lower Severn Internal Drainage Board
Interview 11/07/13
Agricultural / landowner? N/A 08/06/13 yes
Farm Manager, Powys.

29
3.4.5. Theoretical ‘transect walks’ across case study areas Before the physical transect walks could take place it is necessary to perform the same route
as a desk ‘walk’. This fulfils the purpose of investigating the terrain and any likely findings in a
short time, enabling the most institutionally varied router to be selected. This work is carried
out using paper maps, local authority interactive maps, and the academic mapping tool
Digimap, which permits examination of contours and watercourses in detail.
3.4.6. Tracking planning request - including flood risk advice In order to establish the relationship between the EA and Local Authorities with regards to
local planning permission, an example has been sought of a planning application for housing
development in a flood risk area. This would normally require submission of a Flood Risk
Assessment (FRA) and would serve to highlight the advisory role of the EA in such cases. As
part of this investigation, local strategic plans for surface water management are reviewed
alongside the planning application.
3.4.7. Interviews with stakeholder representatives A number of different institutions have been approached in order to understand how these
responsibilities are implemented in practice in the case study area. Subsequently, contacts
within local authorities, the environment agencies and other stakeholders have been
developed in order to interview representatives of each institution directly. This includes
organisations such as Internal Drainage Boards, local land owners or users, the EA and
relevant Local Authorities, in order to assess the responsibilities accepted by different
stakeholders in this issue.
These contacts are interviewed in a semi-structured format, with prepared questions but
following interesting aspects as they arose. The intention is to highlight exactly how the
different responsibilities are implemented in practice in the case study area.
This approach enables the triangulation of data, whilst obtaining new perspectives and
insights into real world problems and common solutions.
3.4.8. Transect walks across case study areas Transect walks provide the final ‘boots on the ground’ approach to the investigation, tracking
the route taken by surface water as it passes through the case study area, ultimately
identifying ‘ownership’ along the route. A variety of walks are selected, seeking to cross as
many differing zones of institutional management as possible, to explore the interaction
between various entities. These are selected from the theoretical ‘transect walks’, benefiting
from the previous investigation in order to select the richest potential runoff route.

30
Box 3-1: Literature Search Techniques
Literature Search Techniques
Snowballing
Three papers acted as a trigger for this research project (Coulthard et al., 2007, Coulthard and
Frostick, 2010 and Porter and Demeritt, 2012). All have proved useful in terms of content and
further references, as well as leading to newer publications which cite them. This technique of
snowballing from relevant papers is one effective search technique, but requires discipline to
track links effectively. It also risks repeating the same influences and sources.
Initial library catalogue and shelf searches for background on water institutions lead to
institutional websites and further links which generate more documents. More academic papers
are then sought for a more critical analysis of these institutions..
Database searches
Searching library databases and Google scholar for fresh material requires inventive use of
search strings. Checking keywords for relevant documents already identified, suggests:
These are searched in combination and refined to produce manageable results. Searching
geo/eco/water databases in this way yields excellent results, including direct links to relevant
journals. The search strings are refined as the issues are explored, a better understanding of the
topic is developed and the evaluation of source and content becomes faster.
Multiple options for England/Britain/UK necessitate repeated searches with small changes to the
search strings. This is time consuming, and multiple keywords denoting ‘institutional’ or
‘governance’ compound the effect. .
Rapid evaluation
Scanning long results lists by eye becomes the most effective technique for refining results. This
requires rapid judgement based only on title details; however, several factors soon became clear
evaluation criteria. Firstly, the most useful publications are post 2007 floods and the consequent
regulatory adjustments. Secondly, much of the institutional data is superficial and publicity
orientated. Papers are therefore judged by date, author and publisher, as well as
recommendations from academics or contacts.
Abstracts are then skimmed in order to establish relevance, and interesting content can be
scanned for pertinent topics and interesting insights. In this way, large numbers of relevant
documents can be identified.
governance; drainage; urban drainage; SuDS; flood; risk; regulation; bureaucracy; institutional
arrangements; institution; statute; legislation; governance; government; England; Wales; Britain;
UK; Europe; risk governance; bureaucratic...

31
3.5. Stakeholder analysis Stakeholders in this case are likely to include:
The analysis chapter assesses the various stakeholder responsibilities for the watercourses
identified from the mixed data sources. A combination of source data is synthesised, using
policy documents, interviews with key stakeholders, map data and physical observations.
Graphical diagrams present the influence of all relevant agencies, exploring the complexity of
institutional management in flood risk areas, and any mitigation by recent legislation.
3.6. Tools used Large scale ordnance survey maps are a key tool for theoretical catchment analysis. This
includes both paper and interactive maps, with particular use of Digimap to establish key
points in the catchment and assess many of the selection criteria in the case study area.
Digimap is also used to develop theoretical ‘transect walks’, as well as permitting annotation in
order to illustrate findings in the final presentation. These annotated maps are then printed for
use as reference while performing physical transect walks. Digimap also offers the facility for
historic maps from the 1890s onwards, permitting the identification of culverted city
watercourses which previously flowed overland.
Graphical diagrams are to be developed using readily available PC tools such as Paintbrush,
MSOffice Picture Manager and Visio, which are also used to adjust and annotate photographs
and maps. Document search and evaluation tools are detailed in Box 3-1: Literature Search
Techniques.
Defra
The Environment Agency
Local Authority (as Lead Local Flood Authority).
District Councils. (who may implement surface water management in practice)
Internal Drainage Boards (such as Rea IDB, Lower Severn IDB)
Local Planning Authority
Highways Authority
Highways Agency
Severn Trent Water
British Waterways (where canals exist, such as Worcester)
Private landowners
Business and agricultural land owners
Organisational landowners such as Shropshire Wildlife Trust.
OFWAT

32
3.7. Limitations of Methodology This approach gives the benefit of multiple sources, enabling data to be triangulated, verified
and enriched. The policy investigation provides direct information on institutional roles and
responsibilities, the theoretical ‘transect walk’ permits the optimal route to be selected, and the
physical transect walk offers direct observation, possible adjustment and deeper
investigations. Interviews are then used to corroborate this data and develop new insights.
Such a rich range of data should permit a broad understanding of the issues revealed.
However one limitation of this approach is anticipated as difficulty in persuading stakeholders
into interviews, or limitations in frankness of interviewees. Planned mitigation includes
attempting to establish contacts with multiple organisations from an early stage in the
research. Further problems could be in accessing internal data, such as sewerage or drainage
maps, or reasons for planning decisions. Where such information is not available, a logical
assumption is made and the reasoning behind it explained in the assumptions section.
In many cases surface water runs across private land and access may not be possible (Figure
3.3). It may be necessary to surmise some surface water routes from contours and OS maps.
Figure 3.3 Padlocked access to Rad Brook, Shrewsbury. Photograph taken by author, July 2013
3.8. Presentation of findings Data established by these means is presented initially by a mapped route in graphical format,
using annotated Digimap output to demonstrate changes in terrain and route. These maps are
then analysed, data extracted, and further expressed using colour coding to illustrate all
changes in institutional responsibility.
Finding a meaningful illustration which works in a paper format presents some challenges, as
few precedents are found for such work. The initial preference is for a colour coded line to
represent institutions along a transect route; however this presents limitations in terms of
representing the terrain as well as ownership and responsibility. The main aspects to be
illustrated are: the physical form of water, type of channel ownership, the terrain, and drainage
responsibility. In this manner it is hoped to present useful analytical data for further
exploration.
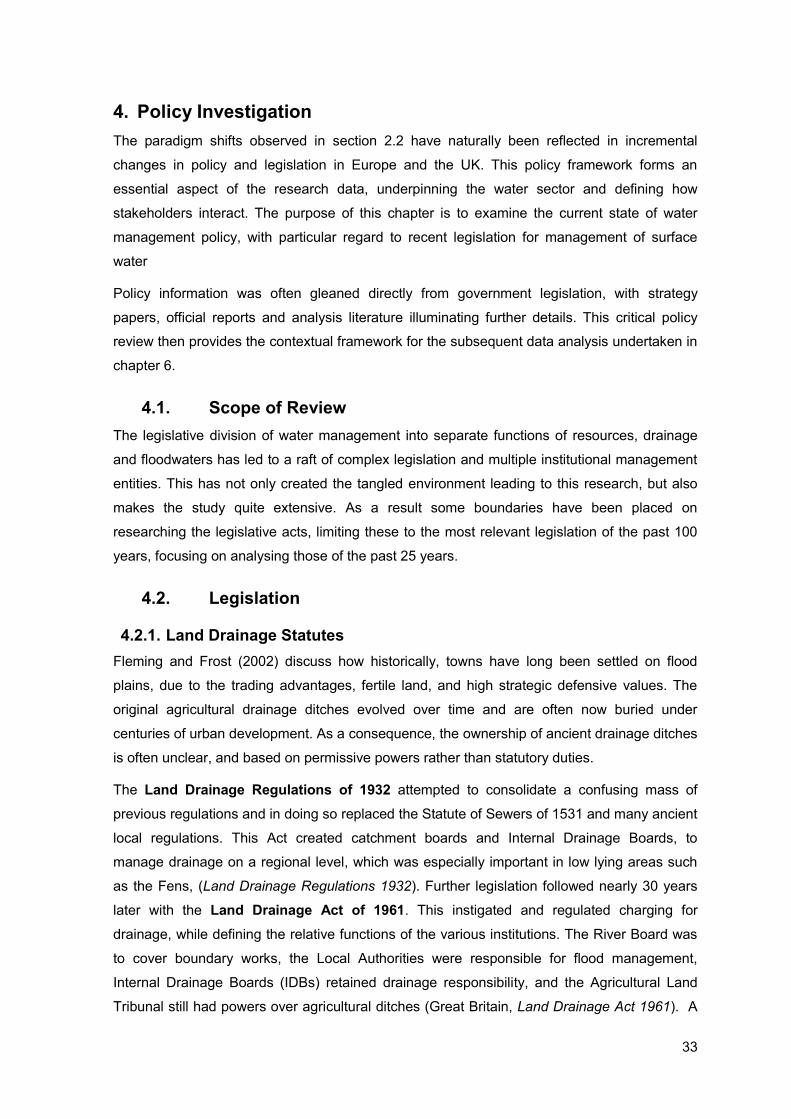
33
4. Policy Investigation The paradigm shifts observed in section 2.2 have naturally been reflected in incremental
changes in policy and legislation in Europe and the UK. This policy framework forms an
essential aspect of the research data, underpinning the water sector and defining how
stakeholders interact. The purpose of this chapter is to examine the current state of water
management policy, with particular regard to recent legislation for management of surface
water
Policy information was often gleaned directly from government legislation, with strategy
papers, official reports and analysis literature illuminating further details. This critical policy
review then provides the contextual framework for the subsequent data analysis undertaken in chapter 6.
4.1. Scope of Review The legislative division of water management into separate functions of resources, drainage
and floodwaters has led to a raft of complex legislation and multiple institutional management
entities. This has not only created the tangled environment leading to this research, but also
makes the study quite extensive. As a result some boundaries have been placed on
researching the legislative acts, limiting these to the most relevant legislation of the past 100
years, focusing on analysing those of the past 25 years.
4.2. Legislation
4.2.1. Land Drainage Statutes Fleming and Frost (2002) discuss how historically, towns have long been settled on flood
plains, due to the trading advantages, fertile land, and high strategic defensive values. The
original agricultural drainage ditches evolved over time and are often now buried under
centuries of urban development. As a consequence, the ownership of ancient drainage ditches
is often unclear, and based on permissive powers rather than statutory duties.
The Land Drainage Regulations of 1932 attempted to consolidate a confusing mass of
previous regulations and in doing so replaced the Statute of Sewers of 1531 and many ancient
local regulations. This Act created catchment boards and Internal Drainage Boards, to
manage drainage on a regional level, which was especially important in low lying areas such
as the Fens, (Land Drainage Regulations 1932). Further legislation followed nearly 30 years
later with the Land Drainage Act of 1961. This instigated and regulated charging for
drainage, while defining the relative functions of the various institutions. The River Board was
to cover boundary works, the Local Authorities were responsible for flood management,
Internal Drainage Boards (IDBs) retained drainage responsibility, and the Agricultural Land
Tribunal still had powers over agricultural ditches (Great Britain, Land Drainage Act 1961). A

34
further Land Drainage Act in 1976 was subsequently superseded in 1991 (Great Britain, Land
Drainage Act 1976).
The 1991 Land Drainage Act consolidated the enactments specifying the functions of Internal
Drainage Boards (IDBs) and drainage related activities of Local Authorities. It specified the
duties, constitution, funding and powers vested in IDBs, and detailed the relative land drainage
responsibilities of Local Authorities and Agricultural Land Tribunals (ALTs). ALTs were
empowered to manage the interaction between different agricultural land owners, where an
order is issued in order to improve drainage across a neighbour’s land. The 1991 Land
Drainage Act also covered the revised designation of IDBs, the provision of land drainage, and
financial obligations related to both (Great Britain, Land Drainage Act 1991).
The 1991 Act was itself subsequently updated in 1994 to repeal certain environmental and
conservation aspects of the work of IDBs, as well as ensuring access to such areas by the
public (Great Britain, Land Drainage Act 1994). However 1991 remains the key statute for
drainage liabilities and rights (ICE, 2010).
4.2.2. Water Resources Statutes Growing water scarcity and poor water quality in urban centres led to a review of the water
industry in the 1950s. Bold recommendations were made, highlighting centuries of
fragmentation into thousands of units,
and lack of coordination between
agencies, leading to reform of the
sector in the early 60s. The 1963 Water Resources Act (Great Britain,
Water Resources Act 1963)
established 29 River Authorities to
replace the 34 River Boards, which
had been in place since 1950, in turn
replacing Catchment Boards
established in the 30s. The River
Authorities had similar catchment
boundaries to River Boards (Figure
4.1) and took on most of their
responsibilities – with some new
duties, such as innovations in water
management, charging and planning
(Sewell and Barr, 1977).
According to Sewell and Barr (1977),
water drainage responsibilities were Figure 4.1 1963 River Authority boundaries. Source: Sewell and Barr (1977, p398)

35
now shared between River Authorities, Internal Drainage Boards, and Ministry of Agriculture
Fisheries and Food (MAFF). This Act was the first to establish water as an economic good;
introducing charges and restrictions for water withdrawal for the first time.
It quickly became apparent that this legislation had a number of weaknesses which were
sought to be mitigated by the 1973 Water Act. This further consolidated water agencies and
established 10 Regional Water Authorities (RWA) to replace over 1500 water management
units, including the 29 River Authorities (Thomas and Ford, 2005).
The Public Health Act of 1936 had defined most sewers, culverts and watercourses as the
responsibility of Local Authorities (Rickard, 2002a); however the 1973 Water Act now shifted
responsibility for sewerage, sewage disposal and water supply from Local Authorities to the
RWAs, while leaving drainage shared between MAFF and newly created Regional Land
Drainage Committees (Great Britain, Water Act 1973). This legislation came into force at the
same time as the 1974 reorganisation of local government, reinforcing a number of local
changes in administration roles, (Ofwat, 2011).
RWAs were now multipurpose bodies, covering water supply, sewerage, and river
management, in an effort to consolidate all aspects of water management under one umbrella.
A corporate management approach was adopted, emphasising control of costs, and charging
water separately from household rates. The National Water Council emerged as a
coordination body for RWAs, heralding a distinct move towards nationalisation of the water
industry in Britain (Sewell and Barr, 1977).
Nationalisation of the water sector was never fully realised. Changing political ideologies led to
the radical Water Act of 1989, privatising the ten RWA’s and their water supply and sewerage
functions. This required the establishment of a regulatory body – Ofwat – to monitor the new
regional monopolies. At that point, management of the river functions was transferred to a
newly created National Rivers Authority (Shaw, 1998) which was later to be subsumed within
the Environment Agency (EA), as part of the Environment Act 1995 (Great Britain,
Environment Act 1995).
Since 1989, water law in England and Wales has been consolidated and to some extent
updated by The Water Industry Act 1991 and The Water Resources Act 1991, then
amended by The Water Industry Act 1999 and The Water Act 2003. However the basic
principles of the 1989 legislation remain intact (Great Britain, Water Act 1989).
More recent proposals include the Water Bill 2013 now in legislative progress; with its stated
intention to reform the water market, protect abstraction sources, enable businesses to select
non-local water suppliers, and encourage water companies to trade water amongst
themselves.

36
The current division of responsibilities for water resources can still be summarised as Figure
4.2:
Figure 4.2 Division of responsibility for water management. Source: Brown (2002)
4.2.3. Flood Management Statutes Until the late 1990s, flooding was not considered a major issue in the UK, so initial legislation
in this area emanated from the Council of the European Union. The European Water Framework Directive 2000 promoted sustainable development for water resources and
encouraged the consideration of flood risk, in the context of environmental management,
(Goodson, 2011). This directive was focused on cleaning up polluted waters, using a river
basin management approach, across multiple countries if necessary. Attention was also given
to groundwater depletion and habitat conservation (Council of the European Union, 2000). The
EA (2012a) accepted the responsibility for developing River Basin Management Plans
(RBMPs) while Local Authorities were required to provide information and assistance to the
EA, and subsequently obliged to reflect RBMP data in their planning decisions.

37
The later sister directive, European Floods Directive 2007 followed some years of disastrous
floods in Europe, including the UK. This Directive required flood risk assessments of all water
courses and coast lines, full mapping of the flood risk in these areas and the implementation of
coordinated measures to control this risk. This included the imperative to provide the public
with access to this information and to include them in the planning process. Both the 2000 and
2007 Directives used the river basin management model as the key to integrated water
management. (Council of the European Union, 2007)
Following serious UK flooding in 2007, the Pitt Review 2008 presented a comprehensive
review of events, making a number of legislative recommendations to the government (Pitt,
2008). The hydrological events of 2007 were clearly extraordinary by historical standards.
According to Marsh and Hannaford (2007), in the lower Severn basin alone, peak river flows
exceeded previous recorded maxima by wide margins. Apparently changing trends in rainfall
patterns and clear institutional issues, combined with European Union (EU) directives, all led
to the subsequent flood statutes.
The European Floods Directive was implemented under English and Welsh law within the
Flood Risk Regulations of 2009 in order to bring together key partners to manage flood risk
from all sources (Great Britain, Flood Risk Regulations 2009). These regulations introduced
the designation of Lead Local Flood Authority (LLFA) – corresponding to upper tier or unitary
Local Authorities – which were now made responsible for local flood risk from surface runoff,
groundwater, and ordinary watercourses. LLFAs were obliged to prepare local surface water
management plans and strategic flood risk assessments for their region (Defra, 2011). Where
an IDB is in place these retain their existing powers over watercourses and drains, but the
flood risk is still managed by the LLFA (EA, 2012c).
The EA had its authority extended to include flood risk from the sea, main rivers, and
reservoirs, while retaining drainage supervisory powers. Flood Risk Management Plans and
flood hazard maps had to be produced by both Local Authorities and EA for their respective
areas of jurisdiction, with a duty to cooperate with each other incumbent upon both parties
(Great Britain, Flood Risk Regulations 2009).
The Flood and Water Management Act (FWMA) 2010 is normally considered in conjunction
with the Flood Risk Regulations of 2009. This legislation reinforced the growing trend towards
managing water sustainably and at the catchment level. This was one of the key tenets within
‘Making Space for Water’ (Defra, 2005), and “Towards a new national flood emergency
framework” (Defra, 2008a); strategies which were reinforced by the summer 2007 floods and
the Pitt Review (Pitt, 2008).

38
The key points of this Act reiterated the respective roles of the EA and the LLFAs:
“A lead local flood authority for an area in England must develop, maintain, apply and
monitor a strategy for local flood risk management in its area”,
(Great Britain, Flood and Water Management Act 2010)
As recommended by several of the post 2007 flood reports (Coulthard and Frostick, 2010;
House of Commons EFRA Select Committee, 2008; Pitt, 2008) the Environmental Agency had
now acquired overarching responsibility for all types of flooding: coastal, fluvial and pluvial, in
an effort to integrate response and mitigation works.
“To give the Environment Agency an overview of all flood and coastal erosion risk
management, and [to give] unitary and county councils the lead in managing the risk of
all local floods”. OFWAT (2010)
It could be argued that although the FWMA tasked the EA with the management of river flood
risk, it still had no real control of those aspects of drainage which cumulatively contribute to
flooding.
4.3. Key Institutions Coulthard et al. (2007) had expressed concerns that no single agency accepted responsibility
for any elements outside their own terms of reference nor had they historically allowed others
to influence their own obligations. This was emphasised as a recurring theme - one of
inadequate consultation, poor co-operation and lack of unity between the agencies. It was
recommended that in future the EA, Local Authority and Water Companies need to co-operate
closely on operation, investment and design.
Subsequently, as part of the 2010 FWMA, the EA, LLFAs, IDBs, Highways Authorities and
Water Companies were designated as Risk Management Authorities (RMAs). RMAs were
obliged by the FWMA to collaborate and share data, in order to contribute to wise land use
planning (Great Britain, Flood and Water Management Act 2010).
The hierarchy of RMAs and flood risk responsibilities can now be expressed as in Figure 4.3:
The various RMAs and peripheral institutions are examined in detail in this section, along with
their changing roles and interactions.

39
Figure 4.3 Responsibilities for Flood Risk. Source: Shropshire Council (2012)
4.3.1. Department for Environment, Food and Rural Affairs (Defra) Formed in 2001, when the Ministry of Agriculture, Fisheries and Food (MAFF) was merged
with the ‘greener’ parts of the Department of Environment, Transport and the Regions (DETR),
the Department for Environment, Food and Rural Affairs (known as Defra) combined
agriculture and rural issues with the newer environmental concerns. Defra is the government
department in charge of setting policy and regulations on environmental, food and rural issues,
and with its stated aims of “reducing risks to people from environmental impacts such as
disease, climate change, floods”, clearly includes water management under its remit.
In terms of operational and risk management, Defra has delegated the responsibility for main
rivers to the EA while the IDBs (where applicable) or LLFAs maintain ordinary watercourses
Rickard, (2002a). Landowners, of course, continue to maintain watercourses within their own
riparian responsibilities.

40
4.3.2. The Environment Agency (EA) The Environment Agency was established as a non-departmental public body by the 1995 Environment Act; in order to manage rivers and coastal defence, and also to regulate water
resources and permit discharges to receiving waters (Ofwat, 2011). At that point they also
assumed the functions of the National Rivers Authority (ICE, 2010), based on the catchment
divisions depicted in Figure 4.1.
Figure 4.4 River Catchments 2012. Source: EA, (2012b)
They were empowered under the Water Resources Act 1991 to manage flood risk from main
rivers and the sea, as well as providing flood warning and forecasting services (Great Britain,
Water Resources Act 1991). Operational land drainage work is provided through the
mechanism of Regional Flood Defence Committees (RFDCs), who may in turn delegate to
Local Flood Defence Committees (LFDCs) (Shaw et al. 2011). It should be noted that the EA
(2009) powers are permissive, which they define as follows:

41
This means that we may choose to intervene in the public interest, where we believe
works would be beneficial and / or economically viable, but we have no legal duty to do
so. This recognises that we have finite resources and must prioritise how we use them.
‘Making Space for Water’ (Defra, 2005) was a key strategy document for the EA, outlining a 20
year plan for a coordinated approach to land use, planning policy and urban design, integrated
with catchment-based water management.
Coulthard and Frostick (2010) point out that there was no system of warning from surface
water flooding in the United Kingdom, despite there being an extensive warning system for
coastal and fluvial flooding. This was clearly an oversight that led to householder distress
during the floods of 2007. This was remedied once overall flooding responsibility was passed
to the EA.
The EA (2009a) refers in the Severn Catchment Flood Management Plan to the middle Severn
Corridor (Shrewsbury to Worcester), where although “the risk is currently managed
appropriately, it is expected to rise significantly in the long term”. Further protection from
flooding will be achieved by reducing dependence on raised flood defences, instead managing
development in order to restore river storage on undeveloped floodplains.
Natural Resources Wales (NRW) is a new body accountable to the Welsh Government, taking
over the work of the EA in Wales. Working closely with the EA in border areas, they provide
the same functions and statutory duties for Wales as the EA does for England.
4.3.3. Local Lead Flood Authorities (LLFA) Under the enhanced role of a Local Lead Flood Authority as defined by FWMA 2010, Local
Authorities are expected to coordinate the roles of other RMAs within their districts, and to
respond to advice by the EA, both as a Local Planning Authority (LPA) and as an LLFA. In
areas where there are no Internal Drainage Boards, the Local Authority also has a role as
drainage authority for all ordinary watercourses in the district (EA, 2006).
LLFAs have a duty under FWMA 2010 to develop a series of flood management documents
over 6 years, covering all forms or local flooding (see Figure 4.5). Firstly, the Preliminary Flood
Risk Assessment (PFRA) identifies locations of significant flooding, referred to as ‘blue
squares’, based on past and future flooding data. ‘Blue squares’ are defined as a 1km2 square
where more than 200 people, 20 businesses, or 2 items of critical infrastructure are at risk of
flooding. Once ‘blue squares’ are identified within the PFRA, related Flood Hazard and Flood
Risk Maps must be produced. Flood Risk Management Plans are then required for any
locations highlighted in the Flood Risk Maps (Shropshire Council, 2011).

42
Figure 4.5 Schedule of required flood risk management activity for LLFAs. Source: Warwickshire County Council (2011)
This expansion of role generated an unexpected need for specialist skills to fulfil such an
enhanced role. For example, Wychavon District Council (2012) explains that work on ordinary
watercourses, previously carried out by the EA or District Councils has now passed to LLFAs.
The LLFA in this case delegates all these functions back to the South Worcestershire Districts
under an existing partnership arrangement, due to a lack of skills held by the LLFA. This
partnership combines the land drainage functions of three District Councils: Malvern Hills,
Wychavon and Worcester, enabling them to work more efficiently.
4.3.4. Internal Drainage Boards (IDB) According to Ofwat, (2011) Internal Drainage Boards (IDBs) were originally formed to control
groundwater and local watercourse levels. These were focused in areas that relied on artificial
drainage, especially land reclaimed from marshes and the sea, and 170 IDBs still exist,
managing 1.2 million hectares of drainage (ICE, 2010). The relevant IDBs for this project are
the Lower Severn IDB (LSIDB) covering Worcestershire and Gloucestershire, and three IDBs
to the west of Shrewsbury: named Melverley, Rea and Powysland.
IDB powers are summarised by the Association of Drainage Authorities, [n.d.]:

43
“Under the Land Drainage Act 1991, each IDB exercises a general power of supervision
over all matters relating to water level management within its district. In pursuance of
this role they can prohibit the obstruction of watercourses within their district.
Thus, anyone constructing or altering a weir, bridge, embankment, culvert or similar
obstruction must first seek the consent of the IDB before undertaking works. IDBs also
have a series of bylaws relating to the management of watercourses and can designate
features and structures within their district which relate to managing flood risk.”
These permissive powers are used to clear weed from several hundred kilometres of
watercourse, as well as de-silting and re-profiling around 60km of watercourse each year
(email from Civil Engineer at LSIDB, 10th June 2013). As stated in LSIDB (2003), IDBs’ powers
now include a policy on flood prevention and environmental measures.
IDBs’ powers may appear to overlap with those of Local Authorities, but they focus only on
drainage. Where an IDB exists, it acts as the primary drainage body for that area (ICE, 2010),
handing control to the Local Authority at their boundary, or to the EA at the main river. Since
1991 the EA has supervised the work of IDBs, as well as Local Authorities, both being
deemed ‘drainage bodies’ under the Land Drainage Act 1991. This continued with FWMA
2010, which placed duties on Risk Management Authorities (RMAs) to co-operate, share data
and have regard to local and national strategies (email from Civil Engineer at LSIDB, 10th June
2013). IDBs are now expected to play a role in helping LLFAs to develop and implement their
local flood risk strategies (Association of Drainage Authorities and EA, [n.d.]).
4.3.5. Water Companies ICE (2010) explains in detail the distinction between watercourses and sewers, as the two are
subject to very different legislation and rulings. A sewer is vested in a sewerage undertaker,
and the public has the right to discharge into them under the Water Industry Act of 1991,
derived from principles within the Public Health Act 1936. Primary responsibility for sewerage
and sewage disposal is currently held by the water companies.
Water supply and sewerage management is structured and regulated differently across
different parts of the UK, which affects the relationships between the primary entities in each
region. England’s water and sewerage services are provided by regional private companies
which are overseen by regulators Ofwat. In Wales, Glas Cymru is regulated by Ofwat Wales,
but has no shareholders as it is run solely for the benefit of customers, while Scotland and
Northern Ireland have retained the pre-1989 publicly owned model (ICE, 2012).
The distinction between householders and water companies is clearly defined by Severn Trent
([n.d.], p1). The householder is responsible for waste water pipes that are located within their
land boundary (purple lines on Figure 4.6). The water company holds responsibility for the

44
underground pipes outside the boundary, including those shared between neighbours (in
yellow), and connecting to the public sewerage network (in red).
Figure 4.6 Sewerage responsibilities defined. Source: Adapted from Severn Trent Water [n.d].
Many older sewerage systems in Britain have combined flows from different sources; this has
a direct impact on surface water management. Combined systems collect both rainfall runoff
and foul water, so in times of very heavy rainfall sewers can become inundated and contribute
to contaminated flooding. To avoid this, the combined system should include a combined
sewer overflow to permit discharging of excess storm water to a watercourse. Fleming (2002b)
observed over 10 years ago that while combined sewers had been the norm in the UK for
many years, the pressure on such drainage was growing with increased levels of urbanisation
and impermeable surfaces, combined with trends of more intense rainstorms. With the advent
of sustainable drainage systems (SuDS) (see section 2.4) new housing developments are now
assumed to contribute only foul water into sewers, with infiltration systems implemented for
surface water (Shropshire Council, 2010).
The House Of Commons EFRA Select Committee (2008) notes that the existing charging
structure used by water companies does not encourage reduction of surface water runoff. The
result is that much surface water is routed into public sewers, while water companies are still
not statutory consultees in the planning process, and rely on the EA’s intervention.
Conversely, they do have an obligation under human rights to protect householders from
undue flooding, following a legal precedent set in 2001 (Rickard, 2002a). Flood risk from
sewers (and water mains) is excluded from LLFA risk liability under FWMA 2010, unless
caused by rainwater (Great Britain, 2010). However, many utilities are now upgrading

45
pipework or installing pumping stations, to avoid the public distaste and negative publicity
resulting from contaminated floodwaters (Figure 4.7).
Figure 4.7 Headline sewer upgrades from SevernTrent website. Source: Severn Trent Water, 2013
4.3.6. Highways Authorities Severn Trent [n.d.] states that the local Highway Authority, usually the county council, has
responsibility for effectual drainage of roads on the local road network, in so far as ensuring
that road drains, including gullies, are properly maintained. ICE (2010) further explains that the
situation is complicated where the land under the highway is dedicated to, rather than owned
by the authority. In the case of a dedicated highway, the authority does not own the land or
ditches either side of the road, and may be obliged use sub-highway drainage pipes instead of
roadside ditches.
ICE (2010) explains that culverts may be used during road construction to pass a watercourse
under a road, and the highways authority is then responsible for maintenance of that culvert.
However there is no obligation for the authority to increase the size of the culvert, in the event
of any increase in flows from upstream. It is worth noting that culverting is now rarely
approved by the EA for new development other than highways, due to floods caused by poor
maintenance of debris across trash screens.
The central Highways Agency is responsible for managing road drainage from the trunk road
network in England, including the slip roads to and from trunk roads (Shropshire Council,
[n.d]). This surface water is likely to discharge to a watercourse, but increasingly is passed to

46
SuDS influenced reed beds and soakaways, as detailed in the Memorandum of Understanding
between the Highways Agency and EA (2009).
A lack of clarity had been observed regarding any event of surface water flooding a road, (ICE,
2010); however, responsibility has now been passed to LLFAs to manage surface water
issues under the 2010 FWMA (Great Britain, Flood and Water Management Act 2010). The
highways authority does hold an established right under the Highways Act of 1980, to drain
roads into existing drains and sewers, and in towns this is generally how road drainage is
managed (ICE, 2010). However Rickard (2002a) notes that under-designed highway drainage
can lead to sewer floods, by passing excess storm water into combined sewers.
4.3.7. Local Planning Authorities (LPAs) Parker (2000a) notes that institutional constraints in England and Wales had historically led to
a lack of integration between planning and flood defence. The Flood Regulations of 2009/2010
sought to address these issues as part of the shift from engineering to environmental
responses. The ‘National flood and coastal erosion risk management strategy for England’
document (Defra and EA, 2011) was produced as a requirement of the 2010 FWMA; this
strategy document listed five strategic methods to tackle flood risk, shown in Figure 4.8.
Figure 4.8 Managing flood and coastal erosion risks. Source: Adapted from Defra and EA (2011)
One key point in this strategy, ‘prevent inappropriate development’, emphasises that:
47
“The Environment Agency will work with local authorities and developers to avoid
inappropriate building or redevelopment in areas of high flood or coastal erosion risk.
Key to this is ensuring that risks are effectively identified in local strategies ... and being
careful to manage land elsewhere to avoid increasing risks”,
thereby placing planning regulation high on the flood agenda. This adds another stakeholder
in the form of the Department of Communities and Local Government (DCLG), responsible for
spatial planning policy and operation (ICE, 2010). The Local Planning Authority (LPA) is the
day to day decision maker on planning.
As stated by the EA (2006), the EA is now a statutory planning consultee on matters relating
to:
• most development in Flood Zones 2 and 3;
• major development in Flood Zone 1;
• development within 20 metres of main rivers; and
• proposals involving culverting any river or stream
The EA’s role as advisors on technical aspects of flood risk includes the provision of
appropriate data, commenting on methods and conclusions, and advising on local flood risk
management proposals. ICE (2010) acknowledges that the LPA may choose to approve a
planning request to which the EA objects on flood grounds. In these cases the application
must be referred to the Secretary of State to consider whether it should be sent for
determination. This indicates that with regard to planning regulations, the advice of the EA
must be sought but not necessarily heeded. The EA itself has stated that it takes a “yes, if”
approach to planning permission (EA, 2012d), presenting itself as a positive facilitator rather
than a moderator of development. This leaves effective flood plan management with very few
advocates at a senior level.
4.3.7.1. Planning Regulation Given the commercial demands on valuable land for development, the main control for
reduction of flood plain building needs to be via the imposition of planning regulation.
Planning Policy Guidance note 25 (PPG25), was issued in 2001 by the DTLR, as guidance
to LPAs to reduce the risk of flood presented by new developments. PPG25 was replaced by
Planning Policy Statement 25 (PPS25) in the Communities and Local Governments Act
2006, which clarified the respective responsibilities of all stakeholders (Department for
Communities and Local Government, 2009 and 2009a). In parallel, the Town and Country
Planning Order 1995 obliged LPAs to take advice from the EA with regard to development in
flood risk areas (Goodson, 2001).

48
The primary aim of PPS25 was to ensure that new development should not increase flood risk
overall. The local Strategic Water Management Plan produced by LLFAs is intended to
support this aim by sharing information both about flood risk zones and their future planning to
mitigate that risk (Defra, 2010). To this end, the sequential test and exception tests are
explained in ‘Standard Note 4100, Planning and Flooding’, (House of Commons Library, 2012)
as a risk based approach, using flood risk zoning maps to direct the decision making process
towards the zone of lowest risk. The exception test applies to brownfield sites and only if
“there are wider sustainability benefits that outweigh flood risk” (ICE, 2010).
The Construction Industry Research and Information Association (CIRIA, 2004) further explain
the recommended precautionary principle as the approach used in cases of lack of certainty,
using the best available data but in a cautious manner. Flood Risk Assessments (FRAs) are
required for areas of high flood risk probability, to assess whether the proposed development
is at risk directly, or whether it increases the risk elsewhere. FRA results are intended to be
used to direct the construction to an area of lower risk, but as FRAs are frequently conducted
by the requesting developers, this would appear to generate a conflict of interests. The
obligation on developers to accept flood surveys by the EA is known as a Section 105,
referring to the relevant section of the 1991 Water Resources Act. (CIRIA, 2004), where this is
“for the purpose of carrying out its flood defence functions”, (Great Britain, Water Resources
Act 1991). However, it appears from Shropshire Council planning portal, (n.d.), that Section
105s are considerably less prevalent than FRAs.
ICE (2010) describes the case where a proposed development will increase the surface water
runoff into a watercourse prone to flooding. This can lead to ‘a planning obligation’ under
Section106 of the Town and Country Planning Act 1990, where the developer undertakes to
pay for drainage improvements downstream before planning permission is granted: The EA
may seek a drainage impact assessment and consequent flood mitigation contribution from
developers, but Rickard (2002a) raises the concern this is rarely enforced.
The EA described PPS25 as:
“a ‘significant tightening and improvement of the legislation’, and said it had improved
things in a number of ways ... the Agency had powers to “call in” the Secretary of State
for Communities and Local Government if a local authority ignored its advice.”
House of Commons EFRA Select Committee (2008).
However, Bosher (2013) observes that while the sequential approach should be used for the
identification of non flood prone development land, it can be abused by developers. He
demonstrates that the sequential test argument has been used successfully by developers
arguing that there are no low risk areas available, while seeking permission to build in flood
prone areas. Similarly, Monbiot (2000) highlights government proposals to “speed up the

49
planning process in response to business need”; avoiding wasting time at public inquiries
reviewing issues which have already been settled, by limiting input from the public. He
concludes that these measures would “further tilt the balance of decision-making towards to
development and away from local people”.
The subsequent National Planning Policy Framework (DCLG, 2012) is described as
‘streamlining planning regulation’, apparently in favour of developers, by introducing a
“presumption in favour of sustainable development” (p3 then repeated on pages 4, 13, 28, 39
and 52). It clearly states that “development which is sustainable can be approved without
delay” (p4). This framework directs local government to ensure that risks can be managed
through suitable adaptation measures, such as green infrastructure, or SuDS, as well as by
directing development away from flood plains. This policy came into force in March 2013 and
replaces many planning policy statements including PPS25, in wide ranging changes to
planning policy in England.
The sequential and exception tests are still in force, in order that “local plans should apply a
sequential, risk-based approach to the location of development”, but the emphasis appears to
have shifted to prioritise ‘sustainable’ adaptation, rather than locating away from flood plains.
The precautionary principle advised in the PPS25 Practice Guide (DCLG, 2009) is not
mentioned in the National Planning Policy Framework (NPPF) Technical Guidance
(Department for Communities and Local Government, 2012a), by which it is superseded.
Zoning as defined by PPS25 (DCLG, 2009a) has remained much the same in NPPF, but zone
3B - the functional floodplain - is no longer clearly defined by a 5% flood probability in one
year, but now equivocates: “The identification of functional floodplain should take account of
local circumstances and not be defined solely on rigid probability parameters”. It adds that 5%
“should provide a starting point for consideration and discussions to identify the functional
floodplain”, thereby leaving the definition of this highest risk zone much more subjective,
arguably to the benefit of developers.
4.3.7.2. Sustainable Drainage Systems (SuDS) Driven by the sustainability goals of the EU Water Framework Directive 2000, the Flood and
Water Management Act 2010 created an obligation to incorporate sustainable drainage
systems (SuDS) into new housing developments (British Property Federation, 2010). Since
then, soft drainage techniques have become the norm for flood risk management, with LLFAs
expected to establish their own SuDS Approving Body to ensure future compliance with
national standards (Defra, 2011).
Defra (2001) stipulates in the “National Standards for SuDS”, that runoff destinations should
be considered only in the following order,

50
1. Discharge into the ground
2. Discharge to a surface water body
3. Discharge to a surface water sewer
4. Discharge to a combined sewer
SuDS are now routinely added to developments, and their contribution towards reducing the
overall site runoff, often facilitates planning permission, even close to flood zones. However it
could be argued that enhancing infiltration in flood plains merely raises the water table which
also contributes to flooding.
Some issues have been noted around the reluctance of Local Authorities or Water companies
to accept responsibility for maintenance of wetlands, (Rickard, 2002a), as these are currently
less well defined than channel drainage. Further regulation may be needed in this area to
allocate responsibilities and ensure that SuDS remain sustainable.
4.4. Other Stakeholders
4.4.1. Landowners and Riparian Rights Legal rights and obligations in Britain extend beyond statute, and include case law (court
decisions), or common law (common customs). Riparian rights are enjoyed by landowners
bordering or under a watercourse of natural origin, and are defined mainly by common law.
There is no obligation on riparian owners to maintain or de-silt a watercourse, but they may be
obliged to do so by a drainage authority under the Land Drainage Act of 1991(ICE, 2010).
“we have powers of enforcement by serving a notice under Section 28 of the Land
Drainage Act. If this is ignored, we may carry out the necessary work ourselves and then
recharge the person responsible for the full cost incurred.” Durham County Council
(2012)
In general, landowners are responsible for their own land drainage and for accepting and
managing inbound flows on to their land. These flows must then be passed on undiminished
without obstruction, pollution or diversion. They do have a natural right to collect and
discharge surface water onto lower land, even if this increases the onward flow due to
improved land drainage. These enhanced flows must then be accepted by the lower land
owner. However, they may not cause or perpetuate a nuisance, for instance by a blockage to
a culvert (ICE, 2010).
Under the EU Water Framework Directive of 2007, a riparian owner who causes
environmental damage to their watercourse may be required to carry out remedial works. The
FWMA 2010 has updated powers held by drainage bodies under the Land Drainage Act of
1991, empowering them to carry out flood risk works on private land, or to serve notice on

51
riparian owners increasing flood risk from their watercourse (EA, 2012f). However, in general
riparian rights are simply that – rights rather than responsibilities.
4.4.2. Agricultural Influence Agricultural responsibilities for drainage are identical to those of any landowner. However
historically, agriculture was the most significant influence on drainage until the 1980s, with
MAFF grant-aiding field drainage and fewer incidents of city flooding. The emphasis on
engineered barriers followed by an environmental awareness, can be seen as mirroring social
changes from rural to urban to city living, followed by a desire for ‘environmental harmony’.
(Parker. 2000a)
MAFF grants for field drainage ended in the 80s, due to changes in agricultural strategy, and
Frost and Knight, (2002) warn that this has caused continued deterioration of agricultural
drainage. Combined with a loss of skills across generations, more intense farming techniques
and larger fields, this could lead to increased soil displacement in intense rainfall, contributing
to erosion and silt blocking of downhill water courses (Interview with Wychavon District
Council, July 2013).
Shropshire Council (2010) note in their Water Cycle Study that low lying agricultural land at
the confluence of the Severn and the Vyrnwy floods regularly and low earth embankments
have been constructed to provide some protection. Known locally as argaes, these bunds
provide significant protection to downstream communities, such as Shrewsbury, by storing
substantial volumes of floodwater until after the surge.
4.4.3. British Waterways ICE (2010) mention that other bodies may also hold common law obligations for drainage,
such as British Waterways, navigation authorities and licensed coal operators. The latter is
due to the potential effect of subsidence on drainage and is enshrined in mining codes and the
Coal Mining Subsidence Act 1991.
Crichton (2005) raises a concern that British Waterways owns and manages 2600km of canals
which link into UK river basins, sometimes transferring flows from one catchment to another.
Most of the canals were constructed over 200 years ago, and generally operate with only
300mm of freeboard, which can lead to overtopping of embankments during flood events.
British Waterways is very aware of the risk and has a system of sluices, weirs, pumps, and
floodgates to control the flow into canals, however no government yet appears to have fully
recognised the challenges presented by an aging canal network (Crichton, 2005).

52
4.4.4. Ofwat Ofwat was established in 1989, to act as the industry regulator for the regional monopolies
formed by the privatisation of water utilities in England and Wales.
“Ofwat is responsible for regulating the sectors, acting independently of the industry,
government and other stakeholders, while working within the government policy
framework” Ofwat / EA, 2007
This monitoring role is primarily achieved through performance objectives set for each water
company. These are benchmarked across all regions, with the expectation of continued
efficiencies and financial penalties for unmet targets. This generates a focus on results at the
end of the five year review period. (Ofwat, 2011)
The current strategy for Ofwat includes planning for sustainable water and water depletion,
and focuses on four principles: ensuring a fair deal for customers; making monopolies
improve; harnessing market forces; and keeping water companies accountable (Ofwat, 2010).
4.4.5. Agricultural Land Tribunals According to Defra, [n.d], Agricultural Land Tribunals (ALTs) were established under the
Agriculture Act 1947; they are relevant here in that they mediate drainage disputes between
neighbours.
There are eight ALTs within England and Wales, acting as independent statutory bodies with
jurisdiction only within a specific geographic area. These generally issue directions regarding
access required onto neighbouring land to maintain ditches, or orders to improve agricultural
drainage causing problems downstream (Defra, [n.d]).

53
4.5. Division of Responsibilities The roles of the various institutions have changed several times over the past five decades,
with significant changes in flood legislation in the past five years. Since 1991, land drainage
management has operated as a tiered system, updated from FWMA 2010 in Table 4.1:
Table 4.1 Responsibilities for Surface Water Management in England and Wales. Source: Ofwat (2011) with additional information from Frost (2002)
4.6. Paradigm changes Johnson et al. (2005) examines the relationship between flood disasters and a policy
response, arguing that a decade of floods encouraged a rapid and unstructured rush into
policy changes, ready to generate for the next reactive change. Much water legislation can be

54
viewed in this light, which could explain interesting dichotomies within the interaction of the
responsible institutions.
Johnson and Priest’s (2008) consider whether the rapid progression between ‘land drainage’,
‘flood defence’ then ‘flood risk management’, has moved away from the state managed model
and created different divisions of risk/responsibility between the state, public agencies, private
sector and citizens, Butler and Pidgeon (2011) further debate these redistributions of
responsibility, with increased emphasis on the responsibilities of private citizens. Watson et
al. (2009) suggest that national institutions have actually strengthened their control, despite
using language emphasising partnerships and collaborative governance. They also mention
the reallocation of responsibility for policy implementation between public, private and civic
groups and hypothesise that this reflects an international shift from government to
governance.
Johnson and Priest’s (2008) point out that while Defra has overall responsibility for flood risk
management, by using operating partners for all day to day operations, it is taking a noticeably
hands off approach, “reflecting a more general movement in society towards increased
individual responsibility”. Escobar and Demeritt (2012) go further in regarding the use of
intermediary agencies, such as the EA, as a mechanism to deliver government policy at arms’
length from Ministers and the political process.
In future, Defra intends to “facilitate innovation, improve value for money, maintain
accountability and deliver flood risk management through public–private partnerships”,
(Johnson and Priest, 2008), a new development confirmed by the ‘Partnership Offer’ made by
Defra Network (2013), where Defra actively seek commercial partnerships to finance flood
management systems. Defra and EA (2012) explain further in their document “Partnership
Pays”, that from April 2012 projects will be assessed under the new policy of ‘Partnership
Funding’. More detail is given in their flood strategy document:
“... a new partnership approach to funding could make government money available to
pay a share of any worthwhile scheme... Projects can still go ahead if costs can be
reduced or other funding can be found locally.” (Defra and EA, 2011)
Haughton et al. (2010) perceive a neoliberal agenda at work in these developments, at the
same time as noting the loss of local knowledge. As drainage engineers are phased out by
Local Authorities, an increase is noticeable in hiring consultants and contracting out projects.
Penning-Rowsell (1987) observed 25 years ago that consultants were gaining an undue level
of influence on policy makers, raising concerns that all parties involved in flood project
appraisal have an interest in maximising investment levels.

55
4.7. Summary This chapter reviewed legislation, directives, institutional and stakeholder roles, as part of
rapidly changing policy. This illuminated the legislative framework underpinning water
management, and explored the relative roles of stakeholder institutions following recent
changes in legislation. Key issues exposed are summarised in Table 4.2 for further
exploration in subsequent chapters.
Table 4.2 Summary of key policy issues for flood and drainage.
Key Issues:n.d. Riparian rights established by common law and case law over centuries
The right is upheld to pass drained water down to the next landowner1932 IDBs are established by Drainage Regulations1980 Highways Act allocates road drainage to Highways Authorities and Agency
Road storm water surges are passed down to waterourses and sewers1989 Water Act privatises water resources, including sewerage provision
Pressure of storm water on combined sewers is notedMovement away from state managed model first observed
1991 Drainage Act moves drainage focus away from agriculture and into townMAFF grant aid ended for field drainage, leading to reduced maintenancePrimary drainage responsibilities shared between IDBs and LAs
1995 EA established by Environment Act with permissive powers to manage rivers, flood risk, and environment.
2000 EU Directive promotes environmental management on catchment basis2001 Defra formed to merge environmental concerns with rural affairs; much operational
responsibility is delegated to EA2001 PPG25 issued by DTLR for planning guidance2006 PPG25 replaced and updated by PPS25, naming EA as statutory consultee
EA takes 'yes, if' approach to planning permissionPowers available to planners rarely used to mitigate drainage pressureSequential test used by developers to obtain planning permission
2007 EU Directive requires flood assessments, planning and public access to information2008 Pitt reviews effect of 2007 flood and makes recommendations to government regarding
allocation of flood responsibility2010 Major changes in flood management in UK:
FWMA promotes sustainable water management; EA is allocated overall responsibility for flooding; LAs assume responsibility for local surface water - lack of expertise is noted RMAs named and obliged by the FWMA to collaborate and share data SuDS mainstreamed into construction practices, but ongoing responsibility unclear
2012 NPPF replaces PPS25 with ‘presumption in favour of sustainable development’Flood zone definitions become more subjective
2012 Partnership offers made by Defra to private sector

56

57
5. Results All data was obtained from the River Severn catchment area, which covers approximately
11,000km2 and has a population of nearly 2.3 million. The area is predominantly rural and 90%
of the land is currently used for agriculture (Environment Agency, 2009), so representative
samples were selected from rural and urban locations, These include the source spring in the
Cambrian Mountains, a hill tributary in mid Wales, a small town in Shropshire, upland
Shrewsbury and lowland Worcester (Figure 5.1).
Figure 5.1. Severn catchment area, showing sample locations. Source: EA (2009a, p38), annotated.
5.1. Preliminary investigations An initial visit to Worcester and Shrewsbury confirmed many of the findings from the literature
review in section 2.3. Older buildings were indeed well protected from flood plains by natural
means such as high ground or located away from rivers (Figure 5.2. to Figure 5.3), while new
developments appeared at risk of periodic flooding (Figure 5.4).

58
Figure 5.2 Raised older riverside buildings, Shrewsbury. Photograph taken by author. June 2013
Figure 5.3 Riverside Cathedral on raised ground, Worcester. Photograph taken by author, May 2013
New buildings in Figure 5.4 are set back from the river by a ‘wildflower meadow’ which is (as
per the sign), in the process of being established - presumably advocated as flood storage.
Figure 5.4. New riverside buildings on low ground, Worcester. Photograph taken by author, May 2013

59
5.2. Tracking a planning application On 7th March 2013 Taylor Wimpy developers submitted a planning application to Shropshire
Council for a housing development in Sutton Grange, Shrewsbury, near Lea Brook, a tributary
of the River Severn. This is a greenfield site, on existing arable farmland, including a popular
walking and wildlife space known as Rea Brook Valley. The proposed level of development is
described as ‘dense’ by local objectors: with 292 houses in 16 hectares, mainly 3-5 bed
detached, plus 38 smaller social housing units (Shropshire Council planning portal, [n.d.]). The
topography of the site is shown in Figure 5.5:
Figure 5.5 Proposed site map, showing contours, site boundary and flood zones. Sources: EDINA [n.d.], EA [n.d.]a, SC planning portal [n.d.] – combined and annotated by author.
Despite the area sourcing a mineral spring, being traversed by Rea brook, with drainage
crossing the site for another nearby spring, plus acting as local flood storage (Environment
Agency, [n.d.]a), the initial application states that there is no flood risk in the development, nor
a risk of increasing the flood risk elsewhere. The construction starts at 57m Above Ordnance
Datum (AOD) while the brook normally flows at 52m AOD (Shropshire Council planning portal,

60
[n.d.]), joining the River Severn 3km downstream at 50m AOD, and the 1:100 flood zone
reaches 55.4m AOD (Environment Agency, [n.d.]a).
A Flood Risk Assessment (FRA) was submitted by Taylor Wimpy on 14th March 2013,
emphasising SuDS provision, raised first floor level of 600mm and a pumping station for
drainage. The pumping station is certainly necessary in order to pump foul drainage from such
a low site. By locating all houses just south of the flood zone, the site can be designated as
zone 1 (no flood risk), where the sequential test does not apply.
While SuDS does indeed reduce run off from developed areas, it is not a panacea in low
ground, where it will simply add to the water table and consequent flood risk. The FRA
accepts that:
“The management of storm water generated by the development itself will be the
principle flood risk to this development. Infiltration based systems have been
investigated and will have limited application for this site. The preferred outfall would
therefore be to the watercourse to the north of the site as per the existing undeveloped
site.” FRA, 14/3/2013. Shropshire Council Planning Portal, [n.d.]
In other words, it is proposed to drain storm water into Rea Brook, which is likely to exacerbate
the flood risk on the site as well as passing more water towards the Severn before Coleham
Head, placing more pressure on the flood defences installed there.
The Environment Agency (EA) raised a number of objections, to which the developers
responded with a rearranged layout, and redesign of drainage. The EA have subsequently
stated they are now able to lift their standing objections, with some conditions, including:
“..implementation of compensatory flood storage works and improvements to the 1 in
100 year plus climate change modelled river level ... approved in writing by the Local
Planning Authority.”
and
“no new structures (including gates, walls and fences) or raising of ground levels on land
below 55.6m AOD”.
EA comment, 14/6/2013. Shropshire Council Planning Portal [n.d.]
This effectively approves construction of houses less than 4m above standard flow levels,
100m from the watercourse, a decision suggesting that the EA is keen to approve, despite the
flood risk, as long as some concessions are made by the developer.
5.3. Interviews Semi-structured interviews were conducted with contacts at key drainage institutions, in order
to triangulate data and deepen understanding of operational issues. All interviews used a

61
written list of questions (see Appendix I: Interview questions) as a framework, permitting
interesting avenues to be followed where possible.
5.3.1. Lower Severn Internal Drainage Board (LSIDB) This interview with a staff civil engineer on 11th July 2013 confirmed that the key statute for
drainage is still the 1991 Land Drainage Act, updating the wartime approach of its 1930s
precursor. It was mentioned that the 2010 Flood Act had changed the emphasis to cooperative
working between institutions. It was noted that the 2010 Flood and Water Management Act,
by placing local authorities in a key operational role with very little warning, had put
unexpected pressure on local authorities, to which few of them were immediately ready to
respond.
Boundaries are felt to be generally well defined, normally along contour lines, as IDBs have
long been the primary body managing drainage in their areas. As a consequence, handovers
at boundaries are well practiced, interacting with local authorities, the EA and landowners. All
drainage water is pumped or gravity fed to the nearest watercourse, ultimately flowing to the
main river. There is rarely any interaction with sewerage pipes. It was mentioned that
supervision and reporting of IDBs in general is historically unclear and can lead to IDBs being
regarded as arcane institutions under little control.
Relationships with partners are generally good, although in many respects IDBs work alone.
Institutions are now cooperating as instructed, with IDBs and Local Authorities sharing
information, as are Water Companies and the EA. Pressure on greenfield sites for
development is continuous, and while IDBs are not statutory consultees like the EA, they have
good long-standing relationships with the EA and planners, and using these links are able to
insist on mitigatory flood storage plans in most cases. Landowners normally manage their own
drainage, although obligations are dictated by statutes 14-16, & 25 of the 1991 Land Drainage
Act, wherein the IDB is empowered to enforce remedial work on drainage ditches.
Just as the literature review observes that an agricultural approach has given way to an
environmental focus, so it has within IDBs:
“The emphasis on agricultural ditch clearing has changed in the past 20 years to a
gentler, more ecological approach. These days, drains are often re-profiled in stages to
minimise ecological impact, and there is more emphasis now placed on flood
awareness.”
5.3.2. Worcestershire County Council (WCC) (Drainage powers delegated to Wychavon District Council)
This interview with a Senior Assistant Engineer on 15th July 2013 discussed institutional,
legislative and planning issues around drainage. It was explained that WCC is unusual in that
a strong engineering department was retained at Wychavon after the 1998 local floods while

62
other local authorities reduced staff. Consequently, when the LLFAs were designated in 2010,
WCC opted to delegate operational drainage work back to the district council partnership, due
to their longstanding skills and experience combined with strong local knowledge. Other
councils were not so fortunate and are struggling to maintain their new responsibilities, with no
extra staff. Consultants are used frequently in many councils, presenting short term attitudes
and often holding less local knowledge.
Main statutes supporting this role include 1991 Land Drainage Act and 2010 Flood and Water
Management Act, and main partners are landowners, farmers, WCC and the EA. Their
relationship with the EA can be hindered by difficulties in building contacts, as staff there are
moved frequently between roles, and often lack the experience and local knowledge to make
effective decisions. The EA approach was alluded to as “boilerplate’, using checkboxes to
work through an assessment, whereas we use experience and local knowledge”.
Good relationships are maintained with the Local Planning Authority, and while they are not
statutory consultees, still have regular input to drainage and flooding decisions by planners.
The interviewee had observed an increase in planning applications following the new National
Planning Policy Framework, but no major changes in drainage or flood risk. The sequential
test was described, with an explanation of how developers routinely propose SuDS systems to
prove on paper that they are reducing the surface run-off from a site.
Drainage from highways and residential areas was discussed, confirming that most residential
surface water is discharged into a storm sewer or soakaway, while most highway drainage
water discharges eventually into a watercourse. Distinguishing between highway drains, land
drains and sewers is complex, but follows a fairly well established definition (confirmed in ICE,
2010). Mention was made of changes in agricultural land use for commercial reasons: with
less deep ploughing in modern farming methods leading to higher runoff levels. This issue is
generally acknowledged, and now approached as an educational issue.
Finally, it was emphasised that it is unreasonable to expect the LLFAs take responsibility for
all surface water: “It’s never going to happen - excess water simply comes from excessive
rainfall. Forcing LLFAs to take responsibility for all surface water as a kneejerk reaction to
recent floods, but without providing additional staff, is a recipe for failure.”
5.3.3. Agricultural Landowner This interview with a mid-Wales hill farmer in August 2013 confirmed farm ownership of land
under the Werns brook tracked in section 5.4.3 below, and under the nearby highway. This
land has been in family ownership since the 1930s, so the layout and installation of drainage
under the dedicated highway was recalled in detail.
Comment was made that passing highway runoff water along drainage pipes potentially
contaminates the brook, in a way that the old infiltration ditches did not. This comment
63
confirms previous observations that understanding of the benefits of soakaways and SuDS is
very deep-rooted in rural areas. In common with other local people he had also noticed the
current unwillingness of the EA to dredge small rivers.
Most drainage on the farm and buildings uses soakaways, and the traversing brook is well
maintained as part of farm maintenance in order to provide water for livestock, so supervision
by the Local Authority is unobserved. Heavy rains can often carry debris down fields and
across the road, but an agricultural JCB is always used to clear obstructions before it causes a
problem or is noticed by any institution. This brook along with local springs, is clearly regarded
as a valuable water source, rather than as a drainage ditch, and is treated accordingly.
5.3.4. Environment Agency (EA) The following information was obtained from several conversations in August 2013 with
different EA Officers from the Partnership & Strategic Overview Team.
It was confirmed that the EA in Wales has been replaced by National Resource Wales and
operates as a different entity, using standard procedures for working together, especially at
border areas (see Box 5-1).
In order to control a flood problem, smaller brooks and canals are often designated as main
rivers, in order that trash screens and flows can be proactively managed. This had been
reviewed in 2003 for flooding purposes, Shrewsbury being a good example of a high risk town
tightly managed by the EA. For the same reasons, interventions can be made on private land
in order to improve drainage and manage flood risk.
Dredging is used only when really required, avoiding environmental disruption where possible,
but always seeking a risk/benefits balance. Finally, it was pointed out the historically dredging
was only performed for navigational purposes and that clearing blockages under bridges is the
responsibility of the Highways Authority rather than the EA.
The EAs permissive powers enable funding limitations to be managed effectively, prioritising
the issues affecting the largest number of people or assets threatened by floods. Again this is
driven by seeking a balance and assessing the risk involved. Regarding planning consultation,
it was felt that most EA input is heeded: “it’s a balancing act, the main point is that the Local
Authority must feel comfortable with the risk, as they are the primary decision maker”.
5.3.4.1. Planning Influence Finally it is noted that the EA are seeking Advisors with planning experience, to provide “more
emphasis on influencing Local Authorities early on in the planning process ... by pro-actively
influencing developers during pre-application discussions”, see Appendix II : Environment
Agency, Planning Advisor role, for details.

64
5.4. Tracking Surface Water – Transect Walks
5.4.1. Methodology and tools Map based investigations were made using geospatial information obtained from the EDINA
Digimap, paper Ordnance Survey (OS) maps, EA flood map, and on occasion Google maps.
The Digimap service is an online mapping service that gives access to interactive Ordnance
Survey maps at differing scales and levels of detail. It permits the user to annotate and print
any of these maps, or to download the annotated copy for further processing. These maps
were used to perform theoretical “transect walks”, as well as providing the basis for physical
tracking. In the samples taken below, detailed contours are examined in order to estimate
multiple rainwater runoff routes and track this flow all the way to the sea.
Physical tracking permits further observations where this is relevant. For instance, boundaries
indicating change in the type of land ownership need to be noted, as do climate conditions.
Physical catchment conditions have already been considered during sample selection, to
ensure representative sampling. Subsequently these have minimal impact on institutional
issues and do not constitute required data.
5.4.2. Sample 1 – Mountain Source, Ceredigion: Mapped Runoff Routes The first sample investigates the area above the source of the River Severn, tracking runoff
paths down the mountain. These are depicted in detail in Figure 5.6, and an overview showing
the full path to the sea shown in Figure 5.7.
Starting from Pen Pumlumon hilltop (741m AOD), it was estimated that rain falling on the north
and west of the peak (green route in Figure 5.6 and Figure 5.7) would run downhill to Afon
Gwerin stream, then to Afon Hengwm (Hengwm river), and thence to Nant-y-Moch Reservoir,
then out via Afon Rheidol (Rheidol River) and onwards to the Irish Sea. Conversely, rain falling
on the south of the peak (red route) would run south into the source of the River Wye (Afon
Gwy), which migrates several times between England and Wales before passing into the
Severn just before the estuary. Finally, rain falling to the east of the peak (blue route) runs
directly into the source of the Severn (Afon Hafren), then through Powys, Shropshire,
Worcestershire and Gloucestershire where it forms the estuary.
The Wye is not designated a main river until Rhayader in southern Powys, 26 km from the
source, whereas the Severn is so designated at Llanidloes, within 14 km of its source. Afon
Rheidol is considered a main river from the reservoir, within 5 km of its source. This
designation is significant in that it denotes management by the EA rather than drainage board
or local authority. From these points onwards, these rivers are the responsibility of either the
EA or Natural Resources Wales (NRW). The movement of the Wye typifies the ease with
which rivers both traverse and form county and country boundaries in their journey. Inevitably
this complicates the administration of rivers.

65
Figure 5.6 Map of estimated rain runoff routes from Pen Pumlumon, Ceredigion. Source: EDINA, [n.d.], annotated.
Figure 5.7 Map of estimated rain runoff routes from Pen Pumlumon, Ceredigion, to sea. Source: EDINA, [n.d.], annotated.

66
5.4.3. Sample 2– Powys: Theoretical & Physical Transect Walks Moving east, to the border between Wales and England, the land is still hilly and hillside
springs are common. The River Severn is 30km to the north, but all these local rivers are its
tributaries. Routes were tracked from a hill known local as Rhos Hill (380m AOD) (Figure 5.8).
Figure 5.8 Map of estimated rain runoff routes from Rhos Hill, Powys, towards main rivers. Source: EDINA, [n.d.], annotated.
The blue route indicates that rain falling to the north of the peak continues north to Knighton
and the River Teme, which is a main river from Knighton onwards and therefore managed by
the EA. Before this point watercourses are the responsibility of Powys council. The River
Teme flows west to Worcester, where it joins the River Severn as it heads south.
All red routes indicate that any rain falling to the other sides of the hilltop will ultimately run
south into the river Lugg, and thence to Leominster and Hereford. The easterly red route is
physically tracked for 3.5km, passing downhill as either surface or sub-surface flow, emerging
as a spring and forming a new stream called the Werns (Figure 5.9). This watercourse travels
south through farmland (see landowner interview, section 5.3.3), joining the river Lugg at
Whitton village 3km further south. The Lugg feeds the River Wye at Hereford, which later joins
the River Severn in the estuary, as mentioned above.
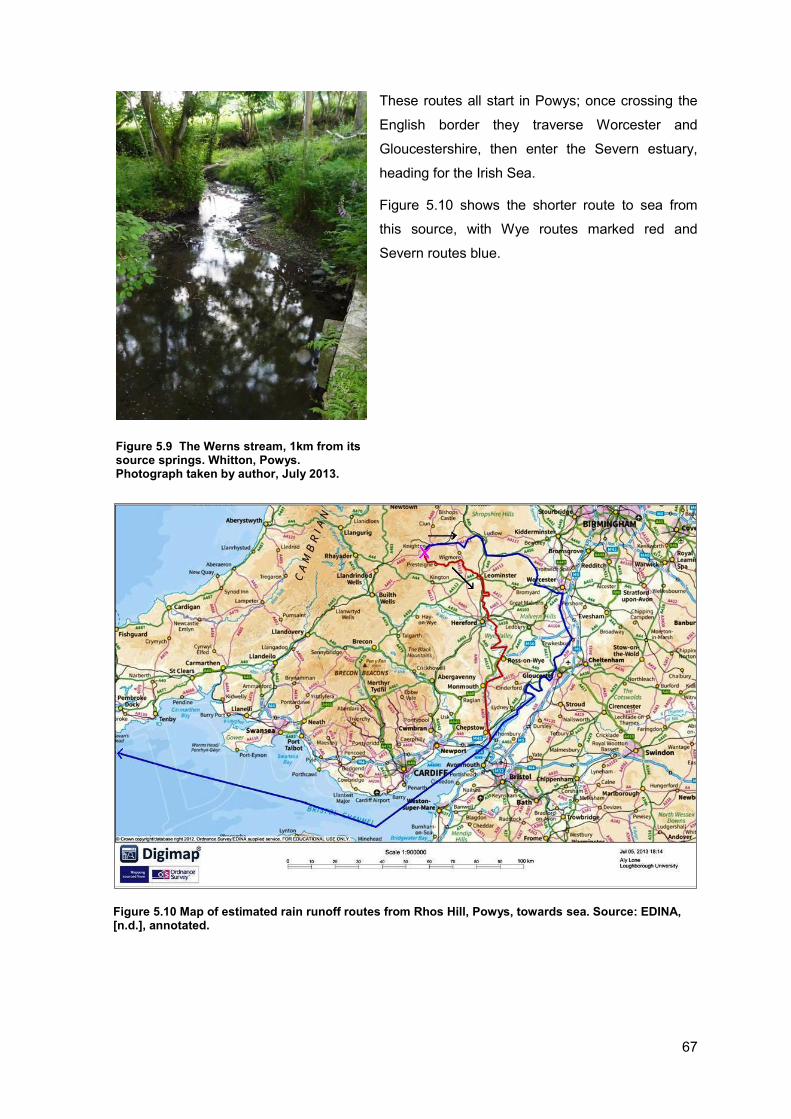
67
These routes all start in Powys; once crossing the
English border they traverse Worcester and
Gloucestershire, then enter the Severn estuary,
heading for the Irish Sea.
Figure 5.10 shows the shorter route to sea from
this source, with Wye routes marked red and
Severn routes blue.
Figure 5.10 Map of estimated rain runoff routes from Rhos Hill, Powys, towards sea. Source: EDINA, [n.d.], annotated.
Figure 5.9 The Werns stream, 1km from its source springs. Whitton, Powys. Photograph taken by author, July 2013.

68
Box 5-1: Cross border river and possible administrative confusion
Cross boundary issues In this border area, confusion over responsibility at complex boundaries appears to lead to
lack of maintenance. Once the River Lugg travels 8km from Rhos Hill, it crosses a renowned
flood point known as ‘Combe corner’ which frequently cuts off a main highway on a
meandering border between England and Wales.
Map showing shifts in administration on Welsh border. Source: EDINA, [n.d.], annotated.
The map shows the watercourse control
moving from Powys, to shared control,
back to Powys, then to Herefordshire
control within just a few kilometres. The
highway shifts across borders in the
same way. Visiting the site during low
waters, it appears silted and liable to
flood easily. It seems likely that there
could be confusion caused by such
varied borders, either between Highways
Authorities or between EA and NRW. In
addition, the locals mention that the EA
discourage dredging, on environmental
grounds. "Combe corner" Photograph by author, Feb 2013

69
5.4.4. Sample 3 – Pontesbury: Theoretical & Physical Transect Walks The third sample location starts near Pontesbury in upland Shropshire, 14km to the west of
Shrewsbury. There are three local Internal Drainage Boards (IDBs) near, but not in,
Shrewsbury: Powysland, Melverley and Rea IDBs, colour coded by location in Figure 5.11.
The location of Pontesbury was surveyed as well as Shrewsbury because it falls on the border
of an IDB zone, therefore the drainage body is Rea IDB (see Figure 5.11), as well as
Shropshire Council in some areas. Rea Brook travels into Shrewsbury from the east, passing
just to the north of Pontesbury, and is designated a main river by the EA from Marten Pool,
some 13km west of Pontesbury.
Figure 5.11. Location of IDBs near Shrewsbury. Source: SC, 2012a
In order to explore a variety of surface water, a track was plotted to cover the IDB zone,
highway flow, subsurface flow, small town drainage, surface water risk zone (Pontesbury town
is rated medium risk by SC flood map), agricultural landowner, organisational landowner, a
rural area, ordinary watercourse and main river flowing towards Shrewsbury.
The selected starting point is on Earl’s Hill (Figure 5.12), 1km south-east of Pontesbury, in a
nature reserve managed by Shropshire Wildlife Trust.

70
Figure 5.12 Top of Earl's Hill, starting point for Sample 3. Photograph taken by author, July 2013
Water falling on the west side of this peak would run west, either overland or underground
along the red line shown in Figure 5.13, down the hill, into the Rea IDB zone, then across the
track and down to the stream. The unnamed stream flows north until it meets Grove Lane
where it is culverted under the road, then north across farmland to Main Road in Pontesford,
where it vanishes under a trading development before joining Habberley Brook to become
Pontesford Brook. This brook then crosses private land, followed by farmland and finally joins
Rea Brook which joins the Severn in Shrewsbury. Rea Brook passes out of the IDB zone at
Cruckmeole, 4 km west of Shrewsbury, but as it is a main river, is always managed by the EA
rather than Rea IDB or Shropshire Council.
Conversely, rain falling to the east of the survey point will follow the blue line down the hill until
it enters Habberley Brook. This passes through woods then farmland, entering the IDB zone
and skirting woodland as it moves north, crossing more farms until it meets Main Road and
becomes Pontesford Brook and continues as above.
The third (pink) route runs north down the hill, then along road gullies until it passes into
combined sewer pipes presumed to run under Main Road. These then pass into Pontesford
where sewerage pipes probably carry storm water under the roads, following the gradient
down to the treatment works north of Pontesbury. Advertised sewerage upgrades for
Pontesbury area suggest that the system may still be combined, and water passes with foul
water to the sewage plant. After treatment, this water discharges into an unnamed stream
which joins the Rea Brook 1km further north and continues as above.
In order to explore issues with drainage in a small town, a fourth route was also plotted from
the edge of Pontesbury, and is shown following a green route, starting at the junction of
Habberley and Grove Roads,

71
Figure 5.13 Map of estimated rain runoff routes from Earl's Hill, Pontesbury, towards main rivers. Source: EDINA, [n.d.], annotated.

72
Rain falling here would move north along the gulley in Habberley Road, flowing into the brook
via highway drainage higher up Habberley Road. It then continues to flow north in this open
stream until it is culverted under the junction with Main Road, to emerge on the north side.
Here, it can be observed (Figure 5.14) that houses are armed with sandbags, despite the dry
weather. A local resident explains that these new houses flood whenever the drainage brook
expands across the road. Locally, it was well known that the previous car park in that location
had flooded regularly; yet planning permission was still granted for these new-builds.
Figure 5.14 New houses permanently sandbagged, Pontesbury. Photograph taken by author, July 2013.
5.4.5. Sample 4 – Shrewsbury: Theoretical & Physical Transect Walks Shrewsbury is the first major English town on the River Severn and is particularly prone to
flooding due to its proximity to the Welsh uplands, compounded by meandering river loops
through the city. Demountable flood defences have been installed, as shown in Figure 5.15, to
protect the community whilst respecting the fine heritage features in the town.
Figure 5.15. Demountable flood defences in Frankwell, Shrewsbury. Source: BBC Shropshire, 2013.

73
EA ([n.d.]a) indicates two areas in the town which are especially vulnerable to flooding:
Frankwell and Coleham Head, both of which are now protected by demountable flood
defences as well as improved drainage and pumping stations. These were installed in 2003 to
eliminate the four acknowledged sources of flooding in the area: river overtopping,
groundwater flow/seepage, breaching of existing riverside walls, and inadequate drainage
(EA, 2004). Shrewsbury town has also been identified at being generally susceptible to
surface water flooding within ‘Water Cycle Study’ (Shropshire Council, 2010) and SWMP
(Shropshire Council, 2012). Calculated risk here differs according to source, as SC blue
squares, or wetspots, (as Shropshire Council (SC) call them) remove three out of four EA blue
squares and add five new ones (Shropshire Council, 2012, p6). An interview with
Worcestershire drainage engineer indicated exactly the same contradictions, stating that EA
frequently differs from local knowledge.
The annotated flood map in Figure 5.16 shows the flood defences, along with main rivers, flow
direction, flood zones plus highlights in green and red the location of the two vulnerable areas.
It can be observed that both ‘wetspots’ occur where a tributary enters the Severn.
Figure 5.16. Flood map for Shrewsbury, showing Frankwell and Coleham Head flood defences. Source: EA [n.d.]a, annotated by author
Three ‘brooks’ traverse the town to outfall into the Severn; all are designated as main rivers
therefore are the responsibility of the EA, There are very few other natural watercourses in
town, small streams mapped transpired to be impossible to find on a site visit, so are
presumed to be culverted. As is evident from Figure 5.17, these main rivers can be quite
minor, but are managed by the EA due to the flood risks in Shrewsbury (interview with EA Risk
Management Advisor, 1/8/13).
As a unitary authority since 2009, Shropshire Council has replaced all district councils in the
former 2-tier authority.
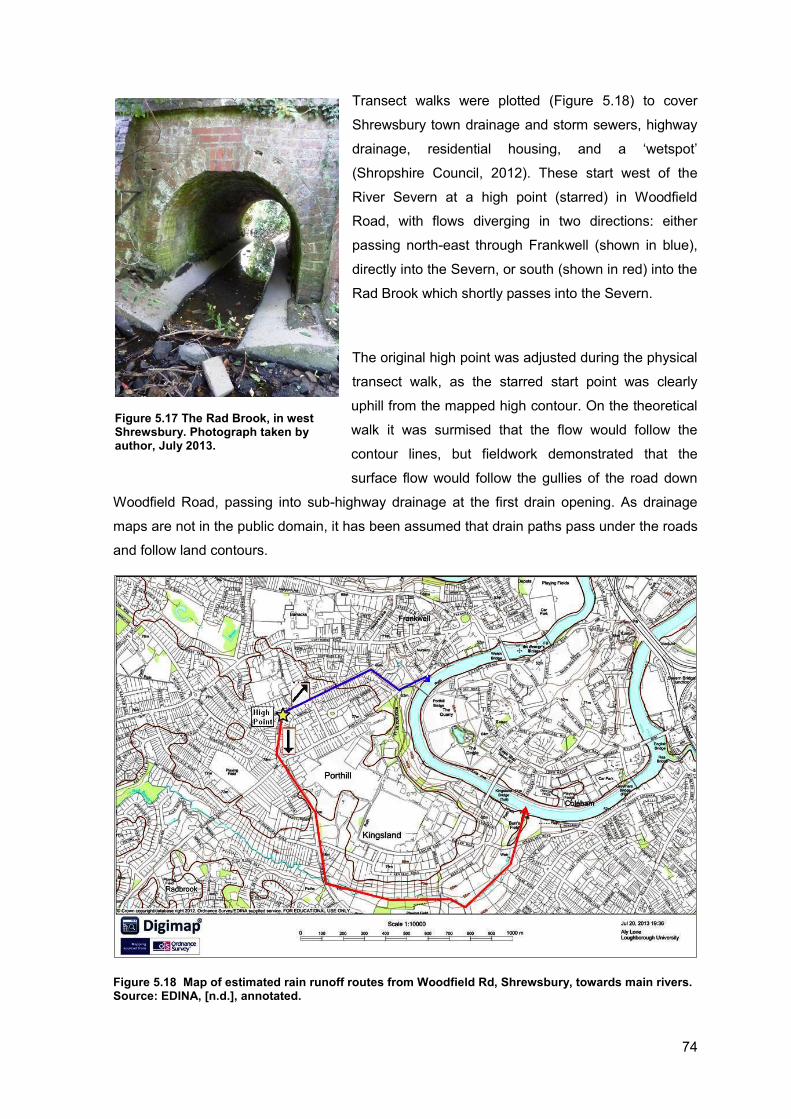
74
Transect walks were plotted (Figure 5.18) to cover
Shrewsbury town drainage and storm sewers, highway
drainage, residential housing, and a ‘wetspot’
(Shropshire Council, 2012). These start west of the
River Severn at a high point (starred) in Woodfield
Road, with flows diverging in two directions: either
passing north-east through Frankwell (shown in blue),
directly into the Severn, or south (shown in red) into the
Rad Brook which shortly passes into the Severn.
The original high point was adjusted during the physical
transect walk, as the starred start point was clearly
uphill from the mapped high contour. On the theoretical
walk it was surmised that the flow would follow the
contour lines, but fieldwork demonstrated that the
surface flow would follow the gullies of the road down
Woodfield Road, passing into sub-highway drainage at the first drain opening. As drainage
maps are not in the public domain, it has been assumed that drain paths pass under the roads
and follow land contours.
Figure 5.18 Map of estimated rain runoff routes from Woodfield Rd, Shrewsbury, towards main rivers. Source: EDINA, [n.d.], annotated.
Figure 5.17 The Rad Brook, in west Shrewsbury. Photograph taken by author, July 2013.

75
Tracking rain falling on a householder’s drive on the apex, water can take one of two possible
paths: it could either flow north east onto to Woodfield Rd (blue route, Figure 5.18), where it
would travel along the gulley until it enters a highway storm drain. In this case, water would
continue to travel under Woodfield Rd then flow south east through Frankwell. Then it is likely
to turn under New St and outfall to the river just north of Porthill Bridge.
Alternatively, (red route) it could initially flow south onto Woodfield Rd and would enter a
highway drain, continuing under the road until the drain turns southeast under Roman Road
and eventually outfalls to the Rad Brook in Kingsland (Figure 5.17). It then flows 1000m before
flowing into the River Severn after Kingsland Bridge, joining the raindrop from the east side of
the drive.
5.4.6. Sample 5 – Worcester: Theoretical & Physical Transect Walks As an old style 2-tier council, WCC partners the six district councils and Lower Severn IDB.
The Preliminary Flood Risk Assessment for WCC states that: “There are no 'Nationally
Significant Flood Risk Areas’ identified in Worcestershire for the purposes of the Flood Risk
Regulations” (WCC, 2011).
As Worcester is a renowned flood plain, this presumably means that all areas are now well
protected by the raised landscaped banks and amenity areas on the riverbanks (Figure 5.19).
Figure 5.19 Raised path and bank alongside River Severn, north Worcester. Photograph taken by author, May 2013

76
Figure 5.20 Map of estimated rain runoff routes from Leopard Hill, Worcester, towards main rivers. Source: EDINA, [n.d.], annotated.

77
Here, the transect route has been selected to include the Worcester and Birmingham canal, as
well as public land, urban road drainage, sub-surface drainage and low lying terrain.
This route starts on the top of Leopard Hill in North Worcester (Figure 5.20), within parkland
above a relatively modern housing development showing evidence of SuDS paving. The flow
travelling north would therefore partially infiltrate both the green hill and lower housing drives
and would then travel to some extent as a subsurface flow, following contours directly until it
reaches the canal or is subsumed within streams heading in the same direction. Surface flow
would follow a similar route shown in red, flowing off the hill into Oteley Close then north along
road gullies and eventually sub-highway storm drainage, under the roundabout. Alongside
Trothill Road there is a stream, where storm drainage is likely to discharge. This then flows
north through this residential area until it is presumed to
reach the canal within an inaccessible industrialised
area.
Inside the city, the canal is designated as a main river,
so while it is owned and managed by British Waterways,
it is the responsibility of the EA. The watercourse is on
public land and is managed by the Local Authority.
5.5. Limitations in data Tracking an urban route in person enriches mapped
data by allowing the contours to be confirmed, drainage
grills, culverts and outfalls to be identified (Figure 5.21),
watercourses to be tracked and any local impedance to
flow (such as blocked drains or road humps) to be
observed. Another benefit is the ability to speak to
residents to gain unexpectedly useful local knowledge,
and the observation of flood clues, such as sandbags.
For the most part, distinction between boundaries and
ownership were often less clear in rural areas than on
the OS map, but visible ownership signs, such as that of
the Shropshire Wildlife Trust, could be noted.
However, in towns, the transect walks had limited
usefulness: it remained unclear what underground route
the drains would take, outfalls to the river were rarely
visible, and surface flows could not be confirmed.
Furthermore, information about urban terrain is of limited
use, as most of the route is underground.
Figure 5.21 Outfall to Pontesbury Brook, presumed from highway drainage. Photograph taken by author, July 2013

78
In general, all routes and locations have been selected to provide a variety of influences and
terrains; however this form of selection can carry its own bias.
Jones (2000) explains the process of subsurface flow as infiltrating water soaking down to
bedrock and following this layer downhill until infiltrating the nearest watercourse. Where
necessary, it has been assumed that this will occur as described and that bedrock will run
roughly parallel to surface contours – however, this may not always be the case.
Highway drains may discharge into a combined sewer, storm sewer, watercourse or soakaway
(ICE, 2010), but as sub-surface drainage maps are not in the public domain, it is impossible to
know which route is followed. It has therefore been assumed that highway drains will follow
roads and land slopes until they can discharge into a nearby watercourse. Where there is no
watercourse, a sewer is assumed for discharge, or a soakaway in rural areas.
Finally, unusually dry weather conditions during fieldwork meant that the likely movement of
surface water at wetter times had to be surmised rather than observed.
5.6. Summary This chapter collates results from interview, planning applications, maps, transect walks, and
field observations. It remains now to analyse this data into the required mapping and
conclusions.

79
6. Analysis This chapter takes the collated results and develops the required mapping, to illustrate
spheres of institutional influence.
6.1. Diagram Methodology Originally, consideration was given to Venn diagrams, to demonstrate any overlaps in
influence. However, examination of policy and field data indicates responsibilities split into
three different types: drainage, flood risk and supervision, with very few intersections. These
layers, combined with fluctuating ownership and drainage responsibilities, suggest linear
colour coded diagrams instead. The final diagrams combine coloured and labelled boxes,
scaled in parallel on a layered horizontal axis, to illustrate different forms of ownership and
responsibility. The water flow is presented as a scaled foundation, using blue lines to express
the different channel types and direction. Responsibility is divided into the three layers, with
ownership expressed separately, to reflect the disconnect observed between the two
concepts. As terrain changes have already been illustrated on maps in the results chapter,
these are not included here.
These diagrams show the first 10km flow distance of each route selected. This decision stems
from the observation that the Environment Agency (EA) has responsibility for all main rivers,
which provides very little complexity to research. However, additional pie charts have been
plotted from each sample point to the Severn Bridge at the estuary, where the main river
designation ends. These pie charts demonstrate the breakdown of drainage responsibility
only, depicting the entire route.
One route has been plotted from each sample location, selected to demonstrate a fully
representative view of source data. As in the results chapter, these are shown in order of river
flow, enabling a sense of the shift from mountains to lowlands, from rural to increasingly
urbanity. All these diagrams derive from data supplied by maps and field work, compiled in
Appendix III: Raw Data for Analysis.
6.2. Data Interpretation Judgements about layers of responsibility are based on the policy investigation in chapter 4. It
is observed that landowners are entitled to pass water on, but they have limited liability for
drainage (ICE, 2010). However they may be instructed to carry out drainage work by the Local
Authority or IDB, indicating that overall responsibility for drainage lies with the drainage body,
even when land is privately owned. Similarly, the Local Authority is defined as responsible for
all types of flood risk since 2010, including surface and groundwater, and this is illustrated. No
entity appears to take responsibility for supervision when water is unchannelled, so this area is
marked as undefined although the EA supervises all channelled flows.

80
6.3. Diagrams
6.3.1. Sample 1 – Mountain Source, Ceredigion Figure 6.1 takes the blue route from the Severn’s source, mapped in Figure 5.6 and illustrates
the responsibilities for this remote rural area. This diagram is notable for its simplicity, but
demonstrates several points which remain valid throughout:
Ownership bears no link to responsibility - riparian rights are mostly limited to rights over
the water rather than management duties.
Where water is unchannelled, supervision is undefined – no body appears to hold
responsibility for this aspect.
There are several administrative splits: the EA’s role is divided between EA and Natural
Resources Wales (NRW); also the early flow passes across two Local Authorities (LAs).
Rivers commonly pass over (even acting as) administrative boundaries, requiring close
coordination between drainage bodies. See Box 5-1 for examples where this coordination
appears ineffective.
Figure 6.1 Diagram to demonstrate layers of responsibility, ownership and channel type. Ceredigion, blue route
Ownership for the first 19km is entirely agricultural, reflecting the remote setting.

81
Repeated handover points between EA and NRW need careful management for the full path
to sea, as the river Wye flows south along the Wales/England boundary. These administrative
splits can clearly be seen in Figure 6.2 showing the entire route, and the repeated division of
responsibilities between the two EA bodies and the LAs. Apart from the split between EA
bodies, this chart is still quite simple, and shows significant influence from the second LA.
Powys LA, 17.5
Ceredigion LA0
EA, 61
NRW, 70
Figure 6.2 Chart showing drainage responsibilities in km, along entire route. Ceredigion, blue route
6.3.2. Sample 2 – Border Hills, Powys Figure 6.3 depicts the southern red route from rural mid-Wales Figure 5.8, and demonstrates
the three previous points from 6.3.1, as well as two new general points:
Increased influence from the EA is evident here, due to the main river designation within
4km of source. This is typical of less remote settings, and will grow more pronounced.
There is only one LA before the EA takes over, and only one handover point between EA
and NRW. Administratively, this is still quite straightforward; this now appears typical of
rural settings.
The first watercourse feeds the river Lugg just as it is designated a main river, so drainage
responsibility passes to the NRW before crossing the English border, then falls under the EA
5km east. This makes three organisations liable for drainage within the first 10km.
Ownership in this case is mostly agricultural with private ownership through the villages until it
reaches Leominster; it then acquires a mix of private, business and agricultural owners. This
still has no effect on drainage liabilities which remain with the EA.

82
Figure 6.3 Diagram to demonstrate layers of responsibility, ownership and channel type. Powys, red route.
Viewing the entire length of this sample in Figure 6.4, the EA now dominates drainage
responsibilities:
Figure 6.4 Chart showing drainage responsibilities in km, along entire route. Powys, red route
Local Authority
3.5 EA Wales
5
Environment Agency 141.5

83
6.3.3. Sample 3 – Upland small town, Pontesbury This location (Figure 5.13, pink route) is semi- urban and is growing more complex (Figure
6.5). The following are notable points here:
Urban drainage responsibility is much more diverse, as the Highways Authority (HA)
manages road drainage and discharges into combined or storm sewers run by the Water
Company (WC).
Rea Internal Drainage Board (IDB) manages the remaining drainage, with repeated
handovers to different bodies.
Shropshire LA is liable for flood risk but not drainage, due to the presence of Rea IDB. The
LA may even own land but the IDB, WC or HA still manage drainage, while the LA must
manage flood risk throughout. This raises a question around the feasibility of managing
flood risk without controlling drainage.
Piped channels are more common for urban areas, and water is harder to track reliably.
The undefined area mentioned in 6.3.1 still applies, but grows smaller in urban areas as
the runoff area reduces and surface water is controlled sooner.
Figure 6.5 Diagram to demonstrate layers of responsibility, ownership and channel type. Pontesbury, pink route.

84
It is assumed here that HA own the road even where water is managed by WC, but when off-
road the WC remains responsible for piped sewers across agricultural land.
Figure 6.6 shows overwhelming influence by the EA over the entire route from Pontesbury,
with multiple drainage bodies affecting just the first 4km across town.
Figure 6.6 Chart showing drainage responsibilities in km, along entire route. Pontesbury, pink route
6.3.4. Sample 4 – Upland town, Shrewsbury Figure 6.7 examines the blue route in Figure 5.18, showing increased urban influences of HA
and WC as raised in 6.3.3, with several new points:
Ownership across the town now has closer links to the drainage responsibility chain, which
again shows urban diversity.
The EA has huge influence in this flood-prone town, managing all but the first kilometre for
all aspects.
Shropshire LA have almost no drainage duties at all, and very little flood risk management
Undefined run-off is now a tiny proportion, mostly under householder ownership.
All non-river water is piped as it passes across town.
HA and WC appear to dominate urban drainage management.
In this case, Shropshire LA is assumed to own public areas within the town, and highway
drainage is assumed to pass into storm sewers managed by SevernTrent WC.
IDB 1.4
Highways Authority
1.1
Water Company
1.3 Local
Authority 0
Environment Agency 216.2

85
Figure 6.7 Diagram to demonstrate layers of responsibility, ownership and channel type. Shrewsbury, blue route.
Across the entire route (Figure 6.8), the role of the EA continues to increase, with other
influences now barely visible, affecting only the first kilometre.
Figure 6.8 Chart showing drainage responsibilities in km, along entire route. Shrewsbury, blue route.
Highways Authority
0.12
Water Company
0.66
Local Authority
0.02
Environ-ment Agency 199.2

86
6.3.5. Sample 5 – Lowland city, Worcester Figure 6.9 charts the red route in Figure 5.20, showing city influences, such as parkland,
canal, business parks, and highway drainage. The parkland start-point gives unusually long
undefined area for a city; this would be minimal where rain falls on a road or drive. Otherwise
this diagram continues the urban trends observed above. The canal in this case is managed
by EA, in order to control the flood risk through the city (interview with EA Risk Management
Advisor, 1/8/13).
Figure 6.9 Diagram to demonstrate layers of responsibility, ownership and channel type. Worcester, red route.
Figure 6.10 shows a higher relative LA influence, owing to the shorter remaining length of the
river before the estuary. The EA influence still predominates overall.

87
Figure 6.10 Chart showing drainage responsibilities in km, along entire route. Worcester, red route
6.4. Limitations in mapping It was not possible to investigate all aspects of ownership, therefore certain assumptions have
been made. In general, ownership is divided by type of owner rather than depicted as
specified entities. It is assumed that in the absence of evidence to the contrary, all land under
roads is owned by the highways authority / agency; conversely, it is assumed that land
traversed by sewerage pipes rarely belongs to the Water Company. Rural land is assumed to
be agricultural unless it is visibly privately or business owned; while urban public areas are
assumed to be Local Authority owned. All data assumptions made in section 5.5 also apply
here.
Water flows have been measured using Digimap measuring tools, but these cannot take full
account of meanders, so flow distances are all approximate.
As water flows along a main river, upstream management influences grow in the water
downstream. This makes the range of antecedent institutional management especially wide for
lowland rivers such as in Worcester. There are limitations in presenting such responsibility
changes over a large area, so only the initial flow been mapped; however preceding influences
in the river should remain a consideration.
Highways Authority
0.75
British Waterways
0
Local Authority 2.25
Environment Agency
102

88
6.5. Summary These analysis diagrams demonstrate a number of points regarding the changing influences
along flow routes. These include noticeable changes when sampling shifts from rural to
increasingly urban settings: institutional influences are different; drainage management
changes more frequently; the EA increasingly manages more of the flow; more water is piped
underground; and unchannelled surface water reduces significantly. Other key issues are
visible over all terrains, these include: the continuous split between ownership and
responsibility; multiple drainage handovers between institutions; very high influence of the EA;
and the imposition of flood-risk responsibility upon a body which does not fully control
drainage.
These and other observations will be considered in the concluding chapter.

89
7. Conclusion and Recommendations This chapter reviews the original research questions in the light of results and analysis, recaps
findings from the analysis chapter, then presents further observations and recommendations.
7.1. Reflections
Box 7-1: Reviewing Aim and Objectives
Aims and objectives The primary aim was: ‘To present a visual mapping of the institutional responsibilities for surface
water within the case study areas: illustrating movement of a raindrop across the areas of
institutional ownership.’
This mapping was presented in the analysis chapter and discussed in detail, along with plotted
charts and annotated maps.
The original objectives were:
i. To establish the roles, responsibilities and interactions of all surface water stakeholders
The roles and responsibilities of relevant institutions were primarily established in the policy
review, with some historical data from the literature reviewing to broaden understanding. This
then combined with interview and field data to analyse the interactions of stakeholders and
illustrate these in the analysis.
ii. To track specific theoretical flows of water across a catchment, considering the implications
of runoff and infiltration, as well as constructed drainage, sewers and all watercourses
Flows were tracked using maps and transect walks to consider all forms of water, and illustrated
on annotated maps, demonstrating multiple routes.
iii. To illustrate the changes in institutional management as a visual mapping
Management was depicted on highly accessible line diagrams, in order to simplify a complex
series of rights and responsibilities.
iv. To summarise pertinent background information to facilitate these objectives
Such background data was summarised in the literature review and more importantly the policy
investigation; indeed the analysis would not have been possible without the policy review.

90
7.1.1. Methodology The combination of methods successfully generated diverse and meaningful results. The
variety of data sources proved useful for triangulating data and enriching the analysis.
Some limitations were mentioned in results; in particular that the physical transect walks
offered only a marginal increase in geographical data over the theoretical mapping. However,
it did permit the acquisition of local knowledge which provided valuable insights.
Amongst contacts, although initial information was issued, Shropshire Flood Manager proved
extremely difficult to contact by phone or email, and SevernTrent failed to supply any contact
at all, despite their many automated responses to requests. In addition, investigating
institutional failures in interaction proved difficult without the candid discussions which could
only result from in-depth relationships.
7.2. Observations Certain issues were raised within the analysis section, firstly, how can a Local Authority (LA)
control flood risk when it has only partial control over drainage? The 1991 Land Drainage Act
has been updated by the 2010 Flood and Water Management Act without real any attempt to
integrate drainage with flood management. As seen in section 2.1, flooding and drainage are
inextricably linked, but discrepancies remain between flood risk and drainage responsibility.
The distinction between land ownership and the various levels of responsibility is also
interesting and somewhat surprising. Along with the observation of split layers of
responsibility, these suggest that this field is lacking in the holistic approach which is
fundamental to both river basin management and disaster risk management.
It is also noticeable from diagrams that water companies and highways authorities act as
primary drainage managers in urban settings, normally implementing this underground; while
rural surface water is very visible, easy to manage and controlled by drainage bodies.
Frequent handovers between stakeholders regularly take place in urban settings, requiring
close coordination and increasing the risk of confusion in a crisis.
Also clear from the diagrams is the fact that the Environment Agency (EA) dominates
management of river water. Given the frequent mention of loss of local knowledge and the
EAs apparent lack of teeth it is not clear that the EA is equipped for this responsibility.
Similarly, lack of resource and loss of embedded knowledge within the LAs make it hard to
see how they can carry out their required flood management responsibilities. This loss of
continuity and institutional memory may simply be an inevitable casualty of centralised
accountability.
Other observations arose from combining data: for instance, it must be remembered that
subsurface flow still contributes to drainage as well as flooding. This is marked as initial flow
on annotated maps but not distinguished on diagrams, however is always present and

91
contributing to open drainage flow. Planning guidance advocates infiltration systems (SuDS)
in order to reduce a site’s overall runoff rate, but appears not to consider the implications of
infiltration on groundwater flooding. This is especially significant important in lowland areas. If
ground is saturated due to proximity to a floodplain, infiltration systems will fail to function, and
are likely to add to the problem. This is mentioned in Shropshire Council’s surface water
management plan, where linkages are drawn with groundwater, sewer and surface water
flooding (Shropshire Council, 2012) but apparently not considered in planning decisions.
From the planning request tracked in section 5.2 it appears that SuDS are now routinely
added to developments without any real consideration of these implications. It is apparently
regarded as a method of obtaining planning permission, allowing a ‘sustainable’ tag to be
added to new developments. However it is far from the panacea implied in the National
Planning Policy Framework, and such limitations must be considered before planning
permission is granted. Planners do need to balance local needs with flood risk, but bowing to
the pressure of developers fails to appreciate the gravity of the current flood problem.
The recent shift from state to non-state actors is evidenced by privatisation of water supply,
the increasing powers of non-elected agencies such as the EA, and the trend towards
business partnership by Defra. While pushing flood responsibility down to the LAs is
advertised as a move to local resilience and support for communities, without additional
powers or resource this seems unlikely to succeed. In practice, as many urban watercourses
are designated main rivers, most flood-prone towns have this risk managed by the EA, who
are less accountable than the LA.
Box 7-2: Further research suggestions
Further research suggestions Given more time it would have been instructive to investigate in more depth the legal
responsibilities for flood risk and supervision, as well as ownership - for instance the
‘undefined’ surface water flood responsibility, or the apparent ‘layers of responsibility’.
Given the limited availability of urban drainage information, it would be useful to build in-
depth relationships with contacts to obtain sewerage maps and more candid interviews. More
detailed diagrams could then be built based on fewer assumptions.
Given the huge role played by the EA in drainage and supervision, it would now be
instructive to investigate in depth their ability to perform this role.
Following a route in metropolitan city would be instructive and could pinpoint urban trends,
although another river basin would be required for this.

92
7.3. Recommendations Planning regulations in England and Wales need urgent review and tighter enforcement, in
order to provide rivers with viable flood storage without inundating new housing. Planning
control is the first layer of proactive surface water management and as long as identified
issues remain unaddressed (Table 4.2), the flood problem will continue to grow. The recent
planning changes with their ‘presumption in favour’ should be recognised as a step in the
wrong direction.
Lessons could be learned from other countries, especially Scotland, around flood insurance,
links with planning, participation of all stakeholders and especially accountability. Coordinated
proactive management has made a real difference there and demonstrate that change is really
feasible if the political will is strong enough.
The Environment Agency’s role is demonstrated as far-reaching and essential; this agency
should provide advocacy for wise catchment management at a senior level. Sadly this role
appears under-powered and over-cautious, particularly with their ‘yes, if’ approach to
developers. More zealous leadership could lead to an agency holding real conviction, leading
the cause for effective surface water management in the manner observed in Scotland. Better
still, fully elected and accountable controlling bodies would be a movement back in the right
direction.
Loss of local drainage knowledge should be stemmed by either knowledge management or
investment in technical roles at a local level. The current trend of funding flood schemes
through business partnerships can only aggravate such issues, and show little merit other than
saving money in the short term.
Finally, the distinction between pluvial and fluvial flooding needs to be recognised as
misleading. To mitigate risk effectively requires anticipation and proactive management, which
in the case of flood risk means managing surface water and drainage long before tributaries fill
the river. If the issue of flooding is to ever move on from insurance, protection and
rehabilitation it must be managed intelligently and before this accumulation of risk.
Water legislation in the UK has developed organically and in a fragmentary manner (see Table
4.2); consequentially is divided into issues of drainage, flooding, environment and water
resource. This fragmentation obstructs the proactive management of water and generates the
observed contradictions between flood risk, drainage and ownership. Better integrated
legislation based around river basin management, restoring the link between cause and effect,
could ensure holistic management of this vital resource and growing problem.

93
References ARNELL, N., 2000. Flood Insurance. In: PARKER, D., ed. Floods: Vol 2. London: Routledge.
ASSOCIATION of BRITISH INSURERS (ABI), 2013. The Future of Flood Insurance: What you need to know about Flood Re. Webpage, available at: https://www.abi.org.uk/Insurance-and-savings/Topics-and-issues/Flooding/Government-and-insurance-industry-flood-agreement/The-Future-of-Flood-Insurance Accessed 16/07/2013
ASSOCIATION OF DRAINAGE AUTHORITIES (ADA), [n.d.]. An introduction to Internal Drainage Boards (IDBs). Available at: www.ada.org.uk/downloads/publications/ IDBs%20An%20Introduction.pdf Accessed 11/07/2013
ASSOCIATION OF DRAINAGE AUTHORITIES and ENVIRONMENT AGENCY (EA), [n.d.], Establishing New Internal Drainage Boards – Guidance. Available at: https://consult-cy.environment-agency.gov.uk/file/2145217 Accessed 05/06/2013.
ADAPTATION SUB-COMMITTEE OF THE COMMITTEE ON CLIMATE CHANGE, 2012. Climate change – is the UK preparing for flooding and water scarcity? Available at: www.theccc.org.uk/publication/climate-change-is-the-uk-preparing-for-flooding-and-water-scarcity-3rd-progress-report-2012/ Accessed 21/06/2013.
ANDOH, R., 1994. Urban drainage - the alternative approach. 20th WEDC Conference
BBC SHROPSHIRE, 2013. Flood defences remain in Shrewsbury and Ironbridge. Available at: http://www.bbc.co.uk/news/uk-england-shropshire-20886920 Accessed 15/08/2013.
BIGGS, E. M., 2009. Changes in hydrological extremes and climate variability in the Severn Uplands. Doctoral dissertation, University of Southampton. Available at : http://eprints.soton. ac.uk/69768/1.hasCoversheetVersion/EloiseBiggs_PhDThesis.pdf Accessed 11/06/2013.
BLACK, A. and LAW, F., 2004. Chronology of British Hydrological Events. British Hydrological Society. Available at: www.trp.dundee.ac.uk/cbhe/welcome.htm Accessed 20/05/2013
BOSHER, L.S., DAINTY, A., CARRILLO, P., GLASS, J. and PRICE, A., 2009. Attaining improved resilience to floods: a proactive multi-stakeholder approach. Disaster Prevention and Management, 18 (1), pp. 9 – 22.
BOSHER, L., 2013. Flood risk management and the roles of the private sector in England. Background paper for UNISDR 2013 Global Assessment Report, UNISDR, Geneva
BRITISH PROPERTY FEDERATION, 2010. Briefing on the Flood and Water Management Act 2010. Available at: www.bpf.org.uk/en/files/bpf_documents/commercial/ BPF_briefing_on_the_Flood_and_Water_Management_Act_2010.pdf Accessed 20/02/2013.
BROWN, J. and DAMERY, S, 2002. “Managing flood risks in the UK: towards an integration of social and technical perspectives” Transactions of the Institute of British Geographers, New Series 27(4) pp412–426.
BUTLER, C, and PIDGEON, N., 2011, “From ‘flood defence’ to ‘flood risk management’: exploring governance, responsibility, and blame” Environment and Planning C: Government and Policy 29 533–547.
CAPONERA, D. A., 1992. Principles of Water Law and Administration. Rotterdam: AA Balkema.
CLIMATE CHANGE RISK ASSESSMENT (CCRA), 2012. Key Findings from the UK Climate Change Risk Assessment 2012 Available at: www.defra.gov.uk/sac/files/SAC1215-CCRA-Paper-Annex-1-Key-Findings.pdf Accessed 21/06/2013.
94
CONSTRUCTION INDUSTRY RESEARCH AND INFORMATION ASSOCIATION (CIRIA), 2004. Development and Flood Risk – guidance for the construction industry. London: CIRIA.
COULTHARD, T., FROSTICK, L., HARDCASTLE, H., JONES, K., ROGERS, D., SCOTT, M. and BANKOFF, G., 2007. The June 2007 floods in Hull: final report by the Independent Review Body. Kingston-upon-Hull, UK: Independent Review Body.
COULTHARD, T. J. and FROSTICK, L. E., 2010. The Hull floods of 2007: Implications for the governance and management of urban drainage systems. Journal of Flood Risk Management, 3(3), 223-231.
COUNCIL OF THE EUROPEAN UNION, 2000. Directive 2000/60/EC of the European Parliament and of the Council establishing a framework for community action in the field of water policy (Water Framework Directive). Available at: http://eur-lex.europa.eu/LexUriServ/ LexUriServ.do?uri=OJ:L:2000:327:0001:0072:EN:PDF Accessed 14/06/2013
COUNCIL OF THE EUROPEAN UNION, 2007. Directive 2007/60/EC of the European Parliament and of the council on the assessment and management of flood risks (Flood Management Directive). Available at: http://eur-lex.europa.eu/LexUriServ/ LexUriServ.do?uri=OJ:L:2007:288:0027:0034:EN:PDF Accessed 14/06/2013.
CRICHTON, D., 2013. Flood Risk & Insurance in England and Wales: Are there lessons to be learned from Scotland? Available at: www.jubileeriver.co.uk/Technical_Paper_1.pdf Accessed 31/07/2013.
CRICHTON, D., 2012. Flood Plain Speaking. The Chartered Insurance Institute, London Available at: http://www.cii.co.uk/knowledge/claims/articles/flood-plain-speaking/16686 Accessed 31/07/2013
DEPARTMENT FOR COMMUNITIES AND LOCAL GOVERNMENT (DCLG), 2009. Planning Policy Statement 25: Development and Flood Risk Practice Guide. Available at: https://www.gov.uk/government/uploads/system/uploads/attachment_data/file/7772/pps25guideupdate.pdf Accessed 11/07/2013.
DEPARTMENT FOR COMMUNITIES AND LOCAL GOVERNMENT (DCLG), 2009a. Planning Policy Statement 25: Development and Flood Risk. Available at: www.ambiental.co.uk/planning-policy-statement-25-pps25-development-and-flood-risk.html Accessed 12/07/2013
DEPARTMENT FOR COMMUNITIES AND LOCAL GOVERNMENT (DCLG), 2012. National Planning Policy Framework. Available at: https://www.gov.uk/government/uploads/system/ uploads/attachment_data/file/6077/2116950.pdf Accessed 12/07/2013
DEPARTMENT FOR COMMUNITIES AND LOCAL GOVERNMENT (DCLG), 2012a. Technical Guidance to the National Planning Policy Framework. Available at: https://www.gov.uk/government/ publications/national-planning-policy-framework-technical-guidance Accessed 12/07/2013
DEPARTMENT FOR ENVIRONMENT, FOOD AND RURAL AFFAIRS (DEFRA), [n.d]. Restoration or Improvement of ditches - Notes for Guidance. Available at: http://archive.defra.gov.uk/foodfarm/farmmanage/alt/documents/alt-lda-guidance-notes.pdf Accessed 05/06/2013.
DEPARTMENT FOR ENVIRONMENT, FOOD AND RURAL AFFAIRS (DEFRA, 2005. Making space for water: Taking forward a new government strategy for flood and coastal erosion risk. London, UK: Defra.
DEPARTMENT FOR ENVIRONMENT, FOOD AND RURAL AFFAIRS (DEFRA), 2008b. Future Water. London, UK: Defra.

95
DEPARTMENT FOR ENVIRONMENT, FOOD AND RURAL AFFAIRS (DEFRA), 2010. Surface Water Management Plan Technical Guidance. Available at: https://www.gov.uk/government/uploads/system/uploads/attachment_data/file/69342/pb13546-swmp-guidance-100319.pdf Accessed 15/06/2013.
DEPARTMENT FOR ENVIRONMENT, FOOD AND RURAL AFFAIRS (DEFRA), 2011. National Standards for sustainable drainage systems. Available at: https://www.gov.uk/government/uploads/system/uploads/attachment_data/file/82421/suds-consult-annexa-national-standards-111221.pdf Accessed 14/06/2013.
DEPARTMENT FOR ENVIRONMENT, FOOD AND RURAL AFFAIRS (DEFRA), 2013. Flood insurance agreement reached, press release 27th June 2013. Available at: https://www.gov.uk/government/news/flood-insurance-agreement-reached Accessed 27/06/2013
DEPARTMENT FOR ENVIRONMENT, FOOD AND RURAL AFFAIRS (DEFRA)and ENVIRONMENT AGENCY (EA), 2011. National flood and coastal erosion risk management strategy for England. Available at: http://a0768b4a8a31e106d8b0-50dc802554 eb38a24458b98ff72d550b.r19.cf3.rackcdn.com/geho0711btze-e-e.pdf Accessed 25/06/2013.
DEPARTMENT FOR ENVIRONMENT, FOOD AND RURAL AFFAIRS (DEFRA) and ENVIRONMENT AGENCY (EA), 2012. Partnership Pays. Available at: https://publications. environment-agency.gov.uk/skeleton/publications/default.aspx Accessed 25/06/2013
DEFRA, ENVIRONMENT AGENCY, NATURAL ENGLAND, FORESTRY COMMISSION and THE MARINE MANAGEMENT ORGANISATION (DEFRA NETWORK), 2013. Defra Network Offer to LEPs and City Deals. Available at: www.naturalengland.org.uk/Images/defra-network-offer_tcm6-35836.pdf Accessed 22/06/2013.
DURHAM COUNTY COUNCIL, 2012. Land drainage and watercourses. Available at: www.durham.gov.uk/pages/Service.aspx?ServiceId=8777 Accessed 05/06/2013.
EDINA, [n.d.]. Digimap Ordnance Survey Service, Available at: http://edina.ac.uk/digimap Accessed 10/08/2013
ELLIS, J., and REVITT, D., 2010. The management of urban surface water drainage in England and Wales. Water and Environment Journal, 24(1), 1-8.
ENCYCLOPAEDIA BRITANNICA, [n.d.]. Available at: www.britannica.com/EBchecked/topic/536714/River-Severn Accessed 6/06/2013.
ENGLISH NATURE, 2001. Sustainable flood defence - The case for washlands. Norfolk: Risk & Policy Analysts Limited
ENVIRONMENT AGENCY (EA), [n.d.]. Case Study: River Quaggy makes a comeback. Available at: www.environment-agency.gov.uk/static/documents/Business/ casestudyrecreation_1514776.pdf Accessed 25/06/2013.
ENVIRONMENT AGENCY (EA), [n.d.]a. Online Flood Map. Available at: http://maps.environment-agency.gov.uk/wiyby/wiybyController?x=349500.0&y=312500.0& topic=floodmap&ep=map&scale=9&location=Shrewsbury,%20Shropshire&lang=_e&layerGroups=default&distance=&textonly=off#x=350012&y=312308&lg=1,&scale=8 Accessed 09/07/2013
ENVIRONMENT AGENCY (EA), 2004. Frankwell Flood Alleviation Scheme, Shrewsbury. Available at: http://a0768b4a8a31e106d8b0-50dc802554eb38a24458b98ff72d550b.r19.cf3.rackcdn.com/ gemi0304bhes-e-e.pdf Accessed 08/07/2013.

96
ENVIRONMENT AGENCY (EA), 2009. Draft Eastern Yar Flood and Erosion Management Strategy Consultation. Available at: https://publications.environment-agency.gov.uk/skeleton/publications Accessed 22/06/2013.
ENVIRONMENT AGENCY (EA), 2009a. River Basin Management Plan, Severn River Basin District. Available at: www.environment-agency.gov.uk/research/library/publications Accessed 14/06/2013.
ENVIRONMENT AGENCY (EA), 2009b. Investing for the future – Flood and coastal risk management in England: A long‐term investment strategy. Available at: www.environment-agency.gov.uk/research/library/publications Accessed 14/06/2013
ENVIRONMENT AGENCY (EA), 2009c. River Severn Catchment Flood Management Plan. Available at: https://publications.environment-agency.gov.uk/skeleton/publications Accessed 08/07/2013
ENVIRONMENT AGENCY (EA), 2012. Guidance on surface water flood mapping for Lead Local Flood Authorities. Available at: www.environment-agency.gov.uk/research/planning/125459.aspx Accessed 15/06/2013.
ENVIRONMENT AGENCY (EA), 2012a. Local Authority Services and the Water Environment: Advice Note on the Water Framework Directive for Local Authorities across the Midlands. Available at: www.environment-agency.gov.uk/research/library/publications Accessed 14/06/2013.
ENVIRONMENT AGENCY (EA), 2012b. Water for life and livelihoods. Available at: www.environment-agency.gov.uk/research/library/publications Accessed 22/06/2013.
ENVIRONMENT AGENCY (EA), 2012c. Advice Note: Ordinary Watercourse Regulation – Consenting. Available at: www.environment-agency.gov.uk/research/library/publications Accessed 12/07/2013.
ENVIRONMENT AGENCY (EA), 2012d. Improvement Plan – update. Available at: www.environment-agency.gov.uk/research/library/publications Accessed 15/06/2013.
ENVIRONMENT AGENCY (EA), 2012e. Rural Sustainable Drainage Systems (RSuDS). Available at: www.environment-agency.gov.uk/research/library/publications Accessed 23/05/2013
ENVIRONMENT AGENCY (EA), 2012f. Living on the edge: A guide to your rights and responsibilities of riverside ownership. Available at: www.environment-agency.gov.uk/research/library/ publications Accessed 15/07/2013.
ENVIRONMENT AGENCY (EA), 2013. Interactive Flood Map: Risk of Flooding from Rivers and Sea. Available at: http://maps.environment-agency.gov.uk/wiyby/wiybyController?x=357683.0 &y=355134.0&scale=1&layerGroups=default&ep=map&textonly=off&lang=_e&topic=floodmap#x=375542&y=265837&lg=1,&scale=5 Accessed 04/07/2013.
ESCOBAR, M. and DEMERITT, D., 2012. Flooding and the framing of risk in British broadsheets, 1985–2010. Available at: www.kcl.ac.uk/sspp/departments/geography/people/academic/ demeritt/ floodingandframingofriskinbritishbroadsheets.pdf Accessed 15/06/2013.
FLEMING, G., 2002a. The Future for Flood Risk Management. In: Fleming, G., ed. Flood Risk Management. London: Thomas Telford.
FLEMING, G., 2002b. Learning to live with rivers—the ICE’s report to government. Civil Engineering 150 May 2002, Pages 15–21 Paper 12774

97
FLEMING, G. and FROST, L., 2002. Flooding and flood estimation. In: Fleming, G., ed. Flood Risk Management. London: Thomas Telford.
FROST, L., 2002. Supply and Delivery. In: Fleming, G., ed. Flood Risk Management. London: Thomas Telford.
FROST, L. and KNIGHT, D., 2002. Catchment and River Basin Management. In: Fleming, G., ed. Flood Risk Management. London: Thomas Telford.
GOODSON, J., 2011. Briefing: Keeping up with the Suds revolution and legislative evolution. Proceedings of the ICE-Municipal Engineer, 164(2), 67-70. Available at: www.icevirtuallibrary.com/content/article/10.1680/muen.2011.164.2.67 Accessed 11/06/2013.
GREAT BRITAIN. Flood Risk Regulations 2009: Elizabeth II. No. 3042 (2009) Available at: www.legislation.gov.uk/uksi/2009/3042/contents Accessed 15/06/2013.
GREAT BRITAIN. Flood and Water Management Act 2010: Elizabeth II. Chapter 29 (2010) Available at: www.legislation.gov.uk/ukpga/2010/29/contents Accessed 12/06/2013.
GREAT BRITAIN. Land Drainage Act 1961: Elizabeth II. Chapter 48 (1961) Available at: www.legislation.gov.uk/ukpga/1961/48/contents Accessed 11/06/2013.
GREAT BRITAIN. Land Drainage Act 1976: Elizabeth II. Chapter 70 (1976) Available at: www.legislation.gov.uk/ukpga/1976/70/contents Accessed 02/08/2013.
GREAT BRITAIN. Land Drainage Act 1991: Elizabeth II. Chapter 59 (1991) Available at: www.legislation.gov.uk/ukpga/1991/59/contents Accessed 11/06/2013.
GREAT BRITAIN. Land Drainage Act 1994: Elizabeth II. Chapter 25 (1994) Available at: www.legislation.gov.uk/ukpga/1994/25/contents Accessed 11/06/2013.
GREAT BRITAIN. Town and Country Planning Act 1990: Elizabeth II. Chapter 8 (1990) Available at: www.legislation.gov.uk/ukpga/1990/8/contents Accessed 15/07/2013.
GREAT BRITAIN. Water Act 1973: Elizabeth II. Chapter 37 (1973) Available at: www.legislation.gov.uk/ukpga/1973/37/contents Accessed 11/06/2013.
GREAT BRITAIN. Water Act 1989: Elizabeth II. Chapter 15 (1989) Available at: www.legislation.gov.uk/ukpga/1989/15/contents Accessed 17/06/2013.
GREAT BRITAIN. Water Industry Act 1991: Elizabeth II. Chapter 56 (1991) Available at: www.legislation.gov.uk/ukpga/1991/56/contents Accessed 17/06/2013.
GREAT BRITAIN. Water Resources Act 1963: Elizabeth II. Chapter 38 (1963) Available at: www.legislation.gov.uk/ukpga/1963/38/contents Accessed 11/06/2013.
GREAT BRITAIN. Water Resources Act 1991: Elizabeth II. Chapter 57 (1991) Available at: www.legislation.gov.uk/ukpga/1991/57/contents Accessed 17/06/2013.
GUBA, E. and LINCOLN, Y., 1994. Competing paradigms in qualitative research. Handbook of qualitative research, p105-117.
HAUGHTON, G., BANKOFF, G., and COULTHARD, T., 2010. The Neoliberalisation of Flood Risk Management. In presentation to an ESRC workshop on ‘Sub-Contracting Risk: Neoliberal Policy Agendas and the Changing Nature of Flood Risk Management,’ at Hull University (Vol. 16).
HIGHWAYS AGENCY and ENVIRONMENT AGENCY (EA), 2009. Memorandum of Understanding. Available at: http://www.highways.gov.uk/publications/corporate-documents-memorandum-of-understanding/ Accessed 15/07/2013

98
HOUSE OF COMMONS EFRA COMMITTEE, 2002. The Role of Defra. Available at: www.publications.parliament.uk/pa/cm200102/cmselect/cmenvfru/991/991.pdf Accessed 27/06/2013
HOUSE OF COMMONS EFRA SELECT COMMITTEE, 2008. Flooding. Available at: www.publications.parliament.uk /pa/cm200708/cmselect/cmenvfru/49/49.pdf Accessed 27/11/2012.
HOUSE OF COMMONS LIBRARY, 2012. Planning and Flooding, Standard Note: SN/SC/4100.
HOUSE OF COMMONS LIBRARY, 2013. Flood defence spending in England: Standard Note: SN/SC/5755.
HOUSE OF COMMONS LIBRARY, 2013a. Household flood insurance: Standard Note: SN06187
HUBER, M., 2004. Reforming the UK flood insurance regime. The breakdown of a gentlemen's agreement. Centre for Analysis of Risk and Regulation, London School of Economics and Political Science.
HUNTINGDON, S. and MACDOUGALL, K., 2002. Flooding and flood estimation. In: Fleming, G., ed. Flood Risk Management. London: Thomas Telford.
HUNTINGDON, S., KNIGHT, D. and MACDOUGALL, K., 2002. Flood Management Tools. In: Fleming, G., ed. Flood Risk Management. London: Thomas Telford.
IBBITT, R., WOODS, R. and MCKERCHAR, A., 1997. Hydrological processes of extreme events. In: Mosley, M. and Pearson, C., eds. Floods and droughts: the New Zealand experience. Wellington: New Zealand Hydrological Society.
INSTITUTE OF CIVIL ENGINEERS (ICE), 2010. Land Drainage and Flood Defence Responsibilities. 4th ed., London: Thomas Telford Ltd.
INSTITUTE OF CIVIL ENGINEERS (ICE), 2012. The State of the Nation: Water 2012. London: ICE.
JOHNSON, C. AND PRIEST, S., 2008. Flood risk management in England: A changing landscape of risk responsibility? International Journal of Water Resources Development, 24(4), 513-525.
JOHNSON, C., TUNSTALL, S. and TAPSELL, S., 2005. Floods as catalysts for policy change: Historical lessons from England and Wales. International Journal of Water Resources Development 21(4): 561‐575.
JONES, J., 2000. Physical Basis of Flooding. In: PARKER, D., ed. Floods : Vol 1 and 2. London: Routledge.
Land Drainage Regulations 1932. 21 GEO. 5, C. 44. Available at: www.legislation.gov.uk/uksro/1932/306/contents/made Accessed 11/06/2013.
LANDSCAPE INSTITUTE, 2013. Sutcliffe Park. Available at: http://www.landscapeinstitute.org/casestudies/casestudy.php?id=1 Accessed 31/07/2013.
LOWER SEVERN INTERNAL DRAINAGE BOARD (LSIDB), 2003. Policy statement on flood protection and water level management. Available at: http://www.lowersevernidb.org.uk/dbps.html Accessed 15/08/2013
LWEC UKWRIF, [n.d.]. Taking Responsibility for Water: United Kingdom Water Research and Innovation Framework 2011 – 2030. Available at: www.lwec.org.uk/sites/default/files/ Taking%20Responsibility%20for%20Water%20Full%20doc.pdf Accessed 26/11/2012.

99
MARSH, T. J. and HANNAFORD, J., 2007. The summer 2007 floods in England and Wales – a hydrological appraisal. Wallingford, Oxfordshire: Centre for Ecology & Hydrology (CEH)
MONBIOT, G., 2000. Captive state: the corporate takeover of Britain. London: Macmillan.
MINISTRY FOR AGRICULTURE, FISHERIES AND FOOD (MAFF), 1993. Strategy for Flood and Coastal Defence in England and Wales.
MYERS, M., and PASSERINI, E., 2000. Floodplain Management: historic trends and options for the future. In: PARKER, D., ed. Floods : Vol 1 and 2. London: Routledge.
NEW CIVIL ENGINEER (NCE), 2001. Debate: Homes built on flood plains. p17, New Civil Engineer, 22/11/2001.
OFWAT / ENVIRONMENT AGENCY (EA), 2007. Memorandum of Understanding. Available at: www.environment-agency.gov.uk/research/planning/33090.aspx Accessed 15/06/2013.
OFWAT, 2010. Delivering sustainable water – Ofwat’s strategy . Available at: www.OFWAT.gov.uk/aboutOFWAT/reports/forwardprogrammes/rpt_fwd_20100303OFWATstrategy.pdf Accessed 15/06/2013.
OFWAT, 2011. Comparing the Arrangements for the Management of Surface Water in England and Wales to Arrangements in Other Countries. Available at: www.OFWAT.gov.uk/ future/sustainable/drainage/rpt_com_201102mwhswd.pdf Accessed 14/06/2013.
PARKER, D., 1995. Floodplain development policy in England and Wales. Applied Geography, 15(4), 341-363.
PARKER, D., 2000a. Introduction. In: PARKER, D., ed. Floods : Vol 1 and 2. London: Routledge.
PARKER, D., 2000b. Managing Flood Hazards and Disasters. In: PARKER, D., ed. Floods : Vol 1 and 2. London: Routledge.
PARKER, D. and SEWELL, D., 1988. Evolving Water Institutions in England and Wales: An Assessment of Two Decades of Experience. Hein online: available at http://lawlibrary.unm.edu/nrj/volumes/28/v28_no4.php Accessed 10/06/2013.
PEARS, R., and SHIELDS, G., 2010. Cite them right. London: Palgrave Macmillan.
PENNING-ROWSELL, E. C., 1987. Power Behind the Flood Scene. Flood Hazard Management: British and International Perspectives. Geo Books, Norwich England.
PITT, M., 2008. The Pitt Review: learning lessons from the 2007 floods. Cabinet Office, 284668, 1207.
POIRIER, B. and DE LOË, R., 2010. Analyzing Water Institutions in the 21st Century: Guidelines for Water Researchers and Professionals. Journal of Natural Resources Policy Research, 2(3), 229-244
POPULATION COMMUNICATION SERVICES (PCS) project, [n.d.]. Session 10: Transect Walks and Observation. Available at: http://pcs.aed.org/manuals/cafs/handbook/sessions10-12.pdf Accessed 11/06/2013.
PORTER, J. and DEMERITT, D., 2012. Flood-risk management, mapping, and planning: the institutional politics of decision support in England. Environment and Planning A 44(10) 2359 – 2378.
POTTER, K., 2008. Planning Space for Water. In 10th National Hydrology Symposium.
REED, D., FAULKNER, D., ROBSON, A., HOUGHTON-CARR, H., BAYLISS, A., and Institute of Hydrology, 1999. Flood estimation handbook: procedures for flood frequency estimation. Oxford: Institute of Hydrology.
100
RICKARD, C., 2002a. Urban Drainage. In: Fleming, G., ed. Flood Risk Management. London: Thomas Telford.
RICKARD, C., 2002b. Engineered Solutions. In: Fleming, G., ed. Flood Risk Management. London: Thomas Telford.
ROWE, L., FAHEY, B., JACKSON, R. and DUNCAN, M., 1997. Effects of land use on floods and low flows. Hydrological processes of extreme events. In: Mosley, M. and Pearson, C., eds. Floods and droughts: the New Zealand experience. Wellington: New Zealand Hydrological Society.
SEVERN TRENT WATER [n.d.]. Responsibility for sewer pipes. Available at: www.stwater.co.uk/households/waste-water-and-sewers/responsibility-for-sewer-pipes/ Accessed 25/06/2013
SEVERN TRENT WATER, 2013. Work to prevent Worcester sewer flooding begins. Available at: www.stwater.co.uk/households/waste-water-and-sewers/responsibility-for-sewer-pipes/ Accessed 20/07/2013
SEWELL, D. and BARR, L., 1977. Evolution in the British institutional framework for water management. Natural resources journal. Available at http://lawschool.unm.edu/nrj/volumes/17/v17_no3.php Accessed 26/11/2012.
SHAW, E., 1989. Engineering hydrology techniques in practice. England: Ellis.
SHAW, E., 1998. Hydrology in practice. 3rd ed., UK: Stanley Thornes Pub.
SHAW, E., BEVAN, K., CHAPPELL, N., and LAMB, R., 2011. Hydrology in Practice. Oxon: Spon Press
SHROPSHIRE COUNCIL (SC), [n.d]. Watercourses and Drainage Systems – Maintenance Responsibilities. Issued by Flood and Water Manager, Shropshire Council, 5/6/2013 by email.
SHROPSHIRE COUNCIL (SC), 2010. Shropshire Outline Water Cycle Study – Final report. Available at: www.shropshire.gov.uk/media/161806/shropshire-outline-water-cycle-study-report.pdf Accessed 11/07/2013.
SHROPSHIRE COUNCIL (SC), 2010a. Guidance for drainage and flooding. Available at: http://www.shropshire.gov.uk/media/150767/guidance-for-drainage-and-flooding-leaflet.pdf Accessed 11/07/2013
SHROPSHIRE COUNCIL (SC), 2011. Shropshire Council Preliminary Flood Risk Assessment. Available at: www.shropshire.gov.uk/media/161797/shropshire-council-PFRA.pdf Accessed 23/05/2013
SHROPSHIRE COUNCIL (SC), 2012. Shrewsbury Surface Water Management Plan: Intermediate Report. Available at: www.shropshire.gov.uk/environmental-maintenance/drainage-and-flooding/surface-water-management-plans/shrewsbury-surface-water-management-plan/ Accessed 15/06/2013.
SHROPSHIRE COUNCIL (SC), 2012a. Drainage and flooding interactive map. Available at: http://shropshire.gov.uk/maps/flood.htm Accessed 15/08/2013.
SHROPSHIRE COUNCIL PLANNING PORTAL, [n.d.] Planning ref: 13/00893/FUL - document section. Available at: http://planningpa.shropshire.gov.uk/online-applications/applicationDetails .do?activeTab =summary&keyVal=MJB0W1TDF0000 . Accessed 09/07/2013
SMITH, D., 2000. Floodplain Management. In: PARKER, D., ed. Floods: Vol 1 and 2. London: Routledge.
THOMAS, D. and FORD, R., 2005. The crisis of innovation in water and wastewater. Cheltenham: Edward Elgar

101
THOMPSON, P. and SULTANA, P., 2000. Flood Embankment Strategies in Bangladesh. In: PARKER, D., ed. Floods: Vol 1 and 2. London: Routledge.
TOBIN, G., 1995. The levee love affair: a stormy relationship? JAWRA Journal of the American Water Resources Association, 31, pp359–367.
UNITED NATIONS INTERNATIONAL STRATEGY FOR DISASTER REDUCTION (UNISDR), 2004. Living with Risk: A Global Review of Disaster Reduction Initiatives. UNISDR, Geneva
WARWICKSHIRE COUNTY COUNCIL, 2011. Preliminary Flood Risk Assessment. Available at: https://democratic.warwickshire.gov.uk/Cmis5/Document.ashx?czJKcaeAi5tUFL1 DTL2UE4zNRBcoShgo Accessed 03/06/2013.
WATSON, N., DEEMING, H. and TREFFNY, R., 2009. Beyond bureaucracy? Assessing institutional change in the governance of water in England. Water Alternatives 2(3) pp448‐460
WHITE, G.,1945. Human Adjustment to Floods. University of Chicago Department of Geography Research Paper No. 29. Chicago: University of Chicago Department of Geography.
WHITE, I. and HOWE, J., 2002. Flooding and the Role of Planning in England and Wales: A Critical Review. Journal of Environmental Planning and Management, 45:5, 735-745
WORCESTER COUNTY COUNCIL (WCC), 2011. Preliminary Flood Risk Assessment 2011 - Preliminary Assessment Report.
WORDPRESS, 2009. Flooding after Hurricane Katrina. Available at: http://densitykatrina.wordpress.com Accessed 31/07/2013
WWF SCOTLAND, 2002. Turning the tide on flooding. http://assets.wwf.org.uk/downloads/turningtide.pdf Accessed 26/11/2012
WYCHAVON DISTRICT COUNCIL, 2012. Delegations under the Flood and Water Management Act 2010. Available at: www.e-wychavon.org.uk/modern.gov/ documents/s19954/ flooding%20delegations.pdf Accessed 19/06/2013

102
Bibliography AUDACIOUS PROJECT, [n.d]. Homepage. Available at: www.eng.brad.ac.uk/audacious Accessed 27/11/2012.
BICKERSTAFF K, SIMMONS P, and PIDGEON N, 2008. “Constructing responsibilities for risk: negotiating citizen–state relationships” Environment and Planning A40 1312–1330.
CANNON, T., 2000. Vulnerability analysis and disasters. In: PARKER, D., ed. Floods: Vol 1 and 2. London: Routledge.
DEPARTMENT FOR ENVIRONMENT, FOOD AND RURAL AFFAIRS (DEFRA), 2008a. Towards a new national flood emergency framework. London, UK: Defra.
ENVIRONMENT AGENCY (EA), 2006. Flood management through spatial planning. Available at: www.environment-agency.gov.uk/research/library/publications/default.aspx Accessed 11/06/2013.
FLEMING, G., HUNTINGDON, S., KNIGHT, D. and LAW, F., 2002. International. In: Fleming, G., ed. Flood Risk Management. London: Thomas Telford.
HOGG, S., 2004. Modelling Sewer and River Interaction. Ewan Associates Ltd. Available at: www.innovyze.com/news/fullarticle.aspx?id=225 Accessed 20/2/2013.
HOLNICOTE MULTI-OBJECTIVE FLOOD MANAGEMENT DEMONSTRATION PROJECT, 2011. An Analysis of the Impacts of Rural Land Management Change on Flooding and Flood Risk. www.pennyanderson.com/case-studies/defra-multi-objective-flood-management-demonstration-project Accessed 25/11/2012.
HULL CITY COUNCIL, 2008. Aqua Green Project – Appendix 1. Available at: https://web5.hullcc.gov.uk/akshull/images/att9355.doc Accessed 26/11/2012.
DANGERFIELD, B., 1979. The structure and management of the British water industry. London: Institution of Water Engineers and Scientists (IWES), 268.
JOHNSON, C. and HANDMER, J., 2002. Water supply in England and Wales: whose responsibility is it when things go wrong? Water Policy, 4(4).
NATURAL ENVIRONMENT RESEARCH COUNCIL (NERC), [n.d.]. Flooding from Intense Rainfall.www.nerc.ac.uk/research/programmes/flooding Accessed 26/11/2012.
PARKER, D.J., PRIEST, S.J., and MCCARTHY, S.S., 2011. Surface water flood warnings requirements and potential in England and Wales. Applied Geography, Vol.31(3), pp.891-900 [Peer Reviewed Journal] SciVerseScienceDirect Journals.
PRIEST, S.J., PARKER, D.J., HURFORD, A.P., WALKER, J., and EVANS, K., 2011. Assessing options for the development of surface water flood warning in England and Wales. Journal of Environmental Management, Vol.92(12), pp.3038-3048 [Peer Reviewed Journal] SciVerseScienceDirect Journals.
TUNSTALL, S. and GREEN, C., 2003. From listener to talker: The changing social role of the citizen in England and Wales. Available at: www.harmonicop.uni-osnabrueck.de/_files/_down/UK.pdf Accessed 26/11/2012
WATER UK, 2012. Can local solutions offer immediate action and a more sustainable future? Available at: www.water.org.uk/home/policy/positions/national-water-grid Accessed 26/11/2012

103
Appendix I: Interview questions
1. Environment Agency 1/8/13: Flood & Coastal Risk Management Advisor, Partnerships & Strategic Overview Team General
Is a map or list available for main rivers, other than the flood map?
What are the standard statutes used in your role?
In practice, what are the limitations of EA’s “permissive powers”?
Who are your main partners?
What are the challenges in working with those partners?
Do EA responsibilities overlap with other authorities?
Some very minor urban watercourses (even canals) are designated as main rivers – why is
this?
Where a canal is designated a main river who manages it, EA or British waterways?
Is there any confusion between EA and EA in Wales at the border rivers?
Is there enough staff to cover statutory duties?
Planning
Drainage mitigation (section 106 Town/Country planning) ruling in PPS25 – how often is this
enforced on developers?
Do developers contribute in any way to flood mitigation? Should they?
How often is EA advice a)heeded and b)feedback given to EA c) passed up to Secretary of
State for Environment for determination?
What are the implications of the new National Planning Policy Framework (NPPF) for
drainage?
Drainage
Are combined sewers a problem for storm water mgt?
Do you feel it is possible to manage floods only by managing the rivers, while others manage
the smaller drains that fill the river?
Do you see a distinction between drainage and flood risk?
Do you feel the EA works proactively to manage flood risk? Can you give examples?

104
2. WCC Local Authority (delegated to Wychavon District) 15/7/13 Senior Assistant Engineer - Wychavon District Council
General
What are the standard statutes used in your role?
Do you interact much with Lower Severn IDB?
What form does EA supervision take?
What is the usual distinction between district & county for drainage and flood risk?
Who are your main partners?
What are the challenges in working with those partners?
Do LA powers overlap with other authorities, or are boundaries clear?
Planning
Are you involved in planning? Who else should I talk to?
Drainage mitigation (section 106 ) ruling – how often is this enforced on developers?
Do developers contribute in any way to flood mitigation? Should they?
EA survey (section 105 ) ruling – how often is this enforced on developers or is the FRA
always done by developers?
How often is EA advice a) heeded and b) feedback given to EA c) passed up to Secretary of
State for determination?
What are the implications of the new National Planning Policy Framework (NPPF) for
drainage?
Is SuDS appropriate for flood plains?
How is the exception test used in practice – “wider sustainable benefits that outweigh flood
risk” means what exactly?
Drainage
Is a map available for watercourses under your jurisdiction or is OS map enough?
Is there sufficient distinction in practice between sewers and drains?
Are combined sewers a problem?
Are there still regular maintenance teams to clear culvert screens and watercourses in town?
When rain leaves a house gutter does it pass into a sewer or a road drain?
Where do residential road / highway drains discharge – sewers? Watercourses? Soakaways?

105
3. SCC Local Authority (Unitary) Flood and Water Manager,
This interview was not conducted as the Flood Manager went on holiday for 3 weeks without
warning, after which it was too late for inclusion.
General
What are the standard statutes used in your role?
Is there an IDB for the Upper Severn? Rea, Powysland, Melverley?
What form does EA supervision take?
Who are your main partners?
What are the challenges in working with those partners?
Do LA powers overlap with other authorities, or are boundaries clear?
Is there enough staff to cover statutory duties?
Planning
Drainage mitigation (section 106 ) ruling in PPS25 – how often is this enforced on developers?
Do developers contribute in any way to flood mitigation? Should they?
EA survey (section 105 ) ruling – how often is this enforced on developers or is the FRA
always done by developers?
How often is EA advice a)heeded and b)feedback given to EA c) passed up to Secretary of
Environment for determination?
What are the implications of the new National Planning Policy Framework (NPPF) for
drainage?
Regarding the Sutton Grange development, near Oteley Rd, what changes were made by
Taylor Wimpey to get past EA objections? Surely improved drainage will simply reduce flood
plain storage and exacerbate flood risk elsewhere?
How is the exception test used in practice – “wider sustainable benefits that outweigh flood
risk” means what exactly?
Drainage
Is a map available for watercourses under your jurisdiction especially where it flows
underground?
Is there sufficient distinction in practice between sewers and drains?
Are combined sewers a problem?
106
Are there still regular maintenance teams to clear culvert screens and watercourses in town?
When rain leaves a house gutter does it pass into a sewer or a road drain?
Where do highway drains discharge – sewers/watercourses/soakaways? Is this data publically
available?
Do you see a distinction between drainage and flood risk?
4. Lower Severn IDB 11/7/13 Civil Engineer - Lower Severn Internal Drainage Board
General
What are the standard statutes used in your role? 1991, 2010?
In practice, what are the limitations of IDB’s “permissive powers”?
Do IDBs manage every watercourse up to main rivers?
Who are your main partners?
What are the challenges in working with those partners?
Do IDB powers overlap with local authorities?
Do IDB powers overlap with EA?
Is there increased emphasis on flood protection? Since when?
Do development pressures affect IDBs?
Drainage
Is a map available for drains under your jurisdiction? Or is the OS map complete? What about
culverts?
This may not affect IDBs but is there sufficient distinction in practice between sewers and
drains?
This may not affect IDBs but: Are combined sewers a problem?
The complexity of IDB working was mentioned in the Pitt review as needing review with regard
to sub-catchment boards – has this been implemented? See p27 ICE 12
Have you worked with Agricultural Land Tribunals and in what circumstances?
Any other comments on institutional responsibilities?

107
5. Severn Trent This interview was not able to be conducted, as many requests failed to elicit a non-automated
response
General
Do water company powers overlap with other authorities?
Who are your main partners?
What are the challenges in working with those partners?
What are the standard statutes used in your role?
Drainage
Is a map available for sewers under your jurisdiction?
Is there sufficient distinction in practice between sewers and drains?
Are combined sewers a problem for sewage mgt?
Does the right for anyone to drain to a sewer cause you a problem?

108
6. Agricultural Landowner 1/8/13: Owner , Whitton, Powys
Do you own the land under the road, or does the highways agency?
Do you know where highways drains discharge?
Are you aware of any riparian rights or responsibilities regarding the stream across your land?
Do you use any drainage system on the farm or just soakaways?
Is there an issue here with excess surface water during excess rainfall?
Are you aware of any direction or supervision by Powys CC or the EA regarding drainage or
floods?
Have you noticed changes in agricultural land use for commercial reasons, with less deep
ploughing?

109
Appendix II : Environment Agency, Planning Advisor role Planning Advisor - Sustainable Places
The way we work is changing so this is an exciting time to join our team. We will be continuing
our current level of technical response to planning consultations but are developing our skills
to become more evidence led and strategic, with more emphasis on influencing Local
Authorities early on in the planning process.
You’ll achieve this by pro-actively influencing developers during pre-application discussions,
Local Authorities through their strategic development plans and through our role as a statutory
consultee on planning applications.
Apply at: https://ig24.i-grasp.com/fe/tpl_ea01.asp?s=4A515F4E5A565B1A&jobid=
75248,1461587159&key=33461748&c=565835767754&pagestamp=seusqjljiohujsijuk

110

111
Appendix III: Raw Data for Analysis This data was derived by measurements on Digimap
Owner Source 1 Powys 2 Pontes 3 Shrews 4 Worc 5
LA 140 - 800m 0 - 250m
1 - 2.4km
HA 400 - 1800m 20 - 140m 250 - 1000
BW N/A N/A N/A N/A 3 - 10km
AGRIC 0 - 19km 0 - 3km 1.8 - 18.8km
3.2 - 35km
PRIVATE 3 - 3.2 km 0 - 20m
ORG 0 - 400m
BUSINESS 2.4 - 3km
MIXED 19 - 150km 18.8 - 220km 0.8 - 200km 10 - 105km
Supervision
UNDEFINED 0 - 1.5km 0 - 500m 0 - 400m 0 - 20m 0 - 250m
EA 1.5 - 150km 0.5 - 150km 400m - 220km
0.020 - 200km
250m - 105km
Flood Risk
UNDEFINED 0 - 1.5km 0 - 500m 0 - 400m 0 - 20m 0 - 250m
LLFA 1.5 - 19km 0.5 - 3.5km 400 - 3800m 20 - 800m 250 - 3000
EA 19 - 150km 3.5 - 150km 3.8 - 220km 0.8 - 200km 3 - 105km
Drainage
IDB N/A N/A 0 - 400m N/A N/A
2.8 - 3.8km
HA N/A N/A 400 - 1500m 20 - 140m 250 - 1000
WC N/A N/A 1500 - 2800m 140 - 800m
BW N/A N/A N/A N/A
LA 1.5 - 19km 0 - 3.5km 0 - 20m 0 - 250m
1 - 3km
EA 19 - 150km 3.5 - 150km 3.8 - 220km 0.8 - 200km 3 - 105km
Water channel
UNDEFINED 0 - 1.5km 0 - 500m 0 - 1000m 0 - 40m 0 - 250m
COVERED 1000 - 1200 1000 - 2800m 40 - 800m 250 - 1000
OPEN 1.5 - 150km 500 - 1000 2.8 - 220km 0.8 - 200 1 - 105km
1.2 - 150km

112

113
Appendix IV: Raw Data for Pie Charts This data was derived by interpolating data in Appendix III
Source
LA (Powys) 17.5
LA (Ceredigion) 0.5
Environment Agency 61
EA Wales 70
Powys
Local Authority 3.5
EA Wales 5
Environment Agency 141.5
Pontesbury
IDB 1.4
Highways Authority 1.1
WC 1.3
Local Authority 0
Environment Agency 216.2
Shrewsbury
Highways Authority 0.12
WC 0.66
Local Authority 0.02
Environment Agency 199.2
Worcester
Highways Authority 0.75
British Waterways 0
Local Authority 2.25
Environment Agency 102

114

115
Appendix V: Work Plan and Schedule