Embed Size (px)
Citation preview

INSTITUTIONAL EQUITY RESEARCH
Page | 1 | PHILLIPCAPITAL INDIA RESEARCH
Please see penultimate page for additional important disclosures. PhillipCapital (India) Private Limited. (“PHILLIPCAP”) is a foreign broker-dealer unregistered in the USA. PHILLIPCAP research is prepared by research analysts who are not registered in the USA. PHILLIPCAP research is distributed in the USA pursuant to Rule 15a-6 of the Securities Exchange Act of 1934 solely by Rosenblatt Securities Inc, an SEC registered and FINRA-member broker-dealer.
Dabur India Ltd (DABUR IN)
Continues to defy the odds INDIA | FMCG | Quarterly Update
5 November 2019
Top takeaways from 2QFY20 Dabur 2QFY20 results were better than other FMCG companies, who have reported results
so far. In our view, volume growth of 7.4% (ex-Foods) is quite commendable as it was able to
navigate challenges of rural distress /liquidity related issues for trade channels, much better
than its peers. Management highlighted its initiative of a) increased direct distribution reach
in rural (added 3000 villages in Q2 to 51,000), b) intensive focus on power brands (65-70% of
revenue) through portfolio enhancement/ new launches and c) revamp of supply chain
infrastructure led to strong performance in tough environment. Performance was mixed bag
with health supplements leading the pack; however juices business continued to remain a
drag for fifth consecutive quarter on account of down trading to low value carbonated
drinks. HPC (grew 4.3% yoy) growth remains subdued, as increased competitive intensity
and weak consumer sentiment kept growth of oral care (4.4%) and Hair care (4-5%) under
check.
International business (30% of sales) saw 3.2% CC revenue growth only due to weak
performance of Nepal (declined 35% yoy), which was impacted due to implementation of
VCTS (Vehicle and Consignment tracking system), something similar to E-way bill in India at
time of GST implementation. Management guided international business operating
profitability should revive in coming quarters as (1) category growth coming back to
normalcy (2) benign input costs and (3) cost optimization programme. Ebitda margin
expansion (up c100 bps yoy) was higher than our expectations due to improved product mix
(increased salience of high-margin Healthcare products), low input costs and favourable
country mix within the International business.
Management cautioned that near term demand headwinds (liquidity issues in trade
channels muted consumer sentiments in urban impacting Juices and oral care business) are
likely to persist ; however, it shall be able to deliver its guidance of mid to high single digit
volume growth / 20% operating margin for FY20 on back of increased distribution reach,
new launches gaining traction and focus on power brands; which we believe is quite
commendable in relative context given other CPG companies are struggling for growth.
Segment takeaways
Corrective action in place to revive Juices business: Dabur has launched lower price point
SKU (160 ml pack) for its Real Koolerz brand to compete other fruit based drinks (for e.g
Frooti). Moreover, it also plans to launch new variants and new packaging (PET bottles) in
order to compete with carbonated players in urban areas.
Oral care lost its smile: Oral care industry declined 3% yoy in Q2 due to weak consumer
sentiment and households deferring purchase of larger packs. However, Dabur Red, flagship
brand continued its growth momentum (up 9.5% yoy) due to increasing preference of
customers towards natural products (which is growing @10% at industry level). Babool
Ayurvedic, another natural’s product which was launched in Q1FY20 in North India saw
encouraging response and it plans to roll-out on Pan-India basis soon. Management stated
competitor performance (HUL, Colgate etc) in naturals segments has not been upto the mark
Diversified portfolio makes it immune from any unknown: We believe Dabur’s diversified
portfolio makes it fool-proof from any economic, regulatory and seasonality risks that other
peers might have to tackle. Management under the guidance of Mr Mohit Malhotra is taking
steps in right direction (Focus on power brands, NPD and increased distribution reach) to drive
growth in long term. Reduction in competitive intensity from Patanjali further should support the
cause. We maintain BUY with TP with of Rs 530 (45x FY22 EPS) vs. Rs 485 (45x Sept -21 EPS).
Key Risks to our call – 1) Discount-led competition by juice/ oral care players to gain market share
and 2) any unfavourable factor could hurt growth of rural economy
BUY (Maintain) CMP RS 481 TARGET RS 530 (10%)
SEBI CATEGORY: LARGE CAP
COMPANY DATA
O/S SHARES (MN) : 1767
MARKET CAP (RSBN) : 852
MARKET CAP (USDBN) : 10.8
52 - WK HI/LO (RS) : 483 / 358
LIQUIDITY 3M (USDMN) : 11.2
PAR VALUE (RS) : 1
SHARE HOLDING PATTERN, %
Sep 19 Jun 19 Mar 19
PROMOTERS : 67.9 67.9 67.9
FII / NRI : 17.7 17.8 18.3
FI / MF : 7.7 7.0 6.6
NON PRO : 1.7 1.8 1.8
PUBLIC & OTHERS : 5.0 5.5 5.4
KEY FINANCIALS
Rs mn FY20E FY21E FY22E
Net Sales 92,192 1,01,487 1,11,742
EBIDTA 19,963 22,146 24,685
Net Profit 16,701 18,536 20,684
EPS, Rs 9.5 10.5 11.7
PER, x 50.9 45.8 41.1
EV/EBIDTA, x 41.9 37.3 33.0
PBV, X 13.0 11.2 9.7
ROE, % 25.5 24.5 23.5
Debt/Equity (%) 8.0 6.9 6.0
Vishal Gutka, Research Analyst Preeyam Tolia, Research Associate
(Rs mn) 2QFY20 2QFY19 yoy %
1QFY20 qoq %
PC yoy %
Net Sales 22,120 21,250 4.1 22,733 (2.7) 7.6
EBITDA 4,895 4,508 8.6 4,576 7.0 8.3
PAT 4,430 3,766 17.6 3,831 15.6 7.7

Page | 2 | PHILLIPCAPITAL INDIA RESEARCH
DABUR INDIA LTD QUARTERLY UPDATE
Health supplements continued its momentum - grew 14% on back of market share gains in Chyawanprash and glucose category
Hair care – impacted by sharp slowdown in hair oil category, Coconut oil disappointed due to increased competitive intensity from Marico while Amla growth was muted in Q2. Floods in some parts also impacted the hair oil portfolio.
ETR – consolidated ETR for FY20/21 stands at 18-20%
Financial Snapshot
Consolidated (Rs m) 2QFY19 2QFY20 Yoy % Comments
Volume gr (%) 8.1 4.8
Net sales 21,250 22,120 4.1 Growth across categories ; with food being only exception
Operating Costs (16,741) (17,224) 2.9
EBITDA 4,508 4,895 8.6 Improved product mix, better geographical mix and operating leverage
EBITDA Margin (%) 21.2 22.1 92bps
Depreciation (431) (545) 26.4
Interest (156) (152) -2.1
Other Income 812 818 0.7
PBT 4,734 5,016 6.0
Provision for Tax (961) (582) -39.5
-Tax Rate (%) 20.3 11.6 -870bps
Net profit before minority 3,773 4,434 17.5
Minority Interest (9) (7)
Share of profit from associate 3 2
Adj PAT 3,766 4,430 17.6
Net Profit Margin 17.7 20.0 230bps
EO Items - (400)
Reported PAT 3,766 4,030 7.0
EPS 2.1 2.3 7.0
Gross Profit 10,491 11,235 7.1 Better product mix and benign input
Gross margins (%) 49.4 50.8 142bps
Cost Details 2QFY19 2QFY20 Yoy %
Raw Material Consumption 10,758 10,885 1.2
As a % of sales 50.6 49.2 -142bps
Employees cost 2,343 2,415 3.1
As a % of sales 11.0 10.9 -11bps
Ad spends 1,335 1,442 8.0 Spends on Power brands
As a % of sales 6.3 6.5 24bps
Other expenditure 2,305 2,482 7.7
As a % of sales 10.8 11.2 37bps
Source: Company PhillipCapital India Research

Page | 3 | PHILLIPCAPITAL INDIA RESEARCH
DABUR INDIA LTD QUARTERLY UPDATE
Adjusted for Food, volume growth was 7.4% yoy
Source: Company
Category growth
Q3FY17 Q4FY17 Q1FY18 Q2FY18 Q3FY18 Q4FY18 Q1FY19 Q2FY19 3QFY19 4QFY19 1QFY20 Q2FY20
Growth rates
Markets
Domestic (6.8) 0.7 (5.5) 10.7 17.7 10.0 24.7 8.6 15.2 5.9 11 4.9
International (reported currency) 6.0 - - - - - - 3.4 1.9 0
International (constant currency) - (4.5) (2.2) 3.9 5.0 16.8 10.5 7.0 1 7.7 3.2
Categories
Health Supplements (14.0) 5.0 (7.0) 3.0 19.5 14.0 27.5 12.3 13.8 10.2 19.6 14.4
Digestives (10.0) (5.0) 4.0 11.7 19.3 7.2 21.6 10.8 22.5 11.9 18.2 10.2
OTC & Ethicals (11.0) (4.0) 6.6 5.5 8.7 7.8 13.3 7.7 17.7 12.1 15.2 6
Hair Care (20.0) (4.0) (11.0) 2.3 24.0 13.0 20.0 15.4 24 2.8 11.7 12/2.6
Home Care (5.0) 6.5 6.2 10.1 36.0 - 17.4 10.9 8.9 16.2 10.9 7
Oral Care (5.0) 9.0 1.5 22.8 23.0 11.0 17.3 3.9 10 8.2 11.4 4.4
Skin Care (11.0) - 4.0 15.8 14.5 8.5 27.1 11.9 19.3 11.2 12.1 1
Foods 52.0 10.0 - 11.7 - 2.0 26.0 1.4 11.5 6.5 0.5 -5
Source: Company PhillipCapital India Research
4 5
-5
2
-4
7
13
8
21
8.1
12.4
4.3
9.6
4.8
-10
-5
0
5
10
15
20
25
Domestic volume gr (%)

Page | 4 | PHILLIPCAPITAL INDIA RESEARCH
DABUR INDIA LTD QUARTERLY UPDATE
Two-year forward P/E band EV/EBITDA band
Source: PhillipCapital India Research Estimates
12x
24x
36x
48x
0
100
200
300
400
500
600 Rs
9x
18x
27x
36x
0
200000
400000
600000
800000
1000000 Rs mn

Page | 5 | PHILLIPCAPITAL INDIA RESEARCH
DABUR INDIA LTD QUARTERLY UPDATE
Financials
Income Statement Y/E Mar, Rs mn FY19 FY20E FY21E FY22E
Net sales 85,331 92,192 1,01,487 1,11,742
Growth, % 10.1 8.0 10.1 10.1
Other income 0 0 0 0
Total income -43,090 -46,107 -50,487 -55,157
Raw material expenses -9,379 -9,660 -10,627 -11,689
Other Operating expenses -15,466 -16,461 -18,228 -20,211
EBITDA (Core) 17,396 19,963 22,146 24,685
Growth, % 7.6 14.8 10.9 11.5
Margin, % 20.4 21.7 21.8 22.1
Depreciation -1,769 -2,235 -2,444 -2,653
EBIT 15,627 17,729 19,702 22,032
Growth, % 7.4 13.5 11.1 11.8
Margin, % 18.3 19.2 19.4 19.7
Interest paid -596 -620 -682 -750
Other income 2,962 3,258 3,584 3,942
Other Non-Operating Income -753 0 0 0
Pre-tax profit 17,249 20,367 22,605 25,225
Tax provided -2,786 -3,666 -4,069 -4,540
Profit after tax 14,463 16,701 18,536 20,684
Net Profit 14,463 16,701 18,536 20,684
Growth, % 10.9 9.8 11.0 11.6
Net Profit (adjusted) 14,463 16,701 18,536 20,684
Unadj. shares (m) 1,766 1,766 1,766 1,766
Wtd avg shares (m) 1,766 1,766 1,766 1,766
Balance Sheet Y/E Mar, Rs mn FY19 FY20E FY21E FY22E
Cash & bank 3,282 11,503 20,515 31,808
Marketable securities at cost 7,254 7,254 7,254 7,254
Debtors 8,336 9,006 9,914 10,916
Inventory 13,005 14,051 15,468 17,031
Loans & advances 110 110 110 110
Total current assets 35,862 45,800 57,136 70,994
Investments 26,334 26,334 26,334 26,334
Gross fixed assets 31,389 34,894 37,644 40,394
Less: Depreciation -11,698 -13,933 -16,376 -19,029
Add: Capital WIP 638 415 415 415
Net fixed assets 20,328 21,376 21,682 21,779
Total assets 84,366 95,351 1,06,994 1,20,949
Current liabilities 26,603 27,773 29,359 31,108
Provision 595 595 595 595
Total current liabilities 27,198 28,369 29,954 31,703
Non-current liabilities 538 1,070 1,070 1,070
Total liabilities 27,736 29,438 31,024 32,773
Paid-up capital 1,766 1,766 1,766 1,766
Reserves & surplus 54,550 63,833 73,890 86,096
Shareholders’ equity 56,631 65,913 75,970 88,177
Total equity & liabilities 84,366 95,351 1,06,994 1,20,949
Source: Company, PhillipCapital India Research Estimates
Cash Flow Y/E Mar, Rs mn FY19 FY20E FY21E FY22E
Pre-tax profit 17,249 20,367 22,605 25,225 Depreciation 1,769 2,235 2,444 2,653 Chg in working capital 306 -546 -739 -816 Total tax paid -3,621 -3,666 -4,069 -4,540 Other operating activities 0 0 0 0 Cash flow from operating activities 15,703 18,390 20,240 22,521 Capital expenditure -1,401 -3,282 -2,750 -2,750 Chg in investments 4,584 0 0 0 Chg in marketable securities -120 0 0 0 Other investing activities 0 0 0 0 Cash flow from investing activities 3,073 -3,282 -2,750 -2,750 Free cash flow 18,776 15,108 17,490 19,771 Equity raised/(repaid) 782 0 0 0 Debt raised/(repaid) -3,383 0 0 0 Dividend (incl. tax) -5,829 -7,418 -8,478 -8,478 Other financing activities 0 0 0 0 Cash flow from financing activities -8,381 -7,418 -8,478 -8,478 Net chg in cash 10,394 7,689 9,012 11,293
Valuation Ratios
FY19 FY20E FY21E FY22E
Per Share data EPS (INR) 8.2 9.5 10.5 11.7
Growth, % 10.9 9.8 11.0 11.6 Book NAV/share (INR) 31.9 37.1 42.8 49.7 FDEPS (INR) 8.6 9.5 10.5 11.7 CEPS (INR) 10.0 10.7 11.9 13.2 CFPS (INR) 7.5 8.9 9.4 10.5 DPS (INR) 2.8 3.5 4.0 4.0 Return ratios
Return on assets (%) 17.6 19.3 19.0 18.8 Return on equity (%) 27.0 25.5 24.5 23.5 Return on capital employed (%) 25.0 27.6 26.5 25.6 Turnover ratios
Asset turnover (x) 3.5 3.8 4.0 4.2 Sales/Total assets (x) 1.0 1.0 1.0 1.0 Sales/Net FA (x) 4.2 4.4 4.7 5.1 Working capital/Sales (x) (0.0) (0.0) 0.0 0.0 Fixed capital/Sales (x) - - - - Working capital days (5.5) (2.9) 0.0 2.7 Liquidity ratios Current ratio (x) 1.3 1.6 1.9 2.3 Quick ratio (x) 0.9 1.1 1.4 1.7 Interest cover (x) 26.2 28.6 28.9 29.4 Dividend cover (x) Total debt/Equity (%) 9.3 8.0 6.9 6.0 Net debt/Equity (%) 3.5 (9.5) (20.2) (30.2) Valuation PER (x) 55.8 50.9 45.8 41.1 Price/Book (x) 15.1 13.0 11.2 9.7 Yield (%) EV/Net sales (x) 9.9 9.1 8.1 7.3 EV/EBITDA (x) 48.5 41.9 37.3 33.0 EV/EBIT (x) 54.0 47.2 42.0 37.0
Page | 6 | PHILLIPCAPITAL INDIA RESEARCH
DABUR INDIA LTD QUARTERLY UPDATE
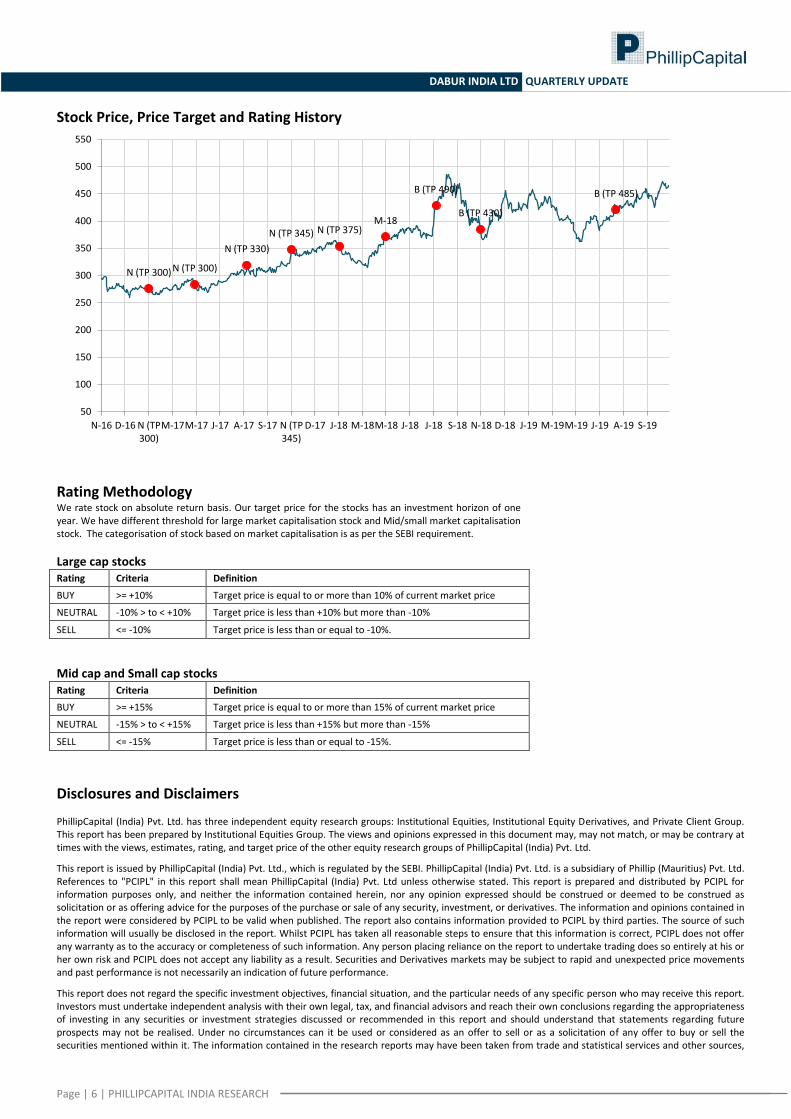
Stock Price, Price Target and Rating History
Rating Methodology We rate stock on absolute return basis. Our target price for the stocks has an investment horizon of one year. We have different threshold for large market capitalisation stock and Mid/small market capitalisation stock. The categorisation of stock based on market capitalisation is as per the SEBI requirement.
Large cap stocks Rating Criteria Definition
BUY >= +10% Target price is equal to or more than 10% of current market price
NEUTRAL -10% > to < +10% Target price is less than +10% but more than -10%
SELL <= -10% Target price is less than or equal to -10%.
Mid cap and Small cap stocks Rating Criteria Definition
BUY >= +15% Target price is equal to or more than 15% of current market price
NEUTRAL -15% > to < +15% Target price is less than +15% but more than -15%
SELL <= -15% Target price is less than or equal to -15%.
Disclosures and Disclaimers PhillipCapital (India) Pvt. Ltd. has three independent equity research groups: Institutional Equities, Institutional Equity Derivatives, and Private Client Group. This report has been prepared by Institutional Equities Group. The views and opinions expressed in this document may, may not match, or may be contrary at times with the views, estimates, rating, and target price of the other equity research groups of PhillipCapital (India) Pvt. Ltd.
This report is issued by PhillipCapital (India) Pvt. Ltd., which is regulated by the SEBI. PhillipCapital (India) Pvt. Ltd. is a subsidiary of Phillip (Mauritius) Pvt. Ltd. References to "PCIPL" in this report shall mean PhillipCapital (India) Pvt. Ltd unless otherwise stated. This report is prepared and distributed by PCIPL for information purposes only, and neither the information contained herein, nor any opinion expressed should be construed or deemed to be construed as solicitation or as offering advice for the purposes of the purchase or sale of any security, investment, or derivatives. The information and opinions contained in the report were considered by PCIPL to be valid when published. The report also contains information provided to PCIPL by third parties. The source of such information will usually be disclosed in the report. Whilst PCIPL has taken all reasonable steps to ensure that this information is correct, PCIPL does not offer any warranty as to the accuracy or completeness of such information. Any person placing reliance on the report to undertake trading does so entirely at his or her own risk and PCIPL does not accept any liability as a result. Securities and Derivatives markets may be subject to rapid and unexpected price movements and past performance is not necessarily an indication of future performance.
This report does not regard the specific investment objectives, financial situation, and the particular needs of any specific person who may receive this report. Investors must undertake independent analysis with their own legal, tax, and financial advisors and reach their own conclusions regarding the appropriateness of investing in any securities or investment strategies discussed or recommended in this report and should understand that statements regarding future prospects may not be realised. Under no circumstances can it be used or considered as an offer to sell or as a solicitation of any offer to buy or sell the securities mentioned within it. The information contained in the research reports may have been taken from trade and statistical services and other sources,
N (TP 300) N (TP 300)
N (TP 330)
N (TP 345) N (TP 375) M-18
B (TP 490)
B (TP 430)
B (TP 485)
50
100
150
200
250
300
350
400
450
500
550
N-16 D-16 N (TP 300)
M-17 M-17 J-17 A-17 S-17 N (TP 345)
D-17 J-18 M-18 M-18 J-18 J-18 S-18 N-18 D-18 J-19 M-19 M-19 J-19 A-19 S-19

Page | 7 | PHILLIPCAPITAL INDIA RESEARCH
DABUR INDIA LTD QUARTERLY UPDATE
which PCIL believe is reliable. PhillipCapital (India) Pvt. Ltd. or any of its group/associate/affiliate companies do not guarantee that such information is accurate or complete and it should not be relied upon as such. Any opinions expressed reflect judgments at this date and are subject to change without notice.
Important: These disclosures and disclaimers must be read in conjunction with the research report of which it forms part. Receipt and use of the research report is subject to all aspects of these disclosures and disclaimers. Additional information about the issuers and securities discussed in this research report is available on request.
Certifications: The research analyst(s) who prepared this research report hereby certifies that the views expressed in this research report accurately reflect the research analyst’s personal views about all of the subject issuers and/or securities, that the analyst(s) have no known conflict of interest and no part of the research analyst’s compensation was, is, or will be, directly or indirectly, related to the specific views or recommendations contained in this research report.
Additional Disclosures of Interest: Unless specifically mentioned in Point No. 9 below: 1. The Research Analyst(s), PCIL, or its associates or relatives of the Research Analyst does not have any financial interest in the company(ies) covered in
this report. 2. The Research Analyst, PCIL or its associates or relatives of the Research Analyst affiliates collectively do not hold more than 1% of the securities of the
company (ies)covered in this report as of the end of the month immediately preceding the distribution of the research report. 3. The Research Analyst, his/her associate, his/her relative, and PCIL, do not have any other material conflict of interest at the time of publication of this
research report. 4. The Research Analyst, PCIL, and its associates have not received compensation for investment banking or merchant banking or brokerage services or for
any other products or services from the company(ies) covered in this report, in the past twelve months. 5. The Research Analyst, PCIL or its associates have not managed or co-managed in the previous twelve months, a private or public offering of securities for
the company (ies) covered in this report. 6. PCIL or its associates have not received compensation or other benefits from the company(ies) covered in this report or from any third party, in
connection with the research report. 7. The Research Analyst has not served as an Officer, Director, or employee of the company (ies) covered in the Research report. 8. The Research Analyst and PCIL has not been engaged in market making activity for the company(ies) covered in the Research report. 9. Details of PCIL, Research Analyst and its associates pertaining to the companies covered in the Research report:
Sr. no. Particulars Yes/No
1 Whether compensation has been received from the company(ies) covered in the Research report in the past 12 months for investment banking transaction by PCIL
No
2 Whether Research Analyst, PCIL or its associates or relatives of the Research Analyst affiliates collectively hold more than 1% of the company(ies) covered in the Research report
No
3 Whether compensation has been received by PCIL or its associates from the company(ies) covered in the Research report No
4 PCIL or its affiliates have managed or co-managed in the previous twelve months a private or public offering of securities for the company(ies) covered in the Research report
No
5 Research Analyst, his associate, PCIL or its associates have received compensation for investment banking or merchant banking or brokerage services or for any other products or services from the company(ies) covered in the Research report, in the last twelve months
No
Independence: PhillipCapital (India) Pvt. Ltd. has not had an investment banking relationship with, and has not received any compensation for investment banking services from, the subject issuers in the past twelve (12) months, and PhillipCapital (India) Pvt. Ltd does not anticipate receiving or intend to seek compensation for investment banking services from the subject issuers in the next three (3) months. PhillipCapital (India) Pvt. Ltd is not a market maker in the securities mentioned in this research report, although it, or its affiliates/employees, may have positions in, purchase or sell, or be materially interested in any of the securities covered in the report.
Suitability and Risks: This research report is for informational purposes only and is not tailored to the specific investment objectives, financial situation or particular requirements of any individual recipient hereof. Certain securities may give rise to substantial risks and may not be suitable for certain investors. Each investor must make its own determination as to the appropriateness of any securities referred to in this research report based upon the legal, tax and accounting considerations applicable to such investor and its own investment objectives or strategy, its financial situation and its investing experience. The value of any security may be positively or adversely affected by changes in foreign exchange or interest rates, as well as by other financial, economic, or political factors. Past performance is not necessarily indicative of future performance or results.
Sources, Completeness and Accuracy: The material herein is based upon information obtained from sources that PCIPL and the research analyst believe to be reliable, but neither PCIPL nor the research analyst represents or guarantees that the information contained herein is accurate or complete and it should not be relied upon as such. Opinions expressed herein are current opinions as of the date appearing on this material, and are subject to change without notice. Furthermore, PCIPL is under no obligation to update or keep the information current. Without limiting any of the foregoing, in no event shall PCIL, any of its affiliates/employees or any third party involved in, or related to computing or compiling the information have any liability for any damages of any kind including but not limited to any direct or consequential loss or damage, however arising, from the use of this document.
Copyright: The copyright in this research report belongs exclusively to PCIPL. All rights are reserved. Any unauthorised use or disclosure is prohibited. No reprinting or reproduction, in whole or in part, is permitted without the PCIPL’s prior consent, except that a recipient may reprint it for internal circulation only and only if it is reprinted in its entirety.
Caution: Risk of loss in trading/investment can be substantial and even more than the amount / margin given by you. Investment in securities market are subject to market risks, you are requested to read all the related documents carefully before investing. You should carefully consider whether trading/investment is appropriate for you in light of your experience, objectives, financial resources and other relevant circumstances. PhillipCapital and any of its employees, directors, associates, group entities, or affiliates shall not be liable for losses, if any, incurred by you. You are further cautioned that trading/investments in financial markets are subject to market risks and are advised to seek independent third party trading/investment advice outside PhillipCapital/group/associates/affiliates/directors/employees before and during your trading/investment. There is no guarantee/assurance as to returns or profits or capital protection or appreciation. PhillipCapital and any of its employees, directors, associates, and/or employees, directors, associates of PhillipCapital’s group entities or affiliates is not inducing you for trading/investing in the financial market(s). Trading/Investment decision is your sole responsibility. You must also read the Risk Disclosure Document and Do’s and Don’ts before investing.
Kindly note that past performance is not necessarily a guide to future performance.
Page | 8 | PHILLIPCAPITAL INDIA RESEARCH
DABUR INDIA LTD QUARTERLY UPDATE
For Detailed Disclaimer: Please visit our website www.phillipcapital.in IMPORTANT DISCLOSURES FOR U.S. PERSONS This research report is a product of PhillipCapital (India) Pvt. Ltd. which is the employer of the research analyst(s) who has prepared the research report. PhillipCapital (India) Pvt Ltd. is authorized to engage in securities activities in India. PHILLIPCAP is not a registered broker-dealer in the United States and, therefore, is not subject to U.S. rules regarding the preparation of research reports and the independence of research analysts. This research report is provided for distribution to “major U.S. institutional investors” in reliance on the exemption from registration provided by Rule 15a-6 of the U.S. Securities Exchange Act of 1934, as amended (the “Exchange Act”). If the recipient of this report is not a Major Institutional Investor as specified above, then it should not act upon this report and return the same to the sender. Further, this report may not be copied, duplicated and/or transmitted onward to any U.S. person, which is not a Major Institutional Investor.
Any U.S. recipient of this research report wishing to effect any transaction to buy or sell securities or related financial instruments based on the information provided in this research report should do so only through Rosenblatt Securities Inc, 40 Wall Street 59th Floor, New York NY 10005, a registered broker dealer in the United States. Under no circumstances should any recipient of this research report effect any transaction to buy or sell securities or related financial instruments through PHILLIPCAP. Rosenblatt Securities Inc. accepts responsibility for the contents of this research report, subject to the terms set out below, to the extent that it is delivered to a U.S. person other than a major U.S. institutional investor.
The analyst whose name appears in this research report is not registered or qualified as a research analyst with the Financial Industry Regulatory Authority (“FINRA”) and may not be an associated person of Rosenblatt Securities Inc. and, therefore, may not be subject to applicable restrictions under FINRA Rules on communications with a subject company, public appearances and trading securities held by a research analyst account. Ownership and Material Conflicts of Interest Rosenblatt Securities Inc. or its affiliates does not ‘beneficially own,’ as determined in accordance with Section 13(d) of the Exchange Act, 1% or more of any of the equity securities mentioned in the report. Rosenblatt Securities Inc, its affiliates and/or their respective officers, directors or employees may have interests, or long or short positions, and may at any time make purchases or sales as a principal or agent of the securities referred to herein. Rosenblatt Securities Inc. is not aware of any material conflict of interest as of the date of this publication Compensation and Investment Banking Activities Rosenblatt Securities Inc. or any affiliate has not managed or co-managed a public offering of securities for the subject company in the past 12 months, nor received compensation for investment banking services from the subject company in the past 12 months, neither does it or any affiliate expect to receive, or intends to seek compensation for investment banking services from the subject company in the next 3 months. Additional Disclosures This research report is for distribution only under such circumstances as may be permitted by applicable law. This research report has no regard to the specific investment objectives, financial situation or particular needs of any specific recipient, even if sent only to a single recipient. This research report is not guaranteed to be a complete statement or summary of any securities, markets, reports or developments referred to in this research report. Neither PHILLIPCAP nor any of its directors, officers, employees or agents shall have any liability, however arising, for any error, inaccuracy or incompleteness of fact or opinion in this research report or lack of care in this research report’s preparation or publication, or any losses or damages which may arise from the use of this research report.
PHILLIPCAP may rely on information barriers, such as “Chinese Walls” to control the flow of information within the areas, units, divisions, groups, or affiliates of PHILLIPCAP.
Investing in any non-U.S. securities or related financial instruments (including ADRs) discussed in this research report may present certain risks. The securities of non-U.S. issuers may not be registered with, or be subject to the regulations of, the U.S. Securities and Exchange Commission. Information on such non-U.S. securities or related financial instruments may be limited. Foreign companies may not be subject to audit and reporting standards and regulatory requirements comparable to those in effect within the United States.
The value of any investment or income from any securities or related financial instruments discussed in this research report denominated in a currency other than U.S. dollars is subject to exchange rate fluctuations that may have a positive or adverse effect on the value of or income from such securities or related financial instruments.
Past performance is not necessarily a guide to future performance and no representation or warranty, express or implied, is made by PHILLIPCAP with respect to future performance. Income from investments may fluctuate. The price or value of the investments to which this research report relates, either directly or indirectly, may fall or rise against the interest of investors. Any recommendation or opinion contained in this research report may become outdated as a consequence of changes in the environment in which the issuer of the securities under analysis operates, in addition to changes in the estimates and forecasts, assumptions and valuation methodology used herein.
No part of the content of this research report may be copied, forwarded or duplicated in any form or by any means without the prior written consent of PHILLIPCAP and PHILLIPCAP accepts no liability whatsoever for the actions of third parties in this respect.
PhillipCapital (India) Pvt. Ltd. Registered office: 18th floor, Urmi Estate, Ganpatrao Kadam Marg, Lower Parel (West), Mumbai – 400013, India.