Embed Size (px)
Citation preview

PROOFS O
NLY
Institutional and Individual Influenceson the President’s Veto
John B+ GilmourCollege of William & Mary
This article evaluates and compares “president” and “presidency” centered explanations of presi-dential activity with respect to one important presidential power, the veto. Using individual billdata for nine congresses characterized by divided party government, I estimate a logistic regressionmodel of presidential vetoes. This contrasts with previous research, which has used annual aggre-gate data. Using individual bill data allows controls for objectionable legislation passed by Con-gress and enables me to measure and compare the “propensity to veto” of different presidents. Iconclude that presidential vetoes are in substantial measure caused by Congress passing objection-able bills, but that even controlling for congressional behavior, presidents exhibit strikingly differ-ent veto behavior. Ford was most prone to using the veto, and Reagan, the least. Although externalfactors exert great influence on the president’s veto decision, the individual choices and strategiesof presidents also have an important influence.
A paradox of the American presidency is that this office, routinely called themost powerful on Earth, is also said by many observers to allow its incumbentrelatively little autonomy. Neustadt (1960) asked whether the president was a“leader or clerk.” Similarly, recent work has focused on “president” versus “pres-idency” centered explanations of presidential activity (Hager and Sullivan 1994;Shields and Huang 1997). Presidency-centered explanations suppose that thepresident is a clerk and that presidential behavior is a function of the institu-tional setting of the president. From this perspective, the individual attributesand idiosyncratic strategic choices of presidents have little influence, and pres-idents make the choices they do because of externally imposed constraints overwhich they have little control. The essence of the presidency-centered approachis the view “that most presidents would behave similarly in similar contexts”(Hager and Sullivan 1994, 1081). President-centered explanations suppose thatthe president makes choices that are not determined by outside factors and thatindividual attributes of the president will make a difference. According to thepresident-centered view, the president will have the freedom of action to im-
I thank Ron Rapoport, Eric Jensen, Sam Baker, Bill Hixon, Dan Ponder, Terry Sullivan, JeremyZilber, and anonymous referees for helpful suggestions or comments on previous drafts of thispaper.
JOPO 040400crfc
THE JOURNAL OF POLITICS, Vol+ 64, No+ 1, February 2002, Pp+ 198–218© 2002 Blackwell Publishers, 350 Main St+, Malden, MA 02148, USA, and 108 Cowley Road,Oxford OX4 1JF, UK+

PROOFS O
NLY
pose his own views of leadership on the office and “to be as big a man as hecan.” 1
Contemporary research on the president has tended more in the presidency-centered than the president-centered direction. Terry Moe contends that theo-retical development in presidential studies will come primarily from a focus onthe institutions of the presidency, not on “personal factors” (Moe 1993, 338).Similarly, Hager and Sullivan (1994) find presidency-centered explanations moreuseful in understanding presidential public activity, and Shields and Huang (1997)find the same for presidential vetoes.
This article evaluates and compares president and presidency-centered expla-nations for one important area of presidential power, the veto. The study islimited to periods of divided party control of Congress and the president. Theresearch strategy is to use a data set of individual bills passed by Congress toascertain the extent to which institutional variables account for vetoes and theextent to which variables for individual presidents account for variation in vetobehavior. If, despite controls for appropriate institutional factors, variables forindividual presidents can account for variation in veto behavior, one can, withdue caution, interpret that as supporting the view that presidents are using theveto in distinctively different ways. Hager and Sullivan use this method to in-vestigate the importance of president- and presidency-centered factors in ex-plaining presidential public activity.
Some previous research has investigated the importance of individual behav-ior as an influence on veto behavior. Simonton (1987) has shown that presi-dents exhibiting “inflexibility” as a personality trait tend to veto more oftenthan flexible presidents. Other work has investigated the specific veto strat-egies of individual presidents, especially President Ford, who relied heavily onthe veto in his dealings with strongly Democratic congresses (Collier 1997,Light 1991, Reichley 1981). The puzzle for scholars is to untangle institutionaland individual influences on presidential behavior in order to understand theirrelative contributions to the observed behavior of the presidents.
The evidence in this article suggests that institutional explanations are im-portant, but so are individual ones.
Aggregate Models of the Veto
Previous research on presidential vetoes has been limited by a reliance onaggregate data that has, in turn, all but precluded consideration of anything butpresidency-centered explanations. The chief goal of most previous veto re-search has been to explain variation in the rate of presidential vetoes over time.There have been several important papers on the veto, but those by Rohde andSimon (1985) and Woolley (1991) stand out as particularly useful. Articles byHoff (1991) and Shields and Huang (1995, 1997) elaborate on the work of
1 This is Woodrow Wilson’s phrase, quoted by Neustadt (1960, 6).
Institutional and Individual Influences on the President’s Veto 199

PROOFS O
NLY
Rohde and Simon and Woolley, although they work within the same generalframework.
Rohde and Simon propose what is in essence a two-step model of presiden-tial vetoes. A key intervening variable in aggregate models is the frequencywith which Congress passes “objectionable legislation,” to use Woolley’s term.Objectionable legislation greatly displeases the president and is likely to resultin a veto.
In the first step of the model, Congress passes bills, some of which are “ob-jectionable.” Rohde and Simon imply that the rate at which Congress passesobjectionable bills will depend on a variety of circumstances, mostly relating tothe power position of the president. When the president is politically weak,lacking public approval and party support in Congress, Congress will pass moreobjectionable legislation. The stronger the president’s position is, the less ob-jectionable legislation Congress should pass.
In the second step of the model, objectionable legislation explains the num-ber of vetoes. Rohde and Simon write that vetoes are a “function of the fre-quency with which the Congress produces legislation which is radically differentfrom that which the president desires it to produce” (Rohde and Simon 1985,401). In aggregate models of the veto, the more objectionable bills Congresspasses, the more bills the president will veto.
The primary weakness in aggregate models of presidential vetoes is that thekey intermediary variable, the amount of objectionable legislation passed byCongress, is both unobserved and unmeasured. Lacking a measure of objection-able legislation, Rohde and Simon and others estimate the model as if it werereally a one-step model. That is, they use presidential resources and other polit-ical variables to account for the frequency of vetoes. They assume that the in-dependent variables are having the hypothesized effect on passage of objectionablelegislation and that the objectionable legislation is driving the rate of vetoes.
The Rohde and Simon model has the unfortunate consequence of casting thepresident as an automaton, or perhaps as Neustadt’s “clerk,” whose exercise ofthe veto is determined largely by congressional action. The veto is portrayed asa ministerial function, not as an important matter of presidential discretion andjudgment. Clearly, objectionable legislation has a great influence on presiden-tial veto behavior, but when the president casts a veto he is less like a clerkthan at almost any other time. According to the Rohde and Simon model, Ford’sveto binge would be due to Congress passing an unusually large amount ofobjectionable legislation. The binge could, however, be due to (1) Congresspassing objectionable legislation, or (2) Ford being unusually veto-prone, or(3) some combination of both. Woolley (1991) takes this problem into accountby incorporating a dummy variable for President Ford, who is widely acknowl-edged to have vetoed more than a normal amount of legislation. But his ap-proach, which relies on aggregate data, cannot distinguish between Congresshaving passed an exceptional amount of objectionable legislation and Ford wield-ing a “hair trigger” veto pen.
200 John B. Gilmour
PROOFS O
NLY
Woolley distinguishes between “major” and “minor” vetoes, estimates sepa-rate models for each, and finds very different results. He concludes that “vari-ation in the likelihood of a major bill veto is almost entirely a function ofvariation in the president’s power resources” (Woolley 1991, 297). He tests“president-centered” explanations by including a dummy variable for PresidentFord and finds that, as expected, Ford vetoed more than the other presidents.Vetoes of minor bills are not influenced by presidential resources, but theytend to increase in election years.
Shields and Huang (1995) modify the Rohde and Simon and Woolley analy-sis by updating the analysis and employing an “event count” estimator. Insteadof distinguishing between “major” and “minor” vetoes, Shields and Huang ex-clude pocket vetoes, contending that decision making on pocket vetoes is dif-ferent. With their event count estimator, they find that the Ford variable is notstatistically significant. They find that unemployment, midterm elections, andthe number of public bills increase vetoes, while international conflicts, presi-dential popularity, and party support in the Senate reduce vetoes.
Shields and Huang (1997) provide a useful improvement on previous aggre-gate studies by disaggregating to the month rather than the year. This givesthem far greater analytic power, allowing them to test hypotheses untestablewith annual data. They compare president- and presidency-centered models ofthe veto and do not find statistically significant differences. Thus they con-clude that the presidency-centered model can be accepted as a more parsimo-nious model. Their results are limited by their inability to control for quantityof objectionable legislation passed.
Congressional Provocation and PresidentialPropensity to Veto
Studies of the veto need to accommodate variation in presidential behavior aswell as in congressional behavior. Just as Congress can be more or less confron-tational in the legislation it sends the president, the president can be more orless inclined to exercise the veto. We can see vetoes as a product of two factors,both of which are measurable, observable attributes of congressional and presi-dential. The first is the tendency of Congress to provoke a veto, and the secondis the president’s propensity to veto. Vetoes result from both of these factors.
In passing bills, Congress can be motivated by more than a desire to create anew law. Congress can, and routinely does, pass laws deliberately designed toprovoke a presidential veto. The purpose of provoking a veto is symbolic—toshow important constituencies in a very clear way that Congress favors some-thing and that the president is against it (Gilmour 1995; Groseclose and Mc-Carty 2001). The more provocative legislation Congress passes, the more vetoesthere will be.
Presidents can in principle have a greater or lesser “propensity to veto.” Whetheror not that propensity varies across presidents remains to be empirically dem-
Institutional and Individual Influences on the President’s Veto 201

PROOFS O
NLY
onstrated. By propensity to veto, I mean a characteristic or strategic posture ofa president defined by a greater or lesser willingness to use the veto. Let usassume that we can by some objective procedure determine for each bill, inadvance of its being presented to the president, its “objectionableness.” For allpresidents the probability that they will veto a bill rises with its objectionable-ness. A president with a high propensity to veto will veto legislation that apresident with a low propensity would sign. In discussing the concept of apropensity to veto, I do not mean to posit any cause for why presidents mightexhibit different propensities.
Measuring Congressional Provocation
The fundamental challenge in this study is to control for the shifting partisanand strategic circumstances that confront presidents so that we can isolate be-havior attributable to the presidents themselves. A variety of institutional fac-tors will influence the president’s veto decisions, but undoubtedly one of themost important, and possibly the most important, will be the nature and provoc-ativeness of the legislation that Congress passes. We have no way of measuringdirectly the objectionableness of legislation. But by observing how the bill ispassed by Congress and who votes for it and against it, we can learn a greatdeal about the bill. We can use votes in Congress by the president’s party asproxies for the president position and votes by the other party as negative proxies.
When members of the congressional majority are facing a president of theother party and want to ensure that a bill will become law, they must normallycompromise with the president and the minority in Congress. If they are moreconcerned about scoring points with constituencies and developing an issue touse in the next election, they need not compromise. To gain bipartisan supportfor a bill, the majority can modify a bill by eliminating features most objection-able to the minority. If the congressional minority opposes the bill in substan-tial numbers, there is good reason to believe that the president will find the billtroubling as well.
We will consider party voting on bills as a useful but imperfect measure oftheir objectionableness. The more support a bill receives from members of hisparty in Congress, all else being equal, the more the president will like it.Similarly, the more support a bill receives from members of the other party, theless likely the president is to approve of the bill.2 I do not mean to imply that
2 An alternative to relying on party support on final passage as a measure of the ideologicalsuitability of legislation would be to use, as McCarty and Poole (1995) did, the NOMINATE scoresof members supporting and opposing a bill to estimate the ideological positioning of the bill. Bothapproaches should yield similar results. Neither approach actually tells what the ideological posi-tioning of the bill is, only the position of the people who voted for and against. A bill increasingthe minimum wage might, because of popular sentiment at the time, draw some votes from conser-vative members. That would not make increasing the minimum wage a conservative bill: it wouldbe a liberal policy for which conservatives grudgingly voted.
202 John B. Gilmour

PROOFS O
NLY
the president is taking the congressional vote as a cue, although that may be thecase. More likely, the president and members of Congress from his party reactsimilarly because of shared beliefs.
This approach assumes that if two similarly obnoxious bills were passed bythe majority party in two different congresses, the president’s party would voteagainst them in roughly similar proportions both years. This approach takes thereactions of members of Congress to legislation as a basis for comparisonsacross bills and across time. It assumes that the voting in one Congress is com-parable to voting in another and that congressional voting is an equally goodsurrogate for presidential preference across time. This is not a completely ac-curate assumption, however, because congressional parties can vary in ideol-ogy over time, and the ideological distance between presidents and thecongressional parties also varies. I will deal with these complications later.
Bill-Specific Data
I have created a data set in which the case is the individual bill passed byCongress, and the dependent variable is whether the bill was vetoed or signed.The superiority of bill-level data has probably been apparent to previous vetoresearchers, but the difficulty of assembling the data was discouraging. Stud-ies based on aggregate data have a partially offsetting advantage of allowingthe researcher to incorporate a larger number of congresses in a study withease. Most veto researchers use data from the entire postwar period (Rohdeand Simon 1985, Shields and Huang 1995, 1997, Woolley 1991), and someuse a century or even the entire span of United States history (Hoff 1991, Lee1975).
I made a number of important decisions in the course of collecting data.First, I have collected data only from congresses in which one party controlledboth chambers of Congress and the other party controlled the White House.This is the purest condition of divided party government. I focused on dividedgovernment because unified governments produce fewer, less conflictual ve-toes. Woolley (1991) reports that, under unified government, major vetoes nearlydisappear. Vetoes are of interest mostly insofar as they provide evidence ofserious conflict between the executive and legislative branches. Vetoes of mi-nor bills, which predominate under unified governments, are not of great inter-est. Conclusions from this study pertain only to divided government.
Second, in selecting cases for this analysis, I employed a screen to excludethe more trivial bills passed by Congress. The criterion was to select only billsthat passed with at least 10% of either the House or Senate opposed to finalpassage. The vast majority of bills are not important (readers who doubt thisassertion should read through a list of the public laws enacted in a Congress)and are passed by Congress without a recorded vote in either chamber. Impor-tant legislation tends to generate at least a modest level of controversy, and thisbrings about a recorded vote.
Institutional and Individual Influences on the President’s Veto 203

PROOFS O
NLY
In all cases, I selected only votes that were votes on final passage, reflectingthe reaction of members to the bill actually presented to the president.3 Votesearlier in the legislative process can be misleading since bills change over thecourse of enactment. Provisions causing dissent during initial House passagemight have been removed in conference. I identified votes for final passage bymeans of legislative summaries in the Digest of General Public Bills, a congres-sional Research Service publication, and in THOMAS, the congressional Website (http:00thomas.loc.gov).
I have used eight and a half congresses for this analysis: the 92nd, 93rd,94th, 100th, 101st, 102nd, 104th, 105th, and the first session of the 106th. Allof them are characterized by split party control of Congress and the presidency.Prior to the 104th, Republican presidents faced congresses in which both cham-bers were controlled by Democrats. This was reversed beginning in the 104th.The 92nd through 94th congresses consist of the years 1971–76, when firstNixon and then Ford were president. The 101st Congress (1987–1988) encom-passed the final two years of Reagan’s presidency; this was the only time inReagan’s presidency when Democrats controlled both chambers of Congress.During the 101st Congress, 1989–1990, and 102nd, 1991–1992, Bush was pres-ident. The 104th, 105th, and 106th congresses (1995–2001), with Clinton aspresident, were the first since 1946–1948 in which a Democratic president faceda Republican Congress.
Selecting only bills that passed with a modestly contested final vote resultsin a surprisingly small number of bills in the data set. The vast majority of billsthat pass do so without a recorded vote, and many of those that do pass on arecorded vote pass with no votes opposed, or perhaps just a small handful op-posed. Most bills pass with no conflict in evidence on the vote for final pas-sage. As Table 1 shows, 541 out of the 4,867 bills passed in these congresses,about 11%, made it into the data set. Of the 191 vetoes in these seven con-gresses, 108—about 57%—made it into the data set. Leaving 43% of vetoesout of the data set may seem problematic. Cameron addresses this point well.He argues that “minor bills dominate summary counts of vetoes simply be-cause Congress passes so many minor bills. We care little about such vetoessimply because the bills are so unimportant, whether vetoed or not.” Further-more, he writes, “Any attempt to find patterns in vetoes will come to griefunless we sort the jewels from the gravel” (Cameron 2000, 37).
The great majority of vetoes screened out are unimportant bills, but there areinstances of important bills passing Congress on a voice vote only to be met bya presidential veto. To ensure that case selection does not bias the results, Iconducted a second “sweep” to pick up important vetoes that were excluded bythe criterion of a contested vote on final passage. To do so, I checked to seewhich excluded vetoes were significant enough to have an article written aboutthem in Congressional Quarterly Almanac. Twenty of the excluded vetoes were
3 See Mayhew’s justification for using votes for final passage (Mayhew 1991, 119–120).
204 John B. Gilmour

PROOFS O
NLYwritten up in CQ. Including them in the analysis does not change any of thesubstantive results.
Preliminary Results
A preliminary examination of the data yields some interesting observations.Some congresses pass more provocative legislation than others. Bills that passover the strong opposition of the president’s party in Congress are very likelyto be vetoed. Table 2 records bills by the level of minority party opposition in
TABLE 1
Comparison of All Bills and Vetoes to Those in Data Set
Bills Passing Congress Vetoes
Congress Total In Data Set Total In Data Set
92 625 52 20 693 684 98 39 1494 617 113 37 24100 729 59 19 8101 671 58 21 14102 615 56 25 14104 350 49 17 16105 401 36 8 7106 175 20 5 5
Total 4,867 541 (11%) 191 108 (57%)
TABLE 2
Level of Minority Opposition by Congress and Chamber
House Senate
0–49% 50%–100% 0–49% 50%–100%
92 42 10 50 293 82 16 91 794 79 34 100 13100 34 25 49 10101 40 18 52 6102 33 23 49 7104 22 27 27 22105 27 9 31 5106 14 6 16 4
TOTAL 373 168 465 76
Institutional and Individual Influences on the President’s Veto 205

PROOFS O
NLY
the House and Senate on votes for final passage. Notice that there are morethan twice as many instances in the House than in the Senate of a majority ofthe minority party opposing a bill. This does not mean that the House passesmore partisan legislation—after all, the House and the Senate must approveidentical bills. The table shows that the minority party in the House respondsmore negatively to identical legislation than the minority in the Senate. Alsonotice the sharp discrepancies among congresses in the passage of provocativelegislation.
There is a strong relationship between the congressional voting variables andpresidential vetoes. Table 3 shows the relationship between the level of opposi-tion from the president’s party to a bill on final passage and the president’saction on receiving the bill. For both the House and the Senate, bills passedwith two-thirds of the minority party opposed are vetoed at a high rate. TheSenate minority votes against bills less often, but Senate votes appear to be amore reliable predictor of presidential action.
A Logistic Regression Model of Presidential Vetoes
The purpose of the following logistic regression model is to simulate thepresidential decision process, so the equation includes an array of factors thatmight plausibly provide useful information to the president or otherwise influ-ence the president’s decision. It estimates the second stage of the Rohde-Simon veto model, testing the relationship between the enactment of objectionablelegislation and other factors and presidential vetoes. More broadly, the modelpermits a test of two partially competing hypotheses—one representingpresidency-centered explanations and the other representing president-centered explanations.
Hypothesis 1 (presidency-centered): Presidential veto behavior is deter-mined by institutional factors beyond the control of the president.
TABLE 3
Minority Opposition and Veto Probability
House Senate
Pct. Opposed Number % Vetoed Number % Vetoed
67% and up 82 57% 40 90%50%–66% 86 29% 36 47%33%–49% 106 8% 37 30%Below 33% 267 10% 28 10%
206 John B. Gilmour
PROOFS O
NLY
Hypothesis 2 (president-centered): Presidential veto behavior is determinedby factors unique to individual presidents.
The model incorporates a variety of variables that can lend support to onehypothesis or the other. The presidency-centered variables are four variablesmeasuring party voting in Congress, two variables related to the election cycle,presidential popularity, the unemployment rate, and veto-proof passage by Con-gress. The president-centered variables are dummy variables for individualpresidents.
The dependent variable is whether or not a bill was vetoed—coded 1 forvetoed and 0 for not vetoed. No distinction is made between pocket vetoes andordinary vetoes. The president typically reserves the pocket veto for minor leg-islation, and consequently few of the vetoes in the data set are of the pocketvariety.
Presidency-Centered (or Institutional) Variables
(1) Senate minority opposition. This should take a positive sign since the higherthe president’s party opposition, the more likely the president will alsodislike the bill and veto it. This and the next three variables are all codedas the percentage of party members opposing the bill, with values rangingfrom 0 to 100%. If there was no vote in one chamber, or opposition wasless than 10%, the level of party opposition is coded as zero. These vari-ables measure congressional provocation or its absence and thus are goodtests of the presidency-centered thesis. These are clearly institutional fac-tors beyond the control of the president.
(2) House minority opposition. This should also take a positive sign, withvalues ranging from 0 to 100%.
(3) Senate majority opposition. This should take a negative sign since thehigher the other party opposition, the less likely the president will be toveto. In other words, a bill that divides the other party cannot be all bad.
(4) House majority opposition. This should also take a negative sign.(5) President’s popularity. This is measured as percentage approving of pres-
idential performance minus the percentage disapproving, aggregated on aquarterly basis. This should have a positive sign since the more popular apresident is, the more confident he will be in standing up to Congresswhen it passes bills he does not like. This is also considered a test ofHypothesis 1 since a president’s popularity is beyond his control (he can-not choose to be more popular). I include presidential approval as an in-stitutional variable because it is largely, although not entirely, beyond thecontrol of the president. Presidents have some ability to manipulate pub-lic opinion, as Brace and Hinckley (1993) argue, but they cannot chooseto be popular. If they could, all presidents would be popular all the time.
(6) Presidential and midterm election variables. The presidential election vari-able is coded 1 for bills signed or vetoed in a presidential election year.
Institutional and Individual Influences on the President’s Veto 207
PROOFS O
NLY
The midterm election variable is coded 1 for bills signed or vetoed in amidterm election year. Previous studies have included these variables, withmixed results. Plausible arguments can be made that vetoes should beboth more and less likely in these years. Perhaps presidents will be moreinclined to stand up to Congress when there is an election. They may alsobe more inclined to sign marginally acceptable legislation in the electionyear, knowing that there may not be another chance to pass a bill in thatparticular Congress. Regardless, these are institutional influences on apresident’s decision making, and thus help to test Hypothesis 1.
(7) Veto proof margin. It seems very likely that the probability that Congresswould override a veto should influence the president’s veto decision. If abill passes with at least two-thirds voting in favor in both the House andSenate, it is “veto-proof.” A president who wishes to avoid being overrid-den might well shy away from vetoing such bills, even when he dislikesthem. Veto-proof bills are coded 1 and all others are coded 0. We canexpect that this variable will have a negative sign, meaning that presidentsare reluctant to use the veto when it is likely to be overridden. Again, thistests Hypothesis 1 since this is an influence on the president’s decisionthat is outside his control.
(8) Unemployment rate. It is likely that the president’s political standing willinfluence use of the veto, and the state of the economy, especially un-employment, is an important contributor to the president’s political stand-ing, or lack of it. The national unemployment rate is correlated withpresidential popularity at a surprisingly low 2.123. This variable shouldtake a negative coefficient since higher unemployment is likely to reducethe probability of a veto.
(9) Subject to pocket veto. Presidents may be more likely to veto bills if theycan use the pocket veto and thus avoid any possibility of a congressionaloverride. This variable is scored 1 for bills passed in the last ten days of acongress and thus subject to a pocket veto. All others are scored zero.
President-Centered (or Individual) Variables
(10) Presidential dummy variables. Dummy variables are included for Presi-dents Ford, Reagan, Bush, and Clinton. No variable is included for Nixon,who is the omitted class. The “Ford” variable is coded 1 for bills signedor vetoed by Ford, and 0 otherwise. The “Reagan” variable is coded 1 forbills signed or vetoed by Reagan, and 0 otherwise, and so on for Bush andClinton. These variables are intended to capture each president’s propen-sity to veto—in essence, their personal or idiosyncratic approach to exer-cising the veto. As such, they test the president-centered hypothesis. Thelogic of the analysis is that if these variables are statistically and substan-tively significant, then institutional factors are not by themselves account-ing for presidential veto behavior and that the presidents exhibit distinctively
208 John B. Gilmour

PROOFS O
NLY
different patterns in their use of the veto. The difficulties of interpretingthese variables will be discussed in a later section. In alternative specifi-cations of the model, I substituted all the presidents in turn as the omittedcategory.
Other
(11) President’s position. Whether or not the president was in favor of a billprior to its passage is obviously an extremely important factor in explain-ing vetoes, but it does not seem to bear on either hypothesis. Data onpresidential positions were collected from Congressional Quarterly. If thepresident took a position in favor of a bill, the variable is coded 1. If thepresident opposed the bill, it is coded 21. If the president took no posi-tion, it is coded 0. This should take a negative sign since, obviously, whenthe president favors a bill he is less likely to veto. The president opposed103 bills, favored 81, and took no position on the rest.
Descriptive statistics for the independent variables in the model are dis-played in Table 4.
Results
I estimated three logistic regression models. The results are displayed in Table 5.Table 6 reports marginal effects on veto probability of changes in the values of
TABLE 4
Descriptive Statistics for Independent Variables
Continuous Variables Mean Min. Max. Std. Dev.
Senate Minority Opposition 16.4 0 100.0 26.0House Minority Opposition 36.4 0 100.0 26.2Senate Majority Opposition 6.4 0 80.0 12.7House Majority Opposition 14.6 0 80.2 13.5Presidential Approval 11.5 241 65.4 21.3Unemployment Rate 6.2 4.1 8.8 1.2
Ordinal Variables n 5 1 n 5 0 n 5 21President’s Position 81 357 103Presidential Election 190 351Midterm Election 109 432Veto-Proof Majority 374 167Nixon 103 438Ford 160 381Reagan 59 482Bush 114 427Clinton 105 436
Institutional and Individual Influences on the President’s Veto 209

PROOFS O
NLY
the independent variables, with the other variables held constant. It allows for amore meaningful comparison of the importance of different independent variables.
Model 1 includes institutional and individual variables and classifies 90.6%of cases correctly, assuming that the predicted probability of a veto for an in-dividual bill above .5 is classed as a veto and lower probabilities are not vetoes.Model 2 is the same as Model 1 except that the variables for individual presi-dents are divided into multiple time periods. Model 3 presents a baseline insti-tutional model that excludes the presidential variables. All three models classifyat least 90.2% of cases correctly.
TABLE 5
Logistic Regression Estimates of Veto Models
VariableModel 1
COEFF. (T-STAT)Model 2
COEFF. (T-STAT)Model 3
COEFF. (T-STAT)
Constant 1.352 (0.91) 6.036 (1.56) 24.623 (24.13)Senate Minority Opposition 0.038 (4.22) 0.037 (4.11) 0.031 (4.26)House Minority Opposition 0.027 (3.38) 0.026 (3.25) 0.018 (2.44)Senate Majority Opposition 20.036 (21.38) 20.033 (21.26) 20.033 (21.49)House Majority Opposition 20.077 (23.35) 20.084 (23.50) 20.052 (22.74)President’s Position 22.856 (26.83) 23.147 (26.58) 22.218 (26.95)Presidential Approval 0.011 (1.22) 0.007 (0.41) 0.004 (0.50)Presidential Election 20.048 (20.11) 1.014 (1.28) 20.315 (20.81)Midterm Election 21.318 (22.29) 21.239 (21.49) 20.035 (20.74)Veto Proof Majority 21.309 (22.68) 21.360 (22.67) 20.949 (22.07)Unemployment Rate 20.597 (22.37) 21.331 (22.05) 0.452 (2.97)Subject to Pocket Veto 20.420 (20.89) 20.417 (0.83) 20.497 (1.10)Ford 2.759 (3.39) — —Reagan 22.126 (22.62) — —Bush 0.598 (0.80) — —Clinton 21.890 (22.36) — —93rd Cong., 1st sess. (Nixon) — 23.175 (21.76) —93rd Cong., 2nd sess. (Nixon) — 26.193 (20.31) —93rd Cong., 2nd sess. (Ford) — 2.854 (2.23) —94th Cong., 1st sess. (Ford) — 4.773 (2.42) —94th Cong., 2nd sess. (Ford) — 2.302 (1.55) —100th Cong., 1st sess. (Reagan) — 22.306 (21.98) —100th Cong., 2nd sess. (Reagan) — 23.992 (23.81) —101st Cong. (Bush) — 0.070 (0.07) —102nd Cong. (Bush) — 0.558 (0.41) —104th Cong. (Clinton) — 22.939 (23.08) —105th Cong. (Clinton) — 23.219 (22.03) —106th Cong., 1st sess. (Clinton) — 23.307 (21.94) —Number of cases 541 541 541Chi Squared 298.440 311.453 256.046Cases categorized correctly 90.6% 91.1% 90.2%22 log likelihood 242.440 229.428 284.835
210 John B. Gilmour
PROOFS O
NLY
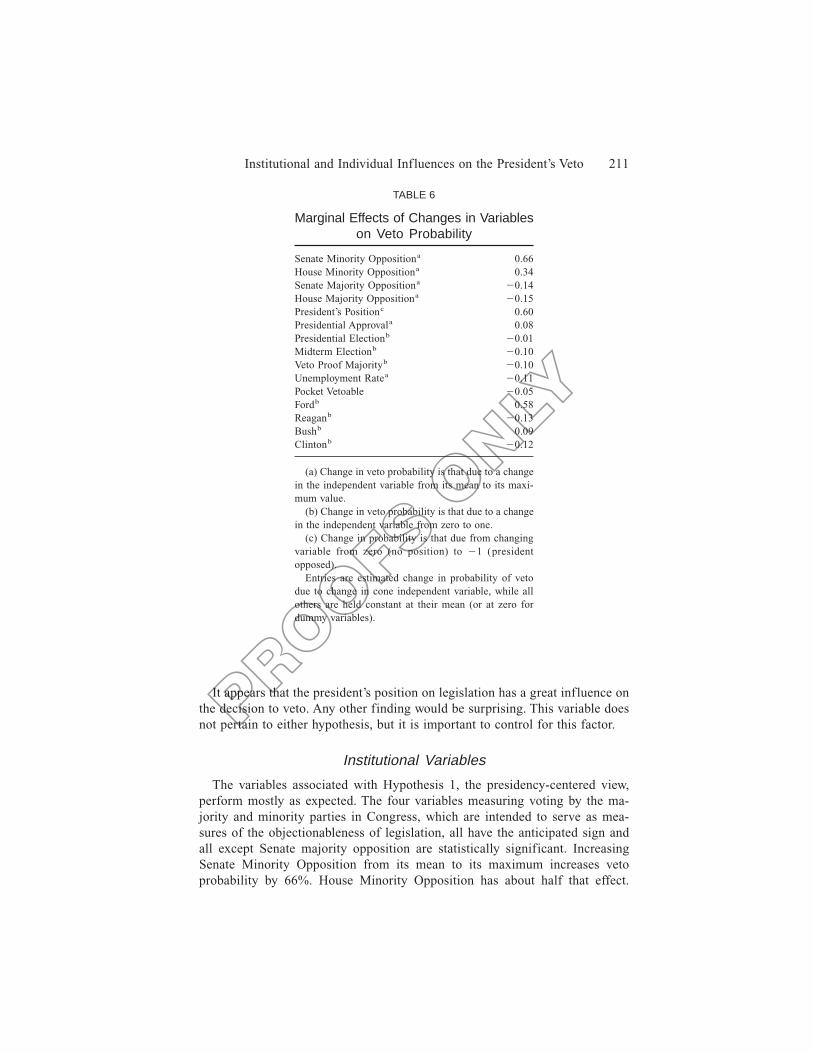
It appears that the president’s position on legislation has a great influence onthe decision to veto. Any other finding would be surprising. This variable doesnot pertain to either hypothesis, but it is important to control for this factor.
Institutional Variables
The variables associated with Hypothesis 1, the presidency-centered view,perform mostly as expected. The four variables measuring voting by the ma-jority and minority parties in Congress, which are intended to serve as mea-sures of the objectionableness of legislation, all have the anticipated sign andall except Senate majority opposition are statistically significant. IncreasingSenate Minority Opposition from its mean to its maximum increases vetoprobability by 66%. House Minority Opposition has about half that effect.
TABLE 6
Marginal Effects of Changes in Variableson Veto Probability
Senate Minority Oppositiona 0.66House Minority Oppositiona 0.34Senate Majority Oppositiona 20.14House Majority Oppositiona 20.15President’s Positionc 0.60Presidential Approvala 0.08Presidential Electionb 20.01Midterm Electionb 20.10Veto Proof Majorityb 20.10Unemployment Ratea 20.11Pocket Vetoable 20.05Fordb 0.58Reaganb 20.13Bushb 0.09Clintonb 20.12
(a) Change in veto probability is that due to a changein the independent variable from its mean to its maxi-mum value.
(b) Change in veto probability is that due to a changein the independent variable from zero to one.
(c) Change in probability is that due from changingvariable from zero (no position) to 21 (presidentopposed).
Entries are estimated change in probability of vetodue to change in cone independent variable, while allothers are held constant at their mean (or at zero fordummy variables).
Institutional and Individual Influences on the President’s Veto 211

PROOFS O
NLY
Marginal effects of the majority opposition variables are much smaller. To asubstantial degree, presidential vetoes are a direct and predictable conse-quence of congressional behavior and of the kind of legislation Congress passes.When Congress passes bills in spite of strong opposition by the president’sparty, they are frequently vetoed. This finding, suggesting that presidentialbehavior is determined by external forces, strongly supports “presidency-centered” explanations.
The results for the midterm election and unemployment variables shed lighton the president’s decision to use the veto in a way that aggregate studies can-not. Previous studies (Rohde and Simon 1985; Shields and Huang 1995, 1997)found that vetoes are more common in midterm election years. That is, thenumber of vetoes rises. According to Table 6, the probability that the presidentwill veto a bill declines about 10% in midterm election years. This finding issomewhat counterintuitive, but nonetheless consistent with the idea that thenumber of vetoes rises in midterm years. Vetoes become more common be-cause Congress is passing more objectionable legislation close to the election.But holding constant the objectionableness of the legislation, presidents areless likely to use the veto in a midterm election year. This makes sense giventhe expectation that the president’s party will lose seats in Congress in themidterm election. The president will probably have a Congress that is harder towork with after the election, so he cannot expect to veto a marginally unsatis-factory bill and hope to do better with the new Congress.
Previous studies have found that higher levels of unemployment are associ-ated with greater numbers of vetoes. My research shows that when the level ofunemployment is higher, the president is less likely to use the veto. These find-ings are not contradictory. When the level of unemployment rises, Congressmay feel emboldened to challenge the president and pass more objectionablelegislation, which results in more vetoes. But the president, feeling his positionweaker, may be reluctant to veto moderately offensive legislation and may savethe veto for only the worst bills. The probability of the president vetoing anyparticular bill declines, but, given the quantity of offensive legislation beingpassed, the number of vetoes still rises.
The variable for veto-proof margin indicates that presidents are not inclinedto veto legislation when an override is likely. A bill with a veto-proof majorityis about 10% less likely to be vetoed than one without, all else being equal.This is consistent with presidency-centered explanations: presidents are unitedby an underlying institutional logic in not vetoing when an override is likely.
The variable for presidential popularity has the anticipated positive sign, sug-gesting that a more popular president may be more willing to exercise the veto.But with a t-statistic of 1.2 we cannot have much confidence in this finding.
In all, the model provides strong support for Hypothesis 1. These results areconsistent with previous studies of the veto, such as Rohde and Simon (1985)and Woolley (1991), which have emphasized institutional factors and disre-garded individual presidential choice and discretion.
212 John B. Gilmour
PROOFS O
NLY
Individual Presidential Variables
Hypothesis 2 also finds strong support. Three out of the four presidentialvariables in Model 1 have statistically significant coefficients. Further, the chi-square test comparing Model 1 with Model 3 leaves no doubt that the president-centered variables enhance the model’s ability to explain vetoes (chi-square 542 with four degrees of freedom; p , .001).
The individual presidential dummy variables have strikingly different coeffi-cients, supporting the notion that presidents have differing propensities to veto.That is, controlling for the objectionableness of legislation and other institu-tional factors, these presidents exhibit distinctive veto behavior compared toNixon, the omitted category. Ford has a very high propensity to veto. HavingFord as president increases the veto probability by a large amount—58%. Re-agan and Clinton have low propensities to veto, reducing veto probability by13% and 12%, respectively. Bush and Nixon are in between. The coefficientsfor Ford, Reagan, and Clinton are highly statistically significant ( p , .01),meaning that their propensities to veto are statistically distinguishable fromNixon’s. Bush, with an intermediate propensity to veto, is not statistically dis-tinguishable from Nixon.
I also estimated the model using each president in turn as the omitted class.As the model is reported in Table 5, Ford, Reagan, Bush, and Clinton can becompared to Nixon, but not directly with each other. The additional model spec-ifications allow all possible comparisons among presidents to be made. For rea-sons of space, I do not report those models here, but the results can be easilysummarized. Reagan and Clinton, with low veto propensities, are statisticallydistinguishable from all presidents except each other. Bush and Nixon, withintermediate veto propensities, are statistically distinguishable from all presi-dents except each other. Ford is statistically distinguishable from all the others.
Interpreting the individual president dummy variables requires some cautionand explanation. My intention is to use them as measures of each president’sunique “propensity to veto.” The problem with such dummy variables is that inaddition to the president’s propensity to veto, they capture circumstances andevents correlated with a particular administration that are not otherwise repre-sented in the equation. To minimize the possibility that other unexplained vari-ance is being conflated with propensity to veto, I estimated Model 2, in whicheach presidency is split into at least two time periods. A presidential propensityto veto, if it exists, is likely to be relatively stable over time, but other un-explained variance that might contribute to vetoes is less likely to be stableover time. Thus, if dummy variables for the 104th, 105th, and 106th congresseshave similar coefficients, that would increase our confidence that the Clintonvariable is actually measuring propensity to veto rather than some other un-related factor.
The discrete time-period variables in Model 2 are consistent with the corre-sponding presidential dummy variables in Model 1. The three variables for the
Institutional and Individual Influences on the President’s Veto 213
PROOFS O
NLY
Clinton congresses have similar coefficients (22.939, 23.219, and 23.307).The two Bush variables, for the 101st and 102nd congresses, are likewise close(0.070 and 0.558). The two Reagan variables, 100th Congress, 1st and 2ndsessions, vary somewhat (22.306 and 23.392), but in both sessions there wasa decided tendency against vetoing. The Ford variables, like Reagan’s, varysomewhat, but all indicate a tendency to make active use of the veto. The com-parability of the discrete time-period variables lends substantial support to theinterpretation of the presidential dummy variables as indicators of presidentialpropensity to veto.
A possible alternative explanation for the strong observed importance of in-dividual presidents is the ideological distance of presidents from Congress. Apresident who is especially conservative and ideologically distant from Con-gress might find the bills emerging from Congress more distasteful than a moremoderate president and hence veto more. This increased rate of vetoes wouldbe explained by the objectionableness of the legislation and not reflect a higherpropensity to veto. On closer examination, ideological distance turns out to beof no use in explaining vetoes.4
To consider the possibility that the results are somehow determined by themanner of selecting cases, I reestimated the model using a slightly enlargeddata set. The enhanced data set included all of the original 541 cases plus anadditional 20 cases that consist of nontrivial vetoed bills that were not initiallyselected because they passed without a contested vote. The results from theenlarged data set are virtually identical to the results reported in Model 1 inTable 5.
Comparing Presidential Veto Behavior
The coefficients on the presidential dummy variables in Table 5 and the prob-abilities in Table 6 give some idea of the differences among presidents in their
4For each of the presidents I created a measure of ideological distance using NOMINATE scores.NOMINATE estimates the position of the president based on the president’s stated positions onlegislation. The presidential scores tend to bounce around a lot from year to year since they arebased on relatively few observations. Thus, I averaged the presidential scores for the entire periodunder study and calculated the distance between the president’s average and the filibuster pivot ofthe Senate. The distances were: Nixon, .593; Ford, .523; Reagan, .892; Bush, .533; and Clinton,.313. In all cases, the Republican presidents are to the right of the filibuster pivot and the Demo-crat is to the left of the filibuster pivot. I defined filibuster pivot as the 40th closest senator to thepresident. NOMINATE scores are made available to the scholarly community by Keith Poole at hisWeb site, http:00voteview.uh.edu0.
One would expect that all else equal, presidents who are more ideologically distant from Con-gress should veto more, and thus the variable should take a positive sign. Substituting the ideolog-ical distance variable for the presidential dummy variables, the distance variable had a strong negativecoefficient that was statistically significant, the opposite of what one would expect. This is a spu-rious result, an artifact of Reagan being the president least likely to veto but also the most ideolog-ically extreme and Ford being the president most likely to veto but also ideologically moderate.
214 John B. Gilmour
PROOFS O
NLY
propensity to use the veto, but they reduce complex presidential strategies to asingle number. The following exercise is designed to make comparisons amongthe presidents more transparent.
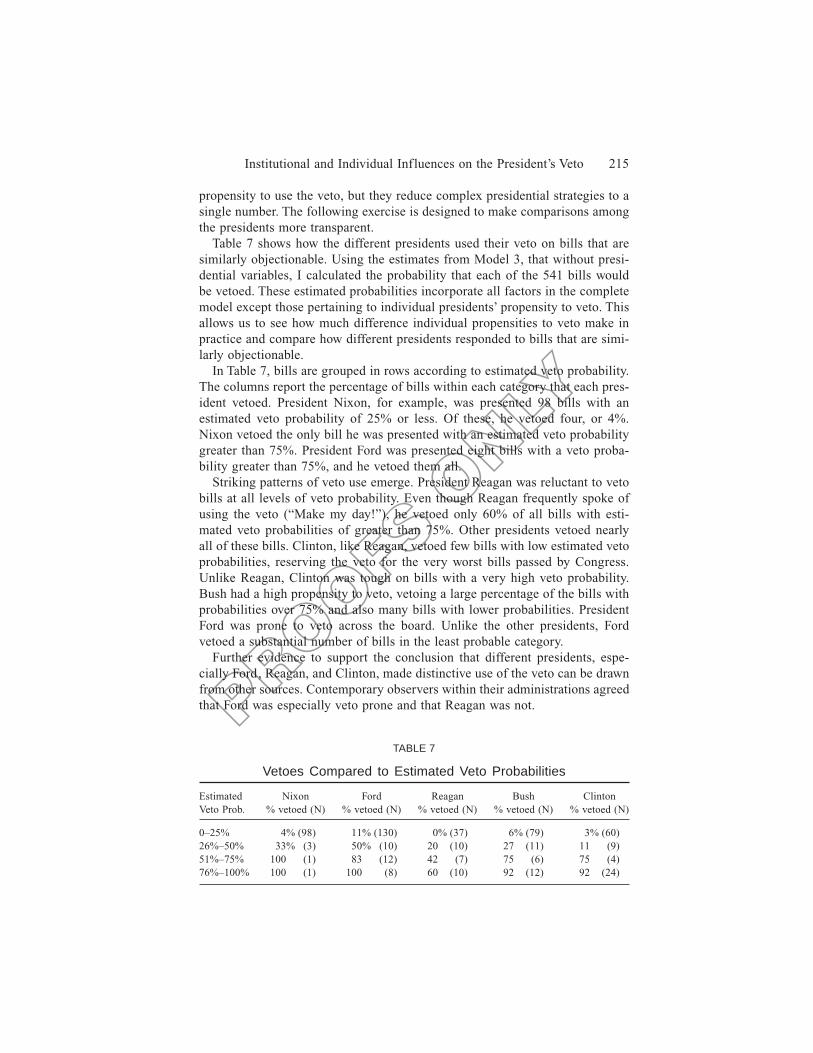
Table 7 shows how the different presidents used their veto on bills that aresimilarly objectionable. Using the estimates from Model 3, that without presi-dential variables, I calculated the probability that each of the 541 bills wouldbe vetoed. These estimated probabilities incorporate all factors in the completemodel except those pertaining to individual presidents’ propensity to veto. Thisallows us to see how much difference individual propensities to veto make inpractice and compare how different presidents responded to bills that are simi-larly objectionable.
In Table 7, bills are grouped in rows according to estimated veto probability.The columns report the percentage of bills within each category that each pres-ident vetoed. President Nixon, for example, was presented 98 bills with anestimated veto probability of 25% or less. Of these, he vetoed four, or 4%.Nixon vetoed the only bill he was presented with an estimated veto probabilitygreater than 75%. President Ford was presented eight bills with a veto proba-bility greater than 75%, and he vetoed them all.
Striking patterns of veto use emerge. President Reagan was reluctant to vetobills at all levels of veto probability. Even though Reagan frequently spoke ofusing the veto (“Make my day!”), he vetoed only 60% of all bills with esti-mated veto probabilities of greater than 75%. Other presidents vetoed nearlyall of these bills. Clinton, like Reagan, vetoed few bills with low estimated vetoprobabilities, reserving the veto for the very worst bills passed by Congress.Unlike Reagan, Clinton was tough on bills with a very high veto probability.Bush had a high propensity to veto, vetoing a large percentage of the bills withprobabilities over 75% and also many bills with lower probabilities. PresidentFord was prone to veto across the board. Unlike the other presidents, Fordvetoed a substantial number of bills in the least probable category.
Further evidence to support the conclusion that different presidents, espe-cially Ford, Reagan, and Clinton, made distinctive use of the veto can be drawnfrom other sources. Contemporary observers within their administrations agreedthat Ford was especially veto prone and that Reagan was not.
TABLE 7
Vetoes Compared to Estimated Veto Probabilities
EstimatedVeto Prob.
Nixon% vetoed (N)
Ford% vetoed (N)
Reagan% vetoed (N)
Bush% vetoed (N)
Clinton% vetoed (N)
0–25% 4% (98) 11% (130) 0% (37) 6% (79) 3% (60)26%–50% 33% (3) 50% (10) 20 (10) 27 (11) 11 (9)51%–75% 100 (1) 83 (12) 42 (7) 75 (6) 75 (4)76%–100% 100 (1) 100 (8) 60 (10) 92 (12) 92 (24)
Institutional and Individual Influences on the President’s Veto 215
PROOFS O
NLY
In his memoir, David Stockman expressed his disappointment that Reaganfailed to back up his repeated insistence that he would use the veto to blockoverly expensive appropriations bills (Stockman 1986, 371–73). Kenneth E.Collier supports Stockman’s understanding: “Ronald Reagan developed a repu-tation on the Hill for threatening vetoes but failing to follow through on histhreats. Reagan would sometimes talk at length about his ‘veto pen,’ but mem-bers of Congress paid less attention to his very visible threats and consideredthem more for public consumption” (Collier 1997, 241). Many observers havenoted that President Ford adopted a self-conscious “veto strategy” as a meansof dealing with an overwhelmingly Democratic and aggressive Congress (Light1991, Reichley 1981, Spitzer 1988). Spitzer contends that “Ford was the onlytwentieth century president to design and pursue a calculated veto strategy”(Spitzer 1988, 85).
Perhaps the most impressive supporting evidence of Clinton’s approach tousing the veto is the fact that in his first two years, working with a DemocraticCongress, he did not veto even once. Not since the 32nd Congress in the 1850s,with Millard Fillmore in the White House, had a president failed to use theveto for an entire Congress.
Conclusion
This article seeks to map out in an empirically rigorous manner importantinteractions between Congress and the president with respect to the veto. Bothhypotheses are strongly supported. Institutional factors such as congressionalprovocation are the most important determinants of veto behavior. However,the strongest version of the presidency-centered thesis, that presidents behavesimilarly in similar contexts, is not correct. Different presidents in fact behavedifferently even in similar contexts because they have unique propensities toveto.
The logic of the scientific study of politics is to discover underlying, system-atic causes of apparently random or chaotic behavior. From the standpoint ofthe scientific study of politics, we would normally prefer to develop explana-tions that rest on universal or institutional factors rather than individual ones.In this research, the individual and particular explanations refuse to yield to thegeneral. This is an important finding, although possibly frustrating for scholarsintent on discovering the hidden order of the political realm and avoiding reli-ance on ad hoc explanations. It is probably true that Moe (1993) is correct thatthe study of institutional factors holds more promise for propelling theoreticaladvances in our understanding of the presidency. But uncovering and identify-ing the individual peculiarities of presidents is vital in any effort to developmore powerful theoretical and institutional explanations of presidential behavior.
This article ventures no explanation of why presidents exercise the veto asthey do, but this is clearly an interesting and important topic. This article alsoleaves aside the questions of what impact presidential veto practices might have
216 John B. Gilmour

PROOFS O
NLY
on Congress. Even in advance of additional research, it seems fair to concludethat with respect to the veto, presidents are not clerks. Institutions of the pres-idency and Congress influence presidential veto behavior, but they do not de-prive presidents of the opportunity to make their unique mark and to mold thepresidency in their own image.
Manuscript submitted 30 October 2000Final manuscript received 3 May 2001
References
Brace, Paul, and Barbara Hinckley. 1993. “Presidential Activities from Truman through Reagan:Timing and Impact.” Journal of Politics 55(2): 382–98.
Cameron, Charles M. 2000. Veto Bargaining: Presidents and the Politics of Negative Power. Cam-bridge: Cambridge University Press.
Collier, Kenneth E. 1997. Between the Branches: The White House Office of Legislative Affairs.Pittsburgh: University of Pittsburgh Press.
Gilmour, John B. 1995. Strategic Disagreement: Stalemate in American Politics. Pittsburgh: Uni-versity of Pittsburgh Press.
Groseclose, Tim, and Nolan McCarty. 2001. “The Politics of Blame: Bargaining before an Audi-ence.” American Journal of Political Science 45(January): 100–19.
Hager, Gregory, and Terry Sullivan. 1994. “President-Centered and Presidency-Centered Explana-tions of Presidential Public Activity.” American Journal of Political Science 38: 1079-
Hoff, Samuel. 1991. “Saying No: Presidential Support and Veto Use, 1889–1989.” American Poli-tics Quarterly 19(3): 310–23.
Lee, Jong R. 1975. “Presidential Vetoes from Washington to Nixon.” Journal of Politics 37(3):522–46.
Light, Paul C. 1991. The President’s Agenda: Domestic Policy Choice from Kennedy to Reagan.Rev. ed. Baltimore: John’s Hopkins University Press.
Mayhew, David R. 1991. Divided We Govern: Party Control, Lawmaking, and Investigation, 1946–1990. New Haven: Yale University Press.
McCarty, Nolan, and Keith Poole. 1995. “Veto Power and Legislation: An Empirical Analysis ofExecutive and Legislative Bargaining from 1961 to 1986.” Journal of Law, Economics andOrganization 11(2): 282–312.
Moe, Terry. 1993. “Presidents, Institutions, and Theories.” In Researching the Presidency: VitalQuestions, New Approaches, ed. George Edwards, John Kessel, and Bert Rockman. Pittsburgh:University of Pittsburgh Press.
Neustadt, Richard. 1960. Presidential Power. New York: Wiley.Reichley, A. James. 1981. Conservative in an Age of Change: The Nixon and Ford Administrations.
Washington, DC: Brookings Institution Press.Rohde, David, and Dennis Simon. 1985. “Presidential Vetoes and Congressional Response.” Amer-
ican Journal of Political Science 29(2): 397–427.Shields, Todd, and Chi Huang. 1995. “Presidential Vetoes: An Event Count Model.” Political Re-
search Quarterly 48(3): 559–72.Shields, Todd, and Chi Huang. 1997. “Executive Vetoes: Testing Presidency-Versus President-
Centered Perspectives of Presidential Behavior.” American Politics Quarterly 25(4): 431–57.Spitzer, Robert J. 1988. The Presidential Veto: Touchstone of the American Presidency. Albany:
State University of New York Press.Simonton, Dean Keith. 1987. “Presidential Inf lexibility and Veto Behavior: Two Individual-
Situational Interactions.” Journal of Personality 55(1): 1–18.
Institutional and Individual Influences on the President’s Veto 217
PROOFS O
NLY
Stockman, David. 1986. The Triumph of Politics: How the Reagan Revolution Failed. New York:Harper & Row.
Woolley, John T. 1991. “Institutions, the Election Cycle, and the Presidential Veto.” AmericanJournal of Political Science 35(2): 279–304.
John B. Gilmour is associate professor of government at the College ofWilliam & Mary, Williamsburg, VA 23187.
218 John B. Gilmour