Embed Size (px)
Citation preview
,4*
DOCUMENT RESUME,
ED 1BB 07B CG 014 475
ADTMOR Paez, A4olfo .1., Ed.
TITLE San Diego: Public Attitudes About Crime. A NationalCrime Survey Report.
INSTITUTION Bureau of tilt) Censur (Dor), Suitland, Md.MNS AGENCY National Crijninal Justicc Information and Statistics
Service (Dept. of Justice/LEAA) , Washington, B.C.4FEPORT NO NCJ-46245: SD-NCS-C-30:-A)OB DATE (77.)
NOTE 71p.AVAILABLE FRCM Superintendent of Documents, U.S. Govelnment Printing
Office, Washirgton, DC 20402.
E BBS PRICEDESCRIPTCPS
IDENTIFIFFS
MF01/Pc03 Plus Postage.Adults; Attitude'Measures: *Community Attitudes:Community Surveys: *Crime: *Fear; Law Enforcement.;National Surveys: News Media: PoliCe Action: *PublicOpinion: Research Projects: *Security (Psychology)*California (San Diego): *Victims
ABSTRACTThe National Crime Survey'program has conducted a
continucus national survey and separate surveys in 26 central citiesto study the impaC't of crime on American society. Attitudinalinformation ,cbtained from a 1974 survey of occupants of 4,1906 houdoIngunits (9,125 residents age 16 aril over) in San Diego reflects crimetrends, fear et crime, residential problems, and local policeperfcrmance. Although -75% of San Diego residents felt crime wasincreasing,nationally, crime-and fear 'et crime made no impact on .
their daily Toutines. Most residents.felt reasonably safe-alone intheir neightcrhooas at night, 'with whites feeling.more secure thanblacks. Crime was not a Major influence in moving, shopping cr -
'entertainment activities:- 'Whites wtre more poSitive in their.assessmente ef police 'performance than were blacks. Feat of crime had -
a greater impact en. women,hthe elderly, and formdr victims. Iheappendices centain 37 data tables,-the survey questionnaire, andinformation cn sample design and size, estimaticn procedutes,-estimated reliabilities, and 'standard ertor7. (013)
*********************************************************************** Reproductions supplied by RIDES are the best that can be made *
.from the original document. *
10110101*490**4!******************************************************t******* J
N- San Diego:g' PublicOD
attitudesaboutcrime
A National Crime Survey report
4.4
L
S DEPARTMENT OF HEAL TH.EDUCATION &WELFARENATIOZADLINASIIOTITNUTE OF
I t4IS OOLUME N I HAS BE( N ft PRODUCEO E XAC1L 'V As RECEIVUD FROAATHE PERSON OR OROANITATIONORIGIN-AIING :I POINIS OF \NEW OR OPINIONSSTAI EU DO NOT NECESSARILY REPRESENT OFFICIAL NATIONAL INSTITUTE orroticATION POSI1FON OR POII(Y
U.S. DEPARTMENT OF JUSTICE
Law EnforcementAssistance Administration
National Criminal Justice Informationand Statistics Seiwice
.0-,
National Criminal Justice informationand Statistics Service Reports
Single copies are evaltable at no charge from the National CriminalJodie Reference Servioe, Boa 8000, Rockvilie, Md. 20860. Multiplecopies are for sale by the Supednlandeni of Documents, U.S.Government Printing Office, Webbing ton, D.C. 20402.
National Crime Survey of victimization:Criminal Victimisation in the United Slides (annual)
Summary Findings ol 1977-70 Changes in Crime-and Of 1rondsFonce .913. NCJ 81368
A Dem option of T lends bum 1973 to 1971 NCJ 598981971 (final lepor1), NCJ 58125
UnlPa
rm Parole Report's: 7ole In th United SIM.. 10711 NC,1 S8772
1916 nnd 197 P NC.1-49/0";
ChII4rsn In CustodyJti (mile Detention and Col r or-Lionel I ai-dily
1 11 advance levantCensus of Public Juvenile Facilities NCJ 60967
i7C5eonisnuasl ju-vSofin1/31e9 Facilities. NC./ 60968
1 74 NCJ-579461913, NCJ-'44/771W 1, NCJ- 13403
Myths 1pnd Realities About Crime. A Noinin rine al Presentalion in!,,elei toil Infoininlinn hum the Nnhonal 1,1130n1ml Slalislit J
Tlik
Intimate
Criminal
Criminal
Public
Criminal
Criminal
Crims
A4Splicationsand
Pblic
L.
The
AnCompensating
Crime
Rap.Criminal
NationalCapital
Prisoners
Census
Profile
Censuirof
Census
The
Survey
1916. NCJ-4954319/5. NCJ-445931914. NCJ-394671973, NCJ-34732
Cost of Nog ligenr: Losses from Preventable HouseholdBurglaries. NCJ-53927
Victim.: A Study of Violence Among 1-iiere1s andRelatives. NCJ-62319
Victimization Surveys InBoston. NCJ 34618 New Odeon., NCJ 34825Buffalo, NCJ-34620 Oakland, NCJ-34826CIncInnalt, NCJ-348I9 Pittsburgh. NCJ-34821Houston, NCJ-34621 San Diego, NCJ-34028Miami, NCJ-34822 San Francisco, NCJ-34829Milwaukee, NCJ34823 Washington, D.C. NCJ- 34830Minneapolis, NCJ-34624 (final report. 13 volis ) .
Victimization Surveys In 13 American CIO*. (summaryreport 1 vol ). NCJ 16471
Altitudes About Crime:Boston, NCJ 46235 N.* Orleans, NCJ-46242Buffalo, NCJ 46)6 OM lend, NCJ 4624.1Cincinnati, NC,2-48237 Pittsburgh. NCJ-46244Houston,'NCJ-46236 San Diego, NCJ 46245Miami, NCJ-46239 San Francisco, NCJ-46246Milwadkee, NCJ-46240 Washington, D.C. NCJ-46247Minneapolis. NCJ 46241 (final report. t3 vols 1
Victimization Surveys in Chicago, Detroit, Los Angeles.New York, and Philadelphia. A' Comparison uf 1912 and 1974
Findings. NCJ 36360Victimization Surveys in Eight American eines.
A Comparison of 1971:72 and 1974-75 findings NationalCrime Surveys in Atlanta. Balt, (more. Cleveland. Dallas. DenverNewark. Portland. and St Louis, NCJ-36361
and Victims: A Report on the Dayton-San Jose PilotSurvey of yictimization. NCJ-013314
of the National Crime Survey VictimizationAttitud Data:
Opinion About Crime: The Attitudes of Victims and Non-
victims in Selected Cities. NCJ -41336el Victim Surveys: A Review of the Issues. NCJ 39973Police and Public Opinion: An Analysis of Victimization and
Attitude Data from 13 American Cities. 44CJ-42016 r
Introduction to the National Crime Survey, NU-43732Victims of Violent Crime: Potential COsts and
Coverage Ole-National Program. NCJ-43367Against Persons In Urban, Suburban, and Rural Areas:
A Comparative Analysis of Victimization Rates. NCJ-53551
VIctimizetion In 26 American Cities NW 55878Victlinization In Urban Schools. NCJ-56396
Prisoner Statistics:Punishment (annual)
1978. NCJ-59$97 -
In sulti and Federal Institutions (annual)December 31. 1978, advance repOrt. NCJ-58324December 3.1, 1977.(finel report). NCJ-52701
Of Stat. Correctional Facilities, 1974 advance report.NCJ-25642
of State Prison Inmates: Sociodemographic Findings fromthe 1974 Survey of Inmates of State Correctional Facilities,NCJ-58251
Prisoners in State Correctional Foollities, 11173,NCJ-34729
of Jails and Survey of Jail Inmates, 1975, preliminaryrePOrt, NCJ-55172
Nalion's Jails: A report on the census 01 1.115 front the 1972
Survey 01 inmates of Local Jails, NCJ-19001 dl
of inmates oflocal Jeele, 1172, advance report, NCJ-13313'
l'umg ant end rho National col It, Smitvoy NCJ 46249
Stale Couri Model Statistical ()lc lonary. NCJ 62320
Stele C urt Caseload Statistics:The Sfpto of the Art, NCJ 46934Annus RepOrt. 1975, NCJ-51885Am lillial Report 1976. NCJ 56599
A Cross- fly Comparison ol.F.lony Case Processing. NCJ 55171
National prey ot Court Organization.1977 Spqpiement to Stale Judicial Systems NCJ 400221975 Supfleinent lo State Judicial Systems NCJ-29433071 (full vepor1). NCJ- 11427
1Stale and Local Probation end Parole Systems, NCJ41335.\
Stal and Lo.1 Phrsocution and Cleft Attorney Systeme, NCJ-41334
Trends in ExPenditure and Employment Date for the CriminalJustice System. 1971-77 (annual). NCJ-57463 .
Expenditure and Employment Date for the Criminal Justic System0101111/11)
1911) ariviinc 0 lepoit Ne.1 6 , -031977 tonal report NCJ-53206
Criminal Justice Agencles In Regions 1-10 (10 vols by slate)NCJ -17930-36. 15151
ilDictionary of Criminsi Justice Data Terminology: Terms andDefinitions proposed tor Interstate and National Data Collectionand Exchange NCJ-36747
Program Plan for Statistics, 1977-81, NCJ-37811
Utilization of Criminal Justice Statistics Project:Sourcebook of Criminal Justice Statistics 1978 (annual).
NCJ-53207Public Opinion flegprding`Crime, Cruhinal Justice, and Related
Topics. NCJ- 17419New Directions in Processing of Juvenile Offenders: The Denver
Model. NCJ- 17420Who Gets Deleined? An Empirical Analysis of the Pre-Adiudicatoiy
Detention of Juveniles in Denver NCJ 11417Juvenite Dispositions: Social and Legal Factors Related to the
Processing of Denver Delinquency Cases, NCJ-17418Offender-Based TransaCtion Statistics; New Directions in Data
ColleCtion and Reporting, NCJ-29645 . . -Sentencing of California Felony Offenders, NCJ-20646The Judicial Processing of Assault and 'Burglary Offenders in
Selected California Counties, NCJ-296114Pre-Argudicatory Deatention in Three Juvenile Courts, NCJ-34730Delinquency Dispositions: An Empirical Analysis of Processing
Decisions in Three Juvenile Courts. NCJ-34734The Patterns end Distribution of Assituit incident Characierislice
Among Social Areas, NCJ-40025 iPatterns of Robbery Ctarecteristice and Itierr Occurrence Among
Social Areas, NCJ-40026Crime-Specific Analysis:
The Characteristics of Burglary IncldentSNCJ-42093An Empirical Examination of Burglary Offender Characteristica!
NCJ-43131 .An Empirical Examination Of Burglary Offenders and Offense
Characteristics. NCJ-42476Source, of National Criminal Justice Statistics: An Annotated'
Bibliography. NCJ-45006Federal Criminal Sentencing: Perspectives of Analysis and a
Design for Research, NCJ-33663Variations In Federal Crimlhal Sentences: A Statishbal Assessment .
at the National Level. NCJ-33684.Fecieral Sentencing Pstlerns: A Study of Geographical Variations,
NCJ-3)3685Predicting Sentences in Federal Courts: The Feasibility of a
National Sentencing Policy. NCJ-33686.
3
San Diego:Publicattitudesaboutcrime
National Crime Survey ReportNo. SD-NCS-C-30, NCJ-46245
41
5
U.S. DEPARTMENT OF JUSTICE
L Enforcementssistance Administration
National Criminal Justice Informationand Statistics Service
For sale by the Superintendent oibocuin,nt s, U.S. Oovermnent Printing MeevWashington, D.C. 204'02 tlAY 1 6 1980
U.S. DEPARTMENT OF JUSTICE.
LaW lotcement &sista MT 'Ad ministuation
Henry S. Dogin, Administrator
Homer F. Broome, Jr., Deputy Administrator#rffor Administration
Benjamin II. RenshawActing Assistant AdnunistratmNatimial Criminal Justice Informationand Statistics Service
Charles R. Kindermann, Acting I)irect0tStatistics Division
-v
4ACKNOWLEDIGMENTS. This report was prepared for thr Law
1.1Am-cement Assistance Administration by the Bureau of the
census. In the IAA' Enforcement Assistance Aministralion, gen-
eral supervision was supphed by Charles R. Kindermann. assisted
by Dawn D. Nelson and Patsy A. Klaus Collection and piocess-
ing of data for the household survey were condpried in the Bu-
reau of the Census under the general supervision_of Marvin M.Thompson,'DemographiC Surveys Division, assisted by Linda K.
Murphy and Robert L Goodson. Thc report wasrprepared in the
Crime Statistics Analysis Staff under the general supervision of
Robert I'. Parkinso». Adolfo L. Paez directed and edited the
report. Tlw analysis was written by J. Frcderkk Shenk. A tech-
nical review of tin report was performed by Louis E, Williams,
Statistical Methods Division, under the general supervision of
Dennis J. Schwartz.
Library of Congress Cataloging in Publication Data
Ugitcd States. National.Crimitlal Justice Information andtatilitics Service.
SaeDiego: public attitudes about crime.
(6 National crime survey report; no. SD-NCP-C-30)I. Crime and criminalsCaltforMa ,--San.Diego--Pu tie opin-
4 loh. 2. San Diego, Cali.Police opinimi, 3.opinion,CalifortfiaSakDiego. I. Title. H. Series.1-1V6795.S371155 1977 301.15'43164979498 77-4122
ublic
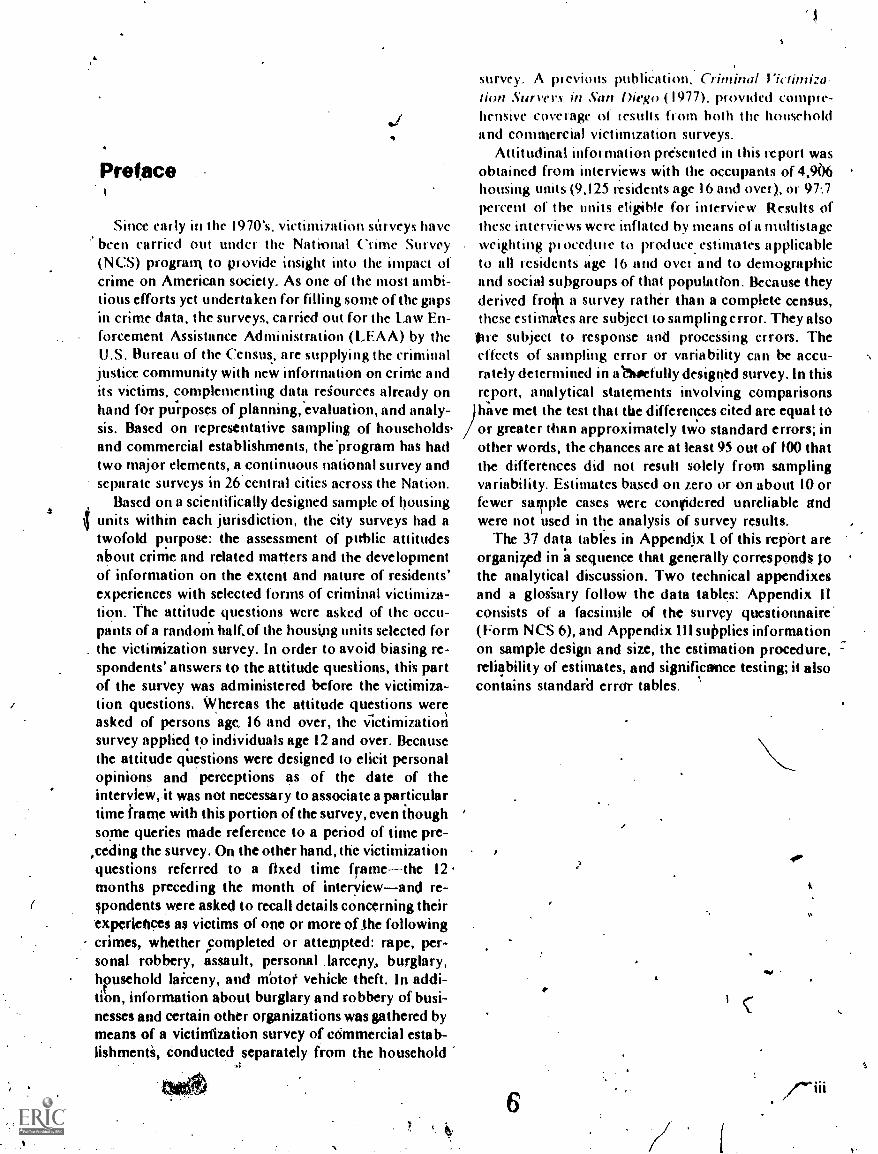
Preface
Since early in the 1970's, victimization sitrveys havebeen carried out under the Nati-onal Crime Survey(NCS) program to provide insight into the impact ofcrime on American society. As one of the most ambi-tious efforts yet undertaken for filling some of the gapsin crime data, the surveys, carried out for the Law En-forcement Assistance Administration (LEAA) by theU.S. Bureau of the Census, arc supplying the criminaljustice community with new information on crinie andits victims, complementing data reiources already onhand for purposes of planning, evaluation, and analy-sis. Based on representative sampling of households.and commercial establishments, the'program has hadtwo major elements, acontinuous national survey andseparate surveys in 26 central cities across the Nation.
Based on a scientifically designed sample of housingunits within each jurisdiction, the city surveys had atwofold purpose: the assessment of public attitudesabout crime and related matters and the developmentof information on the extent and nature of residents'experiences with selected forms of criminal victimiza-tion. The attitude questions were asked of the occu-pants of a random half.of the houskrig units selected forthe victimization survey. In order to avoid biasing re-spondents' answers to the attitude questions, this partof the survey was administered before the victimiza-tion questions. Whereas the attitude questions wereasked of persons age, 16 and over, the victimizationsurvey applied to individuals age 12 and over. Becausethe attitude questions were designed to elicit personalopinions and perceptions as of the date of theinterview, it was not necessary to associate a particulartime trame with this portion of the survey, even thoughsome queries made reference to a period of time pre-
,ceding the survey. On the other hand, the victimizationquestions referred to a fixed time framethe 12months preceding the month of interviewand re-spondents were asked to recall details concerning theirexperietKes as victims of one or more of the followingcrimes, whether completed or attempted: rape, per-sonal robbery, assault, personal larcepy, burglary,heusehold laireny, and mOtot vehicle theft. In addi-tion, information about burglary and robbery of busi-nesses and certain other organizations was gathered bymeans of a victintization survey o commercial estab-lishmenti, Conducted separately from the household
,t
survey. A previous publication, Criminal Victimiza-tion Surveys in San Diego (1977), provided compre-hensive coverage of icsults from both thc householdand commercial victimization surveys.
Attitudinal information presented in this report wasobtained from interviews with the occupants of 4,966housing units (9,125 residents age 16 and over), or 97:7percent of the units eligible for interview_ Results ofthese interviews were inflated by means of a multistageweighting procedure to produce estimates applicableto all residents age 16 and ovet and to demographicand social subgroups of that population. Because theyderived froiri a survey rather than a complete census,these estimakes are subject to samplingerror. They alsoPre subject to response and processing errors. Theeffects of sampling error or variability can be accu-rately determined in ahsefully desiped survey. In thisreport, analytical statements involving comparisons
)havc met the test that tbe differences cited arc equal toor greater tban approximately two standard errors; inother words, the chances arc at least 95 out of 100 thatthe differences did not result solely from samplingvariability. Estimates based on zero or on about 10 orfewer sawle cases were confidered unreliable andwere not used in the analysis of survey results.
The 37 data tables in Appendix 1 of this report areorganird in a sequence that generally corresponds jothe analytical discussion. Two technical appendixesand a glos'sary follow the data tables: Appendix IIconsists of a facsimile of the survey questionnaire.(Form NCS 6), and Appendix ill supplies informationon sample design and size, the estimation procedure,reliability of.estimates, and significance testing; it alsocontains standard error tables.
It
Contents
Preface
Crime and attitudes
PageIII
m ma ry 3
( Crime t rends 6
U.S. crime trends 6
Neighborhood crime trends 6
Who are the offelders? 6
Chances of personal victimization 6
Crime.and the media 7
Fear of crime 7
Crime as a deterrent to mobility 7
Neighborhood safety 7
Crime as a cause for moving away 8
Crime as a cause for activitymodification , 8
Residential problems and lifestyles 8
Neighborhood problems
r.
. and selecting a homeFood and merchandise shopping
8
practices 9Entertainment practices 9
Local police performanceAre they doting a good,.average,
90
Or poor job? 9
How can the policejmprove? 10
AppendixesI. Survey data taPles I I
. II. survey instrument 461
HI. Technical information and reliabilityof the estimates 41)
,-,Sample design afid size 49Estimation procedurt 49Reliability of estimates 50
ComPutation and' applicationof the standard error 5 I
1
Glossary 53
User evaluation S5
Charts
Pao4
4A. Summary findings about ci imc trendsH. Summary findings about fear of crime
C. Summary findings about residential problems
D. Summary findings about police performance
Tablas
Appendix I
Crime ilynds
I. Direction of crime trends in the United States2. Direction of crime trends in the neighborhood3. Comparison of neighborhood crime with other
metropolitan area neighborhoods I 3
4. Place of residence of persons committingneighborhood crimes 13
S. Change in the chances of being attacked or robbed 19
6. Seriousness of crime problem relative to what
newspapers and television report 15
Fear of crime
7. Fear of going to parts of the metropolitan areatturing the day I6
8. Fear of going to ports of the metropolitan areaat night 17
9. Neighborhood safety when out alone during
the day I 8
10. Neigh rhood safety when out alone during
the dayII. Neigh rhood safety when out alone during
the day 20
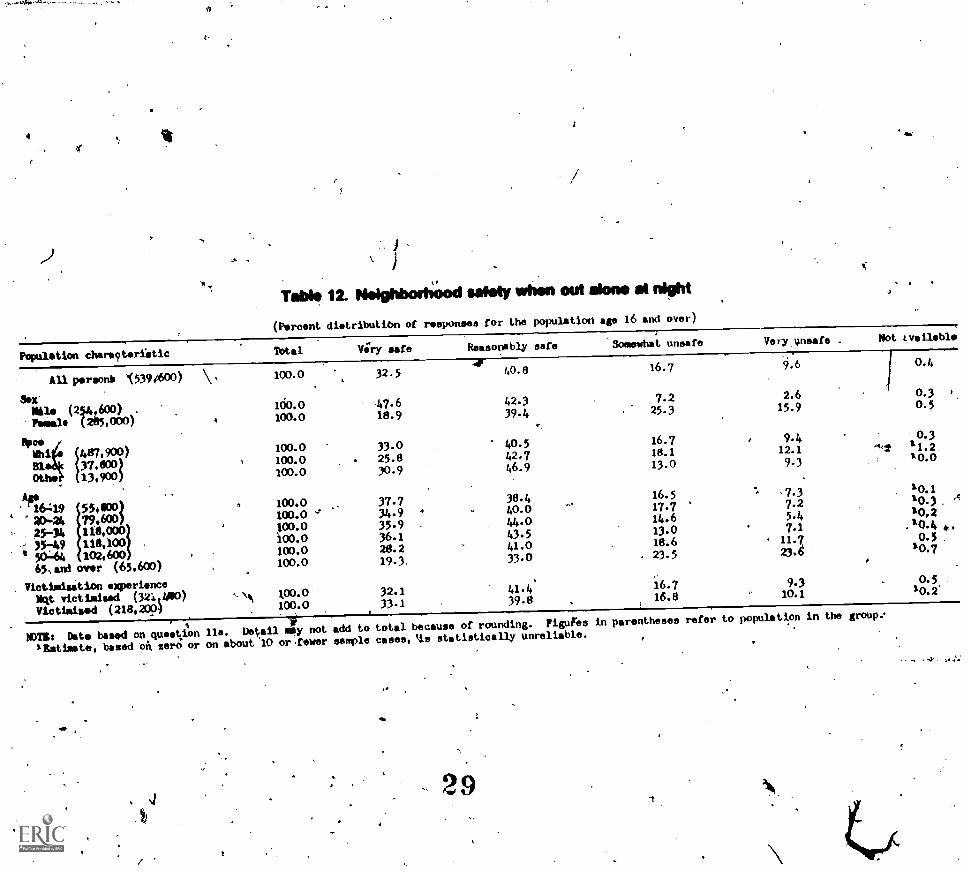
12. Neighborhood safety when out alone at night 21
13. Neighborhood safety when out alone at night 22
14. Neighborhood safety when out alone at night 23
13. Neighborhood dangerous enough to consider
moving elsewhere 24
16. Limitation or change in activities because of fear
of crime 25
17. Personal limitation or change in activities blouse
of fear of crime 26
18. Personal limitation or change in activities because
of fear of crime 27
Resident& problems and lifestyles
19. Most important reason for selecting present
neighborhood 28
20. Most important reason for leaving former
residence 28
21. Whether or not there are undesirableneighborhood characteristics 29
22. Mott important neighborhoOd problem23. Whether 'or not major food phopping done
in the neighborhood 5 31
24. Most important reason for not doing major food
shopping in the neighborhood 32
25, Preferred locatien for general .merchandise
shopping, .
26 Most important reason for nsually doing general
merchandise shopping in the suburbs (01 neighbol hood)
or downtown .
14
27 Change in ihe frequency with which prisons went out
for evening entertainment5 28. Most important reasoo for increasing or decreasing
5 the frequency with which persons went out for evening
entertainment 16
29. Places usually visited for evening cutertairnnent 3 7
30. Most important reason for usually seeking evening
entertainment inside Of outside the city 18
Local police performance
ft 31. Oinnion about local police performance32. Opinion about local police performance
1233. Opinion about local Irolice performance
12'34. Whether or not local police performance
improvement
19
v ,V
33
VI404 I
needs4?
33. Most important measure tot improving local police
performance41
36. Most important measure for improving local police
pcformance 44
37. Most important measure for improving local police
performance 45
Appendix III
I. Individual respondent data: Standard errorapproximations for estimated 'percentages S2
II. Household respondent data: Standard errorapproximations for estimated percentages 52
1
.
Crime and attitudes
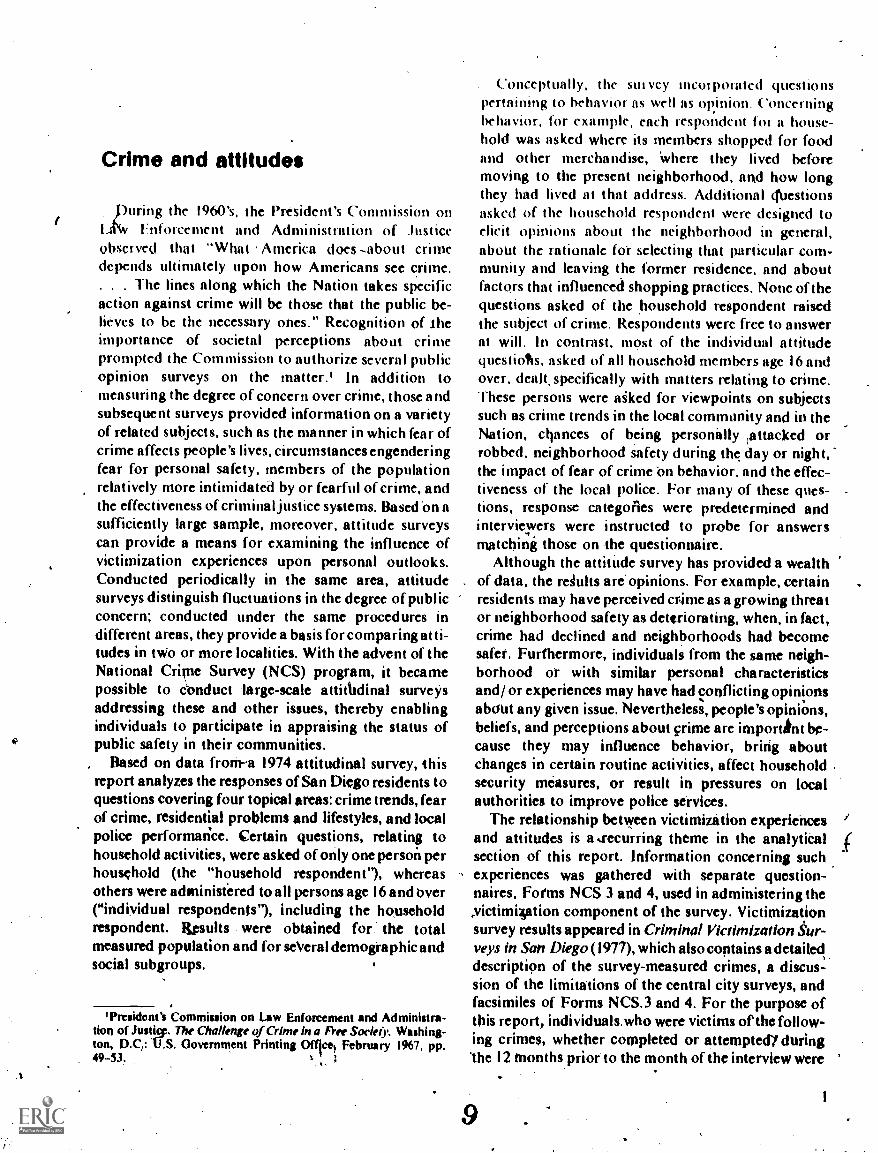
puring the 1960's, thc President's Commission onLIttv Enforcement and Administration of Justiceobserved that "What America does-about crimedepends ultimately upon how Americans see crime.. . . The lines along which the Nation takes specificaction against crime will be those that thc public be-lieves to be the necessary ones." Recognition of iheimportance of societal perceptions about crimeprompted the Commission to authorize several publicopinion surveys on the matter.' In addition tomeasuring the degree of concern over crime, those andsubsequent surveys provided information on a varietyof related subjects, such as the manner in which fear ofcrime affects people's lives, circumstances engenderingfear for personal safety, members of the populationrelatively more intimidated by or fearful of crime, andthe effectiveness of criminal justice systems. Based 'on asufficiently large sample, moreover, attitude surveyscan provide a means for examining the influence ofvictimization experiences upon personal outlooks.Conducted periodically in the same area, attitudesurveys distinguish fluctuations in thc degree of publicconcern; conducted under the same procedures indifferent areas, they provide a basis for comparing atti-tudes in tWo or more localities. With the advent of theNational Crime Survey (NCS) program, it becamepossible to cbnduct -large-scale attitUdinal surveysaddressing these and other issues, thereby enablingindividuals to participate in appraising the status ofpublic safety in their communities.
Based on data from-a 1974 attitudinal survey, thisreport analyzes the responses of San Diego residents toquestions covering four topical areas: crime trends, fearof crime, residential problems and lifestyles, and localpolice performarice. Certain questions, relating tohousehold activities, were asked of only one person perhousehold (the "household respondent"), whereasothers were administered to all persons age 16 and over("individual respondents"), including the householdrespondent. Results were obtained for: the totalmeasured population and for seVeral demographic andsocial subgroups.
'President's Commission on Law Enforcement and Administra-tion of Justig. The Challenge of Crime in a fl.ee Soriely. Washing-ton, Government Printing Officel February 1967, pp.49-33. I
Conceptually, the suivey incorporated questionspertaining to behavior as well as opinion Concerningbehavior, for example, each respondent for a house-hold was asked where its members shopped for foodand other merchandise, Where they lived beforemoving to thc present neighborhood, and how longthcy had lived at that address. Additional questionsasked of the household respondent were designed toelicit opinions about thc neighborhood in general,about thc rationale for selecting that particular com-munity and leaving the former residence, and aboutfactors that influenced shopping practices. None of thequestions asked of the household respondent raisedthe subject of crimc. Respondents were free to answerat will. In contrast, most of the individual attitudequestions, asked of all household members age 16 andover, dealt, specifically with matters relating to crime.These persons were aiked for viewpoints on subjectssuch as crime trends in the local community and in theNation, chances of bcing personally ,attacked orrobbed, neighborhood safety during the day or night,the impact of fear of crime bn behavior, and the effec-tiveness of the local police. For many of these ques-tions, response categories were predetermined andinterviewers were instructed to probe for answersmatching those on the questionnaire.
Although the attitUde survey has provided a wealthof data, the reiults are opinions. For example, certainresidents may have perceived crime as a growing threator neighborhood safety as deteriorating, when, in fact,crime had declined and neighborhoods had becomesafer. Furthermore, individuals from the same neigh-borhood or with similar personal characteristicsand/ or experiences may have had conflicting opinionsabOut any given issue. Nevertheless, people's opiniOns,beliefs, and perceptions about crime are important be-cause they may influence behavior, bring aboutchanges in certain routine activities, affect householdsecurity measures, or result in pressures on localauthorities to improve police services.
The relationship between victimization experiencesand attitudes is a ,recurring theme in the analytiCalscction of this report. Information concerning suchexperiences was gathered with separate question-naires, Forms NCS 3 and 4, used in administering thevictim4ation component of the survey. Victimizationsurvey results appeared in Criminal Victimization ..ur-veys in San Diego (1977), which also contains a detaileddescription of the survey-measured crimes, a discus-sion of the limitations of the central city surveys, andfacsimiles of Forms NCS.3 and 4. For the purpose ofthis report, individuals.who were victims of the follow-ing crimes, whether completed or attemptedy duringThe 12 Months prior to the month of the interview were
considered :victimized": rape, personal robbei v,ssault, and personal larceny. ,Similarly, members of
house olds that experienced One Or more.of Ince typesof offenses--burglary, hliusehold larceny, and motorvehick theftwere categorized as victints. These
crimes are defined in the glossary. Orsons who experi-enced crimes other than those measured, by thc pro-gram, or who were victimized by any of the relevantoffenses outside of the I 2-month reference period,were -classified as "not victimized." Limitatnins in-herent in the victimization surveythat may haveaffected the riccuracy of distinguishing Victims fromnonvictimsresulted from the problem of ietim re-call (the differing abihty of respondents to remembercrimes) and from the phenomenon of Wescoping (thetendency of some respondents to recount incidentsoccurring outside, usually before, the appropriate timeframe). Moreover, sOme crimes were sustained by vie-tims outside of their city of residence;these may havehad little or no effect in the formatiOn of attitudesabout local limners.
Despite the difficulties in distinguishing preciselybetween victims and nonvietims, it was deemed impor-tant to explore the possiblity that be,ing a victim ofcrime, irrespective of the level of seriousness or the fre-quency of occur-mice, has an impact on,behavior andattitudes. Adopting a simfile dichotomous victimiza-tiOn experience variabkvictimized and not victim-ized --for purposes of -tabulation and analyaris alsostemmed from the desirability of attaining the highestpossible degree of statistical reliability, even at the costof using these broad categories. ideally, the victimcategoryshoWd have distinguished the type or serious-ness of crimes, the- recency.of the event4 and/ or thenumber of offenses sustained.2 Such a procedure seem-ingly would have yidded more refined measures of theeffects of crime upon attitudes. By reducing thenumber of sample cases on which estimates werebased, howcyer, such a subeategorization of victimswoukl have Weakened the statistical validity of 'com-parisons between the victims and nonvictirns.
/Survey resultsferesented in tbis'report _contain attitudinal datafuinksbed by ths victims of "series yiciiinizations" (see glossary). 1 0
Summary
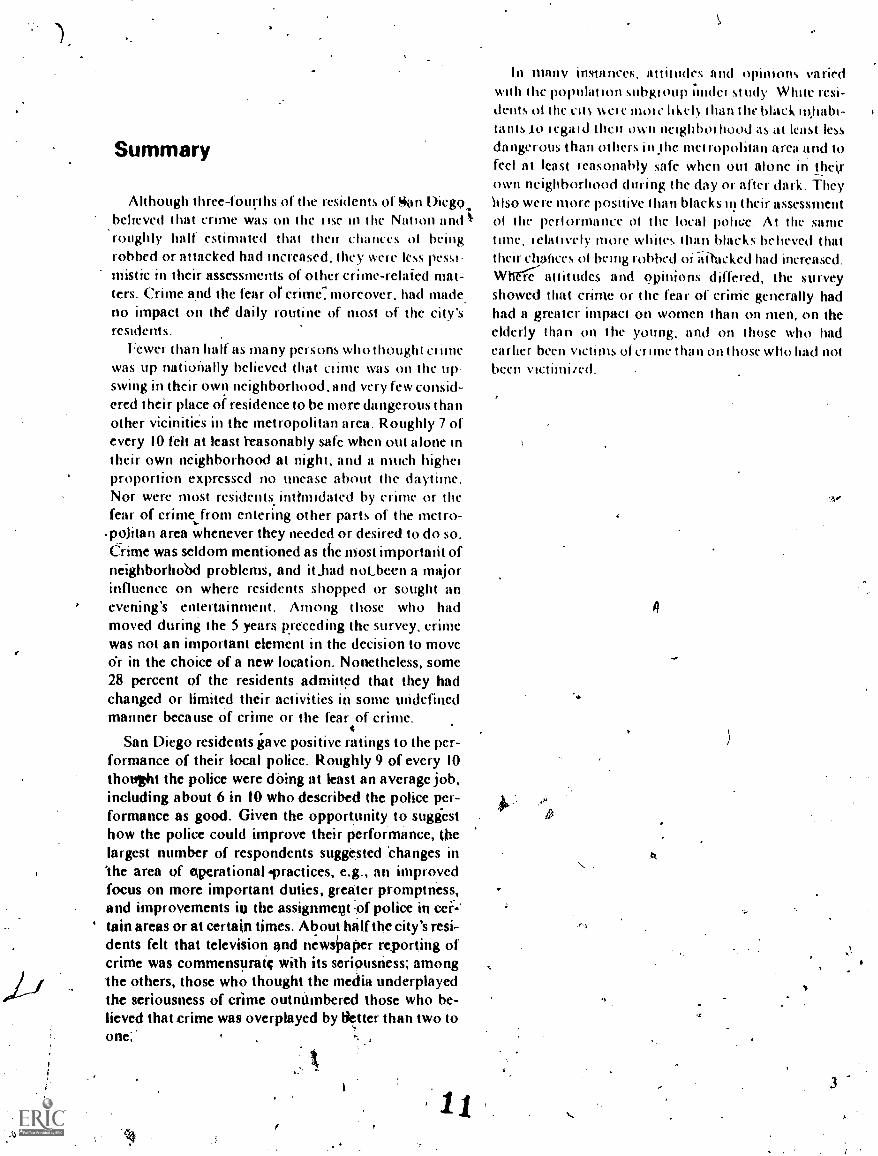
Although three-foui:ths of the residents of *an Diego...beheved that crime was on the Ilse in the Nation and k.roughly halt estimated that then chances of Mugrobbed or attacked had increased, they were less pessi-mistic in their assessments of other crime-related mat-ters. Crime and the fear or criine moreover, had madeno impact on the daily routine of most of the city'sresidents.
Fewer than half as many persons who thought eiwas up nationally believed that clime was on the up-swing in their own neighborhood , and very few consid-ered their place ot residence to be more dangerous t ha nother vicinities in the metropolitan arca. Roughly 7 ofevery 10 felt at least Yeasonably safe when out alone intheir Own neighborhood at night, and a much higherproportion expressed no unease about the daytime.Nor were most residents indmidated by crime or thefear of crime from entering other parts of the metro-poiitan area whenever they needed or desired to do so.Crime was seldom mentioned as the most important ofneighborhobd problems, and it_had not_been a majorinfluence on where residents shopped or sought anevening's entertainment. Among those who hadmoved during the 5 years preceding the survey, crimewas not an important element in the decision to moveo'r in the choice of a new !option. Nonetheless, some28 percent of the residents admitted that they hadchanged or limited their activities in some undefinedmanner because of crime or the fear of crime.
San Diego residents igave positive ratings to the per-formance of their local police. Roughly 9 of every 10thouisht the police were doing at least an average job,including about 6 in 10 who described the police per-formance as good. Given the opportunity to sugiesthow the police could improve their performance, Olelargest number of respondents suggested Changes inMe area of Aperational vactices, e.g., an improvedfocus on more important duties, greater promptness,and improvements in the assignment -of police in cer-'
' lain areas or at certain times. About half the city's resi-dents felt that television and news/paper reporting ofcrime was commensurate with its seriousness; among'the others, those who thought the media underplayedthe seriousness of crime outniimbered those who be-lieved that crime was overplayed by Better than two toone:.
11
In many jrmin flees, altitudes a nd opinions variedwith the population subgroup ;nidei st tidy White resi-dents ol the cit +ele mole likely than tlw black inhabi-tants to legal d then own neighboi hood as at least lessdangeRnis than others in Jhe metropolitan area and tofeel at least reasonably safe when out alone in theisown neighborhood during the day or after dark. TheyIdso were more positive than blacks in their assessmentof the pert ormance o1 the local police. Ai the sametime, ielatively mole whites than blacks believed thattheir chances of being robbed or iiitacked had increased.Whrre- attitudes and opinions differed, the surveyshowed that crime or the fear of eriMe generally hadhad a greater impact on women than on men, on theelderly than on the young, and on those who hadearlier been victims of crime than on those who had notbeen victimircd.
0
Detection 01U 8 crime(Table 1)
LNInclion 01rwelOborhoon crimn(lable 2)
Comparativeneighborhood safety(Table 3)
General identityof offenders(Table 4)
Chances of beingvictimued(Table 5)
Crane as portrayedby news medra
fibre 6)
Inhibits daytimemovement(Table 7)
Chart A. Summary findings about crime trends
Increased
Same
04)creased
Increased
Same
Decreased
Less safe
Safer
Average
Outsiders
Neighbors
Don't know
Increased
Sarne
Decreased
Moat serious
Same
ess serious
11111111H11111111
111
IHII
IHH1111111HI11111111111H10111111111HIIIIHHIIIIIHIIHIIH111111
11111111111111111111111111111111111111
1111111111111111111111111111111
11111111111111111111111111HH
31
4 4
27
26
37
1111111111111111111111111111111111111111111111
11111111
IIIIIIIIIIHIIIIIIIIIIIIIIIIIIIIIDIIIIIIIIIIIIIIIIIIIIH11111111111111
32
39
t 4
52
50
61
75
11
110 20 :10 50 60 70 80Pt Ref:Nf
lk
Chart B. Summary Man& about fear of crime
Yes
No
90 100
12
1111011111111111111111111111111111111111111111111111111111111111111111111111111111111111111111111111
06
Inhibits nighttime YOs 24
/-
movementashin 8)
No 1111111111111111111111111111111111111111111111111111111111111111111111111111111111
Daytime neighboinoed-
Unsafesafety(Table 9)
.,Sato
Nighttime) Unsateneighborhood safety(Table 12) .
Sate
, Home relocation Yesconsklered(Table 15)
No
Population limiting Yesactivities(Table 16) -.
No
Neighbors limiting Yes
activities .
(Table 1 6)No
Respondent limiting Yes
aClivilies(Table
No
69
298
26
11111111111111111111111111111111111111;11111111111111111111111111111111111111111111111
11
73
111111111111111111111111111111111111MMIEHINIIIIIIIIIIIIIIII11111111111111111101111111111
11111111111111111111111111111111111132
34
111111111111111111H111111111111111111111111111110111111011110111110
::.: . . ....
iiiiiiiiiimillielliiHHHHHHHIHHHHHHHHHHHHHHHHHHH
28
62
0 10 20 30 '40 40 Eir0 ;0 40 90 100
PERC,F NT
7 1
86
12
,
%;
-
Jots per loInialis (-)fflhiri
311k' .11)
Need (otirprovenienlanblo 34)
Main in)PrOVt;tilerllneededfl able 35)
Reason (or leavsngold neighborhood(Table 20)
Chart C. Summary findings about residential problems
Reason tor choosingnests, neighborhoodITable 19)
had neighbofhoodfeatures .
(Table 21)
Main neighborhoodtxoblems .
(Table .V)
Good
Average
Riot
Yes
No
Persontleiresources
Qiwationaipractices
Cpapuroyrolations
III
JO
59
17
.31
0
13
ITO A) 410 4 40 710 00 90 100
PERCENT
Chart D. Summary findings about police performance .
Crime safety
Location Idisliked
.
House dtsliked
Crime safety
Location liked
House liked
Yes
No
Crime
Environment
Transportation
1111111111111111111111101111111111111111
11111111111111111111111111111111111111111
36
36
rill11111114156c.
111111111111111111111111111111111111111111111111111111111111111111111
11111111111111111
35
17
65
10 20 30 40 80 60 70 80 90 100
PERCENT
1
0
13 t5
Crime trends
This scction of the report deals with the perceptionsof San Diego residents with respect to national a nfi commu n ity crime trends. personal safety, and the accuracywith which newspapecs and televisien were thought tobe reporting the crime problem. The findings weredrawn from Data Tables I fhrough 6, found in Ap-pendix I. The relevant questions, appearing in the fac-simile of the survey instrument (Appendix 'II), are 9a,9c, !pa, 12. 15a, and 151); each question was asked ofpersons age 16 and over.
U.S. crime trendsMost residents of San Diego 'believed that crime in
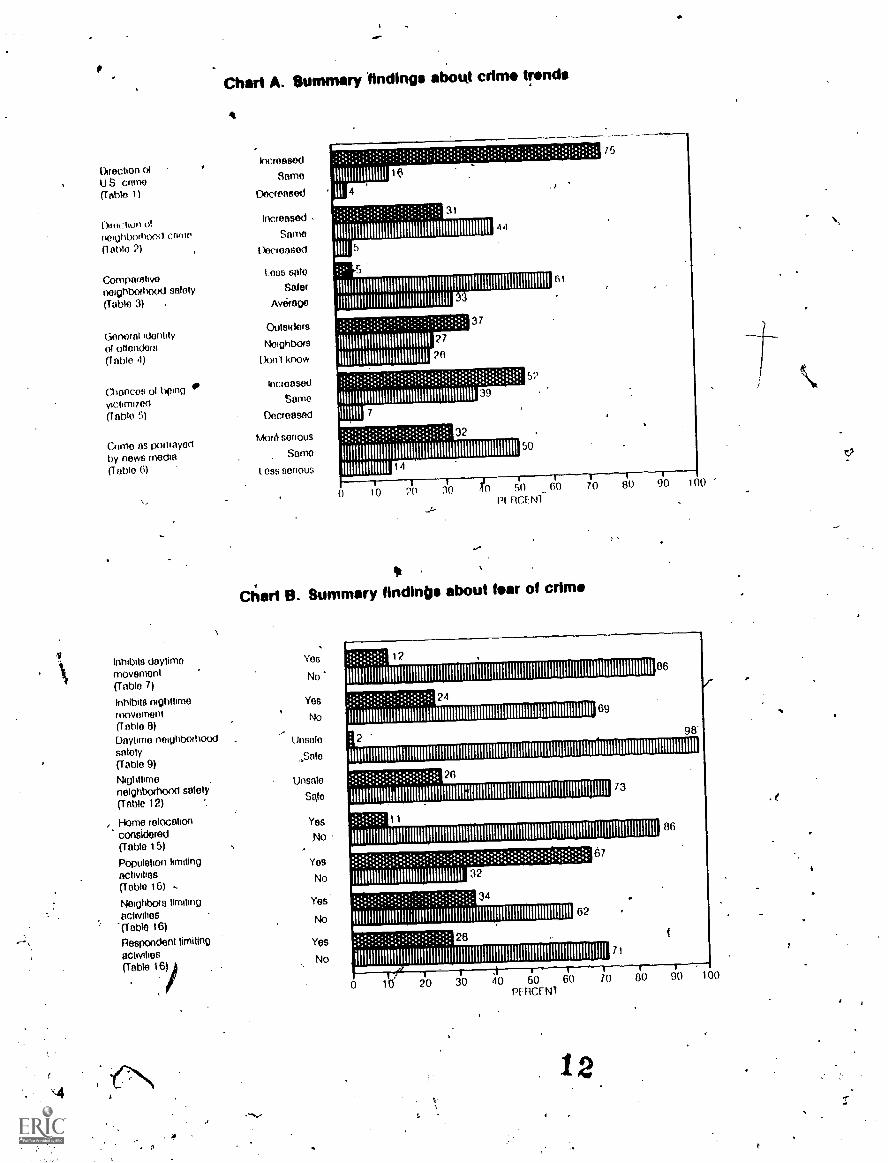
thc United States had filen during the past year or two.Three of every four residents held this view, comparedwith only 4 percent who felt the trend was downwardand 16 percent who thought that crime levels had re4mained constant. The remaining 5 percent had DO
opinion on the snbject. Men and women differed littlein their assessment of crime trends in the Nation, andthere was little disagreement between residents whohad been the victims Of clime and those who had not.However, it higher prpportion of the black residents ofSan Diego (84 ptrcent) than their white counterparts(75 percent) felt crime to be on the rise nation 'ide.Residents age 35 and over also were somewhat iiorclikely than younget'persons to view crane as increiring.
Neighborhood crime trends
Fewer than half as many who drought that kr'ime
was up nationally also believed that crime was on theincrease in their own neighborhood. Thus, only 31 per-cent indicated a belief that neighborhood crime Wasrising. The largest number of residents (44 percent) feltthat the level of crime in their neighborhood was un-changed; 5 percent said it had decreased, and the,re-maiming 20 percent either hat' no opinion on the matteror said they had not lived in their neighborhoods long.enough to know. Amodg those who had formed a judg--ment, opinion on whether ineighborhbod crime hd in-creased, decreased, or'remained the same varieslightly betweeil mcn and women,.between blackwhites, and among persons of different age. Howrelatively more victims of-crime (37 percent) thanvictims (26 Percent) believed that crinirm theirneighborhood had risen.
6
butand.Ver,on-wn
A comparative assessment of residents' feehngsabout neighboi hood mine was pi vided by liltingthen own neighboi hood %is a vis otht`ts in the mill 0-[mina I I a l ea. Although kW believed crime in theo ownneighborhoods was decreasing. a majority (61 percent)considered their own neighborhood to be less 01 muchless dangerous than others, and another 33 percent re-garded it as about average. Only 5 percent thoughtticii n neighhoi hood to be 11101c of Much more
d Inge" OtisWhites woe !al more likely than blacks (62 vs. 41
ercent) to indicate that their neighborhoods were lessr much less dangerous than others; blacks were most
inclined to classify their neighborhoods as' average.Nonvictims were somewhat more disposed than vic-tims to rate their neighborhood as at least less danger-ous. Differences, in perception between the sexes andamong persons classed by age were not pronounced.
Who are the offenders?Slightly more than a third ,of all respondents be-
lieved that outsiders were responsible for most of thccrime in their own neighborhood, whereas 27 percentattributed these offenses to persons living within theneighborhood. Of the remainder. 4 percent blamedoutsiders and local residents equally, 26 percent didn'tknow who was responsible, and 5 percent denied theexistence of crime in their neighborboods. Amongthose who acknowledged the presence of neighbor-hood crime and held an opinion as to the identity of theculprits, a majority blamed outsiders, a finding thatheld for both men and women, for white residents, forpersons age 35 and over, and for nonvictims. Blacks,persons under 35, and the victimiad all Were not onlymore likely than others to have igplicatep neighbor-hood people, but they also were more disposed to havean opinion about who was committing neighborhoodcrime. In relative terms, a bout three titnei as many per-sons under age 20 as those 65 and over thought localresidents were the culprits.
Chances of personal victimization
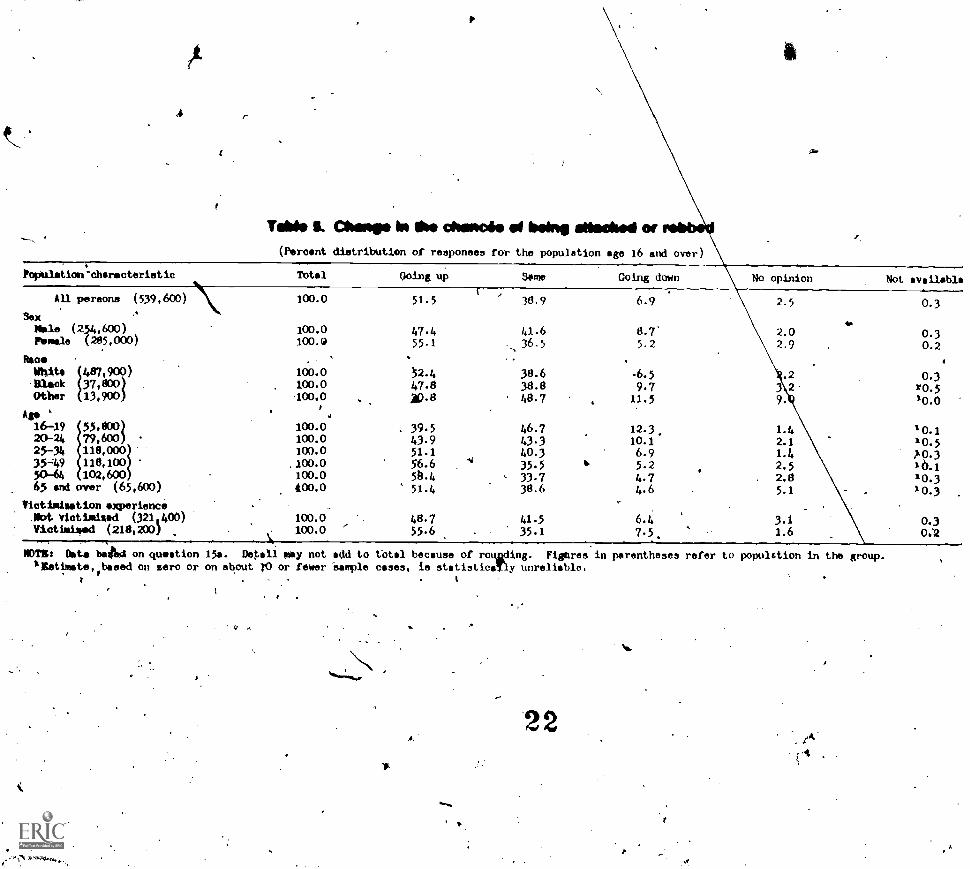
Despite their relatively optimistic views about crimein their own neighborhood, San Diego residents feltthat their chances of being personally robbed or at-tacked had increased during the year or two prior tothc survey. Some 52 percent of the 'respondents en-dorsed this belief, compared with 7 percent whothought the chanceS had gone down and 39 percentWho saw no change. A majority of women, white ',hi'dents', inhabitants age 25 and over, and victims all feltthat their chances of being personally robbed or at-tacked were greater at the time of the survey than ear7
1 4
her, and the largest propotoon of males, blacks, andnonvictims also shared this belief Only among restdents under age 25 was the issue not cleat cut. In thissegment 01 sollel V. opinion MIN about equally dividedhet weer, those who kit ia t the possibility had In-c-teased and (hose who claimed it was about the same;another 11 pet cent thought that there was less likeli-hood of their-being robbed oi attacked.
Crime and the media
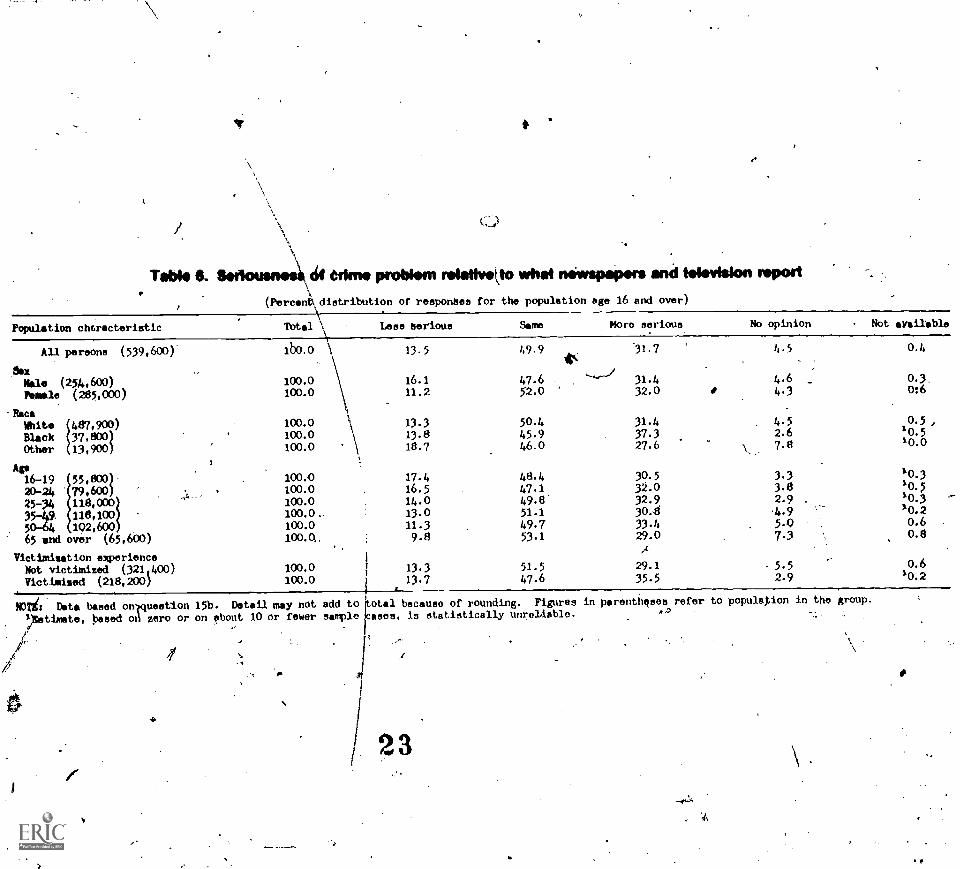
I he sot v showedit hitt hall the population believedthat crime was as serious as portrayed on televisionand in the newspapers. Ainong others having an opin-ion on thematter, 32 percent telt that crime was moreserious 'and, therefore, that the media was undet play-ing the seriousness of the problem. Some 14 percenttfiought that the opposite was the case, oi that crimewas less serious than depicted. Inigeneral, opinions onthe subject differed but little amobg the variou. poptl-lation.groups. Howeveri black residents and -personswho had been victimized both were more likely thantheir white and lionvictimized counterparts to thinkthat crime was more serious than portrayed.
Fear of crime
Among Qther things, results covered thus far haveshown that Many residents of San Diego believed crimehad increased over/the years leading up to the survey,and, in addition, felt their own chances of beingattacked pr robbed, had risen. Whether or not theyfeared for their personal safety is a Matter treated inthis section of the report. Also examined is the inivtictof the.fear of crime on activity patterns and on consid-erations regarding changes of residence. Surveyquestions I la, l lb, -11c, I3a, 13b, 16b, and Wall asked of persoris.age 16 and over-- and Data Tables
.7 through 18 arc rekrented here.
Crime as a deterrent to mobility
For most San Diego residents, crime or the fear ofcrime was not a deterrent to mo(oility within the metro-
: politan area. Some,86 liercent indicated that there Wereno parts.of the area where they needed or.desired to gothat they were afraid of entering during the day. And,although there was somewhat more apprehensionabout movement at night, about 7 out of 10 expressedno fear about entering these sections after dark.
oRelatively more \dines than blacks and Sietuns oianii,mviolm, 55 etc ;111;11,1 01 roIng ml o pail's of the mettopohlan ;ilea hoth thu I hg tlw da ,. and at nighi . btu theditlerences were not great !An both daytime:old nighttime movement, persons age 6.5 and over expressed lessapprehension than did those in the other ige gi oups '
Neighborhood safety
Ninety-eight out ol es ci 100 reident S of San Piegotelt at least reasonably sale when out alone in then ownneighbor hood d iii ing the day ln fact, a clear majorityof iesidents, ill espective ol se-/.. lace, age, or victuniza-bon experience, felt very safe undyr- these circum-stances. llifWever, men were more likely than womenand whites more likely than blacks to leel yet) safe.I he elderly, i e., those age 65 and over, were less in-
clined (Ilan persons of younger age to feel very sate, butthere was little diswgreement On the matter between thevictimized and the nonvictims.
ln general, relatively more men than women in eachage group felt very safe when out alone during the dayin their own neighborhood, but the proportion ofwomen age 16 19 who consideted themselves very safeunder such circumstances did not differ significantly .
ont that ol elder ly men. Black women in each agegroup were the least likely to feel very safe.t Although roughly three-fourths of the city; inhabi-tants also felt at least reit sona bly_safe out alone in theirown neighboihood at night, the number who felt verysafe was 'less than half that of those who consideredthemselves very safe under these conditions during thcday. Only among white males under age 50 and amongblack males under age 20 did # majority feel very safe.At the other extreme', most wromen age 65 and over,irrespective of race, believed themselves to be some-what or very unsafe, with the number- feeling veryunsafe exceeding that of those who sensed they weresomewhat unsafe.
Overall, men we l!e far less likely than women to haveexpressed unease being out alone in their neighbor-hoods at night; and the same held true for personsunder age 50 compa5ed with those who were older.Even young women were more apprehensive than el-derly men. White residents were somewhat less pronethan blacks to have trepidations. Victimization ex-perience appeared to have had little impact on feelingsof safety.
'It should be noted Ihat the source questions for data coveredanthis section (Questions l3a and 13b) referred to plaCesin the melro-polhtan area where the respondent needed or dewed to enter, thus,airs reasonable to assume that high-risk places, those most highlyrofired, were excluded from consideration' by many respondents.Had the questions applied unconditionally to all sectors of the area,the pattern of responsos no doubt would have been different.
7
(rime as a cause for ntoving away
Respondents who had stated that they felt some-what or vet y unsafe when out alone in then neighlkoihood during the day 01 at night were asked whetherthey thought the neighkorhood was dangerous enough-for them to consider moving away. Even among this 26percent of the population, only about one in eight be-lieveg the danger sufficiently grave to have consideredmoving elsewhere. Males, blacks, and crime victims allwere somewhat more apt than females, whites, andnonvictims to have given thought to moving because ofneighborhood dangers; for the subgroup as a whole, 86percent had not considered relocating. Persons age 65
and over, those most likely to have indicated 'some un-ease about being out alone in their neighborhocids,were among those most unlikely to ha ye contemplatedmoving elsewhere.
Crime as causo for activity .modification
Some two,thirds. of the residents of San Diegothought that people in general were reacting to crimeor the fear of crime by curtailing their' activities, butonly 34 percent believed that neighborhood residentsWert so doing and only 28 percent claimed that theythemselves had limited or altered thcir daily routine.
A higher proportion of women than menA33 vs. 23percent) indicated they had limited or changed theiractivities because of crime, a disparity between thesexes that applied 'peach age group among whites, britlacked statistical significance among blacks. However,young women (16-19) were no more likely than nknage 50 and over to have indicated a change in activities.White Males age 16-19 made up the group least likely
to have acknowledged some change in activities. Over-all, relatively more blacki (36 percent) than whites (28
percent) stated they had curtailed their activities.VictimCalso were more likely to have done so thannonvictims. Age appeared to play a part in wl4ther ornot activities had been modified as the result of crimeor the fear of crime. Generally speaking, the older theindividual the more likely there hid been some limita-tion of activities, although the differencesbetween par-ticular agc groups wcrc not always large nor necessarily
statistically significant.
\f413ased on responses shown in Data Table 15, this observationsomewhat misleading because the source question was asked only ofpersons who said they felt unsafe-during daytime and/or nighttime.Totaling 26 percelit of the relevant population, individuals who wereasked the question included 10 percent of all males, contrasted with41 percent of all females. Thus, 3 percent of the total population age16 and overincluding 2 percent of males and 4 percent offemalessaid they had seriously considered moving,
8
Residential problemsand lifestyles
The initial attitudry questions were designedto gather information about certain specific behavioi alpractices oi San Diego householders and to explore per-eeptions about a wide range of community problems,o4 of which was crime. As indicated in the sectionentitled "Crime find Attitudes:certain questions wereasked of only one member oreach household, knownas the household respondent. Information gathered
om such persons is treated in this section of the reportand found in Data Tables 19 through 26; the pertinentdata were based on survey questions 2a Jhrough 7b. In
abition, the responses to questions 8a through 81,relating to certain aspects of personal lifestyle, also areexamined in this section; the televant questions were 'asked of all household members age 16 and overisincluding the household respondent, and the resultsare displayed itt Data Tables 27 through 30. As can beken from thc 'questionnaire, anti unlike the protedureused in developing .the information discussed in thetwo preceding sections of this repo91, the questionsthat served as a basis for the topics eoVered here did hotreveal to respondents that the development of data oncrime was the main purpose of the survey.
l'Ulghborhood problemsand selecting a_homs
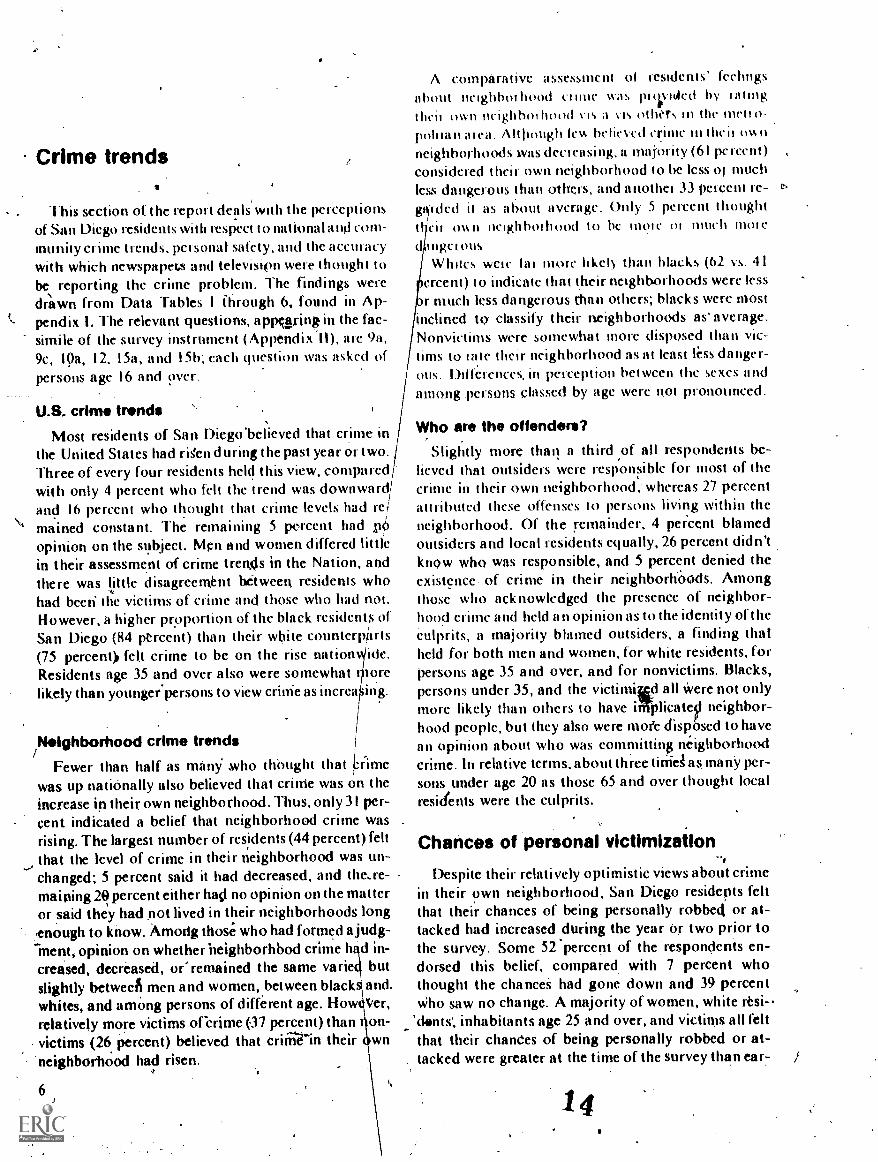
. Respondents in 65 percent of the households in SanDiego stated that their own ncighborhoods had no un-desirable characteristics, evidence of a "considerable
degree of satisfaction with thcarea ti which they wereliving. Of the 34 percent who .indicated that unde-sirable features were prbsent, approximately 9 percentbelieved crime to be the Most important problem, butott4r issues, such Its the environment (noise, troth,overcrowding, etc.), neighbors, and traffic and/orparking, were more commonly cited. Respondents inhouseholds that had incurred onc or inore victimiza-lions were more likely than those in nonvictimizedhouseholds to haye mentioned crime.as the most im-portant neighborhood issue, although even these re-spondentS ranked crime after the environment andneighbors. Householders with annual income less than$7,500 were morc inclined than 'their more affluent
1 6
counterparts to have cited crime as the most importantneighborhood problem
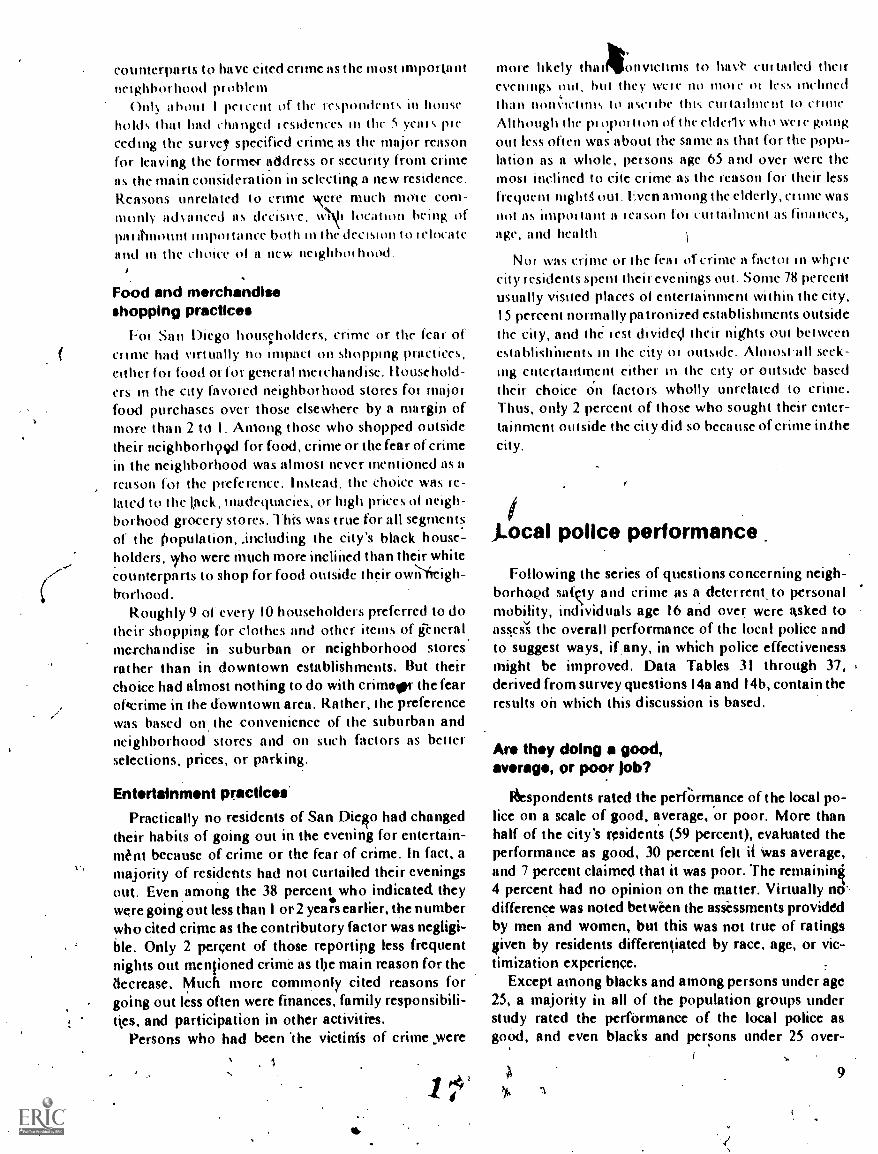
OnIN about I pelt-en! of the respondents in honsebolds that had changed residences in the 5 veal s pieceding the stave, specified crime as the major reasonfor leaving the former address or security from crimeas the main consideration in selecting a new residence.Reasons unrelated to crime svre much mote com-monly advanced as decisive. %%IV location being (d-im! &mount impot ta nee both in the decision to I00Ca Ic
and in the choice 01 a new neighboi hood.
Food and merchandiseshopping practices
For San Diego housvholders, crime or the fear ofcrime had virtually no impact on shopping practices,either for food or for general merchandise. Household-ers in the city favored neighbot hood stores for majorfood purchases over those elsewhere by a margin ofmore than 2 to I. Among those who shopped outsidetheir neighborhd9d for food, crime or the fear of crimein the neighborhood was almost never mentioned as areason for the preference. Instead, the choice was re-
lated to the tack, inadequacies, or high prices of neigh-borhood grocery stores. This was true for all segmentsof the population, including the city's black house-holders, vyho were Much more inclined than their whitecounterparts to shop for food outside their owñeigh-trorhood.
Roughly 9 of every 10 householders preferred to dotheir shopping for clothes and other items of &nem!.merchandise in suburban or neighborhood storesrather than in downtown establishments. But theirchoice had almost nothing to do with crimoto the fearoPcrime in the downtown area. Rather, the preferencewas based on. the 'convenience of the suburban andneighborhood stores and on such factors as betterselections, prices, or parking.
Entrtainmnt practices.Practically no residents of San Dice had changed
their habits of going out in the evening for entertain-ment because of crime or the fear of crime. In fact, amajority of residents had not curtailed their eveningsout. Even .among the 38 percent who indicated theywere going out less than I or 2 years earlier, the numberwho cited crime as the contributory factor was negligi-ble. Only 2 percent of those reportipg less frequentnights out mentioned crime as tbc main reason for thedecrease. Much more commonly cited reasons forgoing out less often were finances, family responsibili-tkes, and participation in other activities.
Persons who had been 'the victinis of crime were
4more likely that onvictims to !last curtailed theirevenings WA, but they Welt' tto molt: ot Icss inchricdthan noni.ictims to ascIthe this cuitadment to crimeAlthough tlw pi opoi non or the eldetiv who weir goingout less often was about the same as that for the popti-lation as a whole, persons age 65 and over were themost inclined to cite crime as thc reason for their less1 requent mght out. Fven among the elderly, et ime wasnot 115 Minot tant a lea son lot cut tailment as finances,age, and health.
Nor was crime or the fear of crime a factot in who ecity residents spent their evenings out. Some 78 percentusually visited places of entertainment within the city,15 percent normally patronized establishments outsidethe city, and the rest divided their nights out betweenestablishibents in the city or outside. Almostall seek-ing entertainment either in thr city or outside basedtheir choice on factors wholly unrelated to crime.Thus, only 2 percent of thosc who sought their enter-tainment outside the city did so because of crime inlhecity.
j_ocal police performance
Following the series of questions concerning neigh-borhood safsty and crime as a deterrent_ to personalmobility, individuals age 16 and over were asked toassess's the overall performance of the local police andto suggest ways, if any, in which police effectivenessmight be improved. Data Tables 31 through 37,derived from survey questions I 4a and 14b, contain theresults on which this discussion is based,
Are they doing a good,average, or poor job?
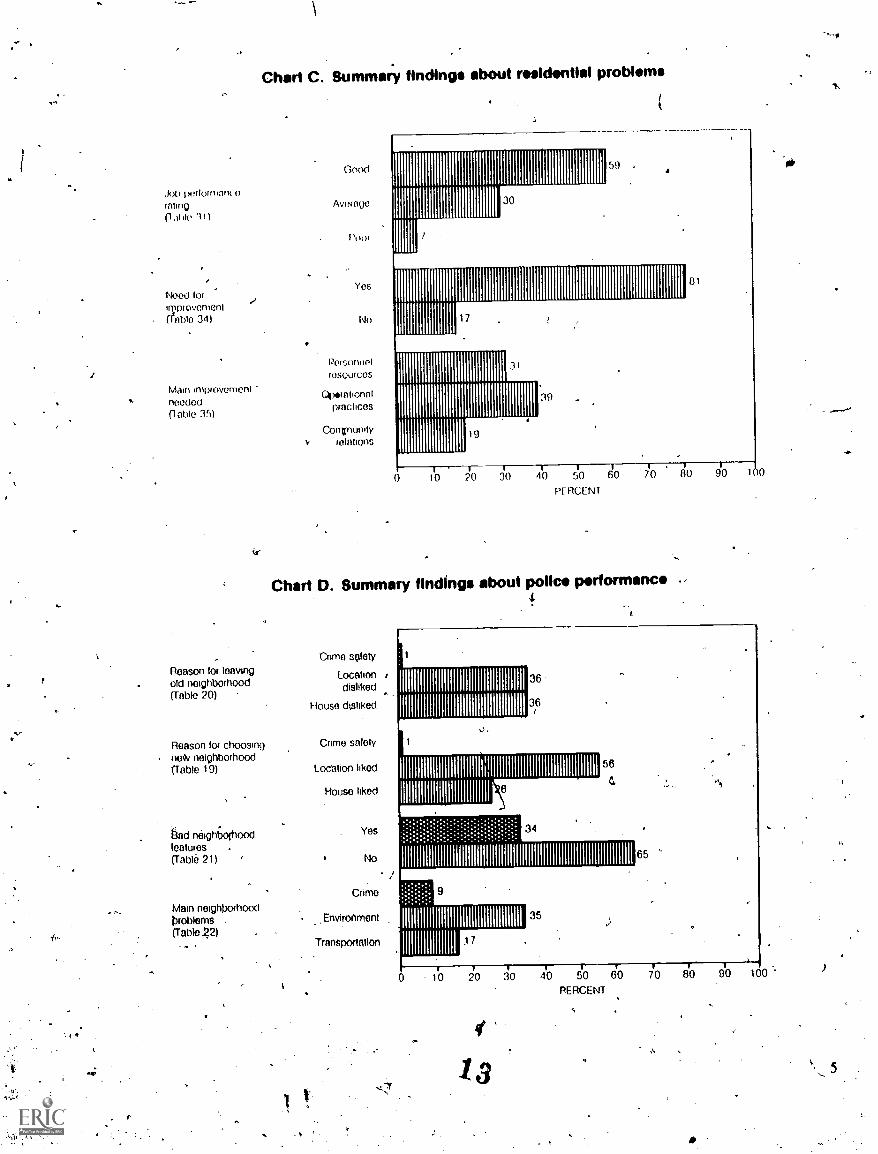
FSespondents rated the performance of the local po-lice on a scale of good, average, or poor. More thanhalf of the city's residents (59 percent), evahmted theperformance as good, 30 percent felt if 'was average,and 7 percent claimed that it was poor. The remainini4 percent had no opinion on the matter. Virtually no'.difference was noted between the assessments providedby men and women, but this was not true of ratingsgiven by residents differentiated by race, age, or vic-timization experience.
Except among blacks and among persons under age25, a majority in all of the population groups tinderstudy rated the performance of the local police asgood, and even blacks and persons under 25 over-
9
whchmogly ihought the pert ormance to be at leastaverage
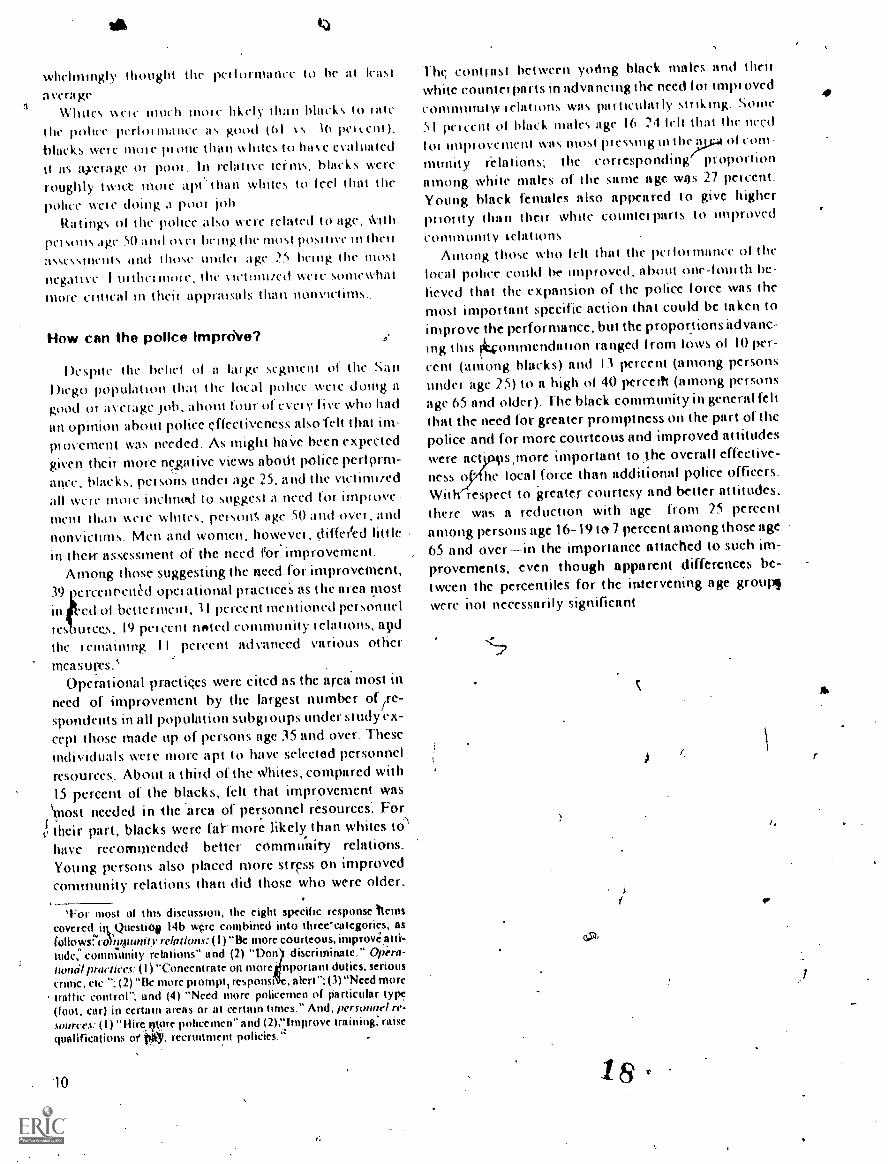
Vlutcs %%cu. much mole hikch than blacks to latethe polnT perloi mance as good 161 vs_ 16 pet I. Cii I ).
blacks were mole pi one than whites to have evaluatedit as axerage or pool. In relative terms, blacks wereroughly I wice more apt' Min whites to feel that thepolfte were doing a pool job
RatIngs ol the police also were related to age. it h
pci sons agc 50 and ovel being the most positive in theirassessments and those undel age 2.s being tlw mostnegative_ I ni thci mow. the \let inured % Ci e somewhat
more critical m them! zippraisals than nonvictims..
How can the police Impro\fe?
Despite the behel 01 a Loge segment of the SanDiego population that the local police wete doing agood or average rob, allow four of every five who had
an opinion about police effectiveness also felt that im-
provement was needed. As might haVe been expected
given their more nezative views abotit police pert orm-ance. blacks, persons under age 25, and the victimuedall weic mole inclined to suggest a need for improve-ment than w (-le whites, pet son!, age SO and over , and
nonvictims. Men and women, however, differted littlein their assessment of the need for improvement.
Among those suggestMg the need for improvement,39 )ercenvettM operational practice's as the area most
in .ed ol bettelnle111, 3 I percent Mentioned personnel
les rurccs. 19 percent noted community telations, ttpd
the remaining 11 percent advanced various other
measUrts. ,
Operational practices were cited as the area most in
need of improvement by the largest number of/re-spondents in ail population subgroups under study ex-
cept those made up of persons age 35 and over. Thesemdividuals were more apt to have selected personnelresources. About a third of the Whites, compared with15 percent ol the blacks, felt that improvement was'most needed in the 'area of personnel resources For
tI, iheir part, blacks were fal- more likely than whites tO.'
have recommended better cOmmunity relations.Young persons also placed more stress on improved
community relations than did those who were older.
Tor most of this discussion, the eight specific response Itemscovered,..ittpuestiO. l4b wcrc combined into thrcc'eategories, asfollows: co)wponity relations: ( I ) "Be more courteous, improve' atti\-tialc,- community relations" and (2) "Don discriminate," Opera-licnuil pratliees: (1) "Concent rate on more nportant duties, seriouscrime, etc.": (2) "Ik more pi ompt, responsi , alert ":(3)"Need moretraffic control"; and (4) "Need more policemen of particular typc(foot, car) in certain areas or at certain times." And, perswinel re-source.s: (1) "Hirer qt9re policemen" and (2),"Improve training, raisequalifications or Niy. recruitmeot policies."
10
Thc contrast between yoring black males and theirwhite counterparts in advancing the need lot implovedcommumtw relations was particular ly sir iking. Some
51 pei cent ol black males age 16 :24 telt that the need
len impiovement was most pi essing iii theimj.:4 of cow
munity relations; the corresponding proportionamong white males of the same age was 27 percent.Young black females also appeared to give higherpitority than their white COUntel parts t 1111proved
community selationsAmong those who felt that the peitormance ol the
local police could be improved, about one-tomtit be-
lieved that the expansion of the police force was the
most important specific action that could be taken toimprove the performance, but the proportions advanc-
ing this r4onunendation ranged 1 rom lows ol 10 per-
cent (among blacks) and 13 percent (among personsunder age 25) to a high of 40 pereeitt (among persons
age 65 and older). The black community in general felt
that the need for greater promptness on the part of the
police and for more courteous and improved attitudes
were act ts,more important to ,the overall effective-
ness o54hc local force than additional police officers.With respect to greater courtesy and better attitudes.
there writ; a reduction with age from 25 percentamong persons age 16-19 to 7 percent among those age
65 and overin the ,importance attached to such im-provements, even though apparent differences be-
tween the percentiles for the intervening age groups
were ilot necessarily significant
Appipmax
Survey data tables
The 37 statistical data tabks in this appendix presentthe results of the San Diego attitudinal survey con-ducted early in 1974. Thcy are organized topically, gen-erally paralleling the report's analytical discussion. Foreach subject, the data tables consist of cross-tabulationsof personal (or household) characteristics and the rele-vant response categories. For a given population group,each table displays the percent distribution of answersto a' question. .
All statistical data generated by t c survey are esti-mates that vary in their degree of çliability and arcsubject to variances, or errors, associated with the factthat they were derived from a sample survey ratherthan a cothplete enumeration. Constraints on interpre-tation and other uses of the data, as well as.guidelinesfor determining their reliability, are set forth in Appen-dix ill. As a general rule, however, estimates based on'zero or on about 10 or fcwcr sample cases have beenconsidered unieliable. Such estimates, qualified byfootnotes to the data tables, were not uscd for analyti-cal purposes in this report.
Each data table parenthetically-displays the size ofthe group for which a distribution of responses was calculated," As with the percentages, these base figures arcestimates. On tables showing the answers of individualrespondents)(Tables 1-18 and 27-37), the figuresreflect an adjustment based on an independent post-Census estimate of the city's resident pdpulation. Fordata from household respondents (Tables 19-26), thebascs:were generated' soleipby the survey itself.
A note 1:neath each data table identifies the ques-tion that served as source of ke data. As an txpedient ,in preparing tables, certain response categories werereworded and/or ab reviate&The questionnaire fac-
14simile (Appendix hbukl be consulted for the exactwording of both the questions and the response cate-gories. For tiuestionnaire items that Carried theinstructir "Mark all that apply," thereby enabling arespondint tolurnish more than a single answer, thedata tables reflect only the answer designated by therespondent as being the most important one ratherthan all answers given.
TIN) first six data tables were used in preparing the"Crime Trends" section Of the report, Tables 7-18relate to the topic "Fear of Crithe"; Tables 19-30 cover"Residential Problems and Lifestyles"; and the lastseven tables display information concerning "LocalPolice Performance."
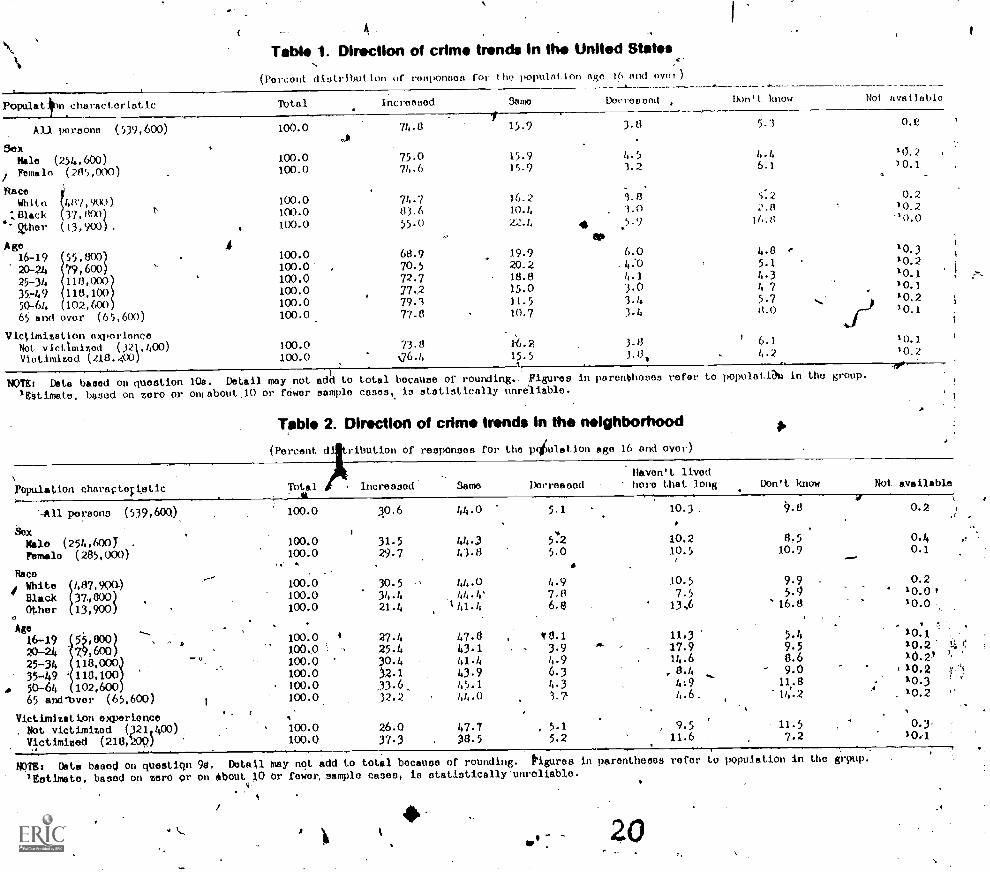
Table 1. Direction of crime trends in the United States
(Percent dlatrIbutIon or roma-moos for tho population ngo 16 and oval)
Populatibn charactoriatle Total Incroanod 8amo Docroasod , Don't know Not nvallablm
/Ali portsona (539,600) 100.0 74.8 15.9
wil
3exHale (254,600) 100.0 75.0 15.9
/Female (2)15,000) 100.0 711.6 15.9
,
RaceWhite 487,900) 100.0 74.7 16.2
relack 37,800) 100.0 83.6 10.4
her (13,900). 100.0 55-0 22.4 4
Age 416-19 55,81 100.0 68.9 19.9
20-24 79 100.0 70.5 20.2
25-3h 118,000 100.0 72.7 18.8
35749 118,100 100.0 77..2 15.0
50-64 102,600 100.0 79.1 11.5
65 and ovor (65,600) 100.0. 77.8 10.7
Vicpnization experlenceNot victlmited 021,400) 100.0 73.8 16.2
Vietimized (218.00) 100.0 76.h 15.51
3.8 5-3
4.5 4.4
1.2 6-1
1.8 5.2
1.0
.5-9
6.0
.4:0 5.1
164::
4.1 4.33.0 4 7 .
3.43.4
Jr-)
3.8 ' 6.1
3.0, , 4.2
refer to populatiN in the group.
0.0
10.210.1
0.210.2
10.310.210.110.110.210.1
10.1
10.2
-40)
NOTE: Data booed on question 10a. Detail may not add to total becarrae or roundimg.. 7igures in parenbheses
'EStimate, boned on zero or Onobout,10 or fewer eample cases, is statistically unreliable.
170611, 2. Dhrection of minim trencMs In the neighborhood
(Percent ditribution of responses for the p4ulat1on age 16 and over)
A
Population charaptn1stic Total 1 Increased Same DecreaoedHaven't livedhere that long Don't know Not availab)e
'All persons (539,600) 100.0 30.6 44.0 5.1 10.3 .9.8 0.2
SoxNolo (254,600j . 100.0 31.5 44.3 572 10.2 8.5 0.4Fmeale (285,000) 100.0 29.7 41.8 5.0 10.5 10.9 0.1
%co, 4
0 White 487,9Q0.) 100.0 30.5 44.0 4.9 10.5 9.9 .0.2
Black 374800 100.0 34.4 7.8 7.5 5./
Other 13,900) 100.0 21.4 131.1, 6.8 13s6 * 16.8 10.00
Age ,_16-19 55,800 . - . 100.0 4 27.1, 47.8 I 8.1 11,3 5.4 10.1
20-21, Z9,600 100.0 25.4 43.1 3.9AO. 17.9 9.5 10.2
25-34 118,000 100.0 30.4 41.4 /3.9 1/,.6 0.6 10.V35-49 118,100 100.0 )2.1 43.9 6.3 , 8.4 9.0 10450-64 102,600 100.0 33.6. 45.1 4.3 11.8 10.3
65 and -bver (65,600) 100 . 0 32.2 44.0 1-7 14. 2 . 10.2
Victimizatim ex:WI-Once A
/ist victimized (321,400) 100.0 26.0 47.7 , 5.1 9.5 11.5 0.3
Victimized (218,09) 100.0 37.3 . 38.5 5,2 11.6 7.2 10,1
MTEr Data based on questiqn 9. Detail may not add to total because of rounding. Pigures in parentheses refer to population in the grpup:
I-Esti/nate, based on zero or on about 10 or fewer, sample cases, in statistically-unreliable.
)4w 20
.4
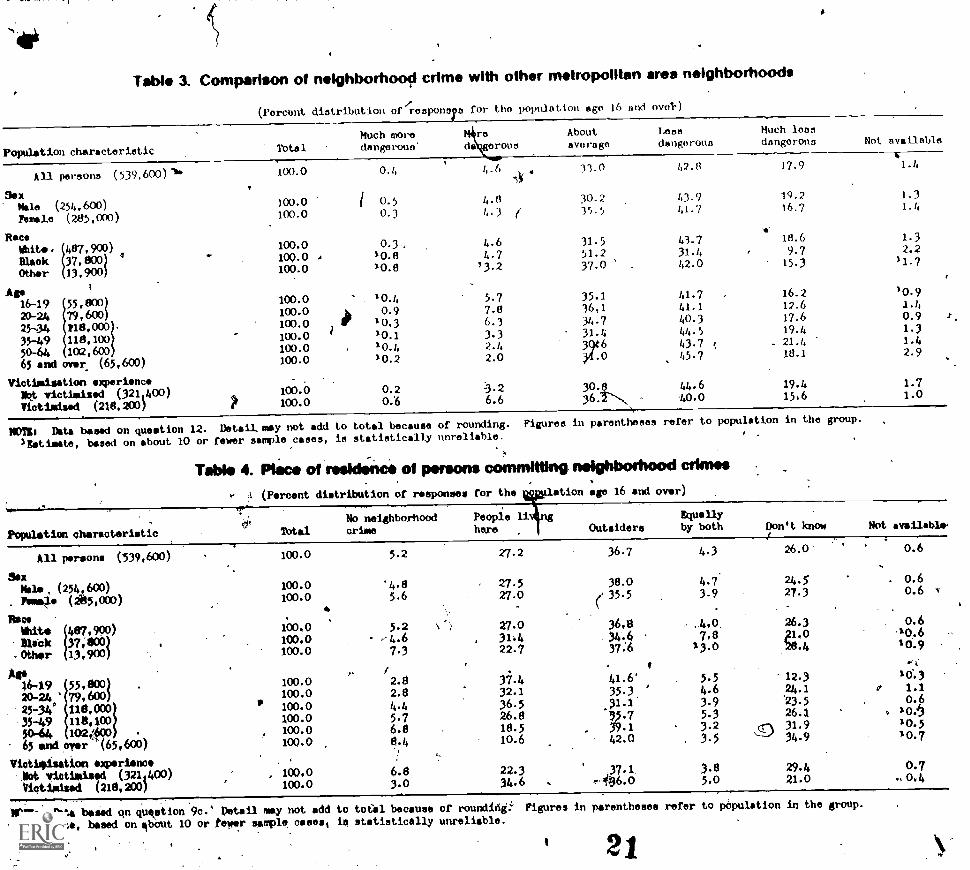
Table 31. Comparison of rielgtdocrilood crime with other rnetropolitem area neighborhoods
(Percent distribution ofcosponor for tho population ago 16 and ovol-)
Much more
Population characteristic Total dangoroun'
All persona (539.600)1*
Sexlisle (254,600)
Female (285,000) 100.0
Race
13
Whit..Black 37,800)Otber ,900)
4
!
Age16-19 55,81 100.0
20-24 79,600 100.0
1
00102,600
25-44 ,100.0
35-49 118,1 100.0
50-64 100.0
65 and over (65,600) 100.0
Viothmisation experienceMgt victimised (321,400) 100.0
Victimised (218,200) 100.0
100.0
100.0 1
100.0100.0 A
100.0
About Lens Much loss
avorage dangerous dangerous Not available
0.4 4.6 . 13_0 42.8 17.9 1 . 4
0.5 4.8 30.2 43.9 19.2 1 3
0.3 19-3 35.5 41.7 16.7 1.4
0.3. 4.6 31.5 43.7 18.6 1.3
10.8 4.7 51.2 31.4 9.7 2,2
10.8 13.2 37.0 . 42.0 15.3 11.7
10.4 5.7 35.1 41.7 . 16.2 10.9
0.9 7.8 36,1 41.1 12.6 1.4
10.3 6.3 34.7 40.3 17.6 0.9
10.1 3.3 31.4 44.5 19.4 1.3
10.4 2.4 39t 6 43.7 i - 21.4 1.4
10.2 2.0 ,34.0 45.7 18.1 2.9
0.2 30.8 44.6 19.4 1.7
0:6 6.6 40.0 15.6 1.0
NOlts Data based on question 12. Detail msy not add to total because of rounding.Figures in parentheses refer to population in the group.
IBitisate, based on about 10 or fewer sample cases, is statistically unreliable.
Tabie 4. Row of nosidena of weans committing. neighbothood aim*,
(Percent distribution of responses for the *Lion age 16 and over)
PopulatiOn characteristic0'
No neighborhood People li &Pm 1-14'
Taal crime hare Outsiders by both Don't know Not available.
All persons (539,600)
Sex)ile, (254,600)
. Neale (265,000)
Race*itslatok 37401 .
Oth.: 13.900
AV
1
16-19 55,800320-24 79,600
25-34°35-49 1184635044 102;600 .
65 and arm (65,600)
Victioisation experience-.1Pot !victimised (3211400Victisised (218,200)
100.0
100.0100.0
5.2
4.85.6
27. 2
27.527.0
36.7
38.0(. 35.5
4.3
4.73-9
26.0
24.527.3
0.6
. 0.60.6 4
371: 04
100.0 5.2 ,-) 36.8 , _4,0. 26.3 . 0.6
100.0 - -.4.6 34.4 7.8 p1.0 .10.6
100.0 7.3 22.7 37:6 13.0 126.4 16.9
i, I
100.0 2.8 3i.4 41.6' 5.5 12.3 16.3
100.0 2.8 32.1 35.3 4.6 24.1 e 1.1
IP 100.0 4.4 36.5 .31.1' 3.9 .23.5 0.6
100.0 5.7 26.8 5.3 26.13.2 cr-- 31.9
, 106
100.0 6.8 18.5 ;;:i 10.5
100.0 $.4 10.6 42.0 3.5 ""=-' 34.9 10.7
100.0 4.8 22.3 .37.1. 3.8 29.4 0.7.
100.0 3.0 34.6 1.-46.o 5.0 21.0
.
VDU: NU based qn quSstion 90.' Detail may not add to total because of roundilie Figures in parentheses refer to pOpulation in the group.
11St1sste, based on 4bOut 10 or fewer sample oases, ie statistically unreliable.
et
Table I. anew he Ow clumo46 el Ming ~hod or(Percent distribution of responses for the population age 16 and over)
Population'eharecteristie Total Poing up Seem Going down No opinion Not available
All persons (539,600) 100.0 51-5 36.9 6.9 2-5 0.3
SexMale (254,600)Female (285,000)
Rico
.,
White.81eckOther
37,80113,900
Ago16-19 55,80020-24 79,603325-34
3549 118,10050-64 102,60065 end over (65,600)
Victimisation experiencelot victiedsed (3211400)Victtateed (218,200)
100.0100.0
.
.
100.0100.0100.0 .
47.455,1
.
N2.4
47.830.8
41.636.5
38.638.848.7
6.75.2
.
.6.5
9.711.3
100.0. 39.5 46.7 12.3,
100.0 43.9 43.3 10.1
00100.01.0
51.156.6 . .,
40.335.5 a
6.95.2
100.0 511.4 ' 33.7 4.7400.0 51.4 38.6 4.6
100.0 48.7 41.5 6.4100.0 ' 55.6 351 7-5,
...
2.0 0.32.9 0.2
.
.2 0.3
.
3 2-
9
p0.510.0
1.4 10.12.1 10.5
2.5 10.11.4 .10.3
2.8 10.35.1 10.3
3.1 0.31.6 0.2
sync: Data beild on question 15a. D0411 may not add to total because of rouading. Figmres in parentheses refer to populAtion in the group.lEstimate,
obased on zero or on about ro or fewer 'Semple oases, is statilticany unreliable.
o . - I. .
'
22
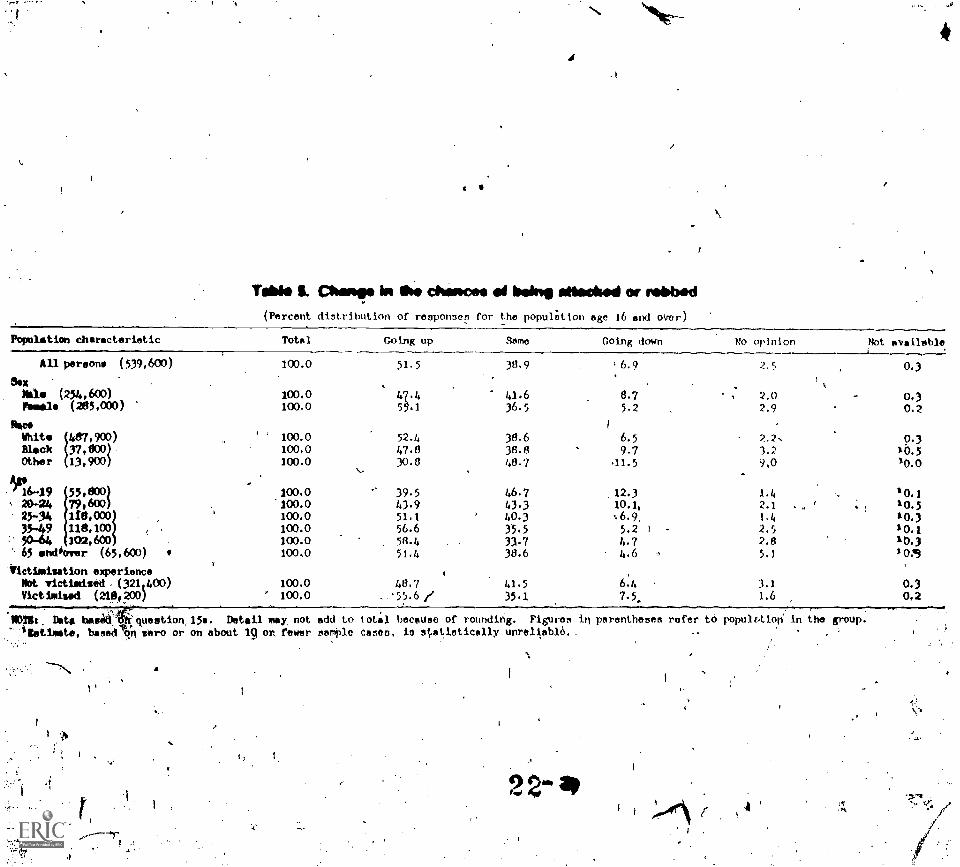
Table I. Mawr, he illo chsoces Wing ~lied tor raiPbd(Percent distribution of responsep ('or the populOtion age 16 and ()Ver.)
Population characteristic
All persons (539,600)
lakle (254,600)Forel. (285,00D)
IkeaWhite 487,900)Bleck 37,800)Other 13,900)
9 55400)t 20-24 79,600)25-34
3349 118,100r.
;' 5044 102,600' 65 andbover (65,600)
-Victimisation experienceNot victimised, (321,400)Victimised (218,200)
Total Going up Same Going down No opinion Not availeble
100.0 51.5 38.9 t6.9 2.5 0.3
100.01;;:
41.6 8.7 2.0 0.3100.0 36.5 5.2 2.9 0.2
1
100.0 52.4 38.6 6.5 2.2. 93100.0 47.8 38.8 .
9.7 3.2 10.5100.0 300
.,,_.
48.7 .11.5 9,0 10.0
100.0 39.5 46.7 12.3 1.4 10.1100.0 43.9 43.5 10.1, 2.1 10.5100.0 51.1 40.3 1.4 10.3100.0 56.6 35.5 5.2 ) 2.5 1 0.1
100.0 . 58.4 33.7 4.7 2.8 10.3
100,0 51.4 38.6 4.6 5.1 1 0.9
100.0 48.7 41.5 6.4 . 3.1 0.5100.0 . 55.6 I' 354 7.5. 1.6 0.2
MIXt,D0.0biamidquestion. 15a. Deteil may not add to total because of rounding. Figures in parenthesen refer te populaioli in the group.
.4tetinate, based (In zero or on about 19 OA fewer sample cases, is al.stiatically unre1ab16.,
a
,p
411
C,;)
Table lietiousne4 61 Crime problem relettve(to whet newspapers end teterlslon report(Percon'Oistribution of reeponbee for the population age 16 and over)
Population chcracteriatic TOtel
Ail persons (539,600)
SOXWale (254,600)Female (285,000)
AlecWhiteBlack 37,800)Other 13,900)
Age
20-24 79,60016-19 55,8001-
i
25-34 118,000
3g194. 116,100
100.0100.0
100.0100.0100.0
100.0100.0
5 102,60J 100.0
100.0100.0.
65 and over (65,600)
Victimisation experienceNot victimdzed (321,400)Victimised (218,200)
100.0100.0
Lees berioue Same Moro serious No opinion . Not available
13.5 49.94.
)1.7 4.5 0.4
16.1 47.6 31.4 4.6 0.311.2 52.0 32.0 4.3 0:6
13.3 50.4 31.4 4.5 0.513.8 45.9 37.3 2.6 10.518.7 46.o 27.6 7.8 10.0
17.4 48.4 30.5 3.3 10.3
16.5 47.1 32.0 3.8 10.5
14.0 49.8 32.9 2.9 10.3
13.0 51.1 30.8 4.9 10.2
11.3 49.7 33.4 5.0 0.6
9.8 53.1 29.0 7.3 0.8
A
13.3 51.5 29.1 5.5 0.6
13.7 47.6 35.5 2.9 10.2
NOTIes Data baeed onlqueetion 15b. Detail may not add to tota1 because of rounding. Figures in parentheees refer to population in the group.
atimete, based oil zero or on ebout 10 or fewer sample Icaeca, 15 statistically unrelAable.
4
?3
0
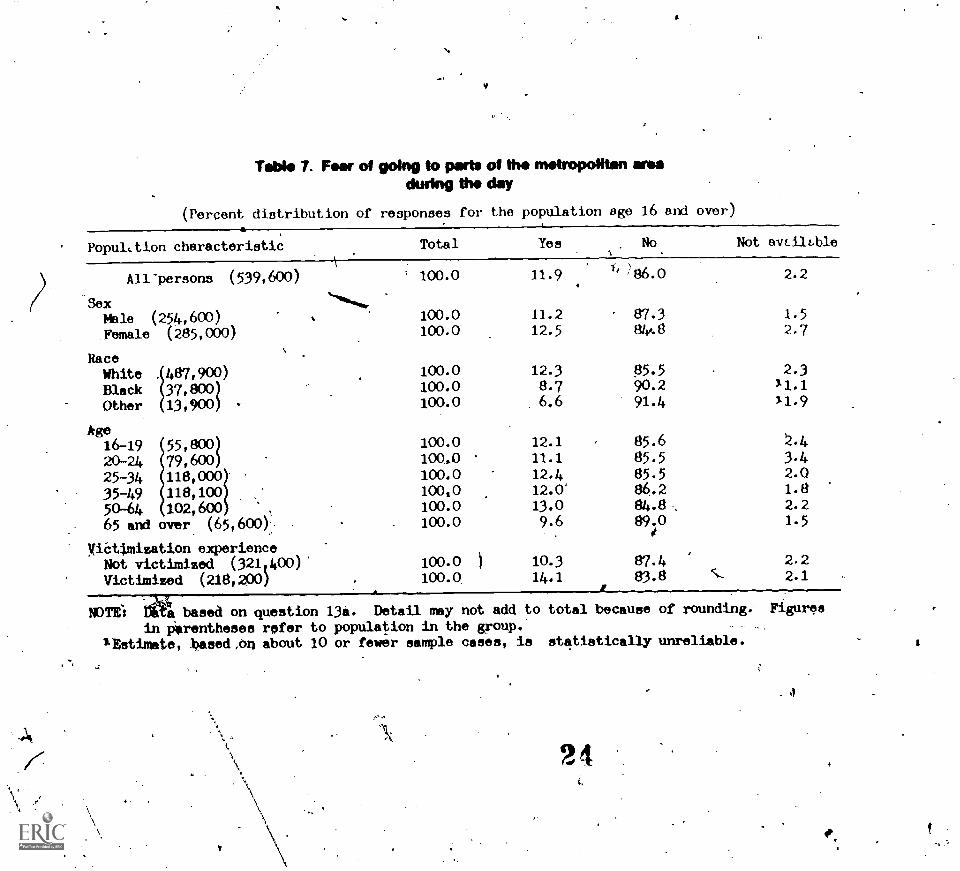
Table 7. Fear of %ping to parts of the metropolitan areadudng the day
(Percent distribution of responses for the population age 16 and over)
Popule.tion characteristic Total Yem No Not avLilt.ble
All-persons (539,600) 100.0 11.9 86.0 2.2
3ex_
Mhle (254,600) s 100.0 11.2 87.3 1.5
Female (285,000) 100.0 12.5 844 8 2.7
RaceWhite .487,900) 100.0 12.3 05.5 2.3
Black 37,800) 100.0 8.7 90.2 11.1
Other 13,900) - 100.0 6.6 91.4 11.9
kge
20-24 MO . 85.5 3.4... il.i16-19 100.0 12.1 85.6
25-34 118,000 100.0 12.4 85.5 2.0
35-49 118,100 100,0 12.0 86.2 1.8
50-64 102,600 ,100.0 13,0 84.8 2.2
65 and over (65,600) 100.0 9.6 89.0 0 1.5
Vietimization experienceNot victimized (321,400)Victimized (218,200)
4NOTEi DiCA based on question 13A. Detail may not add to total because of rounding. Figures
in PArentheses refer to population in the group. _
'Estimate, tased,On about 10 or fewer sample cases, is statistically unreliable.
100.0 )
100.010.3 87.4 2.2
14.1 83.8 S. 2.1
24
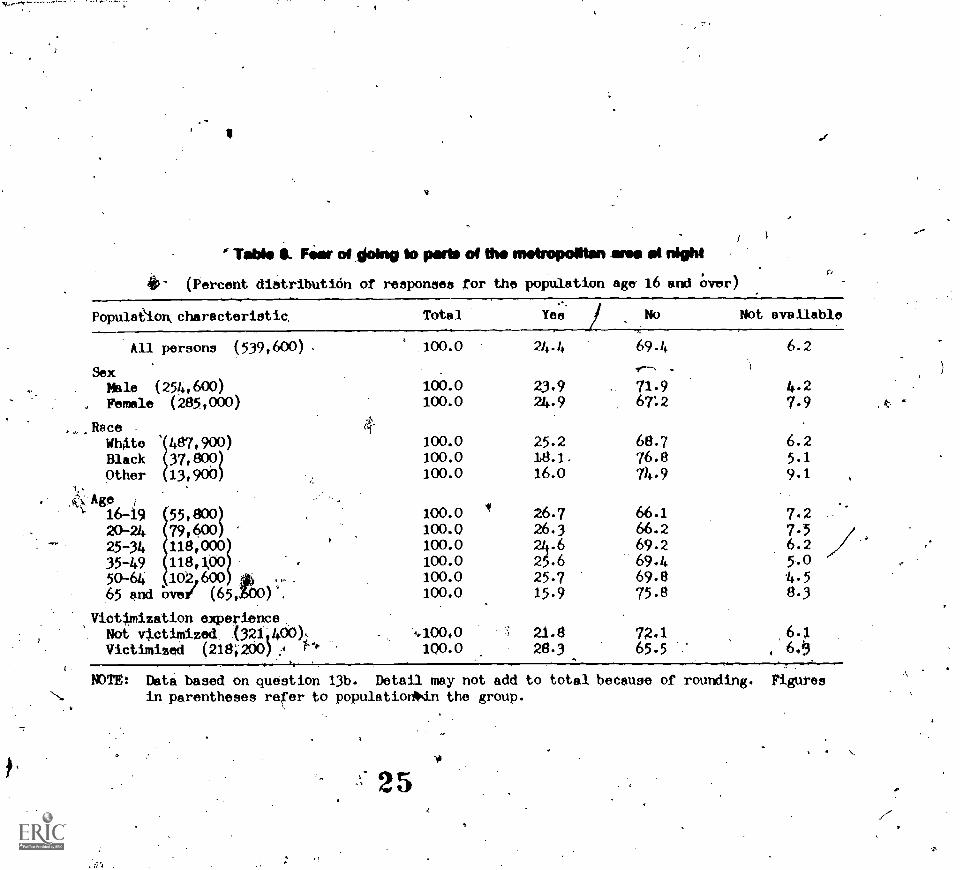
F T L Fair of licolng to parts of th metropolitan MOS Ili night
4o- (Percent diStributión of responses ror the population age- 16 and Over)
Populaioncharacteristic
All persona (539,600) .
Sex. Male (254,600)
Amalfi (285,000)
RaceWhaleBlack 37,e00 )
Other 13,900)
k), Age' 16-19 55,800
20-24 79,600
E
31,0025-34 118,0
5-49 118,0050L-64 102,600
65 and Zwei (65, .1C
Victimization experienceNot 0.ctimized (321,400),Victimized (218,200) .t 1-*
t.
4.
Total Yee No Not available
100.0 24-4 69.4 6.2
.
100.0 23.9 71.9 4.2100.0 24.9 67:2 7-9
100.0 25.2 68.7 6.2100.0 18.1. 76.8 5.1
100.0 16.0 74.9 9.1
100.0 26.7 66.1 7.2100.0 26.3 66.2 7-3100.0 246 69.2 6.2
100.0 2 .6 69.4 5.0
100.0 25.7 69.8 4.5100.0 15.9 75.8 8.3
21.8 72.1 6.1100.0 28.3 65.5
N)TE: Data based on question 13b. Detail may not add to total because of rounding. Figuresin parentheses refer to populatioriFin the group.
t
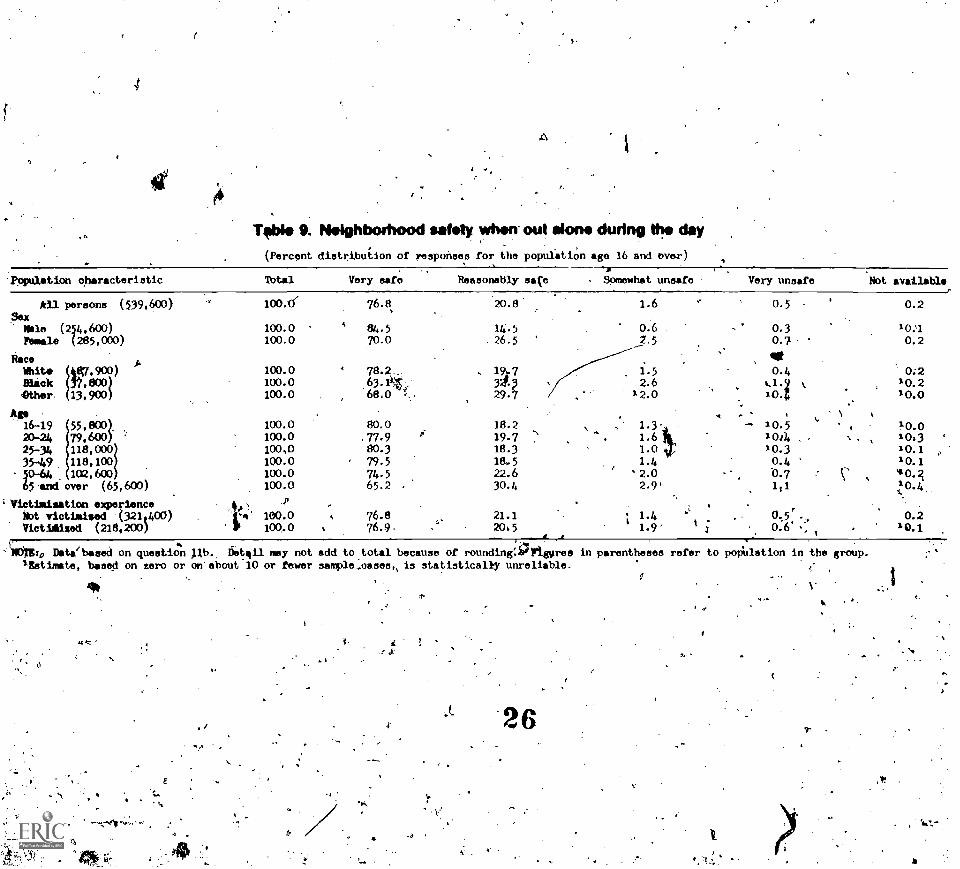
TOW 9. Pieighterhood safety when out eloneduring the day
(Percent distribuiion of responses for the populitiOn age 16 and ove.r)
Pepulation characteristic
al persons (539,600)3ex
Mole (254,600)?Wale (285,000)
twee Aik7;030907)ite
BleckWh
Other. (13,900)
Ago .
1
16-19 55,80120-24 79,60025-34 118,C00
35-49. 118,10050-64 102,60J65'and over (65,600)
'Victimisation experienceNot victimized (3211400)Victlased (218,200)
A
Total Very safe Reasonably sqe Somewhat unsafe Very unsafe Not available
100.0r
100.0100.0
100.0100.0100.0
100.0100.0
100,0100.0100.0100.0
VP
100.0100.0
4
4
76.8.
84.570.0
78.2..
.63.T1,t.
68.0 t...
80.0. 77.980-379.5
74.565.2
76.876.9
20.8
14.5. 26.5
- 191.732'.
29.7
18.219.7
.
18.318.522.630.4
21.120.5
1.6
0.62.5
l .5
2.6
, 12.0
. -,." 1.3'...
.. 1.6. 1.0 ist:
1.4'2.02.9'
; 1.41.9'
"
3
..
-
0.5
0.30.7
qg0.4
.0.i10.
-10.51 0,410.30.40.71,1
0.5r0.6
k
,1
0.2
10:10.2
0;210.210.0
10.0101310.110.1
10.4
0.2
a 3
't1076:0 Deta'bosed on questiOn ostRil may not add to total because of rounding:geigvree in parentheses refer to poPUlation in the group.'Estimate, based on zero or on'about 10 or fewer sample...oases, is statistically unreliable. /
'
-
4 .( 26
4 .3
1'
7.
r
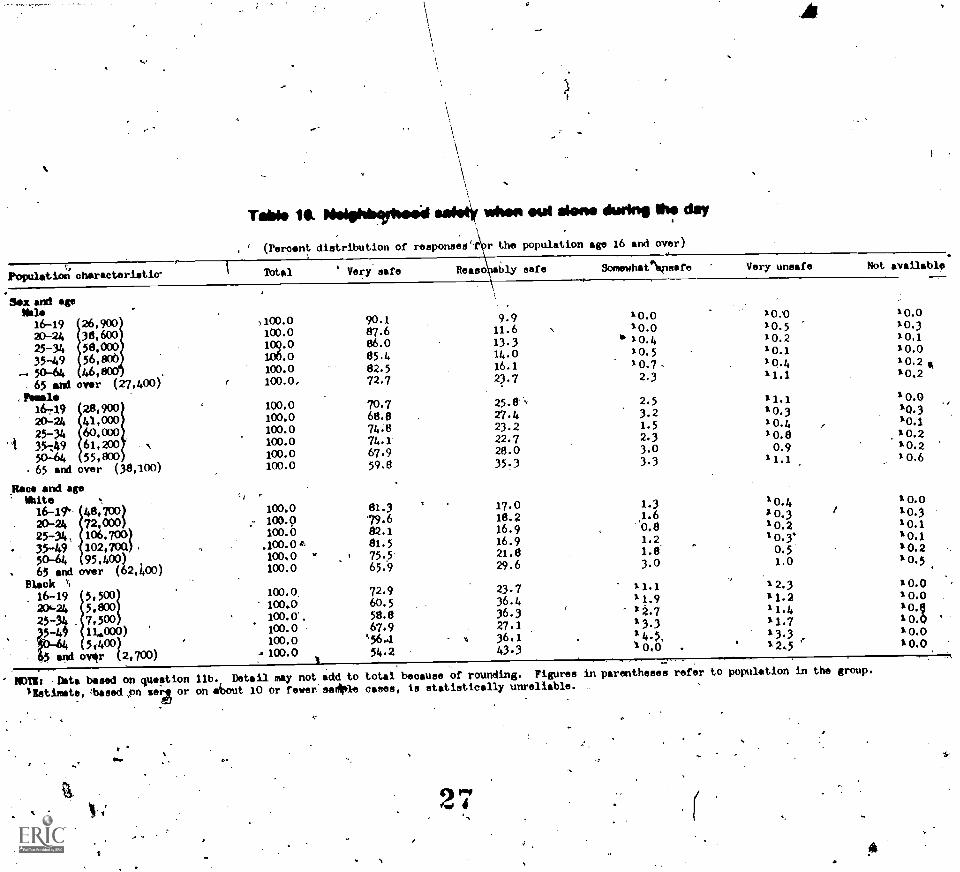
Table iS Meighbylwid sateiii wimp out dem &eine the day
' (Percent distribution of reeponee sr the population age 16 and over)
Population characteristic'
8ex and age16 le
116-19 26,90020-24 38,60025-34 56,00035-49 56.000
- 50-64 46,600 .
65 and over (27,400), heals
1
16-719 28,90020-24 41,00025-34 60,000
A 35749 61,20050-64 55,80065 and over (38,100)
_Reel and ageWhite s.
16-17- 48,700 )
1
20-24 72,000)
35-49 102,703,25-34, 106.w0
(1
50-64 95.400). 65 and over (62,400)
Black ,,
16-19206,24 5,80025-34 . 7,5005-0 n.000)
51400)5 and ov4r (2,700)
Ibtal Verisafe Rosso bly safe Somewhat"Mpeafe Very unsafe Not available
\
')100.0 90.1 9.9100.0 87.6 11.6109.0 86.0 13.3100.0 85.4 14.0100.0 82.5 16.1100.0, 72.7 2?.7
100.0 70.7 25.8100.0 68.8 27.4100.0 74.8 23.2100.0 74.1 22.7100.0 67.9 28.0100.0 59.8 35.3
100.0 81.3 17.0100.9 479.6 18.2,-100.0 82.1 16.9
100.04% 81.5 16.9100.0 ,, 75..5 21.8100.0 65.9 29.6
100.0 72.9 23.7100.0 60.5 36.4100.9 . 58.8 36.3100.0 67.9 27.1100.0 '56.4 3 36.1
- 100.0 t 54.2 43.3
%
1 0.01 0.0
6 10.40.5
1 0.72.3
2. 53.21.52.33.03.3
1.31.60.81.2 ,1.83.0
1 1.11 1.912.71 3.314.5,1 0.0
10.'010. 510. 210.110.41 1.1
1 1.11 0.310.410.8
0.91 1.1
1 0.410.310.210.3'0.51.0
1 2.31 1.21 1.41 1.713.3 ,
10.01 0.310.110.010.2 ot10.2
1 0.0f
10.310.11 0.21 0.21 0.6
1 0.00.3
10.110.110.21 0.5
10.01 0.010.01 0.010.010.0
Data based on question 11b. Detail may not. add to total becauee of rounding. Figures in parentheses refer to population in the group.'Estimate, ,based ,on seri or on dbout 10 or fewer sa4le cases, is statistically unreliable. _
..''."
2 4
7
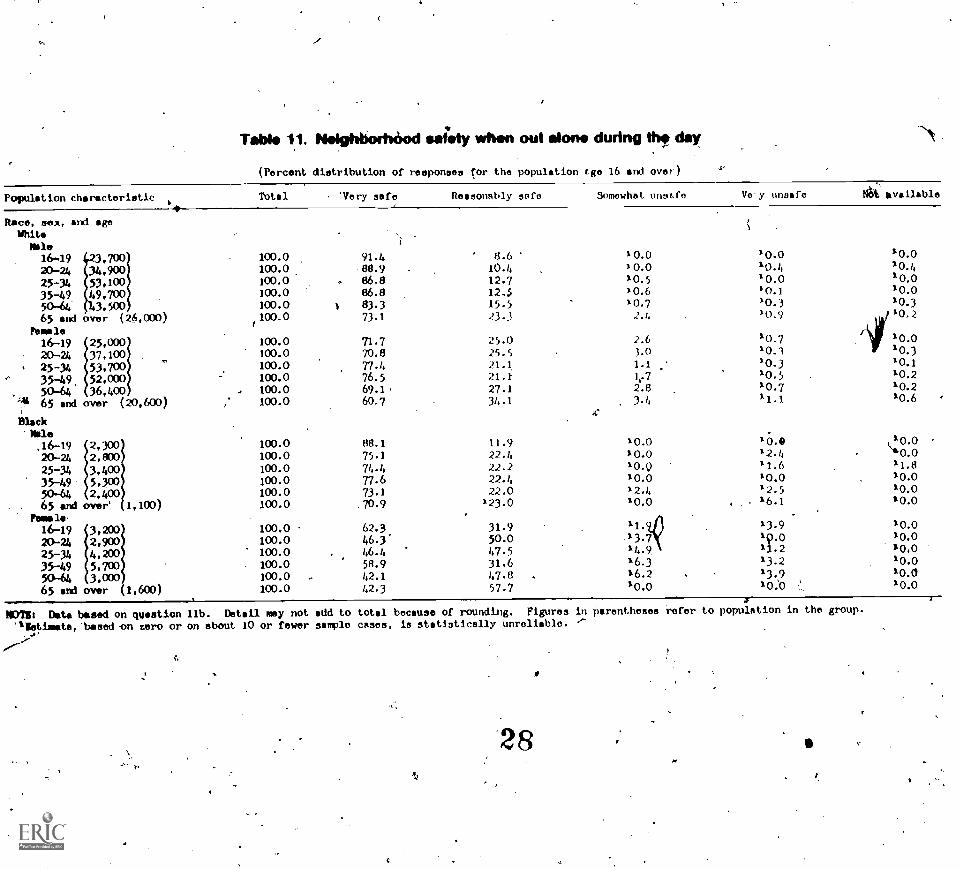
Table 11. Neighborhood saiaty when out alone during th? day
(Percent distribution of responsea for the population qv, 16 and over)
Population characteristic
Race, sex, and ageWhite
Male
16-49 3,70020-24 34,900
25-34 53,100
35-49 49,7005044 Z3,50065 and Over (26,000)
Female
35-49, 52,000,. 5044 36,400
* 25-34 53.700
20-24 37,10016-19
65 and over (20,600)1
Black-Nile
35-49- 1:34gg
i
,16-19 2,30020-24 240025-34 3.400
65 and over' 1,100)Paaale.
16-19 3,200
i
20-24 2,90025-34 4,200
35-49 5.7005044 3,00065 and over (1,600)
a-
NOM Date based on question 11b. Detail may not add to total because of rounding. Figures in Parentheses refer to population in the group.
'Illatimete,'based .on zero or on about 10 or fewer sample cases, is statistically unreliable. '-
...,'-
Total 'Very safe Reasonably 3nfo Somewhat unstfo Vo-y unsafe Nh available
100.0100.0100.0100.0100.0
,100.0
100.0100.0100.0100.0100.0100.0
100.0100.0
100.0100.0100.0100.0
100.0100.0100.0100.0100.0100.0
91.488.986.886.8
83.373.1
71.7
70.8
77.476.5
69.1,60.7
88.1
75.1
74.477.673.1
.70.9
62.346.346.4
58.942.1
42.3
8.610.412.712.515.5
23-3
25.025.521.121.127.1
34.1
11.922.4
22.222.422.0
123.0
31.950.0
47.531.647-857.7
10.010.010.510.610.72.4
2.63.0
1.1
2.6
3.4
10.010.010.910.012.410.0
11.
13.714.916.316.210.0
.
10.0
10.410.010.110.310.9
10.710.310.)10.510.711.1
.
10.012.411.610.012.5
, . 16.1
13.919.011.213.2
13.9100
10.010.i,10.0.0.0p0.3
10.010.310.1
10.210.210.6
tl0.0N10.011.810.010.010.0
10.010.010,010.010.010.0
28
41.1
)
Table 12. NelghbooliOod safety when out alone at night
(Percent distributiOn of responses (or the population age 16 and over)
Population chareotoriitic Total Ve.ry safe Reasonsbly sa(e
,
Somewhat unsafe Very nnsafe .
All persone 1539/600)
Seit
11110 (24,600) .
Panels (285,000)
PfeeMit 2,87,9013)81 37.8)3)Othe 13,900)
.,
S4
.11116419;;:igg
' . ;5-34 118,000
' 35-49 118,100
2 9044 102,600650ind over (65,603)
Victimisation experiencevictinised (324,/00)
Victimised (218,200)
\,.
.
.
d
100.0
100.0100.0
100.0100.0100.0
100.0100.0A00.0100.0100.0100.0
100.0100.0
'
,32.5
47.618.7
33.025.830.9
37.734.935.956.1
28.219.3.
32.133.1
..ir
40.8
42.339.4
..,
40.5
42.746.9
38.440.0
-.
44.043.541.033.0
41.439.8
.
16.7
7.225.3
16.718.113.0
16.517.714.613.018.623.5
16.716.8
*
4.6
2.615.9
9.412.1
9.3
.., '7.37.2
5.47.111.7
23.6
9.310.1
Not evaileble
I
0.4
0.3 ,
0.5
0.3"'-'2 11.2
10.0
10.110.3. A10.2
.10.4 e.0.5 .
10.7
0.5%0.2'
xNOTZ: Date baamd on queettiOn lle. Detail may not add to total because of rounding. Figures in parentheses refer to
population in the group..
).Eatimate, belted pA zero or on about 10 or-fewer sample cases, kis statistically unreliable.
-
29
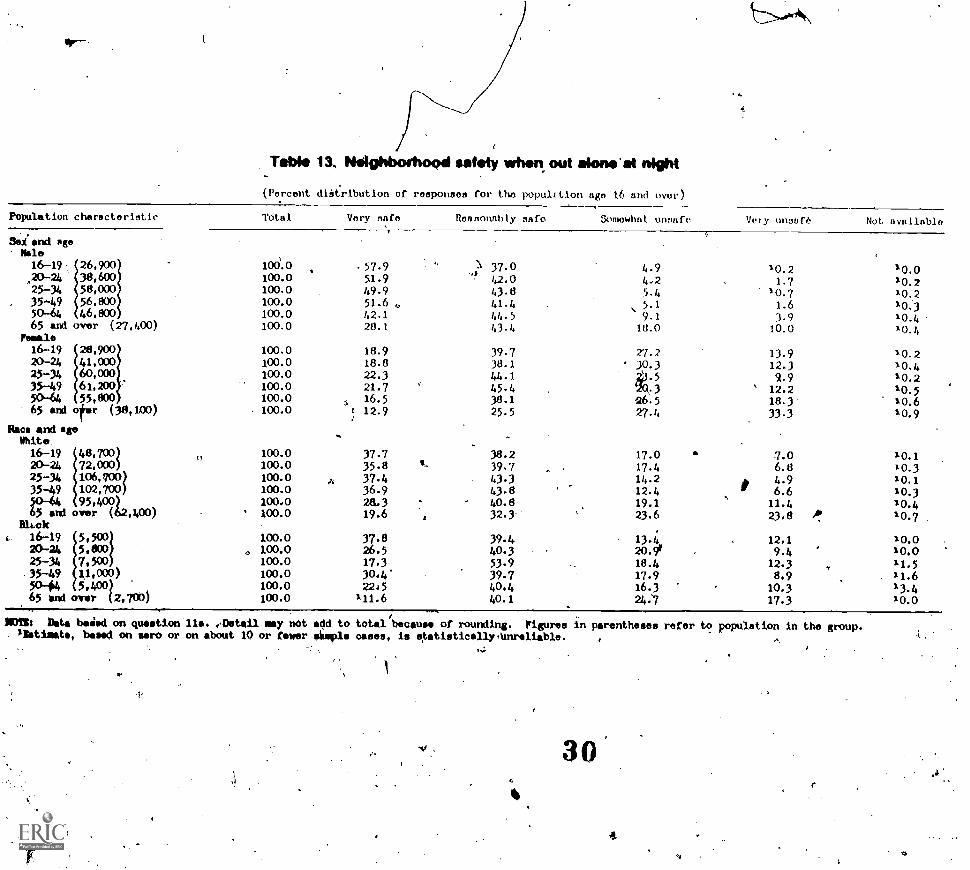
4
4
Table 13, Neighbothood safety when, out alone' at night
(Percent diat:ribution of responses for (he populztion ago 16 and over)
Population characteristic
&land ageMale16-19 26,900
i
,20-24 38,60025-34 58,000
35-49 56,0005044 46,80065 and over (27,400)
Pamela
i
16-19 28,90020-24 41,00025-34 60,000
35-49 61,20050-64 55,80065 and /far (38,100)
Race and ageWhite16-19 48,70120-24 72,000
i50-64 95,400)
25-34 106,700)
35-49 102,7010)
65 and over (62,400)BUck
.35-49 i1,000)
2D-24 5,60016-19
25-34 7,500
5044 5,400)65 and over (2,700)
Total Very safe Reasonably safe Somewhat unosn. Viy uneafè Not available
c)
'
1 Di 0100.0100.0100.0100.0100.0
100.0100.0100.0100.0100.0100.0
100.0100.0100.0100.0100,0100.0
100.0100.0100.0100.0100.0100.0
.
.4
.57.951.949.9
n.28.1
18.918.822.321.7
12.9
37.735.837.436.928.319.6
37.826.519.330.4.
2245111.6
I,
14
37.0
42.043-841.444.543.4
39-738.144.145.438.125.5
38.239.743.343.840.832.3
39.440.353.939.740.440.1
4.94,25.45.1
9.118,0
27.2' 30.3
5
126.5
27.4
17.017.414.212.4
19.123.6
13.420.91
18.417.916.324:7
10.21.7
10.71.67.910.0
13.912.3
9.912.218.3
33.3
7.06.8
4.96.611-423.8
12.1
9.412.38.9
10.3
17.3
ft
,
10.010.210,210.310.410.4
10.210.410.210.510.610.9
10.110.310.110.3
10.410.7
10.010.011.511.6
13-410.0
MEM Data boded on question lla. :Detail may not add to total/
because of rounding. Figures in parentheses refer to population in the group.nstiaste, based on zero or on about 10 or fewer sample oases, is statistically,Unreliable. ,
30'
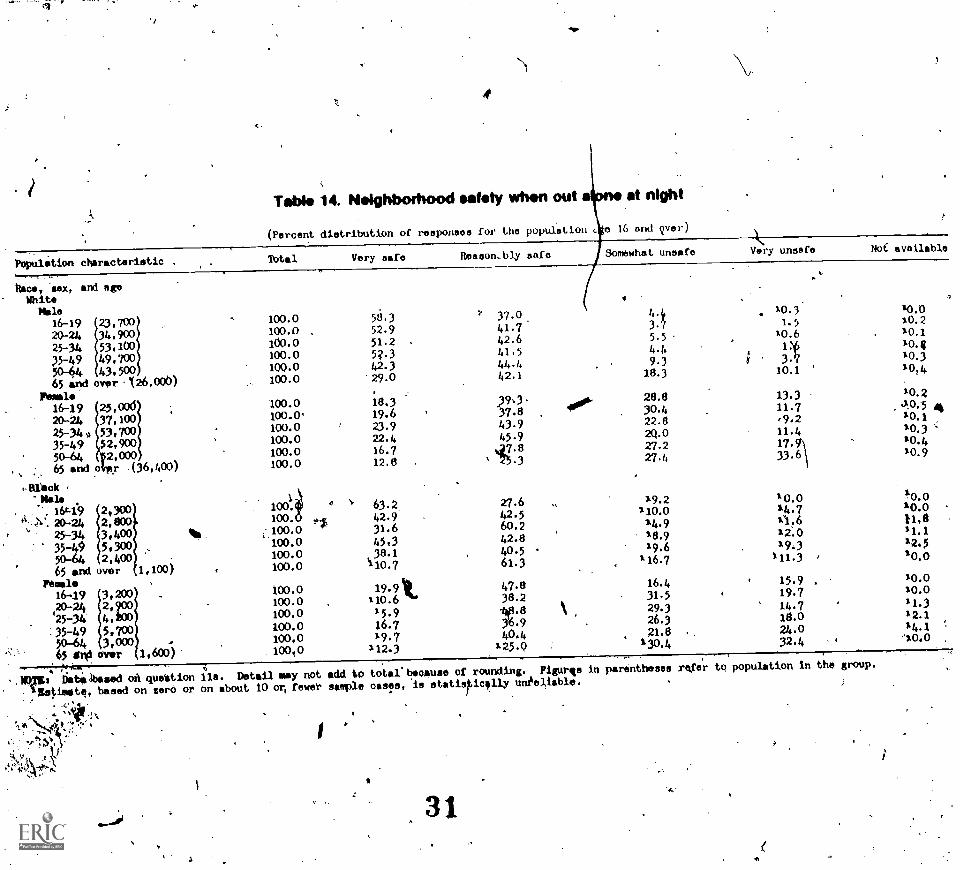
.
4
Table 14. Nolghborhood safety when out at night
(Percent diatribution of reaponsoa for the population t. c 16 and 9ve.r)
Population c
Rac, 4024, aWhite
Male16-1920-2425-34
35-49504465 and
nova.16-1920-2425-34v,
35-4950-6465 and
haracteristic
nd age
23.70034,90053,100
49,70043,500ovar 000)
25,00037,10053,7002,9002,000
r (36,400)
,Bleck .-Halo., 1649 2,300
20-24 2,800
25-34 3,400te.5,300
5 2,40065 and over
Female16-.19 3,200,20-24 2,90025-34 4,100
:35-49 500050-64 3,000 .
65 en0 over 1,600)
, .,: :.i..,
Agri: natalbesed on queetion11fmt.imate, based on zerd or
1,100)
1
Total Vary safe Reason..b.ly safo 0offewhat unaafo Very uneafo WC available
100.0100.0 ,
100.o100.0100.0100.0
100.0
56.352.951.2
5?.342.329.0
18.3
37.0
41.742.641.544.442.1
439,.3
100.0 4 19.6 37.8
100.0 23.9 43.9
100.0 22.4 45.9
100.0100.0
16.712.8 475.8.3
0 N. 63.2 27.6
100. 42.9 42.5
100.0 31.6 60.2
100.0 45,3 42.8
100.0 38.1 40.5
100.0 61.3
100.0 19.91t. 47.8
100.0 110.6 38.2
100.0100.0100.0
15.916.7
19.7
-4p.8
n:4 9
k
100,0 112.3 125.Q
4.i 10.3 10.0
3.7 1.5 10.2
5.5
4.49.3
10.6
1>.t
10.1
10. g10.3
18.3 10.1 10,4
28.8 13.3 10.2
30.4 11.7 10.5-10.3
22.820.0
e9.211.4
10.1
27.2 17. 10.4
27.4 33.9 10.9
19.2 10.0 10.o110.0 14.7 10.0
14.9 11.6 11412.0 11.1
19.6 19.3 12.5
116.7 111.3 10.0
16.4 15.9 ,10.0
31.5 19.7 10.0
29.3 14.7 11.3
26.3 18.0 12.1
21.0130.4
24.032.4
14.1g).0
.,
lls. Detail may not add tO total:because of rounding. Figurge in parentheses refer tq population In the group.
on about 10 or, fewer sample cassis, is statistically udeliable.
31
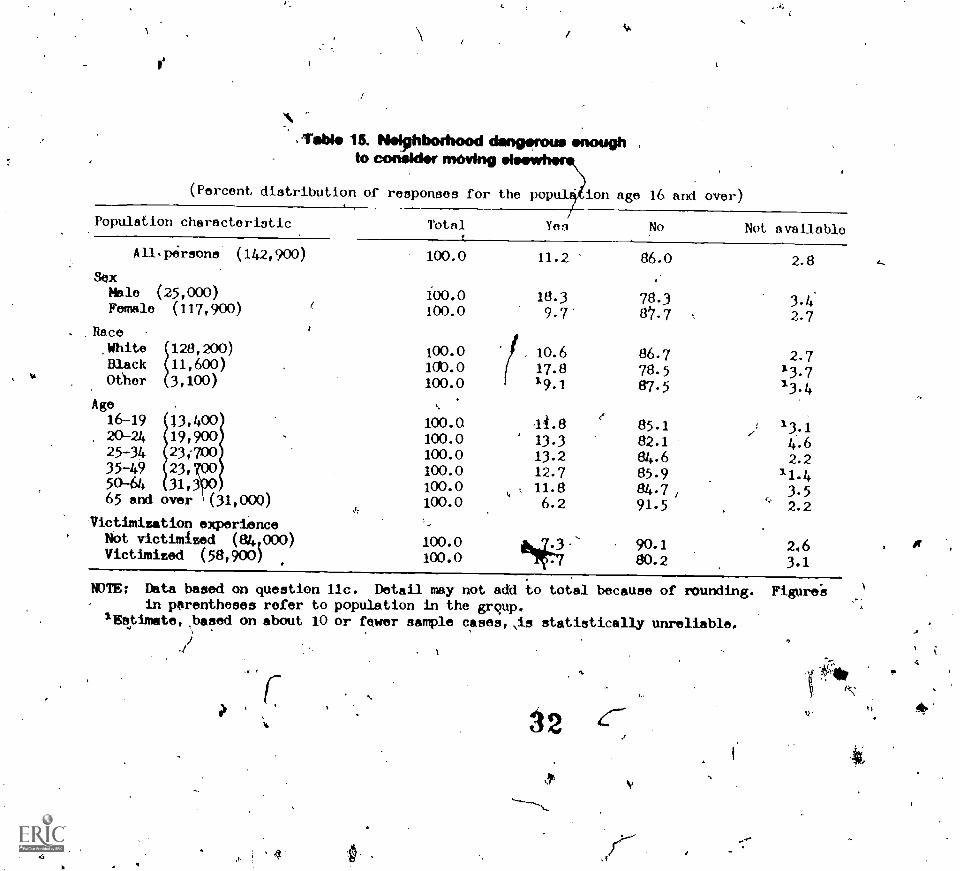
14
,Toble 15. Neighbothood dangerous enoughto consider moving
(Percent distribution of responses for the popul4 ion age 16 and over)
Population characteristic Total
Allspiraons (142,900)
30xMale (25,000)Female (117,900)
RaceWhite 128,200)Black 11,600)Other 3,100)
Age16-19 13,40020-24 19,90025-34 23,70035-49 23,7005044 3113
100.0
100.0100.0
100.010).0 1
100.0
100.0100.0100.0100.0100.0
65 and over (31,000 100.0
Victimization experienceNot victimized (84 000)Victimized (58,900)
100.0100.0
Yes No Not available
11.2 86.0 2.8
18.3 78.3 3.49.7 2.7
10.6 86.7 2.717.8 78.5 13.719.1 87.5 13.4
44.8 85.1 13.1
13.3 82.1 4.613.2 84.6 2.212.7 85.9 11.4
, 11.8 84.7 , 3.56.2 91.5 2.2
141i4
90.180.2
2,63.1
NOTE; Data based on question 11c. Detail may not add to total because of rounding. Figureein parentheses refer to population in the grqup.
lEstimate,,based on about 10 or fewer sample casesis statistically unreliable,
4
3 2 c 4.
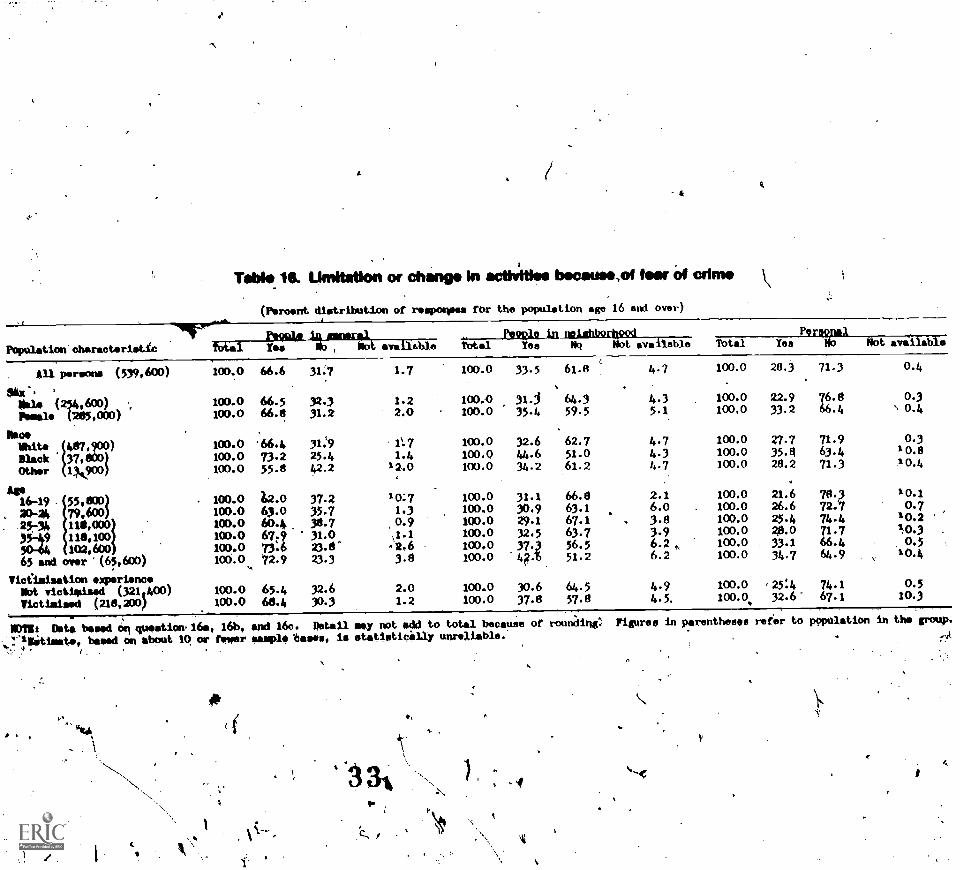
*
Tabhle. Llmitation cmr change In adh4thre became,of twig cmirrmo
(Percent distribution of respoopres for the population age 16 and Over)
Population oharactaristfc
. All persons (539,600)
Male (214,600)
Pimple (285,000) .'
Naoe*it* 487.900)Black 37,800)Othor 13,900)
Age
1
16-19 - 55,800)
20-24 79,600). .25734
i4:49 1111,1(X)
102,60065 and over (65,600)
Viceimination overtone.Mbt victlmised (321,400)Victimised (218,200)
Ewan in menu-4, Pennae in noLahborbsKrd Pe reopel
total Yes No , Not available Taal Yes Nq Not available Itotal Yee No Not available
100.0 66.6 31.7 1.7 100.0 33.5 61.8 4.7 100.0 28.3 71.3 0.4
%4
100.0 66.5 32.3 1.2 100.,0 31.1 64.3 4.3 100.0 22.9 76.8 O. 3
103.0 66.8 31.2 2.0 100.0 35.4 59.5 5.1 100, 0 33.2 66.4 0.4
100.0 '66,4 31:9 1:7 100.0 32.6 62.7 4.7 100.0 27.7 71.9 0.3
100.0 73.2 25.4 1.4 100.Q 44.6 51.0 4.3 100. 0 35.8 63.4 1 0.8
100.0 55.8 42.2 12.0 100.0 34.2 61.2 4-7 100. 0 28.2 71.3 1 0.4
100.0 io2.0 37.2 107 100.0 31.1 66.8 2.1 100.0 21.6 70.3 10.1
100.0100.0
63.0604
35.738.7
1.30.9
100.0100.0
30.929.1
63.167.1
6.0 .
3.8100.0100,0
26.625.4
72.774.4
0.710.2
.
103.0 67.9 31.0 N1.1 100.0 32.5 63.7 3.9 100.0 4.0 71.7 10.3
100.0 73.6 23.8 .2.6 100.0 37.2 56.5 6.2 , 100. 0 33.1 66.4
100.0..
12.9 23.3 3.8 100.0 4F.b 51.2 6.2 100.0 34.7 64.9 10.4
100.0 65.4 32.6 2.0 100.0 33.6 64.5 4.9 100.0 ,25:4 74.1 0.5100.0 68.4 30.3 1.2 100.0 37.8 57.0 4.5. 100.0. 32.6 67.1 10.3
113132 Data booed On quostion.16e, 16b, end 16c. Wall may not odd to total because or rounaine Piguree in-parentheses refer to population in the group.
"Mitimato, based on about 13 co.. flower *ample bases, is stattstieilly unreliable.,
-A
pp
4
p.
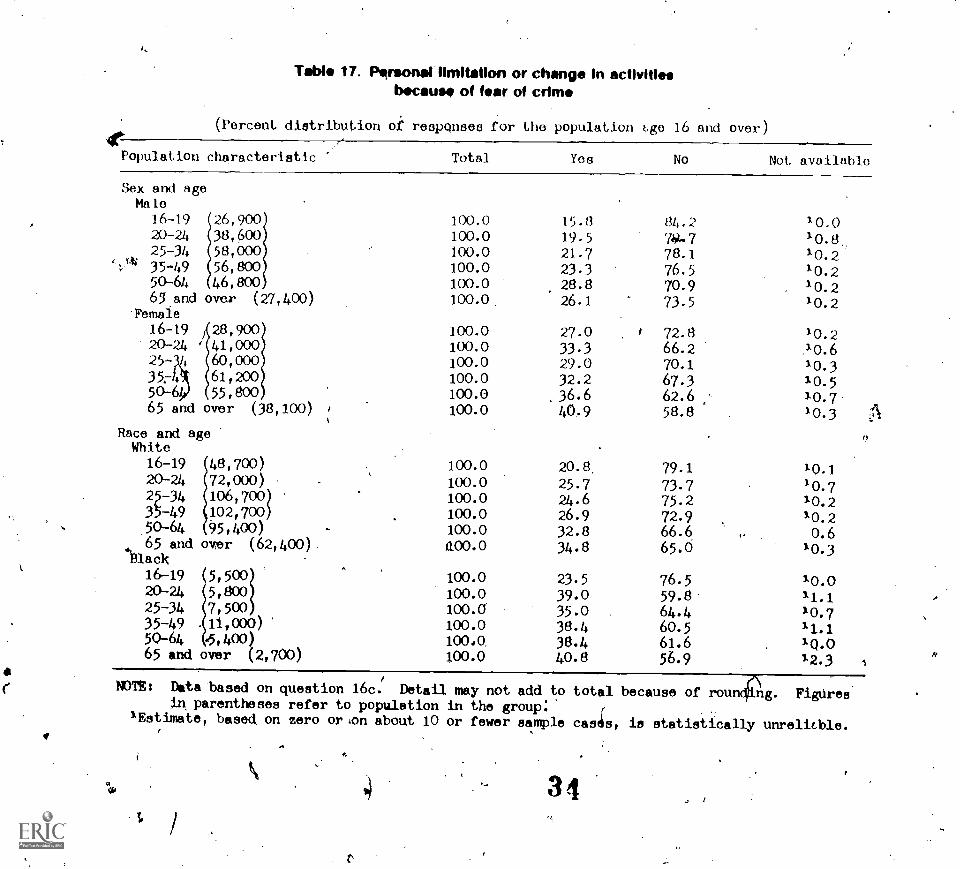
4t-
Table 17. Personallimitation or change in activitiesbecause of fear of crime
(Percent distribution oi responses for the population bge 16 and over)
Population characteristic Total Yos No Not available
Sex and ageMale
16-1920-2425-34
35-49504465 and
.ftnale
16-1920-2425-
35;--
50465 and
6,900
46,800
38,60058,00056,800
over (27,400)
28,90041,00060,00061,200
55,800over (38,100)
Race and ageWhite.
16-192G-24
2.5-34
35-4950-64
65 and*black
16-1920-24
25-3435-49504465 and
48,700)72,000)106,700)102,700)
95,400)over (62,400)
7,5005 ,800
11,000)
.5,400)over (2,700)
100.0 15.8 84.2 10.0100.0 19.5 7k0.7 10.8100.0 21.7 78.1 10.2100.0 23.3 76.5 10.2100.0 28.8 70.9 10.2100.0 26.1 73.5 10.2
100.0 27.0 72.8 10.2100.0 33.3 66.2 10.6100.0 29.0 70.1 10.3100.0 32.2 67.3 10.5100.0 36.6 62.6 10.7100.0 40.9 58.8 10.3
100.0 20.8 79.1 10.1100.0 25.7 73.7 10.7100.0 24.6 75.2 10.2100.0 26.9 72.9 10.2100.0 32.8 66.6 0.6(Imo 34.8 65.0 10.3
100.0 23.5 76.5 10.0100.0 39.0 59.8 11.1100.0 35.0 64.4 10.7100.0 38.4 60.5 11.1100.0 38.4 61.6 1Q.0100.0 40.8 56.9 12.3
NOTE: Data based on question 16c. Detail may not add to total because of rouncAg. FigUresin, parentheses refer to population in the group:
'Estimate, based on zero ol.4on about 10 or fewer sample casks, is statistically unreliLble.
cict. 3 4
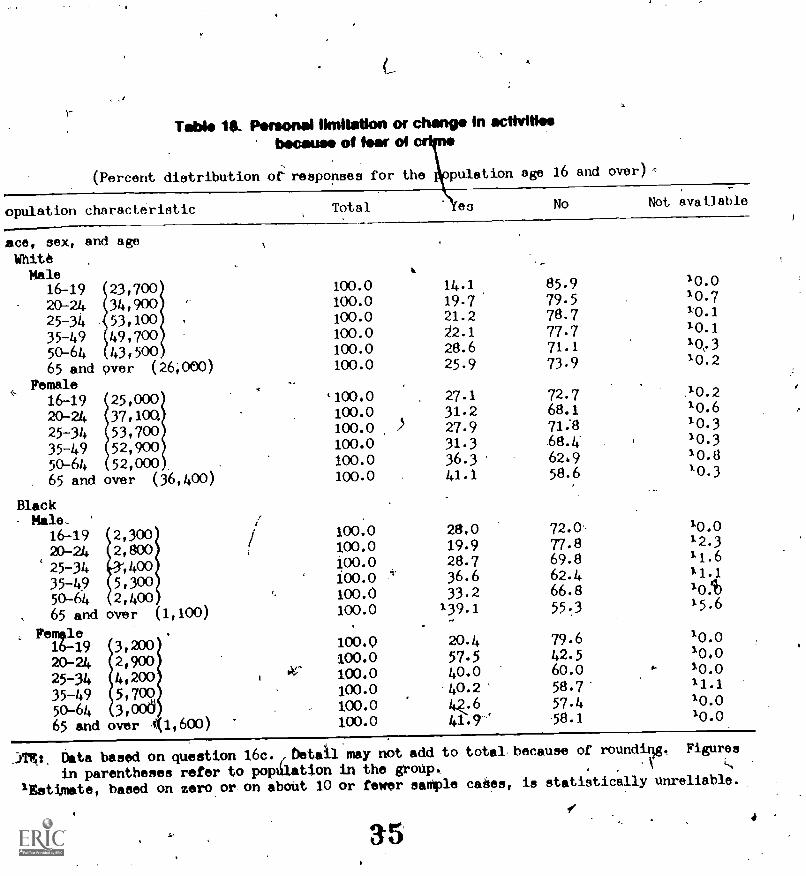
Table 1$. Porsonal limitation or change in aclivItiseWm:cause of fear of
(Percent distribution ot responses for the pulation age 16 and over)-,
opulation characteristic Total es No Not available
ace, sex, and agr
WhiteMale
16-19 100.0 14.1 85.9 10.0
20-24 34,900 100.0 19.7 79.5 10.7
25-34
i23,700
53,100 100.0 21.2 78.7 10.1
35-49 49,700 100.0 22.1 77.7 10.1
50-64 43,500 100.0 28.6 71.1 10.3
65 and over (26;000) 100.0 25.9 73.9 10.2
Female16-1920-24
5,00.0
37,10a
`100.0100.0
27.131.2
72.768.1
10.210.6
25-34 53,700r52,900
100.0 27.9 71:8 10.3
35-4950-64
5
2,000
100.0100.0
31.336.3
68.46269
10.310.8
65 and over (36.400) 100.0 41.1 58.6 10.3
Black- Male_ .
16-19 2,300 100.0 28.0 72.0 10.0
20-24 2,800 100.0 19.9 77.8 12.3
25-34 ,400 100.0 28.7 69.8 11.6
35-49 5,300 100.0 36.6 62.4 11.1
50-64 2,400 100.0 33.2 66.8 10:b
65 and over (1,100) 100.0 '39.1 55.3 15.6
Female16-19 3,200 100.0 20.4 79.6 10.020-24 100.0 57.5 42.5 10.0
25-34 4,200 I 4( 100.0 40.0 60.0 0. 10.0
35-49 5,709, 100.0 40.2 58.7 11.1
50-64 3,000 100.0 57.4 10.0
65 and over (1,600) 100.0 58.1 10.0
:IVA:. Data based on question 16c.,,betail'may not add to total.becauae of rounding. Figures
in parentheses refer to popeation in the groUp. .k
ISstimate, based on zero or on aboUt 10 or fewer saMple calicos, is statistically unreliable.
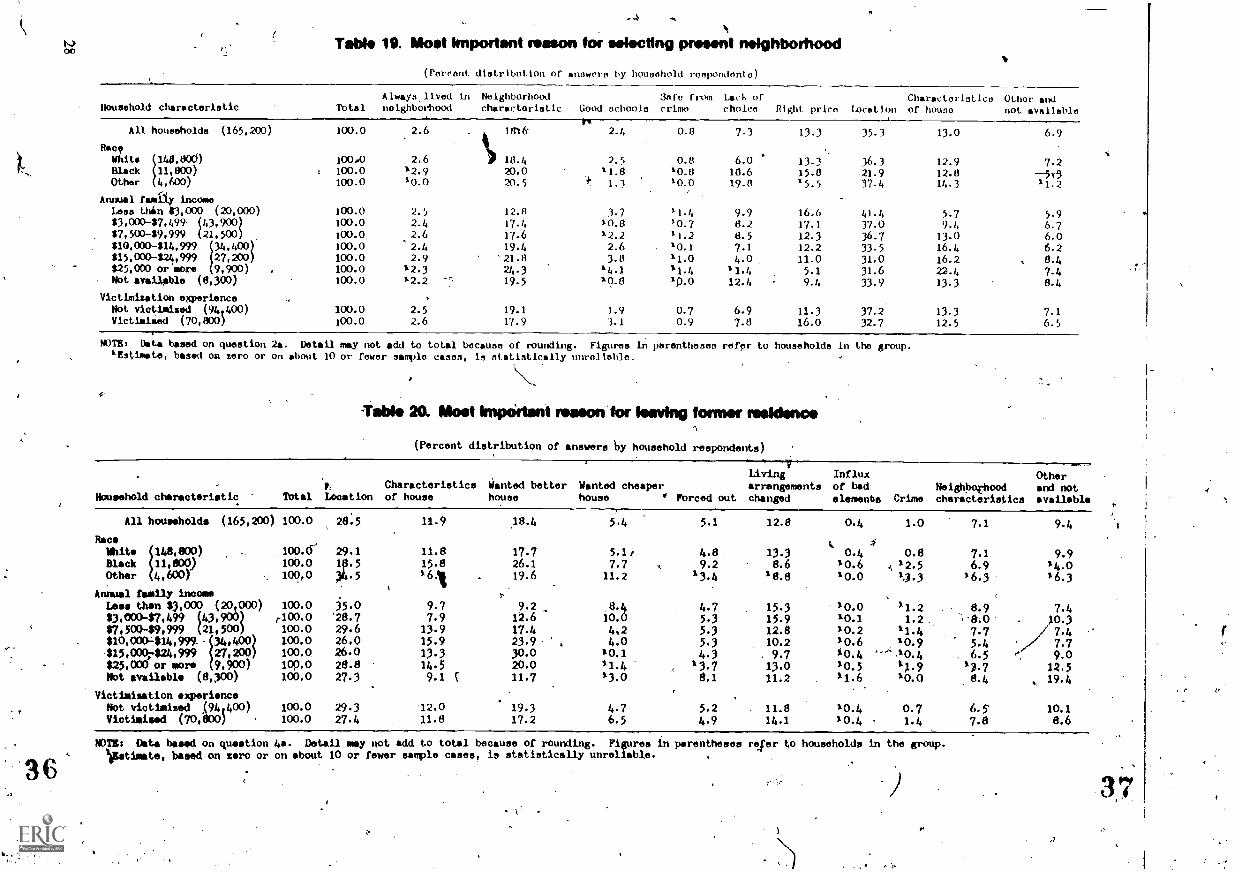
00 Table 19. Most Important mason for selectIng present neighborhood
(Poreont distribution of anowero by houoohold ronpcmdonto)
Household characteristicAlway0.11m1 Ln Neighborhood We from Lack of Charactor1st1co Olhor and
Total neighborhood characteristic Good schools crime choice Right prico Location or houno nOi mvallablo
All households (165,200)
Race
OtherBlack
148,006)Whit.11,800)
4,600)
100.0 2.6 1816' 2-4 0.8 7.) I33 35.3 13.0 6.9
100.0 2.6 "il 18.4 2.5 0.0 6.0 13-3 36.3 12.9 7.2r 100.0 12.9 20.0 11.8 10.8 10.6 15.8 21.9 12.8 --50
100.0 10.0 20.5 1.3 7'0.0 19.0 15.5 37.4 14.3 11.2:
Annual fs*ily incomeLess thin 13,000 (20,000) 100.0 2.5 12.013,000-37,49 43,900$7,500-39,999 21,500
100.0 2.4 17. i,
100.0 2.6 17.6$10,000414.499 100.0
100.02.42.9 21.0
19.4315,000-324,999 27,200$25,000 or'more 9,900) 100.0
.'
12.3 243Not available (8,300) 100.0 1'2.2 19.5
Victimisation experienceNot victimised (94,400) 100.0 2.5 19.1Victimiled (70,800) 100.0 2.6 17.9
3.7 11.4 9.9 16.6 41.4 5.7 5-910.8 '0.7 6.2 17.1 37.0 9-4 6.712.2 )1.2 8.5 12.3 36.7 13.0 6.02.6 10.1 7.1 12.2 33-5 16-4 6.23.8 11.0 4.0 11.0 31.0 16.2 . 8.4
14.1 11.4 11.4 5.1 31.6 22.4 7.4*9.8 10.0 12.4 9.4 33.9 13.3 8.4
1.9 0.73.1 0.9
6.9 11.37.8 16.0
37.2 13.332.7 12.5
7-16.5
NOTE: Data based on question 2a. Detail may not add to total because of rounding. Figures in parentheses refer to households in tho group.'Estimate, based on zero or on about 10 or fewer sample cases, Is statistically unreliable.
-Table 20. Most Important reason for having former residence
(Percent distribution of answers by household respondents)
Living Influx Otherp., Characteristics Wanted better Wanted cheaper arrangements of bad Neighborhood and not
Nommehold characteristic Taal Location of house house house ' Forced out changed elements Crime characteristics available
All households (165,200) 100.0 28.5 11.9
Race
{
White 148,800)Black 11,800Other 4,600)
Annual family incomeLess then $3,000 (20,000)$3,00047.499 (43,900)$7,500-$9,999 (21,500 )
$10,000414, 999 346,400)
$15,000;424,999 27,209)$25,000 or more 9,900)Not evailable (8,300)
Victimisation experienceNot victimised (914400)Victimised (70,800) .
loo.dr 29.1loomlo6,o
loom 35.0room .26.7loom 29.6106.0 26.0100.0 26.0lopm 28.8100.0 27.3
100.0 29.3100.0 27.4
11.815.81 61
18.4 5.4
17.726.1
19.6
5.1,7.711,2
5.1 12.8
4.89.2
13.4
13.38.6
18.8
0.4 1.0
k 40.4 0.8
10.6 .,, 12.5
10.0 14.3
7.1 9.4
7.16.9
*6.3
9.914.016,3
,
9.7 9.2 , 8.4 4.7 15.3 10.0 )- 1 . 2 8.9 7.47.9 12.6 10.0 5.3 15.9 10.1 1.2 .4.0 . 10.313.9 17.4 4.2 5.3 12.8 10.2 11.4 7.7 ,,// 7:14
15.923.9 4.0 5.3 10.2 *0.6 10.9 5.413.3 30.0 l0.1 4.3 9.7 *Oa, .10.4 6.5 e:' 9.014.5 20.0 11.4 13.7 13.0 10.5 11 9 13.7 12.59.1 ( 11.7
.
13.0 8.1 11.2 )'1.6 10.0 8.4 . 19.4
12.011.8
19.317.2
4.76.5
5.24.9
11.8 10.414.1 10.4
0.7 6.51.4 7.8
10.1
8.6
T.
NOM Data booed on question 4a. Detail mey not add to total because of rounding. Figures in parentheses refer to households in the group.liptimate, based on zero or on about 10 or fewer sample cases, is statistically unreliable..16 .
,) 37
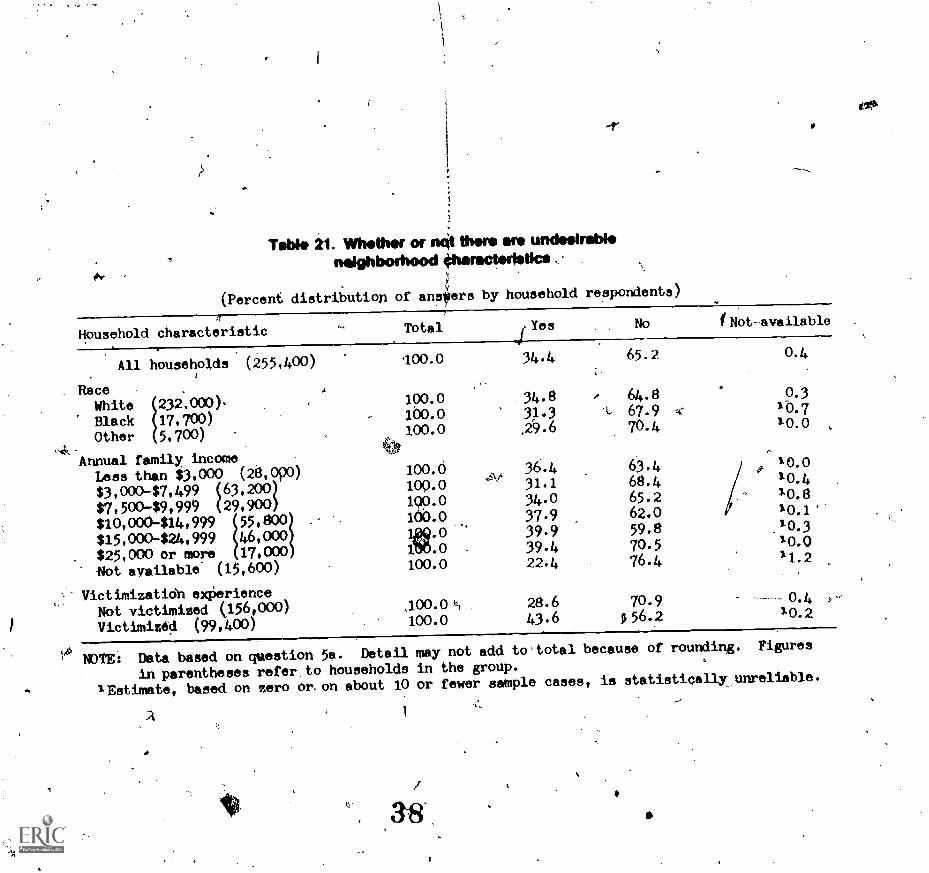
toy-
-r
Table 21. Whether or mit there are undesirablenalghbothood Sharaoteristics
(Percent distribution of anspers by household respondents)
Household characteristic Total Yes No (Not-available
All households (255,400)
Race ,
WhiteBlack 17,700)Other 5,700)
Annual family incomeLess than $3,000 (28,000)
$3,000-$7,499 (63,200)
$7,500-$9,999 (29,900)
$10,000-$14,999 55,800 i
$15,000-$24,999 46,000$25,000 or more 17,000
Not available (15,600)
%- Victimization exPerience
Not victimized (156,000)
Victimized (99,400)
4
100.0
100.0160.0100.0
100.0106.0100.0160.0..40' .+410.0100.0
.100.0 ki
100.0
.,1...,
34.4
34.83.31.
,29.6
36.431.1
34.037.939.939.422.4
28.643.6
/
k
65.2
64.867.970.4
63.468.465.262.0
59.870.5
76.4
70.9p 56.2
A:
.
i
..
e
0.4
0.310.710.0 ,
10.0'0.4'0.8'0.1'10.310.011.2
0.410.2
MTE: Data based on question 5a. Detail may not add to.total because of rounding. Figures
in parentheses refer to households in the group.
'Estimate, based on zero or.on about 10 or fewer sample cases, is statistically unreliable.
A
t
at*
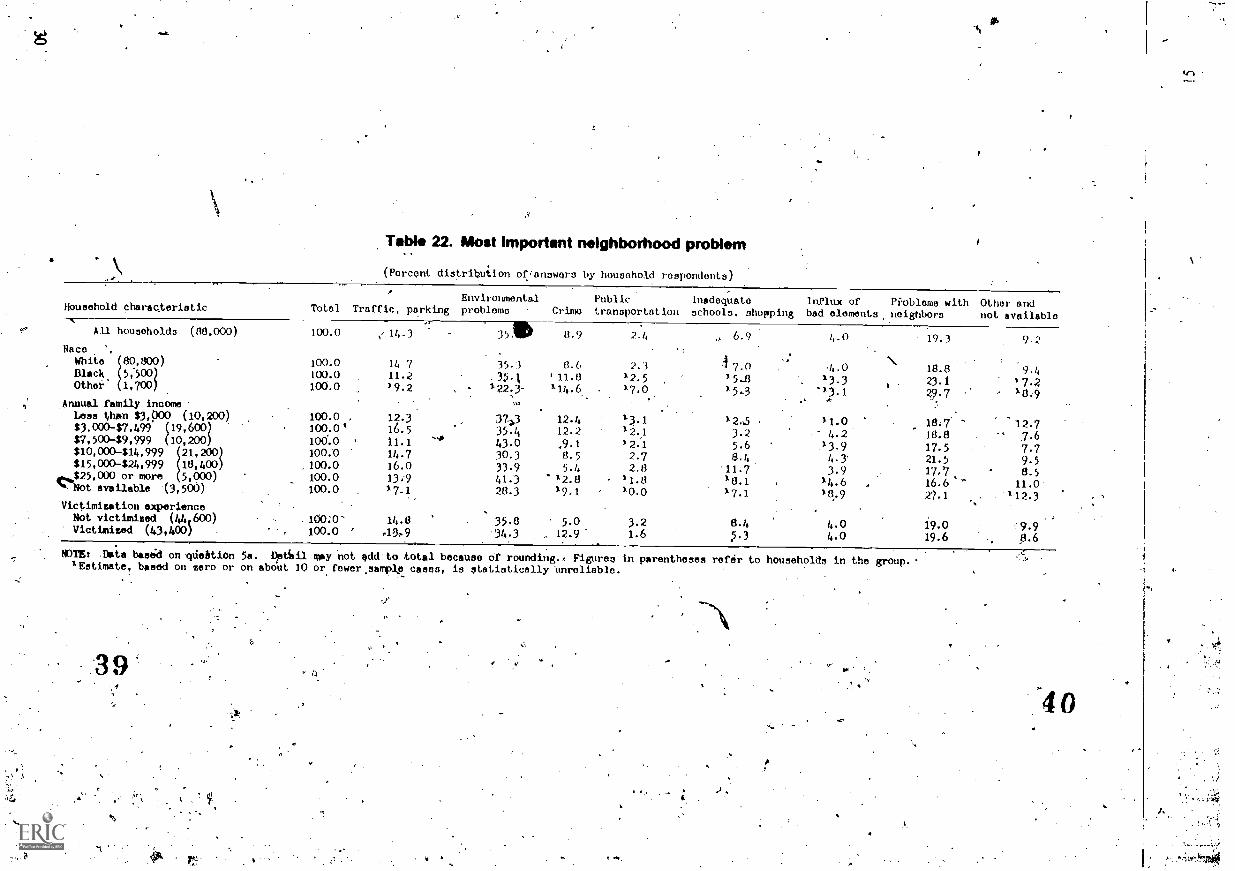
-4,
141)1h, 22. Most Important neighborhood problem
(Percent distribniion of,answorn by household respondents)
Household charac.teristic Total Traffic, parkingEnvironamntal Publicproblems Crime traneportation
Inadequateschools, shopping
Influx of Hoblems withbad elements, neighbors
Other andnot available
All households ((38,000) 100.0 14.3 35. 8.9 2.4 , 6.9 4.0 19.3RaceWhiie 100.0 14 7 35.3 8.6 2.3 3 7.0 18.8 9.4Black 5,-500) 100.0 11.2 . 3.k . 11.8 12.5 15.11 . 13,3 23,1 1 7.2Other' 1,700) 100.0 19.2 1223- 114.6 17,0
. 15-3 . 18.9Annual family incoam
.
..,
Leas t,hpn $34000 (10,200) 100.0 , 12.3 37-3 12.4 13.1 12.5 *1.0 18.7 12.7$3,000-$7,499 (19,600) loo.o, 16.5 35.4 12.2 12.,1 3.2 4.2 18.8 7.6$7,500-49,999 (10,200) 100.0 11.1....
43.0 .9.1 12.1 5.6 13.9 17.5 7.7*10,000-S14,999 100:0 14.7 30.3 8.5 2.7 8.4 21.5 9.5*15,000-424,999 18,400 100.0 16.0 33.9 5.4 2.8 11.7 3.9 17,7 8.5,o,,..$25,000 or more 5,000) 100.0 13,-9 41.3 12.8 11.8 18.1 14.6 16.6 11.0'---Not available (3,500) 100.0 17.1 28.3 19.1 10.0 17.1 27.1 112.3Victimization experienceNot victimized (44,600) 100.0- 14.8 35.8 5.0 3.2 8.4 4.0 19,,0 9-9Victimized (43,400) . 100.0 41,.9 .34.3 12.9 1.6 4.0 19.6 8.6
WITS: .Data based on -cidebtion 5a. Detiiil may not add to total because Of rounding-, Figures in parentheses refer to households in the group.1Estimate, based on zero or on about 10 or fewer.sampie cases, is statistically nnreliable.
39
.1w.t
ve.
,
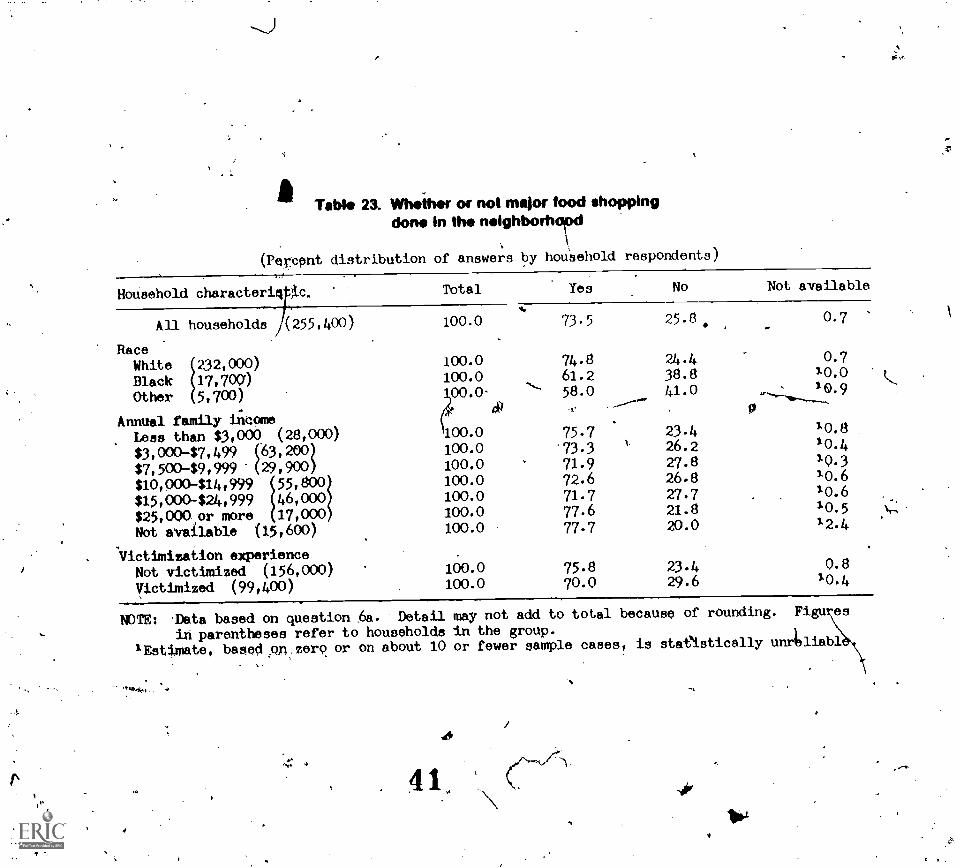
to a Table 23. Whether or not major food shoppingdone In the nelghbodwed
(Pertpnt distribution of answers by houSehold respondents)
Household characteriq At.
All households (255,400)
RaceWhiteBlack 17,700)Other 5,700)
Annual family income
Lees than $3,000 (28,000)
$3,000-$7,499 (63,200)$7,500-$9,999 (29,900)
$25,000 or more 17,000$15,00024,999 46,000$10,000-$14t999
4Not available (15,600)
'Victimization experienceNot victimized (156,000)
Victimized (99,400)
Total Yes No Not available
100.0 73.5 25.8 0.7
100.0 74.8 24.4 0.7
100.0,..,
61.2 38.8 10.0
y0.0. 58.0 41.010.0
7
40 t 0
100.0 75.7 23.4 10.8
100.0 73.3 26.2 10.4
100.0.
71.9 27.8 10.3
100.0 72.6 26.8 10.6
100.0 71.7 27.7 10.6
100.0 77.6 21.8 10.5
100.0 77.7 20.0 12.4
100.0 75.8 23.4 0.8
100.0 70.0 29.6 10.4
NOTE: Tata based on question .6a. Detail may not add to total because of rounding. Figu es
in parentheses refer to households In the group.'Estimate, barled,m.zerq or on about 10 or fewer sample cases, is stweistically unrliabl
41,
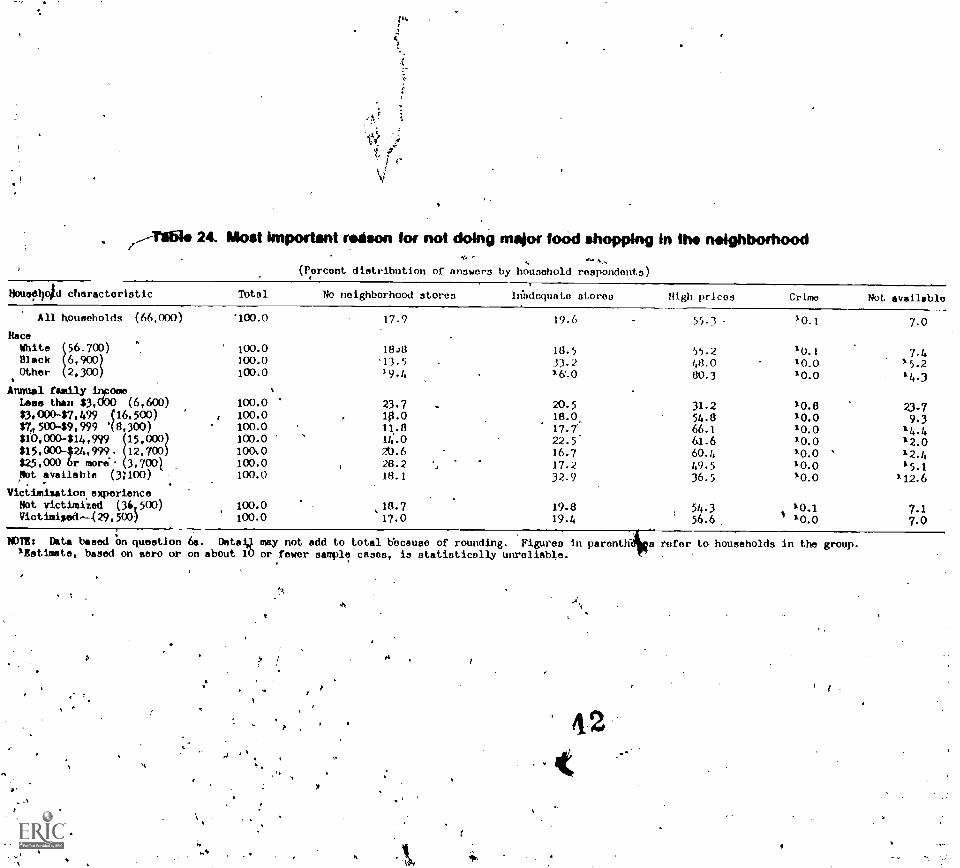
24. Most important reason for not doing malor food shopping In the neighborhood
(Percent distribution of answers by household respondents)
tianqdrid characteristic Taal No neighborhood stores In'ocloquaLo stores High prices Crime Not available
All households (66,000)
RaceWhite 56.700)Olack 6,900)Other 2,300)
Annual famay inposeLess than $3,000 (6,600)
83.00047,499 (16,500)17,50049,999 '(0000)03,000414,999$15,000-424,999. 12,700)$25,000 6r more.- 3,7001
,Not available (3100)
Victimization experienceNot victimiZed (36,500)Victimized.-429,500)
'100.0
100.0100.0100.0
100.0, 100.0
100.0100.01001.0100.0100.0
100.0100.0
17.9
18.13
413.5
9.4
23.7ltho11. 8
14.020.628.218.1
18.717.0
19.4
18.5
3). 2
16.0
20.518.0
. -
17.7.
22.5'
16.717.232.9
19.819.4
55.3
55.248.080.3
31.2
54.066.161.660.4
49.536.5
54.356.6
10.1
'0.110.010.0
10.810.0
10.010.010.010.0'0.0
10.1/ 10.0
7.0
7.4'5.2
14.3
23.79.3
14.412.012.415.1
112.6
7.1
7.0
NOTE: Data baeed On question 66. OstaU may not add to total bbcause of rounding. Figures in parenth' s refer to households in the group.'Esti:mate, based on zero or on about 10 or fewer sample cases, is statistically unreliable.
d
pl ,
42
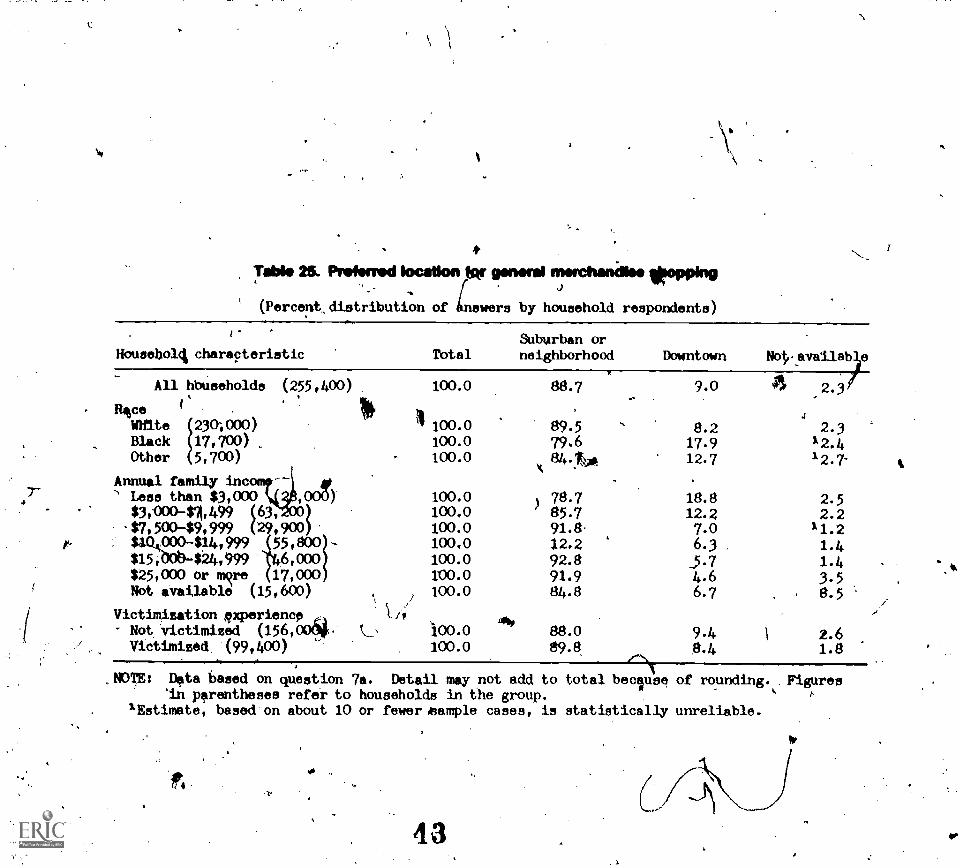
t2
, *Table 25. Prsiened locallonikr general merthenillee 'poppingk
J-..
' (Percent,distribution of 'mowers by household respondents)
House:WA characteristicSuburban or
TOtal neighborhood Downtown Note,avallab e
All hbUseholds (255,400)
Race fWrite 230; coo)Black 17,700)Cther 5,700)
Annual family incLess than $3,000 OA7, 50049,999 29,900$3,00041,499 SO
s$43,909-$14, 999 -
$15,000424,199 6,000$25,000 Or are 17,000Not available (15,600)
100.0 88.7 9.0 4 2.3
100.0100.0100.0
100.0100.0100.0100.0100.0100.0100.0
Victimisation qxperience / I
Not victimized (156,004, 100.0Victimised (99,400) 100.0
89.5 8.2 2.379.6 17.9 12.484.,ts* 12.7 12.7-
78.7)
85.718.812.2
2.52.2
91.8 7.0 11.212.2 6.3 1.492.8 5. 7 1.491.9 4.6 3.584.8 6.7 , 8.5
88.0 9.4 1 2.689.8 8.4 1.8
,
,NDTE: Data based on question 7a. Detail may not add to total becluse of rounding. .Figures.
'in parentheses refer to households in the group. .A
1Estimate, based on about 10 or fewer/sample cases, is statistically unreliable.
.,
43
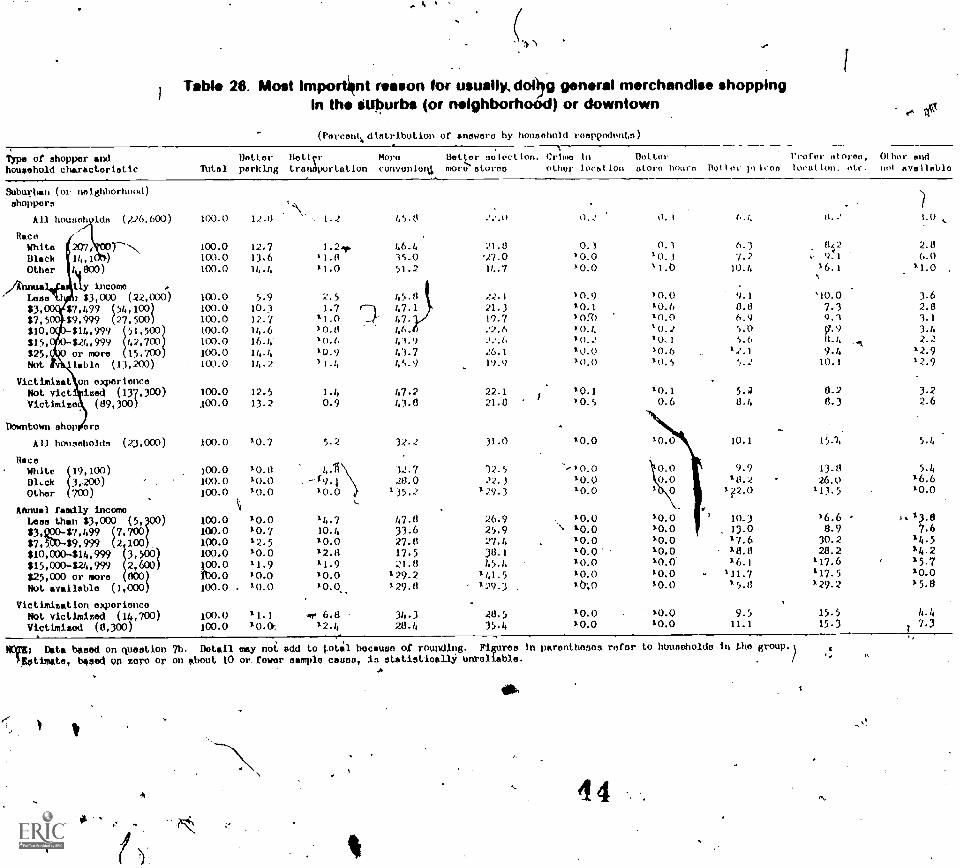
Table 28. Most importimt reason tor usually,dolg general merchandise shoppingIn the Stiburbs (or neighborhood) or downtown
(Poreen%dlntrIbotloo of enewore by hounnhold ronpendou1s)
Bottorulnro houru
,
Type or shopper andhousehold charecteristic Taal
Dotterparking
Bel.lvtronaportation
'
Mornconvonloul
Better coloclInn.morPatureo
1Crnim Inother location
3uburban (nr nnighborhood)shoppers
All bouneh lda (J6,600) 100_0 12.0 1.2 45.0 2.;.0
RaceWhite 2Q7i F.\ 100.0 12.7 1.21p. 46.4 21.8 0.1
Black 14,1 (X) 100.0 13.6 '1.8 35.0 '4.0 10.0
Other 000) 100.0 14.4 '1.0 51.2 14.7
AnnualvFe income ,
Lasoll i S3.000 (22,000) 100.0 5,9 2.5 45.8 10.9
$3,144 $7,499 54,101S7,5 $9,999 27,500
100.0100.0
10.3
12-71.7
11.047.147-
21.)i9.7
10.110:0
$10,41 S14,999 51,500 100.0 14.6 10.8 46. 22.6 10.4
$15,5 I *24,999 42,700 100.0 16.4- 10.6 43.9 /0.2
$25,1 s or more 15,700 100.0 14-4 10,9 43.7 26.1 10.0
Not labia (11,2(0) 100.0 14.2 'I. I, 0.9 19.9 10.0
Victimisat on experienceNot vict izod (137,300) 100.0 12.5 1.4 47.2 22.1 10.1
Victimize (89,300) 100.0 13.2 0.9 43.8 21.6/
10.5
Downtown shop ors
All households (23,000) 100.0 10.7 5.2 32-2 31.0 10.0
RaceWhito 19,100) 100.0 10.8 4.1 12.7 12.5
Bl.ck 3,200) 100.0 "0.0 26.0 22.3 10.0Other 700) 100.0 "0.0 "0.0 135.2 129.3 10.0
Menial family income Si
Leen than $3,000 Or$3088 $7,499 (7,700$7, ." $9,999 (2 100
100.0100.0100.0
10.0*0.7*2.5
14.710.4
*0.0
47.833.627.8
26.925.927.4
10.01.0.010.0
$10,000414,999 3,500 100.0 10.0 12.8 17.5 36.1 10.0$15,000-S24,999 2,600 100.0 11.9 11.9 21.8 45.4 *0.0$25,000 or more 900) f00.0 10.0 10.0 129.2 *41.5 10.0Not available (1,600) 100.0 10.0 10.0 129.8 . 129.3
Victimiza)- ion experience
Not victimized (14,700) 100.0 11.1 dr 6.8 34.3 28.5 10.0
Victimised (8,300) 100.0 10.Ck 12.4 28.4 35.4 1 0.0
0.5
('.1
'0.)1.0
/0.01.0.6
10.0'0.2'0.110.610.5
10.10.6
*0.010.0
,
Urofor otoroo, Othor andDutiful- pricer; locution. utc. nol nvoiln1,10
6.1 lb2 2.8
7.2 9:1 6.010.4 16.1 11.0 ,
5.2 0.2 3.2
8.4 8.3 2.6
6,4 5.0
9.1
8.86.95.05.6
12.1
10.1 15.1, 5.4
9.918.2
1F2.0
10.)13.0*7.618.816.1
111.715.11
'10.0
7.39.,
8.9.14
10.1
1).8
26.0113.5
16.68.930.228.2
117.6117.5
129.2
3.62.83.1
3.42.2
12.912.9
5.416.610.0
13.87.6
14.514.215.7*0.05.8
9.5 15.5 4.411.1 15.3 7.3
i
MIS; Data based on question 7b. Detail mey not add to 10144 because of rounding. Figuree in parentheses refer to hbunoholdu in the
).Aatimate, based on zero or on about 10 or rower sample COL100, is statistleall4 unreliable.A
4 4
!
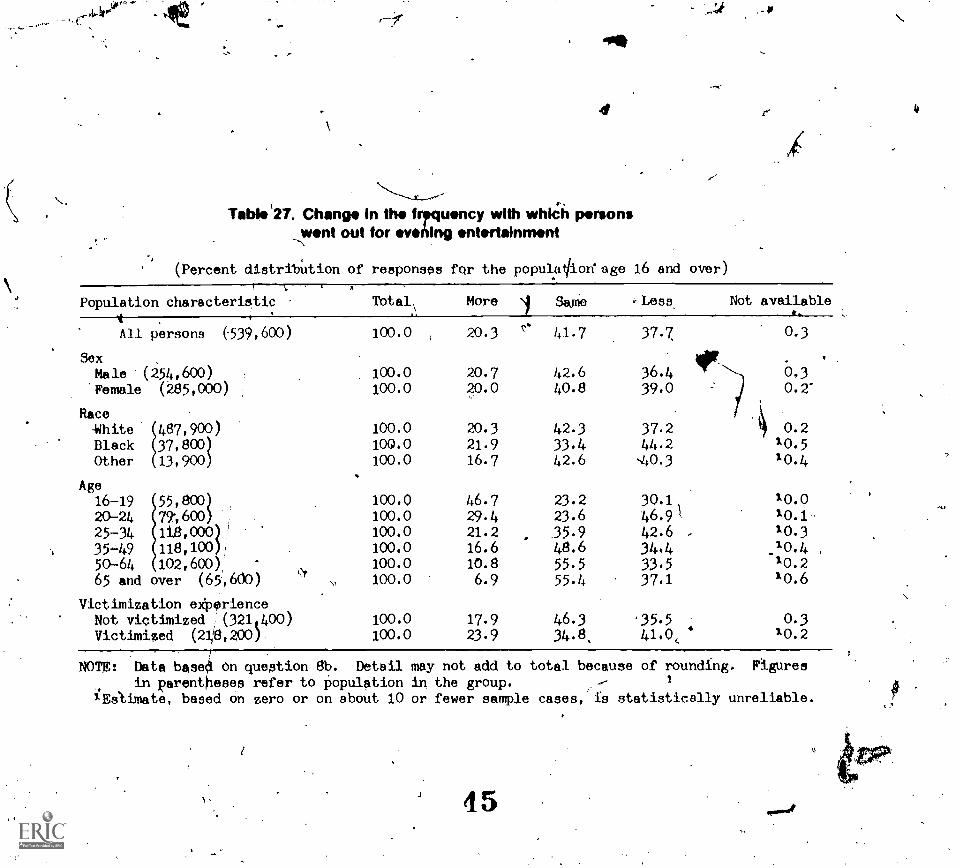
p.
Table'27. Change In the tr?quency with whiCh personswent out for *Irmilng entortainmnt
(Percent distribUtion of responses for the populailkon'age 16 and over)
Population characteristic Total More SaMe
All persons (539,600) 100.0 , 20.3 '* 41.7 37.7
Sex
Male (254,600) 100.0 20.7 42.6 36.4
'Female (285,000) 100.0 20.0 40.8 39.0
Race-White 487,900) 100.0 20.3 42.3 37.2
Black 37,801 100.0 21.9 33.4 44.2Other 13,900 100.0 16.7 42.6
Age16-19 55,800) 100.0 46.7 23.2 30.1
20-24 79,600) 100.0 29.4 23.6 46.925-34 112,000) 100.0 21.2 35.9 42.635-49 118,100), 100.0 16.6 48.6 34.45044 102,600) 100.0 10.8 55.5 33.565 and over (65,600) \ 100.0 6.9 55.4 37.1
Victimization eiperienceNot victimized (321t400) 100.0 17.9 46.3 '35.5Victimized (2118,200) 100.0 23.9 34.8. 41.0,
Not available
0.3
10.010.110.310.410.210.6
0.310.2
NOTE: Data based On question 8b. Detail may not add to total because of rounding. Figuresin parentheses refer to Population in the group.
qAimate, based on zero or on about 10 or fewer sample cases, is statistically unreliable.
45
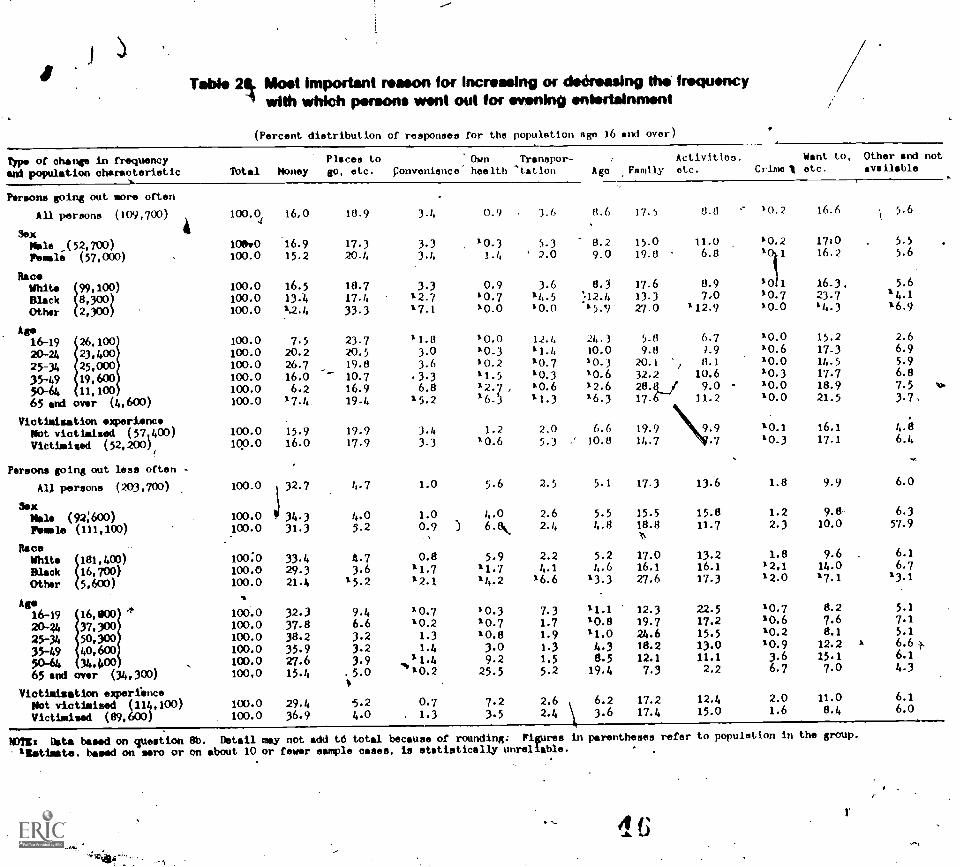
Table 2g. Most important reason for Increasing or dedroasing the frequency-1 with which persons went out for evening entertainment
(Percent distribution of responses for the population age 16 and over)
Typs of change in frequencyend population characteristic Total Honey
Persons going out more often
All persone (109,700) 100.04
16,0
SexMale ,(52,700) 108,0 16.9
Female (57,000) 100.0 15.2
RaceWhite 99,100) 100.0 16.5
Black 8,300) 100.0 13.4
Moor 2,300) 100.0 1.2.4
Ago
1
16-19 26,100 100.0 7.5
20-24 23,400 100.0 20.2
25-34 25,000 100.0 26.7
35-49 19,600 100.0 16.0
50-64 11,100 100.0 6,2
65 and over (4,600) 100.0 17.4
Victimisation experienceNot victimised (57,400) 100.0 15.9
Victimised (52,200) 100.0 16.0t
Persons going out less often -
All persons (203,700) 100.0 32.7
Sexloo.o I) 34.3msl. (92:600)
Female (111,100) 100.0 31.3
Race.
White 181.400)Black 16,700)Other 5,600)
Age16-19 16,800 4* 100.0 32.3
20-44 37,300 100.0 37.8
25-34 50,300 100.0 38.2
35-49 40,600 100.0 35.950-64 34,400 . 100.0 27.6
65 end over (34,300) 100,0 15.4
100:0 33.4100.0 29.3
100.0 21.4
Victimisation experienceNot victimized (114,100)Victimised (89,600)
100.0 29.4100.0 36.9
18.9 3.4 0.9 3.6 8.6 17.5 8.8 ' 10.2 16.6
17.3 3.3 10.3 5.3 8.2 15.0 11.0 10.2 1710 5.5
20.4 3.4 1.4 ' 2.0 9.0 19.8 6.8 16.2 5.6
18.7 3.3 0.9 3.6 8.1 17.6 8.9 10)1 16.3. 5.6
17.4 12.7 10.7 14.5 ;12.h 13.3 7,0 10.7 23.7 14.1
33.3 17.1 10.0 10.0 15.9 27.0 112.9 10.0 14.3 16.9
23.7 11.8 10.0 12.1, 24.3 5.8 6.7 10.0 15.2 2.6
20.5 3.0 10.3 11.4 10.0 9.8 1.9 10.6 17-3 6.9
19.8 3.6 10.2 10.7 10.3 20.1 8.1 10.0 14.5 5.9
10.7 -3.3 11.5 10.3 *0.6 32.2 10.6 10.3 17.7 6.8
16.9 6.8 12.7 , 10.6 12.6 28. 9.0 10.0 18.9 7.5 10.
19.4 15.2 16. 11.3 16.3 17. 11.2 10.0 21.5 3.7,
V ,
19.9 3.4 1.2 2.0 6.6 19.9 9.9 10.1 16.1 4.8
17.9 3.3 10.6 5.3 -' 10.8 14.7 7 10.3 17.1 6.4
Places to 'Own Transpor- Activities. Went to, Other and not
go, etc. Convenience' health -lotion Ago ,Fandly etc. Cr1mm A etc. available
4.73.6
15.2
4.7 1.0
4.0 1.0 4.05.2 0.9 )
9.46.63.23.2
3.9. 5.0
0.811.712.1
1 0.7
1 0.2
1.3
1.4
1.410.2
5.6 2.5 5.1 17.3 13.6 1.8 9.9 6.0
5.911.714.2
2.6 5.52.4 4.8
2.24.1
16.6
5.2
13.3
15.5
18.8
16.127.6
10.3 7.3 11.1 12.3 22.5
10.7 1.7 10.8 19.7 17.2
10.8 1.9 11.0 24.6 15.5
3.0 1.3 4.3 18.2 13.0
9.2 1.5 8.5 12.1 11.1
25.5 5.2 19.4 7.9 2.2
17.0
15.8 1.2
11.7 2.3
13.216.117.3
1.812,112.0
10.710.610.2a0.9
).66.7
9.8 6.3
10.0 57.9
9.614.017.1
8.27.68.1
12.215.17.0
6.16.7
13.1
5.1
7.1
5.16.66.1
4.3
5.2 0.7 7.2 2.6 6.2 17.2 12.4 2.0 11.0 6.1
4.0 . 1.3 3.5 2.4 3.6 17.4 15.0 1.6 8.4 6.0
MYRis Data biped on question 8b. Detail may not add to total because of rounding.. Figures in parentheses refer to population in the group.
'Ultimate. based on sero or on about 10 or fewer sample oases, is statistically unreliable.
1'
..
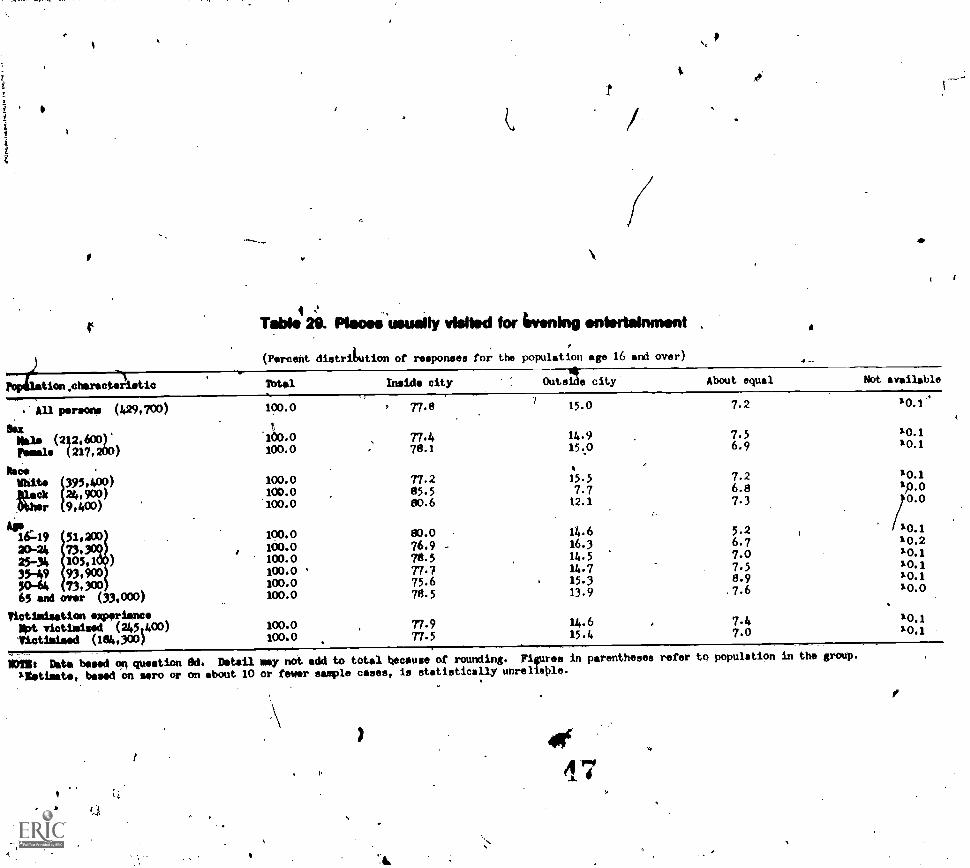
0
tion.oharactekietic
4
TWA* 29. Flimmi'imitionly %WOW for twordnipoilMortailmmomml ,
(Percent distritution of responses for the population age 16 and over)
1otel Inside city Outs e city
4/P
4 -..
About equal NOt available
.'All persons (429,700)
SaxMlle (212,603)'restale (217,200)
RaceMitePvck 24,900)%her 9,400)
Ale16:49 51,200
1
A06-24 73,
25-34 105,1 )
al:93,900
73,30085 sod over (55,000)
Victimisation **mimes100t victimised (2451400)
liotimieed (184,300)
100.0 r 77.8 15.0 7.2 10.1
103.0 77.4 14.9 7.5 10.1
100.0 78.1 15.0 6.9 10.1
100.0 77.2 15.5 7.2 10.1
100.0 85.5 7.7 6.8 1,0.0
100.0 80.6 12.1 7.3 0.0
/10.1100.0 80.0 14.6 5.2
100.0 76.9 - 16.3 6.7 10.2
100.0 78.5 14.5 7.0 10.1
100.0 , 77.7 14.7 7.5 10.1
100.0 75.6 15.3 8.9 10.1
103.0 78.5 13.9 7.6 10.0
100.0 77.9 14.6 7.4 10.1
100.0 77.5 15.4 7.0 10.1
Mint Date based on quostion Ad. Detail may not add to total becomes of rounding. Figures in parentheses refer to population in the group.
ISItimate, based on 'pro or on about 10 or fewer sample cases, is statistically unreliaPle.
t
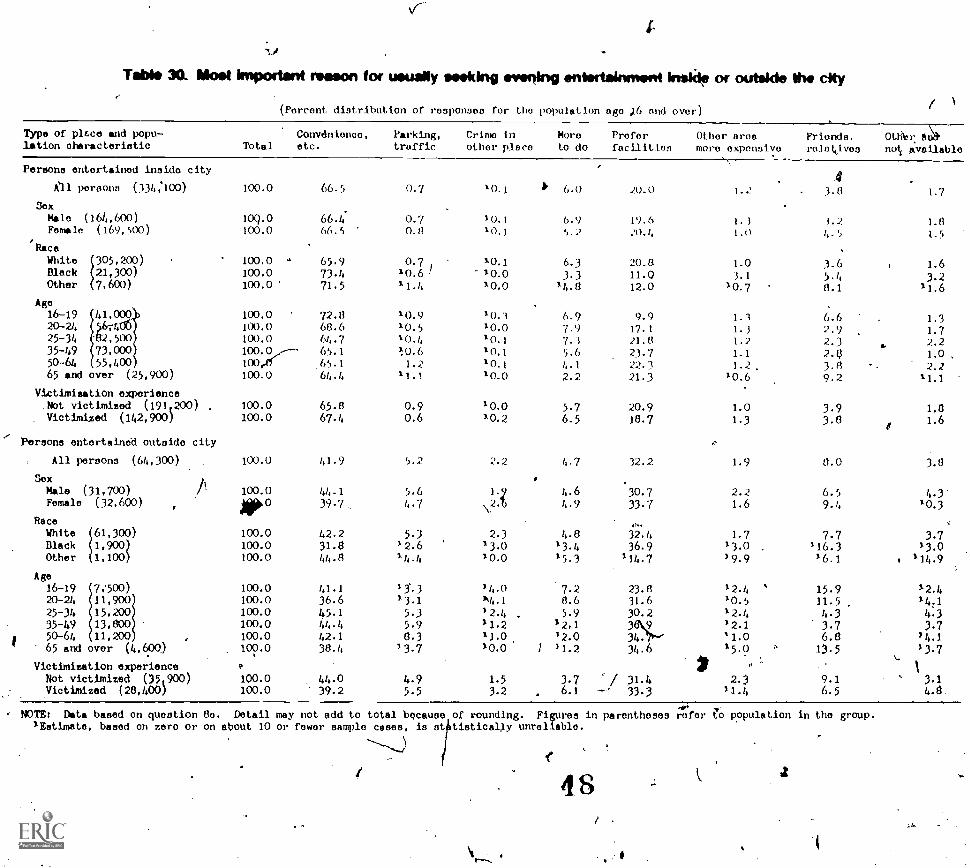
Table 30. Noel important reason tor ueuaNy seeking evening entertainment instile or outside W. city
(Porcont distribution of .rosponses for the population ago ,16 and over)
Type of place and popu-lation characteristic
Convdnionco,Total etc.
Parking,traffic
Crinm inother piaco
Persons entertained insido city
All persons (131,:100)
SexMale (16),,600)
Female (169,500)/
Race
White 305,200)Black 21,300)Other 7,600)
Ago
100.0
109.0100.0
100.0 4
100.0100.0 '
66.5
66.4-
66.5
65.9
73.471.5
0.7
0.70.8
0.710.61 1.4
10.1
10.1
10.1
10.110.010.0
16-19 41, 100.0 72.8 10.9 10.120-24 0,74 IS 100.0 68.6 10.5 10.025-34 82,500 100.0 64.7 10.4 10. I35-49 73,000 100.0,-- 65.1 120.6 10.150-64 55,400 100/i 1.2 10,165 and ver (25,900) 100.0
.65.1
64.4 11.1 10.0
Victimisation experienceNot victimized (191,200) , 100.0 65.8 0.9 1 0.0
Victimized (142,900) 100.0 67.4 0.6 10.2
Persons entertained outoide city
All persons (64,300) 100.0 41.9 5.2 2.2
SexMale (31,700) 100.0 44.1 5.6 1.
Female (32,600) JP° 39.7 4.7
RaceWhite 61,300) 100.0 42.2 5.3 2.3Black 1,900) 100.0 31.8 12.6 13.0Other 1,100) 100.0 44 . 8 1h.h 1 0.0
Age16-19 7;500) 100.0 41.1 13%3 14.020-24 11,900 100.0 36.6 13.1 1"4.1
25-34 15,200 100.0 45.1 5.3 12.4
35-49 13,800 100.0 44.4 5.9 '1.250-64 11,200 100.0 42.1 8.3 11.065 and over (4,600) 100.0 38.4 3-7 10.0
Victimization experienceNot victimized (35,900) 100.0 44.0 4.9 1.5Victimized (28,400) 100.0 39.2 5.5 3.2
NOTE: Data based on question 80. Detail may not add to total because of rounding.
Otlir.PreferMoro Friends,Other aroaLo do facilities more oxpensivo relet4,1voo no1, Available
) 6.0
6.95.2
6.3
3.314.8
6.9
7.97.35.6
4.1
2.2
5.76.5
4.7
4.64.9
4.813.415.3
7.28.6
5.912,1
'2.01 '1.2
3.7 /
20.0
19.620.1,
20.811.012.0
9.917.1
21.823.722.321.3
20.9
18.7
32.2
30.7
33.7
32.436.9
114.7
23.831.630.23934.6
31.46.1 33.3
1.2 1. (I 1.7
1. 3 1.2 1.111.0 1, . 1.5
3.6 1.6).1 5-4 3.2
10.7 8.1 11.6
1.1 6.6 1.31.1 2.9 1.71. 2 2.3 2.21.1 1.0 ,
1.2. 3.8 2. 210.6 9.2 11.1
1.0 3.9 1.81.3 3.8 1.6
1.9 8. 0 3.8
2.2 6.5 4.31.6 9 4 10.3
1. 7 7.7 3.71 3.0 116.3 13.09. 9 1 6.1 , 114.9
'2.4 15.9 '2.410.5 11.5 , '4,112.4 4.3 4.3'2.1 3.7 3.7'1.0 6.8 14.1150 13.5 13.7
1
2.3 9.1 3.111.1, 6.5 4.8
Figures in parentheses refer ?so population in the group.'Estimate, based on zero or on about 10 or fewer sample cases, is st tistical:ly unreliable.
481%,
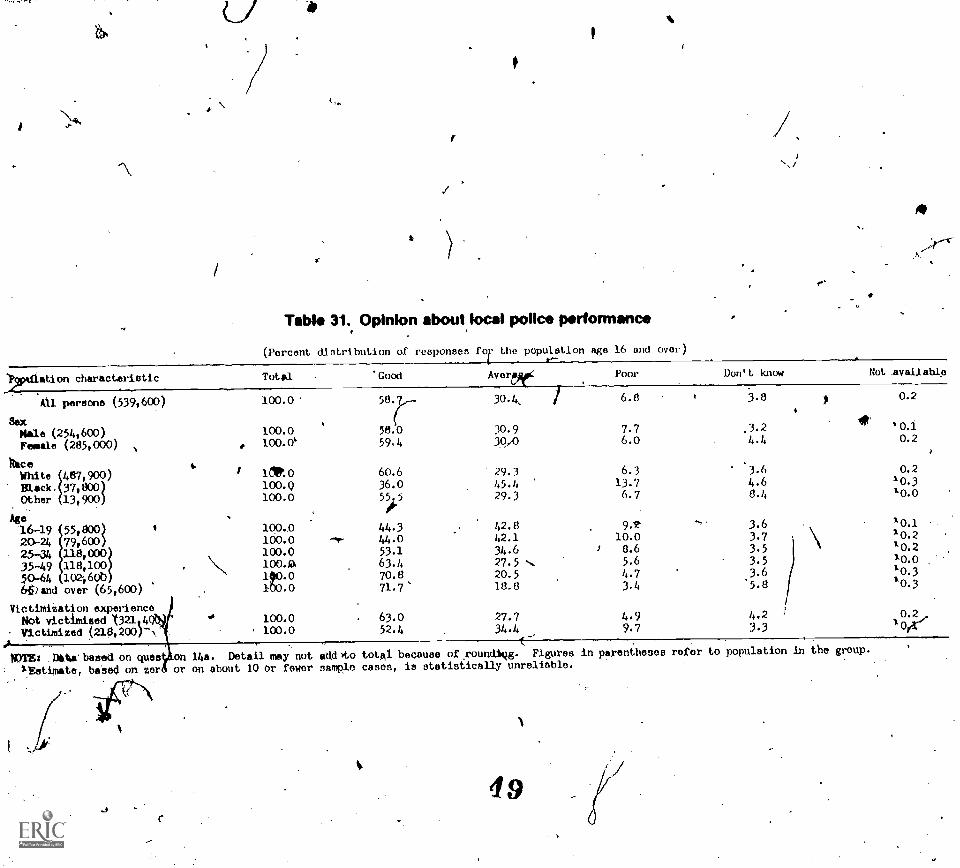
Tabk 31. Opinion about local police partormance
(Percent dlatribution of roaponees for the population age 16 and over)4
characterietic Total Good Averve Poor Don't know Not. available.941iation
All persons (539,600) 100.0 58, 30.4, 6. 8 3.8
SaxMale (254,600) 100. 0 58.0 30. 9 7. 7 3. 2 *'Female (285,000) 100.0' 59.4 30.0 6.0 4. 4
Race487,900) itlko 60.6 29. 3 6. 3 3.6White
lackB. 37,800) 100.0 36. 0 4 5* 13.7 4.6Other 13,900) 100.0 55. 5 29.3 6. 7 8.4
Age16-19 55,800) 100.0 44.3 42. 8 3.620-24 79,600) 100.0 414.0 1,2.1 10.0 3.725-34 100.0 53.1 34.6 ) 8.6 3. 5
35-49 118,100 63.h 27. 5 5.6 3. 5
50-64 10.200b 1.0.0 70.8 20. 5 4.7 3.6146) and over (65,600) 100. 0 71. 7 18. 8 3.4 '5. 8
Victimization experienceNot victimized l32.1t4 .. 3.40 27. 7 4. 9 4.2100.0 . 652.
Victimized (218,200)-\ 100. 0'
34.4 9. 7 3.3.f.-'
0.2
10.10.2
0. 210010.0
10.110.210.210.010.10.3
0.2lore
101E: , lie' based on ques on 14a. Detail may not add A.o total because of roundiNg. Figures in parentheses refer to population in the group.%Estimate, baSed on zer or on about 10 or fower sample cases, is statistically unreliable.
1 9
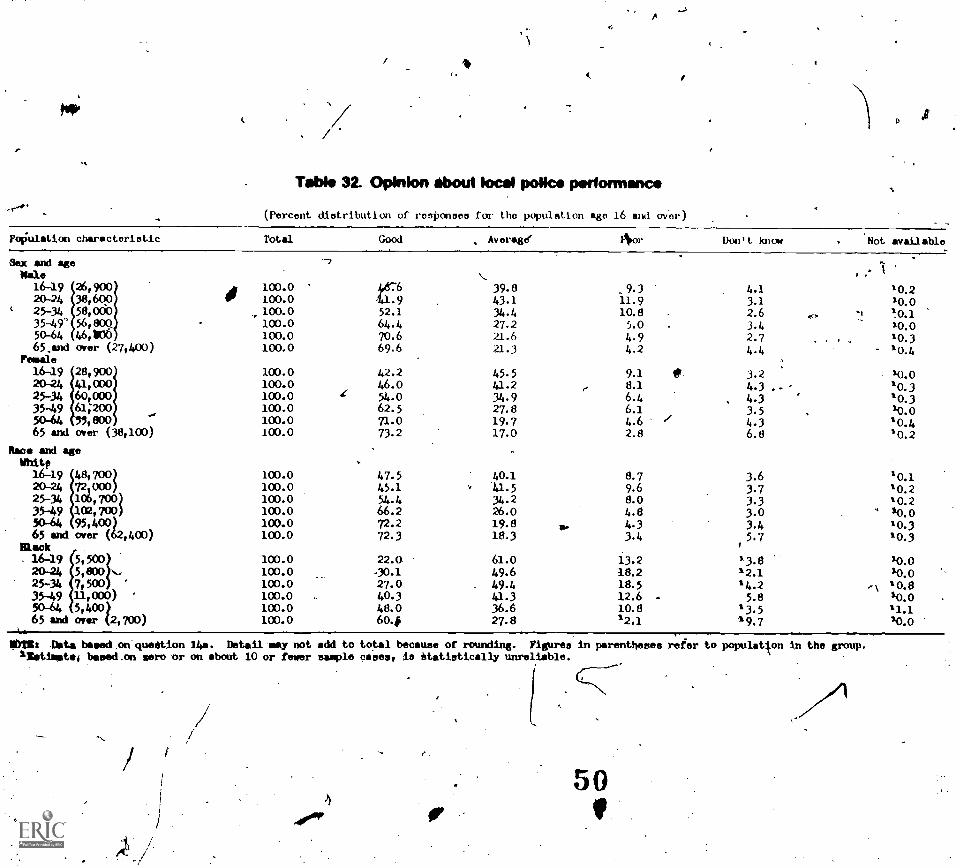
Table 32. Opinion About local polio. podonnanc*
(Percent dietribution of ronponeoe for tho population ago 16 and ov'or)
PoPulation characterietic
Sex and ageKale
t
16-19
35-49" 5600020-24 38,60025-34 58,000
50-64 46,90065.and over (27,400)
Female16-19 28,90020-24 41,00025-34 60,00035-49 61;20050-64 ,900 ---
65 and over (38,100)
Race and ageWhitp
16-19 48,700)20-24 72,000)25-34 106,700)35-49 1(2,700)50-64 95,4002265 and over ( ,400)
Black
25-34 7,500
_ 16-1920-24 5,000
35-49 11,000) ,
..,
50-64 5,400)65 and ove (2,700)
1/4.
Total Good Average' Aro, Don't know Not. available
0 100.0100.0100.0100.0100.0100.0
100.0100.0100.0100.0100.0100.0
100.0100.0100.0100.0100.0100.0
100.0100.0100.0100.0100.0100.0
4
.
t87.69
52.164.470.669.6
42.246.054.062.571.073.2
47.545.154.466.272.272.3
22.0.30.127.040.348.060.#
39.843.134.427.221.621.3
45. 541.234. 927.819.717.0
40.1'41.534.226.019.818.3
61.049.649.441336.627.8
0.-
e
, 9.311. 910.8
5.04. 94.2
9.18.16.46.1
4.62.8
8.79.68.04.84.33.4
13.218.218.512.610.812.1
*
/
4.13.12.63.42.74-4
,
3.24.3 .-4.33.54.36.8
3.63.73.33.03.45.7
3.3.812.1'4.25.8
13.5'9.7
'
.0.
.
.. I
'
I10.210.010.110.0'0.3'0.4
10.0'0.3'0.310.0'0.4'0.2
10.110.210.210.0
I 0.310.3
'0.010.010.820.011.110.0
901ZI Data based on question 14a. Detail may not add to total because of rounding. Figures in parontbeses :vier to populatIon in the group.listimatei beeed.on zero or on about 10 or fewer sample cases, is ttatistically unreliable.
I.
50
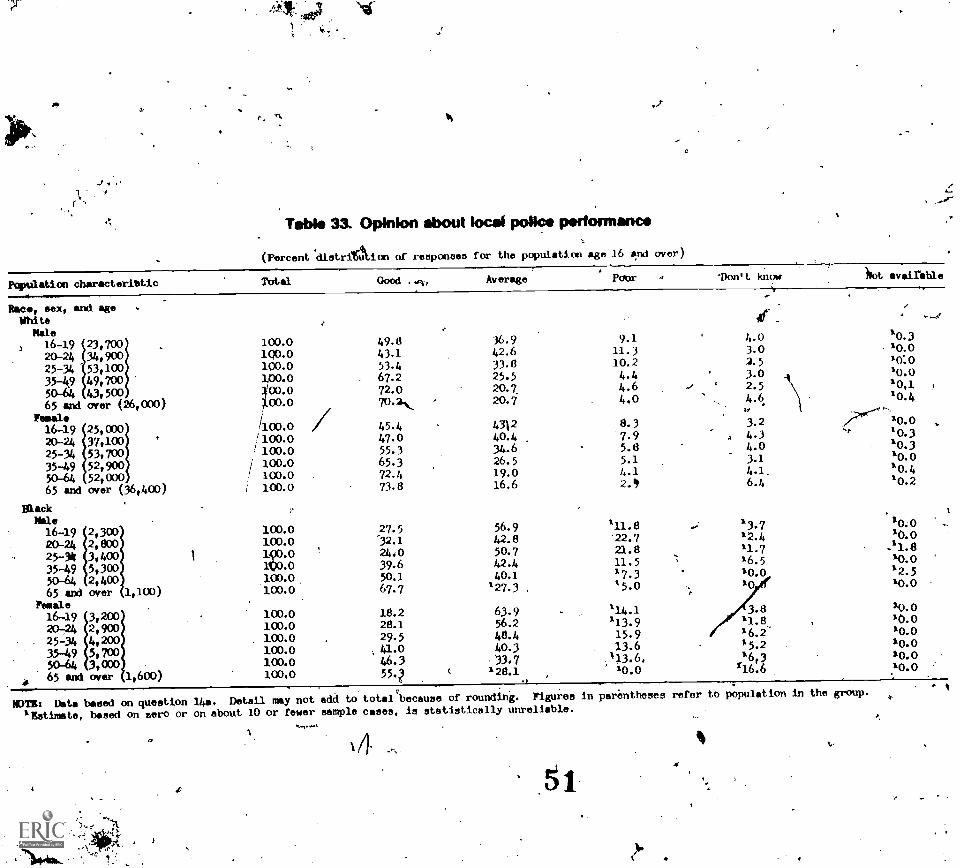
TWIN 33. Ophnlon mipcmot 10410 Koko pefftwinanot
(Percent.distridion of remponeee for tho population age 16 and aver)
Pqpfulation characterittic
Race, sax, and ageWhite
Wale
3 16-1920-24
25-34
35-4950-6465 amd
Female16-1920-2425-34
35-4950-6465 and
MeekMlle16-19R0-2425-34
35-49504465 and
Female16-1920724
25-34354950-64
65 and
1
49,7001
r4,791%
53,103
43000over (26,000)
Total Good Average Poor
1;7:111153,70052,90052,000over (36,400)
2,800
3,403513002,400over 1,100)
1
:200
4,2005,700
over 1,600)
WTI: Data belied on question'Estimate, based on zero or
4r:
-Don't know 4ot availible
Ar
1400.0 49.8 36.9 9.1 4.0 10.3100.0 43.1 42.6 11.3 3.0 10.0100.0 53.4 )3.8 10.2 2.5 10:0100.0 67.2 25.5 4.4 3.0 10.0
72.0 20.7. 4.6 2.5 10,1/09.000.0 70.2, 20.7 4,0 4.6. 10.4
/100.0 45.4 4312 0.3 3.2 10.0 ,1100.0 47.0 40.4 7.9 . 4.3 10.3I 100.0 55.3 34.6 5.8 4.0 10.3
/ 100.0 65.3 26.5 5.1 3.1 10.0' 100.0 72.4 19.0 4.1 4.1. 10. 4
100.0 73.8 16.6 6.4 10.2
100.0 27.5 56.9 111.8 1347 10.0100.0 32.1 42.8 22.7 12.4 10. 0
1Q0.0 2440 50.7 21.8 11.7 .11.8100.0 39.6 42.4 11.5 16.5 10.0
100.0 50.1 40.1 17.3 10.0 12.5
100.0 67.7 127.3 15.0 10.0
100.0 18.2 6 3.9 114.1 3.8 10.0100.0 28.1 56.2 113.9 11.8 10. 0
100.0 29.5 48.4 15.9 16.2' 10.0
100.0 41.0 40.3 13.6 15.2 10. 0
100.0100.0
,
46.3
554? 1 38.17
113.6,10.0
16,31.16.6
10. 0.10. 0
14a. Detail may not add to total because of rounding. Figures in parOntheses refer to population in the group.
on about 10 or fewer sample caves, ia statistically unreliable.
5 1
11111
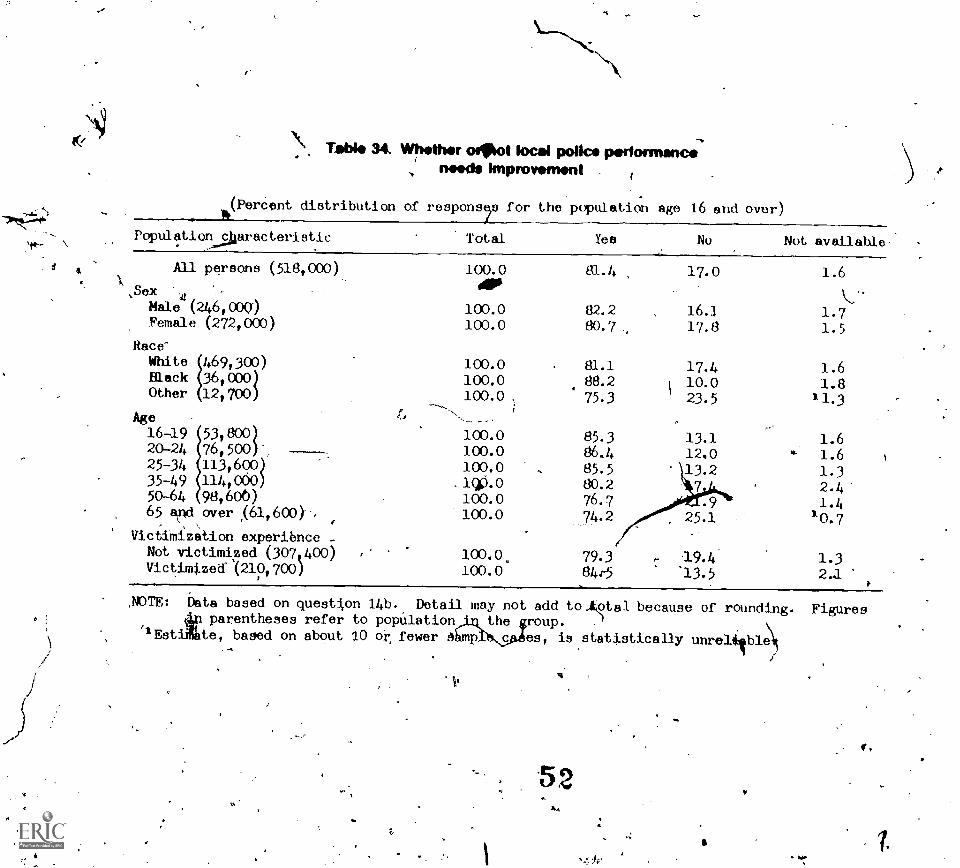
3
Tikollo:PL VWhothercwOollocalpoMkxopirilornmsmo;e
moods knprovemont .
14(PerCent distribution of respons7 for the popUlatin age 16 and over)
Population characteristic.
Total Yes No Not available-
All persons (518,000) 100.0 81.4 17.0 1.6
,SeX 4.11\,-
Male (246,000 100.0 82.2 16.4 1.7Female (272,000) 100.0 80,7 17.8 1.5
Race-
White 469,300) 100.0 81.1 17.4 1.6Black 36,000) 100.0 88.2 1 10.0 1.8Other 12,700)
Age
100.0 ,-,-,
.._ _
.75.3 23.5 11.3
16 -19 53,800) 100.0 85.3 13.1 1.620-24 76,500)", 100.0 86.4 12.0 1.6 )
25-34 113,690 ) 100.0 ., 85.5 13.2 1.335-49 114,000) 80.2 7 2.450-64 98,600) 100.0 76.7 4.9 1.465 aM,over ,(61,60D) ., 100.0 74.2 25.1 10.7
Victimization experibnce -
Not victimized (307,400) 100.0. 79.3 19.4 1.3Victimized* '(210,70o) 100.0 84r5 *13.5
,N)TE: bata based on quest1con 14b. Detail may not add to,tptal because of rounding. Figuresparentheses refer to popnlation the roup.
'1Est te, baced on about 10 or fewer Amp es, is statistically unrel4p14/
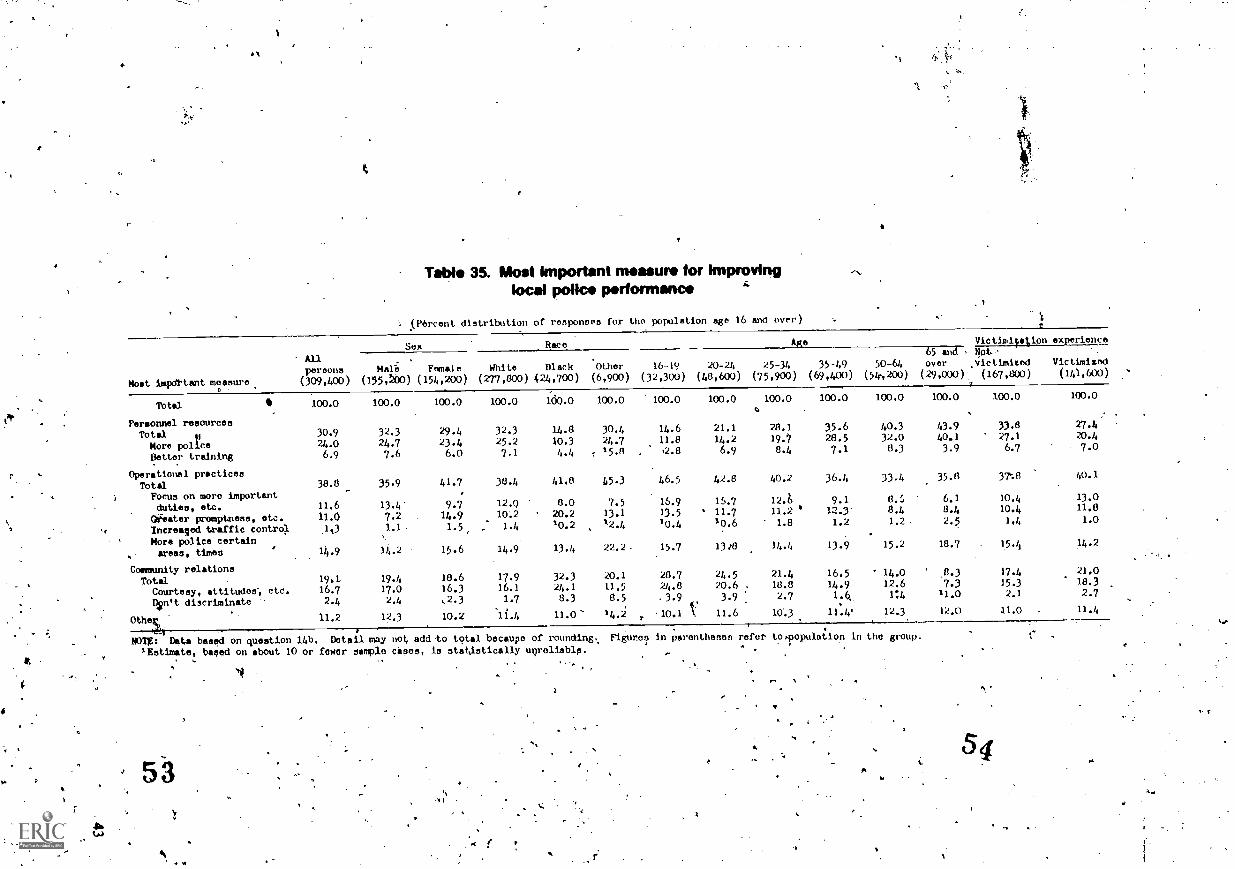
q."
UM* 35. Moot Important maim, for Improvinglocal police porformanc.
1,(Percent distribotion of responses for the population age 16 end over)
Most impdrtant mvisure
AUpersona
(309,400)
Sex Race 410 VictiaiTation experience
Male
(15A0)Female
(154,200)
White
(277,800)
Black424,700)
.
(6,900)Other 16-19
(32,300)20-24
(48,600)
25-34(75,900)
35-49(69,400)
50-64
(54..200) (29,000)
65 and ,
overDot-victimited Victimized
(167,800) (141,600)..
Total
Personnel resourcesTotal 0More policeBetter training
Operational practicesTotal
Focus on more importantduties, etc.Weater promptness, etc.Increaged traffic centre].
More police certain, areas, times
Community relations
TotalCourtesy, attitudes; etc.014In't discriminate
Othet
100.0
30.924.0
6.9
38.8
11.611.0
1,3
14.9
19.116.7
2.4
11.2
100.0
32.324.7
7.6
35.9
13.4
7.21.1
14.2
19.417.0
2.4
12.3
103.0
29.423.46.0
41.7
9.714.91.5,
15.6
113.6
16.3,2.3
10.2
100.0
32.325.27.1
38.4
12.0
10.2
1.4
14.9
17.916.1
1.7
11.4
100.0
14.810.3
4.4
41.8
8.020.210.2
13.4
32.3
24.1
8'311.0
1
100.0
30.424.715.8
65.3
7.513.1
14.4
22.2
20.1
11.58.5
14.
100.0
14.611.8.2.8
46.5
16.913.510.4
15.7
28.7
24.83.9
, '10.1
'
k
100.0
21.1
14.26.9
42.8
16.711.7
10,6
13.r8
24.520.6 .
3.9 1
11.6
100.0
28.1
19./
8.4
40.2
12.611.2
1.8
14.4
21.418.8
2.7
100
"1
100.0
35.628.57.1
36.4
9.112.31.2
13.9
16.5
14.91.4
11.4'
100.0
40.332.08.3
33.4
8.6
8.41,2
15.2
' 14.012.6
1412.3
100.0
43.940.13.9
35.8
6.1
8.42.5
18.7
8.3
7.311.0
12.0
100.0
33.827.1
6.7
370
10.4
10.41,4
15.4
17.4
15.32.1
41.0
100.0
27.420.4
7.0
40.1
13.011.8
1.0
14.2
21.018.3
2.7
11.4
NOW: Data based on question 14b, Detail may not add to total because of roundingt. Figuroa in parentheses refer to.populaiion In the group.
f 'Estimate, based on about 10 or fewer sample cases, is statastically ugroliable..
e
5-3
(A)
A
t"
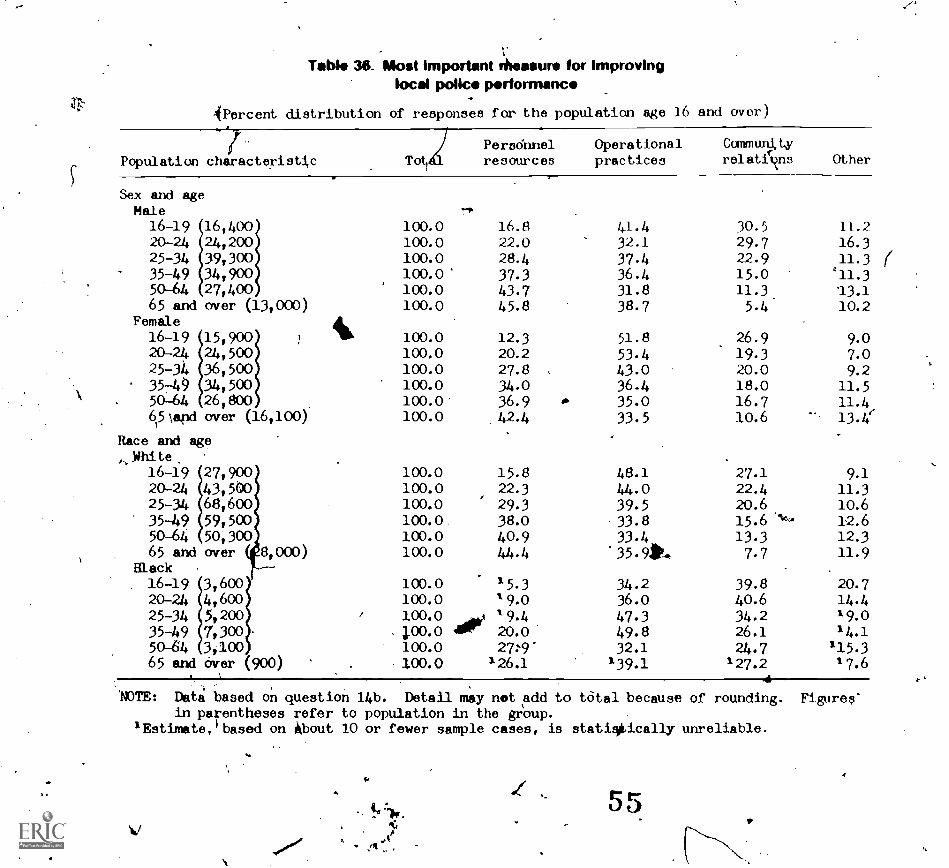
Table 38_ Most Important theasure for Improvinglocal police performance
4Percent distribution of responses for the population age 16 and over)
Population characteristic T t
Persdnnelresources
Sex and ageMale16-1920-2425-3435-4950-6465 and
Female16-1920-2425-34
3574950-64
615\apd
16,40024,20039,30034,90027,400over (13,000)
15,900 )
24,50036,500
34,50026,800over (16,100
Race and ageWhite,
16-19 27,90020-24 43,50025-34 68,60035-49 59,50050-64 50,30065 and over 8 000)
Black16-19 3 60020-24 4,60025-34 5120035-49 7,30050-64 3,10065 and aver (900)
100.0100.0100.0100.0100.0100.0
100.0100.0100.0100.0100.0100.0
100.0100.0100.0100.0100.0100.0
100.0100.0100.0100.01000100.0
.re
16.822.028.4
37.343.745.8
12.320.227.8
34.036.9
42.4
15.822.329.338.0
40.944.4
15.31 9.0
1 9.4
2o.0279'
126.1
Operationalpractices
CommunktyrelatAns Other
41.432.1
37.436.431.838.7
30.529.722.915.011.3
5.4'
11.2
16.311.3411.3
13.110.2
51.8 26.9 9.0
53.4 19.3 7.0
43.0 20.0 9.236.4 18.0 11.5
35.0 16.7 11.433.5 10.6 13.4c
48.1 27.1 9.1
44.0 22.4 11.339.5 20.6 10.6
33.8 15.6 10- 12.6
33.4 13.3 12.3
'35.9110. 7.7 11.9
34.2 39.8 20.736.0 40.6 14.447.3 34.2 19.0
49.8 26.1 14.132.1 24.7 115.3
139.1 127.2 17.64
NOTE: Dat o;. based on question 14b. Detail may net add to total because of rounding. Figures'in parentheses refer to population in the goup.
lEstimate,/based on 4bottt 10 or fewer sample cases, is statisikically unreliable.
V55
(
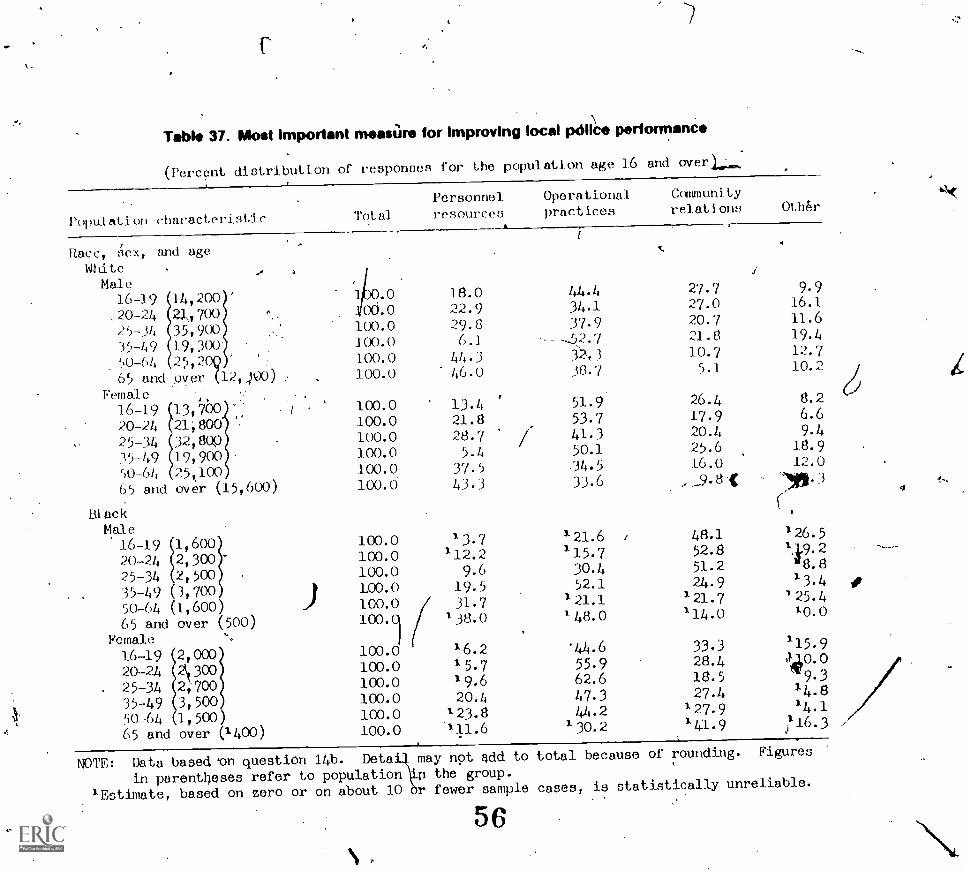
Table 37. Most Important measare for Improving local pollee performance
(Percent distribution or responses for the population age 16 and overt...,
r)pul atioh characteristi
Race, Acx, and ageWhite
.,.
Male16-19 14,200 '
,20-24 21,70025-34 35,90035-4 9 19, 3(X).
50-64 251,
65 and-.over 400)
Female16-1 9 13, 700
.
20-24 21,80025-34 :32, 80P
35-49 19,90050-64 25,10065 and over (15,600)
BlackMale16-19 1,600
1
20-24 2,30025-34 2,500
50-64 (1,600)65 and over (500)
35-49 3,700
Female
Z20-24 00016-19 2,000
25-34 2,700
35-49 3,50050-64 1,500)65 and over (1400)
:
Personnel Operational
Total resources practices
.;
.0 18.0 44.4 27.7
00.0 22.9 34.1 27.0
100.0 29.8 37.9 20.7
100.0 6.1 -52.7 21.8
100. 0 44.3 321, 3 10. 7
100.0 46.0 38. 7 5.1
,
100.0 13.4
Cawnunityrelations
51.9 26.4
100.0 21.8 53.7 17.9
100.0 28.7 41.3 20.4
100.0 5.4 50.1 25.6
100.0 37.5 34.5 16.0
100.0 43. 3 33.6 _9.8 1[
100.0 1 3.7 '21.6 , 48.1
100.0 '12.2 "15.7 52.8
100.0 9.6 30.4 51.2
1.00.0 19.5 52.1 24.9
...) 100.0 31.7 1 21.1 1 21 .7
138.0 148.0 114.0
100.0 1 5.7 55.9100.0 16.2 '44.6 33.3
100.0100.0
19.620.4
62.6
47.3
100.0 123.8 44.2 '27.9
100.0 111.6 1 30. 2 141.9
0th61
9.916.1
11.6
19.412.710.2 /
08.26.6
9.418.912.0
'111. 3
(,
'26.5
28.81 3.4 0125.410.0
. .
NOTE: Data based on question 14b. Detai may not add to total because of rounding. Figures,
in parentheses refer to population n the group.
'Estimate, based on zero or on about 10 or fewer sample cases, is statistically unreliable.
56
3 .
Appondbi It
Survey Instrument
t/rorm NCS 6. the attitude sin vcv instrument, contains two batteries of questions. The first ol these.covering items 1 through 7, was used to elicit data from8 knowledgeabk adult member tif eacir household (i.e.,the household respondent). Question$ Kthiough 16were asked dn-ectly of each household !umbel age 16and over including the household respondent. Unlikethe procedure followed in the victumiation compo-nent of the survey, (here was no ision for proxyresponses on behalf of individual who were absent orincapacitated during the intervie ng period.
Data on the characteristics of th se interviewed, askwell rig details concerning any exper (Awes as victims of
the measured crimeS, were gathered with separateinstruments, Forms NCS 3 a id 4, which were admin- ,
/
istered immediately after NC. (i. Following is a fac-\... .'mile of the latter cluestionnaire,\supplemental forms
were a`vailable for uk in households where more thanthree persons were interviewed. Facsimilies of Forms118(CS 3.and 4 have not been inetuded in this report, but ,can bc found in Criminal Victimization SurverA inSan Diego, 1977.
4.;
4f),
4
C-
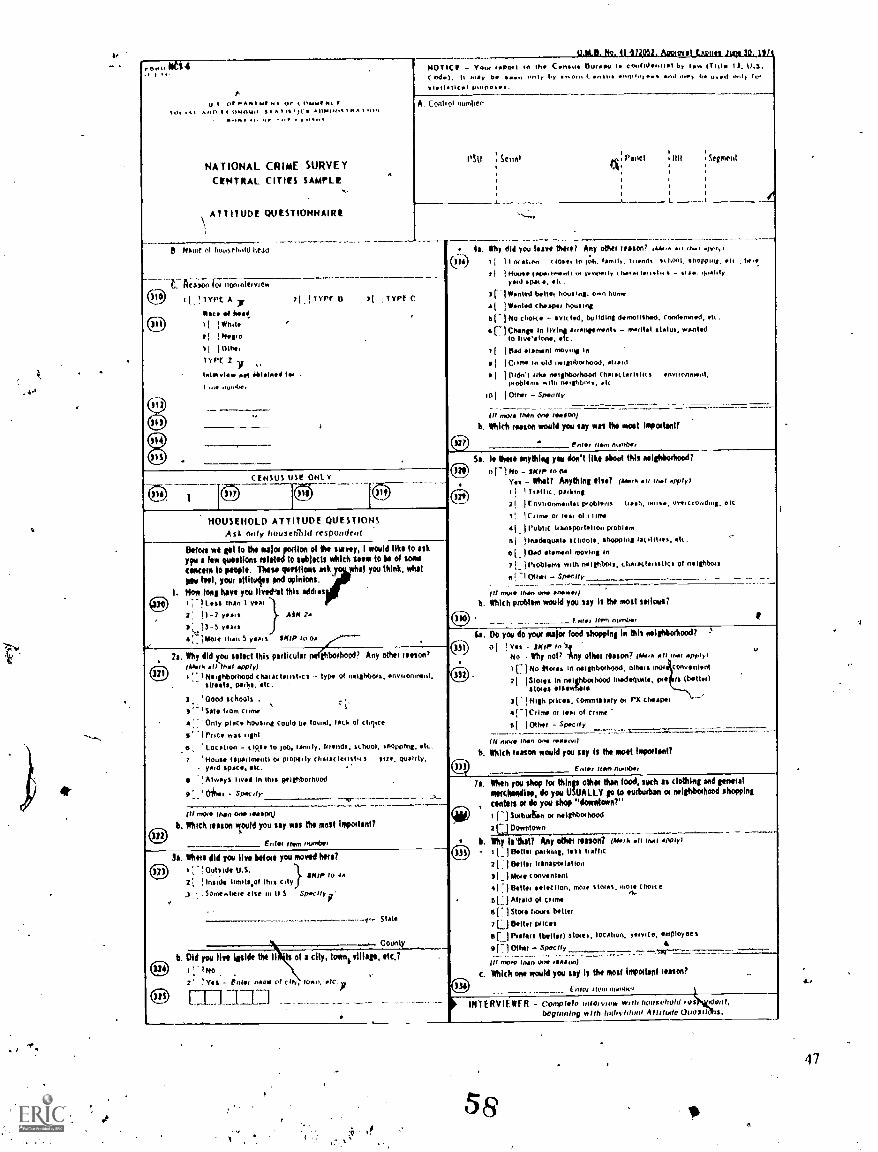
.
41-
tar
I Ono
u.s ye Ow MI No 1 Or t. ('MMt MI I001 501 AO0 II ONOMO 0101,0 1110,11Hos PO/4 OO
illrn " 0,
NATIONAL CRIME SURVEYCENTRAL CITIES SAMPLE
ATTITUDE QUESTIONNAIRE
e Now ol honNellnId lirdd
_ILMAL No. II ORM .tiongti_tnente har 30,117kmusic. - Yew aPml to Ift Cnati Uureett I. confidential by low (01114 Ij, t).$..4), II n., o it Only by Oen oso1 qool.I0,0 and hap b 0"1, 10,
11111c1 00/poen,
A Cont.& nwnlice
Panel Segment
t. ke-aaon fur nonmleryren
71 Iss!rt! is 'I Iyfq C
4a, Why did yOu Isere %CO Any other restos' lak.n. an 11.1 aro",
(11.14) I I n11lg00 110lef 10 1041. family. Inend 9.11001. shopi005. Il
HOLM. lopo.1./011 04 potOol1, I 60601101m1. - 01/ .1..0114yaid patis,
r-IV/anted ballet hous 0.17
Al (Minted Cheallei h0u11%
or )No choke - victed, building demolished. Condenwurd, etc.
6 [1 Chsnew In IlYing siiiingernents motile! status, wantedto Ilve`slone. etc
7( Paid Iernisni moving in
e l Ci ins, In old neighborhood. afraid
9 I Didn't Ilk* neighboihood Chatactiillstics 010,110111,14101.
poOblant with .111r1.1)0..
101 10ther - Spoolly ------(f ino/1 man On I011)
b. Which reason would you say was Itree1424I hroortonIT
enter Mot numbir
116
CENSUS USE ONLY
HOUSEHOLD ATT TUDE QUESTIONSAuk Only hoUscald sesgondent
Before wt get to the major portion of Me surviy, I would Ilk, to talkyou a her questions mlatird to subjects which set* to be of someconcern lo 'motif. These ;potations asky what you think, what
pav yam PURIM and opinions.How Nag hays you Drell this Wilms
; loss than 1 veoi
2: ! 1-2 yeain Ail( 242., I 3-5 Years
4, titbit than 5 yams SKIP to ria
)79
Si. Is More anythlag yew don't Ilk, Mout this nalgliborh00d7
-)No - IMP innsYs - What? Anything Ilse? lt.i opply)
pinking
2! I EnvliOnrilent11 otoblnts !gash, itois, ureic/0..11mo. etc
3 I C./me 01 Iva, ol
4( 'Public tientpwletion caohlent
11I ;Inadequate schools, shopping facilities, etc.pi. ) Om, elemenl /pontos In
7 1_ PtOblielall wi(h neighbors. chin actei istics of neighboie
our, Spocliy
III 01010 Man ono 000...)b. Which problem would you say is the moil sedate?
I. Wet HO, numb., 1
Is. Why did you select [his pailiculat ghboihood? Any Ow (salon?(44.10 Illhaf apply)
?9.5hbethOOd Chalat 1,115142 typo of neighbors. envuOranent,theetli. pike. tc.
2 'Good schools ,
I.- 'Salo !tom fume:_ Only plaC houSina could be found, lock of cliclice
I NiC SVIS fight
6 'Locolion - clos to job, lannly, hotrods, ichoOl, shOpolng,k.7 'limn* IlIftailinentl Of oropirly chalaclerisfics Sire. wetly.
yen) space, 4k.!Aiwa * lived in this pitighborhood
91. ' Dirsi - Spec rly
(If meta than ono isosonJ
b. Which reason would you say was the most imorortant?
Erdal Hem numbv
31. %NI did you lire below you moved Ws?!outside U.S. sun. to 40
2: inside Inalts.of this city}SOinewheie eh. in U S SM.,' fly
1
6a. Do you do yout mulct food thoopMg In this nelehbeehnod?
0[ !Vat SNIP in'xaNo - Why nol7 -Any other reatera 001.111. oil 11.1 .ppirl
r No *toms In neighbOrhood, olhens MO4 COcheenlent
2115totes In nerobehow inadequst., (wm la (better)alma asewwe
31: !man prices, commissary or Tx crunpel41-IColrno Or Ism of crime
51 Otfor - Specify
f If more Mon one nianof
b. Which reason would ycsi say Is the most lorOoftliot?
Enter If*. 111,111.1I
County
b. Did you lir, Susi* the II s of a city, town, village, Mc.?0 IPSO2' VIS - Pols, Nome Of cliy, rOwn, IO,
7a. When you strop for things oils* than food, such as clothing and postalutrchoollso, do you USUALLY go to suctruban or neighborhood shopping
, contort or do you shoo "dowolown?"Unbutton or 11e11012434 hood
'Li Downtown
I. Why IslIttI7 Any othor mason? (tow' oil (oaf 400fYi- Dells, packing, less traffic
21.-: 1 Bette, tanlipol lotion
21_ 1 MOle c011011111111
41 :1Bottei seletlIon, mole stoles, fll0, Choice
L mum' of clime6 11 5101e lams better
7 Li Douai PflCellF.] Pisle,, lbettsil stoles. locAloon. soleiCe. oolyloyer5
9 (- Speelfy !vier_(it mow roan one rowffivol
C. Which one would you say Is tite most irroonanf Nasal?
°for Moo
INTERVIEWER - Conyilefe Intel WU* wall ilinniehOlti 1 Q5beginning wish Individual Attitude °neat! Ls.
58
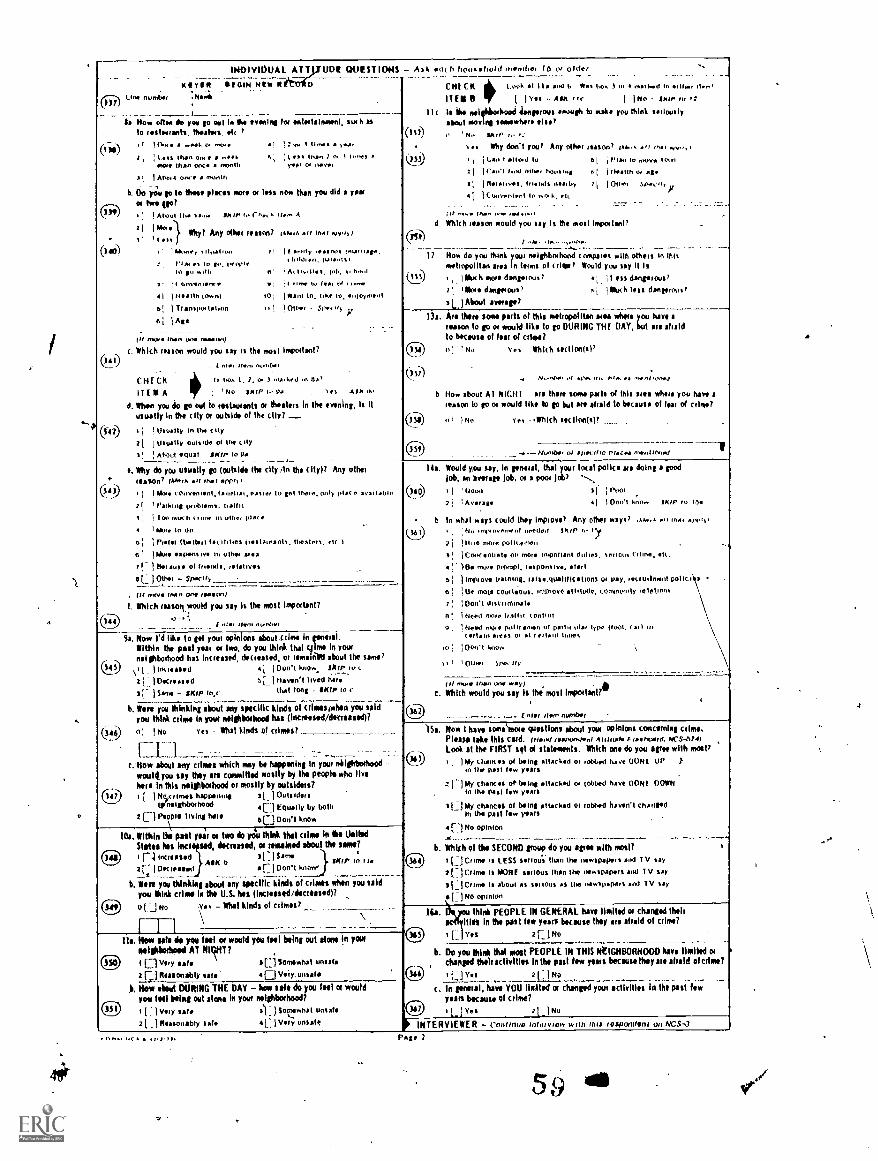
INDIVIDUAL ATTIJUDW QUESTIONS - Ash 4444 h hOoleholil olOothot 16 04 Older- -
Nevelt - Ilt0114 Hew N
(3-7)LIne nurnbel .11Irab
la Ho. AO. 60 yoa In cul I. Ise @vented la entellehsment, such asto testswents, Masten, CII ,
r 10,@
; tss than on, C P lIfl h, :I es. Inan 2 o.mote than OnC. a 14,04,11,
Ahoul or.'0 C mooih
b. Do Yoriu p to Mesa pieces more or Ins now than you did a yewet two Igo?
o : !Aboot theII Mon;} .
wily( mny otml mason/ (.1.,h .11 Ina, .41014
(a )4)
34/ 12.A..
! 1 oti
I 'Money itybalu.n
2 1'14...1 to ....p.(4".in go ...H.
1- !I ttriventent
41 1444atth town)
Of, I Ttnslow talson
01 Age
1! I i amily ro11003 Im.".4114.hdillo. pa,ti I
<1. fob. 1, 'tool
; 1 mon.. or lea,
101 1141111 to, ithe to, 11107mant
1,1 Othet - 514.4.111
(ie n'42/ 1440 oli rea.1.)c. Which te4ICW1 would you say is the most bivalent,
nl, ru...(
CHICK I. bOA 1, 1, 42. 3 rmontsed .n
ITEMA No sill), I., 92 el .4 ,Ift
0. Whew ru 6o p out to tersteuten(s ot theaters In the evenIng, IS itusually In the city ce outside of the My?
117) II tlloally In the city2( 11Jsualgy Outside 01 the city
3! !Abp.( !qua! SKIP in 9.
, Why do ycor usually go (cubicle (ha city ito the city)? Any other(013O117 (A2er Il ft.! Am') I
!Md. l'Onvenient, familial, CASIO) to get thole, ()lily pia( e Avallabio
2 I Patin/to p/nblrni.Too mm11(111111' III lithe, piece
4 I 144o4e to do
0: 1 hetet tbattnit fat,Itthes 1141.mants, !beaten. .14 1
ft 09onstve II, 0144 ate,71-It:location ol Mends, /41allves
e jOthu SPclly
(it tocu IMO (FM mason)I. Which masoli.would you say Is the most Important?
(s49
t ote, 1100.
9a. Now I'd Ilk, to get you, opinions about Orb in ironsusl-Within the past year as Iwo, do you think that 41rno lo yourneighborhood has Increased, decteased, or remalatl about the same?
1111,10,441d 4 100111 MO.. ShifloZ L. 0.0...d L. ( Haven't lived /Uwe
31 -) Same - SKIP to; ltot long SKIP to c
b, Were you thinking about sny specific kinds ol crimesmhsn you saidyou think crime In your neighborhood has (increased/deasased)?
No yrs - Ilfhat Minds of crimes?Q44
la -Ic.-How aboul any camas which may be happening In you' neighborhood
smutq you say they ifl committed mostly by the people who lirekers In this neillhbothood on mostly by outsiders?
(4-1) I [ (No-crimes 11333Pen11111 3 L I CW131114(3,
tent ighbothood en Equally by both2 ci Pv?le living hot. So Don't knowl>
tles. Within ths past year or two do you think thet crime in lks Wilted
States ges INC( sod, decreased, a temairsed about the same?CS) I (-4 levelled 5E13am
2( I 04(14,114441 4r: I Don't know')ASK b SKIP to 114
b. Were you thinking about any specific kinds of Oats vitten you soldyou lkink crime le the U.S. has Ileciessed/decressed)7
C) 0 I_JNo Yes - What kinds of crimes?.
(1st)
I I c
CHICK 001, I II. and I, Was hot 30,4 mall...If In 1114., item,
17E1 )Ya - AM r re I )110 - IMP fo 12
is ise neltbeetsosell Leprous enough to make you think sellouslyabout may rig somewhat@ else
14 Why don't you? Any oily, reaSoint /ob..,
j Lan 1.44040 to lo ntove .00.21 Irani /not orton hottints of, 111001th 0) nee
)1 I ftalattsvs. 1/10411 numb, 41 I °the,
41 ICOnvynint lo 00, I, el,
IU 11105 1114,, 4V10 ova4o11
d Which t1141011 would you say Is the most bivalent,
05-
I? How do you think yout nelgelhothood (maples with othets in thisreeltopolltan sees In terms ol (due Mould you say II le
!Mix h Imo deoptous 4 I ell den/MOUS?
2 igloo* dangmous,
3L.iod1t aVe1SIS7
ni IWO+ less dangerous?
--
0 50
I3e. Ale Iitete soma parts ol this metropolitan yea wham you hare ameson to go a woutd Ilke to p DURING TM DAY , but are afieldto beams. of fear ol alms?0; ' v.. Which section(1),
Nt,o0e, of APO, plos
b How shout Al itiCiti ale there sone puts of DOI Biel where you hare areason to p 01 would Ilk@ to p but are Mudd to because of lea of alms?
01 No v., -.Which 1001001? .
-4-.N...n,be. 02 apecillo mac. ...oltootkt
Ila. Would you say, In gimlet, that your local police Ate doing a podlob, an anted* lob, cm a poor Job?
060 I uomi II Pool
2 lAverage 41 Don't know OUP /0 to.
In *hal ways Emit, they 110PrOve2 Any onset ways, As../. A., tholl,nrInvement neOtlotl SKIP fo
2 j Illtos mina pOlnenten
I Ceotentole on .01.0 nuonitant (1,11101, Cf ltt.4144 moo. prompt, tspOnsIve, alert
51 1IMPI00e training. talsAsualllIcations su pay, rettuilment poticAs
0104.11COuilOus. Indhort attitude, tonvnynity in let,Inni
71 IDon't thstrinitnal.nl 1Need nwre If Mtn' «Mtn)!
9 1 Need ovie nottrtnnen of nett., yda, typo th.)01, (of) nt(attain Antes o, el (eft/tin hale%
tol 100.0.1
101110i Spot-II,.
tI num than (VW way)C. Which would you say Is the rnosl inspottant?
(mot itt)n numbyt
115a. Now than scene'inore questions about yam opinions camomile/ crime.Isite IhIS cad. (Hum' reopoodunt Altitude F lastvoard. Ar$-A74)
Look al the FIRST sot oi statements. Which one do you agree with most?
q I ; 'My chancs I being atlicked 01 raked have (IONS lip 1in the nett few years
1h/ty chances ot being attacked of tokbed have DOM DOWNIn the Pest few yeaut
A LI Ssy chances of being attacked or lobbed haven't changed
.riNIn
othaopm9a10041 few yeats
b. WhIgh of the SECOND group do you apes with most?Crime is LESS tattoo's. than the newspapets and T V say
[iCtIrne IS MORE 1111001 than the newSpapets end TV say
SILICrIrne I. about II 15110115 as the neulpapetS and TV se)
-I No minion
He. New Sate do yew feel of would yoaa Ibl being out MONO In yourneighborhood AT NIIHT? ,C) i Li Very safe S[' Somewhat unsafe
2 EJ Plessonahly cafe 4D Vety. unsafe
b. How abut DURING THE DAY - Mow sate do you fbl a wouldyou fool being out alone In your neighborhood?
I \rely so. il_ jSowhat unsafe21, .1 KIASOnably late 4 1:: 1 Villy unsafe
lb. fl,,you think PEOPLE IN GENERAL hart limited or changed theirRib In the past few years because they are amid of came?0 I [i Yes 2LJNO
b. Do you thInk that most PEOPLE IN THIS NrIGHBORHOOD have Hailed orchanged !hell activities irt the past few years because they ars ahald aloft's*?
IJYii 2(:Ittoc. In moral, hoes YOU limited or changed you! activities In the Past kw
yams because of crime?0 Li Yes 21_1
11" INTERVIEWER - Coniinue 1 InttIVItlib wilts 111if lospomitm oil NCS-J
No
,.." .1III1 Page
5 9 di
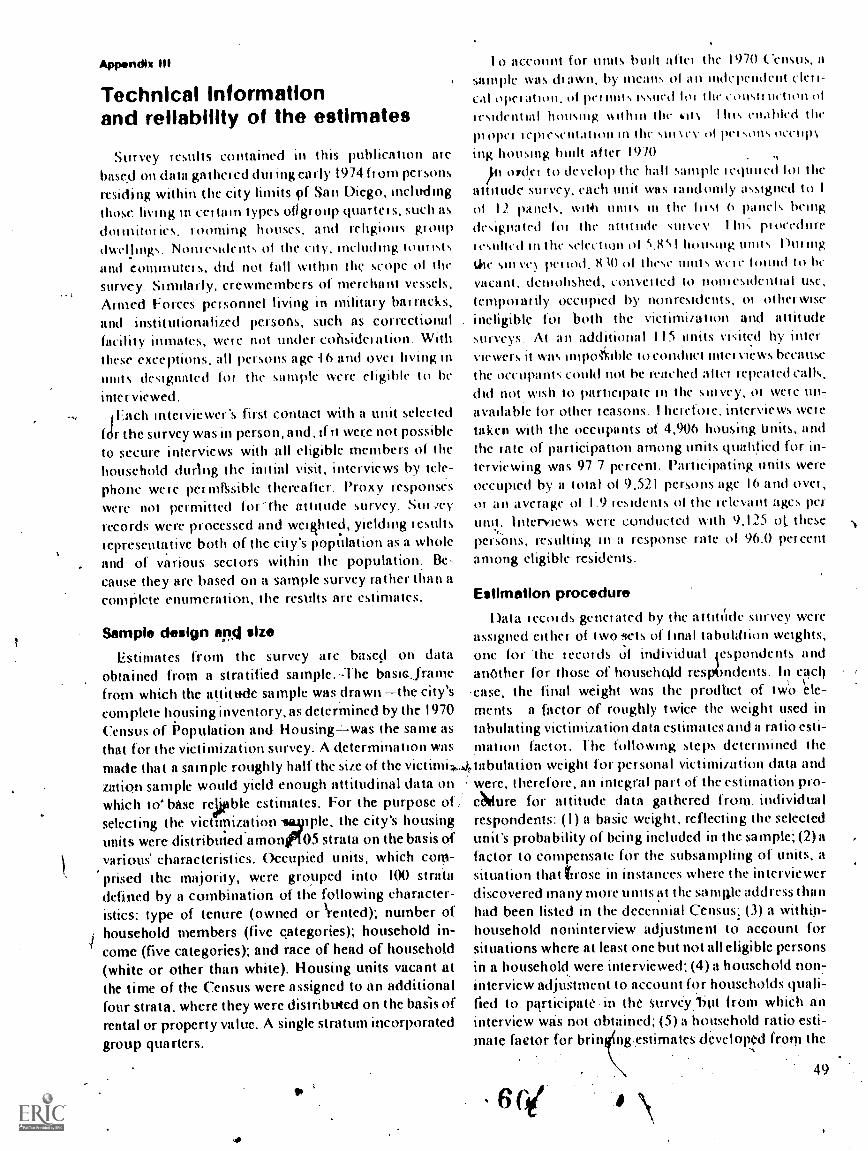
Appondlx III
Technical informationand reliability of the estimates
Survey results contained in this publication arcbase.d on data gathered dui ing early 197411 om personsresiding within the city limits cif San Diego, includingthose living in eel tam types ofigroup quartets, such asdounum ics, rooming houses, and religious groupdwellings. Nomesidents 01 the city, including tom istsand Commutet s, did not fall within the scope 01 tlwsurvey. Similarly, crewmembers of merchant vessels,Armed Forces personnel living in military bat racks,and institutionalized persons, such as correctiomtfacility inmates, wer c not under cobsideration. Withthese exceptions, all persons age 16 and over hying niunits designated lot the sample were eligible to be
interviewed.lEach interviewer's first contact with a unit selected
kir the survey was in person, and, if it were not possibleto secure interviews with all eligible members of thehousehold during the initial visit,- interviews by tele-phone were permllisible thereafter. Proxy responseswere not permitted for-the attitude survey. Sul icyrecords were processed and weiklited, yielding iesultsrepresentative both of the city's population as a wholeand of various sectors within the population: Be-cause they are based on a sample survey rather than acomPlete enumeration, the results are estimates.
10 account tor units built aftet the 1970 Census, asample was di awn, by means ol an independentcal one! :won, Of pet mos issued lot die nowt, ortesulential housing wthin the .its I hits enabled the
opei i (Am esentation iii I lit %III Xi's' pel soils occupying housing built after 1970
pl only, to develop the hall sample i equn ed lot theattitude survey, each unit was randomly assigned to 101 12 panels, wit4i units in the lust 6 panels beingdestgnated for the attitude sin vey 1 hii puocednre
(-stilted iii the selection of 5.)0 I housing Wills DM mgveN pet tod, 81() 01 these units wei e lound to be
vacant, demolished, con vetted to nom estdential use,temporarily occupied by nonresidents, in otherwiseineligible for both the victimization and attitudesurveys. At an additional 115 units visited by inter-viewers it was IMI)01%Ible c011ihR1 Intel vlewti hecalltiehe occ u put ii ts could not be reached a net irpeated calls,
did not wish to participate in the survey. ot were un-available tor other reasons. 1 herefoie, interviews wet etaken with the occupants of 4,906 housing Units, andthe rate of participation among units qualified for in-terviewing was 97 7 percent. Participating units wereoccupied by a total ol 9,521 persons age 16 and over,or an average ol 1.9 lesidents ol the relevant ages perunit. Interviews were conducted with 9,125 01, thesepersons, resulting in a response rate of 96.0 percentamong eligible residents.
Estimation procedureData iecords genet ated by the attaide survey were
Sample design am size assigned either of two lets of f inal tabulation weights,Estimates from the survey are based on data one for -the tecords of individual espondents and
obtained from a stratified sample..-The basieJrame another for those of houselukld res ndents. In cacti
from which the attitude sample was.drawn the city's -case, the final weight was the prodtict of twO le-
complete housing inventory, as determined by the 1970 ments a factor of roughly twice the weight used inCensus of Population and Housing--:--was the same as tabulating victimization data estimates and a ratio esti-
that for the victimization survey. A determination was mation factor. 1-he following steps determined themade that a sample roughly half the size of the victinutabulation weight for personal victimization data andzation sample would yield enough attitudinal data on were, therefore, an integral part of the estimation pro-
which to base re ble estimates. For the purpose of .- Alure for attitude data gathered from individualselecting the victimization -_ vie, the city's housing respondents: (1) a basic weight, reflecting the selectedunits were distributed amone05 strata on the basis of unit's probability of being included in the sample; (2)avarioa characteristics. Occupied units, which com- factor to compensate for the subsampling of units, aprised the majority, were gro.uped into 100 strata situation that firose in instances where the interviewerdefined by a combination of the following character- discovered many more units at the sample address than
istics: type of tenure (owned or Irented); number of had been listed in the decennial Census; (3) a within-.household members (five ca(egories); household in- household noninterview adjustment to account forcome (five categories); and race of head of household situations where at least one but not all eligible persons
(white or other than white). Housing units vacant at in a household were interviewed; (4) a household non:-
the time of the Census were assigned to an additional interview adjustment to account for households quali-four strata, where they were distribu4ed on the basis of fled to. piirtieipate in the. survey.tiut / rom whieh rinrental or property value. A single stratum incorporated interview was not obtained; (5) a household ratio esti-
group quarters. mate factor for brin ng.estimates developed from the
6 Oi49
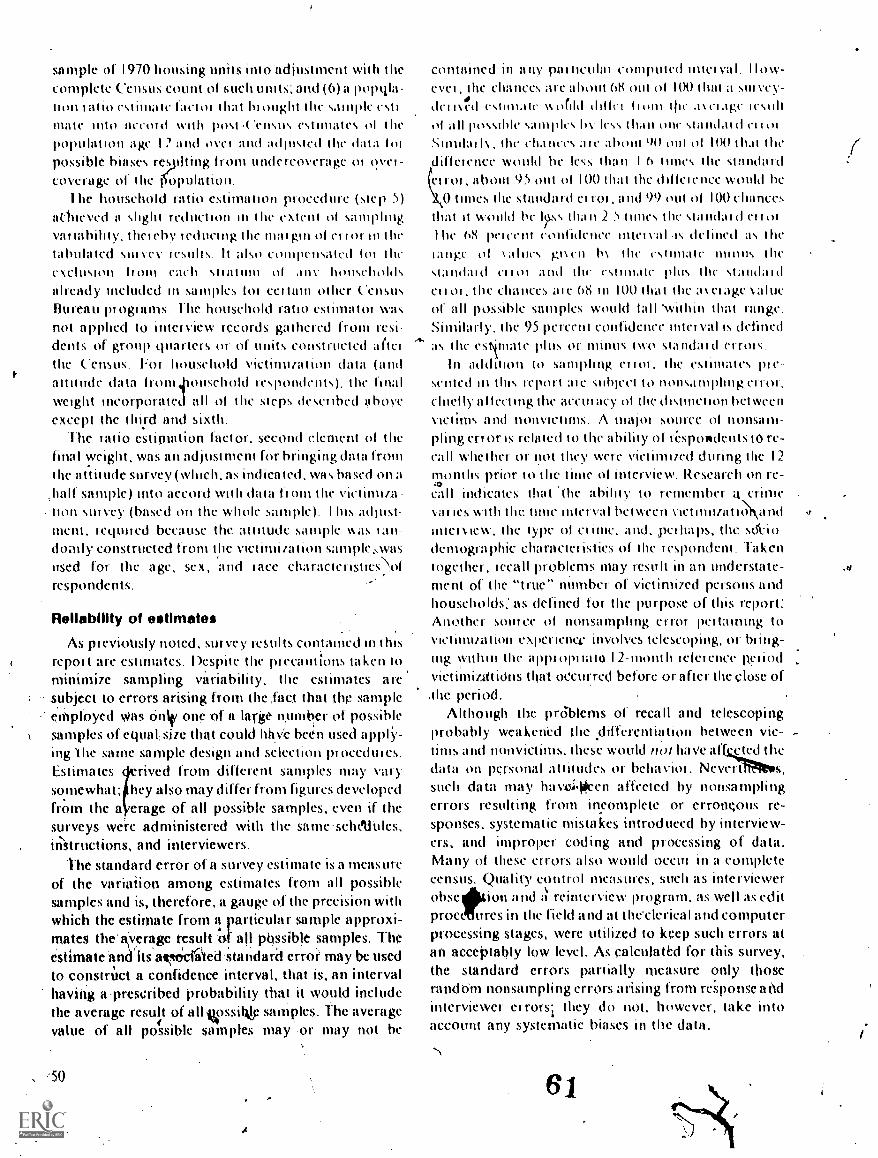
sample of 1970 housing units into adjustment with thecomplete Census count of such units; and (()a popqlalion t atio estimate factoi that hi ought the sample estimate into accoid with post -Censns estimates 01 thepopulation age 12 and ovel and admsted the data liiipossible biases reniting from undereoverage ot Owl -coverage of the 1Sopula no n.
rhe household ratio estimation procedure (step 5)aChieved a slight reduction in 111C Cx1011 01 samplingvariability, the, ehy reducing the !limp!) ol (-riot in thetabulated sulvey It-sults. It also compensated lot theeNcIlls1011 110111 C101 \1111111111 iii 111V householdsalready included in samples toi eel tam other CensusBureau programs. Die household ratio estimator wasnot applied to interview records gathered from resi-dents of group quarters or of units CollS1mtleled afterthe Census. For household victimization data (andattitude data Irom4ionsehold respondents). the finalweight incorporated all ot the steps desenbed aboveexcept the third and sixth.
the !alio estimation factor, second clement ol thefinal weight, was an adjustment for bringing data fromthe attitude survey (which, as indicated, was based on ahalf sample) into accord with data limn the victimiza-tion survey (based on the whole sample). 1 Ins adjust-ment. requited because the attitude sample was tan-domly constructed from die victimization sample,wasused for the age, sex, and lace characteristicsofrespondents.
Reliability of estimates
As pievioUsly noted, survey results contained in thisrepot t are estimates. Despite the pi (-cautions taken tominimize sampling variability, the estimates aresubject to errors arising from the,fact that Ow sample
- eiriployed Was critic one of a large number of possiblesamples of equal:size that could have been used appling the same sample design and selection pi ocedui es.Estimatessomewhat;from the a
rived from different samples may varyhey also may differ from figures developederage of all possible samples, even if the
surveys were administered with the sameschalides,iristructions, and interviewers.
The standard error of a survey estimate is a measureof the variation among estimates from all possiblesamples and is, therefore, a gauge of the precision withwhich the estimate from a rarticular sample approxi-.mates the'average result .o all pOssible samples. Theestimate and'its'acited.Standard error may be usedto constrUct a confidence interval, that is, an intervalhaving a ,prescribed probability that it would includethe average result of all i4ossiklp samples. The averagevalue of all possible samples may .or may not be
, 50
contained in any pal-nodal computed Intel val. How-evei , the chalices are Amin 6K out (il 100 that a sut vey-detistd estimate ss dild (Idler hum tlic as ci age iesult01 all possible samples bv !Cs% I halt one standal (1 r11 01
S111111311\ Ille CILIIICcs Alt' :11)0111 00 0111 01 100 that the
dilleiener would he less than 1 n 11111Cs the standard
ctet tor, about 95 out 01100 that the dilleience would he0 times the standard el tor, and 99 out ol 100 chances
that it would be lksss than 2 5 times the slalldilld eiloiz
111C (Ili percent emitidenee Intel val -is defined as thehinge ol sallies gisen bs the estimate ninths f ht.
standaid ei lot and the estimate plus the standa idell oi, the chalices me 68 in 100 that the as claw: salueof all possible samples would tall 'within that range.Similarly, the 95 percent coididenee inn-Iva! is defined
.4. as the estimate plus or niinus two standatd errois.In addition to sampling mot, the estimates pt e-
sullied m this report are sublect to nonsampling error,chiefly Mick-ling the accinacy ol the distinction betweenvictims and nonvictuns. A major soutee ol nonsam-pling error is related to the ability ol ri.7spondents to re-call whether or not they were victimized during the 12months prior to the time ol interview. Research on re-:*call indicates that 'the ability to remember a crimevaries with the time interval between victunizatikiNandIntel view, the type ol ciune, and, Pk-titans, the s(tiodemographic characteristics of the respondent. Takentogether, iccall problems may result in an understate-ment of the "true" number of victimized persons andhouseholds; as defined for the purpose of this report:Another sower ol nonsampling error Pei taming tovictimization expetiener involves telescoping, or 1s1 ing-ing within the appi opi into 12-mont li tele! eller peliodvictimizittiOns that occurred before or after the close of,the period.
Although the prOblems of recall and telescopingprobably weakened the .differentiation between vic-tims and nonvietims, these would not have aff Tied thedata on personal attitudes or beha viol . Nevert .. ,
such data may ha voliken affected by nonsamplingerrors resulting from incomplete or erroneous re-sponses. systematic mistakes introduced by interview-ers, and improper coding and processing of data.Many of these errors also would °cern in a completecensus. Quality control measures, such as interviewerobse ion a nd
sa reinterview program, as well as edit
proct tires in the field and at the-clerical and computerprocessing stages, were utilized to keep such errors atan acceptably low level. As ealculati:d for this survey,the standard errors partially measure only thosera nd dm nonsampling errors arising from re'sponse andinterviewer errors; they do not, however, take into
,.
account any systematic biases in the data.
61
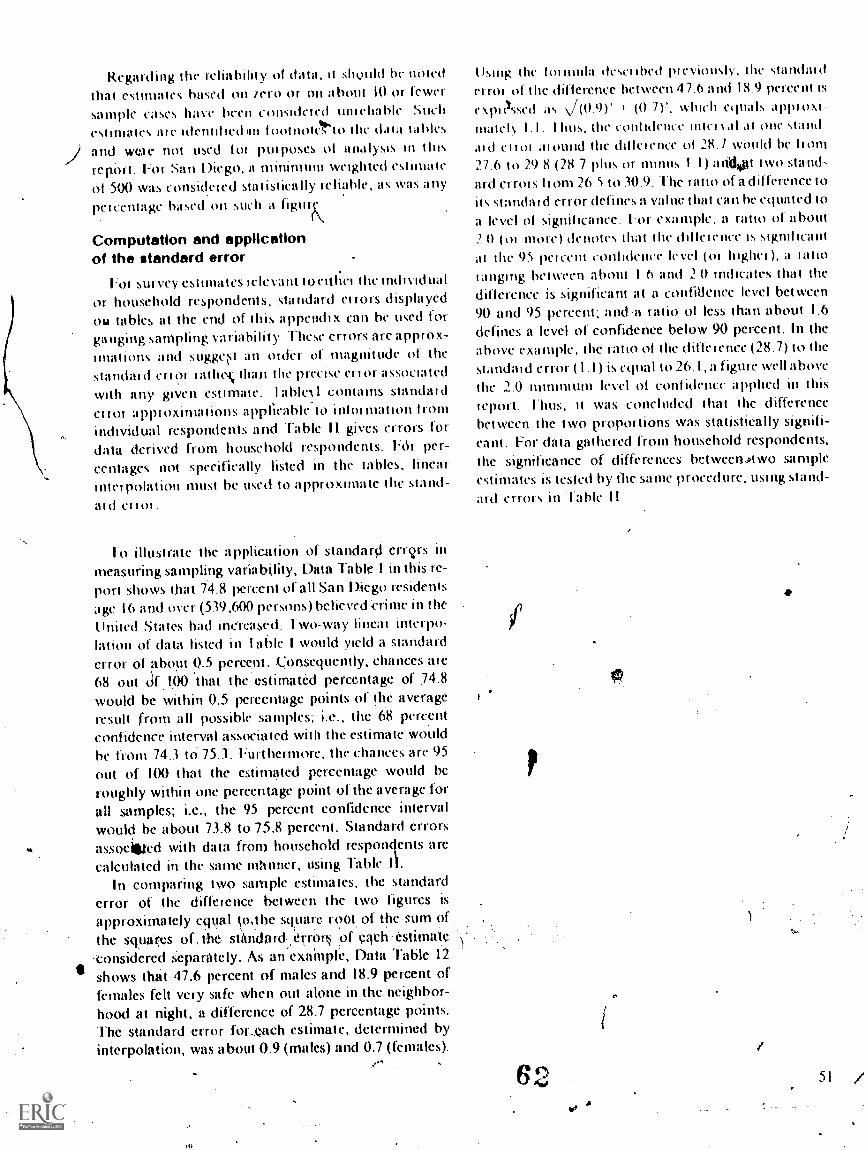
Regarding the reliabilny of data, it should be notedthat estimates based on rero or on about 10 or fewersample cases have been considered unreliable Stich
rst ;mates are identified lin footnottto the data tablesand wete not used lor puiposes ot analysis in this
report. For San Diego, a minimum weighted estimateof 500 was considered statistically reliable, as was anypercentage based on such a figury.
Computation and applicationof the standard error
1-ot Survey estimates relevant to either the individualor household respondents, standard errors displayedou tables at the end of this appendix can be used forgauging sampling variability_ These errors arc approx-imations and sugget an order of magnitude of thestandard error rathok than the precise ell or associatedwith any given estimate. I able% I contains standarderror approximations applicable to information fromindividual respondents and Table II gives errors fordata derived from household respondents. Fer per-centages not specifically listed in the tables, linearinterpolation must be used to approxlmate the stand-ard error _
to illustrate thc application of standar0 errgrs in
measuring sampling variability, Data Table 1 in this re-port shows that 74,8 percent of all San Diego residentsage 16 and over (539,600 persons) believed 'crime in theUnited States had increased. I wo-way linear interpo-lation of data listed in !able I would yield a standarderror of about 0.5 percent. Consequently, chances arc68 out of too that theestimated percentage of 74.8
would be within 0.5 percentage points of the averageresult from all possible samples; i.e., the 68 percentconfidence interval associated with the estimate wouldbe from 74.3 to 75.3. Furthermore. the chances are 95out of 100 that the estimated percentage would beroughly within one percentage point of the average forall samples; i.e., the 95 percent confidence intervalwould be about 73.8 to 75.8 percent. Standard errorsassociated with data from household respondents arecalculated in the same inh nner, using Table li.
In comparing two sample estimates, the standarderror of the difference between the two figures isapproximately equal to,the square root. of Ow sum ofthe squares of , the stAndarcf.e(Tor of each 'estimate-considered Separately. As an exaMplc, Data Table 12shows that 47.6 perccnt of males and 18.9 percent offemales felt very safe when out alone in the neighbor-hood at night, a difference of 28.7 percentage points.The standard error for_each estimate, determined byinterpolation, was about 0.9 (males) and 0.7 (females).
king the I ol inida desel i bed pi eviolis lv, the standarderror of the difference between 47.6 and 18.9 percent ist,expi( sse(., as v , 01 7).% which equals applom-nhitek 1.1. 1 hus, the confidence Inlet sal at one standaid CHOI al nand the diffelenee of 28.7 would be !tom27.6 to 29.8 (28 7 plus or minus 1.1) andot Iwo stand-ard Cirots horn 26.5 to 30.9. .1-he ratio of a difference toits standard error defines a value that can he equated toa level of significance. I'm example, a ratto of about2 0 (01 more) denotes Ihat the diffeience is significantat the 95 pelient Confidence luvel (or highei), a mholanging between about 1 6 and 2 0 indicates that thedifference is significant at a confidence level between90 and 95 percent; and .a ratio of less than about 1.6defines a level of confidence below 90 percent. In theabove example, the ratio of the diffeience (28.7) to thestandaid error (1.1) Is equal to 26.1, a figure well abovethe 2.0 minimum level ol confidence applied in thisreport. rhus, it was concluded that the differencebetween the two proportions was statistically signifi-cant. For data gathered from household respondents.the significance of differences bet ween,two sampleestimates is tested by the same procedure, using stand-ard errors in Table II
6,2
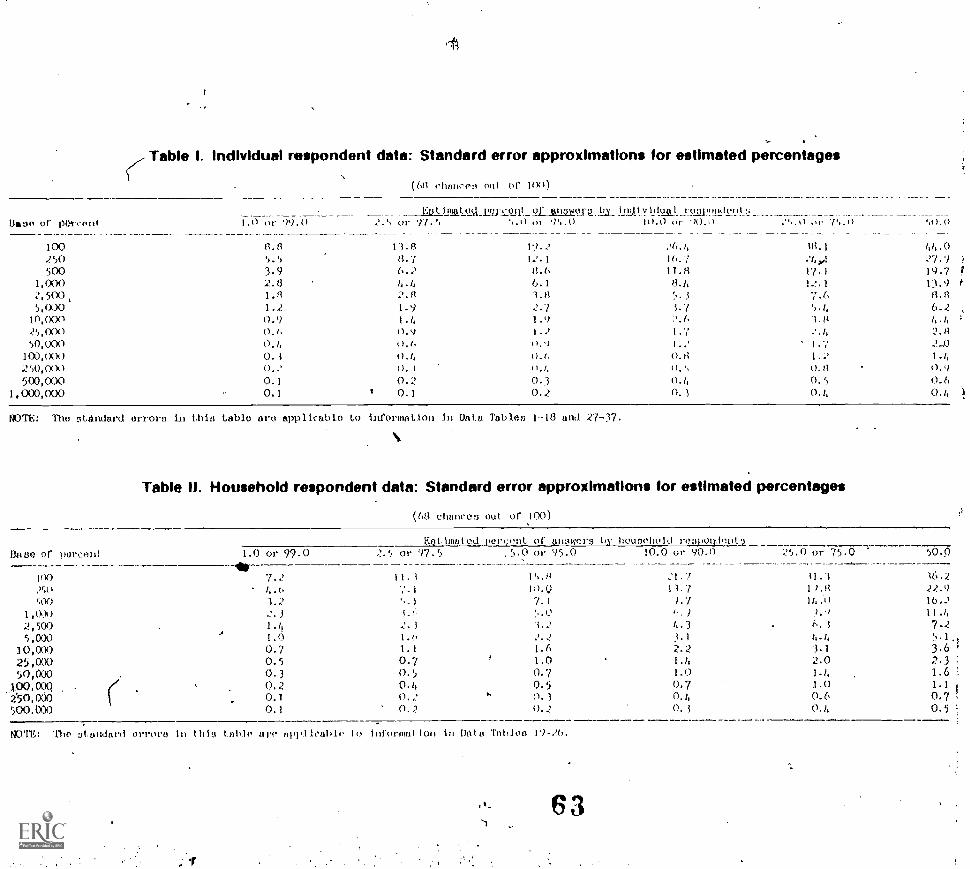
(Table I. Individual respondent data: Standard error approximations for estimated percentages
011) (hances out of 100)
lls 00 of 130s-cootEst. 3;31.1, ot,1 meoil( 03 attuw0r2. 17,y_ 1,.!.t v1d9al roapptidolit ;;.
1.0 or '.19.0 or 0 or ', 0 10.0 or ,",.) or 'DOA)
100 8.8 I 3.8 l').2 ..'11. 4 In. 1 1,4 .050 `.).'.) 8. 7 12.1 16. 7 .'1,1
500 3.9 6.2 8.6 11.8 17.1 19.7
1 ,(X)0 218 14.4 6.1 8.1, !2. I 13192 , 500 1.31 2.11 -3.41 5.3 7.6 8.8
5 , 000 1.2 1.9 2.7 3.7 5.4 6.210, 000 0.9 1 .1, 1 .9 2 . t 1. fl /, . /,
25,000 0.6 0.9 1 .% 1.7 2.4 21-1
50,000 0. /1 tl..) I ..' 1.7 2...0100,000 0. I ()./, 0.1. (3. t; 1. 2 1 ./,
250,000 O..' I). i i I.!, O. /1 0.9500,000 0.] 0.2 0.3 0.4 0. ',.. 0 . ,,,
1,000,000 0. 1 1 0.1 0.2 0.3 0,4 0,4
9DTE: The standard errors in this table aro applicable to information in Data Tables 1-16 and 27-37.
Table II. Household respondent data: Standard error approximations for estimated percentages
(68 chances out or st00)
Estimated percent: or o_usuors by household roo3t0nd.:01.2.
Bass or percent 1.0 or 99.0 7.5 or 97.5 .5.0 or 95.0 10.0 or 4010 25.0 or 75.0 50.9-ea
100 11. i 15.8 21.7 11.3 1(4.2
2r.0 446 10.Q 11.1 1 1.8 22.9400 3. 2 .. . 3 7.3 /.7 lb .0 10.2
1,0)0 2.3 5.t" '...0 1..3 1. 11.4
1.4 2.1 1.2 4.3 3 7.2A
5,000 140 1.6 3.1 h.r, 5.1.,
10,000 0.7 1.1 1.6 2.2 3.6
25,0(X) 0.5 0.7 v 1.0 I.h 2.0 2.3 ;
50,000 0.3 0.5 0.7 1.0 1.6 1
100,000 0.2 0.h 0.5 0.7 1.0 1.1
2'50, 000 0.1 0.2 b 0.1 0.4 0.6 0.7
500.0)0 0.1 0.2 0... 0.3 0.4 0.5
901.11.: The standard errors III t hht 1211)10 are m41110014. In Inform:it lon in DM a Thhlon 1
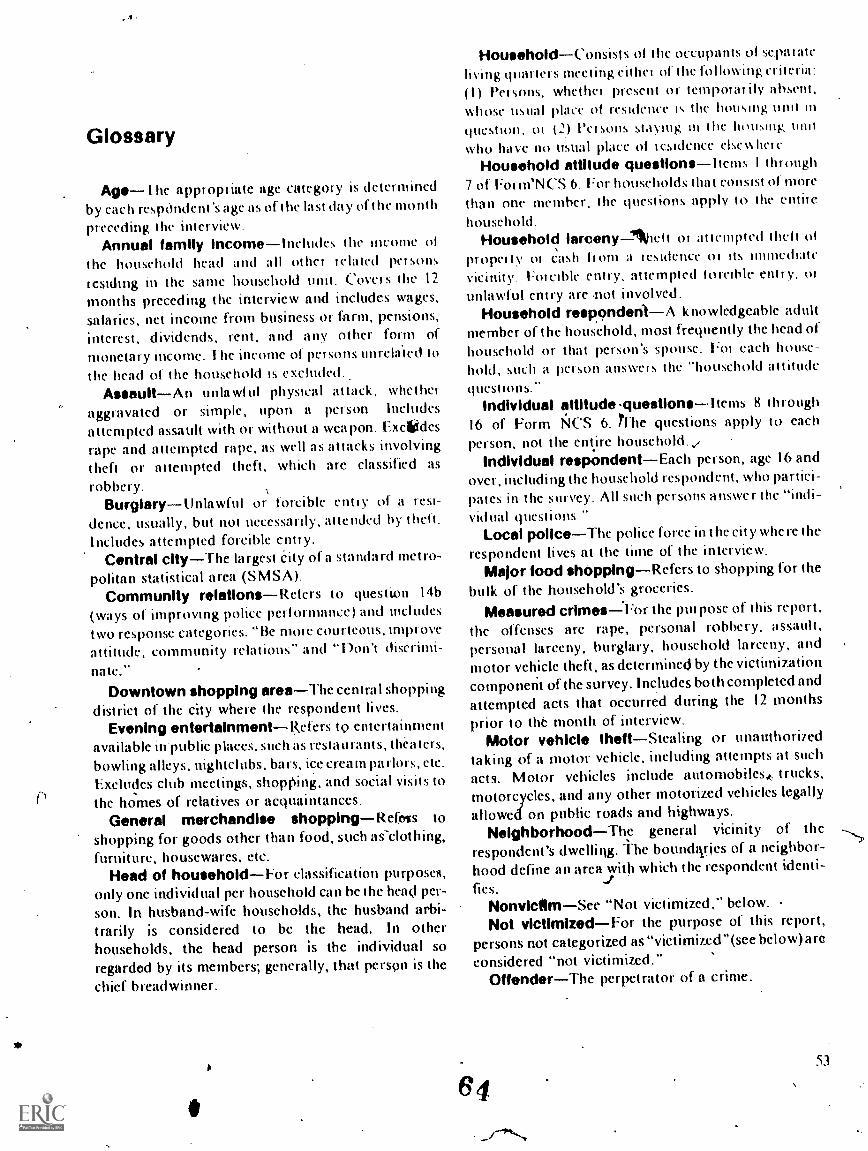
Glossary
Age I he appropriate age category is determinedby each respOndent 's age as of the last day of the month
preceding the interview_Annual family incomeIneludes the income of
the household head and all other related per sons
residing in the same household unit. Cover s the 12
months preceding the interview and includes wages,salaries, net income from business or farm, pensions,
interest, dividends, rent, and any other form ofmonetary income. The income of persons unrelaied to
the head of the household is excluded.AssaultAn unlawful physical attack, whether
aggravated or simple, upon a person. Includesattempted assault with or without a weapon. Exelllides
rape and attempted rape, as well as attacks involving
theft or attempted theft, which are classified as
robbery.Burglary Un la wful or forcible entry ol a resi-
dence, usually, but not necessarily, attended by theft.
Includes attempted forcible entry.Central cityThe largest City of a standard metro-
politan statistical area (SMSA).Community relationsReters to question 14b
(ways of improving police performance) and includes
two response categories: "Be more courteous, improveattitude, community relations" and "1 -)on't discrimi-
nate,"Downtown shopping areaThe centra I shopping
district of the city where the respondent lives.Evening entertainmentRefers to entertainment
available in-public places, such as restaurants, theaters,bowling alleys, nightclubs, bars, ice cream parlors, etc.Excludes club meetings, shopping, and social visits tothe homes of relatives or acquaintances.
General merchandise shopping Ke(reis toshopping for goods other than food, such as-clothing,furniture, housewares, etc.
Head of householdFor classification purposes,only one individual per household can be the head per-son. In husband-wife households, the husband arbi-trarily is considered to be the head. In otherhouseholds, the head person is the individual soregarded by its members; generally, that person is thechief breadwinner.
HouseholdConsist s of t he occupants ol sepai ateliving quartets meeting either of the following criteria:(I) Persons, whether present or temporarily absent,whose usual place of residence is the housing unit iiiquestion, or (2.) Persons staying in the housing Imo%yho have no usual place of residence elsewhere
Household attitude questions I tems 1 through7 of Form'NCS 6. For households that consist of morethan one member, the questions apply to the entire
household.Household larceny-1%dt or attempted theft of
property or cash from a residence or its immediatevicinity. 1:or citric entry, attempted loreible entry, otunlawlul entry arc .not involved.
Household respondeni A knowledgeable adultmember of the household, most frequently the head ofhousehold or that person's spouse. I'm each house-
hold, such a person answers the "household attitude
questions.-Individual attitude .questions Items 8 through
16 of Form Ne'S 6. the questions apply to eachperson, not the entire household.,,
individual respondentEach person, age 16 andOver, including the household respondent, who partici-pates in the survey. All such persons answer the "indi-vid nal quest ions.
Local policeThe police force in t he cit y where therespondent lives at the time of the interview.
Major food shOppingRefers to shopping for thebulk of the household's groceries.
Measured crimesFor the purpose of this report,
the offenses are rape, personal robbery, assault,
personal larceny, burglary, household larceny, and
motor vehicle theft, as determined by the victimizationcomponent of the survey. Includes both completed and
attempted acts that occurred during the 12 monthsprior to the month of interview.
Motor vehicle theftStealing or unauthoriiedtaking of a motor vehicle, including attempts at such
acts. Motor vehicles include automobilesk trucks,motorcycles, and any other motorized vehicles legally
allowed on public roads and highways.NeighborhoodThe general vicinity of the
respondent's dwelling. The boundiries of a neighbor-hood define an area with which the respondent identi-
fies.NonvIcOmSee "Not victimized," below. .
Not victimizedFor the purpose of this report,persons not categorized as "vietimized"(see below)areconsidered "not victimized."
OffenderThe perpetrator of a crime.
53
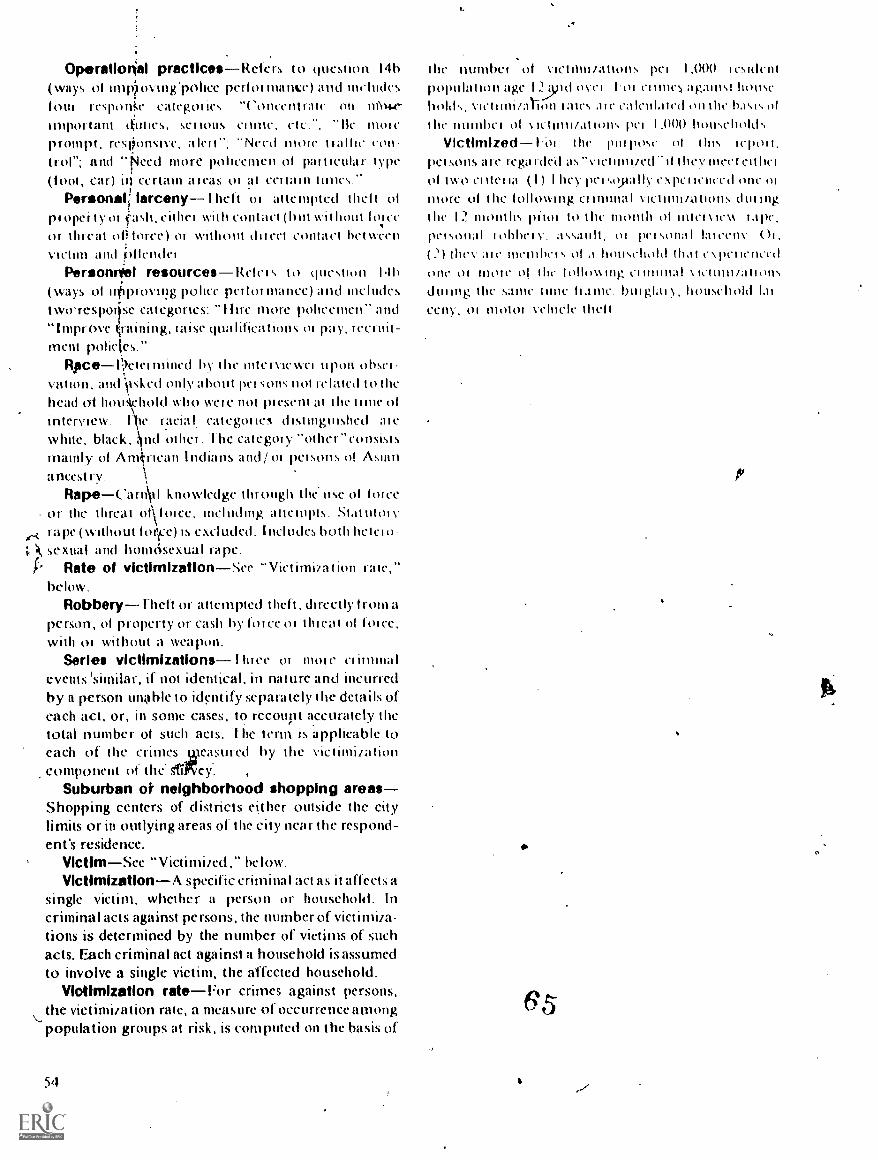
Operatimial practicesite.ers to question 14b(ways of imOoving'police pert ()finance) and includesout responi,e eategot les "Concentrate on iM4 e-
1111pol-tam senous cuinit. etc.". -Ik moleprompt, resionsive, a kW': -Need num- traffic con-trol"; and -Need more policemen of pat tieular type(toot, car) in certain a teas 01 at (-roam 11111es.-
Personal; larceny I het t of attempted theft ofpi Oyer ty or fash, either with contact (hut wit hout foi ccor threat forc(.' ) or wthout do CO (OIlla C1 betweenvictim and idlundei
Personnle1 resources RutC1 5 10 question rth(ways of lip' proving police pcilof mance) and includestwo-rcspote categories: "I lire More policemen'. and"lniprOve !training, raise qualifications or pay, recruit-ment policies."
FkaceOetei mined by the Intervie wet npon obsetvation, and \tsked only about pet sons not related to thehead ol hoinkehold who wete not piesent at tlw time olinterview. 1\he racial eategones distinguished atewhite, black, hnd othef -Fhe categm y -other" consistsmainly of A mrican Indians and/ or nelsons of Asiananus! ry.
RapeCarn'pl knowledge through the' rise of lot ceor the threat of\ force, mcluding attempts. Slat utolrape (without forice) is excluded. Includes both licteto-
k sexual and honuisexual rape.Rate of victimizationSee "Victimi7ation rate,"
below.Robberytheft or attempted theft, directly from a
person, of property or cash by I of-CC 01- 1 hl ea 1 ol 101(T,with ol- without a weapon.
Series victimizations Iii ice 01 mote et imina 1events 'similar, if not identical, in nature and incurredby a person unable to identify separately the details ofeach act, or, in sonic cases, to recount accurately thetotal number of such acts. -I he term is applicable toeach of- the crimes measured by the victimirationComponent of t he. sliFey..
Suburban ot neighborhood shopping areasShopping centers of districts either outside the citylimits or in outlying areas of the city near the respond-ent's residence.
VictimSee "Victimized," below.VictimizationA specific criminal act as it affects a
single victim, whether a person or household. Incriminal acts against persons, the number of vietimiza-tions is determined by the number of victims of suchacts. Each criminal act against a household is assumedto involve a single victim, the affected household.
Viotimization rateFor crimes against persons,the victimization rate, a measure of- occurrence amongpopulation groups at risk, is computed on the basis of
54
thr number MI victilmiations pet 1,000 tesidentpopulation age 12 3,nd ovei 1.ot climes against households, sactlintraYiiin 1:11us AI(' calculated on tlw basis ofthe numbet ol pci 1.000 houscholds
Victimized Vot the put pose of this wpm!.pci sous are regarded as "vietinnied -tither meet cube!01 two it net la (1) 1 hey pet Nl !pally exi.ie tenced one otmore of the I ollowing ci munal vIC111111/.0liolis diningthe 12 months pinu to tluc month of iffici S lc NS 1,1 pr.
pyisonal t obbel v. ass:111h. 01 oci sona 1 lateens. Ch.
they air iuiciiilwm of a household that c pci icoccdonc wow ol I lie lollow mg cilmmal S ictunt/a thinsd ming the sanic tone II a me. lruigla i N, householdcent., m motot vehicle thew
tv
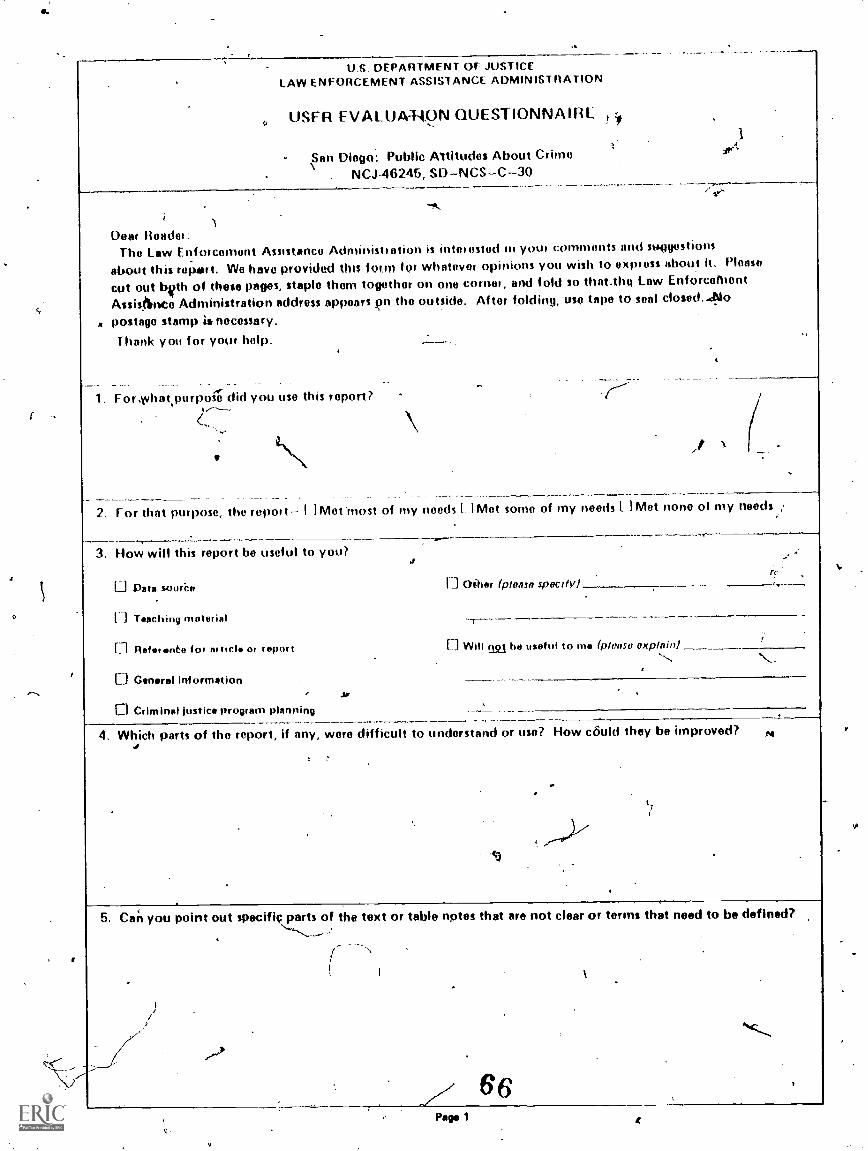
e.
U S. DEPARTMENT OF JUSTICELAW ENFORCEMENT ASSISI ANCE ADMINIST RATION
USFR EVALUATION QUESTIONNAIRE
San Diego: Public Attitudes About CrimeNCJ-46245, SDNCSC---30
Dear Header:The Law Enforcement Assistance Administration is interested in your comments and suggestions
about this report. We have provided this form for whatever opinions you wish to expioss about it. Please
cut out beth of these pages, staple them together on one comer, and fold so that,the Law Enforcelbent
Assis4nce Administration address appears pn the outside. After tolding, use tape to seal closed.410
A postage stamp-ia necessary.
Thank you for your help.
1. For,what.purpose did you use this report?
2. For that purpose, the report.- I I Met-most of my needs IMet some of my needs I Met none of my needs
3. How will this report be useful to you?
LI Data samba
I. I Teaching material
fieferente for nrtscl or report
O General information.sr
0 Criminal justice program planning
11 Other (please specify)
n Will pet be useful to m (please explain)
4. Which parts of the report, if any, were difficult to understand or use? How could they be improved?
s.
5. Can you point out specific parts of the text or table nptes that are not clear or terms that need to be defined?
6. Are there waYslhis report could he improved that you have not mentioned?
t-V
t
7. Please suggest other topics you wotild like to see addressed in future ar$alytic reports using National CrimeSurvey victimization and/or attitude data.
"g?
T..
"t
8. In whatVcity did you use this report?
lieerleitcler
'LJEduc.to r.
0 Studint
d Criminal latirdepency sinployae
-
-0.Govornmant other dont criminal justice - Specify
Other - Sfecify I. -NJ
8ego
s.
_9. 'If you use-ti this report as a governmentld employee, please indicate the level of government.
t 1 Federal I I Cify r--a
0 4, 1.71 Other Specifyslat. ,
.0 County .
.
10. If you used thit report as a criminal justice agency employee, please indicate the sector in which you work.
LI l aw enforcement (police) I I Corrections
li Legal HU vices and prosecution 0 ParoleMir .
0 Public or private defense services 0 Criminal justice planning agency%
-0 Courts or court administration .. ri Other criminal justiCe agency Specify type '
ll Probation
.
,
.Am- ----------- -L---
.
11. If you used this report a! a criminal justice employee, please indicate te type of position you hold. 'Mark all that apply. ,.
... .,
414.1.< .
El Agency or institution administreor 0 Program or project manager
0 General program plannr/evaluator/analyst 0 Statisticianrti Budget r] Other -Specifyplanner/evaluator/analyst .
. .
0 Operatibns or management plannedevaluator/anityst
.
12. Additional comtpents..
, .,
.1.
. -
,
. . -... 4,-----.4-,---'
,- -
,
_. .. ,
. - -
4
-. 7
.
..
. 4,-. .. ,
,
. ,
... ,
y,
- ... .
;-
7... . ., .
V. ..
111it
.
,
page 3 s
OPTIONALNam*
Numbs,' and strt
City
\./
mb .......
Tolephons
NCJ 46245SD--NCS -C-30
State ZIP C
(Fold hers)
-U.S. DEPARTMENT OF JUSTICELaw Enforcommit Assistanco AdministrationWashington, D.C. 20531
POSTAGE AND FEES PAIDU.S. DEPARTMENT OF JUSTICE
JUS-436
Director, Statistics DivisionNational Criminal Justice Information and Statistics ServiceLaw Enforcmnt Assistanco AdministrationU.S. Department of JusticeWashington, D.C. 20531
\I
(Fold hors)
Page 4
69
e-
0
NCJ-46246SD- NCS -C 30 \
NCJREGISTRATION
The National ('riminal Justice Reference SerQice (WARS) abstiicts documents published m the s I uninal justice lick'. Pei %MIN
who are registered with the Reterence Service receive announced.lcuts ot documents in thch stated fields ol interest and (Adel
Corms for free copies of ITAA and N('IISS publications it you are not registered with the Reteience Service. and wish to be.
please provide your name end mailing address below and elli.t5:1 the appropriate box.
NameTelephone
I
Number and street 1- I
City-St ate ZIP Code
F lld here)
Pleas send me aNCJFIS registrationform
Please send me thereport listedbelow.
U.S. DEPARTMENT OF JUSTICELaw Enforcement Assistance AdministrationWashington. D.C. 20531
POSTAGE AND FEES PAIDU S. DEPARTMENT OF JUSTICE
JUS-430
User Services Department 2National Criminal. Justice Reference ServiceLaw Enforcement Assistance AdministrationU.S. Department 9f ..lbsticeBox 6000Rockville, Maryland 20850
izt
(Fold here)
If you wish to receive copies of any of the National Climinal Justice Information and StatisticsService reports listed inside °he front cover, please list them below and include your mune and ad-dross in the splice provided Aove.
0
0"
70
_
National Criminal Justice Informationand Statistics Service Reports
Single cool*. are available at no charge horn the National CriminalJug lice Reference Srikle, Box 9000 Rockville, Md 20580 Multiplecopies are for sate by the Superintendent pi Documents, U.S.Govemmantlifrinting Office, Washington, D.C. 20402.
National Crime Survey of-victimization:Criminel Victimization in the United Slates (annual)
Summary Findings of 1977-70 Changes in Ciime and of 'FendsSince ;973 NCJ-61300
A Description ol !lends from 1913 to if)/ / NL.J 598901911 (final ippon) N(;.) 507251976 NCJ 495431975. NCJ 445931974. NCJ- 394671973. NCJ -34732
The Coe) of Negligence: Losses front Preventabl(, liourieholdBurglaries. NCJ-53527
Intimate Victime7 A Study of Violence Among f [lends andRelatives NCJ 62:119
Criminal Victimization SurveysBoston, NC.1 34010Buffalo, NCJ 34820Cincinnatl,)NCJ 34819Houston, NCJ-34821Miami, NCJ -34822Milwaukee, NCJ 34823Minneapolis, NCJ 34824
Criminal Viciimization Surveysreport. 1 vol ) NCJ 18471
Public illitudes About Crime:BostA, NC.) 46235Duffsio, NCJ-46236Cincinnati, NC2-4623/Houston, NCJ-46230Miami, NCJ-413239Milwaukee, NCJ-46240Minneapolis, NCJA18241
InNew Orleans. NCJ 341125Oakland, NCJ 34026Pittsburgh, NCJ-34027San Diego, NCJ-34020San Francisco, NCJ 34829Washington, D.C. NCJ-34830(final report. 13 vols
In t3 American Cilia. (summary
New Orleans, NCJ 46242Oakland, NCJ 46243Pittsburgh, WA- 46244San Diego, NCJ 46245San Francisco, N 'J 46246Washington, D.C. , 46247(final report. 13 vols )
Criminal Victimization Surveys in Chicago, Deirolt, Los Angeles,New York, and Philadelpida: A Comparison of 19/2 and 1974f indings. NCJ -36360
Criminel Victimization Surveys In Eight American Cities:A Comparison of 1971/72 and 1974/75 f indings National
i Crime Surveys in Atlanta. Baltimore. Cleveland Dallas DenverNewark. Portland. and -V Louis. NCJ-36361
Crimes and Victims: A Report on the Dayton-San. Jose PilotSurvey of Victimization. NCJ-013314 *
Applicationi of the National Crime Survey Victimizationand Attitude Data: A
Public Opinion About Crime: The Attitudes Of Victims and Non-victims in Selected Cities. NCJ-4 i336
Local Victim Surveys: A Review of the Issues.NCJ 39973The Police end Public Opinion: An Analysis I Victimization and
Altitude ()ate from 13 American Cities. J-42010An Introd tion to the National Crime roy, NCJ-43/32Compen ling Victims of Violent Crime: Potential Costs and
Coverag I a National Program. NCJ-43387 '
.,.Crirne Agalnet Persons in Urban, Suburban, and Rural Areas:A Comparative Analysis of Victimization Rates. NCJ-53551 ,
Rape Victimization in 26 Antericn.Cities. NCJ 55978Criminal Victimization in Urban Schools. NC.) 56396
National Prfannoriitallotico:Capital PunlehMent (annual)
.1978. NCJ-59897PrloOners In Slate and Federal institutions (annual)
December 31. 1978. advance report. NCJ-58324December 3, 1977 (final report), NCJ-17401
drhaus of State Correctional Facilities, 19 advance report,I .
Prof State Prison inmates: Sociodomographic Findings fromthe 974 Survey of Irertptes of State Correctional Facilities.
N0J-58257 4...'., .
Census of Prisoner,' in Stale Correctional FacHillse, 1973,NCJ-34729
Comm, of ilaits and Survey of Jail Inmate., 1075, preliminaryreport, NCJ-55172 .
,
Thu Mstion's AIDE A report on the census Of jails fr0m-tt1e 1972Survey of minium of Local Jails. NCJ-19067 --,t
Surrey of Inmates of,Locel Jells, 1572 advance report, NCJ-3313
Uniform Parole Reports:Moroi. In the United State 107/1 NC,1 56722
mai mid 19/1 4970;Children In Cusitody
Jrivorillo Delotirtori arid 1, or UN (tonal I at Oily1917 wham( 0 re loil
Census of Pu lic Juvenile f Ili:Miles NCJ 60907Census of Priv le Juvenile I militioe. NCJ 0090t1
1975 (Imo! rorsgr(). 0 50 t391974. NCJ 57046t973. NCJ- 4411119/i. NCJ 13403
1
va Ceurt Model Stan:Mai Dictionary, NUJ 62J2O
My h end Realities About Crime A N18118(1118, 81 l'18501881108 01.!. 111,8 WO 11001111811181 110111 1110 N/1110/181 P11)01181 Shill5111 5
1' ograni and Ilutr Nrilirurol C11811, Sil/viuy NC./ 41,249
.'841* Court Caseload litatistics:
The State of the Ad NCJ-46934Annual Report. 1975. NCJ- 51805Annual Report 197(1 NCJ 50599
A Cross-City Comparison of .Felony Case Processing, NCJ 551/1
National Survey of Court Prgnlzetton:WI/ Supple 1 lo State Judiyal SysIorii5. NCJ 400).:1975 Supplement to Stale Judirial Systems NCJ 294331071 (1011 report) NC..1- i 1427
State and Local Probation and Parole 9ysterns, NCJ-41335t A
State and Local Prosecution and Civil Attorney Systems, NCJ 111334
Trends in Expenditure and Employment Data for the CriminalJustice System, 1971-77 (annual). NC,1-57463
Expenditure and Employment Data for the Criminal Justice System(annual)
1910 advance wont NCJ 6 ,11161977 final repoit. NCJ-53.206
Criminal Justice Agencies in Regions 1-10 (10 vols by slate)NCJ 1 /930- 38 15151
Dictionary of Criminal Justice Data Terminology: Terms andDefinitions Proposed for Interstate and National Data Collectionand Fxchange, NCJ 36747
Program Plan for Statistics, 1977-81, NCJ 37011
Utilization of Criminal Justice Statistics Protect:Sourcebook of Criminal Justice Statistics 1978 (annual)
NCJ-53207Public Opinion Regirding Crime, Criminal Justice. ancl Related
Topics, NCJ-17419New Directions in Processing of Juvenile Offenders: The Deriver
Mod I NCJ -17420WHO 9sis Delained7 An Empirical Analysis of the Pro-Adjudicator y
DctSuiimun of Juveniles in Denver. NCJ-17417Juve le Dispositions: Social and Legal Factors Related to the
Pr cessing of Denver Delinquency Cases. NCJ-174Off ncler-Based Treliliaction Statistics: Now Dirh-ttoris in Data
C Ilection and Reporting. NCJ-29645Sent cing of California Felony Offenders, NCJ-29646The J lei Procering of Assault and Burglari Offenders in
Select California Counties. NCJ-29644Pre-Adjud story Detention In Three Juvenile Courts, NCJ-34730Dellnquen Dispositions: An Empirical Analysis of Processing
Decision iri Three Juvenile Courts. NCJ-34734The Patter 5 and Distribution of Asseult incident Charecteristics
ArTiong ocial Areas. NCJ-40025Patterns of Robbery Characteristics and I heir Occurrence Among
Sq,cial Arens, NCJ-40026Caine-Specific Analysis:
Tho Characteristics of gurglary Incidents. NCJ-42093An Empirical Examination of Burglary OffenderCharactenstics.
NCJ-43131An Empiricpl Examination of Burglary Offenders
Char acteristics. NCJ-42476Sources of National Criminal Justice Statistics: An Ahnotated
Bibliography, NCJ-45006Federal Criminal Sentencing: Perspectives of Analysis arid
Design for Research, NCJ-33683Variations In Federal CrlIrdnal Sentences: A Statistical
at the National Leval, NCJ-33684Federal Sentencing Patt.rno: A Study of Geographi al Variations,
NCJ-33685Predicting Sentences in Federal Courts: The Feasibility of a
National Sentencing Pb11Cy, NCJ-33686
sessment
001/1141itlin PHINTINO orrlcm n 1950 0-311-379/1,23
`r