Embed Size (px)
Citation preview
Assessment of Human Health Vulnerability to Climate Change in Bangladesh
By
Md. Raihan Tanvir
A project submitted to the Institute of Water and Flood Management (IWFM) of Bangladesh
University of Engineering and Technology, Dhaka in partial fulfillment of the requirements
for the degree of
PG. Dip IN WATER RESOURCES DEVELOPMENT
INSTITUTE OF WATER AND FLOOD MANAGEMENT
BANGLADESH UNIVERSITY OF ENGINEERING AND TECHNOLOGY
March, 2016
ii
Table of Contents
Table of Contents ii
List of Tables vi
List of Figures viii
Acknowledgement x
Abstract xi
CHAPTER I: INTRODUCTION 1
1.1 Background and Present State of the Problem 1
1.2 Objectives of the Study 2
1.3 Possible Outcomes of the Study 2
1.4 Limitations of the Study 3
1.4.1 Sample size 3
1.4.2 Lack of available and/or reliable data 3
CHAPTER II: LITERATURE REVIEW 4
2.1 Introduction 4
2.1.1 Climate 4
2.1.2 Climate change 5
iii
2.1.3 Health effects 5
2.1.4 Vulnerability 5
2.2 Health vulnerability 6
2.3 Steps in assessing Health vulnerability to climate change 7
2.4 Quantitative health impact assessment 8
2.4.1 Direct effects of heat and heat-waves 9
2.4.2 Air pollution 10
2.4.3 Disasters: floods and windstorms 11
2.4.3.1 Floods 13
2.4.3.2 Drought 14
2.4.4 Vector-borne diseases 15
2.4.4.1 Malaria 15
2.4.4.2 Dengue 16
2.4.5 Waterborne and food borne diarrheal disease 16
CHAPTER III: CHARACTERIZATION OF THE STUDY AREA 18
3.1 Socio-Economic Background 18
3.1.1 Location 18
3.1.2 Administrative Setup 18
3.1.3 Demography 20
3.2 Environmental Background 20
iv
3.2.1 Climate 20
3.2.2 Rainfall 21
3.2.3 Temperature 21
3.3 Burden and distribution of disease 21
3.4 Increasing frequency of heat waves 22
3.5 Variable precipitation patterns 22
3.6 Malnutrition 23
3.7 Sea level rise 23
CHAPTER IV: DATA & METHODOLOGY 25
4.1 Introduction 25
4.1.1 Research Design 25
4.2 Data and Data source 26
4.2.1 Variable Identification 26
4.2.2 Indicator 26
4.2.3 Socio-economic indicators 28
4.2.4. Climate Indices 29
4.3 Calculating Indicator Score: 29
4.3.1 Index based Method 29
CHAPTER V: RESULTS AND DISCUSSION 31
v
5.1. Population Density by Districts 31
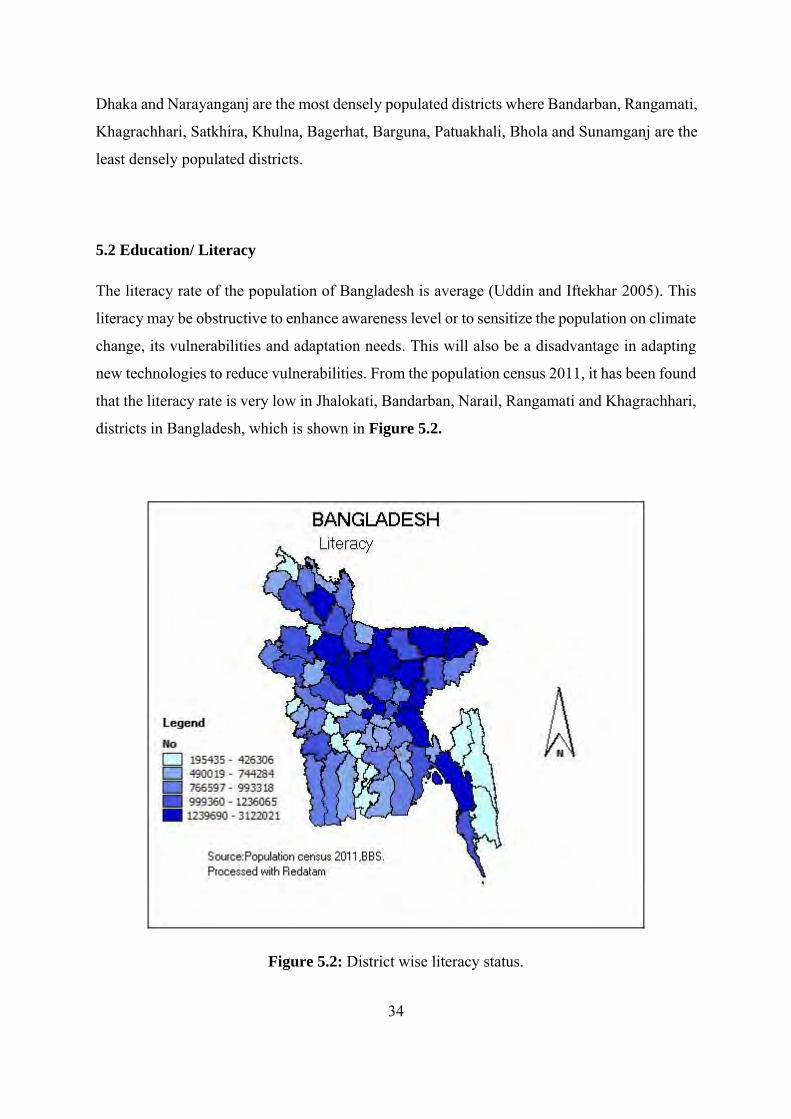
5.2 Education/ Literacy 34
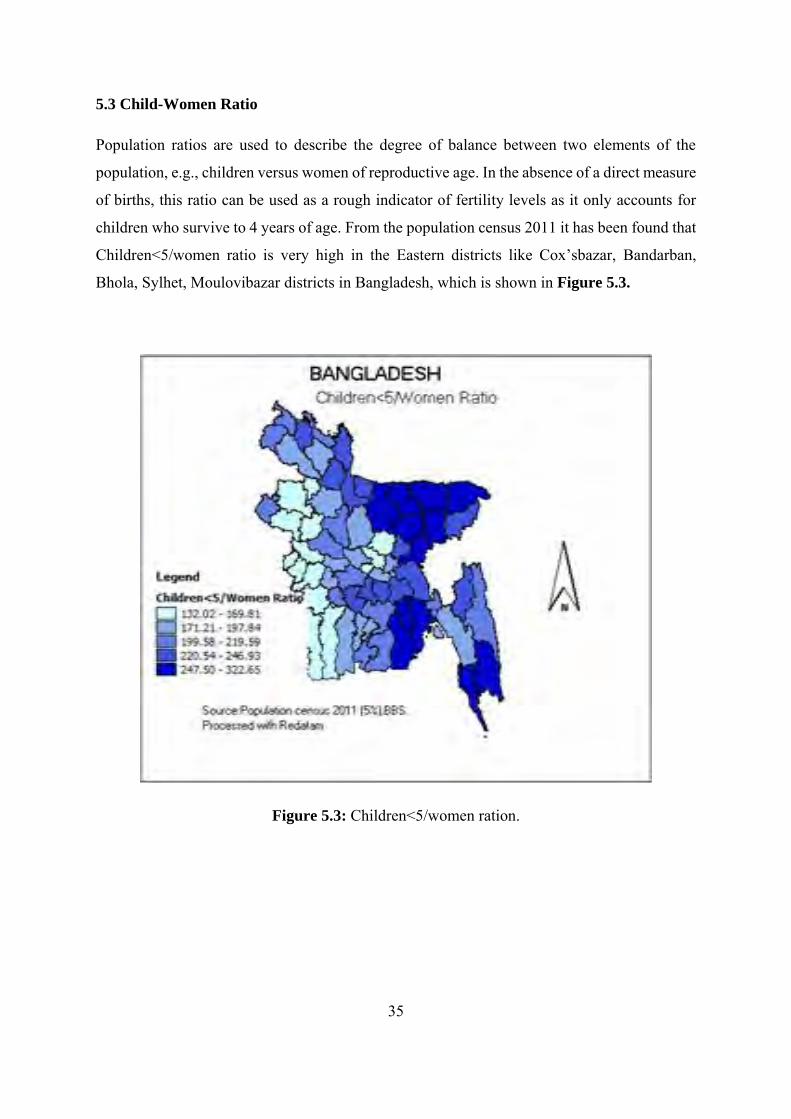
5.3 Child-Women Ratio 35
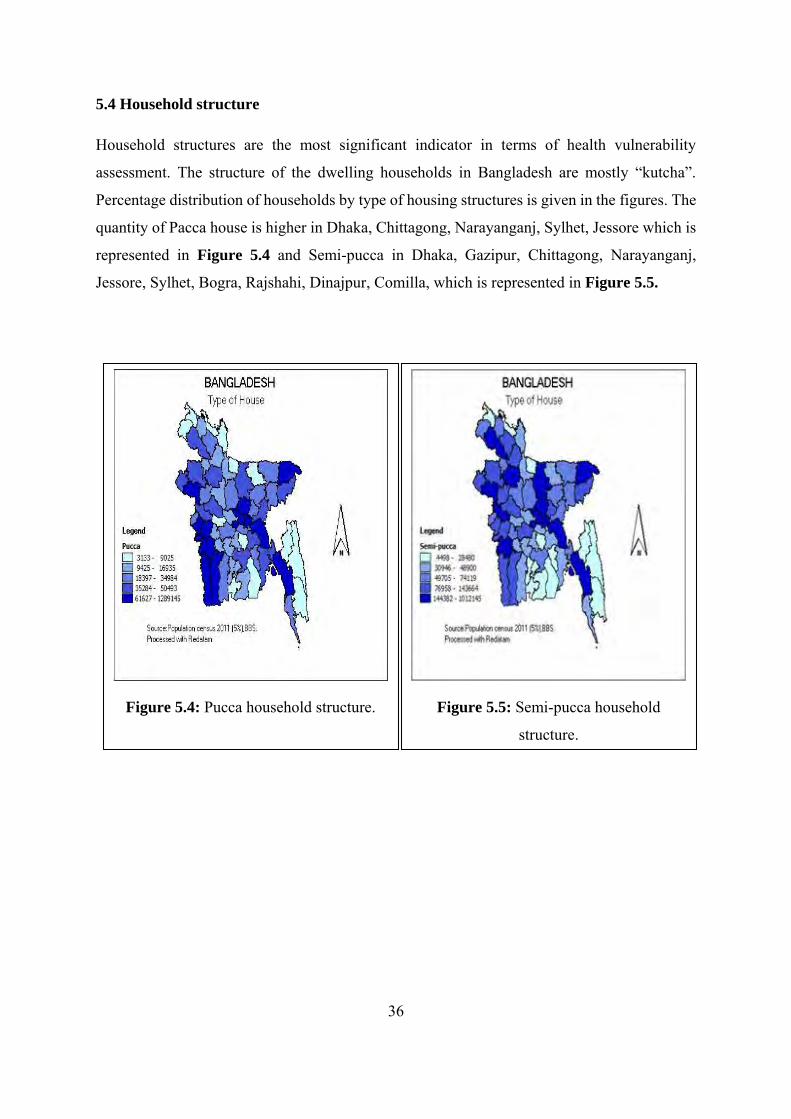
5.4 Household structure 36
5.5 Electricity Connection 38
5.6 Employment Field 39
5.7 Water, Sanitation and Health Support Services 41
5.7.1 Drinking Water Facilities Status 41
5.7.2 Sanitation Toilet Facilities Status 43
5.8 Adaptive capacity 45
5.9 Sensitivity 46
5.10 Exposure 47
5.11 Vulnerability 48
5.12 Contribution of Temperature and Precipitation 50
5.13 Overall Vulnerability 51
5.14 Heat and heat-waves 53
5.15 Waterborne and food borne diarrheal and Cholera disease 54
5.16 Drought 54
5.17 Floods 55
5.18 Malaria 56
5.18.1 Vulnerability Map in relation to the climate sensitive disease Malaria. 58
vi
5.19 Dengue Fever 59
CHAPTER VI: CONCLUSION AND RECOMMENDATION 61
6.1 Conclusion 61
REFERENCES 63
APPENDICES 67
Appendix A: Observed data of the Indicators of Adaptive Capacity (2013) 67
Appendix B: Observed data of the Indicators of Sensitivity (2013) 71
Appendix C: Observed data of the Indicators of Exposure (2013) 73
Appendix D: Data of Vulnerability (2013, 2050,2080) 75
vii
LIST OF TABLES
Table 2.1: Summary of the components of assessment. 7
Table 2.2: Selected air pollutants, sources and health effects. 11
Table 2.3: Pathways by which above-average rainfall can affect health. 13
Table 4.1: Selected indicators vulnerability assessment. 27
Table 5.1: Population density of Bangladesh by districts. 32
Table 5.2: Top ten vulnerable districts of Bangladesh 49
Table 5.3: Top districts of Bangladesh having higher adaptive capacity. 51
Table 5.4: Districts of Bangladesh having higher temperature. 53
Table 5.5: Districts of Bangladesh having higher Precipitation rate. 55
Table 5.6: Vulnerability of the Malaria epidemic districts 59
Table 5.7: Dengue cases from 2003 to 2011 60
viii
LIST OF FUGURES
Figure 2.1: Linkages between health and climate change. 8
Figure 2.2: Relationship between temperature and mortality. 9
Figure 3.1: Physiographic map of Bangladesh. 19
Figure 5.1: Population density by district 31
Figure 5.2: District wise literacy status. 34
Figure 5.3: Children<5/women ration. 35
Figure 5.4: Pucca household structure. 36
Figure 5.5: Semi-pucca household structure. 36
Figure 5.6: Kutcha household structure. 37
Figure 5.7: Jhupri household structure. 37
Figure 5.8: District wise status of electricity connected area. 38
Figure 5.9: Status of no electricity connected area. 38
Figure 5.10: District wise status of employment in service. 39
Figure 5.11: Employment in the field of agriculture. 40
Figure 5.12: Employment in Industrial area. 40
Figure 5.13: Status of tap as a source of drinking water. 41
Figure 5.14: Status of tube-well as a source of drinking water. 42
ix
Figure 5.15: Source of drinking water other than tap and tube-well. 42
Figure 5.16: Toilet facilities that included sanitary with water seal. 43
Figure 5.17: Toilet facilities that has sanitary but without water seal. 44
Figure 5.18: District wise status that has no toilet facilities. 44
Figure 5.19: District wise map of present vulnerability status. 49
Figure 5.20: District wise map of the vulnerability status of 2050 & 2080. 49
Figure 5.21: Contribution of Temperature and Precipitation on Human Health vulnerability. 50
Figure 5.22: Present and top most adaptive capacity having districts on 2050 and 2080. 52
Figure 5.23: Present and top most temperature having districts on 2050 and 2080. 53
Figure 5.24: Present and top most Precipitation having districts on 2050 and 2080. 55
Figure 5.25: Showing the map indicates the districts of malaria endemic area. 57
Figure 5.26: Comparison map of Vulnerability and Malaria epidemic area. 58
x
ACKNOWLEDGEMENT
I would first like to show my heartiest gratitude to my project supervisor Professor Dr. A.K.M.
Saiful Islam of the IWFM at BUET for his tremendous support in this Project work. The door
to his office was always open whenever I ran into a trouble spot or had a question about my
project or writing. He consistently allowed this paper to be my own work, but steered me in the
right direction whenever he thought I needed it. A special thanks for his thoughtful contribution
in stimulating suggestions and encouragement. I found it encouraging and at the same time
helpful to coordinate and write this project.
I would also like to acknowledge Professor Dr. G M Tarekul Islam and Professor Dr. Sujit
Kumar Bala of the IWFM at BUET and I am gratefully indebted for their very valuable
comments on it.
I also would like to express my deepest appreciation to all those who have provided me the
opportunity to complete this project. I acknowledge with much appreciation the crucial role of
the staff Mr. Akbar Hossain and Mr. Liton Das who gave me necessary assistance to use all
required equipment and the necessary materials to complete the task. Furthermore, a special
thanks also goes to Md. Nasir Uddin, for his support in image processing and giving
suggestions about the task. Regional Climate modeling data over Bangladesh has been
collected from a collaborative research project at the institute entitled, ‘High End Climate
Impact and Extremes (HELIX) funded by European Union Seventh Framework Programme
FP7/2007-2013 under grant agreement no 603864.
xi
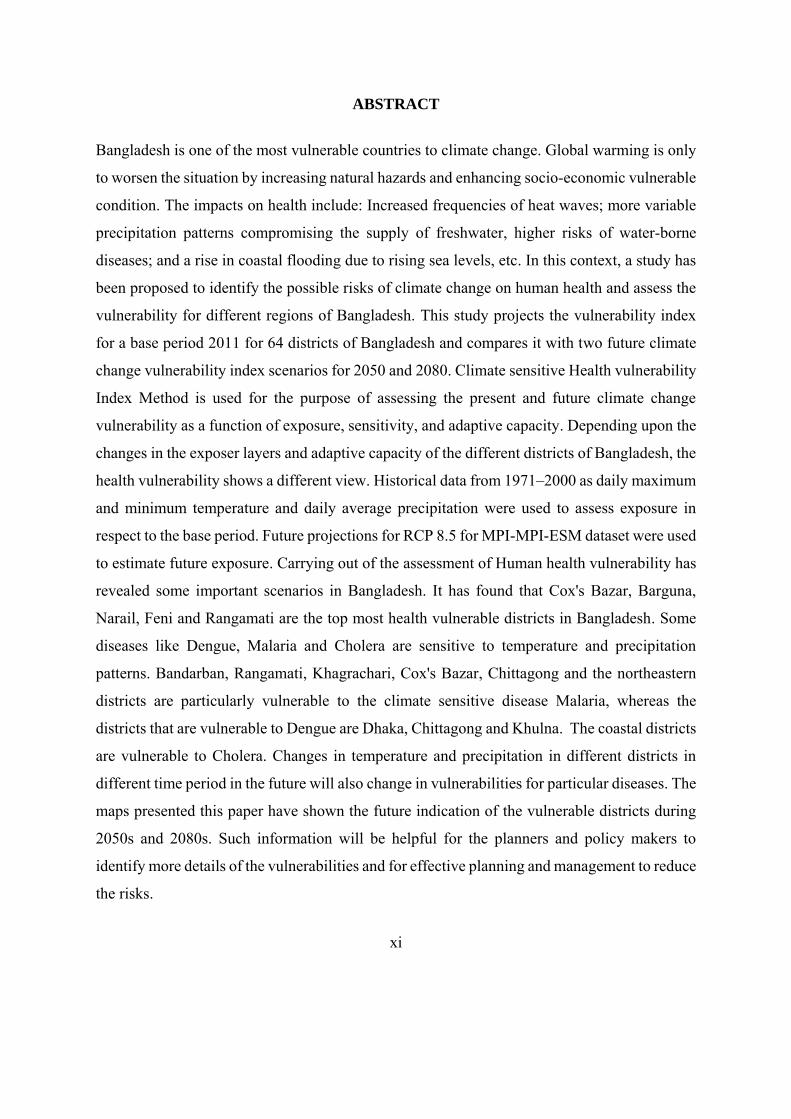
ABSTRACT
Bangladesh is one of the most vulnerable countries to climate change. Global warming is only
to worsen the situation by increasing natural hazards and enhancing socio-economic vulnerable
condition. The impacts on health include: Increased frequencies of heat waves; more variable
precipitation patterns compromising the supply of freshwater, higher risks of water-borne
diseases; and a rise in coastal flooding due to rising sea levels, etc. In this context, a study has
been proposed to identify the possible risks of climate change on human health and assess the
vulnerability for different regions of Bangladesh. This study projects the vulnerability index
for a base period 2011 for 64 districts of Bangladesh and compares it with two future climate
change vulnerability index scenarios for 2050 and 2080. Climate sensitive Health vulnerability
Index Method is used for the purpose of assessing the present and future climate change
vulnerability as a function of exposure, sensitivity, and adaptive capacity. Depending upon the
changes in the exposer layers and adaptive capacity of the different districts of Bangladesh, the
health vulnerability shows a different view. Historical data from 1971–2000 as daily maximum
and minimum temperature and daily average precipitation were used to assess exposure in
respect to the base period. Future projections for RCP 8.5 for MPI-MPI-ESM dataset were used
to estimate future exposure. Carrying out of the assessment of Human health vulnerability has
revealed some important scenarios in Bangladesh. It has found that Cox's Bazar, Barguna,
Narail, Feni and Rangamati are the top most health vulnerable districts in Bangladesh. Some
diseases like Dengue, Malaria and Cholera are sensitive to temperature and precipitation
patterns. Bandarban, Rangamati, Khagrachari, Cox's Bazar, Chittagong and the northeastern
districts are particularly vulnerable to the climate sensitive disease Malaria, whereas the
districts that are vulnerable to Dengue are Dhaka, Chittagong and Khulna. The coastal districts
are vulnerable to Cholera. Changes in temperature and precipitation in different districts in
different time period in the future will also change in vulnerabilities for particular diseases. The
maps presented this paper have shown the future indication of the vulnerable districts during
2050s and 2080s. Such information will be helpful for the planners and policy makers to
identify more details of the vulnerabilities and for effective planning and management to reduce
the risks.
1
CHAPTER I
INTRODUCTION
1.1 Background and Present State of the Problem
Health is the primary goal of sustainable development and it is crucial that the health impacts
of climate change be understood and properly addressed [1]. Climate change affects human
health both directly and indirectly. The impacts on health include: Increased frequencies of
heat waves; more variable precipitation patterns compromising the supply of freshwater,
higher risks of water-borne diseases; and a rise in coastal flooding due to rising sea levels, etc.
The National Health Policy identifies respiratory diseases, heat strokes, cold wave related
illness, vector borne diseases like malaria, dengue, water-borne diseases like diarrhea, cholera,
skin, eye diseases and increased malnutrition due to climate change and natural disasters [2].
There is evidence that warmer temperatures due to climate change will influence dengue
transmission [3]. The health sector needs to play a key role in disease prevention, health
education, disaster preparedness and effective measures to treat early evidence of impact
affecting health [5][6]. In this context, a study has been proposed to identify the possible risks
of climate change on human health and assess the vulnerability for different regions of
Bangladesh.
Hence, it is essential to know the vulnerability of the districts of Bangladesh using an
appropriate approach. Approaches that are currently used to determine the climate vulnerability
are usually index based and location specific.
2
1.2 Objectives of the Study
The key objectives of the project are as follows:
1. To identify the possible potential health effect due to climate variability and change.
2. To assess health vulnerability for each region of Bangladesh considering climate
change.
1.3 Possible Outcomes of the Study
Undoubtedly, it could be said from various scientific evidence and international reports that
Bangladesh is the worse victim of changing climate. Various sectoral specialists and different
organizations are struggling to quantify the impacts, but at present there is no/limited type of
tools to quantify the local level climate change impacts applicable for Bangladesh. From this
study,
There will be identification of different types and degrees of health impacts and most
vulnerable regions due to climate variability and change.
The ultimate outcome will be District-wise Health Vulnerability Map due to climate
change.
The vulnerability assessment results will help policymakers and researchers to take further
initiatives to tackle impacts of climate change. Thus, it could be an effective tool for climate
change regional planning, through which within the country climate change hotspots will be
under proper initiatives based on their vulnerability.
3
1.4 Limitations of the Study
Although there are a lot of limitations in this study, the major limitations are the size of sample,
lack of available reliable data and data sources.
1.4.1 Sample size
The number of the units of analysis I used in my study of the research problem I am
investigating is too small, it is difficult to find significant relationships from the data, as
statistical tests normally require a larger sample size to ensure a representative distribution of
the population and to be considered representative of groups of people to whom results will be
generalized or transferred. In some cases, sample size is less relevant in such qualitative
research.
1.4.2 Lack of available and/or reliable data
A lack of district-wise health data or of reliable data sources has limited the scope of my
analysis. It is a significant obstacle in finding a trend and a meaningful relationship. Although
the availability of health data is a major limitation for now, with the technological advancement
in health sector, it will be much more available in the near future. However, this limitation is
an opportunity for future research on it.
4
CHAPTER II
LITERATURE REVIEW
2.1 Introduction
This chapter will provide a brief literature review on climate change, climate change
vulnerability and present state of vulnerability assessment. Currently there is no standalone
method for vulnerability measurement and scientists are trying to develop a best-fitted method.
Last few decades, there were various researches to quantify the vulnerability of climate change
at various locations, but those methods were applicable for that specific region.
2.1.1 Climate
“Climate” in a narrow sense is usually defined as the “average weather”, or more rigorously,
as the statistical description in terms of the mean and variability of relevant quantities over a
period of time ranging from months to thousands or millions of years. The classical period is
30 years, as defined by the World Meteorological Organization (WMO) [11]. These quantities
are most often surface variables such as temperature, precipitation, and wind. Climate in a
wider sense is the state, including a statistical description, of the climate system. Classical
climatology provides a classification and description of the various climate regimes found on
Earth [10]. Climate varies from place to place, depending on latitude, distance to the sea,
vegetation, presence or absence of mountains or other geographical factors. Climate varies also
in time; from season to season, year to year, decade to decade or on much longer time-scales.
5
2.1.2 Climate change
There are many mechanisms by which changes in climate may affect human health.
Interactions between weather and climate and health are location-specific; using
epidemiological evidence based on local data if they are available is therefore important.
Evidence of an association between weather and health outcome may not imply an increased
burden from climate change. This assessment includes current vulnerability to climate
variability to inform understanding of what could occur with climate change.
According to the IPCC’s (2013) latest assessment report climate change refers to a change in
the state of the climate that can be identified (e.g. using statistical tests) by changes in the mean
and/or the variability of its properties, and that persists for an extended period, typically
decades or longer [12].
2.1.3 Health effects
Health effects include temperature-related illness and death, extreme weather-related health
effects, air pollution-related health effects, water and food-borne diseases and vector-borne and
rodent-borne diseases. There are also effects of food shortages, water shortages, mental,
nutritional, infectious and other health effects.
2.1.4 Vulnerability
Vulnerability was a concept used first by engineers to assess the risk of building collapse and
other problems. IPCC (2001) defined it as the degree to which a system is susceptible to, or
unable to cope with, adverse effects of climate change, including climate variability and
extremes. In the latest report of IPCC (2014) vulnerability is defined as the propensity or
predisposition to be adversely affected [13]. Vulnerability encompasses a variety of concepts
and elements including sensitivity or susceptibility to harm and lack of capacity to cope and
adapt. From the above discussions it is clear that the vulnerability refers to state of a system in
which it could be affected by external changes.
6
2.2 Health vulnerability
The public health and climate change communities share the goal of increasing the ability of
countries, communities and individuals to effectively and efficiently cope with the challenges
and changes that are likely to arise because of climate variability and change. Realistically
assessing the potential health impact of climate variability and change requires understanding
both the vulnerability of a population and its capacity to respond to new conditions [6].The
relationships between vulnerability, adaptive capacity and potential effects are discussed
below.
The IPCC defines vulnerability as the degree to which individuals and systems are susceptible
to or unable to cope with the adverse effects of climate change, including climate variability
and extremes [14]. The vulnerability of human health to climate change is a function of:
• Sensitivity, which includes the extent to which health, or the natural or social systems on
which health outcomes depend, are sensitive to changes in weather and climate (the
exposure–response relationship) and the characteristics of the population, such as the level
of development and its demographic structure;
• The exposure to the weather or climate-related hazard, including the character, magnitude
and rate of climate variation; and
• The adaptation measures and actions in place to reduce the burden of a specific adverse health
outcome (the adaptation baseline), the effectiveness of which determines in part the exposure–
response relationship.
Populations, subgroups and systems that cannot or will not adapt are more vulnerable, as are
those that are more susceptible to weather and climate changes [15]. Understanding a
population’s capacity to adapt to new climate conditions is crucial to realistically assessing the
potential health and other effects of climate change. In general, the vulnerability of a population
to a health risk depends on the local environment, the level of material resources, the
effectiveness of governance and civil institutions, the quality of the public health infrastructure
and the access to relevant local information on extreme weather threats. These factors are not
uniform across a region or country or across time and differ based on geography, demography
and socioeconomic factors. Effectively targeting prevention or adaptation strategies requires
understanding which demographic or geographical subpopulations may be most at risk and
7
when that risk is likely to increase. Thus, individual, community and geographical factors
determine vulnerability.
2.3 Steps in assessing Health vulnerability to climate change
Assessment of vulnerability uses similar concepts to those used in health impact assessment.
The first step is to specify the scope of the assessment in relation to the health and community
security issues of concern today and of potential risk in the future, the geographical region to
be covered by the assessment and the time period [6].
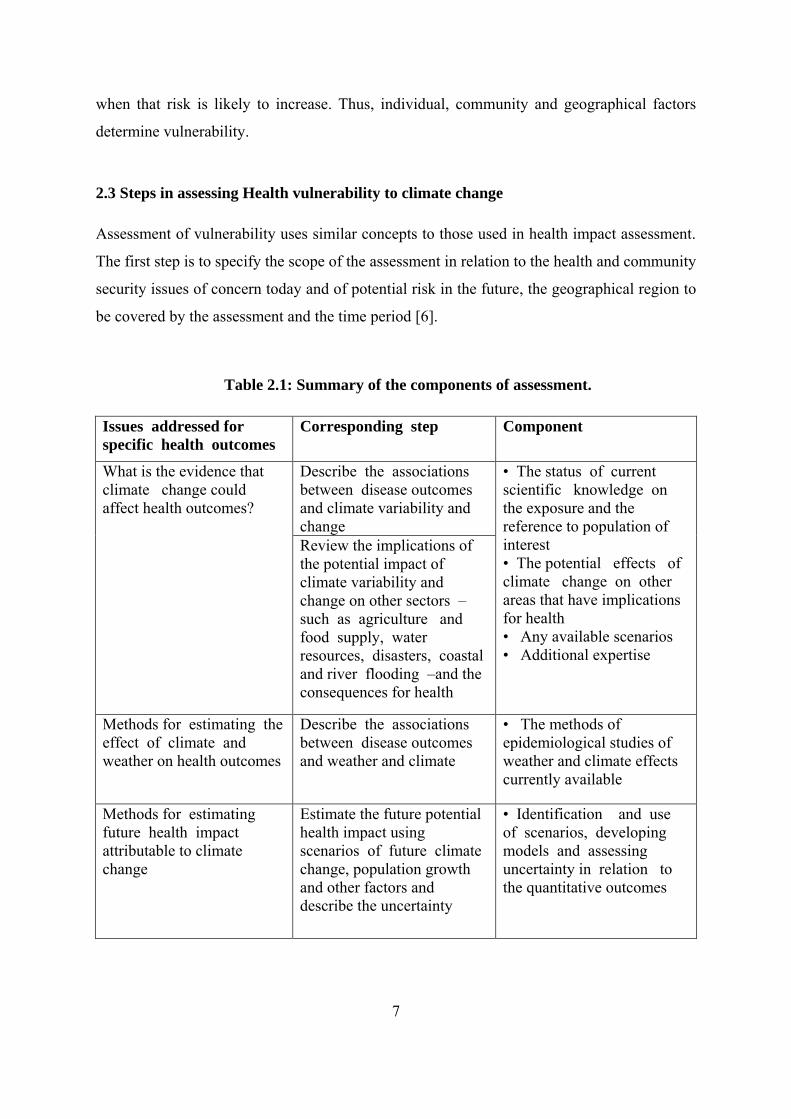
Table 2.1: Summary of the components of assessment.
Issues addressed for
specific health outcomes
Corresponding step Component
What is the evidence that climate change could affect health outcomes?
Describe the associations between disease outcomes and climate variability and change
• The status of current scientific knowledge on the exposure and the reference to population of interest • The potential effects of climate change on other areas that have implications for health • Any available scenarios • Additional expertise
Review the implications of the potential impact of climate variability and change on other sectors – such as agriculture and food supply, water resources, disasters, coastal and river flooding –and the consequences for health
Methods for estimating the effect of climate and weather on health outcomes
Describe the associations between disease outcomes and weather and climate
• The methods of epidemiological studies of weather and climate effects currently available
Methods for estimating future health impact attributable to climate change
Estimate the future potential health impact using scenarios of future climate change, population growth and other factors and describe the uncertainty
• Identification and use of scenarios, developing models and assessing uncertainty in relation to the quantitative outcomes
8
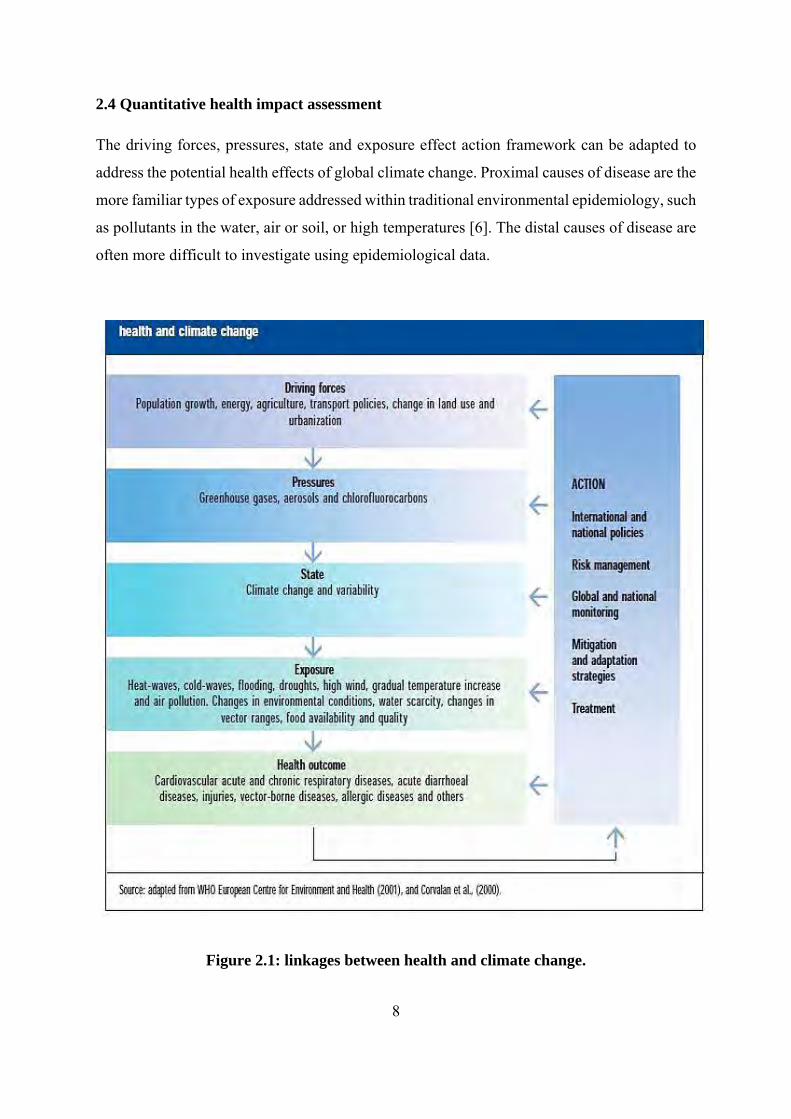
2.4 Quantitative health impact assessment
The driving forces, pressures, state and exposure effect action framework can be adapted to
address the potential health effects of global climate change. Proximal causes of disease are the
more familiar types of exposure addressed within traditional environmental epidemiology, such
as pollutants in the water, air or soil, or high temperatures [6]. The distal causes of disease are
often more difficult to investigate using epidemiological data.
Figure 2.1: linkages between health and climate change.
9
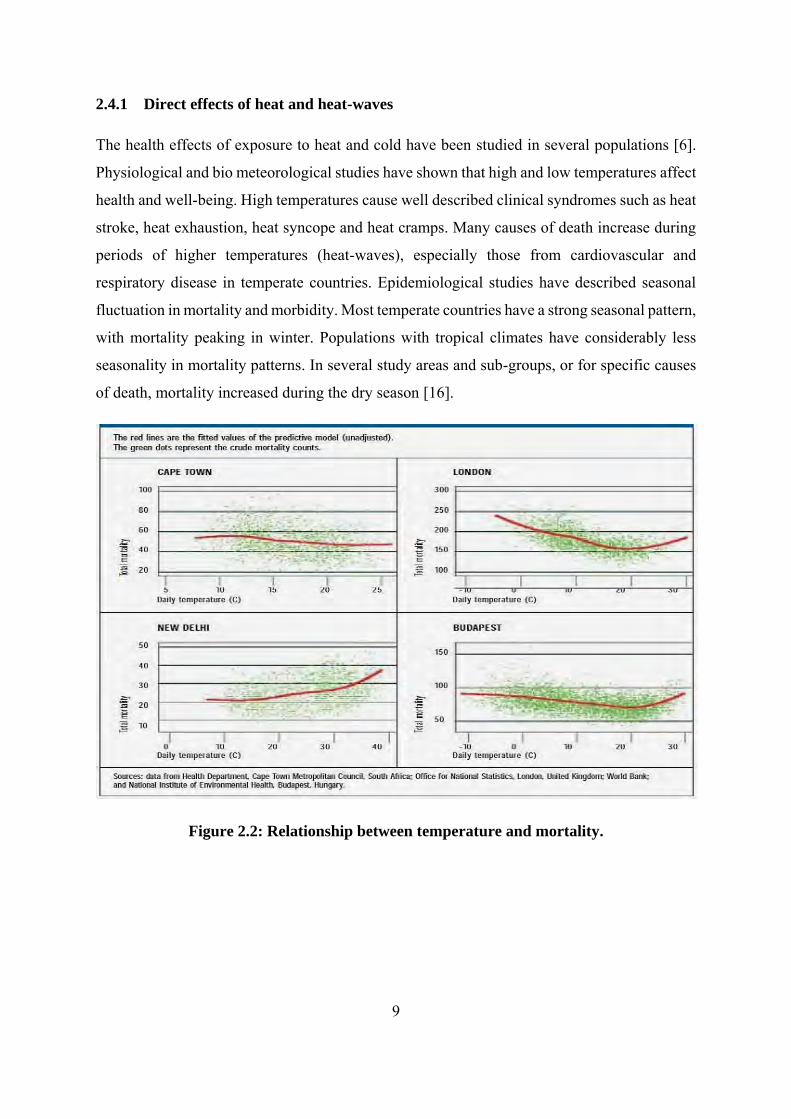
2.4.1 Direct effects of heat and heat-waves
The health effects of exposure to heat and cold have been studied in several populations [6].
Physiological and bio meteorological studies have shown that high and low temperatures affect
health and well-being. High temperatures cause well described clinical syndromes such as heat
stroke, heat exhaustion, heat syncope and heat cramps. Many causes of death increase during
periods of higher temperatures (heat-waves), especially those from cardiovascular and
respiratory disease in temperate countries. Epidemiological studies have described seasonal
fluctuation in mortality and morbidity. Most temperate countries have a strong seasonal pattern,
with mortality peaking in winter. Populations with tropical climates have considerably less
seasonality in mortality patterns. In several study areas and sub-groups, or for specific causes
of death, mortality increased during the dry season [16].
Figure 2.2: Relationship between temperature and mortality.
10
2.4.2 Air pollution
Weather conditions influence air quality via the transport and/or formation of pollutants (or
pollutant precursors). Weather conditions can also influence air pollutant emissions, both
biogenic emissions (such as pollen production) and anthropogenic emissions (such as those
caused by increased energy demand). Exposure to air pollutants can have many serious health
effects, especially following severe pollution episodes. Long-term exposure to elevated levels
of air pollution may have greater health effects than acute exposure. Current air pollution
problems are greatest in cities in developing countries. Vulnerability and susceptibility to the
adverse health effects of air pollution could be related either to variation in exposure between
individual and groups or to the degree to which individuals or groups may respond to a given
exposure [22]. Epidemiological studies conducted in the 1980s and 1990s, combined with
analysis of the health effects recorded during individual episodes of severely elevated air
pollution levels, provide strong evidence for statistically significant associations between
exposure to air pollutants and various types of health effects. Global climate change could
significantly alter plant phenology because temperature influences the timing of development,
both alone and through interactions with other cues, such as photoperiod [17] [18].
Six standard air pollutants have been extensively studied in urban populations: carbon
monoxide, lead, ground-level ozone, particulate matter, nitrogen dioxide, and sulfur dioxide.
Biological particles such as pollen and mold also affect health. There is some evidence from
Europe that the average length of the growing season in Europe has increased by 10–11 days
over the last 30 years [6]. The pollen season is starting and peaking earlier, and this is more
pronounced in species that start flowering earlier in the year. The duration of the pollen season
has been extended in some summer and late-flowering species.
11
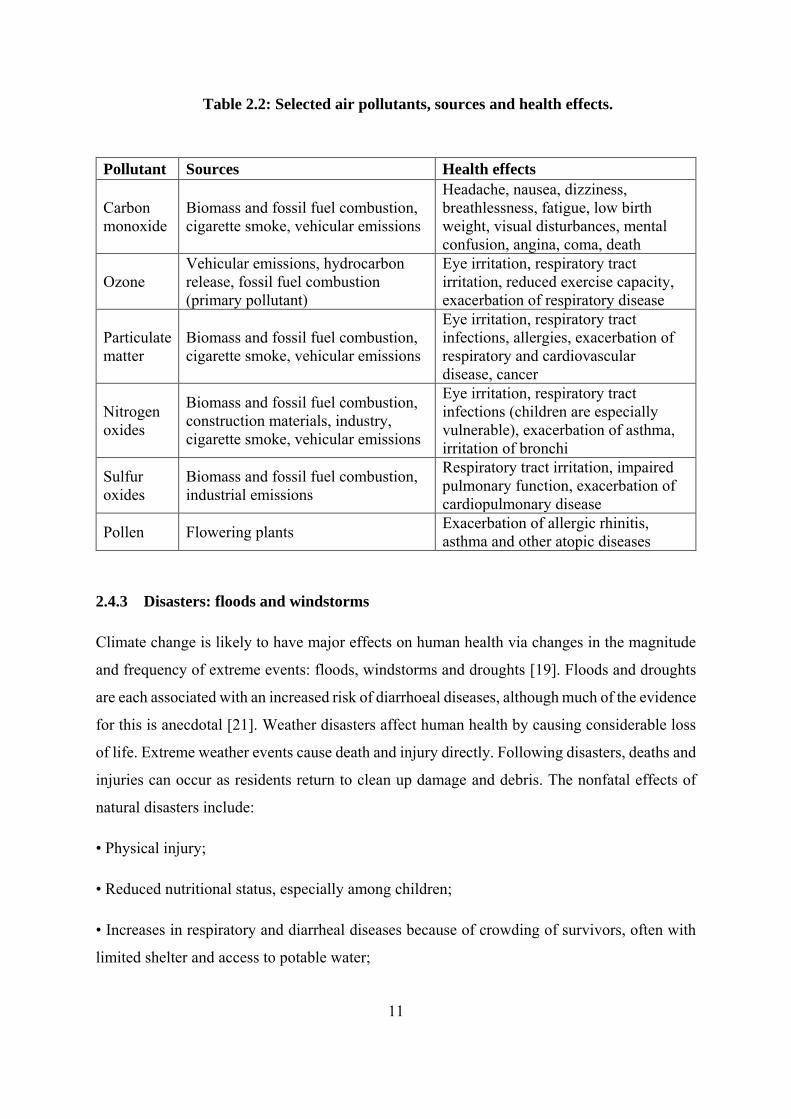
Table 2.2: Selected air pollutants, sources and health effects.
2.4.3 Disasters: floods and windstorms
Climate change is likely to have major effects on human health via changes in the magnitude
and frequency of extreme events: floods, windstorms and droughts [19]. Floods and droughts
are each associated with an increased risk of diarrhoeal diseases, although much of the evidence
for this is anecdotal [21]. Weather disasters affect human health by causing considerable loss
of life. Extreme weather events cause death and injury directly. Following disasters, deaths and
injuries can occur as residents return to clean up damage and debris. The nonfatal effects of
natural disasters include:
• Physical injury;
• Reduced nutritional status, especially among children;
• Increases in respiratory and diarrheal diseases because of crowding of survivors, often with
limited shelter and access to potable water;
Pollutant Sources Health effects
Carbon monoxide
Biomass and fossil fuel combustion, cigarette smoke, vehicular emissions
Headache, nausea, dizziness, breathlessness, fatigue, low birth weight, visual disturbances, mental confusion, angina, coma, death
Ozone Vehicular emissions, hydrocarbon release, fossil fuel combustion (primary pollutant)
Eye irritation, respiratory tract irritation, reduced exercise capacity, exacerbation of respiratory disease
Particulate matter
Biomass and fossil fuel combustion, cigarette smoke, vehicular emissions
Eye irritation, respiratory tract infections, allergies, exacerbation of respiratory and cardiovascular disease, cancer
Nitrogen oxides
Biomass and fossil fuel combustion, construction materials, industry, cigarette smoke, vehicular emissions
Eye irritation, respiratory tract infections (children are especially vulnerable), exacerbation of asthma, irritation of bronchi
Sulfur oxides
Biomass and fossil fuel combustion, industrial emissions
Respiratory tract irritation, impaired pulmonary function, exacerbation of cardiopulmonary disease
Pollen Flowering plants Exacerbation of allergic rhinitis, asthma and other atopic diseases
12
• Effects on mental health that may be long lasting in some cases;
• Increased risk of water-related diseases from disruption of water supply or sewage systems;
• Exposure to dangerous chemicals or pathogens released from storage sites and waste disposal
sites into floodwaters.
Bereavement, property loss and social disruption may increase the risk of depression and
mental health problems. Substantial indirect health impact can also occur because of damage
to the local infrastructure (such as damage to clinics and roads) and population displacement.
13
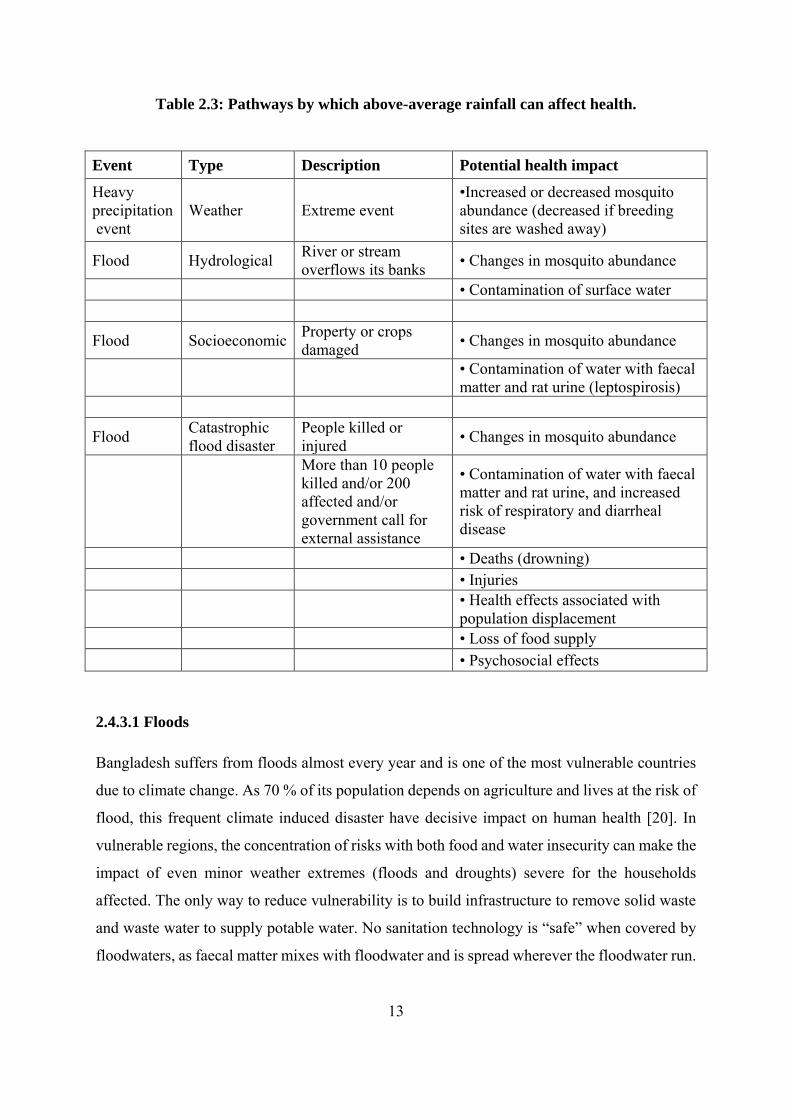
Table 2.3: Pathways by which above-average rainfall can affect health.
2.4.3.1 Floods
Bangladesh suffers from floods almost every year and is one of the most vulnerable countries
due to climate change. As 70 % of its population depends on agriculture and lives at the risk of
flood, this frequent climate induced disaster have decisive impact on human health [20]. In
vulnerable regions, the concentration of risks with both food and water insecurity can make the
impact of even minor weather extremes (floods and droughts) severe for the households
affected. The only way to reduce vulnerability is to build infrastructure to remove solid waste
and waste water to supply potable water. No sanitation technology is “safe” when covered by
floodwaters, as faecal matter mixes with floodwater and is spread wherever the floodwater run.
Event Type Description Potential health impact
Heavy precipitation event
Weather Extreme event •Increased or decreased mosquito abundance (decreased if breeding sites are washed away)
Flood Hydrological River or stream overflows its banks • Changes in mosquito abundance
• Contamination of surface water
Flood Socioeconomic Property or crops damaged • Changes in mosquito abundance
• Contamination of water with faecal matter and rat urine (leptospirosis)
Flood Catastrophic flood disaster
People killed or injured • Changes in mosquito abundance
More than 10 people killed and/or 200 affected and/or government call for external assistance
• Contamination of water with faecal matter and rat urine, and increased risk of respiratory and diarrheal disease
• Deaths (drowning) • Injuries
• Health effects associated with population displacement
• Loss of food supply • Psychosocial effects
14
Epidemiological studies of flood events can be undertaken in relation to the following
outcomes to compare incidence in the pre- and post-flooding situations:
• Injuries
• Infectious diseases, especially skin, gastrointestinal and respiratory infections; and
• Mental disorders: increases in common anxiety and depression disorders.
Routine surveillance may provide data on episodes of infectious disease both before and after
a flood. Obtaining accurate information on disease incidence or prevalence before the flood
may not be possible. Detection may increase after the flood and bias the estimate because
surveillance activity is enhanced. Injuries are not routinely recorded in relation to flood events.
Because the methods of attributing health impact to a flood event are difficult, the type of study
used to quantify the impact should be clearly stated. Qualitative methods can also be used to
estimate the impact of a flood on health and quality of life.
2.4.3.2 Drought
A potential increase in drought could substantially affect water resources and sanitation in
situations where water supply is effectively reduced. This could lead to an increased
concentration of pathogenic organisms in raw water supplies. Additionally, water scarcity may
require using poorer-quality sources of fresh water, such as rivers, which are often
contaminated. All these factors could increase the incidence of diseases. Epidemiological
assessment should be used to quantify this risk. The health consequences of drought include
diseases resulting from lack of water and malnutrition [21]. In times of shortage, water is used
for cooking rather than hygiene. In particular, this increases the risk of faecal-oral (primarily
diarrheal) diseases and water-washed diseases (such as trachoma and scabies). Malnutrition
also increases susceptibility to infection.
15
2.4.4 Vector-borne diseases
Vector-borne diseases are common among populations residing in tropical regions or are poor
[23]. Globally, vector-borne diseases are one of the biggest challenges to humans [24] due to
changes in public health policy, insecticide and drug resistance, shift in emphasis from
prevention to emergency response, demographic and societal changes, and genetic changes in
pathogens [25].Climate change may alter the distribution of vector species (increasing or
decreasing) depending on whether conditions are favorable or unfavorable for their breeding
places (such as vegetation, host or water availability) and their reproductive cycle. Temperature
can also influence the reproduction and maturation rate of the infective agent within the vector
organism and the survival rate of the vector organism, thereby further influencing disease
transmission.
Changes in climate that can affect the potential transmission of vector-borne infectious diseases
include temperature, humidity, altered rainfall, soil moisture and rising sea level. Determining
how these factors may affect the risk of vector-borne diseases is complex. The factors
responsible for determining the incidence and geographical distribution of vector-borne
diseases are complex and involve many demographic and societal as well as climatic factors.
Transmission requires that the reservoir host, a competent vector and the pathogen be present
in an area at the same time and in adequate numbers to maintain transmission.
2.4.4.1 Malaria
In terms of basic reproduction number of malaria, extinction to be more strongly dependent on
rainfall than on temperature and identified a temperature window of around 32–33°C where
endemic transmission and the rate of spread in disease-free regions is optimized [26].This
window was the same for Plasmodium falciparum and P. vivax, but mosquito density played a
stronger role in driving the rate of malaria spread than did the Plasmodium species [26]. Malaria
is transmitted by mosquitoes of the genus Anopheles. About 70 species are vectors of malaria
under natural conditions. These species vary considerably in their ability to transmit malaria.
Although Anopheles mosquitoes are most abundant in tropical or subtropical regions, they are
also found in temperate climates.
16
2.4.4.2 Dengue
Weather significantly influences dengue incidence and Climate change may contribute to an
increase in dengue incidence [27]. Dengue is transmitted by two species of mosquitoes,
Aedesaegypti and Aedesalbopictus. The dengue virus (a flavivirus) has four distinct serotypes
(designated DEN-1, -2, -3, and -4). Climate affects the seasonal abundance and distribution of
Aedes mosquitoes and seasonal patterns of dengue transmission. Several studies have explored
the relationship between climate and the intensity of dengue transmission. Temperature
improves dengue outbreaks forecasts better than humidity and rainfall [28].
2.4.5 Waterborne and foodborne diarrheal disease
Climatic conditions strongly impact the incidence and transmission of many waterborne and
foodborne diseases [30]. Many infectious diseases are sensitive to either temperature or
rainfall, showing strong seasonal variation in numerous sites. Changes in climate particularly
lead to an increase in temperature and a decrease in precipitation are associated with an increase
in diarrheal disease in children in Botswana, a sub-Saharan country with distinct wet and dry
seasons [29]. Many diarrheal diseases (infectious intestinal disease) peak in cases during the
hottest months of the year. This is true for Salmonella infections in Europe and for Shigella
infections in South Asia. Temperature and relative humidity directly influence the rate of
replication of bacterial and protozoan pathogens and the survival of viruses in the environment.
Rainfall, and especially heavy rainfall events, may affect the frequency and level of
contamination of drinking-water. Diarrheal disease has multiple modes of transmission, such
as via water, food, insects or contact between humans. The relative importance of the various
pathogens that cause diarrhea varies between locations and is greatly influenced by the level of
sanitation. Several studies have described climate effects on specific diarrhea pathogens.
Pathogens vary in the severity of clinical symptoms and the likelihood that they will be reported
to health services. The numbers of cases reported either through clinics or laboratory-based
surveillance therefore only represents a small proportion of the total disease burden, especially
for diseases that are not severe. Further, relationships between climate and disease derived from
passive reporting may differ from those based on other methods of surveillance. Climate
change could greatly influence water resources and sanitation in situations where water supply
is effectively reduced. Drought events can lead to an increased concentration of pathogenic

17
organisms in raw water supplies. In addition, water scarcity may necessitate using sources of
fresh water of poorer quality, such as rivers, which are often contaminated. Decreased water
resources will also have consequences for safe food processing and preparation [30].
18
CHAPTER III
STUDY AREA
3.1 Socio-Economic Background
3.1.1 Location
Bangladesh is located in South Asia, bordered by India in the north, the Bay of Bengal in the
east and west, while Myanmar surrounds it to the south. The country of Bangladesh is in the
Asia continent and the latitude and longitude for the country are 23.8511° N, 89.9250° E.
Bangladesh covers 130,168 square kilometers of land and 13,830 square kilometers of water,
making it the 96th largest nation in the world with a total area of 143,998 square kilometers.
The population of Bangladesh is 161,083,804 (2012) and the nation has a density of 1238
people per square kilometer.
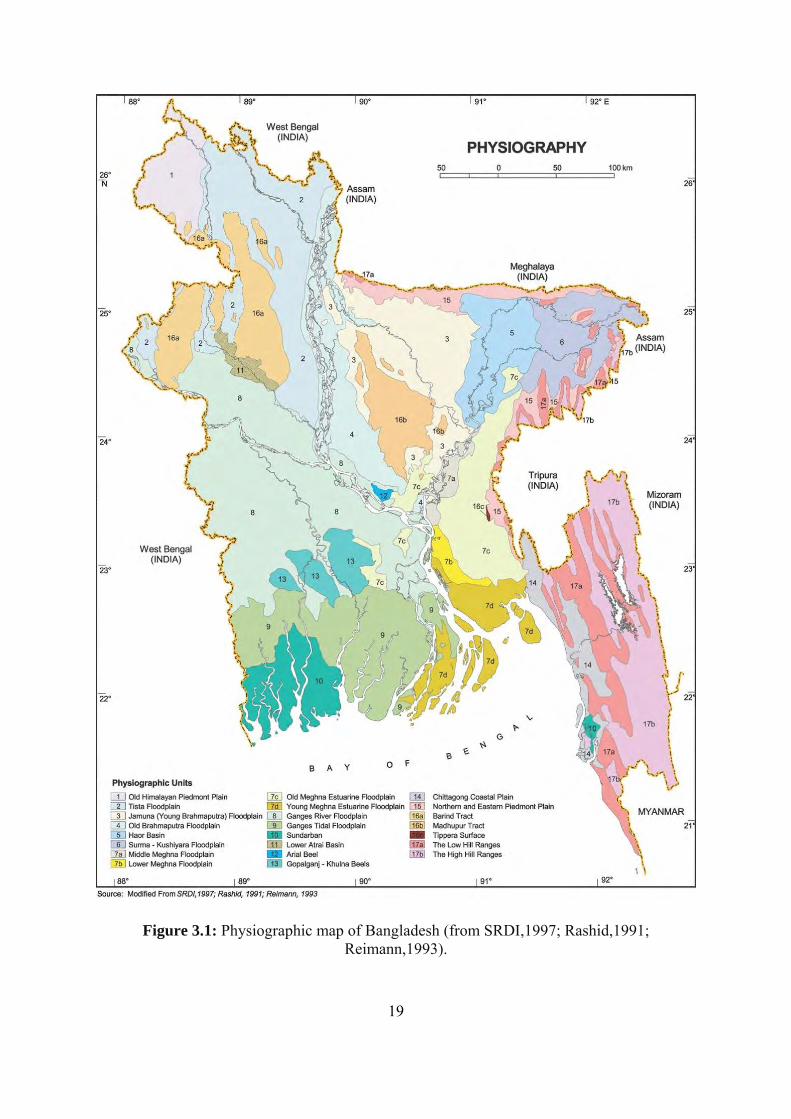
3.1.2 Administrative Setup
The country is divided into seven administrative divisions, which are further subdivided into
districts or zilas. The districts are further divided into sub-districts or ‘upazilas’. In the context
of physiography, Bangladesh may be classified into three distinct regions (a) floodplains, (b)
terraces, and (c) hills each having distinguishing characteristics of its own. The physiography
of the country has been divided into 24 sub-regions and 54 units which have shown in Figure
3.1. Major sub-regions and units are as below: i) Old Himalayan Piedmont Plain; ii) Tista
Floodplain; iii) Old Brahmaputra Floodplain; iv) Jamuna (Young Brahmaputra) Floodplain; v)
Haor Basin; vi) Surma-Kushiyara Floodplain; vii) Meghna Floodplain - a. Middle Meghna
Floodplain, b. Lower Meghna Floodplain, c. Old Meghna Estuarine Floodplain, d. Young
Meghna Estuarine Floodplain; viii) Ganges River Floodplain; ix) Ganges Tidal Floodplain; x)
Sundarbans; xi) Lower Atrai Basin; xii) Arial Beel; xiii) Gopalganj-Khulna Peat Basin; xiv)
Chittagong Coastal Plain; xv) Northern and Eastern Piedmont Plain; xvi) Pleistocene Uplands:
a. Barind Tract, b. madhupur tract and c. Tippera Surface; xvii) Northern and Eastern Hills a.
Low Hill Ranges (DupiTila and Dihing Formations), b. High Hill or Mountain Ranges (Surma
and Tipam Formations).
19
Figure 3.1: Physiographic map of Bangladesh (from SRDI,1997; Rashid,1991; Reimann,1993).
20
3.1.3 Demography
The total population in Bangladesh was last recorded at 160.1 million people in 2015 from 50.1
million in 1960, changing 220 percent during the last 50 years. Population in Bangladesh
averaged 100.77 Million from 1960 until 2015, reaching an all-time high of 160.10 Million in
2015 and a record low of 50.10 Million in 1960. Population in Bangladesh is reported by the
Bangladesh Bureau of Statistics.
The analysis of population density is confined to the ratio of population of a given geographical
or administrative unit to the area occupied by that unit. In terms of landmass, Bangladesh is
only the 94th largest country in the world with a surface area of 147,570 square kilometers
(56,977 square miles) but it certainly makes up for its size through its density statistics and
recently in every square kilometer there is an average 976 person which confirm the country’s
9th largest position in terms of population density around the world. The highest population
density is considered as most vulnerable. The population density by divisions, districts, agro-
ecological zones and natural disaster prone area and earthquake risk area are given below.
3.2 Environmental Background
3.2.1 Climate
Bangladesh enjoys generally a sub-tropical monsoon climate. While there are six seasons in a
year, three namely winter, summer and monsoon, are prominent. Winter which is quite pleasant
begins in November and ends in February. The climatic variations are often hazardous and at
times devastating. The metrological data have been used for discussing the climatic features.
Of all the climatic aspects we will try to consider only the rainfall and temperature which are
very important.
21
3.2.2 Rainfall
Monsoon starts in July and stays up to October. This period accounts for 80% of the total
rainfall. The average annual rainfall varies from 1429 to 4338 millimeters. The maximum
rainfall is recorded in the coastal areas of Chittagong and northern part of Sylhet district, while
the minimum is observed in the western and northern parts of the country [31].
3.2.3 Temperature
In winter there is not usually much fluctuation in temperature which ranges from minimum of
7oC—13o C (45oF—55oF) to maximum of 24oC—31o C (75oF—85oF). The maximum
temperature recorded in summer is 37o C (98oF) although in some places this occasionally
rises up to 41oC (105oF) or more [31].
3.3 Burden and distribution of disease
Bangladesh is vulnerable to outbreaks of infectious, waterborne and other types of diseases
[33]. Records show that the incidence of malaria increased from 1556 cases in 1971 to 15 375
in 1981, and from 30 282 cases in 1991 to 42 012 in 2004 (WHO, 2006). Other diseases such
as diarrhea and dysentery, etc. are also on the rise especially during the summer months. It has
been predicted that the combination of higher temperatures and potential increase in summer
precipitation may cause the spread of many infectious diseases. Climate change also brings
about additional stresses like dehydration, malnutrition and heat-related morbidity especially
among children and the elderly. These problems are thought to be closely interlinked with water
supply, sanitation and food production. Climate change has already been linked to land
degradation, freshwater decline, biodiversity loss and ecosystem decline, and stratospheric
ozone depletion. Changes in the above factors may have a direct or indirect impact on human
health as well. Bangladesh also carries the burden of high population, natural disasters and
diminishing and polluted natural resources. The added burden of increased health problems,
possibly due to climate change and climate variability, will push back its developmental
achievements. Public health depends on safe drinking water, sufficient food, secure shelter and
good social conditions. A changing climate is likely to affect all of these conditions. The health
22
effects of a rapidly-changing climate are likely to be overwhelmingly negative, particularly in
the poorest communities. Some of the health effects of climate change include:
3.4 Increasing frequency of heat waves
Heat waves can dramatically increase morbidity of heat-related illnesses and males are at
higher risks of having heat-related conditions during heat waves than females, and all age
groups are at risks in terms of heat diseases [32]. Recent analyses show that human induced
climate change contributed significantly to the occurrence of the European summer heat wave
of 2003 and of 2007. This has implications for Bangladesh since the elderly and children suffer
the most from increased temperatures. Even though no formal study on increase of heat waves
in Bangladesh has been undertaken, we are already observing yearly trends in rise in
temperatures. The health impacts associated with heat waves are heat stroke, dehydration and
aggravation of cardiovascular diseases in elderly people. It is also to be noted that Bangladesh
does not have records on illnesses and deaths related to heat waves. However, it was generally
observed that prevalence of diarrheal diseases increased during extreme temperatures and heat
waves, particularly in children.
3.5 Variable precipitation patterns
Extreme precipitation has an impact on the occurrence of infectious diseases. Infectious disease
outbreaks occurs in different extreme precipitation conditions [34]. Changes in precipitation
patterns are likely to compromise the supply of fresh water, thus increasing the risk of
waterborne diseases. They are also associated with floods and waterlogging that increase the
incidence of diarrhea, cholera and skin and eye diseases. Agricultural production and food
security are also linked directly to precipitation patterns – this impacts the nutritional status of
the population.
23
3.6 Malnutrition
Malnutrition linked to extreme-climatic events may be one of the most important consequences
of climate change [35]. Rising temperatures and variable precipitation are likely to decrease
agricultural production, thereby increasing the risk of malnutrition. Rice meet up more than 70
percent of the calories consumed by rural Bangladeshis. Rice production are very much
interrupted by flooding and yields are drastically reduced, the Bangladesh government imports
rice and boosts the country’s production the following year, resulting in rapid price increases.
As rice prices climb, consumers spend less on more nutritious food, and the number of
underweight children rises. More than 40 percent of Bangladeshi children under 5 already lack
vital minerals and vitamins, and climate change pushes more children into malnutrition [36].In
children, malnutrition impairs physical, cognitive, motor and emotional development.
Malnutrition will further increase the vulnerability of those affected to infectious and water-
and vector-borne diseases. Changes in climate are likely to lengthen the transmission seasons
of important vector-borne diseases, and alter their geographic range. Already, dengue is a
regular disease in the major cities of Dhaka and Chittagong. Therefore, to end this chain of
hunger and malnutrition, while addressing climate change we have to find and introduce
healthy diets and climate-smart food systems for all.
3.7 Sea level rise
Sea level rise will decrease available land, increase competition for additional infrastructure
and costs. The growing population and the constraints on land availability, will increase
competition for lower prices and higher ground, challenging the ability of socially-vulnerable
populations to respond to the impacts of sea-level rise. Processes of migration will likely lead
to an increase of the number of people at disease risk specially mosquito-spread diseases like
Zika, dengue fever, or chikungunya, or waterborne diseases, like giardia and cryptosporidium
[37].Sea level rise also increase the risk of coastal flooding, and may necessitate population
displacement, and cause many other health-related problems such as cholera, diarrhea,
malnutrition and skin diseases, etc. More than half of the world's population now lives within
60 km of the sea. Some of the most vulnerable regions are the Nile delta in Egypt, the Ganges-
Brahmaputra delta in Bangladesh, and many small islands, such as Maldives, and the Marshall
Islands and Tuvalu in the Pacific Ocean. In Bangladesh, millions of people suffer from

24
diarrhea, skin diseases, malaria, mental disorders and dengue, etc. Other health problems such
as malnutrition, hypertension and kala-azar also affect people in different regions of the
country.
25
CHAPTER IV
DATA AND METHODOLOGY
4.1 Introduction
For the development of an integrated assessment of climate vulnerability of the selected area,
a systemic approach has been adopted, centrally incorporating the concept of complex adaptive
systems and applying it through an interdisciplinary approach that integrates and combines
theoretical conceptions of various knowledge. The study focused on developing a method for
assessing climate vulnerability based on weather and socio-economic data. The study has two
delineated part- one is climate threat (CTI) or exposure quantified from observed and modeled
climate data, and the other is sensitivity and adaptability (A) calculation from secondary data
collected [9]. The study is carried out within an integrated multidisciplinary approach for
assessing current and future climate vulnerability of Bangladesh.
4.1.1 Research Design
Research differs from field to field, approach to approach and nature of work. To determine
the vulnerability to climate change of particular geographic area the research took a holistic
move combining both time series data analysis derived from meteorological station(s) or
climate model and local variable based data. Historical climate data (Bangladesh
Meteorological Department) and dynamically downscaled climate modeled data were used to
determine present and future climate threats of the study area. Representative socio-cultural,
economic and natural environment data were collected through secondary data source [9].
26
4.2 Data and Data Sources
4.2.1 Variable Identification
The variables are identified based on some categories which are classified according to the data
requirement. The socio-economic indicators were obtained from Statistical Yearbook of
Bangladesh 2013. The whole variable selection process is partially guided by the Adaptation
Policy Framework and concept of Shared Socio-economic Pathways [9].
The variables are classified into three board categories, which are-
1. Socio-cultural Variables;
2. Natural Variables; and
3. Economic Variables.
4.2.2 Indicator
The socio-economic indicators were obtained from Statistical Yearbook of Bangladesh 2013,
BBS. Adaptive capacity was expressed with 19 indicators. Sensitivity assessment included a
set of 7 specific indicators. A summary of 17 temperature and precipitation indicators with
explanations and 26 socio-economic indicators are presented. [9].
27
Table 4.1: Selected indicators for vulnerability assessment.
Adaptive
Capacity 19
Sensitivity 7 Exposure 17 Explanation of Climate
Indices
Literacy Rate
Population Density
R95p
Annual total PRCP when RR > 95percentile precipitation on wet days
Economic Activity
Child-Women Ratio
R99p Annual total PRCP when RR > 99percentile precipitation on wet days
Handloom Unit
Population Engaged in Agriculture
Maximum length of wet spell: CWD
Maximum number of consecutive days with RR ≥ 1mm
Livestock No. of Non-Farm Holding
Maximum length of dry spell: CDD
Maximum number of consecutive days with RR < 1mm
Irrigated Area No. of Small Farm Holding
Simple precipitation intensity index: SDII
SDII is the ratio of sum of RR and wet days when (RR ≥ 1mm)
Cropping Intensity
Agricultural Labor House Hold No.
R10mm Annual count of days when PRCP≥ 10mm
Water Source (Ponds)
Net Cultivated Area
R20mm Annual count of days when PRCP≥ 20mm
Boro Area R100mm Annual count of days when PRCP≥ 100mm
Wheat Area Annual total precipitation: PRCPTOT
Sum of annual total precipitation in wet days.
Jute Area Cold spell duration index: CSDI
At least 6 consecutive days in a year when TX > 90th percentile
Oil Seed Area Warm spell duration index: WSDI
At least 6 consecutive days in a year when TX > 90th percentile
Sugar-cane Area
Number of summer days: SU25
Annual count of days when TX (daily maximum temperature) > 25°C
Potato Area Number of summer days: SU35
Annual count of days when TX(daily maximum temperature) > 35°C
Local Market Facility
Number of tropical nights: TR20
Annual count of days when TN (daily minimum temperature) > 20°C
Electricity Connection
Number of tropical nights: TR25
Annual count of days when TN (daily minimum temperature) > 25°C
28
Power Operating Machinery
Number of icing days: ID20
Annual count of days when TX (daily maximum temperature) < 20°C
Power Source (Gas)
Number of frost days: FD5
Annual count of days when TN(daily minimum temperature) < 5°C
Installment Loan Holdings
Permanent Housing Structure
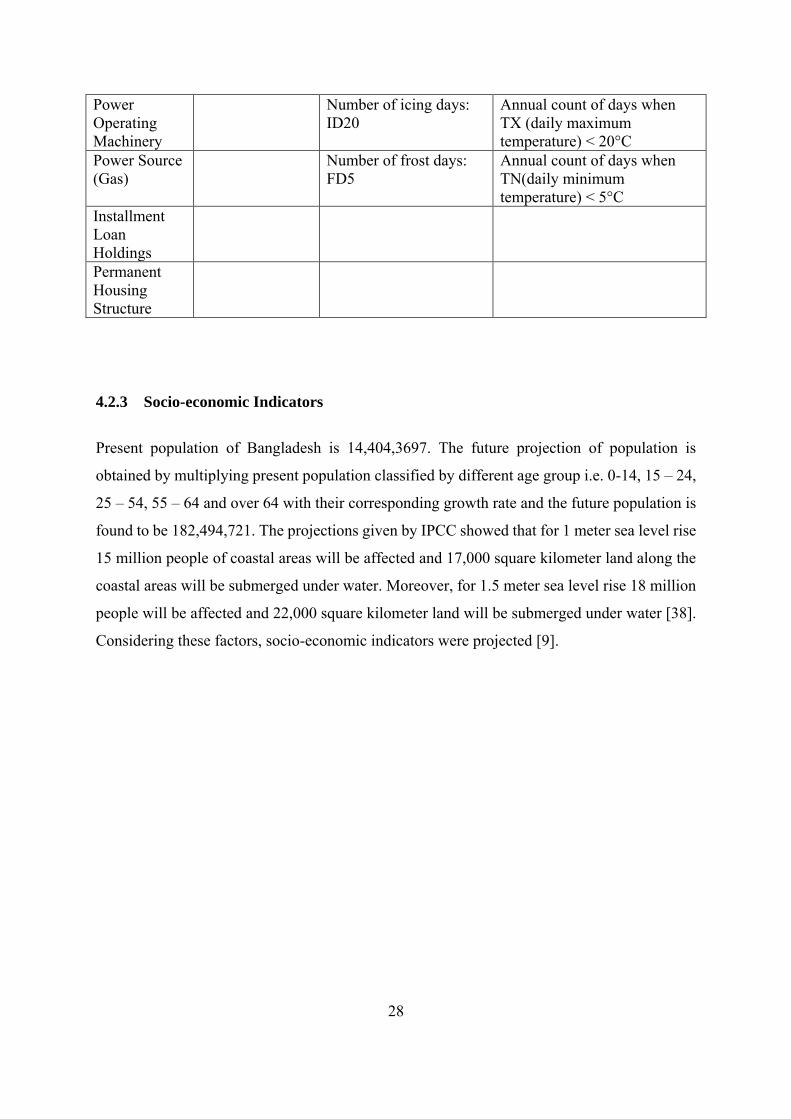
4.2.3 Socio-economic Indicators
Present population of Bangladesh is 14,404,3697. The future projection of population is
obtained by multiplying present population classified by different age group i.e. 0-14, 15 – 24,
25 – 54, 55 – 64 and over 64 with their corresponding growth rate and the future population is
found to be 182,494,721. The projections given by IPCC showed that for 1 meter sea level rise
15 million people of coastal areas will be affected and 17,000 square kilometer land along the
coastal areas will be submerged under water. Moreover, for 1.5 meter sea level rise 18 million
people will be affected and 22,000 square kilometer land will be submerged under water [38].
Considering these factors, socio-economic indicators were projected [9].
29
4.2.4 Climate Indices
The maximum and minimum temperature and daily precipitation data obtained in this study
was split into base period and 2050and 2080 in order to assess observed changes of extreme
climate over the stations. The data was quality controlled using the RClimDex software
package. All unreasonable values were for the meteorological variables were missing. These
include: (a) daily precipitation amounts less than zero and (b) daily maximum temperature less
than daily minimum temperature. The erroneous observations (i.e., the unrealistic data) were
replaced with a code (-99.9) which is recognized as missing data [9].
Out of 63 stations in Bangladesh, 59 stations with the most complete data (less than 1% of
missing data for a period of 130 years from 1971 to 2100 were chosen and 27 climate indices
were obtained, of which 17 was found suitable enough for this study. These indices were
developed by the World Climate Research Program’s Expert Team on Climate Change
Detection and Indices (ETCCDI) [9].
4.3 Calculating Indicator Score
4.3.1 Index Based Method
Each of the sub-components is measured in a different unit. The equation used to convert these
indicators was adapted from that used in the Human Development Index to calculate the life
expectancy index (UNDP, 2007) [39]. This formula is particularly used when the sub-
components have a proportional functional relationship with vulnerability.
𝐼𝑛𝑑𝑒𝑥𝑋𝑑 = 𝑋𝑑−𝑋𝑚𝑖𝑛
𝑋𝑚𝑎𝑥−𝑋𝑚𝑖𝑛 (1)
Here, 𝑋𝑑is the original sub-component for district d, 𝑋𝑚𝑖𝑛and𝑋𝑚𝑎𝑥 are the minimum and
maximum values, respectively, for each sub-component. After standardization of each sub-
component, using PCA (Principal Components Analysis) method the weight (𝑊𝑖) of each sub
component has calculated.
After that the weighted value has calculated through multiplying by the standardized value by
the weight.
30
𝐶𝐹𝑑 = (𝑊_𝑖 ∗ 𝐼𝑛𝑑𝑒𝑥𝑋𝑑 ) (2)
𝐶𝐹𝑑 = IPCC-defined contributing factors,𝑊𝑖 = Weight of each major component.
Once, all the weighted values under the major components are calculated, the contributing
factors of IPCC, which are adaptive capacity, exposure and sensitivity are obtained through the
following equation.
𝑀𝑑 = ∑ (𝑊_𝑖∗ 𝐼𝑛𝑑𝑒𝑥𝑋𝑑
)𝑛𝑖=1
𝑛 (3)
Where, 𝑀𝑑 = Major component score for district d, 𝐼𝑛𝑑𝑒𝑥𝑋𝑑 = index value for each sub-
component, n = number of sub-component in each major component. CVI–IPCC is the Climate
Vulnerability Index which is calculated for each of the 64 districts in Bangladesh using the
IPCC framework.
Vulnerability Index = (Exposure - Adaptive capacity) * Sensitivity (4)
31
CHAPTER V
RESULTS AND DISCUSSION
5.1 Population Density by Districts
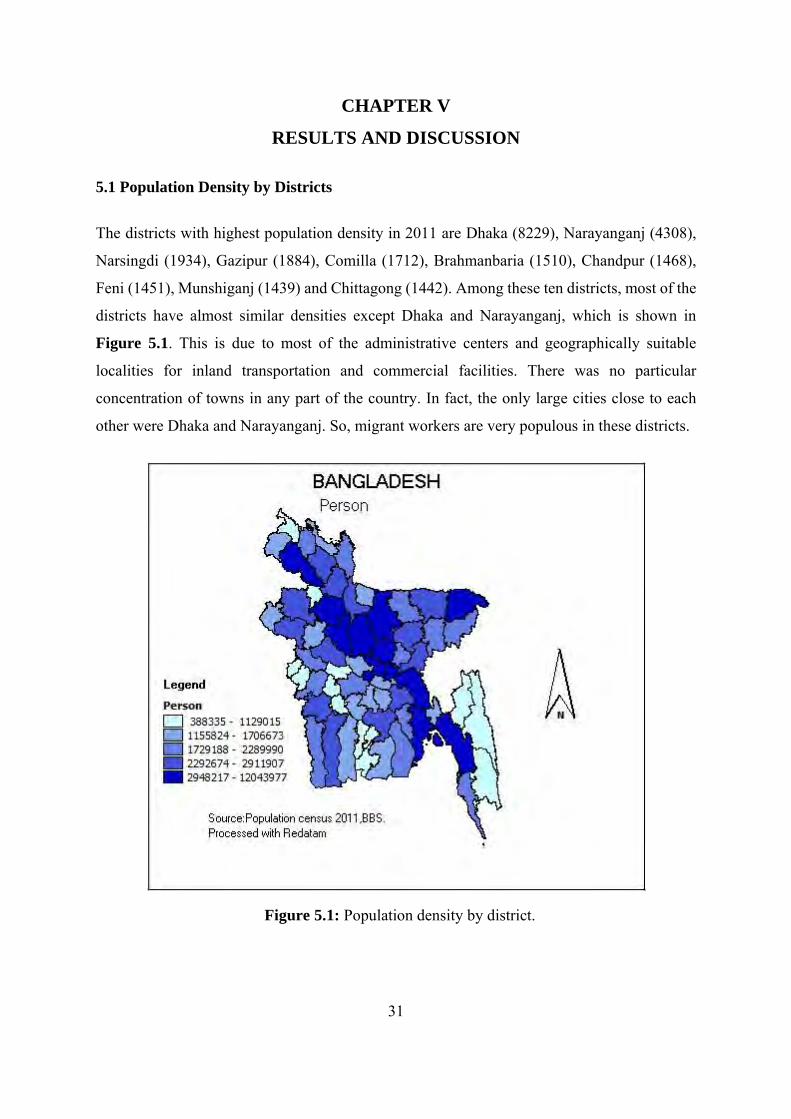
The districts with highest population density in 2011 are Dhaka (8229), Narayanganj (4308),
Narsingdi (1934), Gazipur (1884), Comilla (1712), Brahmanbaria (1510), Chandpur (1468),
Feni (1451), Munshiganj (1439) and Chittagong (1442). Among these ten districts, most of the
districts have almost similar densities except Dhaka and Narayanganj, which is shown in
Figure 5.1. This is due to most of the administrative centers and geographically suitable
localities for inland transportation and commercial facilities. There was no particular
concentration of towns in any part of the country. In fact, the only large cities close to each
other were Dhaka and Narayanganj. So, migrant workers are very populous in these districts.
Figure 5.1: Population density by district.
32
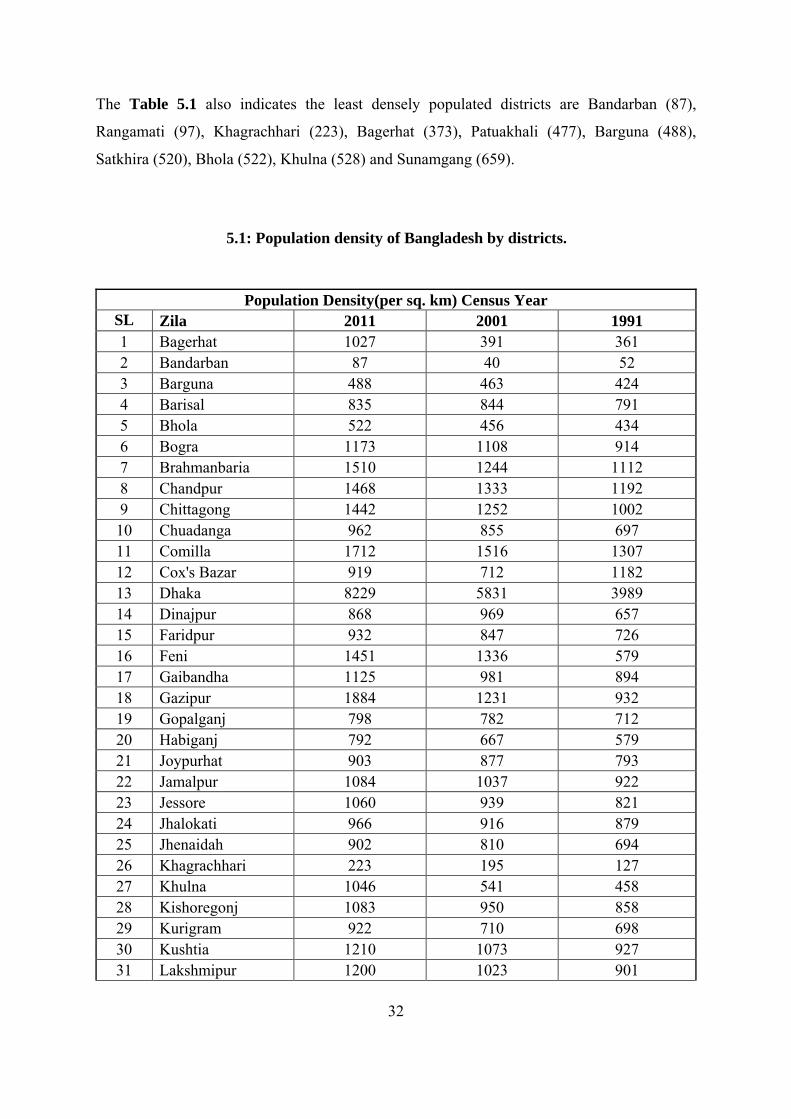
The Table 5.1 also indicates the least densely populated districts are Bandarban (87),
Rangamati (97), Khagrachhari (223), Bagerhat (373), Patuakhali (477), Barguna (488),
Satkhira (520), Bhola (522), Khulna (528) and Sunamgang (659).
5.1: Population density of Bangladesh by districts.
Population Density(per sq. km) Census Year SL
No. Zila 2011 2001 1991
1 Bagerhat 1027 391 361 2 Bandarban 87 40 52 3 Barguna 488 463 424 4 Barisal 835 844 791 5 Bhola 522 456 434 6 Bogra 1173 1108 914 7 Brahmanbaria 1510 1244 1112 8 Chandpur 1468 1333 1192 9 Chittagong 1442 1252 1002 10 Chuadanga 962 855 697 11 Comilla 1712 1516 1307 12 Cox's Bazar 919 712 1182 13 Dhaka 8229 5831 3989 14 Dinajpur 868 969 657 15 Faridpur 932 847 726 16 Feni 1451 1336 579 17 Gaibandha 1125 981 894 18 Gazipur 1884 1231 932 19 Gopalganj 798 782 712 20 Habiganj 792 667 579 21 Joypurhat 903 877 793 22 Jamalpur 1084 1037 922 23 Jessore 1060 939 821 24 Jhalokati 966 916 879 25 Jhenaidah 902 810 694 26 Khagrachhari 223 195 127 27 Khulna 1046 541 458 28 Kishoregonj 1083 950 858 29 Kurigram 922 710 698 30 Kushtia 1210 1073 927 31 Lakshmipur 1200 1023 901
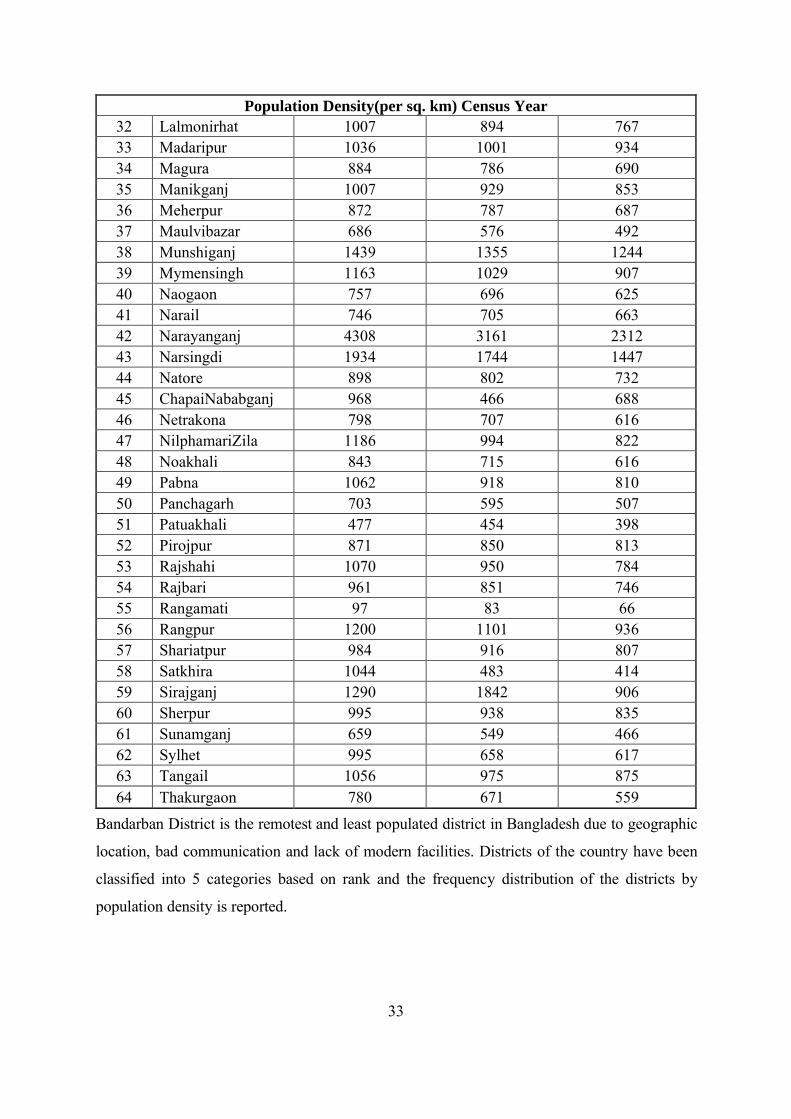
33
Population Density(per sq. km) Census Year 32 Lalmonirhat 1007 894 767 33 Madaripur 1036 1001 934 34 Magura 884 786 690 35 Manikganj 1007 929 853 36 Meherpur 872 787 687 37 Maulvibazar 686 576 492 38 Munshiganj 1439 1355 1244 39 Mymensingh 1163 1029 907 40 Naogaon 757 696 625 41 Narail 746 705 663 42 Narayanganj 4308 3161 2312 43 Narsingdi 1934 1744 1447 44 Natore 898 802 732 45 ChapaiNababganj 968 466 688 46 Netrakona 798 707 616 47 NilphamariZila 1186 994 822 48 Noakhali 843 715 616 49 Pabna 1062 918 810 50 Panchagarh 703 595 507 51 Patuakhali 477 454 398 52 Pirojpur 871 850 813 53 Rajshahi 1070 950 784 54 Rajbari 961 851 746 55 Rangamati 97 83 66 56 Rangpur 1200 1101 936 57 Shariatpur 984 916 807 58 Satkhira 1044 483 414 59 Sirajganj 1290 1842 906 60 Sherpur 995 938 835 61 Sunamganj 659 549 466 62 Sylhet 995 658 617 63 Tangail 1056 975 875 64 Thakurgaon 780 671 559
Bandarban District is the remotest and least populated district in Bangladesh due to geographic
location, bad communication and lack of modern facilities. Districts of the country have been
classified into 5 categories based on rank and the frequency distribution of the districts by
population density is reported.
34
Dhaka and Narayanganj are the most densely populated districts where Bandarban, Rangamati,
Khagrachhari, Satkhira, Khulna, Bagerhat, Barguna, Patuakhali, Bhola and Sunamganj are the
least densely populated districts.
5.2 Education/ Literacy
The literacy rate of the population of Bangladesh is average (Uddin and Iftekhar 2005). This
literacy may be obstructive to enhance awareness level or to sensitize the population on climate
change, its vulnerabilities and adaptation needs. This will also be a disadvantage in adapting
new technologies to reduce vulnerabilities. From the population census 2011, it has been found
that the literacy rate is very low in Jhalokati, Bandarban, Narail, Rangamati and Khagrachhari,
districts in Bangladesh, which is shown in Figure 5.2.
Figure 5.2: District wise literacy status.
35
5.3 Child-Women Ratio
Population ratios are used to describe the degree of balance between two elements of the
population, e.g., children versus women of reproductive age. In the absence of a direct measure
of births, this ratio can be used as a rough indicator of fertility levels as it only accounts for
children who survive to 4 years of age. From the population census 2011 it has been found that
Children<5/women ratio is very high in the Eastern districts like Cox’sbazar, Bandarban,
Bhola, Sylhet, Moulovibazar districts in Bangladesh, which is shown in Figure 5.3.
Figure 5.3: Children<5/women ration.
36
5.4 Household structure
Household structures are the most significant indicator in terms of health vulnerability
assessment. The structure of the dwelling households in Bangladesh are mostly “kutcha”.
Percentage distribution of households by type of housing structures is given in the figures. The
quantity of Pacca house is higher in Dhaka, Chittagong, Narayanganj, Sylhet, Jessore which is
represented in Figure 5.4 and Semi-pucca in Dhaka, Gazipur, Chittagong, Narayanganj,
Jessore, Sylhet, Bogra, Rajshahi, Dinajpur, Comilla, which is represented in Figure 5.5.
Figure 5.4: Pucca household structure.
Figure 5.5: Semi-pucca household
structure.
37
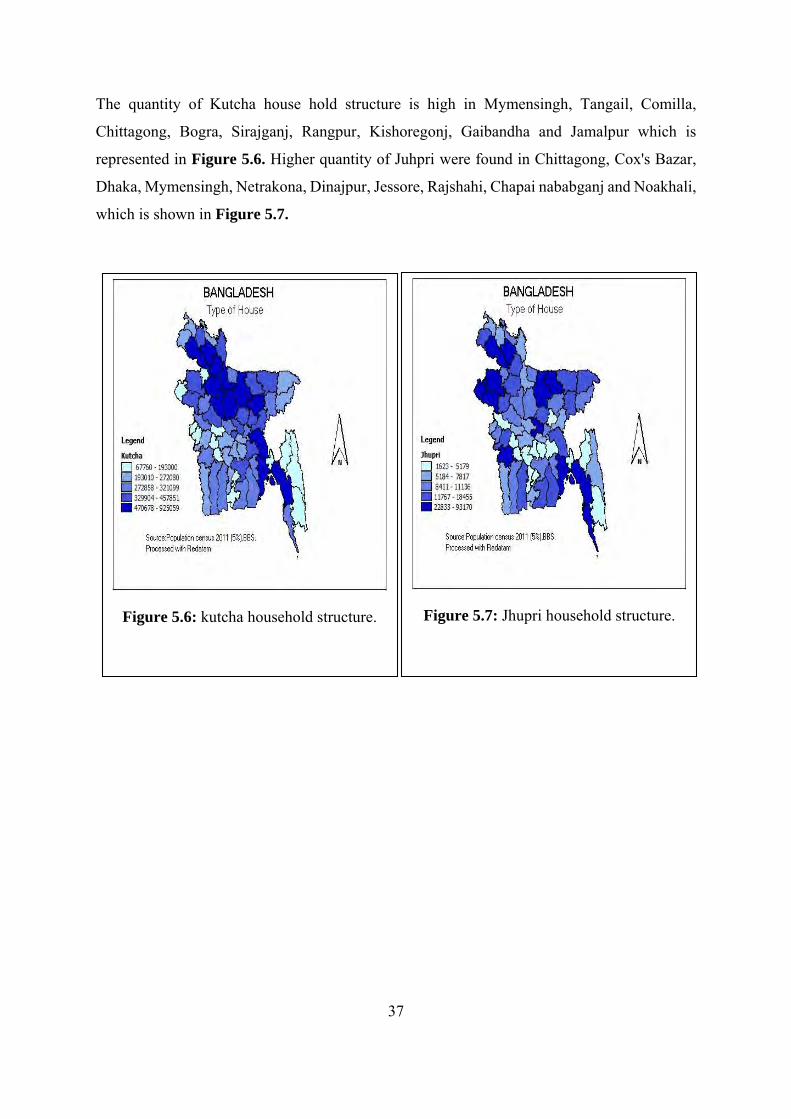
The quantity of Kutcha house hold structure is high in Mymensingh, Tangail, Comilla,
Chittagong, Bogra, Sirajganj, Rangpur, Kishoregonj, Gaibandha and Jamalpur which is
represented in Figure 5.6. Higher quantity of Juhpri were found in Chittagong, Cox's Bazar,
Dhaka, Mymensingh, Netrakona, Dinajpur, Jessore, Rajshahi, Chapai nababganj and Noakhali,
which is shown in Figure 5.7.
Figure 5.6: kutcha household structure.
Figure 5.7: Jhupri household structure.
38
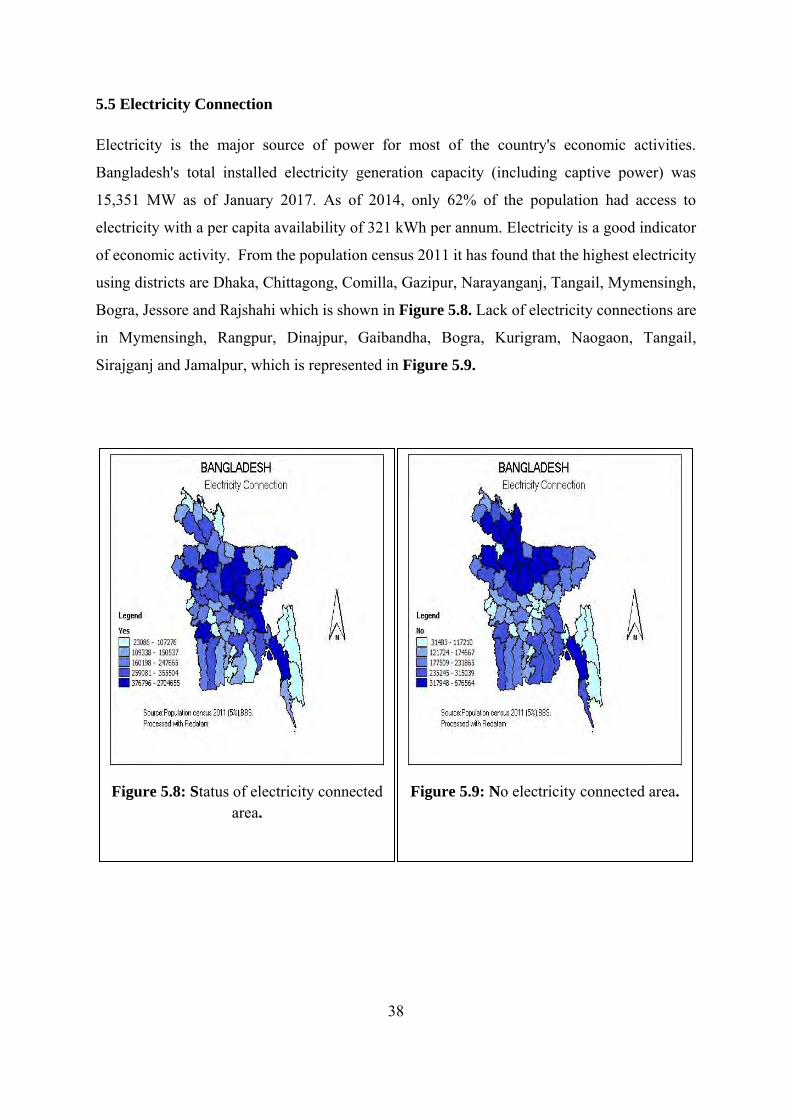
5.5 Electricity Connection
Electricity is the major source of power for most of the country's economic activities.
Bangladesh's total installed electricity generation capacity (including captive power) was
15,351 MW as of January 2017. As of 2014, only 62% of the population had access to
electricity with a per capita availability of 321 kWh per annum. Electricity is a good indicator
of economic activity. From the population census 2011 it has found that the highest electricity
using districts are Dhaka, Chittagong, Comilla, Gazipur, Narayanganj, Tangail, Mymensingh,
Bogra, Jessore and Rajshahi which is shown in Figure 5.8. Lack of electricity connections are
in Mymensingh, Rangpur, Dinajpur, Gaibandha, Bogra, Kurigram, Naogaon, Tangail,
Sirajganj and Jamalpur, which is represented in Figure 5.9.
Figure 5.8: Status of electricity connected area.
Figure 5.9: No electricity connected area.
39
5.6 Employment Field
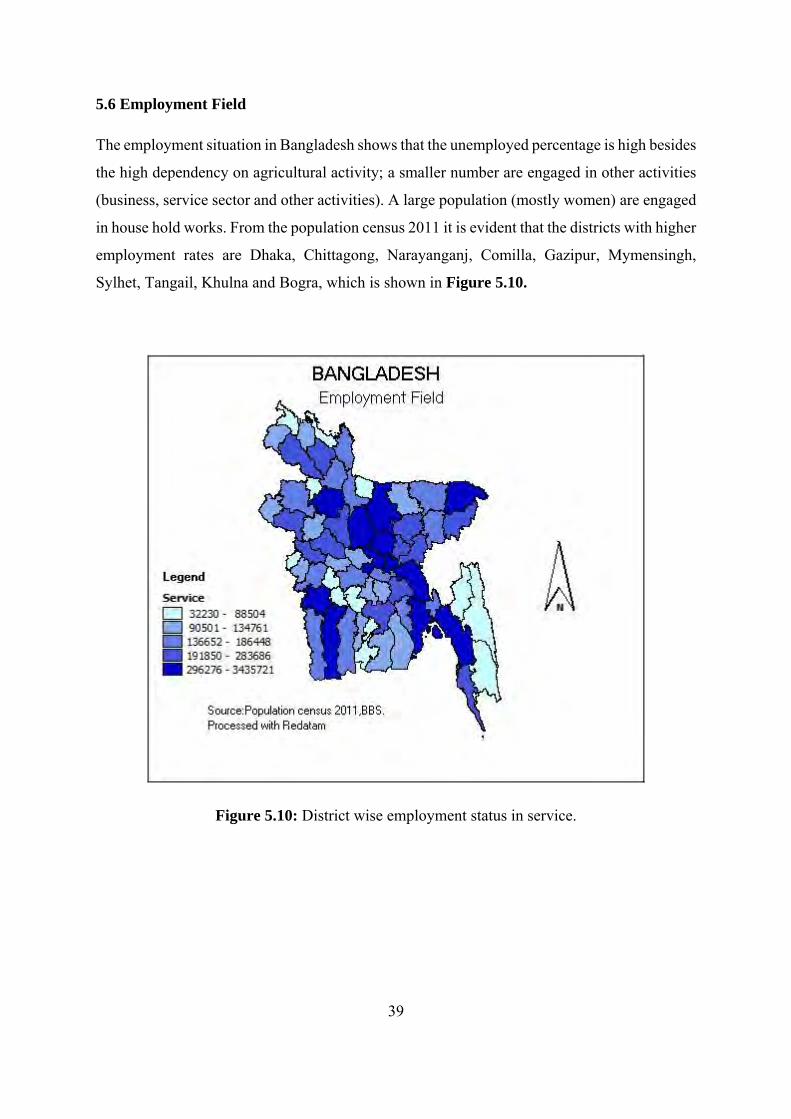
The employment situation in Bangladesh shows that the unemployed percentage is high besides
the high dependency on agricultural activity; a smaller number are engaged in other activities
(business, service sector and other activities). A large population (mostly women) are engaged
in house hold works. From the population census 2011 it is evident that the districts with higher
employment rates are Dhaka, Chittagong, Narayanganj, Comilla, Gazipur, Mymensingh,
Sylhet, Tangail, Khulna and Bogra, which is shown in Figure 5.10.
Figure 5.10: District wise employment status in service.

40
Population engaged in the field of agriculture are high in Mymensingh, Bogra, Naogaon,
Dinajpur, Comilla. Tangail, Rangpur, Rajshahi, Gaibandha and Sunamganj which is shown in
Figure 5.11. And Population highly engaged in industrial employments in Dhaka, Gazipur,
Chittagong, Narayanganj, Sirajganj, Mymensingh, Narsingdi, Sylhet and Comilla, which is
represented in Figure 5.12.
Figure 5.11: Employment in the field of
agriculture.
Figure 5.12: Employment in Industrial
area.
41
5.7 Water, Sanitation and Health Support Services
5.7.1 Drinking Water Facilities Status
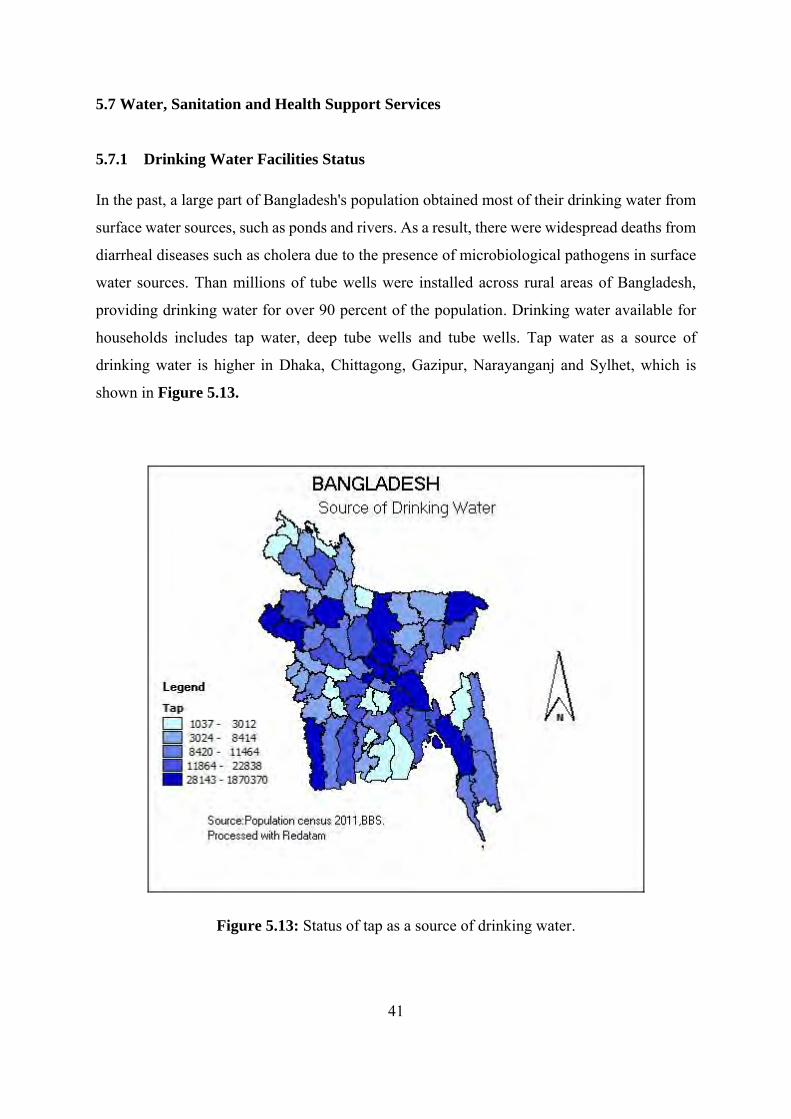
In the past, a large part of Bangladesh's population obtained most of their drinking water from
surface water sources, such as ponds and rivers. As a result, there were widespread deaths from
diarrheal diseases such as cholera due to the presence of microbiological pathogens in surface
water sources. Than millions of tube wells were installed across rural areas of Bangladesh,
providing drinking water for over 90 percent of the population. Drinking water available for
households includes tap water, deep tube wells and tube wells. Tap water as a source of
drinking water is higher in Dhaka, Chittagong, Gazipur, Narayanganj and Sylhet, which is
shown in Figure 5.13.
Figure 5.13: Status of tap as a source of drinking water.
42
Tube well as a source of drinking water is higher in Chittagong, Mymensingh, Comilla, Dhaka
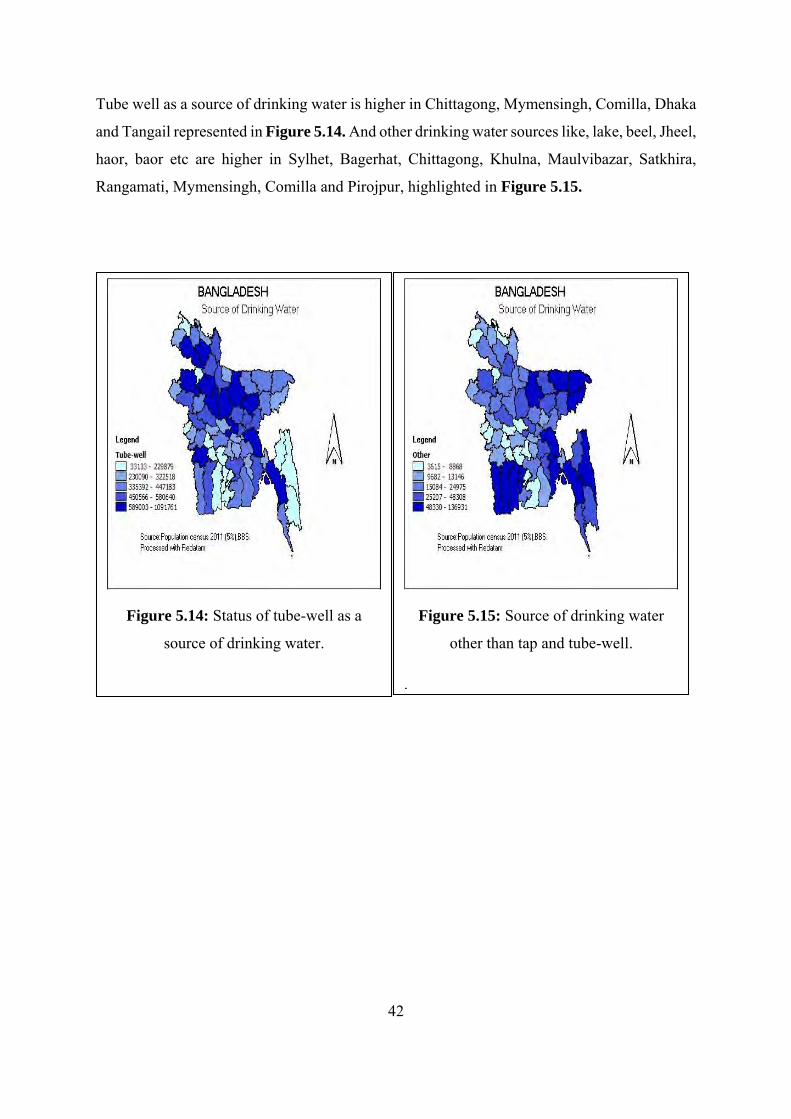
and Tangail represented in Figure 5.14. And other drinking water sources like, lake, beel, Jheel,
haor, baor etc are higher in Sylhet, Bagerhat, Chittagong, Khulna, Maulvibazar, Satkhira,
Rangamati, Mymensingh, Comilla and Pirojpur, highlighted in Figure 5.15.
Figure 5.14: Status of tube-well as a
source of drinking water.
Figure 5.15: Source of drinking water
other than tap and tube-well.
.
43
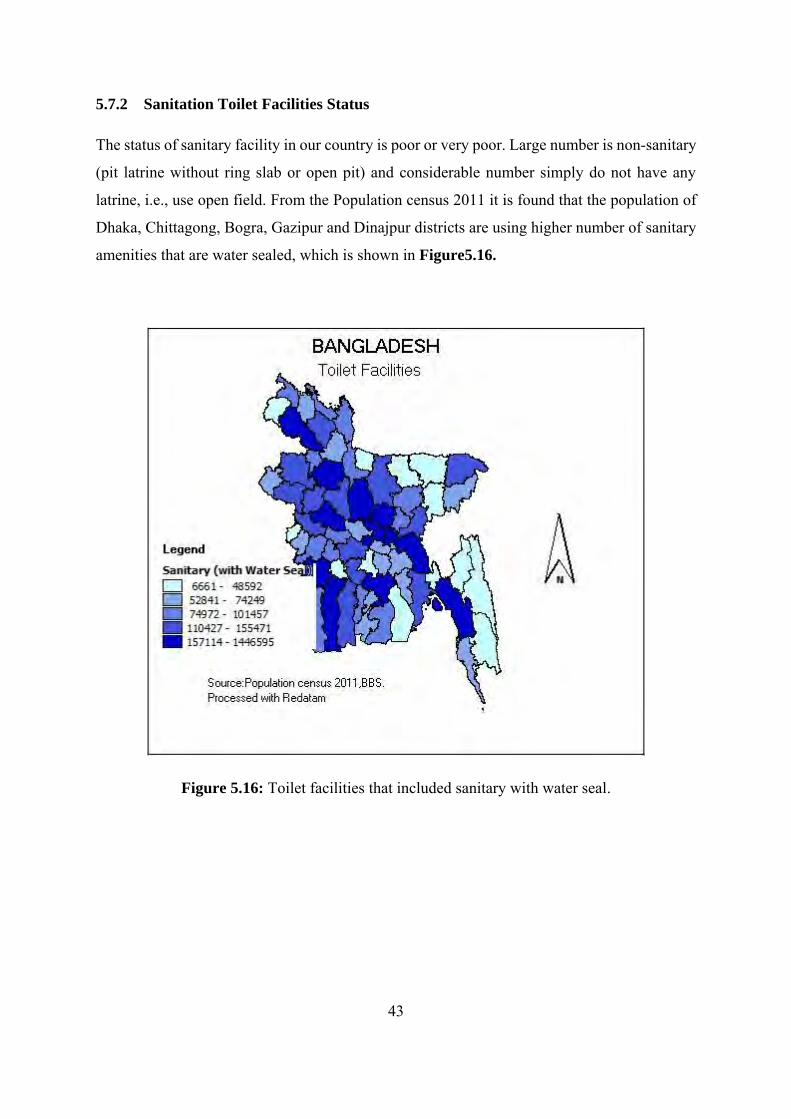
5.7.2 Sanitation Toilet Facilities Status
The status of sanitary facility in our country is poor or very poor. Large number is non-sanitary
(pit latrine without ring slab or open pit) and considerable number simply do not have any
latrine, i.e., use open field. From the Population census 2011 it is found that the population of
Dhaka, Chittagong, Bogra, Gazipur and Dinajpur districts are using higher number of sanitary
amenities that are water sealed, which is shown in Figure5.16.
Figure 5.16: Toilet facilities that included sanitary with water seal.
44
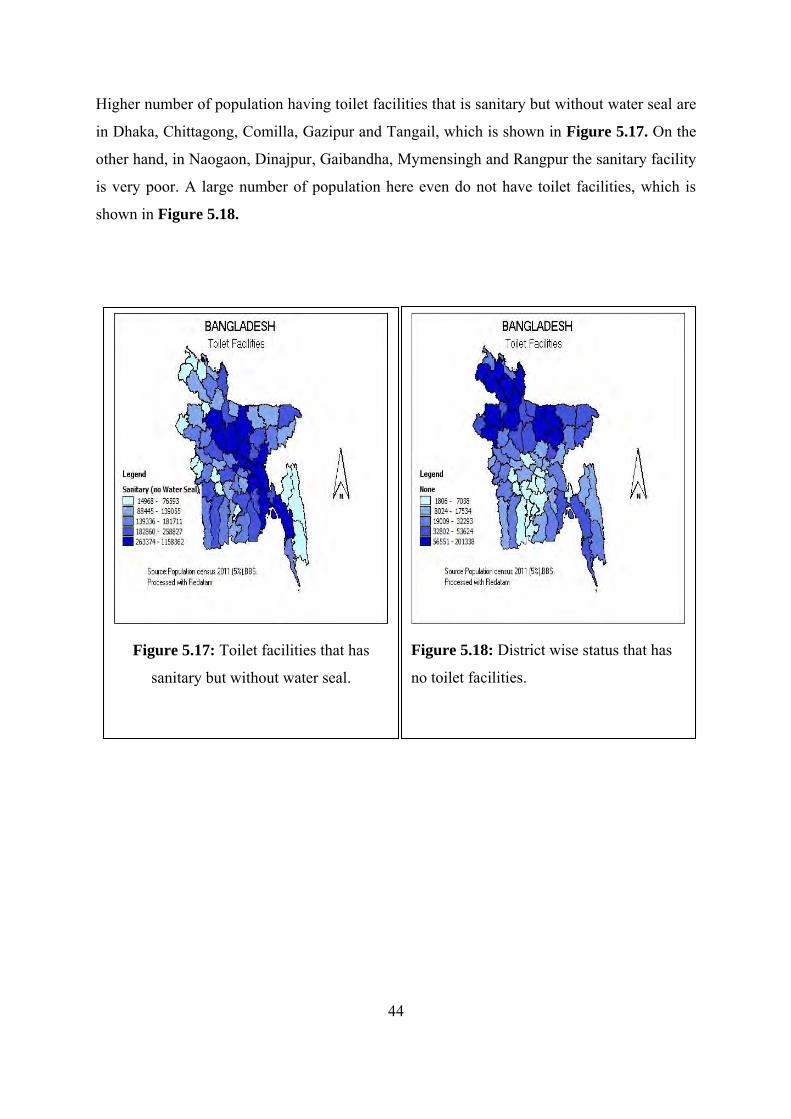
Higher number of population having toilet facilities that is sanitary but without water seal are
in Dhaka, Chittagong, Comilla, Gazipur and Tangail, which is shown in Figure 5.17. On the
other hand, in Naogaon, Dinajpur, Gaibandha, Mymensingh and Rangpur the sanitary facility
is very poor. A large number of population here even do not have toilet facilities, which is
shown in Figure 5.18.
Figure 5.17: Toilet facilities that has
sanitary but without water seal.
Figure 5.18: District wise status that has
no toilet facilities.
45
5.8 Adaptive capacity
While assessing adaptive capacity, a group of related indicators have been taken under
consideration. As the adaptive capacity refers to the ability of a system to accommodate or
cope with climate change impacts with minimal disruption [40], Selecting indicators are
particularly important to get a better outcome. Indicators those are selected to reflect the
adaptive capacity in this study are Literacy Rate, Economic Activity, Handloom Unit,
Livestock, Irrigated Area, Cropping Intensity, Water Source (Ponds), Boro Area, Wheat Area,
Jute Area, Oil Seed Area, Sugar-cane Area, Potato Area, Local Market Facility, Electricity
Connection, Power Operating Machinery, Power Source (Gas), Installment Loan Holdings and
Permanent Housing Structure. Adaptive capacity basically considers the ability to move, adapt
evolutionary and modify behavior. Based on these indicators, adaptive capacity of different
districts has shown different statuses.
Considering the Literacy rate Dhaka, Jhalokati, Pirojpur, Gazipur and Narail has higher
adaptive capacity. Especially the higher the literacy rate the higher the adaptive
capacity.
Considering the water source Mymensingh, Patuakhali, Barguna, Bhola and Chittagong
has higher adaptive capacity.
In terms of Local market facility Dinajpur, Sunamganj, Laksmipur, Brahmanbaria and
Thakurgaon has higher adaptive capacity.
Dinajpur, Narsingdi, Chuadanga, Gopalganj and Kurigram has higher adaptive capacity
based on the Facilities of power source (gas).
Adaptive capacity is high in Joypurhat, Bogra, Magura, Bhola and Rangpur due to the
higher cropping intensity.
Narsingdi, Rangamati, Narayanganj, Khagrachari and Bandarban has high adaptive
capacity in terms of Handloom Unit.
Assessing adaptive capacity – can be intrinsic or extrinsic like behavioral or phenotypic
plasticity, genetic diversity, ecosystem processes and redundancy. Detailed data is given in
APPENDIX A.
46
5.9 Sensitivity
While assessing sensitivity a group of related indicators has been considered. Sensitivity is the
degree to which something is or is likely to be affected by or responsive to climate changes
[41]. It consider physiology, behavior, habitat specificity and affected by other stressors.
Indicators those are selected to reflect the sensitivity in this study are population density, child-
women ratio, population engaged in agriculture, non-farm household, small-farm household,
agricultural labor household and net cultivated area. Based on these indicators, sensitivity of
different districts has shown different statuses.
Considering the Population Density Dhaka, Feni, Narayanganj, Narail and Shariatpur
has high sensitivity.
In terms of Children-Women Ratio Cox's Bazar, Bhola, Sunamganj, Brahmanbaria and
Netrokona has high sensitivity.
Comilla, Mymensingh, Kishoreganj, Jamalpur and Dinajpur has higher sensitivity
based on the Population Engaged in Agriculture.
Sensitivity is high in Dhaka, Chittagong, Mymensingh, Narayanganj and Comilla due
to high Non-Farm Household
Higher Sensitivity found in Mymensingh, Comilla, Tangail, Bogra and Chittagong
based on Small-Farm Household.
Mymensingh, Dinajpur, Comilla, Gaibandha and Rangpur has high Sensitivity in terms
of Agricultural Labor Household.
Considering the Net Cultivated Area Rangamati, Chittagong, Bandarban, Mymensingh
and Khulna has high sensitivity.
Assessing Sensitivity – There is focus on intrinsic factors like phenology and environmental
cues, interactions, community structure and temperature‐sensitive species or ecosystem -
processes. Detailed data is given in APPENDIX B.
47
5.10 Exposure
Exposure refers to the nature and degree to which a system is exposed to significant climate
variations (IPCC 2001). Specially mobility, habitat use, life history and interactions with other
stressors. Indicators selected to reflect the exposure in this study are R95p, R99p, CWD, CDD,
SDII, R10, R20, R100, PRCPTOT, CSDI, WSDI, SU25, SU35, TR20, TR25, ID20 and FD5.
Based on these indicators, exposure of different districts has shown different statuses.
Considering the Annual total PRCP when RR > 95percentile precipitation on wet days
the Nawabganj, Rajshahi, Bogra, Jamalpur and Kushtia has high Exposer.
In terms of Annual total PRCP when RR > 99percentile precipitation on wet days Cox's
Bazar, Barguna, Feni, Narail and Bhola has high Exposer.
Barguna, Cox's Bazar, Sunamganj, Rangamati and Noakhali has higher Exposer based
on the Maximum length of wet spell: CWD.
Exposer is high in Brahmanbaria, Rangpur, Mymensingh, Netrokona and Jamalpur due
to high Maximum length of dry spell: CDD
Higher Exposer found in Jamalpur, Nawabganj, Rajshahi, Bogra and Rajbari based on
Simple precipitation intensity index: SDII.
Jamalpur, Rajbari, Nawabganj, Bogra and Manikganj has high Exposer in terms of
Annual total precipitation: PRCPTOT.
Considering the Cold spell duration index: CSDI Mymensingh, Maulavibazar, Sylhet,
Lalmonirhat and Kurigram has high Exposer.
Considering the Warm spell duration index: WSDI Dinajpur, Panchagarh, Joypurhat,
Rangpur and Barguna has high Exposer.
In terms of Number of summer days: SU35 Naogaon, Natore, Pabna, Joypurhat and
Nawabganj has high Exposer.
Assessing Exposure – focus on extrinsic factors like climate – temp precipitation, drought,
hydrology, pH, salinity and storms. Climate and response models used extensively to estimate
exposure. The presence of people, livelihoods, species or ecosystems, environmental functions,
services, and resources, infrastructure, or economic, social, or cultural assets in places and
settings that could be adversely affected. Detailed data is given in APPENDIX C.
48
5.11 Vulnerability
Vulnerability analysis is an integrated approach, which considers both natural climate
variability and socio-economic drivers as climate change impacts resulting from the interaction
between climate and non-climate drivers and have significant regional variations. However,
regarding vulnerability to climate change, the IPCC defines this as ‘a function of the character,
magnitude and rate of climate change to which a system is exposed, its sensitivity and adaptive
capacity.
Vulnerability is calculated by analyzing the data of exposure, sensitivity and adaptive capacity.
Each district has different values under different exposer layers or indicators. Using the IPCC
guideline, it has calculated the exposer, sensitivity and adaptive capacity for each district and
then the vulnerability was found.
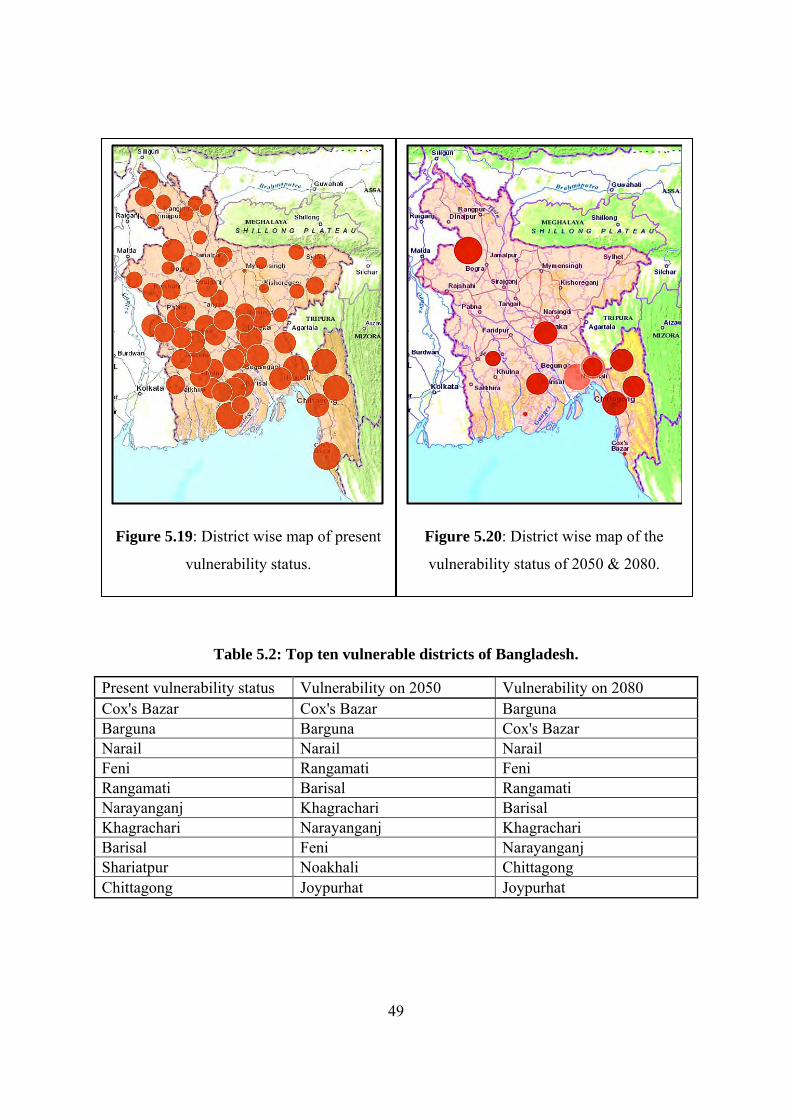
It has been found that Cox's Bazar, Barguna, Narail, Feni, Rangamati, Narayanganj,
Khagrachari, Barisal, Shariatpur and Chittagong districts are highly health vulnerable now
which is shown in Figure 5.19.
The trend of the health vulnerability has projected through models till 2050 and 2080. It has
been found that Cox's Bazar, Barguna, Narail, Rangamati, Barisal, Khagrachari, Narayanganj,
Feni, Noakhali and Joypurhat are highly health vulnerable in 2050. This is shown in Figure
5.20.
In 2080, Cox's Bazar, Barguna, Narail, Feni, Rangamati, Barisal, Khagrachari, Narayanganj,
Chittagong and Joypurhat has been found to be highly health vulnerable. This is shown in
Figure 5.20.
The detailed data of vulnerability is presented in APPENDIX D.
49
Table 5.2: Top ten vulnerable districts of Bangladesh.
Present vulnerability status Vulnerability on 2050 Vulnerability on 2080 Cox's Bazar Cox's Bazar Barguna Barguna Barguna Cox's Bazar Narail Narail Narail Feni Rangamati Feni Rangamati Barisal Rangamati Narayanganj Khagrachari Barisal Khagrachari Narayanganj Khagrachari Barisal Feni Narayanganj Shariatpur Noakhali Chittagong Chittagong Joypurhat Joypurhat
Figure 5.19: District wise map of present
vulnerability status.
Figure 5.20: District wise map of the
vulnerability status of 2050 & 2080.

50
5.12 Contribution of Temperature and Precipitation
Precipitation is higher in Cox's Bazar, Barguna, Chandpur, Shariatpur and Narail. Higher
temperature districts are Naogaon, Natore, Pabna, Joypurhat and Nawabganj, which is shown
in Figure 5.21. High temperature and rate of precipitation both have tremendous impact on
vector born and climate sensitive diseases. In this paper, an attempt is made to present a district-
wise health vulnerability map and evaluate various aspects of future projections of temperature
and precipitation extremes as well as socio-economic change over Bangladesh. And to evaluate
the health vulnerability map from the data derived from the climate sensitive diseases.
f
Figure 5.21: Contribution of Temperature and Precipitation on Human Health vulnerability.
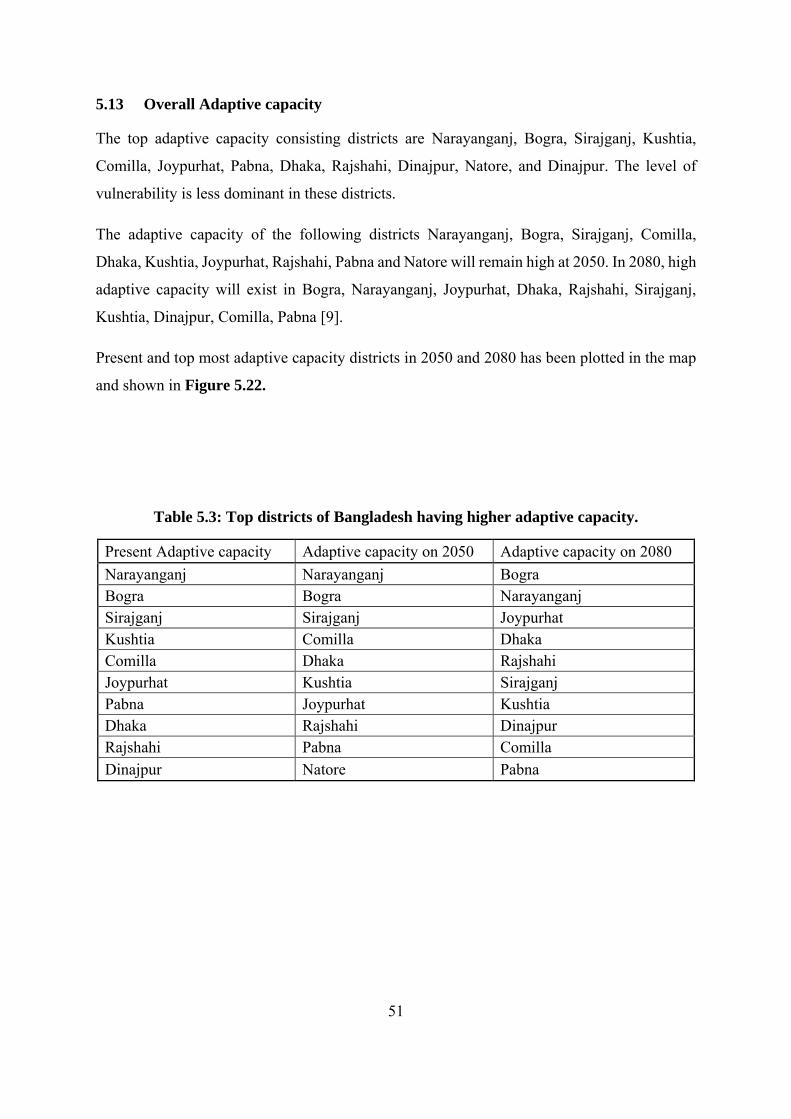
51
5.13 Overall Adaptive capacity
The top adaptive capacity consisting districts are Narayanganj, Bogra, Sirajganj, Kushtia,
Comilla, Joypurhat, Pabna, Dhaka, Rajshahi, Dinajpur, Natore, and Dinajpur. The level of
vulnerability is less dominant in these districts.
The adaptive capacity of the following districts Narayanganj, Bogra, Sirajganj, Comilla,
Dhaka, Kushtia, Joypurhat, Rajshahi, Pabna and Natore will remain high at 2050. In 2080, high
adaptive capacity will exist in Bogra, Narayanganj, Joypurhat, Dhaka, Rajshahi, Sirajganj,
Kushtia, Dinajpur, Comilla, Pabna [9].
Present and top most adaptive capacity districts in 2050 and 2080 has been plotted in the map
and shown in Figure 5.22.
Table 5.3: Top districts of Bangladesh having higher adaptive capacity.
Present Adaptive capacity Adaptive capacity on 2050 Adaptive capacity on 2080 Narayanganj Narayanganj Bogra Bogra Bogra Narayanganj Sirajganj Sirajganj Joypurhat Kushtia Comilla Dhaka Comilla Dhaka Rajshahi Joypurhat Kushtia Sirajganj Pabna Joypurhat Kushtia Dhaka Rajshahi Dinajpur Rajshahi Pabna Comilla Dinajpur Natore Pabna
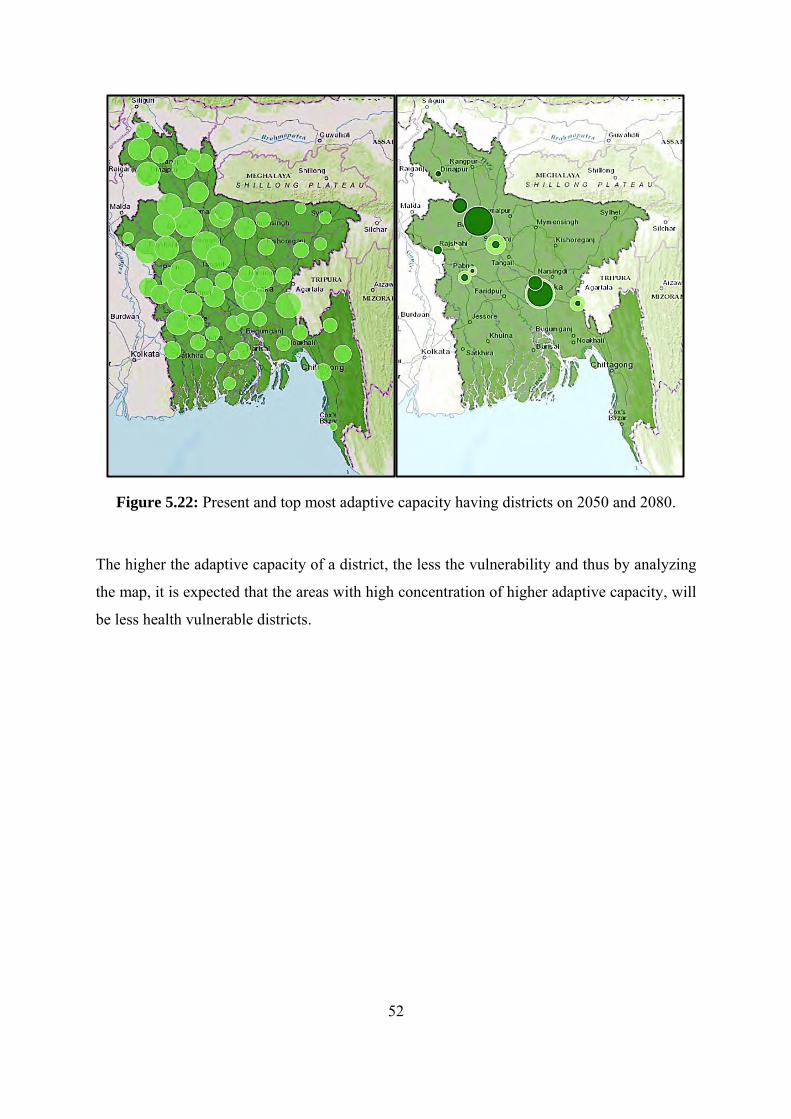
52
Figure 5.22: Present and top most adaptive capacity having districts on 2050 and 2080.
The higher the adaptive capacity of a district, the less the vulnerability and thus by analyzing
the map, it is expected that the areas with high concentration of higher adaptive capacity, will
be less health vulnerable districts.
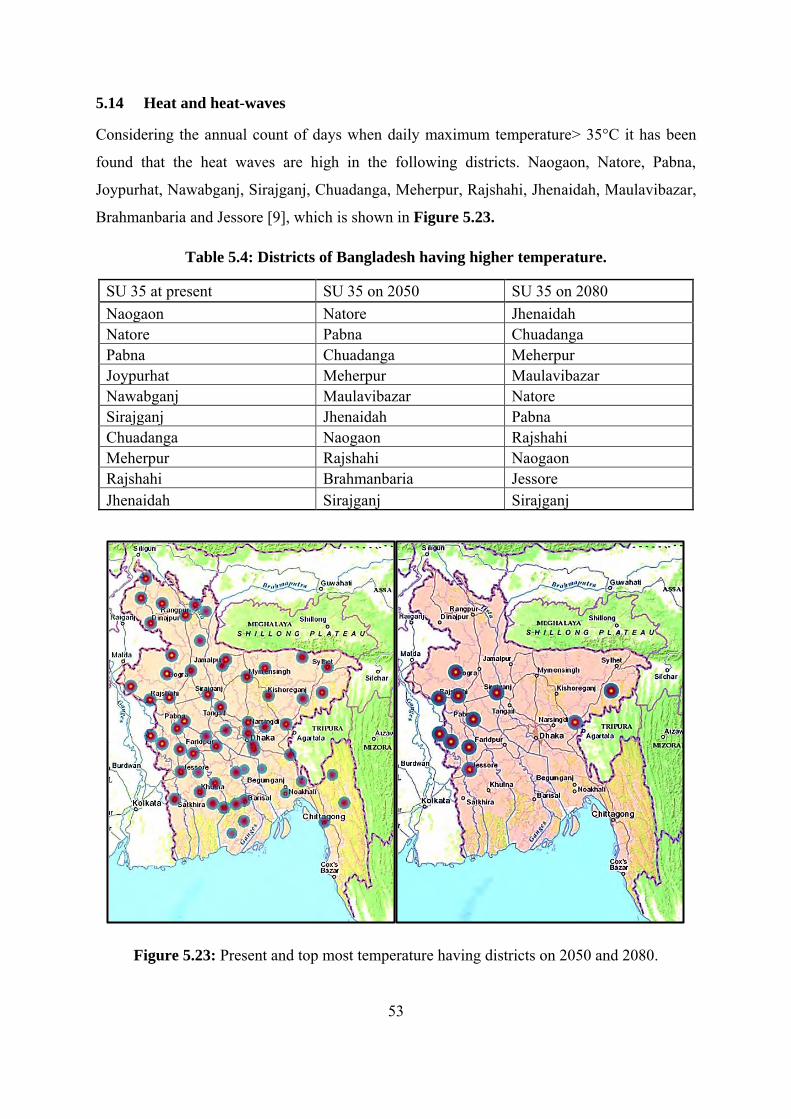
53
5.14 Heat and heat-waves
Considering the annual count of days when daily maximum temperature> 35°C it has been
found that the heat waves are high in the following districts. Naogaon, Natore, Pabna,
Joypurhat, Nawabganj, Sirajganj, Chuadanga, Meherpur, Rajshahi, Jhenaidah, Maulavibazar,
Brahmanbaria and Jessore [9], which is shown in Figure 5.23.
Table 5.4: Districts of Bangladesh having higher temperature.
SU 35 at present SU 35 on 2050 SU 35 on 2080 Naogaon Natore Jhenaidah Natore Pabna Chuadanga Pabna Chuadanga Meherpur Joypurhat Meherpur Maulavibazar Nawabganj Maulavibazar Natore Sirajganj Jhenaidah Pabna Chuadanga Naogaon Rajshahi Meherpur Rajshahi Naogaon Rajshahi Brahmanbaria Jessore Jhenaidah Sirajganj Sirajganj
Figure 5.23: Present and top most temperature having districts on 2050 and 2080.
54
High temperatures cause clinical syndromes such as heat stroke, heat exhaustion, heat syncope
and heat cramps. Many causes of death increase during periods of higher temperatures (heat-
waves), especially those from cardiovascular and respiratory disease.
In terms of high temperature SU35 mean Annual count of days when TX (daily maximum
temperature) > 35°Cat 2050 the following districts Chuadanga, Meherpur, Maulavibazar,
Jhenaidah, Naogaon, Brahmanbaria, Nawabganj, Mymensingh, Tangail, Netrokona will be
subjected to temperature sensitive diseases such as heat stroke, heat exhaustion, heat syncope,
heat cramps, heat allergy, asthma, cardiovascular and respiratory complexity may get highly
active. And at 2080 Jhenaidah, Chuadanga, Meherpur, Maulavibazar, Natore, Naogaon,
Jessore, Brahmanbaria, Mymensing and Faridpur districts will be highly health vulnerable to
temperature sensitive diseases.
5.15 Waterborne and food borne diarrheal and Cholera disease
More attention paid to environmental determinants of Cholera. V. cholera 01 increases with
copepods (which feed on phytoplankton) in coastal waters. The timing of cholera matches (with
lag) frequency of El Nino. It is predicted that rising sea surface temperatures will result in more
frequent cholera outbreaks. So costal districts where temperature remain high and result in sea
surface temperature rise is Cholera vulnerable.
5.16 Drought
A drought is an extended period of dry weather caused by a lack of rain or snow. As
temperatures rise due to global climate change, more moisture evaporates from land and water,
leaving less water behind. Some places are getting more rain or snow to make up for it, but
other places are getting less. Sometimes a drought takes decades to develop fully and they are
very difficult to predict. So considering the high temperature existing districts, it can be
assumed that Naogaon, Natore, Pabna, Joypurhat, Nawabganj, Sirajganj, Chuadanga,
Meherpur, Rajshahi, Jhenaidah, Maulavibazar, Brahmanbaria and Jessore are in drought risk.
55
5.17 Floods
Flooding occurs most commonly from heavy rainfall when natural watercourses do not have
the capacity to convey excess water. Considering the high volume of rainfall rate, like annual
count of days when precipitation ≥ 100mm, the most flood prone districts of Bangladesh are
Cox's Bazar, Barguna, Chandpur, Shariatpur, Narail, Noakhali, Feni, Chittagong, Bhola and
Khagrachari [9], which is shown in Figure 5.24.
Table 5.5: Districts of Bangladesh having higher Precipitation rate.
R100mm present R100mm 2050 R100mm 2080 Cox's Bazar Cox's Bazar Cox's Bazar Barguna Barguna Barguna Chandpur Chandpur Noakhali Shariatpur Shariatpur Narail Narail Noakhali Feni Noakhali Narail Chandpur Feni Feni Shariatpur Chittagong Chittagong Chittagong Bhola Bhola Bhola Khagrachari Khagrachari Khagrachari
Figure 5.24: Present and top most Precipitation having districts on 2050 and 2080.
56
Infectious diseases especially skin, gastrointestinal, respiratory infections; and mental
disorders like increases in common anxiety and depression disorders can be severely observed
in these districts. Proper structural protection and availability of fresh water need to be assure
in these districts as a part pre and post flood protection activities.
5.18 Malaria
Malaria is one of the major public health problem in Bangladesh. Out of 64 districts in the
country 13 border districts Bandarban, Chittagong, Cox's Bazar, Habiganj, Khagrachari,
Kurigram, Maulavibazar, Mymensingh, Netrokona, Rangamati, Sherpur, Sunamganj and
Sylhet shown in Figure 5.25 in the east and northeast facing the eastern states of India and a
small territory of Myanmar are in high endemic malaria zones, reporting about 98% of the total
malaria cases every year. During the Malaria Eradication Program (MEP) malaria was nearly
eradicated in the late 1960s but never disappeared. There surgence started since mid-1980s and
scaled up in many parts of the country assuming an epidemic proportion in many parts of the
hilly and forested areas include the foothills. These areas still have high transmission potentials,
due to prevailing vector prevalence, geo-physical condition and climate, and presence of some
‘hot-spots’ with perennial transmission round the year.
Malaria is endemic in 13 eastern and north-eastern border belt districts of the country with
variable transmission potentials (high, moderate and low). A total of 13.25 million people are at
risk of malaria inhabited in those districts. In 2013 the prevalence rate of malaria was found to
be 0.7% in these districts. About 80% of the total cases are reported from the three Chittagong
Hill Tract (CHT) districts (Rangamati, Khagrachari and Bandarban) including Chittagong and
the coastal district Cox’s Bazar. The CHT districts have perennial transmission throughout the
year due to the geo-physical location in the hilly, forested and the foot-hills, climate, and other
favorable conditions for the vector species. The map of Bangladesh blow shows the malaria
endemic areas based on available epidemiological data.
Parasites prefer 24-26C temp (reproduction rate double vs 20C), mosquitoes like a similar
range. Africa shows evidence of climate affecting malaria after heavy rain.
Based on the SU25 mean Annual count of days when TX (daily maximum temperature) > 25°C
it can be said that in 2050, the following districts Chittagong, Cox's Bazar, Khagrachari, and
57
Rangamati will be highly vulnerable. In 2080 the districts with high malaria vulnerability are
Cox's Bazar and Chittagong [9].
Figure 5.25: Showing the map indicates the districts of malaria endemic area.
58
5.18.1 Vulnerability Map in relation to the climate sensitive disease Malaria.
Figure 5.1 shows the district wise health vulnerability map of Bangladesh 2013. Here it shows
that south eastern districts are highly vulnerable. At the same time if we compare the
vulnerability map with the malaria epidemic map of 2013, it will clearly identify that the most
vulnerable districts are highly malaria prone. The higher the vulnerability the higher the malaria
cases found [9], which is shown in Figure 5.26.
Figure 5.26: Comparison map of Vulnerability and Malaria epidemic area.
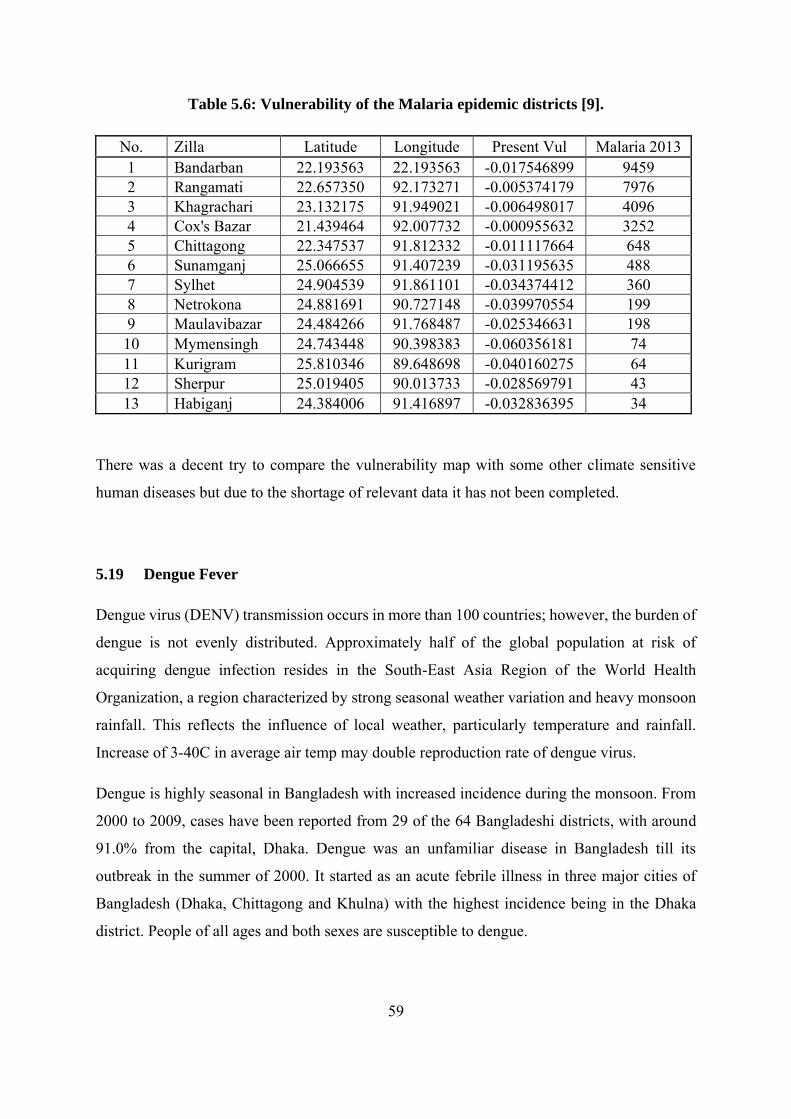
59
Table 5.6: Vulnerability of the Malaria epidemic districts [9].
No. Zilla Latitude Longitude Present Vul Malaria 2013 1 Bandarban 22.193563 22.193563 -0.017546899 9459 2 Rangamati 22.657350 92.173271 -0.005374179 7976 3 Khagrachari 23.132175 91.949021 -0.006498017 4096 4 Cox's Bazar 21.439464 92.007732 -0.000955632 3252 5 Chittagong 22.347537 91.812332 -0.011117664 648 6 Sunamganj 25.066655 91.407239 -0.031195635 488 7 Sylhet 24.904539 91.861101 -0.034374412 360 8 Netrokona 24.881691 90.727148 -0.039970554 199 9 Maulavibazar 24.484266 91.768487 -0.025346631 198 10 Mymensingh 24.743448 90.398383 -0.060356181 74 11 Kurigram 25.810346 89.648698 -0.040160275 64 12 Sherpur 25.019405 90.013733 -0.028569791 43 13 Habiganj 24.384006 91.416897 -0.032836395 34
There was a decent try to compare the vulnerability map with some other climate sensitive
human diseases but due to the shortage of relevant data it has not been completed.
5.19 Dengue Fever
Dengue virus (DENV) transmission occurs in more than 100 countries; however, the burden of
dengue is not evenly distributed. Approximately half of the global population at risk of
acquiring dengue infection resides in the South-East Asia Region of the World Health
Organization, a region characterized by strong seasonal weather variation and heavy monsoon
rainfall. This reflects the influence of local weather, particularly temperature and rainfall.
Increase of 3-40C in average air temp may double reproduction rate of dengue virus.
Dengue is highly seasonal in Bangladesh with increased incidence during the monsoon. From
2000 to 2009, cases have been reported from 29 of the 64 Bangladeshi districts, with around
91.0% from the capital, Dhaka. Dengue was an unfamiliar disease in Bangladesh till its
outbreak in the summer of 2000. It started as an acute febrile illness in three major cities of
Bangladesh (Dhaka, Chittagong and Khulna) with the highest incidence being in the Dhaka
district. People of all ages and both sexes are susceptible to dengue.
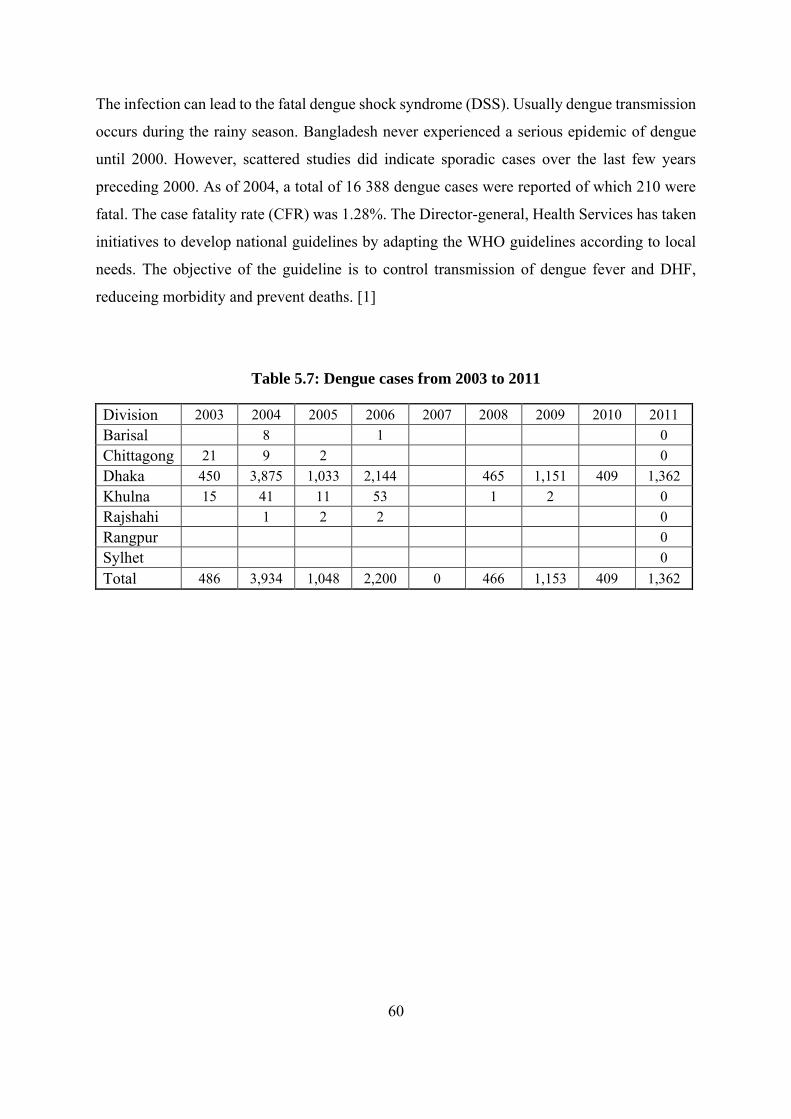
60
The infection can lead to the fatal dengue shock syndrome (DSS). Usually dengue transmission
occurs during the rainy season. Bangladesh never experienced a serious epidemic of dengue
until 2000. However, scattered studies did indicate sporadic cases over the last few years
preceding 2000. As of 2004, a total of 16 388 dengue cases were reported of which 210 were
fatal. The case fatality rate (CFR) was 1.28%. The Director-general, Health Services has taken
initiatives to develop national guidelines by adapting the WHO guidelines according to local
needs. The objective of the guideline is to control transmission of dengue fever and DHF,
reduceing morbidity and prevent deaths. [1]
Table 5.7: Dengue cases from 2003 to 2011
Division 2003 2004 2005 2006 2007 2008 2009 2010 2011 Barisal 8 1 0 Chittagong 21 9 2 0 Dhaka 450 3,875 1,033 2,144 465 1,151 409 1,362 Khulna 15 41 11 53 1 2 0 Rajshahi 1 2 2 0 Rangpur 0 Sylhet 0 Total 486 3,934 1,048 2,200 0 466 1,153 409 1,362
61
CHAPTER VI
CONCLUSION AND RECOMMENDATIONS
6.1 Conclusions
The detection of possible changes in extreme climate events, in terms of the temperature and
precipitation has importance on the district level of Bangladesh. Changes in Climate
Vulnerability would have profound impacts on human society, infrastructure, natural resources,
agriculture, eco-system and especially on human health. Therefore, extreme climate and
weather events are increasingly being recognized as the key aspects of climate change
assessment.
From this study it can be said that, all the districts are not equally vulnerable to human health.
Although the most vulnerable districts are scattered all through the country, extreme climatic
condition like temperature and precipitation has their enormous contribution on it.
Precipitation has a higher contribution in health vulnerability in the southern districts
of Bangladesh especially Cox's Bazar, Barguna, Chandpur, Shariatpur and Narail.
Whereas the district of central east and west part like Jhenaidah, Chuadanga, Meherpur,
Maulavibazar and Natore are vulnerable due to high temperature.
Analyzing the data of adaptive capacity, sensitivity and exposer it has been found that
mostly the southern districts are highly health vulnerable like Cox's Bazar, Barguna,
Narail, Feni and Rangamati.
Adaptive capacity is high in central and central west districts like Narayanganj, Bogra,
Sirajganj, Kushtia, Comilla and Joypurhat.
Rising sea surface temperatures will result in more frequent cholera outbreaks. Costal
districts where temperature remain high and result in sea surface temperature rise is
Cholera vulnerable.
62
Considering the high temperature existing districts it can be assumed that Naogaon,
Natore, Pabna, Joypurhat and Nawabganj are at risk of drought.
The most flood dominated health vulnerable districts of Bangladesh are Cox's Bazar,
Barguna, Chandpur, Shariatpur and Narail.
13 border districts Bandarban, Chittagong, Cox's Bazar, Habiganj, Khagrachari,
Kurigram, Maulavibazar, Mymensingh, Netrokona, Rangamati, Sherpur, Sunamganj
and Sylhet are in high endemic malaria zones. It has been found that the higher the
health vulnerability the higher the malaria cases found. It is clearly identified that the
most health vulnerable districts are highly malaria prone.
Dengue is highly seasonal in Bangladesh with increased incidence during the monsoon
and it started as an acute febrile illness in three major cities of Bangladesh (Dhaka,
Chittagong and Khulna) with the highest incidence being in the Dhaka district.
Climate sensitive diseases are mostly subjected to extreme temperature and precipitation.
Precaution plans taken by the authority should consider different measures based on different
climatic effects. Increase of Adaptive capacity of different locality focus on the vulnerability
of that particular area may play a vital role in minimizing forecasted vulnerability. Integrated
and participatory approach should be taken to address the climate sensitive diseases of that
particular area. This study perhaps reveals the present human health vulnerability along with
future forecast of the possible vulnerabilities.
The core objective is to deliver vulnerabilities assessments to act as a guidance for scientists
and policymakers to improve their understanding on where the vulnerabilities regarding
climate and non-climate drivers, mostly socio-economic aspects will be felt most. The health
sector development plans should get an exact idea according to specific climate sensitive health
vulnerable districts to go forward.
63
This findings of this study would be helpful to medical agencies that want better targeted
interventions and to provide critical information that would aid in the creation of effective
health policies and the establishment of relevant technology- and knowledge-based strategies
so that Bangladesh is better prepared for climatic emergencies in the future.
Reference:
[1] Rahman, A. (2008). Climate change and its impact on health in Bangladesh. In Regional
Health Forum, 12 (1), 2008.
[2] MOHFW (2011). National Health Policy 2011. Ministry of Health and Family Welfare
(MoHFW), Government of the People’s Republic of Bangladesh.
[3] Banu, S., Hu, W., Guo, Y., Hurst, C., & Tong, S. (2014). Projecting the impact of climate change on dengue transmission in Dhaka, Bangladesh. Environment
international, 63, 137-142.
[4] Wu, J., Yunus, M., Streatfield, P. K., &Emch, M. (2014). Association of climate variability and childhood diarrheal disease in rural Bangladesh, 2000–2006. Epidemiology and infection, 142(09), 1859-1868.
[5] De, A., De, A., &Pun, J. (2014). Impact of Global Climate Change on Human Health and Risk Prevention. Crossing the Border: International Journal of Interdisciplinary
Studies, 2(1), 127-134
[6] Sari Kovats, R., Menne, B., &Ebi, K. L. (2003). Methods of assessing human health vulnerability and public health adaptation to climate change.
[7] Portier, C. J., Tart, K. T., Carter, S. R., Dilworth, C. H., Grambsch, A. E., Gohlke, J., ... &Whung, P. Y. (2013). A human health perspective on climate change: a report outlining the research needs on the human health effects of climate change. Journal of
Current Issues in Globalization, 6(4), 621.
[8] Ramieri, E., Hartley, A., Barbanti, A., Santos, F. D., Gomes, A., Hilden, M., &Santini, M. (2011). Methods for assessing coastal vulnerability to climate change. European
Environment Agency, European topic centre on climate change impacts, vulnerability
and adaptation.
[9] S. Adhikary1, S. K. Bala2, A. K. M. S. Islam3, G. M. T Islam4, L. C. Sutradhar5, M. G. R.Fahad6, M. M. Rahman7, A. R. Tazkia8 An Assessment of Climate Change Vulnerability Index at District Level of Bangladesh In Context of Extreme Temperature and Precipitation
64
[10] Bazrkar, M. H., Zamani, N., Eslamian, S., Eslamian, A., & Dehghan, Z. (2015). Urbanization and Climate Change. In Handbook of Climate Change Adaptation (pp. 619-655). Springer Berlin Heidelberg.
[11] World Meteorological Organization (WMO), 2011. What is Climate? , Available
at.In: http://www.wmo.int/pages/prog/wcp/ccl/faqs.html (accessed 01.08.12).
[12] Pachauri, R. K., & Reisinger, A. (2007). IPCC fourth assessment report. IPCC, Geneva, 2007.
[13] IPCC, 2014: Climate Change 2014: Impacts, Adaptation, and Vulnerability. Summaries, Frequently Asked Questions, and Cross-Chapter Boxes. A Contribution of Working Group II to the Fifth Assessment Report of the Intergovernmental Panel on Climate Change [Field, C.B., V.R. Barros, D.J. Dokken, K.J. Mach, M.D. Mastrandrea, T.E. Bilir, M. Chatterjee, K.L. Ebi, Y.O. Estrada, R.C. Genova, B. Girma, E.S. Kissel, A.N. Levy, S. MacCracken,P.R. Mastrandrea, and L.L. White (eds.)]. World Meteorological Organization, Geneva, Switzerland, 190 pp. (in Arabic, Chinese, English, French, Russian, and Spanish.
[14] Jabareen, Y. (2013). Planning the resilient city: Concepts and strategies for coping with climate change and environmental risk. Cities, 31, 220-229.
[15] Ebi, K. L., Smith, J., Burton, I., & Hitz, S. (2005). Adaptation to climate variability and change from a public health perspective. Integration of public health with
adaptation to climate change: lessons learned and new directions.
[16] Kynast-Wolf, G., Preuß, M., Sié, A., Kouyaté, B., & Becher, H. Seasonal patterns of cardiovascular disease mortality of adults in Burkina Faso, West Africa.
[17] Bernier, G. E. O. R. G. E. S. (1988). The control of floral evocation and morphogenesis. Annual Review of Plant Physiology and Plant Molecular Biology, 39(1), 175-219.
[18] Gu, L., Post, W. M., Baldocchi, D., Black, T. A., Verma, S. B., Vesala, T., & Wofsy, S. C. (2003). Phenology of vegetation photosynthesis. In Phenology: An integrative
environmental science (pp. 467-485). Springer Netherlands.
[19] Smith, K. (2013). Environmental hazards: assessing risk and reducing disaster. Routledge.
[20] Parvin, G. A., Fujita, K., Matsuyama, A., Shaw, R., & Sakamoto, M. (2015). Climate change, flood, food security and human health: cross-cutting issues in Bangladesh. In Food Security and Risk Reduction in Bangladesh (pp. 235-254). Springer Japan.
[21] McMichael, A. J., Haines, A., Slooff, R., & Kovats, S. (1996). Climate change and human health. An assessment by a Task Group on behalf of the World Health
65
Organization the World Meteorological Organization and the United Nations Environment Programme.
[22] Khafaie, M. A., Yajnik, C. S., Salvi, S. S., & Ojha, A. CRITICAL REVIEW OF AIR POLLUTION HEALTH EFFECTS WITH SPECIAL CONCERN ON RESPIRATORY HEALTH. Journal of Air Pollution and Health (Spring 2016), 1(2), 123-136.
[23] Iftikhar, B., Bashirullah, N., Khan, S. A., Arif, A., & Ishtiaq, M. (2016). KNOWLEDGE AND PRACTICE OF GENERAL POPULATION REGARDING VECTOR BORNE DISEASES. Cell, 333(9209590), 9209590.
[24] Hollingsworth, T. D., Pulliam, J. R., Funk, S., Truscott, J. E., Isham, V., & Lloyd, A. L. (2015). Seven challenges for modelling indirect transmission: vector-borne diseases, macroparasites and neglected tropical diseases. Epidemics, 10, 16-20.
[25] Rascalou, G., Pontier, D., Menu, F., & Gourbière, S. (2012). Emergence and prevalence of human vector-borne diseases in sink vector populations. PLoS One, 7(5), e36858.
[26] Parham, P. E., & Michael, E. (2010). Modeling the Effects of Weather and Climate Change on Malaria Transmission. Environmental Health Perspectives, 118(5), 621.
[27] Colón-González, F. J., Fezzi, C., Lake, I. R., & Hunter, P. R. (2013). The Effects of Weather and Climate Change on Dengue. PLoS Negl Trop Dis, 7(11), e2503.
[28] Gharbi, M., Quenel, P., Gustave, J., Cassadou, S., La Ruche, G., Girdary, L., & Marrama, L. (2011). Time series analysis of dengue incidence in Guadeloupe, French West Indies: Forecasting models using climate variables as predictors.
[29] Alexander, K. A., Carzolio, M., Goodin, D., & Vance, E. (2013). Climate Change is Likely to Worsen the Public Health Threat of Diarrheal Disease in Botswana. Int. J.
Environ. Res. Public Health, 10, 1202-1230.
[30] Schuster-Wallace, C., Dickin, S., & Metcalfe, C. (2014). Waterborne and foodborne diseases, climate change impacts on health. In Global Environmental Change (pp. 615-622). Springer Netherlands.
[31] (STATISTICAL YEAR BOOK BANGLADESH 2015, 2015)
[32] Bai, L., Ding, G., Gu, S., Bi, P., Su, B., Qin, D., ... & Liu, Q. (2014). The effects of summer temperature and heat waves on heat-related illness in a coastal city of China, 2011–2013. Environmental research, 132, 212-219.
[33] Bank, W. (2000). Bangladesh: Climate Change & Sustainable Development. Dhaka, World Bank Office. South Asia Rural Development Team.
66
[34] Chen, M. J., Lin, C. Y., Wu, Y. T., Wu, P. C., Lung, S. C., & Su, H. J. (2012). Effects of extreme precipitation to the distribution of infectious diseases in Taiwan, 1994–2008. PLoS One, 7(6), e34651.
[35] Confalonieri, U., Menne, B., Akhtar, R., Ebi, K. L., Hauengue, M., Kovats, R. S., ... & Woodward, A. (2007). Human health. Climate change 2007: impacts, adaptation
and vulnerability: contribution of Working Group II to the fourth assessment report of
the Intergovernmental Panel on Climate Change.
[36] Rijsberman, F. (2017). How climate change affects malnutrition. Devex. Retrieved 17 June 2017, from https://www.devex.com/news/how-climate-change-affects-malnutrition-87328
[37] Bloetscher, F., Polsky, C., Bolter, K., Mitsova, D., Garces, K. P., King, R., ... & Hamilton, K. (2016). Assessing potential impacts of sea level rise on public health and vulnerable populations in southeast Florida and providing a framework to improve outcomes. Sustainability, 8(4), 315.
[38] Hossain, M. L., & Hossain, M. K. (2012). Climate Change, Sea Level Rise and Coastal Vulnerabilities of Bangladesh with Adaptation Options.
[39] Watkins, K. (2007). Human Development Report 2007/8. Fighting Climate Change: Human Solidarity in a Divided World.
[40] Gardali, T., Seavy, N. E., DiGaudio, R. T., & Comrack, L. A. (2012). A Climate Change Vulnerability Assessment of California’s At-Risk Birds. PLoS ONE, 7(3), e29507.
[41] Hugo, G., Bardsley, D., Sharma, V., Tan, Y., Williams, M., & Bedford, R. (2012). Addressing climate change and migration in Asia and the Pacific. Asian Development Bank.
67
APPENDICES
Appendix A
Observed data of the Indicators of Adaptive Capacity (2013)
Zilla Literacy Rate
Economic Activity
Handloom Unit Livestock Irrigated
Area Cropping Intensity
Water Source
Boro Area
Wheat Area
Bagerhat 74.72 57.1 564 4.78 7.1 182 50717 849 150 Bandarban 45.43 79.5 14538 4 21.99 121 1685 43311 489 Barguna 73.03 57.2 340 3.01 14.4 202 92838 2947 94 Barisal 77.59 56.2 4013 5.52 29.29 171 68686 17997 2076 Bhola 54.78 59.2 30 5.88 23.31 208 76915 7776 5856 Bogra 62.56 60.7 4982 3.77 88.95 217 54106 104883 2841 Brahmanbaria 57.38 50.8 8662 8.3 72.02 135 22671 18748 5621 Chandpur 71.94 47.3 319 8.76 61.29 167 50552 12034 2179 Chittagong 74.64 56.2 538 12.8 37.23 163 73884 16706 618 Chuadanga 58.17 60.4 1086 4.14 85.75 166 10525 23391 13133 Comilla 67.55 57 11339 8.13 76.54 177 73532 61123 5553 Cox's Bazar 49.78 53.1 994 8.83 74.31 151 10637 7330 283 Dhaka 89.37 55.2 6339 46.3 49.02 138 7273 17645 4158 Dinajpur 66.41 64.4 1053 2.39 87.08 197 43991 87412 29547 Faridpur 62.03 51.6 1459 5.76 53.29 173 26032 4345 44529 Feni 75.55 53.3 250 10.08 51.72 161 45463 5617 704 Gaibandha 54.24 61.5 77 3.35 83.14 189 22631 101003 5401 Gazipur 79.31 57.3 816 8.93 51.45 130 12195 23828 1231 Gopalganj 73.6 53.8 663 4.92 64.46 127 16677 48055 7958 Habiganj 51.35 61.8 291 5.22 72.41 142 35040 75516 3962 Jamalpur 48.7 67.1 170 4.3 82.78 190 21875 46814 6804 Jessore 71.61 63.1 2854 3.84 78.89 182 53942 75585 7255 Jhalokati 84.48 52.1 419 5.37 8.79 169 23575 2007 100 Jhenaidah 61.32 62.4 2853 3.33 94.35 187 28009 23983 13656 Joypurhat 72.82 65.7 1019 2.79 93.2 229 13543 89186 1384 Khagrachari 58.42 68.1 16072 4.46 16.84 152 15478 6218 142 Khulna 76.19 54.1 1878 6.19 33.93 127 40518 41898 964 Kishoreganj 51.78 62.7 1002 5.92 84.56 136 31022 53611 3505 Kurigram 53.87 65.6 719 3.71 67.82 197 14912 52437 19095 Kushtia 58.7 61.4 12433 5 75.18 200 17986 7140 28390 Laksmipur 62.59 51 661 9.58 25.36 201 43162 10757 1275 Lalmonirhat 58.39 67.6 262 3.37 75.61 192 9286 36457 5461 Madaripur 60.78 57.2 1748 6.08 45.42 156 16907 5680 11719 Magura 64.16 58.1 442 3.33 76.13 209 13901 31275 20122 Manikganj 62.33 53.5 1761 4.89 50.9 171 9311 5428 1886 Maulavibazar 64.74 53 3137 5.81 28.89 136 4673 5509 430
68
Zilla Literacy Rate
Economic Activity
Handloom Unit Livestock Irrigated
Area Cropping Intensity
Water Source
Boro Area
Wheat Area
Meherpur 58.62 59.6 778 4.61 90.19 165 17950 12186 24360 Munshiganj 58.39 53.9 1909 11.71 65.41 146 10425 5691 826 Mymensingh 55.1 64.7 620 4.94 79.25 183 141650 96490 5368 Naogaon 61.09 67.7 1064 2.74 79.13 179 43731 60476 16485 Narail 77.63 60.8 621 3.69 52.56 171 6965 42386 5746 Narayanganj 72.34 60.9 17231 31.33 57.47 187 10968 6281 1189 Narsingdi 62.84 62 20511 8.77 70.62 155 10487 10088 1285 Natore 62.83 57.3 254 5.16 70.18 160 16791 49540 40670 Nawabganj 54.4 60.8 1690 5.6 52.59 166 8045 5528 17405 Netrokona 49.97 63.7 79 4.32 82.92 151 49873 39253 2714 Nilphamari 56.21 65.3 270 3.85 72.64 202 26560 45393 9311 Noakhali 64.98 50.4 848 8.26 32.84 164 70668 70474 649 Pabna 58.49 52.8 9745 5.76 61.15 174 34555 14275 52117 Panchagarh 65.59 71.8 72 2.68 48.43 188 12029 22592 25613 Patuakhali 68.5 59.2 754 3.17 22.89 178 108146 1301 238 Pirojpur 82.16 49.5 126 5.04 10.19 143 40380 8660 222 Rajbari 66.24 61.5 1634 5.34 54.83 187 15113 1562 31869 Rajshahi 67.12 60.8 887 51.48 74.36 191 41123 36590 33042 Rangamati 63 64.8 17291 4.85 17.5 160 1180 14396 210 Rangpur 61.51 63.7 97 3.52 86.42 207 25810 129624 7552 Satkhira 65.97 59 3889 4.4 61.78 151 48187 30039 4860 Shariatpur 59.8 57.2 569 6.76 32.34 155 13681 2169 9859 Sherpur 48.03 67.2 393 4.07 87.37 194 30768 65366 2370 Sirajganj 53.27 61 13512 5.1 79.86 180 17820 64050 7386 Sunamganj 44.32 62.2 168 4.77 61.88 108 17036 48232 1422 Sylhet 64.84 58.6 412 6.85 29.54 128 47217 19003 878 Tangail 59.28 63.9 10960 4.71 70.29 183 40004 9295 8386 Thakurgaon 61.71 68.9 254 2.12 90.04 200 11861 17817 73776
69
Zilla
Jute Area
Oil Seed Area
Sugar-cane Area
Potato Area
Local Market Facility
Electricity Connection
Power Operating Machinery
Power Source (Gas)
Installment Loan Holdings
Permanent Housing Structure
Bagerhat 167 4031 185 2133
1012 43.2 548 4 23023 2 Bandarban
1486
1742 1983
1451
3511 61.2 1243 8 59748 5.1 Barguna 63 4018 314 336
3 1839 42.3 206 11 48728 3.6
Barisal 7861
3902 2136
1865
3784 80.25 1727 12 47530 7.3 Bhola 531 1859
4 421 577
4 1654 38.85 1088 6 73206 1.7
Bogra 29596
40937
1151
99943
15363
78.9 4617 21 87133 5.7 Brahmanbaria
7755
13718
278 4056
6550 100 1291 43 42149 8.2 Chandpur
5493
4395 855 18955
4045 83.4 1584 42 51532 7.3 Chittagong
401 2689 576 10512
13359
100 5720 172 190304 25 Chuadanga
30786
8976 5804
3155
2799 90.9 918 3 54603 22.1 Comilla 380
0 9533 517 265
99 7240 100 2964 61 61689 9.9
Cox's Bazar
277 464 255 3625
1757 48.15 732 7 116114 6.2 Dhaka 135
14 2680
9 971 690
0 3038
7 100 8923 799 96305 45.6
Dinajpur 13159
7833 3984
53573
7179 59.1 2908 21 88348 5.5 Faridpur 990
71 2561
0 651
2 104
4 4425 73.05 2266 9 80168 4.8
Feni 348 1312 245 874 3145 100 933 29 168441 16.6 Gaibandha
25466
23920
4373
22602
6006 44.1 2348 13 105235 2 Gazipur 559
9 4020 367
0 123
1 5526 100 1762 150 79681 11.6
Gopalganj
22724
11279
1305
704 2293 73.65 1137 2 125576 4 Habiganj 153
4 3170 560 636
8 3571 71.55 1170 56 68875 5.4
Jamalpur 54776
58708
8937
7270
4912 59.1 1935 15 110953 2 Jessore 344
04 2289
1 120
6 424
7 1312
0 91.65 2642 34 129289 16.4
Jhalokati 229 729 280 710 912 73.5 486 3 66141 6.7 Jhenaidah
34605
20253
6101
2198
6583 87.9 1710 14 42727 14.9 Joypurhat
5144
5532 2926
68799
2880 77.4 897 8 143539 6 Khagrachari
30 349 541 2159
967 49.05 741 4 35745 2.2 Khulna 366
3 4967 134
8 298
4 8003 96.15 1844 23 133925 18.3
Kishoreganj
14023
14948
395 7496
4818 74.4 2160 147 76497 2.8 Kurigram 426
96 2644
6 186
6 635
3 3613 31.2 2026 5 45415 0.9
Kushtia 54526
11918
12828
5648
15535
96.15 1680 6 102170 7.8 Laksmipur
629 37655
211 1037
2222 65.7 860 3 203185 7.6 Lalmonirhat
15298
8201 641 9632
1604 30.15 922 5 87034 1.6 Madaripur
39210
19851
1831
675 1762 88.95 822 9 127522 4.7 Magura 493
00 2008
1 954 139 5747 61.2 1290 16 117751 5.4
Manikganj
11702
82196
2173
5096
3669 79.05 1197 8 179973 3 Maulavibazar
383 338 155 4739
5777 76.2 1506 23 100898 12.1 Meherpur
30041
10965
2114
3239
1786 91.8 542 3 54962 20 Munshiganj
10261
8339 774 51152
5844 100 815 0 143981 7.9 Mymensingh
13882
10750
6228
6714
13133
61.95 4415 49 108637 3.6 Naogaon 946
1 4000
6 303
7 44078
12006
59.1 3598 7 87471 5.3
70
Zilla
Jute Area
Oil Seed Area
Sugar-cane Area
Potato Area
Local Market Facility
Electricity Connection
Power Operating Machinery
Power Source (Gas)
Installment Loan Holdings
Permanent Housing Structure
Narail 22525
7096 1123
201 2718 68.55 909 2 114889 6.4 Narayanganj
2974
6965 335 5933
11062
100 6697 299 109335 20.7 Narsingdi
9647
10276
399 4125
8856 109.2 1801 52 42087 7.2 Natore 199
59 2310
8 45904
2388
3795 73.2 1272 22 32953 5.2 Nawabganj
2295
7659 11166
1276
4381 72.9 1408 1 70637 13.1 Netrokona
8363
7608 175 3161
5300 45.3 2289 42 25173 1.5 Nilphamari
23151
2034 1001
33694
3404 51.75 1267 3 72715 2.5 Noakhali 704 3938
8 261 168
7 4276 76.65 1438 65 124059 7.6
Pabna 52543
57976
8261
1515
11745
90.15 2265 15 83378 7.1 Panchagarh
24087
26800
5236
10609
1148 40.5 647 3 32222 10.6 Patuakhali
690 13234
231 2618
1592 47.7 962 1 97707 2.6 Pirojpur 104
3 525 112
3 233
9 2435 64.35 886 3 67805 4
Rajbari 52249
16412
4974
361 2333 68.7 828 3 61676 3.3 Rajshahi 189
93 3736
1 22709
44444
5798 93.15 1896 23 14743 12.8 Rangamati
119 2456 829 2720
3330 62.7 365 8 43024 4.8 Rangpur 238
58 6415 600
2 77224
4436 57.15 1985 12 16150 3.6 Satkhira 167
66 1106
5 140
6 935
4 1205
8 62.7 1657 20 38940 14.3
Shariatpur
30457
14025
1091
1904
1971 64.8 882 6 20872 2.8 Sherpur 767
9 1144
7 341 479
7 3155 61.8 1012 6 103139 7.4
Sirajganj 27847
192193
5645
5268
18577
70.65 1768 31 46662 2.3 Sunamganj
1355
3341 192 2229
3155 61.8 1012 6 103139 7.4 Sylhet 825 1862 66 331
2 4803 94.35 1848 106 55480 21.7
Tangail 32196
119695
3745
6918
13536
84.3 2439 35 76540 2.8 Thakurgaon
16515
8116 5494
28253
3116 52.05 1516 2 38512 2.8
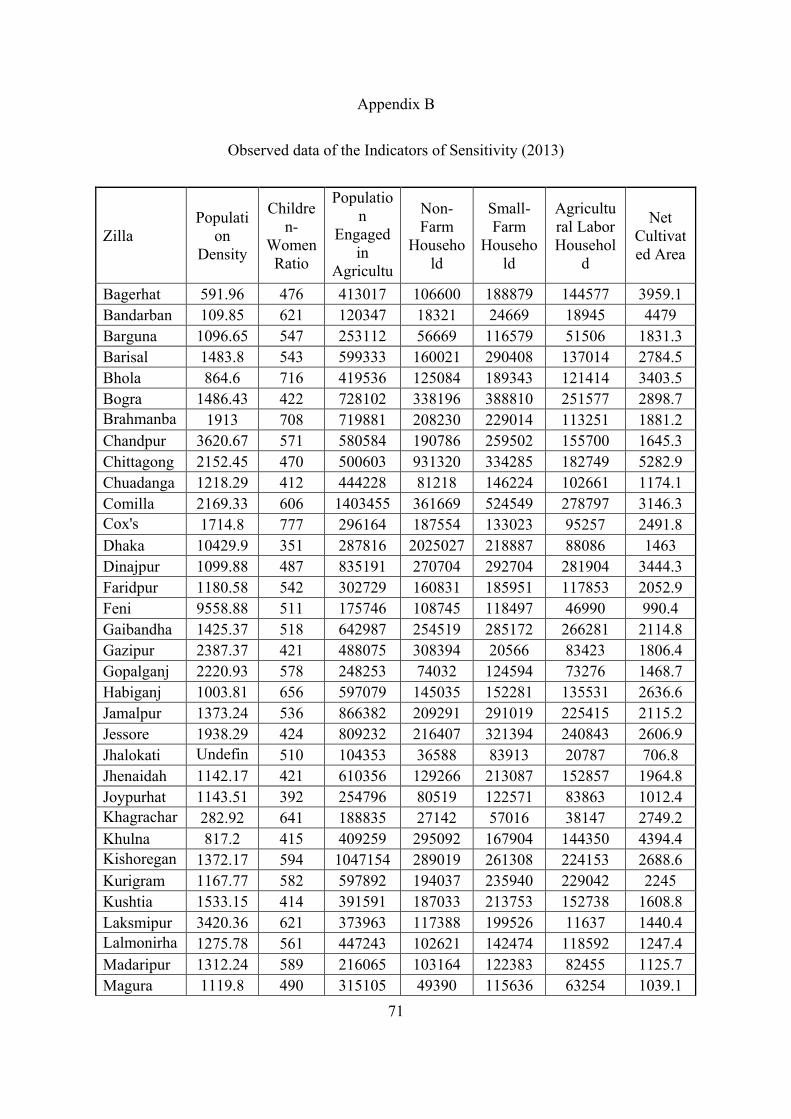
71
Appendix B
Observed data of the Indicators of Sensitivity (2013)
Zilla Populati
on Density
Children-
Women Ratio
Population
Engaged in
Agriculture
Non-Farm
Household
Small-Farm
Household
Agricultural Labor Househol
d
Net Cultivated Area
Bagerhat 591.96 476 413017 106600 188879 144577 3959.1 Bandarban 109.85 621 120347 18321 24669 18945 4479 Barguna 1096.65 547 253112 56669 116579 51506 1831.3 Barisal 1483.8 543 599333 160021 290408 137014 2784.5 Bhola 864.6 716 419536 125084 189343 121414 3403.5 Bogra 1486.43 422 728102 338196 388810 251577 2898.7 Brahmanbaria
1913 708 719881 208230 229014 113251 1881.2 Chandpur 3620.67 571 580584 190786 259502 155700 1645.3 Chittagong 2152.45 470 500603 931320 334285 182749 5282.9 Chuadanga 1218.29 412 444228 81218 146224 102661 1174.1 Comilla 2169.33 606 1403455 361669 524549 278797 3146.3 Cox's Bazar
1714.8 777 296164 187554 133023 95257 2491.8 Dhaka 10429.9 351 287816 2025027 218887 88086 1463 Dinajpur 1099.88 487 835191 270704 292704 281904 3444.3 Faridpur 1180.58 542 302729 160831 185951 117853 2052.9 Feni 9558.88 511 175746 108745 118497 46990 990.4 Gaibandha 1425.37 518 642987 254519 285172 266281 2114.8 Gazipur 2387.37 421 488075 308394 20566 83423 1806.4 Gopalganj 2220.93 578 248253 74032 124594 73276 1468.7 Habiganj 1003.81 656 597079 145035 152281 135531 2636.6 Jamalpur 1373.24 536 866382 209291 291019 225415 2115.2 Jessore 1938.29 424 809232 216407 321394 240843 2606.9 Jhalokati Undefin
ed 510 104353 36588 83913 20787 706.8
Jhenaidah 1142.17 421 610356 129266 213087 152857 1964.8 Joypurhat 1143.51 392 254796 80519 122571 83863 1012.4 Khagrachari
282.92 641 188835 27142 57016 38147 2749.2 Khulna 817.2 415 409259 295092 167904 144350 4394.4 Kishoreganj
1372.17 594 1047154 289019 261308 224153 2688.6 Kurigram 1167.77 582 597892 194037 235940 229042 2245 Kushtia 1533.15 414 391591 187033 213753 152738 1608.8 Laksmipur 3420.36 621 373963 117388 199526 11637 1440.4 Lalmonirhat
1275.78 561 447243 102621 142474 118592 1247.4 Madaripur 1312.24 589 216065 103164 122383 82455 1125.7 Magura 1119.8 490 315105 49390 115636 63254 1039.1
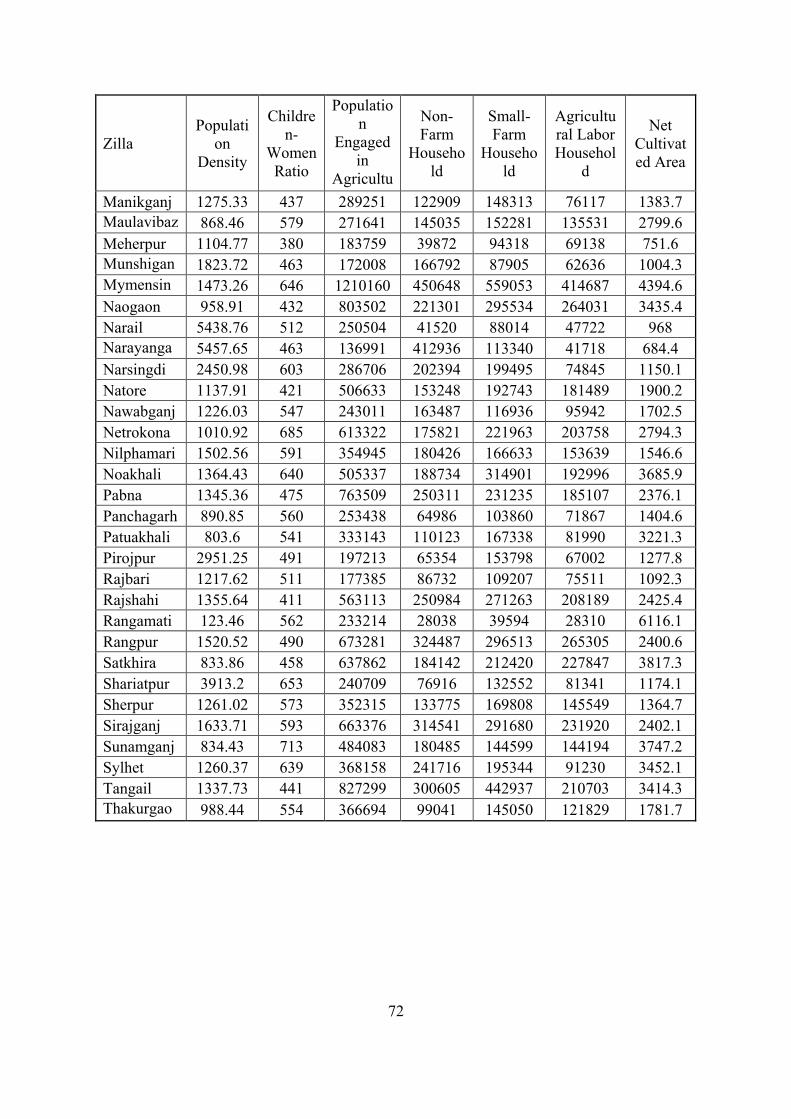
72
Zilla Populati
on Density
Children-
Women Ratio
Population
Engaged in
Agriculture
Non-Farm
Household
Small-Farm
Household
Agricultural Labor Househol
d
Net Cultivated Area
Manikganj 1275.33 437 289251 122909 148313 76117 1383.7 Maulavibazar
868.46 579 271641 145035 152281 135531 2799.6 Meherpur 1104.77 380 183759 39872 94318 69138 751.6 Munshiganj
1823.72 463 172008 166792 87905 62636 1004.3 Mymensingh
1473.26 646 1210160 450648 559053 414687 4394.6 Naogaon 958.91 432 803502 221301 295534 264031 3435.4 Narail 5438.76 512 250504 41520 88014 47722 968 Narayanganj
5457.65 463 136991 412936 113340 41718 684.4 Narsingdi 2450.98 603 286706 202394 199495 74845 1150.1 Natore 1137.91 421 506633 153248 192743 181489 1900.2 Nawabganj 1226.03 547 243011 163487 116936 95942 1702.5 Netrokona 1010.92 685 613322 175821 221963 203758 2794.3 Nilphamari 1502.56 591 354945 180426 166633 153639 1546.6 Noakhali 1364.43 640 505337 188734 314901 192996 3685.9 Pabna 1345.36 475 763509 250311 231235 185107 2376.1 Panchagarh 890.85 560 253438 64986 103860 71867 1404.6 Patuakhali 803.6 541 333143 110123 167338 81990 3221.3 Pirojpur 2951.25 491 197213 65354 153798 67002 1277.8 Rajbari 1217.62 511 177385 86732 109207 75511 1092.3 Rajshahi 1355.64 411 563113 250984 271263 208189 2425.4 Rangamati 123.46 562 233214 28038 39594 28310 6116.1 Rangpur 1520.52 490 673281 324487 296513 265305 2400.6 Satkhira 833.86 458 637862 184142 212420 227847 3817.3 Shariatpur 3913.2 653 240709 76916 132552 81341 1174.1 Sherpur 1261.02 573 352315 133775 169808 145549 1364.7 Sirajganj 1633.71 593 663376 314541 291680 231920 2402.1 Sunamganj 834.43 713 484083 180485 144599 144194 3747.2 Sylhet 1260.37 639 368158 241716 195344 91230 3452.1 Tangail 1337.73 441 827299 300605 442937 210703 3414.3 Thakurgaon
988.44 554 366694 99041 145050 121829 1781.7
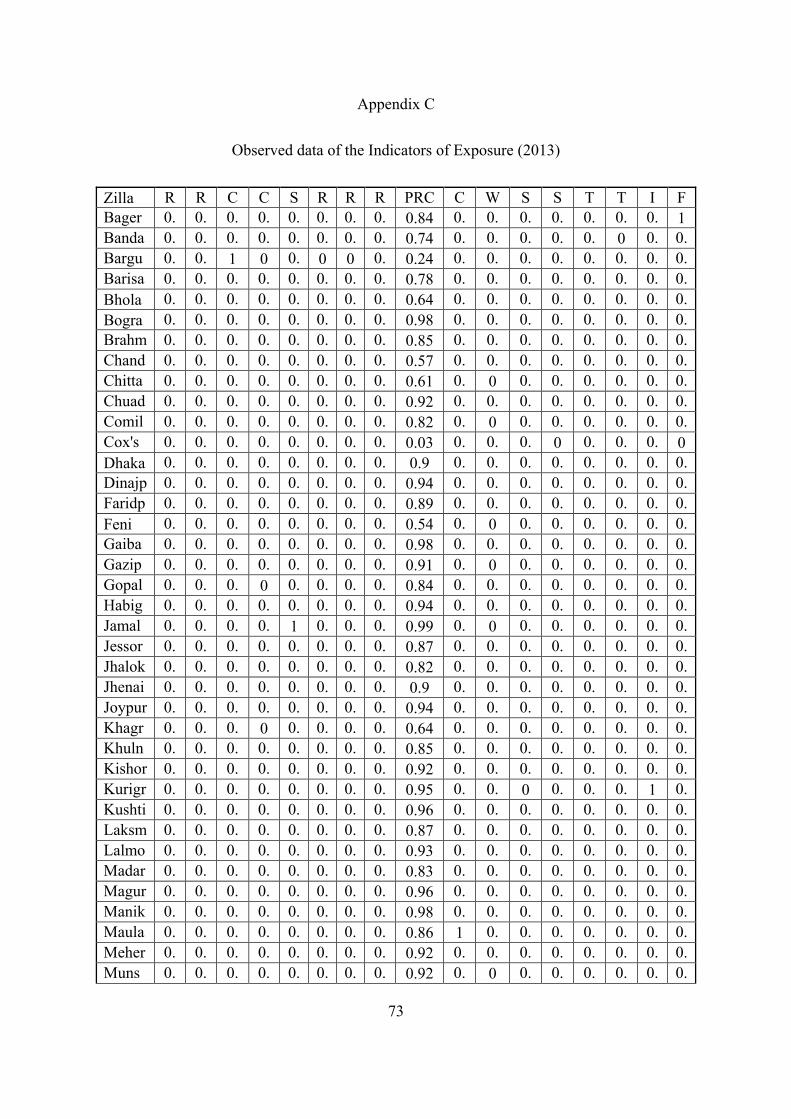
73
Appendix C
Observed data of the Indicators of Exposure (2013)
Zilla R95p
R99p
CWD
CDD
SDII
R10
R20
R100
PRCPTO
T
CSDI
WSDI
SU25
SU35
TR20
TR25
ID20
FD5
Bagerhat
0.88
0.14
0.46
0.1
0.93
0.61
0.8
0.05
0.84 0.17
0.01
0.6
0.39
0.13
0.33
0.39
1 Bandarban
0.83
0.13
0.62
0.07
0.85
0.35
0.56
0.08
0.74 0.43
0.01
0.52
0.25
0.02
0 0.47
0.43
Barguna
0.49
0.35
1 0 0.38
0 0 0.64
0.24 0.64
0.02
0.48
0.12
0.55
0.6
0.51
0.17
Barisal
0.84
0.16
0.46
0.02
0.87
0.48
0.67
0.08
0.78 0.36
0.01
0.59
0.33
0.38
0.44
0.4
0.43
Bhola 0.69
0.27
0.66
0.01
0.76
0.42
0.54
0.22
0.64 0.75
0.01
0.58
0.24
0.29
0.24
0.42
0.33
Bogra 0.98
0.02
0.13
0.34
0.99
0.94
0.97
0.03
0.98 0.49
0.01
0.45
0.43
0.19
0.21
0.54
0.49
Brahmanbaria
0.9
0.11
0.38
0.36
0.93
0.61
0.77
0.06
0.85 0.77
0.01
0.6
0.5
0.28
0.27
0.4
0.58
Chandpur
0.64
0.26
0.71
0.25
0.65
0.38
0.43
0.33
0.57 0.53
0.01
0.49
0.09
0.5
0.58
0.5
0.09
Chittagong
0.7
0.21
0.73
0.1
0.73
0.33
0.44
0.25
0.61 0.51
0 0.68
0.26
0.36
0.35
0.31
0.25
Chuadanga
0.96
0.05
0.3
0.2
0.98
0.72
0.88
0.01
0.92 0.69
0.01
0.67
0.58
0.26
0.34
0.32
0.52
Comilla
0.86
0.14
0.43
0.14
0.91
0.52
0.75
0.07
0.82 0.54
0 0.59
0.36
0.34
0.38
0.41
0.51
Cox's Bazar
0.23
0.51
0.97
0.02
0.19
0.08
0.05
0.94
0.03 0.45
0.01
0.58
0 0.55
0.57
0.41
0 Dhaka 0.
93 0.08
0.33
0.29
0.96
0.73
0.86
0.03
0.9 0.61
0.01
0.65
0.45
0.33
0.4
0.35
0.41
Dinajpur
0.94
0.06
0.19
0.27
0.95
0.85
0.92
0.05
0.94 0.82
0.02
0.24
0.53
0.05
0.21
0.75
0.69
Faridpur
0.92
0.1
0.38
0.1
0.96
0.68
0.86
0.03
0.89 0.32
0.01
0.67
0.48
0.13
0.29
0.33
0.97
Feni 0.64
0.28
0.67
0.1
0.65
0.31
0.37
0.29
0.54 0.67
0 0.65
0.22
0.41
0.44
0.35
0.35
Gaibandha
0.97
0.02
0.1
0.27
0.97
0.95
0.97
0.04
0.98 0.52
0.01
0.17
0.29
0.13
0.08
0.83
0.52
Gazipur
0.94
0.08
0.28
0.17
0.96
0.76
0.86
0.03
0.91 0.45
0 0.63
0.49
0.25
0.3
0.37
0.49
Gopalganj
0.9
0.11
0.54
0 0.95
0.53
0.77
0.04
0.84 0.35
0.01
0.67
0.45
0.12
0.29
0.33
0.96
Habiganj
0.94
0.07
0.34
0.25
0.97
0.85
0.92
0.04
0.94 0.76
0.01
0.52
0.36
0.28
0.19
0.48
0.55
Jamalpur
0.98
0.03
0.13
0.34
1 0.96
0.99
0.01
0.99 0.55
0 0.44
0.34
0.22
0.18
0.55
0.47
Jessore
0.92
0.08
0.45
0.27
0.96
0.61
0.8
0.03
0.87 0.58
0.01
0.66
0.49
0.29
0.33
0.34
0.52
Jhalokati
0.87
0.15
0.49
0.15
0.91
0.55
0.74
0.06
0.82 0.54
0.01
0.63
0.35
0.37
0.44
0.37
0.42
Jhenaidah
0.95
0.06
0.4
0.1
0.97
0.68
0.86
0.02
0.9 0.52
0.01
0.69
0.57
0.28
0.33
0.3
0.51
Joypurhat
0.96
0.05
0.24
0.24
0.96
0.82
0.9
0.03
0.94 0.73
0.02
0.43
0.6
0.13
0.25
0.56
0.62
Khagrachari
0.69
0.27
0.66
0 0.76
0.42
0.54
0.22
0.64 0.75
0.01
0.58
0.24
0.29
0.24
0.42
0.33
Khulna
0.89
0.13
0.45
0.07
0.94
0.59
0.8
0.05
0.85 0.69
0.01
0.62
0.45
0.33
0.39
0.38
0.52
Kishoreganj
0.94
0.09
0.31
0.28
0.97
0.79
0.89
0.02
0.92 0.73
0.01
0.6
0.43
0.27
0.26
0.39
0.54
Kurigram
0.93
0.08
0.15
0.27
0.94
0.93
0.95
0.05
0.95 0.85
0.01
0 0.24
0.06
0.05
1 0.69
Kushtia
0.98
0.03
0.23
0.28
0.99
0.86
0.95
0.02
0.96 0.49
0.01
0.63
0.51
0.29
0.36
0.36
0.44
Laksmipur
0.89
0.11
0.3
0.18
0.92
0.74
0.83
0.07
0.87 0.63
0.01
0.57
0.25
0.42
0.52
0.42
0.36
Lalmonirhat
0.91
0.08
0.17
0.08
0.9
0.89
0.92
0.09
0.93 0.95
0.01
0.17
0.44
0.01
0.12
0.82
0.76
Madaripur
0.85
0.16
0.39
0.14
0.9
0.63
0.76
0.07
0.83 0.5
0.01
0.63
0.34
0.39
0.48
0.36
0.36
Magura
0.98
0.03
0.23
0.28
0.99
0.86
0.95
0.02
0.96 0.49
0.01
0.63
0.51
0.29
0.36
0.36
0.44
Manikganj
0.97
0.04
0.15
0.2
0.99
0.92
0.97
0.02
0.98 0.7
0.01
0.58
0.33
0.37
0.43
0.41
0.3 Maula
vibazar
0.89
0.1
0.66
0.26
0.94
0.69
0.81
0.06
0.86 1 0.01
0.56
0.5
0.17
0.09
0.43
0.59
Meherpur
0.96
0.05
0.3
0.18
0.98
0.72
0.88
0.01
0.92 0.69
0.01
0.67
0.58
0.26
0.34
0.32
0.52
Munshiganj
0.94
0.08
0.28
0.18
0.97
0.79
0.89
0.04
0.92 0.75
0 0.6
0.37
0.34
0.39
0.39
0.44
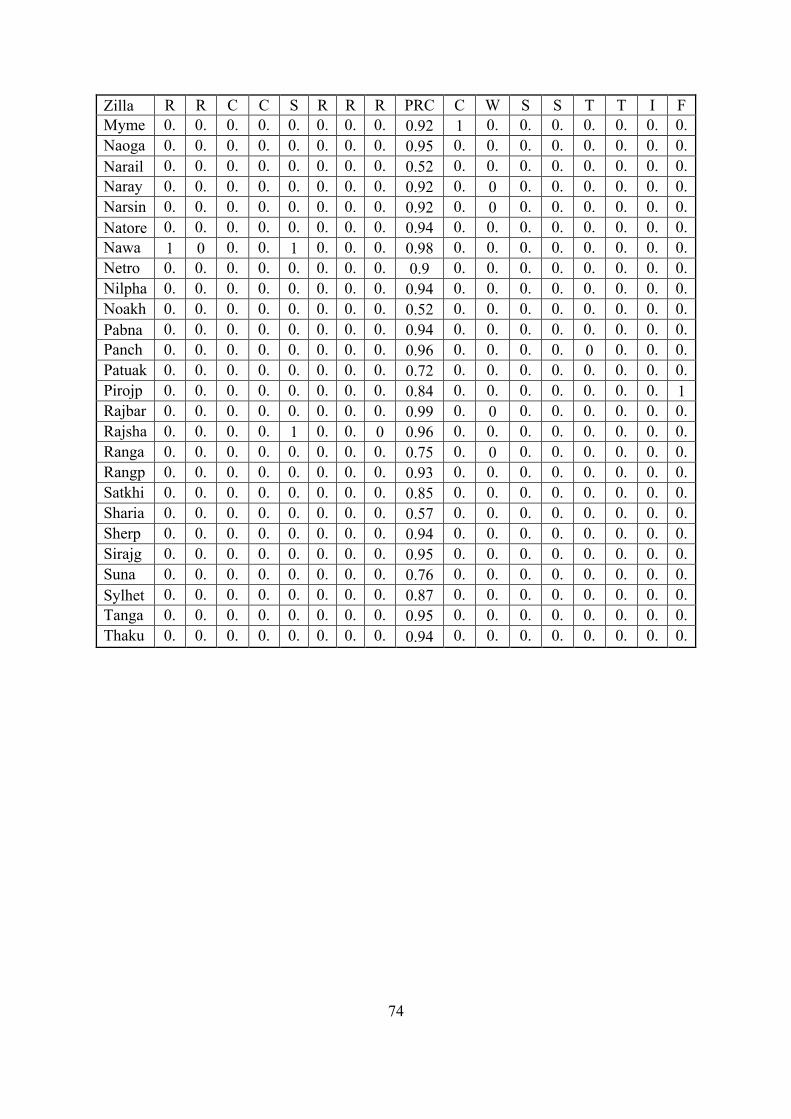
74
Zilla R95p
R99p
CWD
CDD
SDII
R10
R20
R100
PRCPTO
T
CSDI
WSDI
SU25
SU35
TR20
TR25
ID20
FD5
Mymensingh
0.94
0.09
0.49
0.35
0.97
0.79
0.87
0.03
0.92 1 0.01
0.6
0.51
0.19
0.29
0.39
0.57
Naogaon
0.98
0.01
0.22
0.24
0.98
0.82
0.93
0.01
0.95 0.62
0.02
0.47
0.62
0.15
0.3
0.53
0.58
Narail 0.64
0.28
0.7
0.11
0.62
0.21
0.33
0.32
0.52 0.5
0.02
0.48
0.22
0.52
0.54
0.51
0.31
Narayanganj
0.94
0.08
0.28
0.18
0.97
0.79
0.89
0.04
0.92 0.75
0 0.6
0.37
0.34
0.39
0.39
0.44
Narsingdi
0.94
0.08
0.28
0.18
0.97
0.79
0.89
0.04
0.92 0.75
0 0.6
0.37
0.34
0.39
0.39
0.44
Natore 0.98
0.01
0.2
0.28
0.98
0.78
0.9
0.01
0.94 0.41
0.02
0.6
0.61
0.19
0.32
0.4
0.57
Nawabganj
1 0 0.09
0.17
1 0.89
0.96
0.01
0.98 0.43
0.02
0.56
0.59
0.19
0.31
0.43
0.52
Netrokona
0.91
0.12
0.13
0.34
0.96
0.76
0.87
0.04
0.9 0.62
0.01
0.61
0.5
0.2
0.29
0.39
0.59
Nilphamari
0.94
0.06
0.19
0.17
0.95
0.85
0.92
0.05
0.94 0.6
0.02
0.24
0.53
0.05
0.21
0.75
0.69
Noakhali
0.65
0.24
0.75
0.15
0.63
0.26
0.33
0.31
0.52 0.73
0.01
0.57
0.12
0.46
0.55
0.42
0.34
Pabna 0.98
0.01
0.2
0.28
0.98
0.78
0.9
0.01
0.94 0.41
0.02
0.6
0.61
0.19
0.32
0.4
0.57
Panchagarh
0.94
0.05
0.03
0.08
0.91
0.93
0.95
0.05
0.96 0.77
0.02
0.3
0.53
0 0.19
0.69
0.81
Patuakhali
0.76
0.21
0.48
0.12
0.77
0.48
0.63
0.17
0.72 0.51
0.01
0.52
0.29
0.49
0.51
0.47
0.38
Pirojpur
0.88
0.14
0.46
0.01
0.93
0.61
0.8
0.05
0.84 0.17
0.01
0.6
0.39
0.13
0.33
0.39
1 Rajbari
0.98
0.04
0.07
0.3
0.99
0.95
0.98
0.04
0.99 0.61
0 0.54
0.32
0.3
0.27
0.45
0.37
Rajshahi
0.99
0.02
0.21
0.13
1 0.84
0.93
0 0.96 0.54
0.01
0.64
0.57
0.24
0.34
0.36
0.53
Rangamati
0.84
0.16
0.77
0.13
0.9
0.31
0.65
0.06
0.75 0.78
0 0.56
0.29
0.1
0.01
0.42
0.3 Rangp
ur 0.94
0.07
0.2
0.36
0.94
0.84
0.9
0.04
0.93 0.67
0.02
0.31
0.53
0.06
0.19
0.68
0.68
Satkhira
0.89
0.13
0.45
0.05
0.94
0.59
0.8
0.05
0.85 0.69
0.01
0.62
0.45
0.33
0.39
0.38
0.52
Shariatpur
0.64
0.26
0.71
0.25
0.65
0.38
0.43
0.33
0.57 0.53
0.01
0.49
0.09
0.5
0.58
0.5
0.09
Sherpur
0.94
0.06
0.24
0.28
0.96
0.85
0.92
0.05
0.94 0.69
0.01
0.42
0.52
0.14
0.17
0.57
0.65
Sirajganj
0.97
0.03
0.22
0.27
0.98
0.83
0.92
0.02
0.95 0.41
0.01
0.51
0.58
0.15
0.29
0.49
0.59
Sunamganj
0.79
0.23
0.89
0.3
0.9
0.5
0.7
0.1
0.76 0.56
0.01
0.39
0.43
0.1
0.06
0.6
0.43
Sylhet 0.88
0.1
0.61
0.29
0.93
0.71
0.81
0.07
0.87 0.98
0.01
0.52
0.44
0.2
0.18
0.47
0.65
Tangail
0.97
0.05
0.21
0.04
0.98
0.83
0.91
0.03
0.95 0.41
0.02
0.58
0.54
0.22
0.31
0.42
0.52
Thakurgaon
0.94
0.06
0.19
0.18
0.95
0.85
0.92
0.05
0.94 0.6
0.02
0.24
0.53
0.05
0.21
0.75
0.69
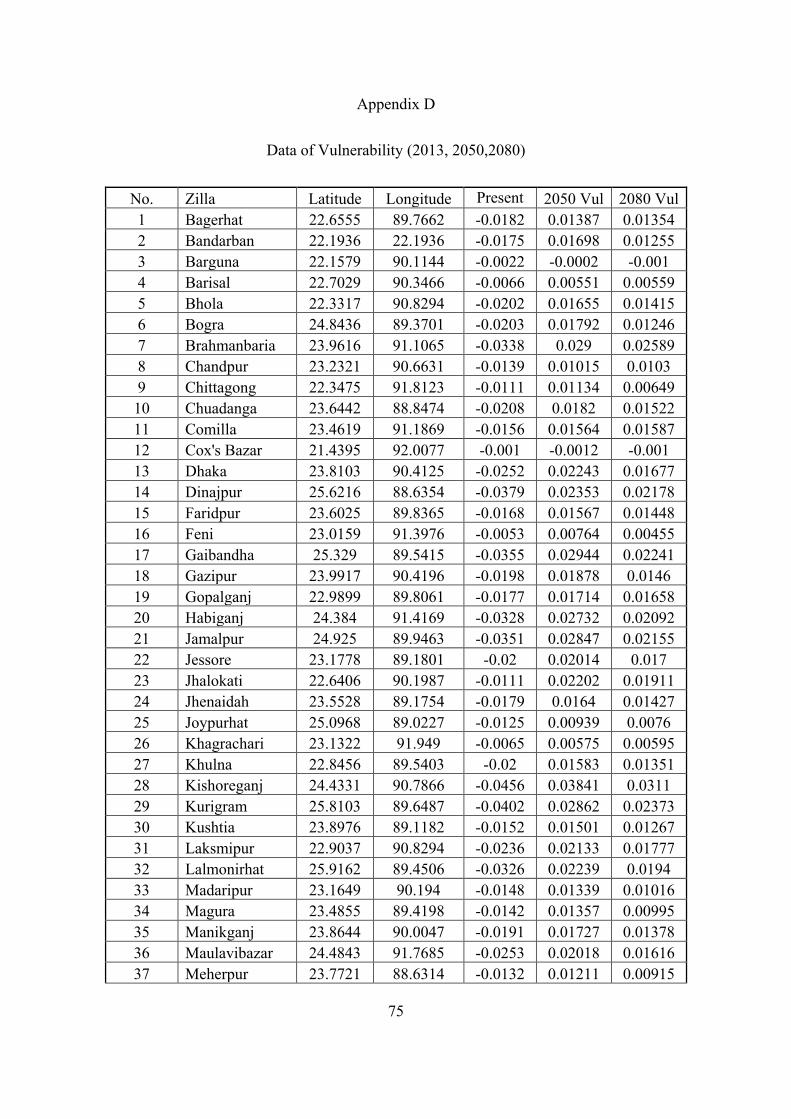
75
Appendix D
Data of Vulnerability (2013, 2050,2080)
No. Zilla Latitude Longitude Present Vul
2050 Vul 2080 Vul 1 Bagerhat 22.6555 89.7662 -0.0182 0.01387 0.01354 2 Bandarban 22.1936 22.1936 -0.0175 0.01698 0.01255 3 Barguna 22.1579 90.1144 -0.0022 -0.0002 -0.001 4 Barisal 22.7029 90.3466 -0.0066 0.00551 0.00559 5 Bhola 22.3317 90.8294 -0.0202 0.01655 0.01415 6 Bogra 24.8436 89.3701 -0.0203 0.01792 0.01246 7 Brahmanbaria 23.9616 91.1065 -0.0338 0.029 0.02589 8 Chandpur 23.2321 90.6631 -0.0139 0.01015 0.0103 9 Chittagong 22.3475 91.8123 -0.0111 0.01134 0.00649 10 Chuadanga 23.6442 88.8474 -0.0208 0.0182 0.01522 11 Comilla 23.4619 91.1869 -0.0156 0.01564 0.01587 12 Cox's Bazar 21.4395 92.0077 -0.001 -0.0012 -0.001 13 Dhaka 23.8103 90.4125 -0.0252 0.02243 0.01677 14 Dinajpur 25.6216 88.6354 -0.0379 0.02353 0.02178 15 Faridpur 23.6025 89.8365 -0.0168 0.01567 0.01448 16 Feni 23.0159 91.3976 -0.0053 0.00764 0.00455 17 Gaibandha 25.329 89.5415 -0.0355 0.02944 0.02241 18 Gazipur 23.9917 90.4196 -0.0198 0.01878 0.0146 19 Gopalganj 22.9899 89.8061 -0.0177 0.01714 0.01658 20 Habiganj 24.384 91.4169 -0.0328 0.02732 0.02092 21 Jamalpur 24.925 89.9463 -0.0351 0.02847 0.02155 22 Jessore 23.1778 89.1801 -0.02 0.02014 0.017 23 Jhalokati 22.6406 90.1987 -0.0111 0.02202 0.01911 24 Jhenaidah 23.5528 89.1754 -0.0179 0.0164 0.01427 25 Joypurhat 25.0968 89.0227 -0.0125 0.00939 0.0076 26 Khagrachari 23.1322 91.949 -0.0065 0.00575 0.00595 27 Khulna 22.8456 89.5403 -0.02 0.01583 0.01351 28 Kishoreganj 24.4331 90.7866 -0.0456 0.03841 0.0311 29 Kurigram 25.8103 89.6487 -0.0402 0.02862 0.02373 30 Kushtia 23.8976 89.1182 -0.0152 0.01501 0.01267 31 Laksmipur 22.9037 90.8294 -0.0236 0.02133 0.01777 32 Lalmonirhat 25.9162 89.4506 -0.0326 0.02239 0.0194 33 Madaripur 23.1649 90.194 -0.0148 0.01339 0.01016 34 Magura 23.4855 89.4198 -0.0142 0.01357 0.00995 35 Manikganj 23.8644 90.0047 -0.0191 0.01727 0.01378 36 Maulavibazar 24.4843 91.7685 -0.0253 0.02018 0.01616 37 Meherpur 23.7721 88.6314 -0.0132 0.01211 0.00915
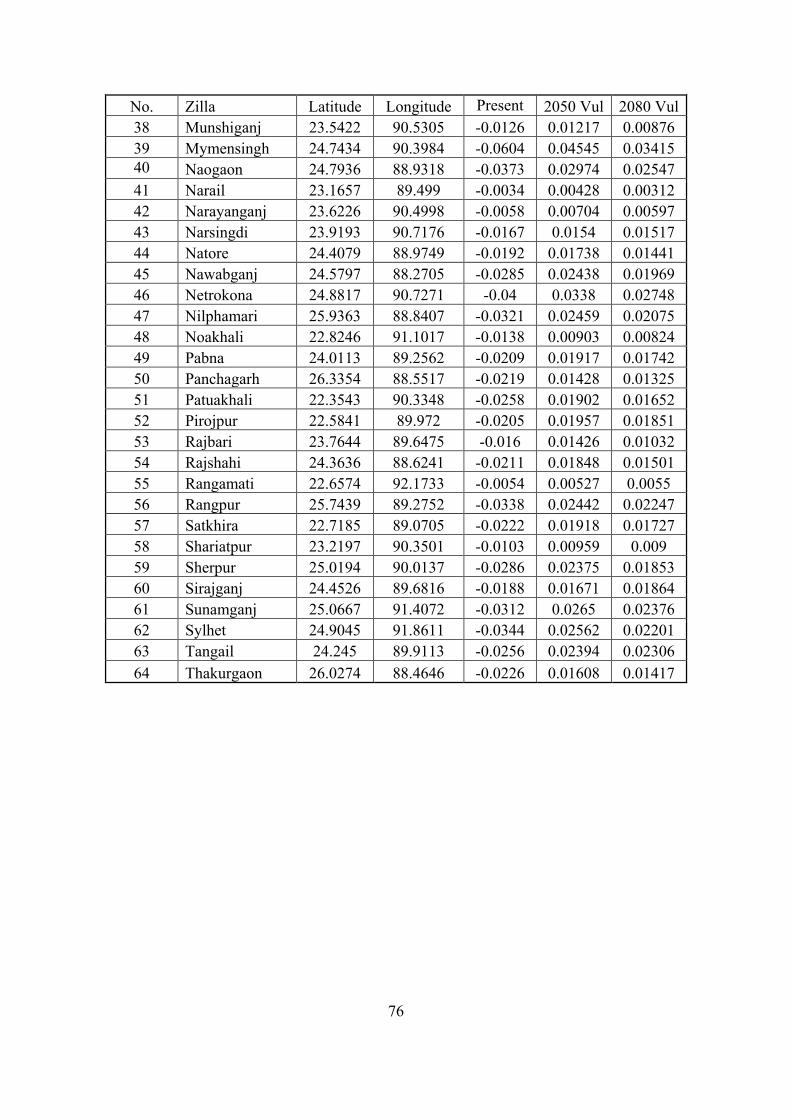
76
No. Zilla Latitude Longitude Present Vul
2050 Vul 2080 Vul 38 Munshiganj 23.5422 90.5305 -0.0126 0.01217 0.00876 39 Mymensingh 24.7434 90.3984 -0.0604 0.04545 0.03415 40
40
Naogaon 24.7936 88.9318 -0.0373 0.02974 0.02547 41 Narail 23.1657 89.499 -0.0034 0.00428 0.00312 42 Narayanganj 23.6226 90.4998 -0.0058 0.00704 0.00597 43 Narsingdi 23.9193 90.7176 -0.0167 0.0154 0.01517 44 Natore 24.4079 88.9749 -0.0192 0.01738 0.01441 45 Nawabganj 24.5797 88.2705 -0.0285 0.02438 0.01969 46 Netrokona 24.8817 90.7271 -0.04 0.0338 0.02748 47 Nilphamari 25.9363 88.8407 -0.0321 0.02459 0.02075 48 Noakhali 22.8246 91.1017 -0.0138 0.00903 0.00824 49 Pabna 24.0113 89.2562 -0.0209 0.01917 0.01742 50 Panchagarh 26.3354 88.5517 -0.0219 0.01428 0.01325 51 Patuakhali 22.3543 90.3348 -0.0258 0.01902 0.01652 52 Pirojpur 22.5841 89.972 -0.0205 0.01957 0.01851 53 Rajbari 23.7644 89.6475 -0.016 0.01426 0.01032 54 Rajshahi 24.3636 88.6241 -0.0211 0.01848 0.01501 55 Rangamati 22.6574 92.1733 -0.0054 0.00527 0.0055 56 Rangpur 25.7439 89.2752 -0.0338 0.02442 0.02247 57 Satkhira 22.7185 89.0705 -0.0222 0.01918 0.01727 58 Shariatpur 23.2197 90.3501 -0.0103 0.00959 0.009 59 Sherpur 25.0194 90.0137 -0.0286 0.02375 0.01853 60 Sirajganj 24.4526 89.6816 -0.0188 0.01671 0.01864 61 Sunamganj 25.0667 91.4072 -0.0312 0.0265 0.02376 62 Sylhet 24.9045 91.8611 -0.0344 0.02562 0.02201 63 Tangail 24.245 89.9113 -0.0256 0.02394 0.02306 64 Thakurgaon 26.0274 88.4646 -0.0226 0.01608 0.01417