Embed Size (px)
Citation preview

Institute of Ted >logv
Gif ■;
PHYSICS OF SELF-FIELD-DOMINATED PLASMAS
Final Technical Report Covering the Period February 1, 1994 to January 31, 1995, Submitted to the AFOSR, Boiling AFB, DC
Grant No. F49620-94-1-0049, DEF
V. Nardi, J. S. Brzosko, C Powell
Stevens Institute of Technology Hoboken, New Jersey 07030
Program Manager: Dr. Robert J. Barker AFOSR
Physics and Electronics Boiling AFB, DC 20332-6448
March 31, 1995
w>
Stevens Institute of Technolog}', Castle Point on Hudson, Hoboken, NJ 07030

REPORT DOCUMENTATION PAGE Form Approved
OMB No. 0704-01S8
i,ei '•rjoor.ie. including the lime ior re* „ni imimciicni. »»rcrunc emtma Obla '.
515 Je , ,,,„.;,,'S., . l.irii'jn cl mtormatior .5 »Mi "WS - i.er-v.«? ■ u' UV ',. _ , , . -„.„r..-,r,r-I.r,i! rona'Ci"" <■-"> burat-n ■.•■.■■,ir-.r,c ." .!•'; ."'■<•' *
Dav.sH.cr.-.ay.Si.ae i/..■*.-: '^<^. • ■ "•" ■"■■" ; ; . ..^ n.rtc rnwPHI
!.-'■'■'■> '
ferv.m '.
1. AGENCY USE ONLY (Leave blank) 2. REPORT DATE
4. TITLE AND SUBTITLE Physics of Self-Field-Dominated Plasmas
3. REPORT TYPE AND DATES COVERED
FINAL REPORT 01 Feb 94 - 31 Jan 9 ~ I 5. FUNDING NUMBERS
61102F 2301/ES
V. Nardi AFOSR-TR-95
7 PERFORMING ORGANIZATION NAME(S) AND ADDRESS(ES) Stevens Institute of Technology Hoboken, NJ 07030
^
9. SPONSORING/MONITORING AGENCY NAME{S) AND ADDRESSES
AFOSR/NE ^^ * 110 Duncan Avenue Suite B115 Boiling AFB DC 20332-0001
■ 11. SUPPLEMENTARY NO1'ES
i iJp. u<> i «ir.; i 11'. jN ■ iJUtn.aMl
10. SPONSORING/MONITORING f
AGENCY REPORT NUMBER [
F49620-94-1-0049
APPROVED FOR PUBLIC RELEASE: DISTRIBUTION UNLIMITED
, N' I I T i '. V
13. ABSTRACT (Maximum 200 words)
SEF FINAL REPORT ABSTRACT
19951018 057 DTXS QUALITY INSPECTED 8
14. SUBJECT TERMS
17. SECURITY CLASSIFICATION OF REPORT
UNCLASSIFIED
13. SECURITY CLASSIFICATION OF THIS PAGE
UNCLASSIFIED
19. SECURITY CLASSIFICATION OF ABSTRACT
UNCLASSIFIED
15. NUMBER GF PAG S
16. PRICE CODE
20. LIMITATION OF A! STRACT j
UNCLASSIFIE)
MSN 75AO-Ow30-5r0O S-andard =orm 293 (Rev 2-89)

DISCLAIM NOTICE
THIS DOCUMENT IS BEST
QUALITY AVAILABLE. THE COPY
FURNISHED TO DTIC CONTAINED
A SIGNIFICANT NUMBER OF
COLOR PAGES WHICH DO NOT
REPRODUCE LEGIBLY ON BLACK
AND WHITE MICROFICHE.

PHYSICS OF SELF-FIELD-DOMINATED PLASMAS
Final Technical Report Covering the Period February 1, 1994 to January 31, 1995, Submitted to the AFOSR, Boiling AFB, DC
Grant No. F49620-94-1-0049, DEF
V. Nardi, J. S. Brzosko, C. Powell
Stevens Institute of Technology Hoboken, New Jersey 07030
Program Manager: Dr. Robert J. Barker AFOSR
Physics and Electronics Boiling AFB, DC 20332-6448
March 31, 1995
Accesion For
NTIS CRA&i DTIC TAB Unannounced Justification
D D
By Distribution/
Availability Codes
Dist
Oil
Avail and/or Special
Summary.
This report presents experimental data, mode of operation and construction details of advanced plasma focus machines (APF) for different optimal levels of discharge-feeding energy W, in particular for APF-200 (W < 200 kJ) and APF-50 (W < 50 kj). The function of these APF systems was to determine, along with the data of smaller machines, the scaling laws of the emission (fluence) of ion and ion-cluster beams as a function of W, ejected from the self-field-dominated plasma of the APF pinch. Typical ion spectra from a Thomson (parabola) spectrometer in the 80° direction from the electrode/pinch axis are also included here.
Page 1 of 26
PHYSICS OF SELF-FIELD-DOMINATED PLASMAS
V. Nardi, J. S. Brzosko, C. Powell
Stevens Institute of Technology Hoboken, New Jersey 07030
Final Technical Report Covering the Period February 1, 1994 to January 31, 1995, Submitted to the AFOSR, Boiling AFB, DC
Grant No. F49620-94-1-0049, DEF March 31, 1995
1. Introduction.
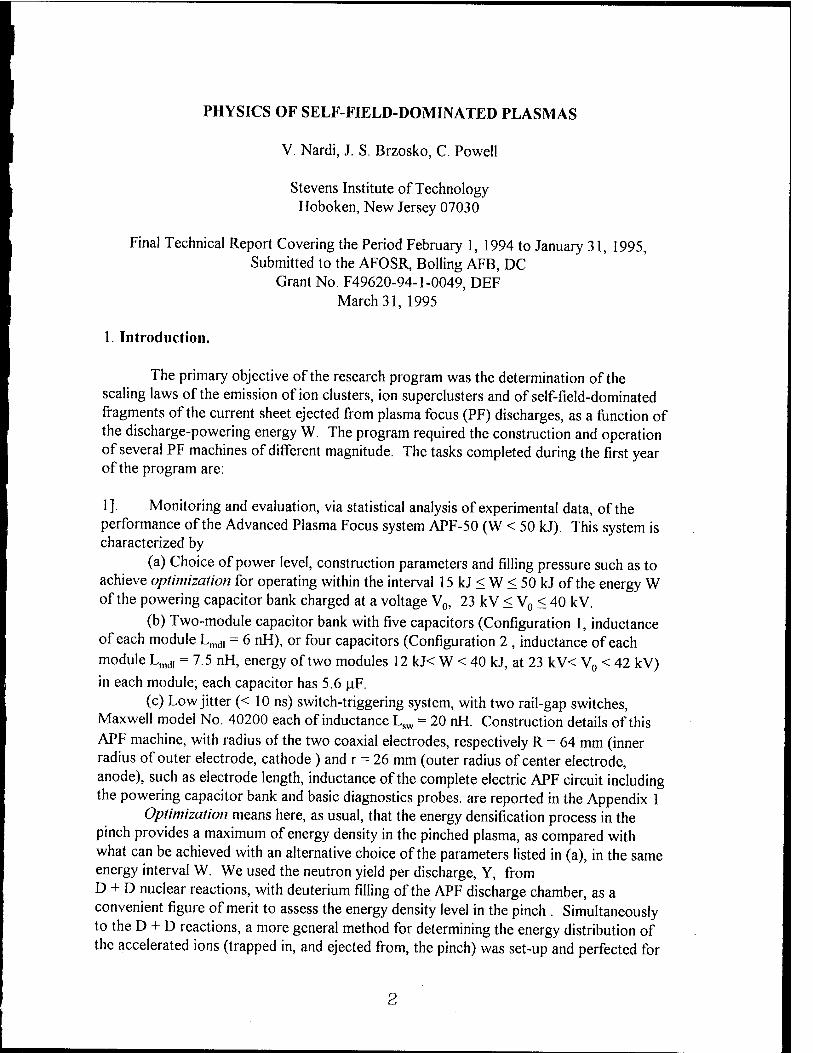
The primary objective of the research program was the determination of the scaling laws of the emission of ion clusters, ion superclusters and of self-field-dominated fragments of the current sheet ejected from plasma focus (PF) discharges, as a function of the discharge-powering energy W. The program required the construction and operation of several PF machines of different magnitude. The tasks completed during the first year of the program are:
1 ]. Monitoring and evaluation, via statistical analysis of experimental data, of the performance of the Advanced Plasma Focus system APF-50 (W < 50 kJ). This system is characterized by
(a) Choice of power level, construction parameters and filling pressure such as to achieve optimization for operating within the interval 15 kJ < W < 50 kJ of the energy W of the powering capacitor bank charged at a voltage V0, 23 kV < V0 < 40 kV.
(b) Two-module capacitor bank with five capacitors (Configuration 1, inductance of each module Lmd, = 6 nH), or four capacitors (Configuration 2 , inductance of each module LmdI = 7.5 nH, energy of two modules 12 kJ< W < 40 kJ, at 23 kV< V0 < 42 kV) in each module; each capacitor has 5.6 uF.
(c) Low jitter (< 10 ns) switch-triggering system, with two rail-gap switches, Maxwell model No. 40200 each of inductance Lsw = 20 nH. Construction details of this APF machine, with radius of the two coaxial electrodes, respectively R = 64 mm (inner radius of outer electrode, cathode ) and r = 26 mm (outer radius of center electrode, anode), such as electrode length, inductance of the complete electric APF circuit including the powering capacitor bank and basic diagnostics probes, are reported in the Appendix 1
Optimization means here, as usual, that the energy densification process in the pinch provides a maximum of energy density in the pinched plasma, as compared with what can be achieved with an alternative choice of the parameters listed in (a), in the same energy interval W. We used the neutron yield per discharge, Y, from D + D nuclear reactions, with deuterium filling of the APF discharge chamber, as a convenient figure of merit to assess the energy density level in the pinch . Simultaneously to the D + D reactions, a more general method for determining the energy distribution of the accelerated ions (trapped in, and ejected from, the pinch) was set-up and perfected for

application to all APF systems of the Laboratory. This general method is based on nuclear activation of solid targets and of gaseous targets (implemented with doping of the filling gas of the APF discharge chamber with high-Z-nuclei) and on a variety of high-Z nuclear reactions, with different values of the energy threshold of the reaction, as reported in the publication [1].
2]. Completion of the construction and operation of the Advanced Plasma Focus system APF-200 (W < 200 kJ) initiated under a previous AFOSR Grant (No. AFOSR - 91-0158), characterized by
(a) APF optimization via a choice of the construction parameters such as to permit operation at different powering energy levels W within a wide interval 70 kJ < W < 200 kJ, with charging voltage V0, 25 kV < V0 < 42 kV of a five-module capacitor bank (Configuration 1). Four modules were assembled (Configuration 2) with twenty capacitors in each module of inductance Lmd, = 1.5 nH (2.8 uF, 30 nH capacitors), with the readily-available option of connecting to the APF fitting header a fifth module with additional 20 capacitors on the back side of APF-200, depending on experimental requirements. This adaptability of the APF design to satisfy a variety of experimental requirements is one of the new features of APF, including field emitters for controlling breakdown conditions on the pyrex insulator sleeve [specifically a circular knife edge (KE) at the breech side of the electrodes], which differentiate APF from PF machines. Each module was singularly tested with a rail gap switch [as for APF-50] and a pulse trigger generator [Maxwell mod. No. 40295] capable of simultaneously triggering up to ten Maxwell rail gap switches.
(b) Pentagon-shaped APF header (formed of power-transmission back plates, electrodes and discharge chamber) connected to four modules, each of inductance 1.5 nH. Ultimately, the operation of APF-200 was limited to the simultaneous discharge of only two modules out of five, because only two Maxwell switches instead of the planned five switches, were available untill the end of the first year of the program. The limitation to two switches was determined by circumstances unforeseeable at an early stage of the research program including, but not limited to, the termination of the laboratory activity after the first year, instead of the programmed three-year activity.
(c) Same low-jitter switches and triggering system as for APF-50. The data obtained under the two-module limitation on W (35 kJ < W < 100 kJ at 25 kV < V0 < 42 kV) are sufficient for a comparison of the good performance of APF- 200 with that of APF-50 at the same level of peak amperian current I on the electrodes (I ~ 1 MA), respectively of radius R = 97 mm (outer electrode, cathode) and r = 55 mm (inner electrode, anode).
3], Same diagnostics and set-up for statistical analysis of data as for APF-50.
The data obtained from APF-50 have confirmed the existence of a particular (oscillatory) mode of propagation of the plasma current sheet between the electrodes, until the last stage of the current sheet implosion on the electrode axis. Characteristics of this oscillatory mode of propagation are reported in the publication [2].

Contributions to the research program and to this report were provided also by Prof. C. M. Luo, Visiting Scientists from Tsinghua University, Beijing, Dr. K. Melzacki, Visiting Scientist from KM Physics, Troy, NY, Mr. D. Goldstein and Ms. L. Schneider, Graduate Students with the support of a three-year AFOSR-AASERT Grant, and Mr. J.R. Brzosko under a Senior Student Project in Physics. Mr. M. Kania provided essential technical assistance in all activities of the Laboratory.
2. Performance of APF-200.
Flexible copper plates of length suitable for matching the relative jitter of the switches, connect switches and header. If compared to coaxial cable for power transmission, these flexible plates permit the use of higher charging-voltage levels V0 in air (no insulating oil was used) without flash-over at switch and header connections.
A Rogowski coil for monitoring the electrode current I(t) as a function of time was located between the two coaxial-electrode back plates of the header. A voltage- divider probe providing the voltage signal V(t), from the breech side of the electrodes, was connected to the power transmission plate attached to the base of the hot central electrode (anode).
The corresponding two signals I(t), V(t) were used to determine the period T of the complete electric circuit of APF-200 [including the powering capacitor bank] and the quality of the pinch from the dips of the I signals and the voltage signal spikes. These voltage spikes occur during the surge of anomalous (i.e., non-collisional) resistivity in the plasma pinch region, during the pinch disintegration stage and may have an amplitude greater by a factor > 5 than the maximum charging voltage V0 of the capacitor bank. The limitation to V0 < 42 kV avoids flash-over between power transmission plate, at the capacitor bushing and at the connection between power-transmission plate with header and with switches.
The neutron yield per discharge Y, from D + D fusion reactions, was also used for monitoring the quality of the energy densification process in the pinch.
The general view of APF-200 is shown in Fig. 1. The typical dl(t)/dt and I(t) ~ /(,' V(t') dt' signal are shown in Fig. 2. The signals are carried from the APF header to the monitoring system inside a noise-shielding Faraday cage, via 50 D. coaxial cables with solid-copper double shielding. The observed period for the two-modules operation was T = 15.5 ± 0.1 (is. The corresponding effective value of the inductance L of the complete circuit, including the plasma-current sheet propagating between the electrodes, was obtained from L ~ (T/27i)2C'' = 55 ± 1 nH, where C is, essentially, the capacitance C0
of the utilized two modules, i.e., C ~ C0 = 112 pF. The same considerations on L, on current sheet structure and multiplicity, and on diagnostic methods presented for APF-50 in Appendix 1, apply to APF-200. The neutron yield Y of the two-module system is reported in the histogram of Fig. 3.
The operation conditions of APF-200 reported here, V0 = 25 kV, W = 35 kJ,
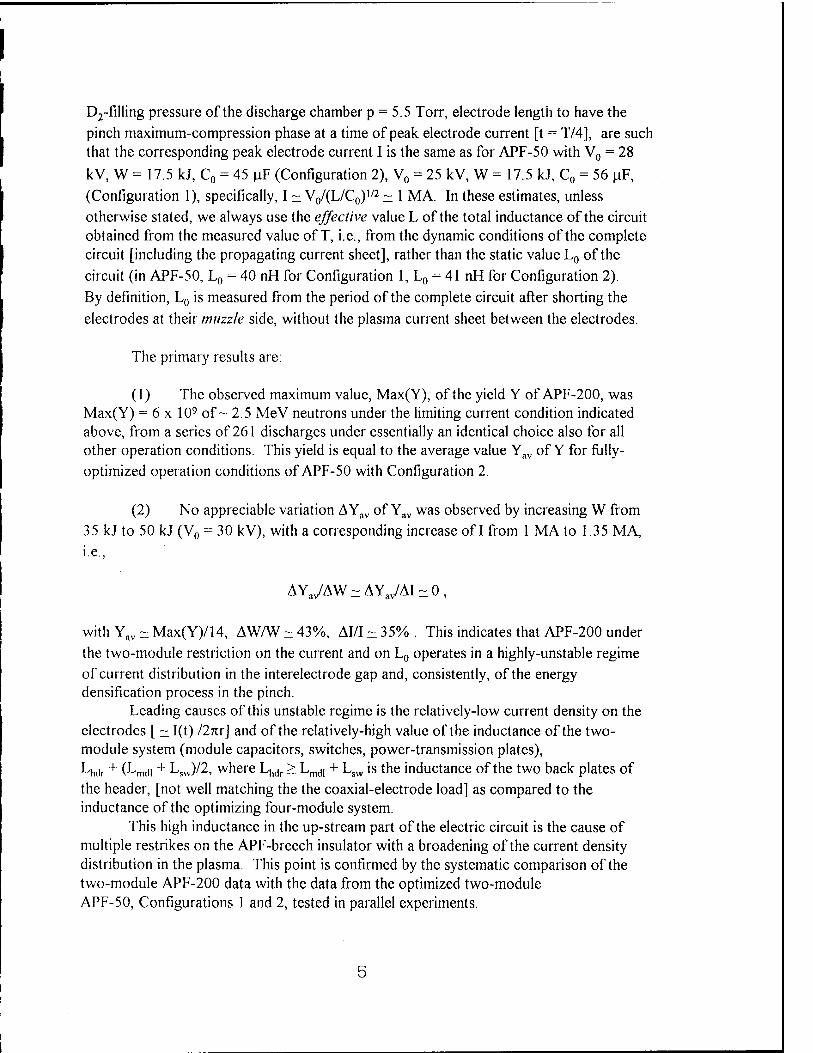
D2-filling pressure of the discharge chamber p = 5.5 Torr, electrode length to have the pinch maximum-compression phase at a time of peak electrode current [t = T/4], are such that the corresponding peak electrode current I is the same as for APF-50 with V0 = 28
kV, W = 17.5 kJ, C0 = 45 uF (Configuration 2), V0 = 25 kV, W = 17.5 kJ, C0 = 56 uF, (Configuration 1), specifically, I ~ V0/(L/C0)
1/2 ~ 1 MA. In these estimates, unless otherwise stated, we always use the effective value L of the total inductance of the circuit obtained from the measured value of T, i.e., from the dynamic conditions of the complete circuit [including the propagating current sheet], rather than the static value L0 of the circuit (in APF-50, L0 = 40 nH for Configuration 1, L0 = 41 nH for Configuration 2). By definition, L0 is measured from the period of the complete circuit after shorting the electrodes at their muzzle side, without the plasma current sheet between the electrodes.
The primary results are:
(1) The observed maximum value, Max(Y), of the yield Y of APF-200, was Max(Y) = 6 x 10⁹ of ~ 2.5 MeV neutrons under the limiting current condition indicated above, from a series of 261 discharges under essentially an identical choice also for all other operation conditions. This yield is equal to the average value Yav of Y for fully- optimized operation conditions of APF-50 with Configuration 2.
(2) No appreciable variation AYav of Yav was observed by increasing W from 35 kJ to 50 kJ (V0 = 30 kV), with a corresponding increase of I from 1 MA to 1.35 MA, i.e.,
AYav/AW~AYav/AI~0,
with Yav ~ Max(Y)/14, AW/W ~ 43%, Mil ~ 35% . This indicates that APF-200 under the two-module restriction on the current and on L0 operates in a highly-unstable regime of current distribution in the interelectrode gap and, consistently, of the energy densification process in the pinch.
Leading causes of this unstable regime is the relatively-low current density on the electrodes [ ~ I(t) /27ir] and of the relatively-high value of the inductance of the two- module system (module capacitors, switches, power-transmission plates), L),dr + (Lmdl + Lsw)/2, where Lhdr > LmdI + Lsw is the inductance of the two back plates of the header, [not well matching the the coaxial-electrode load] as compared to the inductance of the optimizing four-module system.
This high inductance in the up-stream part of the electric circuit is the cause of multiple restrikes on the APF-breech insulator with a broadening of the current density distribution in the plasma. This point is confirmed by the systematic comparison of the two-module APF-200 data with the data from the optimized two-module APF-50, Configurations 1 and 2, tested in parallel experiments.

3. Performance of APF-50.
Typical diagnostic procedures available during the operation of all our APF and PF machines are reported in Appendix 1, where magnetic probe data and neutron yield are reported for Configuration 1.
Fig. 4 reports the general view of APF-50, Configuration 1 (two modules with five 5.6 uF capacitors each; fixed facility; stainless steel discharge chambers with eight ports) and Configuration 2 (two modules with four 5.6 u.F capacitors each; mobile facility, mounted on wheeled platform).
The neutron yield Y of 300 discharges under identical conditions, with typical fluctuations of Y from discharge to discharge is reported in Fig. 5. A similar distribution was obtained for Configuration 1.
The discharge distribution of the optimized APF-50 has a relatively-narrow peak on a 0.1 < Y/Yav < 3.0 interval, with Yav(APF-50) ~ Max[Y(non-optim.APF-200)] = 6 x 10⁹ neutrons per pulse and Max [Y(APF-50)] = 1.7 x 10¹⁰ neutrons per pulse from D + D reactions (~ 2.5 MeV neutrons). A silver activation counter (Los Alamos type with four Geigers) monitors the neutron yield per pulse. Standard scintillations detectors (Pilot-U and NE-102) monitor the time resolved neutron pulse and the hard X-ray pulse emission from the pinch (X-ray energy > 30 keV; detector/monitoring system rise-time less than 5 ns ).
We note that the non-optimized APF-200 has a corresponding distribution over a much wider interval 0.1 < Y/Yav < 14.1, with Yav(APF-200) ~ Yav(APF-50)/10.
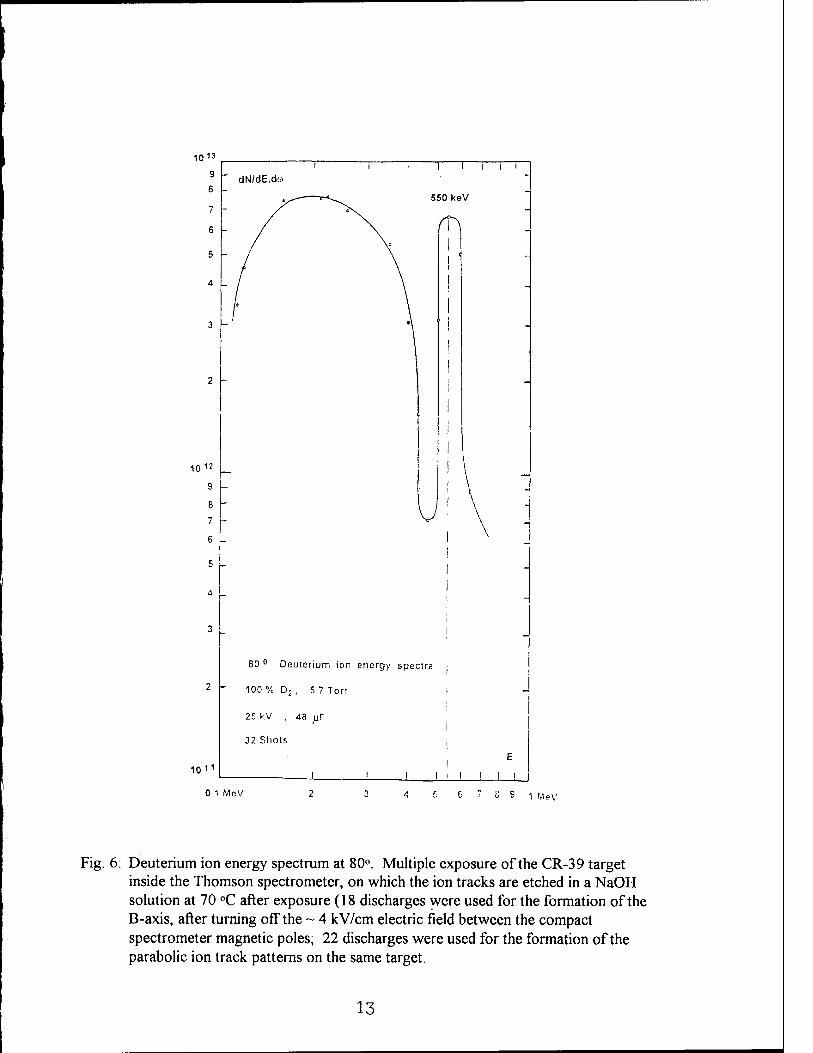
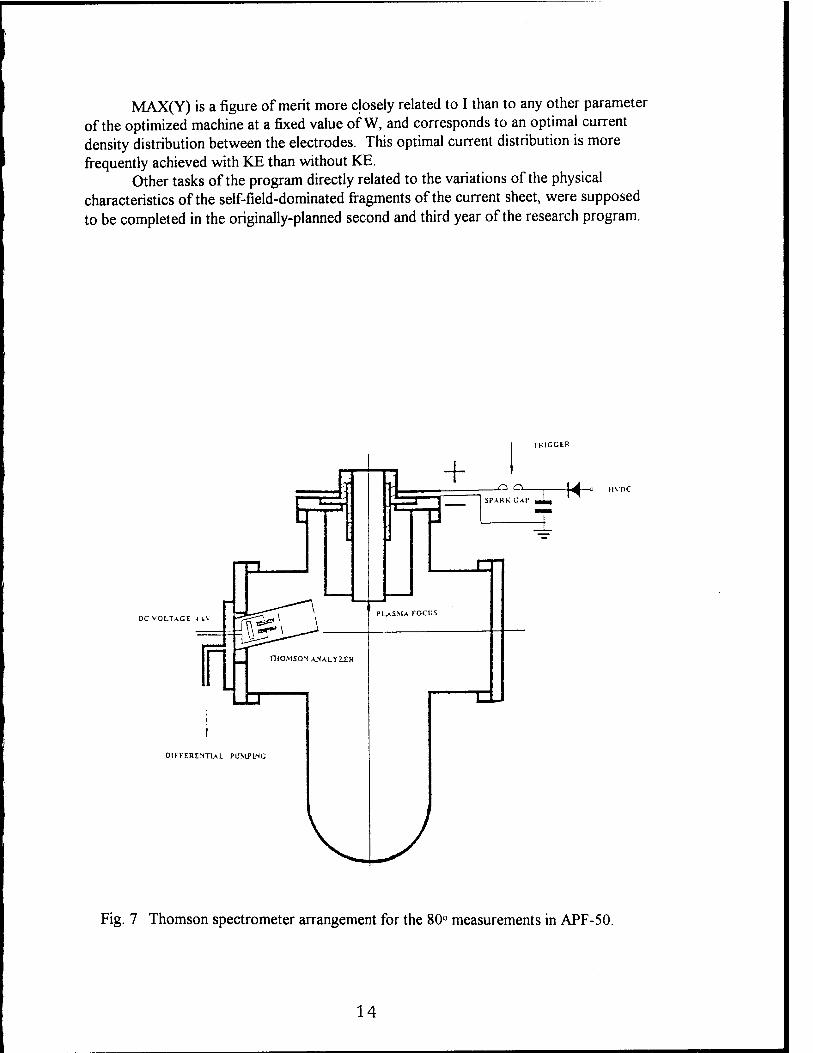
Fig. 6 reports the ion spectrum at 80° from a Thomson (parabola) spectrometer. Differential pumping holds a 10-4 Torr vacuum in the spectrometer chamber, which is separated from the discharge chamber by a 150 -urn-diameter pinhole from which the ion beam is extracted. Fig. 7 reports the spectrometer arrangement with respect to the APF electrodes. Other characteristics of APF-50 were extensively described in previous reports ( as Stevens Tech Report of February 28, 1994, submitted to the AFOSR under Contract No. AFOSR -91-0158 and previous reports under the same Research Contract).
The relatively-low Y values for Configuration 1 reported in Appendix 1, as compared to the corresponding Y values for Configuration 2, at a lower energy W reported in this Section, indicate the difference made by the KE component: No KE was used in Configuration 1 (i.e., the system was used as a conventional type of PF machine, rather than an APF machine). The increase by a factor > 3 to 5 of Yav in Configuration 2 of APF-50 is a direct effect of the introduction of KE to form an APF from a PF.
We note that the MAX (Y) value is less affected by the KE than Yav . MAX(Y) has essentially the same value for both APF and PF mode of operation, within the uncertainty (-20%) of the silver counter determinations. This point is critical to understand the role of the interelectrode (plasma) current density and its distribution in the energy densification process of APF and PF machines. The KE reduces substantially the fluctuation of Y from pulse to pulse, with a steady shift of all Y values toward MAX(Y).
6
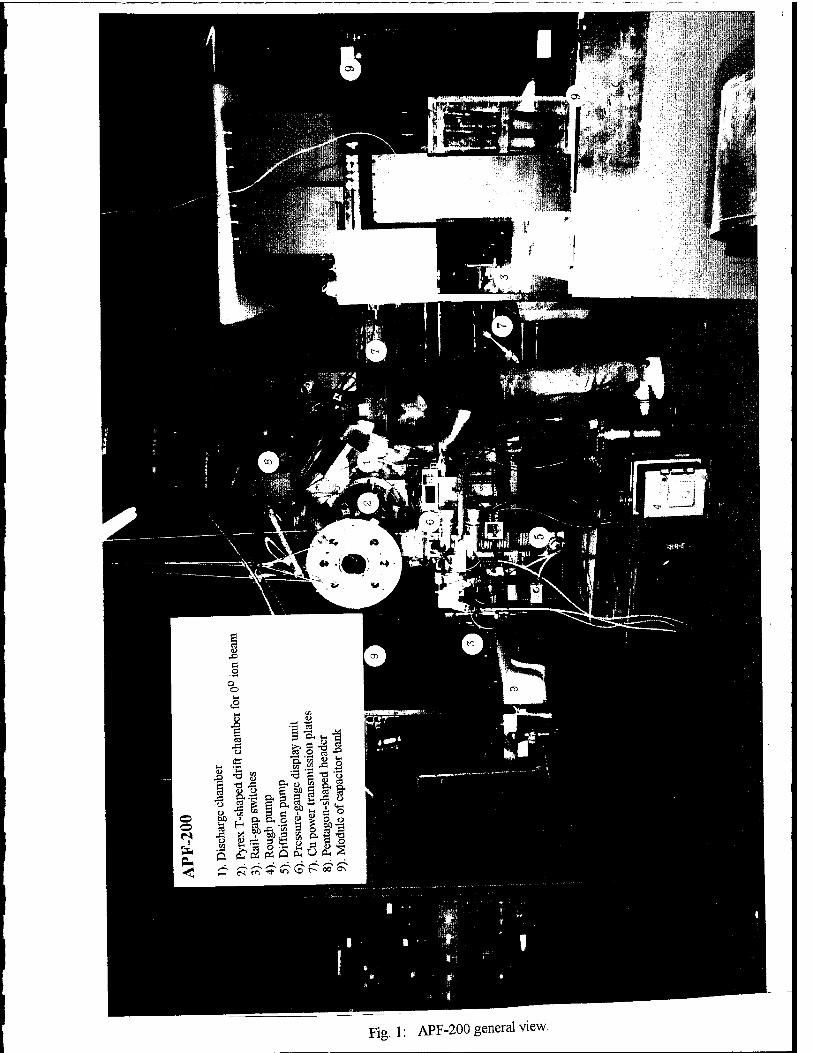
Fig. 1: APF-200 general view.

Graph C 1 J 7. 50 V/div 0.00 V 5.00 us/div -12.00 ps 1: k?f-tOo
Cursor 0 i W- A.
Vx 0.00 V Yp^J
Tx 12. 05 MS i . T =H r 2r-
V0 323 mV i
i jy
i
!
T0 -3. 150 |JS
*
/^
\
i i
AV 323 mV
—i—■—<&■-
V ̂
AT -15.20 ps
Fig. 2: Rogowski-coil signal dl(t)/dt (upper side 1) and current signal I(t) ~fj V(f) df from a self-integrating capacitive voltage divider, generated in the same two- module APF discharge (25 kV, Y ~ Yav). The capacitive voltage divider in this mode of operation, provides a smoothed signal, independent of the Rogowski-coil signal for measuring one and the the same electrical parameter I(t) of the system.
8

Fig. 3: Distribution,from a run of ~ 261 discharges under identical conditions, of the number of APF-200 discharges with yield between Y/Yavg and Y/Yavg + 0.2 , at V0 = 25 kV (W = 35 kJ, p = 5.5 Torr of D2). Under the two-module limitation the APF is far from optimized conditions with the chosen R, r, L0, L,,^ C0, W, but it it still capable, because of the new design with the field emitter KE, of generating good pinch compression, i.e., to have in typical runs of 100 to 300 discharges, a Yav far above background, by a factor > 100 and Max (Y) > 5 x 10⁹ 2.5 Mev neutrons.
9

> o ro 9, £
</) = > >
o in CM n
sz > c/5 £
=8:
h-
9 §
to in
in
in
c/3 .c o —- w
10

Fig. 4: APF-50 general view. Configuration 1 at right, Configuration 2 at left.

Number of Discharges vs. Y /Yav at 25 kV (NGL Ins.)
1.0x tO3mean vulut from all shots with Y =o.urn
Yn = 3 6x10 mean value, from all shots
Y„ x I0'a
20.00
ts.oo
20.00
n,max
1.2x 10 mean \njuc from all shoh with Yn\Q.l*Y
Yn-t./x to'' mean value from all shofs
1-.3 .3-.5 .5-.7 .7-.9 .9 1.1 1.3 1.5 1.7 1.9 2.1 2.3 - 2.5 2.7 2.9 3.1-3.
Histogram of the variation of the neutron yield Yn about the average Yav for 300 APF discharges, all under the same conditions.
Fig. 5: Distribution of the number of discharges with neutron yield between Y/Yav and Y/Yav + 0.2 for the APF-50 Configuration 2. The icons at top right report the discharge distribution for an optimized APF machine with W = 7 kJ and for a PF (the same machine, but without KE) operating under identical conditions for all other parameters.
12
10 1 "•
80 ° Deuterium ion energy spectra
100 % D2 , 5.7 Torr
25 kV , 48 JJF
32 Shots
0.1 McV
Ml I I ' J
5 6 7 8 9i Mev
Fig. 6: Deuterium ion energy spectrum at 80°. Multiple exposure of the CR-39 target inside the Thomson spectrometer, on which the ion tracks are etched in a NaOH solution at 70 °C after exposure (18 discharges were used for the formation of the B-axis, after turning off* the ~ 4 kV/cm electric field between the compact spectrometer magnetic poles; 22 discharges were used for the formation of the parabolic ion track patterns on the same target.
13
MAX(Y) is a figure of merit more closely related to I than to any other parameter of the optimized machine at a fixed value of W, and corresponds to an optimal current density distribution between the electrodes. This optimal current distribution is more frequently achieved with KE than without KE.
Other tasks of the program directly related to the variations of the physical characteristics of the self-field-dominated fragments of the current sheet, were supposed to be completed in the originally-planned second and third year of the research program.
TRIGGER
DC VOLTACE l vv
■o iivnc
DIFFERENTIAL PUMPLNG
Fig. 7 Thomson spectrometer arrangement for the 80° measurements in APF-50.
14
TK Publications
L -i J . "Observation of Plasma Domains With Fast Ions and Enhanced Fusion in Plasma Focus Discharges", J. S. Brzosko, V. Nardi, J. R. Brzosko, D. Goldstein, Physics Lett. A, Vol. 192, p. 250 (Sept. 1994).
Ill "Long Exposure Time Schlieren Photography of Plasma Focus Discharges", K. Melzacki, V. Nardi, Rev. Sei. Instrum., Vol. 66, p. 555, (Jan. 1995).
15
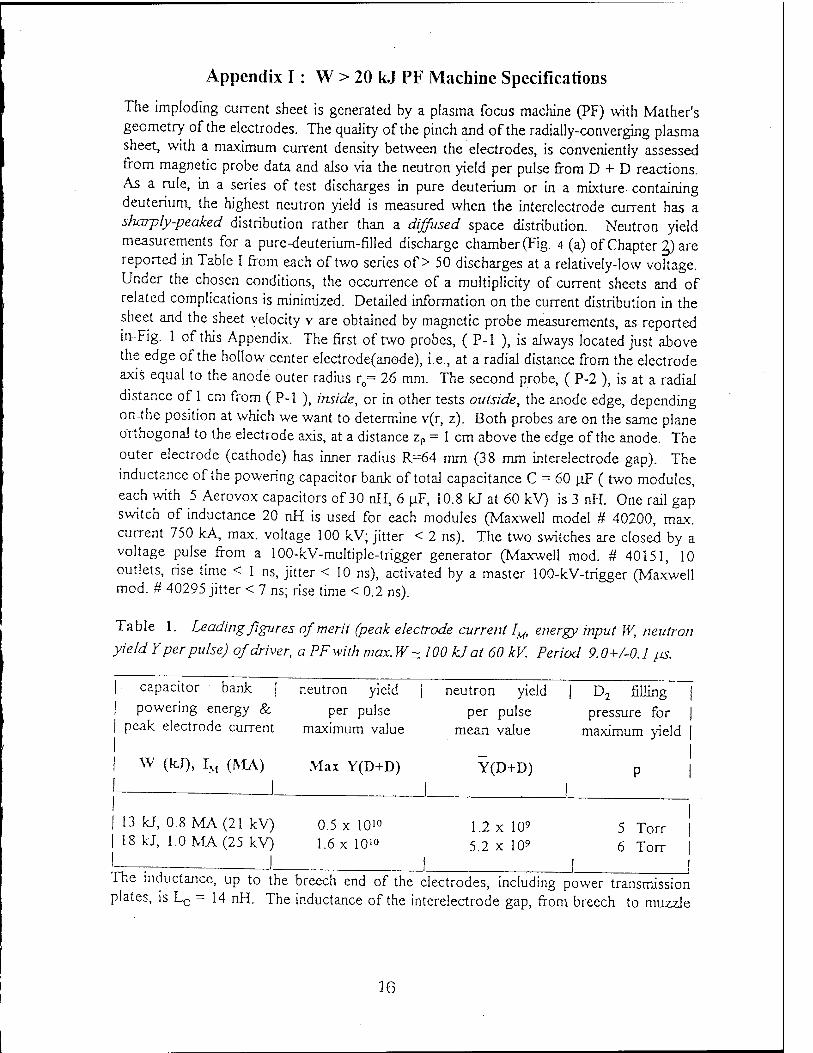
Appendix I: W > 20 kJ PF Machine Specifications
The imploding current sheet is generated by a plasma focus machine (PF) with Mather's geometry of the electrodes. The quality of the pinch and of the radially-converging plasma sheet, with a maximum current density between the electrodes, is conveniently assessed from magnetic probe data and also via the neutron yield per pulse from D + D reactions. As a rule, in a series of test discharges in pure deuterium or in a mixture containing deuterium, the highest neutron yield is measured when the interelectrode current has a sharply-peaked distribution rather than a diffused space distribution. Neutron yield measurements for a pure-deuterium-filled discharge chamber (Fig. 4 (a) of Chapter g) are reported in Table I from each of two series of > 50 discharges at a relatively-low voltage. Under the chosen conditions, the occurrence of a multiplicity of current sheets and of related complications is minimized. Detailed information on the current distribution in the sheet and the sheet velocity v are obtained by magnetic probe measurements, as reported in-Fig. 1 of this Appendix. The first of two probes, ( P-l ), is always located just above the edge of the hollow center electrode(anode), i.e., at a radial distance from the electrode axis equal to the anode outer radius r0= 26 mm. The second probe, ( P-2 ), is at a radial distance of 1 cm from (P-l ), inside, or in other tests outside, the anode edge, depending on-the position at which we want to determine v(r, z). Both probes are on the same plane orthogonal to the electrode axis, at a distance zP = 1 cm above the edge of the anode. The outer electrode (cathode) has inner radius R=64 mm (38 mm interelectrode gap). The inductance of the powering capacitor bank of total capacitance C - 60 uF ( two modules, each with 5 Aerovox capacitors of 30 nH, 6 uF, 10.8 kJ at 60 kV) is 3 nH. One rail gap switch of inductance 20 nH is used for each modules (Maxwell model # 40200, max. current 750 kA, max. voltage 100 kV; jitter < 2 ns). The two switches are closed by a voltage pulse from a 100-kV-multiple-trigger generator (Maxwell mod. # 40151, 10 outlets, rise time < 1 ns, jitter < 10 ns), activated by a master 100-kV-trigger (Maxwell mod. # 40295 jitter < 7 ns; rise time < 0.2 ns).
Table 1. Leading figures of merit (peak electrode current Iu, energy input W, neutron
yield Y per pulse) of driver, a PF with max. W~ 100 kJ at 60 kV. Period 9.0+/-0.1 ps.
capacitor bank | powering energy &
peak electrode current
W (kJ), IM (MA)
neutron yield per pulse
maximum value
Max Y(D+D)
neutron yield per pulse
mean value
Y(D+D)
D2 filling pressure for
maximum yield
13 Id, 0.8 MA (21 kV) 0.5xlO'o 18 kJ, 1.0 MA (25 kV) 1.6 x 10">
1.2 x 10⁹ 5.2 x 10⁹
5 Torr 6 Torr
The inductance, up to the breech end of the electrodes, including power transmission plates, is Lc = 14 nH. The inductance of the interelectrode gap, from breech to muzzle
16

side of the anode end is Le = (\IJ2K) l0 ln(R/r0) =26 nH (anode length l0= 145 mm) The circuit total inductance under static conditions is L„ Lr + L. = 40 nH. From the
measured period T = 9.0 +/- 0.1 u.s ~ 2K ( LC )l/2 of the complete circuit (powering system and electrodes, with the moving plasma sheet in the interelectrode gap), the corresponding value of the total inductance under dynamic conditions is L = 34 +/- 1 nH. The dynamic inductance accounts for the resistivity R ~ dL/dt = v LJl0 > 23 mOhm to 46 mOhm, where v > AxlO6 cm/s to 107 cm/s is the measured current-sheet velocity after
rolling off the interelectrode gap, till the beginning of the radial compression phase [ if R > 0, then L ~ (T/2TI)
2 [ 1/2C + (I/4C2 - {2KJT}I RV4 )1/2 ] < L0 J.
The two reversals in each of the P-l signals in Fig. 1(a) and (b) indicate that three current sheets CS,, CS2, CS3 are sweeping the magnetic probe in these discharges. The neutron
yield depends on specific characteristics of the layered structure of the current distribution. Specifically, Y is strongly dependent on the time delay At^ between the leading CS, and
the trailing CS3 and, to a lesser extent, on the delay At, between CS, and CS2, in
agreement with the equation Y ~ Y x[ a (Atj)-° + ß (At;)-2 ], with n > 2, and a « ß . Y(W,p) is the Y mean value from all discharges with the same W, p. The major number of discharges has a sufficiently-high value of At, (as those of Fig. 1), so that the first a-term
can be neglected. By expressing At in nanosec we have ß(W,p) = 1.6xl05 ns2. Further insight on the equation relating Y and the At' s is gained from its derivation, similar to that of Hartline and Ratliff equations for neural networks [1]. In our case, the i-th response function is the i-th contribution to the neutron yield from the i-th imploding current sheet; the input intensity (~ dl/dt) is determined from the corresponding probe signal of the sheet wliich carries a fraction I/I of the total electrode current I~ 1 MA. Additional
information on the Y, (At)s correlation coefficients is reported in Ref. [2] of thisAppendix.
1.58 V/d i s 8.90 V 280 ns/dlv -588.8 ns 1.58 V/dIv 8.88 V 283 ns/dlv -588.8 ns
f. IA
;rr^...i ;/4';...
7 \ s? '■'■■■■■■* -}•?■■■■? t
.-...L.-....i{^h..h:uJ-\ I. L (b) ! ci, «,v j«, ;
i'j-4^ ! f"
Fig. 1. P-l magnetic probe signals from two discharges under the same conditions (W = 18 kJ, p = 6 Torr of pure D2). Y = 0.35 Y in (a); Y = 0.9 Y in (b).
References
[1] . H. K. Hartline, F. Ratliff: Studies in Excitation and Inhibition in., etc, Rockefeller Univ. Press, New York 1974. F. Ratliff et al: Proc. U.S. Nat. Acad.Sci., 62, 733 (1969). [2] . A_ Bortolotti , J. Brzosko, P. De Chiara, H. Kilic, F. Mezzetti, v! Nardi, C. Powell: Pr. 19-th EPS Conf. Contr. Fusion and Plasma Phys. (Innsbruck, 1992), Vol. 16C, p. 695.
17
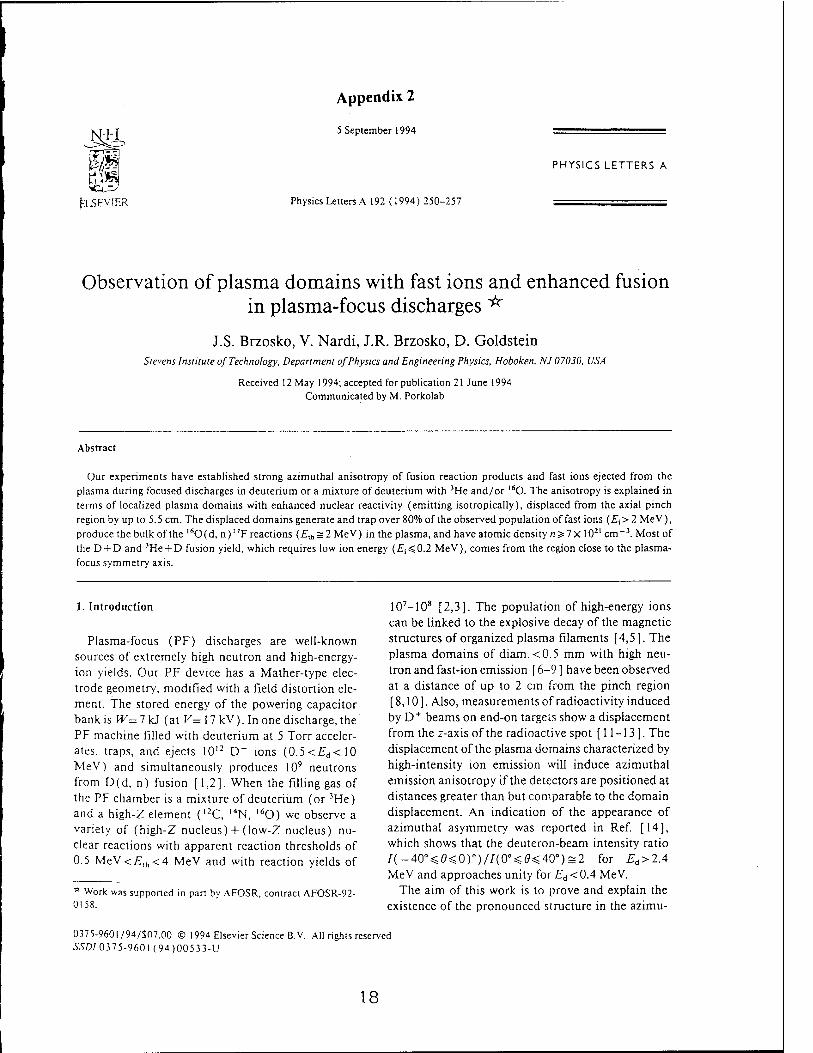
Appendix 2
5 September 1994
Physics Letters A 192 (1994) 250-257
PHYSICS LETTERS A
Observation of plasma domains with fast ions and enhanced fusion in plasma-focus discharges ^
J.S. Brzosko, V. Nardi, J.R. Brzosko, D. Goldstein Stevens Institute of Technology, Department of Physics and Engineering Physics, Hoboken, NJ07030, USA
Received 12 May 1994; accepted for publication 21 June 1994 Communicated by M. Porkolab
Abstract
Our experiments have established strong azimuthal anisotropy of fusion reaction products and fast ions ejected from the plasma during focused discharges in deuterium or a mixture of deuterium with 3He and/or l60. The anisotropy is explained in terms of localized plasma domains with enhanced nuclear reactivity (emitting isotropically), displaced from the axial pinch region by up to 5.5 cm. The displaced domains generate and trap over 80% of the observed population of fast ions (£j> 2 MeV), produce the bulk of the 160(d, n)'7F reactions (E^l MeV) in the plasma, and have atomic density n^lx 102' cm-3. Most of the D + D and 3He + D fusion yield, which requires low ion energy (£^0.2 MeV), comes from the region close to the plasma- focus symmetry axis.
1. Introduction
Plasma-focus (PF) discharges are well-known sources of extremely high neutron and high-energy- ion yields. Our PF device has a Mather-type elec- trode geometry, modified with a field distortion ele- ment. The stored energy of the powering capacitor bank is W=l\ü (at V- 17 kV). In one discharge, the PF machine filled with deuterium at 5 Torr acceler- ates, traps, and ejects 10'2 D+ ions (0.5<£"d< 10 MeV) and simultaneously produces 109 neutrons from D(d, n) fusion [1,2]. When the filling gas of the PF chamber is a mixture of deuterium (or 3He) and a high-Z element (l2C, 14N, 160) we observe a variety of (high-Z nucleus) + (low-Z nucleus) nu- clear reactions with apparent reaction thresholds of 0.5 MeV<£th<4 MeV and with reaction yields of
* Work was supported in part by AFOSR, contract AFOSR-92- 0158.
107—108 [2,3]. The population of high-energy ions can be linked to the explosive decay of the magnetic structures of organized plasma filaments [4,5]. The plasma domains of diam. <0.5 mm with high neu- tron and fast-ion emission [ 6-9 ] have been observed at a distance of up to 2 cm from the pinch region [8,10]. Also, measurements of radioactivity induced by D+ beams on end-on targets show a displacement from the z-axis of the radioactive spot [11-13]. The displacement of the plasma domains characterized by high-intensity ion emission will induce azimuthal emission anisotropy if the detectors are positioned at distances greater than but comparable to the domain displacement. An indication of the appearance of azimuthal asymmetry was reported in Ref. [14], which shows that the deuteron-beam intensity ratio /(-400<6^0)°)//(0°=S(?<400)=2 for EA>2A MeV and approaches unity for Eä < 0.4 MeV.
The aim of this work is to prove and explain the existence of the pronounced structure in the azimu-
0375-9601/94/S07.00 © 1994 Elsevier Science B.V. All rights reserved 55D/0375-960l(94)00533-U
18
J.S. Brzoskoetal. / Physics Letters A 192(1994)250-257 251
thai distribution of the ion and fusion-product emission.
2. Experimental
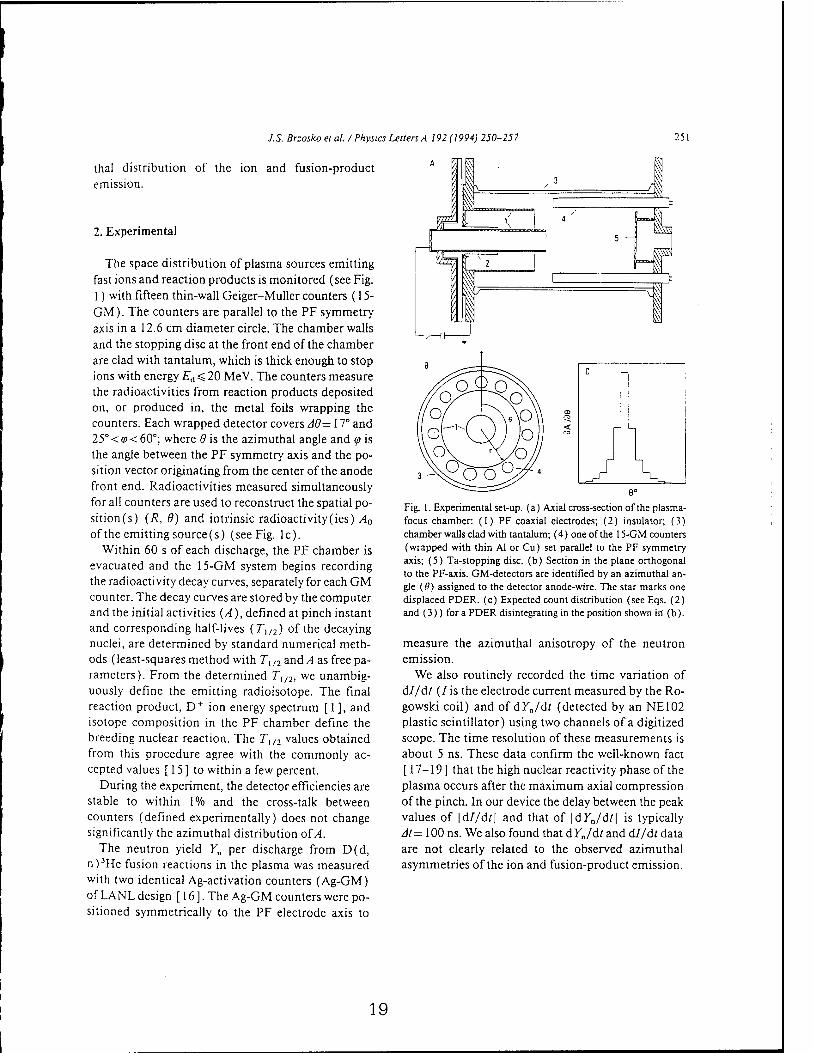
The space distribution of plasma sources emitting fast ions and reaction products is monitored (see Fig. 1) with fifteen thin-wall Geiger-Muller counters (15- GM). The counters are parallel to the PF symmetry axis in a 12.6 cm diameter circle. The chamber walls and the stopping disc at the front end of the chamber are clad with tantalum, which is thick enough to stop ions with energy Ea < 20 Me V. The counters measure the radioactivities from reaction products deposited on, or produced in, the metal foils wrapping the counters. Each wrapped detector covers A9= 17° and 25° < <p< 60°; where 9 is the azimuthal angle and (p is the angle between the PF symmetry axis and the po- sition vector originating from the center of the anode front end. Radioactivities measured simultaneously for all counters are used to reconstruct the spatial po- sition (s) {R, 9) and intrinsic radioactivity (ies) A0
of the emitting source (s) (see Fig. lc). Within 60 s of each discharge, the PF chamber is
evacuated and the 15-GM system begins recording the radioactivity decay curves, separately for each GM counter. The decay curves are stored by the computer and the initial activities (A), defined at pinch instant and corresponding half-lives (Tl/2) of the decaying nuclei, are determined by standard numerical meth- ods ( least-squares method with T, n and A as free pa- rameters). From the determined Tl/2, we unambig- uously define the emitting radioisotope. The final reaction product, D+ ion energy spectrum [ 1 ], and isotope composition in the PF chamber define the breeding nuclear reaction. The Tl/2 values obtained from this procedure agree with the commonly ac- cepted values [ 15 ] to within a few percent.
During the experiment, the detector efficiencies are stable to within 1% and the cross-talk between counters (defined experimentally) does not change significantly the azimuthal distribution of A.
The neutron yield Y„ per discharge from D(d, n)3He fusion reactions in the plasma was measured with two identical Ag-activation counters (Ag-GM) of LANL design [16]. The Ag-GM counters were po- sitioned symmetrically to the PF electrode axis to
n
J V Fig. 1. Experimental set-up. (a) Axial cross-section of the plasma- focus chamber (1) PF coaxial electrodes; (2) insulator, (3) chamber walls clad with tantalum; (4) one of the 15-GM counters (wrapped with thin AJ or Cu) set parallel to the PF symmetry axis; (5) Ta-stopping disc, (b) Section in the plane orthogonal to the PF-axis. GM-detectors are identified by an azimuthal an- gle (6) assigned to the detector anode-wire. The star marks one displaced PDER. (c) Expected count distribution (see Eqs. (2) and (3)) for a PDER disintegrating in the position shown in (b).
measure the azimuthal anisotropy of the neutron emission.
We also routinely recorded the time variation of dl/dt (Iis the electrode current measured by the Ro- gowski coil) and of dY„/dt (detected by an NE102 plastic scintillator) using two channels of a digitized scope. The time resolution of these measurements is about 5 ns. These data confirm the well-known fact [17-19] that the high nuclear reactivity phase of the plasma occurs after the maximum axial compression of the pinch. In our device the delay between the peak values of \dl/dt\ and that of |d7„/d/| is typically At = 100 ns. We also found that d YJdt and dl/dt data are not clearly related to the observed azimuthal asymmetries of the ion and fusion-product emission.
19

252 J.S. Brzosko et at. /Physics Utters A 192 (1994) 250-257
3. Trends in experimental data
The experimental program is based on three com- plementary experiments, each with a different gas mixture filling the discharge chamber and different material wrapping the GM-counters. For a complete specification of the three experiments and of the en- ergy threshold of the observed nuclear reactions, see Table 1.
Measurement of the azimuthal distribution of the reaction products in the plasma and the products of reactions induced by the D+ beam in the external targets (wrapping foils) indicates the following:
(a) Only one half-life decay curve is observed in ex- periment 1 (D2 filling, Al wrapping). The corre- sponding activity is identified as the product of the reactions induced in the aluminium wrapping foil by theD+ beam, i.e., 27Al(d,p)28Al.
(b) A double half-life decay curve is observed in ex- periments 2 and 3. In experiment 2, one half-life re- sults from the decay of products of the 160(d, n)17F reaction in the plasma; the second, from the decay of products of the 65Cu(d, p)66Cu reactions in the wrapping foil. In experiment 3, one half-life results
from the decay of 63Zn nuclei produced in the chain of two reactions—the 3He(d, p)"He reaction (£p= 14.7 MeV) in the plasma followed by 63Cu(p, n )63Zn in the wrapping foil; the second, from the de- cay of products of 65Cu(d, p)66Cu reactions in the wrapping foil (as in experiment 2). Consequently, we simultaneously defined two azimuthal angular distri- butions—one for fusion products, the other for fast deuterons.
(c) The observed distributions have a strong azi- muthal structure in more than 80% of the discharges, with up to three distinct maxima. Examples of the observed distributions are shown in Figs. 2, 3, and 4.
(d) There is a strong correlation between the azi- muthal distributions measured in the same discharge for radioactivities induced by fusion processes and by D+ beams on the targets (wrapping foils); see Figs. 3 and 4.
(e) The positions of the maxima of the detected ra- dioactivities are randomly distributed along the azi- muthal coordinate 6.
(f) The azimuthal neutron anisotropy An is ran- domly distributed between -0.1 and +0.1, and is defined as
Table 1 Specification c f the experiments
Gas composition *
Foil Monitoring reaction
D+ beam plasma fusion
reaction [MeV]
reaction [MeV]
experiment I D2(100%) Al 0.254
"Al(d,p)2sAl 7~,/2 = 2.4m
1.8 D(d.n)3Heb 0.005
experiment 2 D2(90%)+O2(I0%) Cu 65Cu(d,p)66Cu 2.0 D(d,n)3Heb 0.005 0.127 rl/2 = 5.1 m l60(d.n),7Fc 2.0
experiment 3 D2(50%) + 3He (50%) Cu 0.127
65Cu(d,p)66Cu 7~!/2 = 5.1 m
2.0 7",/2=l.l m D(d,n)3Heb
3He(d,p)<Hethend
63Cu(p,n)63Zn r,/2 = 38.1 m
0.005 0.1 5.0
" The chamber is filled with 3.3 x 10¹⁷ atoms/cm3 (equivalent lo 5 Torr of D2). Numbers in brackets refer to atomic abundance. h Azimuthal anisotropy {A„) of neulron emission was measured only. c nF ions (£, ca. 0.6 MeV) are implanted in Cu-foil wrapping GM-counters.
14 7 MeV proions from 3He(d,p)"He reaction in the plasma were detected via the "Cu (p,n )6,Zn reaction induced in Cu-foil wrapping CM counters.
£,„ is the apparent reaction threshold defined as the ion energy above which 90% of reactions occur (for ion spectrum E^lb see Ref ill)-
20
J.S. Brzosko et at. I Physics Letters A 192 (1994) 250-257 253
0.0-
(b)
250
250
Azimuthal Angle • 9°
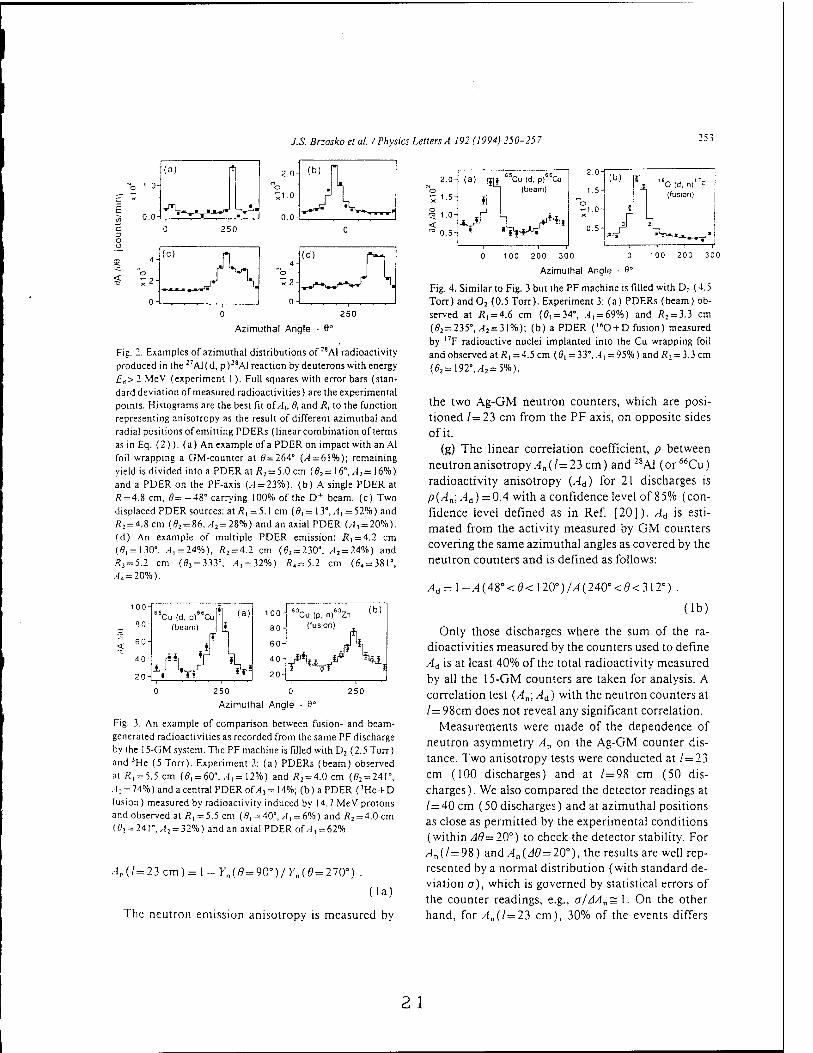
Fig. 2. Examples of azimuthal distributions of 28A1 radioactivity produced in the27Al(d, p)28Al reaction by deuterons with energy £d> 2 MeV (experiment 1). Full squares with error bars (stan- dard deviation of measured radioactivities) are the experimental points. Histograms are the best fit of A„ 6, and R, to the function representing anisotropy as the result of different azimuthal and radial positions of emitting PDERs (linear combination of terms as in Eq. (2)). (a) An example of a PDER on impact with an Al foil wrapping a GM-counter at 0=264° (A = 6\%); remaining yield is divided into a PDER at R2 = 5.0 cm (02 = 16°, A2 = 16%) and a PDER on the PF-axis {A = 23%). (b) A single PDER at « = 4.8 cm, 0= -48° carrying 100% of the D+ beam, (c) Two displaced PDER sources: at «,= 5.1 cm (0, = 13°,/I, = 52%) and Ä2 = 4.8 cm (02 = 86,^2 = 28%) and an axial PDER {A, = 20%). (d) An example of multiple PDER emission: «,=4.2 cm (9, = 130°, A, = 24%), «2 = 4.2 cm (02 = 23O°, /42 = 24%) and «3 = 5.2 cm (03 = 333°, ^3 = 32%) «4 = 5.2 cm (0< = 381°, /14 = 20%).
1 oo
so
60-
40-
20-
Cu fd. p) Cu (beam)
1 HiT
f (a) I 100-
80-
63 63 Cu fp, n) Zn
(fusion)
(b)
60- / \
40-
20- /H/
250 250
Fit
Azimuthal Angle - 9°
3. An example of comparison between fusion- and beam- generated radioactivities as recorded from the same PF discharge by the 15-GM system. The PF machine is filled with D2 (2.5 Torr) and 3He (5 Torr). Experiment 2: (a) PDERs (beam) observed at «, = 5.5 cm (0, = 6O°, ,-(, = 12%) and «2 = 4.0 cm (02 = 24t°, ■l3 = 74%) and a central PDER of/i3= 14%; (b) a PDER (3He + D fusion) measured by radioactivity induced by 14.7 MeV protons and observed at «, = 5.5 cm (0, =40°, A, = 6%) and Ä; = 4.0cm (02 = 241°,.l2 = 32%) and an axial PDER of A3 = 62%.
.-U/=23 cm)= 1 - rn(0=9O°)/yn((9=27Oo)
(la]
(a)
i
ill Cu (d. p) Cu (beam)
2.0- (b) [51 16„ , i:r I
1.5- [i O (d, n) F I
(fusion)
-1.0- l]
al T] 0.5-
JJ^r "ST**,« * .*
2.0-
<5 1.0- < TO 0.5-
0 100 200 300 0 100 200 300
Azimuthal Angle - 9°
Fig. 4. Similar to Fig. 3 but the PF machine is filled with D2 (4.5 Torr) and 02 (0.5 Torr). Experiment 3: (a) PDERs (beam) ob- served at Ä, = 4.6 cm (0, = 34°, A, =69%) and «2 = 3.3 cm (02 = 235°, A2 = 3\%)\ (b) a PDER ("O + D fusion) measured by "F radioactive nuclei implanted into the Cu wrapping foil and observed at Ä, = 4.5 cm (0| = 33°,^, = 95%) and «2 = 3.3 cm (02=192°,/<2 = 5%).
the two Ag-GM neutron counters, which are posi- tioned /=23 cm from the PF axis, on opposite sides ofit.
(g) The linear correlation coefficient, p between neutron anisotropy An{!= 23 cm) and 28A1 (or66Cu) radioactivity anisotropy {Ad) for 21 discharges is p{An;Ad) =0.4 with a confidence level of 85% (con- fidence level defined as in Ref. [20]). Ad is esti- mated from the activity measured by GM counters covering the same azimuthal angles as covered by the neutron counters and is defined as follows:
/ld = 1-/! (48°< 0< 120°)A4 (240° < 0< 312°
(lb)
The neutron emission anisotropy is measured by
Only those discharges where the sum of the ra- dioactivities measured by the counters used to define Ad is at least 40% of the total radioactivity measured by all the 15-GM counters are taken for analysis. A correlation test (A„; Ad) with the neutron counters at /= 98cm does not reveal any significant correlation.
Measurements were made of the dependence of neutron asymmetry A„ on the Ag-GM counter dis- tance. Two anisotropy tests were conducted at /=23 cm (100 discharges) and at /=98 cm (50 dis- charges). We also compared the detector readings at /=40 cm (50 discharges) and at azimuthal positions as close as permitted by the experimental conditions (within A6=20°) to check the detector stability. For /■!„(/= 98) and/ln(zj<9=20o), the results are well rep- resented by a normal distribution (with standard de- viation a), which is governed by statistical errors of the counter readings, e.g., a/AAn= 1. On the other hand, for A„(l=23 cm), 30% of the events differs
2 1

254 J.S. Brzoskoetal. / Physics Leiters A 192 (1994) 250-25?
from the average A„ value by more than one standard deviation (a) and a/AAn>3. The latter is due to the radial and azimulhal displacement of the neutron source. Such a displacement affects the readings of the detectors at small values of distance /and can be neglected for detectors far from the z-axis.
4. Data interpretation
The analysis of the azimuthal anisotropy observed in the experiments assumes that any part of the plasma volume (defined by the 15-GM counters, the tantalum stopper in front, and the plane determined by the front-end of the external electrode) may iso- tropically emit ions and fusion reaction products. Consequently, the anisotropy will be the result of dis-
. placed (from the PF-axis), localized plasma do- mains of enhanced nuclear reactivity (referred to henceforth as PDER(s)).
The alternative assumption of an anisotropic (azi- muthal) emission of D+ ions and fusion products from the central pinch column is rejected because it is unable to consistently explain all the experimental data in this work. We refer specifically to the data quoted in points (d) and (g) above.
Our experimental system is sensitive to the radial position(s) of emitting plasma domain(s) (R) and its azimuthal coordinate(s) (0O), but the experi- ments do not allow us to define the axial position(s) of the domain(s). As a consequence, a PDER emit- ting during impact on the Ta-stopper cannot be dis- tinguished from a PDER in radial flight through the plasma volume. To construct a map of PDERs that would explain the observed anisotropy one can use the least-squares method [20] to compare radioac- tivities imposed by the best fit of source distributions (D* beams and/or fusion products) in the plasma with the measured radioactivities. The tests were done for two space representations of radiating plasmas. In the first representation, the cylinder of plasma normal to the PF axes (1 cm thick, with base at z> 5 'in) is divided into thirteen areas and the thirteen intrinsic radioactivities (A0) can be fitted. The azir muthal division of the plasma source is represented by a polar surface containing a central disc plus six radial and two azimuthal grids such that all thirteen have equal surface area. The second model considers
point-like plasma sources (axial and up to four ra- dial) with A0, R and 60 coordinates as parameters to be fitted. As a special case of the second model one may consider that the emission from the plasma can occur with plasma lumps impacting on the surfaces of the foils wrapping the 15-GM counters. In any case, the optimization procedure (least-squares method) fits an analytical function Ath(6) to the experimen- tally determined radioactivities Acxp(6). Any plasma emitting volume is represented by superposition of emitting point-like sources.
For one point-like PDER at the (R, 80) location, the distribution of radioactivity Axh{6) is written as
and
(2)
Q{R, 00,8) = --arclg(ab>-l(a2 + b2 + r2)-,/2) ,
r2 = R2 + L2-2RLcos(60-6)
(3a)
(3b)
The emitting point-like plasma domain is localized at a distance R from the PF-axis at z = a/2 and at an azimuthal angle 60; L = 6.3 cm is the distance from the GM axis to the z-axis; a=10cm and b = 0.& cm are the active length and radius of the GM counters. Fig. lc shows the Alh(6) distribution that would be observed if a single, point-like PDER is in the posi- tion marked in Fig. lb.
The^2 test was used to choose between a represen- tation of plasma sources by 13 large elements (with constant emissivity within each area) and point-like sources with (R, 6) coordinates as free parameters. For a few typical experimental data sets, the best fits were done and x2/xh was defined (see Fig. 5). /g 5
corresponds to a fit with a confidence level of 50% and is tabulated elsewhere [20], This analysis leads to the following conclusions:
(i) all the considered representations of plasma sources give a similar azimuthal position of the main emitting plasma source but a different angular width of the source(s);
(ii) the highest confidence level is achieved for a small number of point-like sources, where the num- ber of observed maxima in the distribution (if clearl v separated) is equal to the number of PDERs dis- placed more than r> 3 cm;
22
J. S. Brzosko et all Physics Letters A 192(1994) 250-257 255
100
■V
100 -
10 -
1 1
12 0 4 8 12 0 4
Number ol Emitting Sources
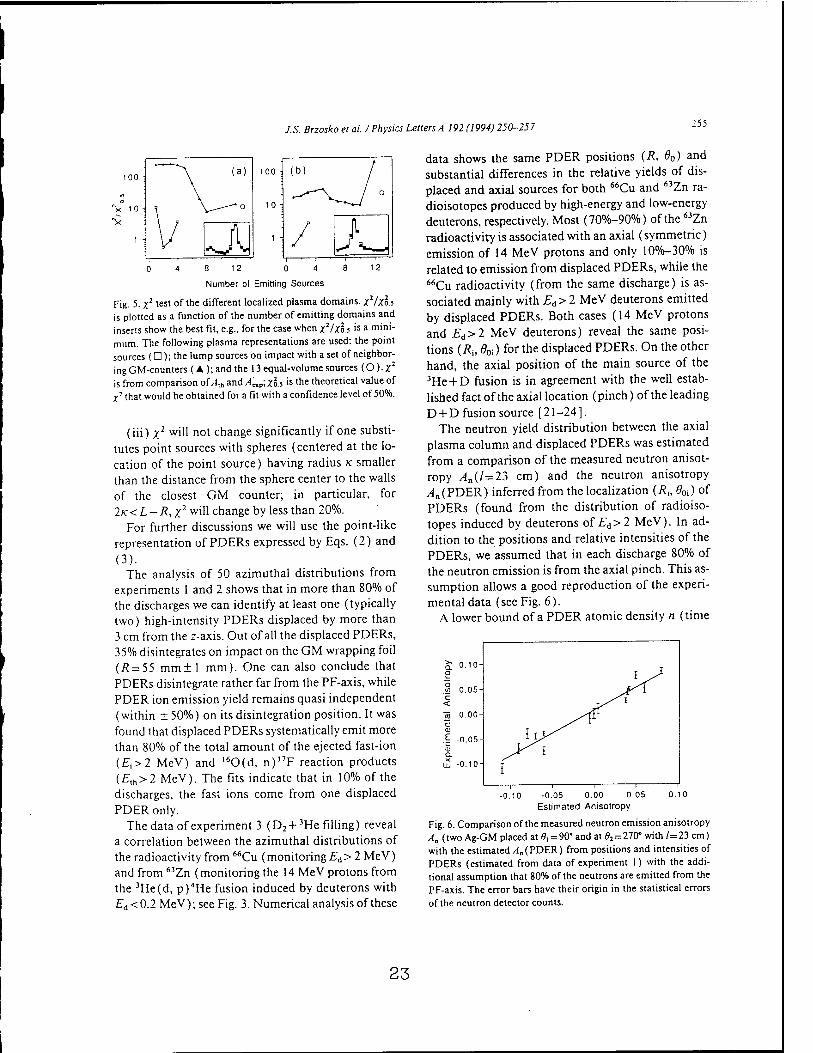
Fig. 5. X2 test of the different localized plasma domains. x2/xh is plotted as a function of the number of emitting domains and inserts show the best fit, e.g., for the case when x2/Xo.s is a mini- mum. The following plasma representations are used: the point sources (D); the lump sources on impact with a set of neighbor- ing GM-counters (A);andthe 13 equal-volume sources (O).*2
is from comparison of AA and A„v; xls is the theoretical value of X2 that would be obtained for a fit with a confidence level of 50%.
(iii) x2 wi'l not change significantly if one substi- tutes point sources with spheres (centered at the lo- cation of the point source) having radius K smaller than the distance from the sphere center to the walls of the closest GM counter; in particular, for 2K<L-R, x2 will change by less than 20%.
For further discussions we will use the point-like representation of PDERs expressed by Eqs. (2) and (3).
The analysis of 50 azimuthal distributions from experiments 1 and 2 shows that in more than 80% of the discharges we can identify at least one (typically two) high-intensity PDERs displaced by more than 3 cm from the z-axis. Out of all the displaced PDERs, 35% disintegrates on impact on the GM wrapping foil (.R=55 mm±l mm). One can also conclude that PDERs disintegrate rather far from the PF-axis, while PDER ion emission yield remains quasi independent (within ± 50%) on its disintegration position. It was found that displaced PDERs systematically emit more than 80% of the total amount of the ejected fast-ion (£j>2 MeV) and 160(d, n)l7F reaction products (£th>2 MeV). The fits indicate that in 10% of the discharges, the fast ions come from one displaced PDER only.
The data of experiment 3 (D2 + 3He filling) reveal a correlation between the azimuthal distributions of the radioactivity from 66Cu (monitoring Ed> 2 MeV) and from "Zn (monitoring the 14 MeV protons from the 3He(d, p)4He fusion induced by deuterons with Ed < 0.2 MeV); see Fig. 3. Numerical analysis of these
data shows the same PDER positions (R, 60) and substantial differences in the relative yields of dis- placed and axial sources for both 66Cu and 63Zn ra- dioisotopes produced by high-energy and low-energy deuterons, respectively. Most (70%-90%) of the 63Zn radioactivity is associated with an axial (symmetric) emission of 14 MeV protons and only 10%-30% is related to emission from displaced PDERs, while the 66Cu radioactivity (from the same discharge) is as- sociated mainly with £d> 2 MeV deuterons emitted by displaced PDERs. Both cases (14 MeV protons and £d>2 MeV deuterons) reveal the same posi- tions (Rit 0oi) for the displaced PDERs. On the other hand, the axial position of the main source of the 3He + D fusion is in agreement with the well estab- lished fact of the axial location (pinch) of the leading D + D fusion source [21-24].
The neutron yield distribution between the axial plasma column and displaced PDERs was estimated from a comparison of the measured neutron anisot- ropy Aa(l =23 cm) and the neutron anisotropy /4n(PDER) inferred from the localization (R{, 90i) of PDERs (found from the distribution of radioiso- topes induced by deuterons of Ed>2 MeV). In ad- dition to the positions and relative intensities of the PDERs, we assumed that in each discharge 80% of the neutron emission is from the axial pinch. This as- sumption allows a good reproduction of the experi- mental data (see Fig. 6).
A lower bound of a PDER atomic density n (time
0.10- ij^
0.05- T^/i-
o.oo-
0.05-
0.10- I
-0.10 -0.05 0.00 0.05 Estimated Anisotropy
Fig. 6. Comparison of the measured neutron emission anisotropy A, (two Ag-GM placed at 0, = 90° and at 02 = 270° with /= 23 cm) with the estimated /*„(PDER) from positions and intensities of PDERs (estimated from data of experiment 1) with the addi- tional assumption that 80% of the neutrons are emitted from the PF-axis. The error bars have their origin in the statistical errors of the neutron detector counts.
23

256 J.S. Brzoskoetai. / Physics Leiters A 192(1994)250-257
averaged during the nuclear reactivity phase) can be estimated from the experimental data of Fig. 4 by us- ing similar approaches to those used in Refs. [ 2,3 ]. For this estimate we have to compare the ratio of the total radioactivity induced by one PDER via l60(d. n)'7F reactions in the plasma with the total radioac- tivity induced by D+ ejected from the same PDER. The reaction cross sections, the spectra of trapped and reacting ions ocEA~1-i [1], and the PDER-lifetime fraction during which ion acceleration and trapping occur ( ~ 5 ns [ 8 ]) are the known quantities entering this estimate. From the data shown in Fig. 4 we found that n > 7 x 10²' /cm " 3. This density is typical of all the data from experiment 3. It also agrees with the estimation in Ref. [ 2 ] that is based on the data from space-integrated fast-ion fusion and fast-ion emis- sion. Such a large plasma density in the plasma focus discharge (pinch density is N^ 1019/cm3) was deter- mined in the past via C02 laser scattering on 50-/zm plasma domains, n> 102O/cm3 [25] and from X-ray line intensities from "hot-spots", n > 1022/cm3 [ 26 ].
and D + 3He fusion reactions induced by ions of en- ergy £d«0.2 MeV. However, only 10%-30% of the D + D and D + 3He fusion reactions are associated with displaced PDERs. Most of the D + D and D + 3He fusion reactions have their origins in the near PF-axis region, as reported elsewhere [ 21 -24 ].
This observation introduces spatial differentiation between plasma domains poor in high-energy ions and those rich in high-energy ions. A comparison of the present results with those of Ref. [2] suggests that displaced and axial plasma domains have different ion energy characteristics but quadratic relations of their nuclear reactivities.
The PDER displacement may be enhanced by the grounding of the discharge chamber walls, GM- counter wrapping foils, and the front stopper. If this is so, it would be an important process for future ap- plications of PF machines.
References
5. Summary
All the data presented in this paper can be consis- tently explained by displaced plasma domains of very high density. It is conceivable that the displaced PDERs and hot-spots (diam.<0.5 mm) previously observed in the vicinity of the r-axis by pin-hole im- aging (D + . Ed> 1 MeV. recorded with CR-39 track detectors) [8.27] have the same origin and physical characteristics.
The following conclusions are drawn: (1 ) High-energy ions (Ed>2 MeV) and the prod-
ucts of the l60(d. n)17F nuclear reactions (reaction threshold Elh> 2 MeV) in the plasma are both emit- ted from the same PDER. The major fraction (-80%) of the PDERs is displaced from the PF symmetry axis at a distance greater than 3 cm, and about 35% of the population is displaced up to 5.5 cm (a limit set by the experimental conditions). Often, more than 80% of the deuterons of the Ed > 2 MeV and 80% of the reaction yields induced by these deuterons in the plasma are generated by one PDER displaced far from the z-axis. The remaining 20% of the emission is emitted from the PF symmetry axis.
(2) The displaced PDERS are also sources of D + D
[ 1 ] V. Nardi et al., IEEE Trans. Plasma Sei. 16(1988)368. [2] J.S. Brzosko and V. Nardi, Phys. Lett. A 155 (1991) 162. [3] J.S. Brzosko, V. Nardi. D. Goldstein and J.R. Brzosko. in:
Proc. 20th IEEE Intern. Conf. on Plasma science (Vancouver, 1993) p. 188.
[4] W.H. Bostick, L. Grunberger, V. Nardi and W. Prior, in: Proc. 5th Symp. on Thermophysical properties (Am. Soc. Mech. Eng., New York, 1970) p. 495.
[5] V. Nardi, Phys. Rev. Lett. 25 (1970) 718. [6] W.H. Bostick, V. Nardi and W. Prior, in: Plasma physics
and controlled fusion research (1976), report IAEA-CN-35 (IAEA, Vienna, 1977) p. 497.
[ 7 ] W.H. Bostick, V. Nardi and W. Prior, Ann. N.V. Acad. Sei. 251 (1975) 2.
[8] V. Nardi et al., in: Plasma physics and controlled fusion research (1988), report IAEA-CN-50, Vol. 2 (IAEA. Vienna, 1989) p. 743.
[9]M. Sadowski et al.. Phys. Lett. A 113 (1985) 25. [ 10 ] W.H. Bostick et al., in: Proc. Intern. Conf. on Energy storage,
compression, and switching (Turin, 1978) p. 267. [11] R.L. Gullickson and H.L. Sahlin. J. Appl. Phys. 49 (1978)
1099. [12]S. Czekaj et al., in: Plasma physics and controlled fusion
research (1986), report IAEA-CN-47, Vol. 2 (IAEA. Vienna. 1987) p. 593.
[ 1 3 J M. Yokoyama et al., in: Plasma physics and controlled fusion research (1982) report IAEA-CN-41. Vol. 2 (IAEA. Vienna. 1983) p. 41 5.
[14]M. Sadowski. J. Zebrowski. E. Rydger and J. Kucinski. Plasma Phys. Controlled Fusion 30 (1988) 763.
24

J.S. Brzosko et at. / Physics Letters A 192 (1994) 250-257 257
; 15 ] V.S. Shirley, ed., Table of radioactive isotopes (Wiley, New
York, 1986). [16JR.J. Lanter and D.E. Bannerman, Los Alamos Nat. Lab.
Report LA-3489-MS (1968). [ 17 j N.J. Peacock, M.G. Hobby and P.D. Morgan, Plasma Phys.
16(1974)489. [ 18 ) A. Bernard el al., Phys. Fluids 18 (1975) 180. [ 19 ] J.S. Brzosko, B.V. Robouch and J. KJobukowska, Fusion
Techn. 12(1987)71. [20] P.R. Bevington, Data reduction and error analysis for the
physical sciences (McGraw-Hill, New York, 1969). [21 ] K. Steinmetz, K. Hubner, J.P. Rager and B.V. Robouch,
Nucl. Fusion 22 (1982) 25.
[22] K. Hirano et al., in: Plasma physics and controlled fusion research (1984) report IAEA-CN-44, Vol. 2 (IAEA, Vienna, 1985) D-III-6-2.
[ 23 ] S.P. Moo, C.K. Chakrabarty and S. Lee, IEEE Trans. Plasma Sei. 19 (1991) 515.
[24] J.S. Brzosko, B.V. Robouch and J. KJobukowska, Nucl./ Fusion Techn. 4 (1983) 263.
[25 ] G.R. Neil and R.S. Post, Plasma Phys. 14(1988)425. [ 26 ] I. Volobuev et al., Sov. J. Plasma Phys. 14 (1988) 401, 622. [27] A. Bortolotti et al., report ECA-12B (1988) 613.
25