Embed Size (px)
Citation preview
1
Institute of Policy Analysis and Research – Rwanda (IPAR)
Report for the African Centre for Economic Transformation (ACET)
Dickson Malunda (PhD)
March 2012
RWANDA CASE STUDY ON ECONOMIC TRANSFORMATION
2
Acknowledgement
We would like to thank government institutions and agencies from which we have obtained data and
information we have used in writing this report. We would also thank the IPAR team members
especially Professor Pamela Abbot for valuable comments and inputs given in shaping this report.
This study was financed by the Africa Center for Economic Transformation (ACET).
We remain responsible for the content of the report. No omissions or areas should be attributed to
anyone who provided information for the project. The opinions expressed in the report are ours and
should not be attributed to the funding agencies who may not necessarily share them.
3
Acronyms
ADB African Development Bank
EAC East African Community
EDPRS Economic Development and Poverty Reduction Strategy
EPZ Export Commodity Processing Zone
European Union European Union
FEZ Free Economic Zone
FTZ Free Trade Zone
GTZ German Technical Cooperation
IMF International Monetary Fund
NBR National Bank of Rwanda
RDB Rwanda Development Board
RRA Rwanda Revenue Authority
UNCTD United Nations Conference on Trade and Development
VAT Value Added Tax
4
Contents
Acknowledgement .................................................................................................................................. 2
Acronyms ................................................................................................................................................ 3
Executive Summary……………………………………………………………………………………………………………………………5
1. Introduction .................................................................................................................................... 6
Country context and economic transformation agenda……………………………………………….……….6
Review of Policy framework for economic Transformation in Rwanda…………………………………7
Historical Context……………………………………………………………………………………………………………...10
Review of Performance on Economic Transformation ........................................................................ 13
Macro-Indicatrors ............................................................................................................................. 14
2. Structure ................................................................................................................................. 118
Production ................................................................................................................................... 118
Foreign Trade .............................................................................................................................. 220
Export Diversification .................................................................................................................... 22
Export Markets for Rwanda .......................................................................................................... 25
Technological Sophiscation of Production and Exports ................................................................ 27
Value Addition of Rwanda’s Exports over Time ............................................................................ 29
An analysis of Rwanda’s economic sectors ................................................................................... 33
3. Employment in Rwanda .......................................................................................................... 441
Poverty and Inequality .................................................................................................................. 44
Bottlenecks to Economic Transformation in Rwanda……………………..………………………….47
III. Institutional Environment for Transformation ...................................................................... 49
State Capacity ................................................................................................................................... 49
Institutional mechanism for Planning and Budgeting ............................................................... 511
The Private Sector and Business Environment ................................................................................. 52
IV. Prospects for Transformation .......................................................................................................... 56
V. What is to be Done ........................................................................................................................... 57
References ............................................................................................................................................ 63
5
Executive Summary Rwanda’s economic growth over the last decade has been remarkable. With a government that is committed to achieving sustainable economic growth coupled with growth in employment opportunities for its people, Rwanda has made impressive progress in rehabilitating and stabilizing its economy to exceed pre‐1994 levels. The overall economy is growing at a significant rate. The average annual growth rated in GDP was 8.8 per cent between 2005 and 2009. Rwanda’s GDP per capita has increased from less than 200US$ in 1994 to 540 US$ in 2010.Although still at an early stage, the GoR has set a set path towards economic transformation which shows signs of economic transformation in Rwanda There is evidence of a significant increase in private sector investment following the introduction of a revised tax code and implementation of the doing business reforms since 2005 although there was a downturn due to the World economic crisis in 2009.Both foreign and domestic investment have increased with FDI exceeding local investment and new jobs have been created. Exports have increased and there is some evidence of a beginning of export diversification into areas prioritised by government as well as an increase in revenues from tourism. However, imports have also increased and so the balance of trade has worsened. Although GDP per capita and government revenues as a proportion of GDP have increased, Rwanda remains dependent on Overseas Development Assistance for about 50% of its annual budget. Another evidence of Rwanda’s emerging economic transformation is significant shift with respect to productivity is that agriculture is breaking out of its long standing stagnation. There is an incipient structural shift in the mode of production away from low-productivity subsistence farming to a higher degree of market-orientation and more use of soil-enriching and yield-enhancing cash inputs. Such a transformation is fundamental for a dynamic and sustainable development and economic transformation. However, it needs to be complemented with specific measures to reverse the trend of environmental degradation and depletion of the natural resources base. The pace of agricultural transformation is important, as will measures to ensure that not only the large and medium sized farms, but also small-holders are be able take part in and benefit from this structural change. Substantial increases in production and yields in recent years are evidence of the high dividends of this structural change. Another sign of Rwanda’s economic transformation is that development of the non-agricultural sectors of the economy has clearly begun. So far, this has been dominated by a proliferation of small-scale business and activities operating on an informal or semi-informal basis. The magnitude of this phenomenon over the past few years has been large enough to make non-agricultural entrepreneurship and wage employment a major source of new employment and income opportunities and to have quite a significant impact on the structural pattern and pace of economic growth. According to the 2011 household survey results, increases in non-farm wages have been one of the major drivers of the reduced poverty rates from 57% in 2006 to 44.9% in 2010/2011. It is important that this development continues, and that the business climate evolves so that the many new small-scale businesses are able to grow and increase demand for non-farm labour. This will enhance long term economic transformation in Rwanda
6
Introduction
In this research project , we conduct a study on economic transformation in Rwanda. The aim of the study is to assess how Rwanda has fared with respect to economic transformation over the past 30 years and suggest recommendations for accelerating its progress. In this study, we not only analyse the trends in Rwanda’s economic indicators over time but also review the policies that underlie the observed trends with the aim of giving policy explanations and policy recommendations to accelerate economic transformation in Rwanda. Economic transformation refers to a process involving increases in productivity, technological capability, economic diversification, and international competitiveness that support rapid, sustained and shared growth in employment and incomes of the population over time(ACET, 2011). The study is part of the on-going country case studies that are being conducted in different Sub-Saharan countries by the African Centre for Economic Transformation (ACET) in order to serve as an input in the Africa Transformation Report (ATR).
These studies are motivated by the slow pace of the observed high economic growth in translating into meaningful economic transformation that comes with more jobs and improved incomes of people in Sub-Saharan Africa , relative to other regions of the World. The studies aim at bringing the subject of structural economic transformation back onto the policy agenda in Africa through (a) promoting the focus of policy in Africa on economic transformation, (b) bringing data and analysis to inform discussion and policy action on the topic, and (c) comparing countries along various dimensions of economic transformation in order to generate competitive action by policy makers.
In the first section of the report, we give an overview of the context in Rwanda in order to the reader a sense of the background to Rwanda as a nation, how it has progressed in terms of economic growth, what the remaining challenges with respect to economic transformation and what it aspires for in terms of government policy. Section two presents a diagnostic review of the performance with respect to economic transformation in Rwanda over the past thirty years. Here, we describe the trends of the different indicators of economic transformation over time in absolute figures, their rates of change and their sustainability over time. We also identify the underlying factors or explanations behind the observed trends and rates of change over time. In section 3, we review the institutional environment for economic transformation in Rwanda in order to assess the extent to which the institutional environment is conducive to proactive government engagement with the private sector in pursuing economic transformation. In section 4, we identify the different export activities in which Rwanda can increase international competitiveness or diversify into while section 5 gives recommendations to help Rwanda to seize opportunities in order to speed up economic transformation. Section 6 concludes.
Country Context and Economic Transformation Agenda
Rwanda is one of the best performing countries in Africa and an example of success in post-conflict reconstruction (Bigsten and Isaksson 2008). Following the devastating effects of the genocide against the Tutsis on Rwandan economy in 1994, the government embarked on an extensive reconstruction program based on sound economic policies, peace and stability. Rwanda has been widely acknowledged for the progress it has made in fighting corruption and promoting gender equality. It has made dramatic progress in creating a soft business environment in recent years becoming one of
7
the most improved countries in the world in the annual Doing Business Index. The combination of these factors restored confidence in Rwanda as a nation , thus attracting private sector investment and overseas development assistance both of which have been crucial in both the post-war reconstruction and setting a path for sustained economic transformation. However, challenges still remain. There has been little change in the contribution of manufacturing which was 15 per cent in 2010 (NISR 2011a). The formal sector’s share of the GDP was only 22 per cent in 2010, with the monetary informal sector’s being 47 per cent , the informal non-monetary sector’s 20 per cent and the Government’s 11 percent (NISR 2011b).Rwanda’s economy is largely informal and dominated by owner-operated SMEs in trade and agriculture. In addition, FDI remains low despite Rwanda having established a sound investment climate and the private sector is still nascent. The binding constraints to sustained growth and economic transformation include inadequate economic infrastructure, aa limited skills base, access and cost of finance and low productivity in the Rwanda’s economy (World Bank CEM, 2007)). A review of the Policy Framework for Economic Transformation in Rwanda
Rwanda has implemented a number of policies to shape its economic transformation agenda and these policies continue to evolve depending on changing needs of the economy. Rwanda’s vision is to build a knowledge-based economy and to become a private sector led middle income country by 2020. Rwanda’s ambitious programme for development is encapsulated in Vision 2020. The Economic Development and Poverty Reduction Strategy (EDPRS) is the mid-term framework to implement the Government’s long-term development agenda (Ministry of Finance and Economic Planning 2007).
The EDPRS is based on three pillars designed to accelerate economic growth and promote human development: 1. Sustainable growth for jobs and exports - investing in improving the climate for business
investment, thereby achieving private-sector growth. In the shorter term the priority is reinforcing the productive and export potential of the agricultural sector, but in the longer term the goal is to diversify the economy by promoting the non-farm sector.
2. Vision 2020 Umurenge is a pro-poor rural development and social protection programme. It aims to eliminate extreme poverty by 2020 through releasing the productive capacity of the very poor. It includes public works, credit packages and direct support and is implemented at village level using participatory methods;
3. Good economic governance is seen as a precondition for poverty reduction and development by creating a comparative advantage in ‘soft infrastructure’ (good governance and institutional arrangements important for private investors) thus compensating for Rwanda’s relatively poorly developed hard infrastructure and disadvantaged geographical location (Ministry of Finance and Economic Planning 2007).
Rwanda takes a developmental state approach with the key objective being sustainable economic growth and social development. The main aim of EDPRS was to overcome the key constraints to economic growth identified through a growth diagnostic and investment climate analysis by: systematically reducing the operating costs of business; investing in the private sector’s capacity to innovate; and, widening and strengthening the public sector. Government policy is to promote private
8
sector investment through good governance, a legal framework, promoting savings and the banking sector and investment in infrastructure, health and education including vocational training. The aim is to: create new jobs to absorb new entrants to the labour market and surplus labour created by the modernisation of farming; facilitate technology transfer; the transfer of skills to Rwandan; an increase in the production of goods and services for export; and, generally promote economic growth.
Public investment is targeted to induce substantial private sector investment and foster growth in agriculture, manufacturing and the service sector. Investment is targeted at developing skill and capacity for productive employment, improving the infrastructure, promoting science technology and innovation and strengthening the Financial Sector. Reforms to the ‘soft’ infrastructure for business and reducing business costs were seen as the first priority. Incentives for FDI including export processing zones and industrial parks were seen as an important element of the strategy. Partnership of FDIs with Rwandan companies was to be encouraged and stimulating domestic investment was also seen as integral element of the policy. Diversifying and increasing exports was also seen as central to the strategy and the Government has identified the main areas for export growth, beyond the strategic exports of tea, coffee, horticulture, hides and skins and minerals. These are tourism, mining services, business process outsourcing, silk textiles, fruit and vegetable processing and dairy processing (Ministry of Trade and Industry 2009). FDI was seen as bring a number of benefits beyond job creation including the investment of foreign capital, know-how and managerial skills and export promotion. FDI as well as local investment was to be encouraged in resource based manufacturing (e.g. tea and coffee), low technology products (e.g. footwear, textiles), high technology manufacturing (e.g. chemicals, ICT, pharmaceuticals) and services including tourism where there is seen to be a high potential for growth. The 2010 Development Driven Trade Policy Framework prepared by the United Nations Conference on Trade and Development and the Ministry of Trade and Industry (UNCTD 2010a) argues that the trade policy should be development-driven and not demand led. It suggests that investment, including FDI, should enable the diversification of exports and markets, build local processing industries that add value to exports especially in agriculture but also in manufacturing and services. Also investment should provide opportunities for employment in rural areas. It argues that tax reductions/exemptions in terms of tariffs should promote the inflow of industrial inputs and that consideration should be given to more strategically located export processing zones with more effective incentives provided. Generally it advocates making the financial regime effective and well administered. It recommends making financial incentives outcome based, targeted to development goals and designed to minimise the impact of taxation on companies ‘cash-flow’ (UNCTD 2006). Rwanda’s agricultural policy is embodied in Rwanda’s Strategic Plan to Transform (PSTA ) the agricultural sector and is now in its second phase. The policy is mainly concerned with the modernisation of the agricultural sector and commercialisation. The overall objective is to increase agricultural outputs and incomes under sustainable production systems for all groups of farmers and food security for all. The emphasis in increased output is on crops for export. There are four interrelated programs: intensification and development of sustainable production systems; support for the professionalization of producers; promotion of commodity chains and agribusiness development; and institutional development. This government policy seeks to modernise the agricultural sector and
9
promote the production of cash crops for export as part of the broader drive for economic growth and transformation. This may well bring benefits to the population in the medium and long term as all benefit from economic growth and increased prosperity. However, there seems to be no indication that this policy is pro-poor in the short term since small holder farmers may end up as working poor agricultural wage labourers.
Box 1: Costs of Economic Transformation: Improving the Pro-poor character of Rwanda’s Agricultural Policy.
Rwanda is a small country in central east Africa. It is one of the most densely populated countries in Africa and over 80 per cent of the population are dependent on subsistence agriculture. The size of landholdings is small with many being inadequate to support a household. Agricultural production is mainly rain fed and is vulnerable to shocks which in different part s of the country include drought and flooding. Soil fertility has deteriorated with over production and soil erosion is also a problem with land shortages forcing people to farm on steep hillsides. There is low use of fertiliser and improved seeds but the use of improved farming methods is increasing as a result of government policy.
Rwanda’s agricultural policy seeks to modernise the agricultural sector and promote the production of cash crops for export as part of the broader drive for economic growth and transformation. This may well bring benefits to the population in the medium term as all benefit from economic growth and increased prosperity. There seems, however, in the short term an indication that this policy is not pro- poor and that a pro poor policy would place more emphasis on increasing the production of staple crops for local consumption. Despite the fact that it increases land use efficiency, it also reduces the opportunity for subsistence farmers to grow food for their own consumption and leaves them vulnerable to crop failure and fluctuations in prices. A 2008 IFPRI scenario modelling exercise on Rwanda agricultural policy suggested that a pro-poor agricultural policy would concentrate on increasing the production of staples for consumption with more a modest growth of export crops. Increased production would come for the increased use of agricultural inputs and bringing into cultivation marshland. In addition, while the government is commended for commercialising farming and increasing productivity, it needs to have clear and realistic policies to absorb the estimated 35 per cent of the rural population who will become surplus to agricultural production in a bid to commercialise.
10
Historical context
a) Pre-genocide period
After independence, Rwanda received a significant amount of foreign aid in the intervening period. Foreign aid rose from 5% of GNP in 1973 to 22% in 1991 and accounted for more than three-quarters of capital expenditures. Aid-financed health care improved and infant mortality was reduced. Aid also financed reforestation and land reclamation, and agricultural productivity increased. High world prices for coffee, tea, and tin, the three core Rwandan export products, created rising wealth. Rwanda rose to 19th from the bottom among countries in terms of per capita income. However, real PPP-adjusted GDP per capita in Rwanda stagnated since 1980. The country still ranked below the sub-Saharan average in life expectancy, child survival, adult literacy, years in school, and nutrition. Access to safe drinking water had declined. Primary-school enrolment had fallen to 51% in 1992, and secondary schools only had capacity for 10% of primary-school graduates. In 1985, there was a collapse in the tin market, Rwanda’s second-largest foreign-exchange earner. There were famines in 1987, 1989–1990, 1991, and 1993. Coffee prices fell by 50% in 1989, with coffee exports declining from $144 million in 1985 to $30 million in 1993. Falling coffee prices weakened the government’s financial position. The budget deficit ballooned and remained at 7% or more of GDP through 1993. Real GDP fell by 10% between 1989 and 1993, and the percentage of income held by the top 10% rose from 10% in 1982 to 41% in 1992. Development aid continued to increase.
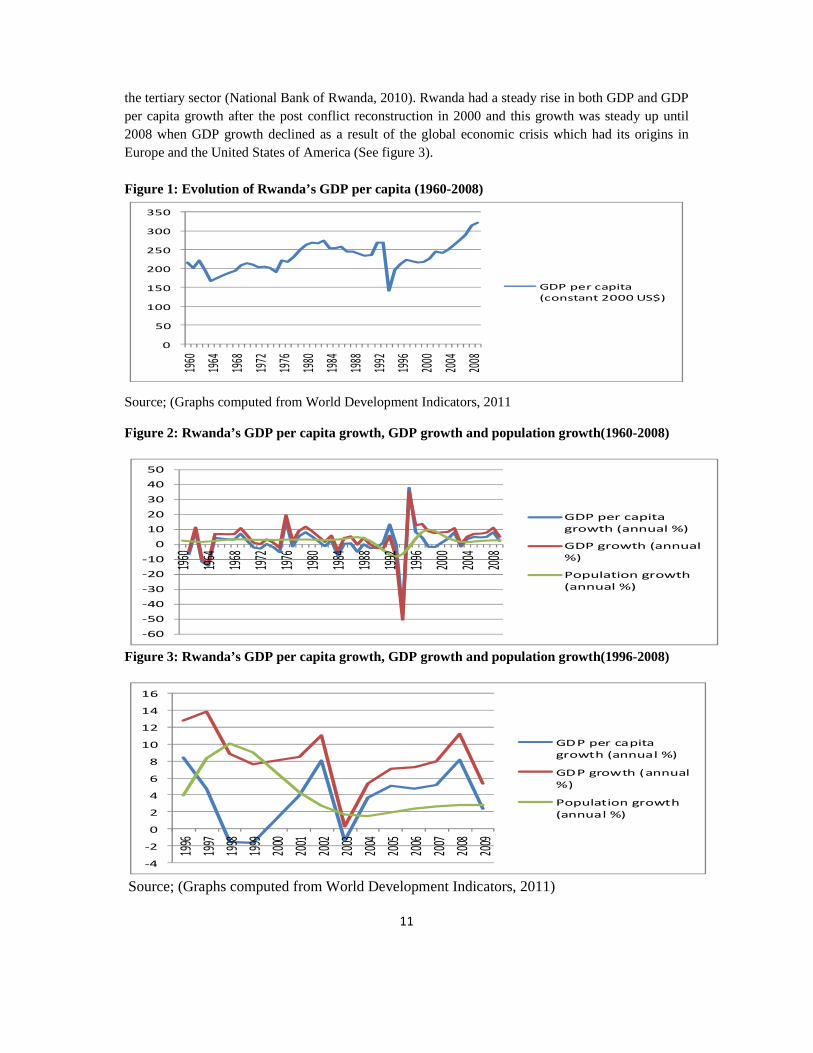
In 1990, the government undertook a structural adjustment program with the assistance of the International Monetary Fund (IMF) and the World Bank that brought $216 million in pledges of new aid. Despite strong domestic opposition, the currency was devalued, leading to sharp price increases. Social expenditures were slashed, and civil service wages were frozen. The promised aid was cancelled, with donors citing the government’s failure to meet conditions including the elimination of coffee price guarantees and reduction of the budget deficit to 5%. A modest per capita growth during the first two decades after independence came to an end around 1980. The early post-independence gains in development did not last as the economy fell into regression after 1980. Economic stagnation combined with high rates of population growth resulted in declining per capita GDP throughout the 1980s and 1990s (See figure 1). The rapid and prolonged economic decline contributed to, and finally culminated in the civil war in 1994. The conflict accentuated the decline and despite the sharp fall in the population due to the genocide, per capita production in 1994-1996 averaged only half of the level in 1980-82. Dramatic as the loss of population during the Genocide was, it had little long term impact on population growth. As a result of return migration of refugees and a sharp increase in birth rates, the population increased by 2.5 million or 45 per cent over a period of five years(See figure 2). b) Post-genocide period Rwanda has achieved remarkable economic growth since the genocide against the Tusti was brought to an end in 1994. Its GDP per capita has increased from less than 200US$ in 1994 following the Genocide against the Tutsis to 540 US$ in 2010(ADB 2010a). The average annual growth rated in GDP was 8.8 per cent between 2005 and 2009. The sectoral decomposition of GDP growth was as follows; 5.2 per cent for the primary sector, 9.3 per cent for the secondary sector and 11.6 per cent for
11
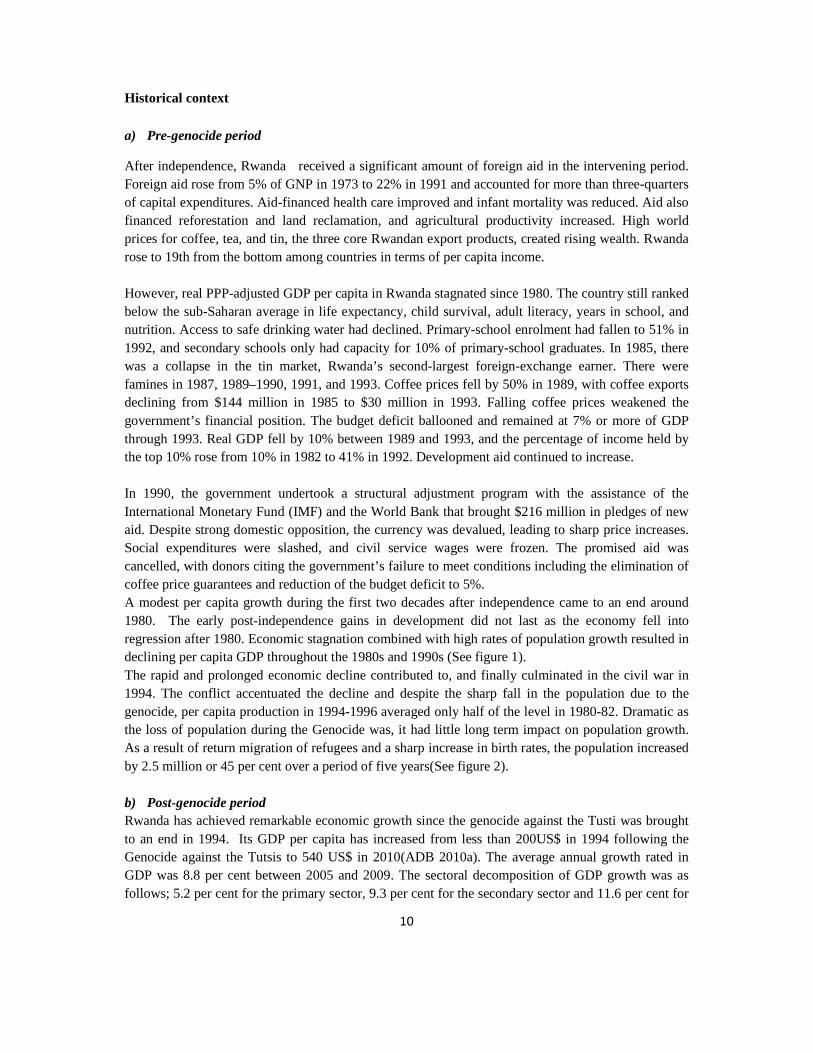
the tertiary sector (National Bank of Rwanda, 2010). Rwanda had a steady rise in both GDP and GDP per capita growth after the post conflict reconstruction in 2000 and this growth was steady up until 2008 when GDP growth declined as a result of the global economic crisis which had its origins in Europe and the United States of America (See figure 3). Figure 1: Evolution of Rwanda’s GDP per capita (1960-2008)
0
50
100
150
200
250
300
350
1960
1964
1968
1972
1976
1980
1984
1988
1992
1996
2000
2004
2008
GDP per capita
(constant 2000 US$)
Source; (Graphs computed from World Development Indicators, 2011
Figure 2: Rwanda’s GDP per capita growth, GDP growth and population growth(1960-2008)
-60
-50
-40
-30
-20
-10
0
10
20
30
40
50
1960
1964
1968
1972
1976
1980
1984
1988
1992
1996
2000
2004
2008
GDP per capita
growth (annual %)
GDP growth (annual
%)
Population growth
(annual %)
Figure 3: Rwanda’s GDP per capita growth, GDP growth and population growth(1996-2008)
-4
-2
0
2
4
6
8
10
12
14
16
1996
1997
1998
1999
2000
2001
2002
2003
2004
2005
2006
2007
2008
2009
GDP per capita
growth (annual %)
GDP growth (annual
%)
Population growth
(annual %)
Source; (Graphs computed from World Development Indicators, 2011)
12
II. Review of Performance on Economic Transformation
Rwanda’s Economic Policy Reforms, 1960-2008
From 1961 to 1990, Rwanda had an administered economy which imposed severe restrictions on trade and foreign exchange transactions, as well as fixed exchange rate regime (IMF, 2005). By the early 1990s the average tariff rate was 34.8 percent, with 5 different tariffs ranging from 0-60 percent. Every import and every importer was subject to a quota, and all import operations were subject to a license authorizing external currency disbursement (WTO, 2004). Exporters had to repatriate currency generated by the sale of exports as a legal requirement, and export licenses were authorized only by the Banque Nationale du Rwanda (BNR). More importantly, all export earnings were transferred to and managed by the BNR. Likewise, BNR had to give prior approval for certain invisible transactions including medical care, tourist trips and study abroad , with purchases of currencies from the BNR to finance these invisible transactions subject to ceilings.
The period from 1991 until 1994 corresponds to the beginning of the removal of restrictions on trade and foreign exchange transactions, and the gradual revival of a market economy.(See box 1 below)
Box 2: The Success of Rwanda’s Post-genocide Policy Reforms on Economic Transformation
In 1995,a number of economic reforms were implemented in Rwanda. Rwanda embraced a market economy characterized by both a continuation of trade reforms and a liberalization of the monetary and financial regimes. Tariffs were reduced considerably with the average rate decreasing to 18 percent, and there remained four tariff bands with a maximum of up to 30 percent by 2003 which a significant reform when compared with an average tariff rate of 34.8 percent, with 5 different tariffs ranging from 0-60 percent prior to 1994. Liberalization of the monetary and financial sector led to the adoption of new currency exchange regulations, the creation of new private commercial banks, and the privatization of banks that had been state-owned (Coulibaly, 2005).Current account operations (imports, exports, services) were liberalized, and some of the previous restrictions on capital flows were either reduced or eliminated. The latter included the transfer of capital and revenues related to foreign direct investment (FDI), and the allowance of free withdrawal from foreign exchange accounts in commercial banks (Kanimba, 2004). Flexible exchange rates were also introduced. During the period 1995 to 2003, the commitment of the government to trade, financial, and exchange reform was much more credible and stable. Prices began to reflect real cost and value, rather than the arbitrary levels established by the government. Economic resources could thus be allocated much more effectively as firms adjusted their productive capacities and subsequently improved the overall competitiveness of the Rwandese economy. At the same time Rwanda was the recipient of substantial humanitarian aid from the World Bank and other entities. Although diminishing returns to aid may exist over the long run, in the case of Rwanda the post-1994 aid has had a much greater, and long-lasting impact (Collier, 2004).
While this period covers the first phase of trade reforms, it was also characterized by macroeconomic and political crisis which finally culminated into the genocide against the Tutsi in Rwanda. The genocide led to the destruction of manpower, capital stock, and resources such as livestock, as well as a total absence of the state. In the process, much of the social capital was destroyed and a climate of uncertainty became prevalent. Due to the business destruction and uncertainty, the few businesses that did survive were reluctant to incur the sunk cost of capital expenditures made possible by the previous
13
wave of trade reforms. Many established businesses failed to adjust their productive capacities and suffered from the resulting inefficiencies.
Macro-economic Indicators
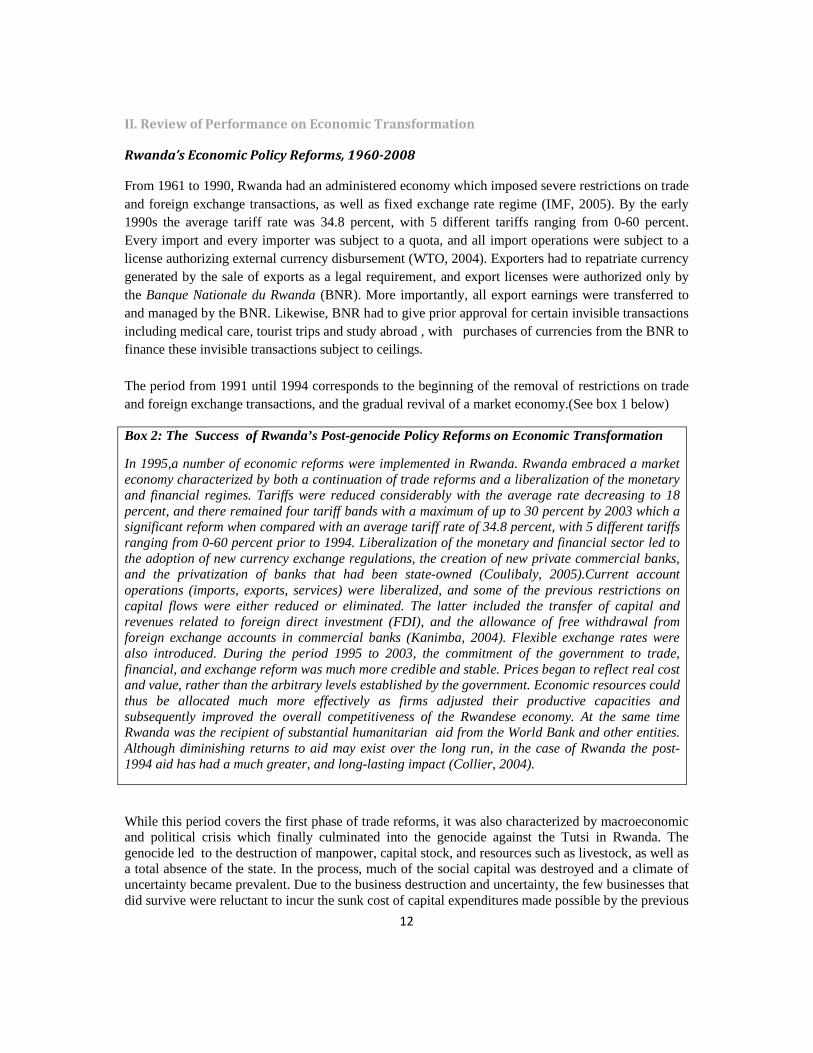
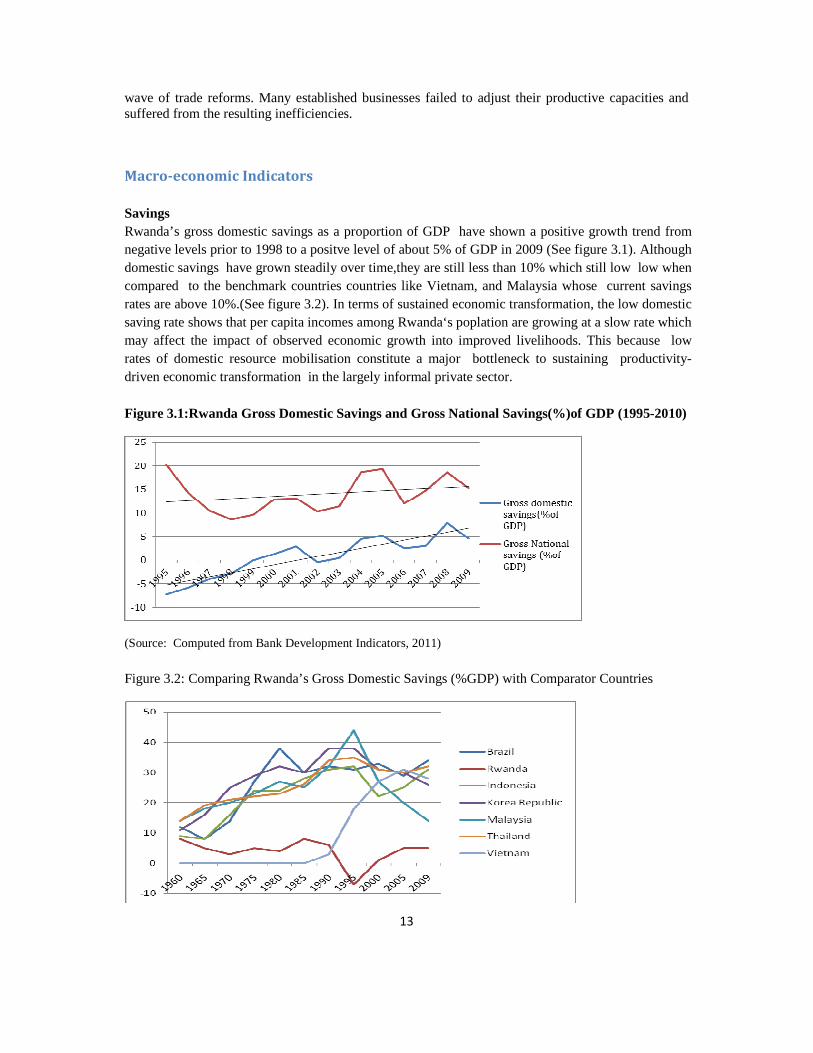
Savings Rwanda’s gross domestic savings as a proportion of GDP have shown a positive growth trend from negative levels prior to 1998 to a positve level of about 5% of GDP in 2009 (See figure 3.1). Although domestic savings have grown steadily over time,they are still less than 10% which still low low when compared to the benchmark countries countries like Vietnam, and Malaysia whose current savings rates are above 10%.(See figure 3.2). In terms of sustained economic transformation, the low domestic saving rate shows that per capita incomes among Rwanda‘s poplation are growing at a slow rate which may affect the impact of observed economic growth into improved livelihoods. This because low rates of domestic resource mobilisation constitute a major bottleneck to sustaining productivity-driven economic transformation in the largely informal private sector. Figure 3.1:Rwanda Gross Domestic Savings and Gross National Savings(%)of GDP (1995-2010)
(Source: Computed from Bank Development Indicators, 2011)
Figure 3.2: Comparing Rwanda’s Gross Domestic Savings (%GDP) with Comparator Countries
14
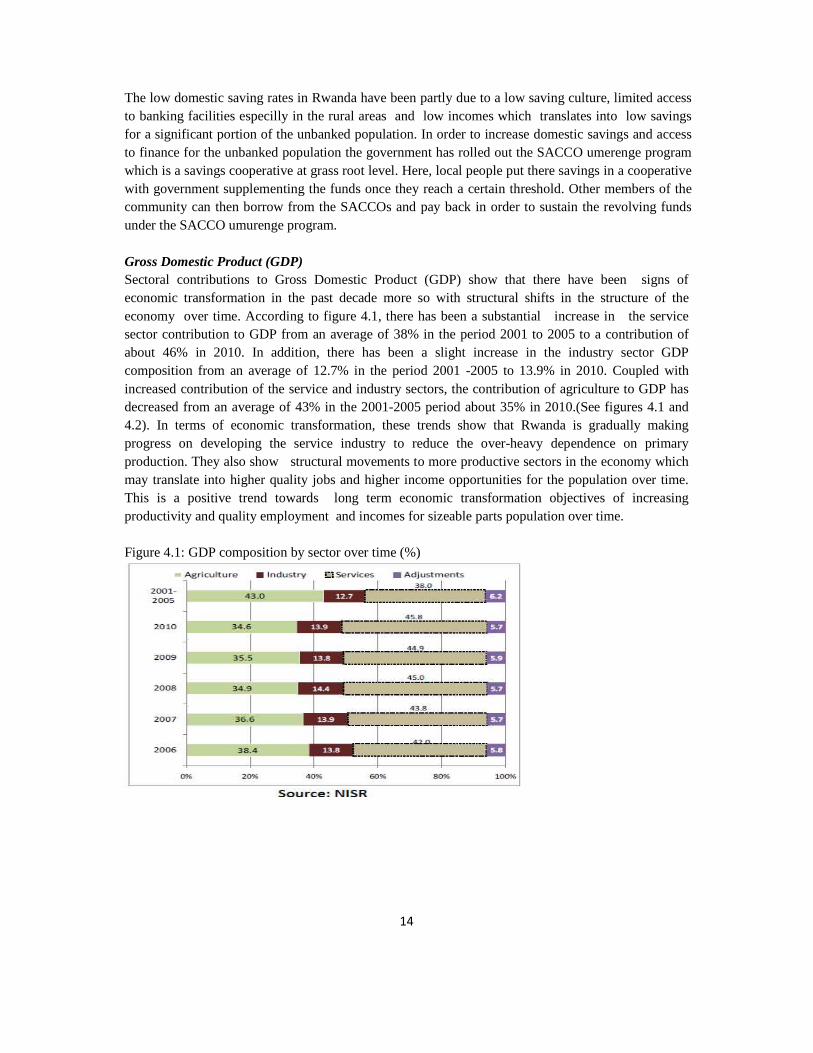
The low domestic saving rates in Rwanda have been partly due to a low saving culture, limited access to banking facilities especilly in the rural areas and low incomes which translates into low savings for a significant portion of the unbanked population. In order to increase domestic savings and access to finance for the unbanked population the government has rolled out the SACCO umerenge program which is a savings cooperative at grass root level. Here, local people put there savings in a cooperative with government supplementing the funds once they reach a certain threshold. Other members of the community can then borrow from the SACCOs and pay back in order to sustain the revolving funds under the SACCO umurenge program. Gross Domestic Product (GDP) Sectoral contributions to Gross Domestic Product (GDP) show that there have been signs of economic transformation in the past decade more so with structural shifts in the structure of the economy over time. According to figure 4.1, there has been a substantial increase in the service sector contribution to GDP from an average of 38% in the period 2001 to 2005 to a contribution of about 46% in 2010. In addition, there has been a slight increase in the industry sector GDP composition from an average of 12.7% in the period 2001 -2005 to 13.9% in 2010. Coupled with increased contribution of the service and industry sectors, the contribution of agriculture to GDP has decreased from an average of 43% in the 2001-2005 period about 35% in 2010.(See figures 4.1 and 4.2). In terms of economic transformation, these trends show that Rwanda is gradually making progress on developing the service industry to reduce the over-heavy dependence on primary production. They also show structural movements to more productive sectors in the economy which may translate into higher quality jobs and higher income opportunities for the population over time. This is a positive trend towards long term economic transformation objectives of increasing productivity and quality employment and incomes for sizeable parts population over time. Figure 4.1: GDP composition by sector over time (%)
15
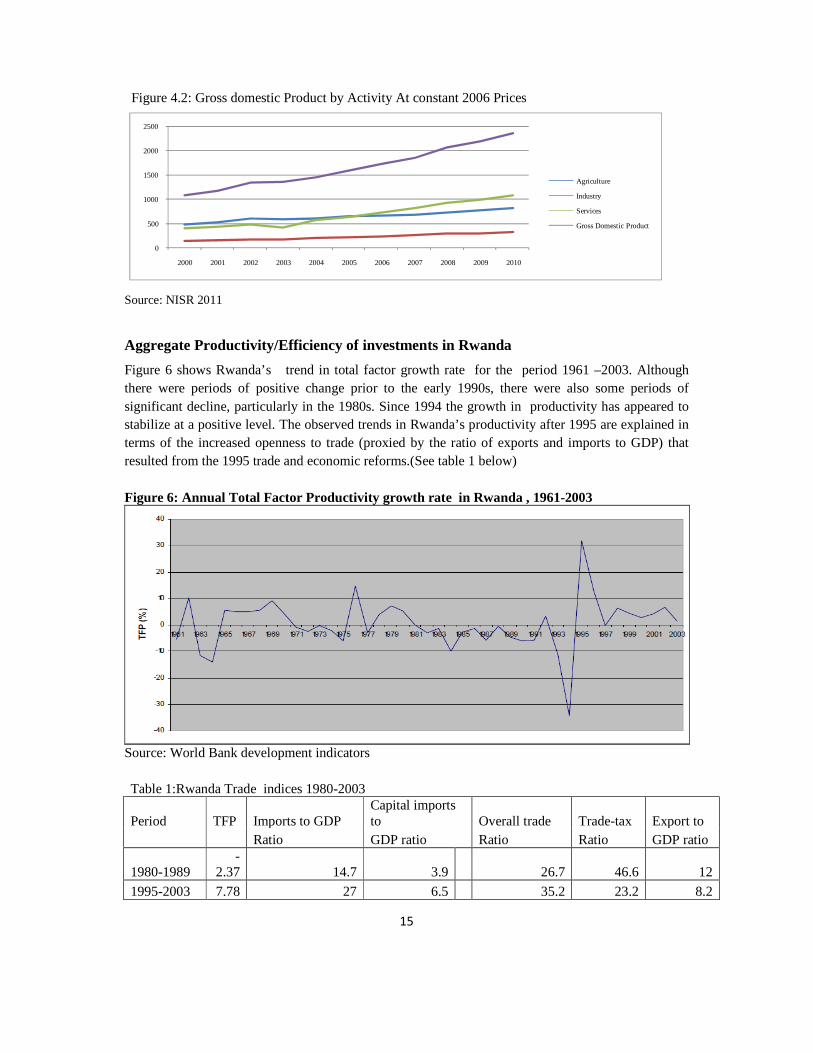
Figure 4.2: Gross domestic Product by Activity At constant 2006 Prices
0
500
1000
1500
2000
2500
2000 2001 2002 2003 2004 2005 2006 2007 2008 2009 2010
Agriculture
Industry
Services
Gross Domestic Product
Source: NISR 2011
Aggregate Productivity/Efficiency of investments in Rwanda
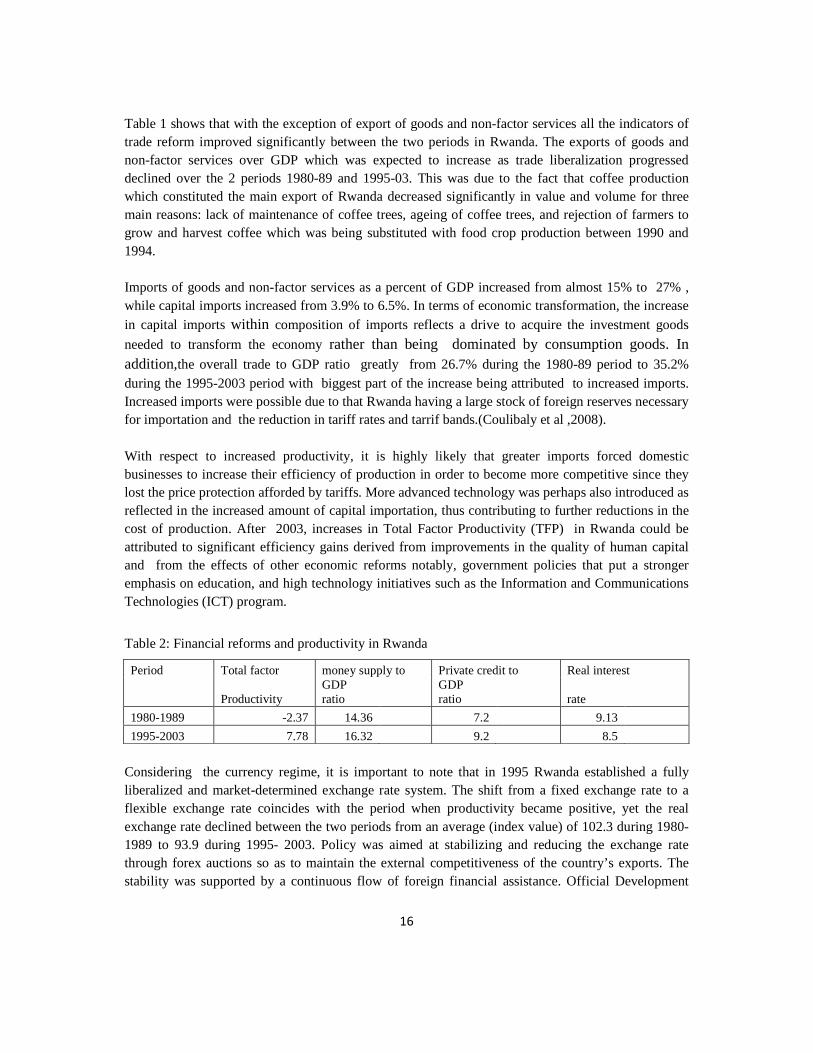
Figure 6 shows Rwanda’s trend in total factor growth rate for the period 1961 –2003. Although there were periods of positive change prior to the early 1990s, there were also some periods of significant decline, particularly in the 1980s. Since 1994 the growth in productivity has appeared to stabilize at a positive level. The observed trends in Rwanda’s productivity after 1995 are explained in terms of the increased openness to trade (proxied by the ratio of exports and imports to GDP) that resulted from the 1995 trade and economic reforms.(See table 1 below) Figure 6: Annual Total Factor Productivity growth r ate in Rwanda , 1961-2003
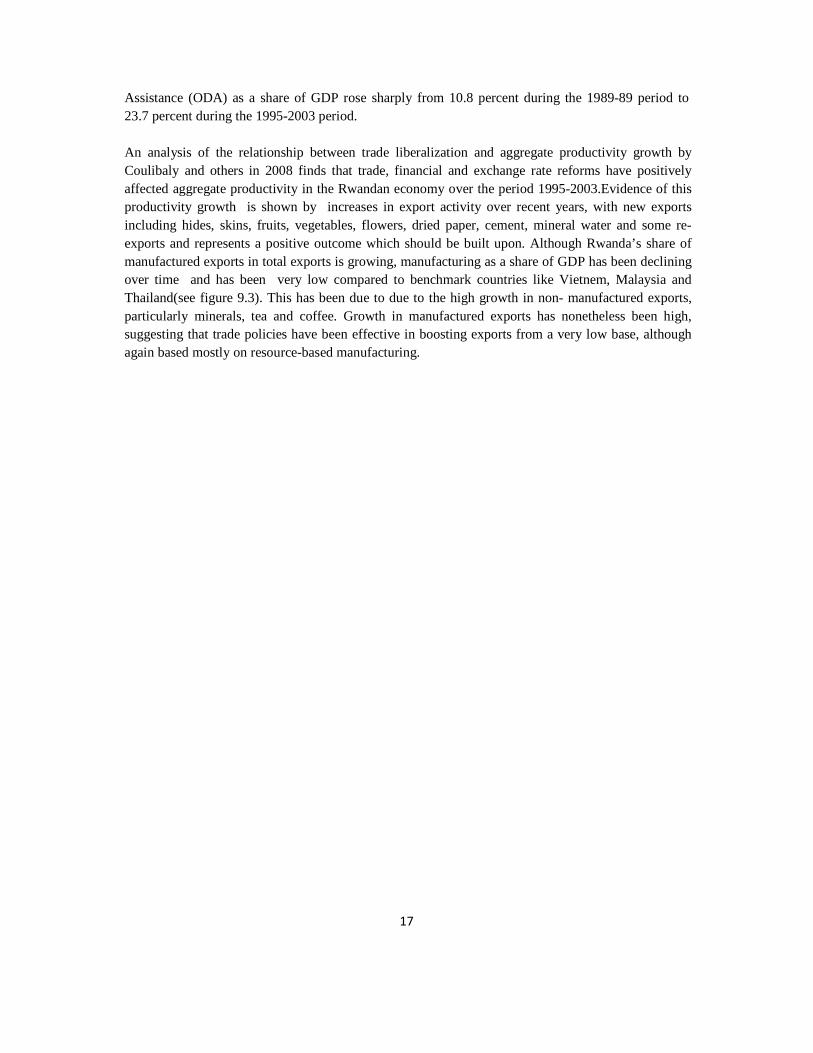
Source: World Bank development indicators Table 1:Rwanda Trade indices 1980-2003
Period TFP Imports to GDP Capital imports to Overall trade Trade-tax Export to
Ratio GDP ratio Ratio Ratio GDP ratio
1980-1989 -
2.37 14.7 3.9 26.7 46.6 12
1995-2003 7.78 27 6.5 35.2 23.2 8.2
16
Table 1 shows that with the exception of export of goods and non-factor services all the indicators of trade reform improved significantly between the two periods in Rwanda. The exports of goods and non-factor services over GDP which was expected to increase as trade liberalization progressed declined over the 2 periods 1980-89 and 1995-03. This was due to the fact that coffee production which constituted the main export of Rwanda decreased significantly in value and volume for three main reasons: lack of maintenance of coffee trees, ageing of coffee trees, and rejection of farmers to grow and harvest coffee which was being substituted with food crop production between 1990 and 1994. Imports of goods and non-factor services as a percent of GDP increased from almost 15% to 27% , while capital imports increased from 3.9% to 6.5%. In terms of economic transformation, the increase in capital imports within composition of imports reflects a drive to acquire the investment goods
needed to transform the economy rather than being dominated by consumption goods. In addition,the overall trade to GDP ratio greatly from 26.7% during the 1980-89 period to 35.2% during the 1995-2003 period with biggest part of the increase being attributed to increased imports. Increased imports were possible due to that Rwanda having a large stock of foreign reserves necessary for importation and the reduction in tariff rates and tarrif bands.(Coulibaly et al ,2008). With respect to increased productivity, it is highly likely that greater imports forced domestic businesses to increase their efficiency of production in order to become more competitive since they lost the price protection afforded by tariffs. More advanced technology was perhaps also introduced as reflected in the increased amount of capital importation, thus contributing to further reductions in the cost of production. After 2003, increases in Total Factor Productivity (TFP) in Rwanda could be attributed to significant efficiency gains derived from improvements in the quality of human capital and from the effects of other economic reforms notably, government policies that put a stronger emphasis on education, and high technology initiatives such as the Information and Communications Technologies (ICT) program.
Table 2: Financial reforms and productivity in Rwanda
Period Total factor money supply to Private credit to Real interest
Productivity GDP ratio
GDP ratio rate
1980-1989 -2.37 14.36 7.2 9.13
1995-2003 7.78 16.32 9.2 8.5
Considering the currency regime, it is important to note that in 1995 Rwanda established a fully liberalized and market-determined exchange rate system. The shift from a fixed exchange rate to a flexible exchange rate coincides with the period when productivity became positive, yet the real exchange rate declined between the two periods from an average (index value) of 102.3 during 1980-1989 to 93.9 during 1995- 2003. Policy was aimed at stabilizing and reducing the exchange rate through forex auctions so as to maintain the external competitiveness of the country’s exports. The stability was supported by a continuous flow of foreign financial assistance. Official Development
17
Assistance (ODA) as a share of GDP rose sharply from 10.8 percent during the 1989-89 period to 23.7 percent during the 1995-2003 period. An analysis of the relationship between trade liberalization and aggregate productivity growth by Coulibaly and others in 2008 finds that trade, financial and exchange rate reforms have positively affected aggregate productivity in the Rwandan economy over the period 1995-2003.Evidence of this productivity growth is shown by increases in export activity over recent years, with new exports including hides, skins, fruits, vegetables, flowers, dried paper, cement, mineral water and some re-exports and represents a positive outcome which should be built upon. Although Rwanda’s share of manufactured exports in total exports is growing, manufacturing as a share of GDP has been declining over time and has been very low compared to benchmark countries like Vietnem, Malaysia and Thailand(see figure 9.3). This has been due to due to the high growth in non- manufactured exports, particularly minerals, tea and coffee. Growth in manufactured exports has nonetheless been high, suggesting that trade policies have been effective in boosting exports from a very low base, although again based mostly on resource-based manufacturing.
18
2. Structure
Production
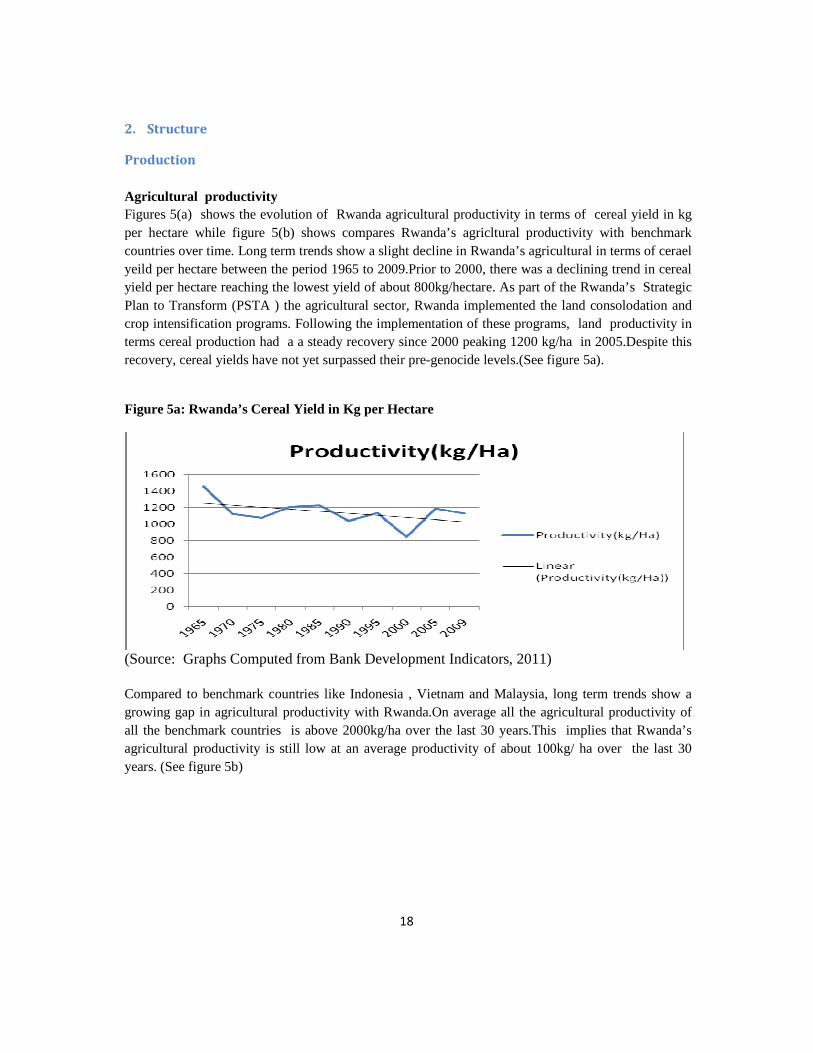
Agricultural productivity Figures 5(a) shows the evolution of Rwanda agricultural productivity in terms of cereal yield in kg per hectare while figure 5(b) shows compares Rwanda’s agricltural productivity with benchmark countries over time. Long term trends show a slight decline in Rwanda’s agricultural in terms of cerael yeild per hectare between the period 1965 to 2009.Prior to 2000, there was a declining trend in cereal yield per hectare reaching the lowest yield of about 800kg/hectare. As part of the Rwanda’s Strategic Plan to Transform (PSTA ) the agricultural sector, Rwanda implemented the land consolodation and crop intensification programs. Following the implementation of these programs, land productivity in terms cereal production had a a steady recovery since 2000 peaking 1200 kg/ha in 2005.Despite this recovery, cereal yields have not yet surpassed their pre-genocide levels.(See figure 5a).
Figure 5a: Rwanda’s Cereal Yield in Kg per Hectare
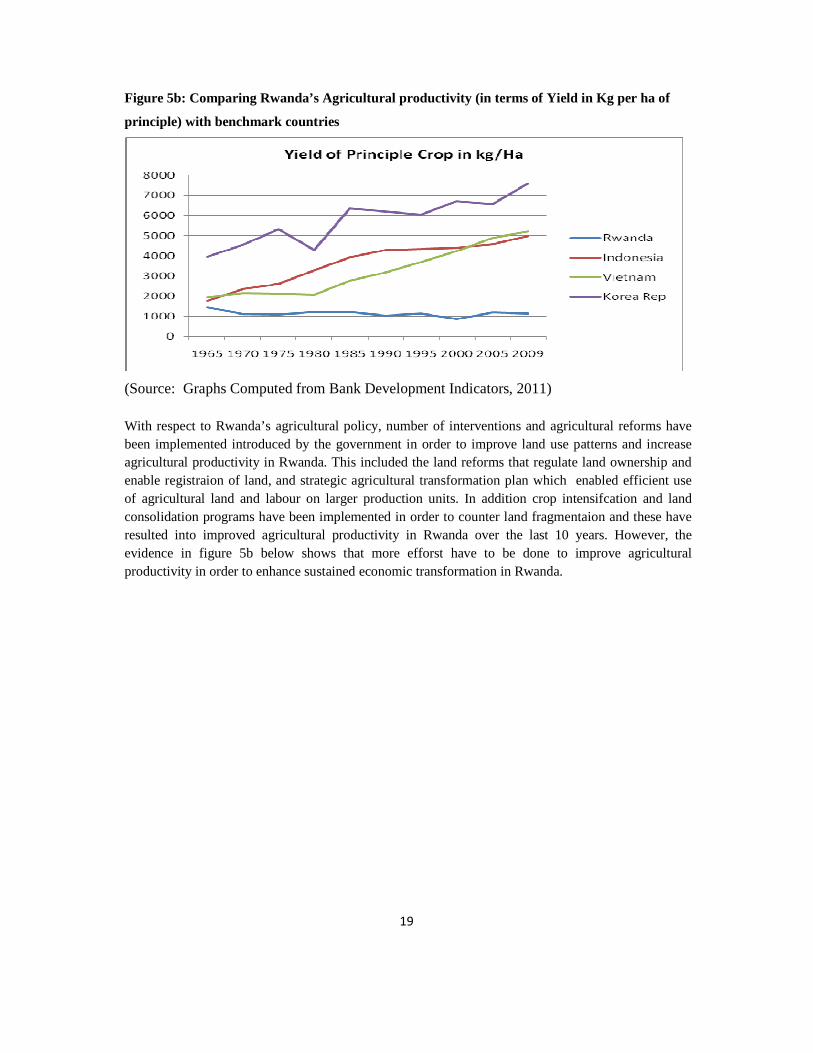
(Source: Graphs Computed from Bank Development Indicators, 2011) Compared to benchmark countries like Indonesia , Vietnam and Malaysia, long term trends show a growing gap in agricultural productivity with Rwanda.On average all the agricultural productivity of all the benchmark countries is above 2000kg/ha over the last 30 years.This implies that Rwanda’s agricultural productivity is still low at an average productivity of about 100kg/ ha over the last 30 years. (See figure 5b)
19
Figure 5b: Comparing Rwanda’s Agricultural producti vity (in terms of Yield in Kg per ha of
principle) with benchmark countries
(Source: Graphs Computed from Bank Development Indicators, 2011) With respect to Rwanda’s agricultural policy, number of interventions and agricultural reforms have been implemented introduced by the government in order to improve land use patterns and increase agricultural productivity in Rwanda. This included the land reforms that regulate land ownership and enable registraion of land, and strategic agricultural transformation plan which enabled efficient use of agricultural land and labour on larger production units. In addition crop intensifcation and land consolidation programs have been implemented in order to counter land fragmentaion and these have resulted into improved agricultural productivity in Rwanda over the last 10 years. However, the evidence in figure 5b below shows that more efforst have to be done to improve agricultural productivity in order to enhance sustained economic transformation in Rwanda.
20
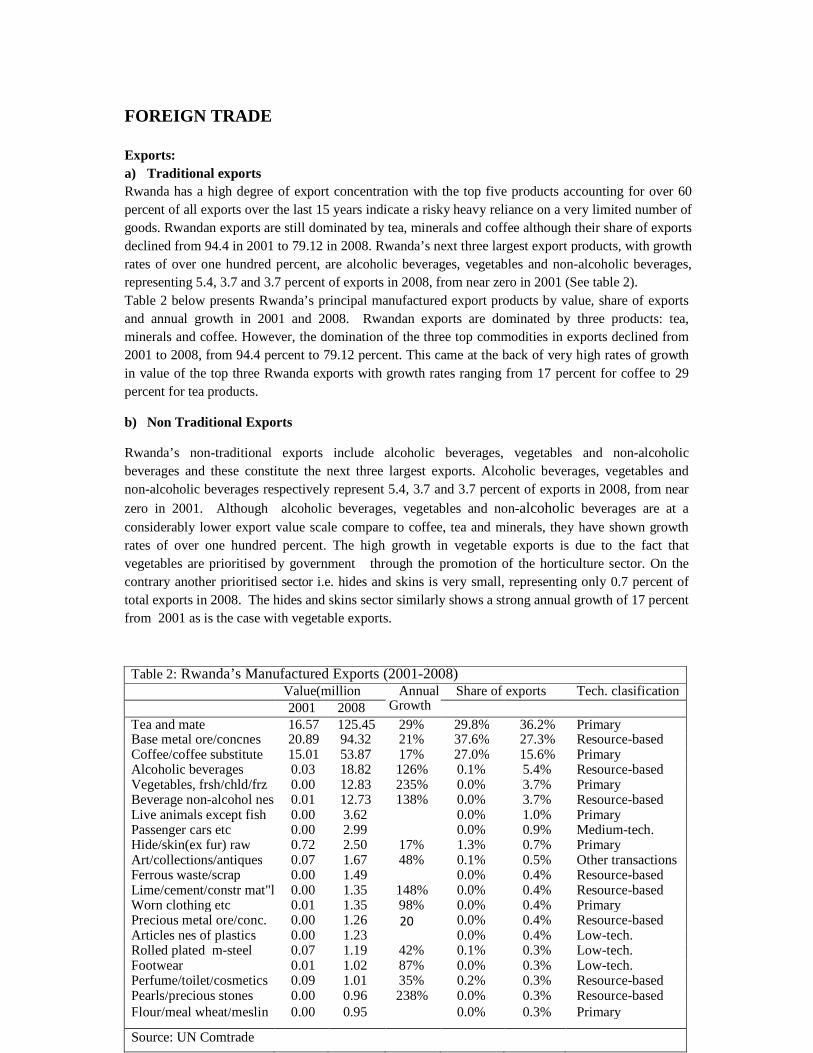
FOREIGN TRADE Exports: a) Traditional exports Rwanda has a high degree of export concentration with the top five products accounting for over 60 percent of all exports over the last 15 years indicate a risky heavy reliance on a very limited number of goods. Rwandan exports are still dominated by tea, minerals and coffee although their share of exports declined from 94.4 in 2001 to 79.12 in 2008. Rwanda’s next three largest export products, with growth rates of over one hundred percent, are alcoholic beverages, vegetables and non-alcoholic beverages, representing 5.4, 3.7 and 3.7 percent of exports in 2008, from near zero in 2001 (See table 2). Table 2 below presents Rwanda’s principal manufactured export products by value, share of exports and annual growth in 2001 and 2008. Rwandan exports are dominated by three products: tea, minerals and coffee. However, the domination of the three top commodities in exports declined from 2001 to 2008, from 94.4 percent to 79.12 percent. This came at the back of very high rates of growth in value of the top three Rwanda exports with growth rates ranging from 17 percent for coffee to 29 percent for tea products.
b) Non Traditional Exports
Rwanda’s non-traditional exports include alcoholic beverages, vegetables and non-alcoholic beverages and these constitute the next three largest exports. Alcoholic beverages, vegetables and non-alcoholic beverages respectively represent 5.4, 3.7 and 3.7 percent of exports in 2008, from near
zero in 2001. Although alcoholic beverages, vegetables and non-alcoholic beverages are at a considerably lower export value scale compare to coffee, tea and minerals, they have shown growth rates of over one hundred percent. The high growth in vegetable exports is due to the fact that vegetables are prioritised by government through the promotion of the horticulture sector. On the contrary another prioritised sector i.e. hides and skins is very small, representing only 0.7 percent of total exports in 2008. The hides and skins sector similarly shows a strong annual growth of 17 percent from 2001 as is the case with vegetable exports.
Table 2: Rwanda’s Manufactured Exports (2001-2008) Value(million
USD) Annual
Growth Share of exports Tech. clasification
2001 2008 Tea and mate 16.57 125.45 29% 29.8% 36.2% Primary Base metal ore/concnes 20.89 94.32 21% 37.6% 27.3% Resource-based Coffee/coffee substitute 15.01 53.87 17% 27.0% 15.6% Primary Alcoholic beverages 0.03 18.82 126% 0.1% 5.4% Resource-based Vegetables, frsh/chld/frz 0.00 12.83 235% 0.0% 3.7% Primary Beverage non-alcohol nes 0.01 12.73 138% 0.0% 3.7% Resource-based Live animals except fish 0.00 3.62 0.0% 1.0% Primary Passenger cars etc 0.00 2.99 0.0% 0.9% Medium-tech. Hide/skin(ex fur) raw 0.72 2.50 17% 1.3% 0.7% Primary Art/collections/antiques 0.07 1.67 48% 0.1% 0.5% Other transactions Ferrous waste/scrap 0.00 1.49 0.0% 0.4% Resource-based Lime/cement/constr mat"l 0.00 1.35 148% 0.0% 0.4% Resource-based Worn clothing etc 0.01 1.35 98% 0.0% 0.4% Primary Precious metal ore/conc. 0.00 1.26 0.0% 0.4% Resource-based Articles nes of plastics 0.00 1.23 0.0% 0.4% Low-tech. Rolled plated m-steel 0.07 1.19 42% 0.1% 0.3% Low-tech. Footwear 0.01 1.02 87% 0.0% 0.3% Low-tech. Perfume/toilet/cosmetics 0.09 1.01 35% 0.2% 0.3% Resource-based Pearls/precious stones 0.00 0.96 238% 0.0% 0.3% Resource-based Flour/meal wheat/meslin 0.00 0.95 0.0% 0.3% Primary
Source: UN Comtrade
21
Export Diversification in Rwanda
Table 3 belowshows the different measures of export diversification in Rwanda over the period 1970 to 2004 but represented as 5-years averages. The number of exported products worth over 10, 000US dollars increased four fold between 1970 and 2004.Despite the increase in the number of exported products, shares of the top 5, 10 and 20 products remained closer to 100 percent over the period pre-genocide period (1970- 1994) and only started decreasing due to reforms taken after the 1994. In addition, the Herfindahl index, which is a measure of concentation of the dfiferent industrail sectors in Rwanda’s exports showed a dramatic decline from 0.6 in 1990 to 0.35 in 2004. Although still high, the drastic reduction of the Herfindhal index shows a tendency towards greater export diversification in Rwanda during the post genocide period.
Table 3: Different measures of export diversification in Rwanda (1980 to 2004)
Year No. of products exported
Avg Herfindhal Share of top
Share of top 10 Share of top 20
(>10,000USD) index-5years 5 products products products 1970 11 0.5 0.97 0.99 1 1975 21 0.43 0.97 0.99 1 1980 27 0.57 0.98 1 1 1985 41 0.59 0.96 0.99 1 1990 37 0.6 0.95 0.99 1 1995 42 0.49 0.9 0.96 0.98 2000 51 0.45 0.91 0.95 0.97 2004 46 0.35 0.94 0.96 0.99
Source: Staff estimates, COMTRADE SITC1
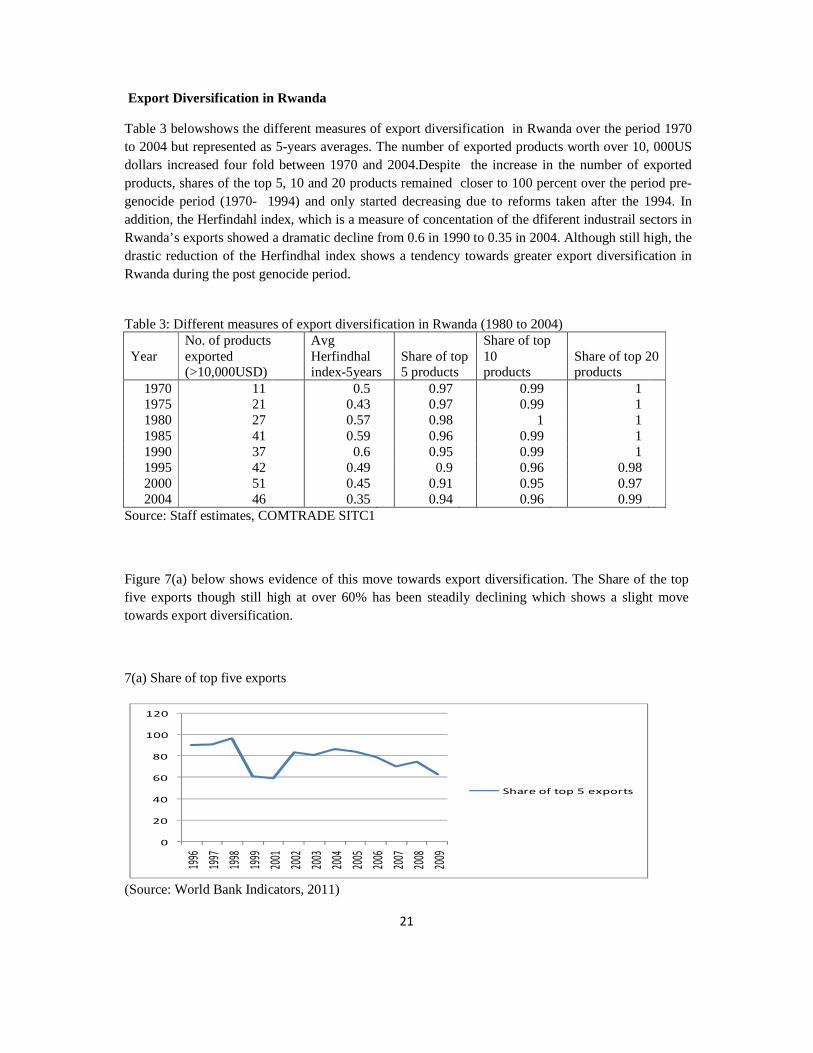
Figure 7(a) below shows evidence of this move towards export diversification. The Share of the top five exports though still high at over 60% has been steadily declining which shows a slight move towards export diversification.
7(a) Share of top five exports
0
20
40
60
80
100
120
1996
1997
1998
1999
2001
2002
2003
2004
2005
2006
2007
2008
2009
Share of top 5 exports
(Source: World Bank Indicators, 2011)
22
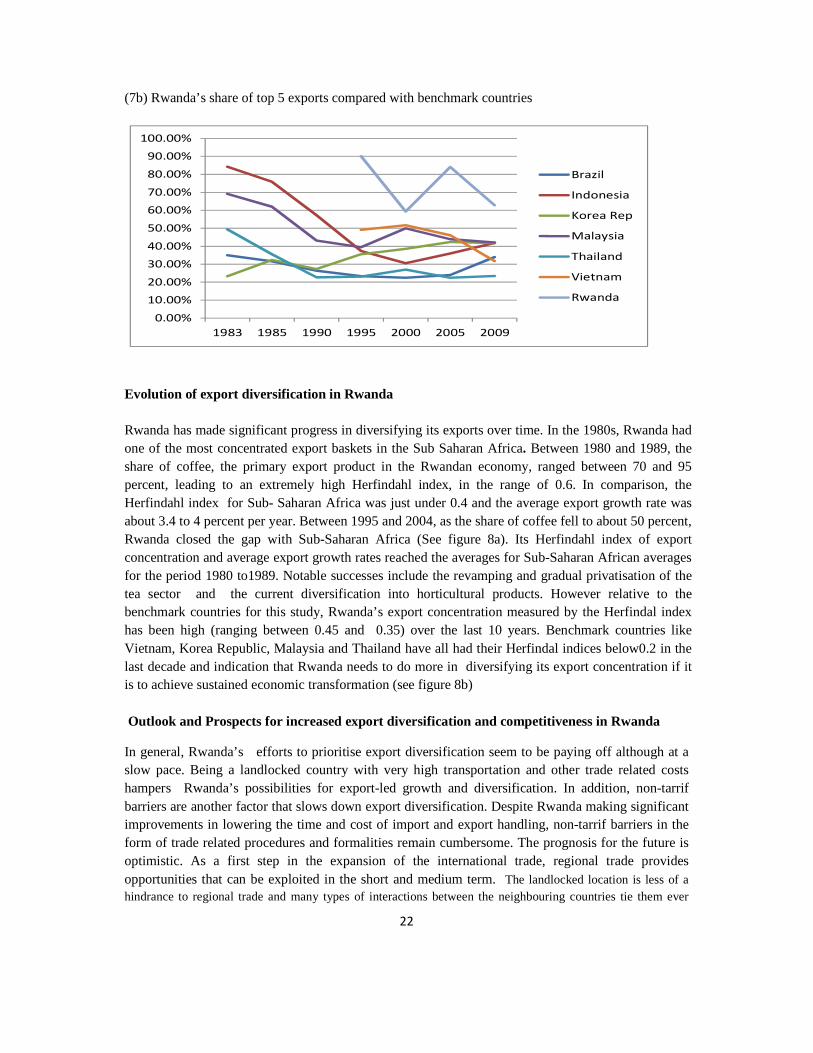
(7b) Rwanda’s share of top 5 exports compared with benchmark countries
0.00%
10.00%
20.00%
30.00%
40.00%
50.00%
60.00%
70.00%
80.00%
90.00%
100.00%
1983 1985 1990 1995 2000 2005 2009
Brazil
Indonesia
Korea Rep
Malaysia
Thailand
Vietnam
Rwanda
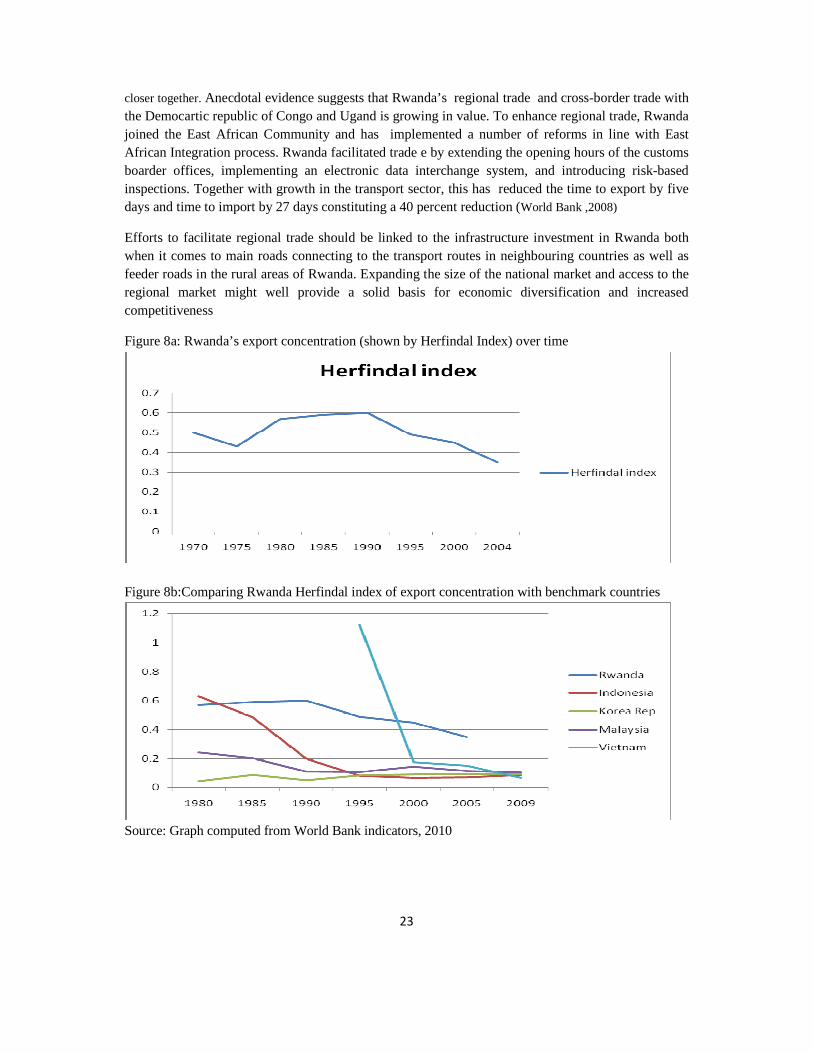
Evolution of export diversification in Rwanda Rwanda has made significant progress in diversifying its exports over time. In the 1980s, Rwanda had one of the most concentrated export baskets in the Sub Saharan Africa. Between 1980 and 1989, the share of coffee, the primary export product in the Rwandan economy, ranged between 70 and 95 percent, leading to an extremely high Herfindahl index, in the range of 0.6. In comparison, the Herfindahl index for Sub- Saharan Africa was just under 0.4 and the average export growth rate was about 3.4 to 4 percent per year. Between 1995 and 2004, as the share of coffee fell to about 50 percent, Rwanda closed the gap with Sub-Saharan Africa (See figure 8a). Its Herfindahl index of export concentration and average export growth rates reached the averages for Sub-Saharan African averages for the period 1980 to1989. Notable successes include the revamping and gradual privatisation of the tea sector and the current diversification into horticultural products. However relative to the benchmark countries for this study, Rwanda’s export concentration measured by the Herfindal index has been high (ranging between 0.45 and 0.35) over the last 10 years. Benchmark countries like Vietnam, Korea Republic, Malaysia and Thailand have all had their Herfindal indices below0.2 in the last decade and indication that Rwanda needs to do more in diversifying its export concentration if it is to achieve sustained economic transformation (see figure 8b) Outlook and Prospects for increased export diversification and competitiveness in Rwanda
In general, Rwanda’s efforts to prioritise export diversification seem to be paying off although at a slow pace. Being a landlocked country with very high transportation and other trade related costs hampers Rwanda’s possibilities for export-led growth and diversification. In addition, non-tarrif barriers are another factor that slows down export diversification. Despite Rwanda making significant improvements in lowering the time and cost of import and export handling, non-tarrif barriers in the form of trade related procedures and formalities remain cumbersome. The prognosis for the future is optimistic. As a first step in the expansion of the international trade, regional trade provides opportunities that can be exploited in the short and medium term. The landlocked location is less of a hindrance to regional trade and many types of interactions between the neighbouring countries tie them ever
23
closer together. Anecdotal evidence suggests that Rwanda’s regional trade and cross-border trade with the Democartic republic of Congo and Ugand is growing in value. To enhance regional trade, Rwanda joined the East African Community and has implemented a number of reforms in line with East African Integration process. Rwanda facilitated trade e by extending the opening hours of the customs boarder offices, implementing an electronic data interchange system, and introducing risk-based inspections. Together with growth in the transport sector, this has reduced the time to export by five days and time to import by 27 days constituting a 40 percent reduction (World Bank ,2008)
Efforts to facilitate regional trade should be linked to the infrastructure investment in Rwanda both when it comes to main roads connecting to the transport routes in neighbouring countries as well as feeder roads in the rural areas of Rwanda. Expanding the size of the national market and access to the regional market might well provide a solid basis for economic diversification and increased competitiveness
Figure 8a: Rwanda’s export concentration (shown by Herfindal Index) over time
Figure 8b:Comparing Rwanda Herfindal index of export concentration with benchmark countries
Source: Graph computed from World Bank indicators, 2010
24
Export Markets for Rwanda
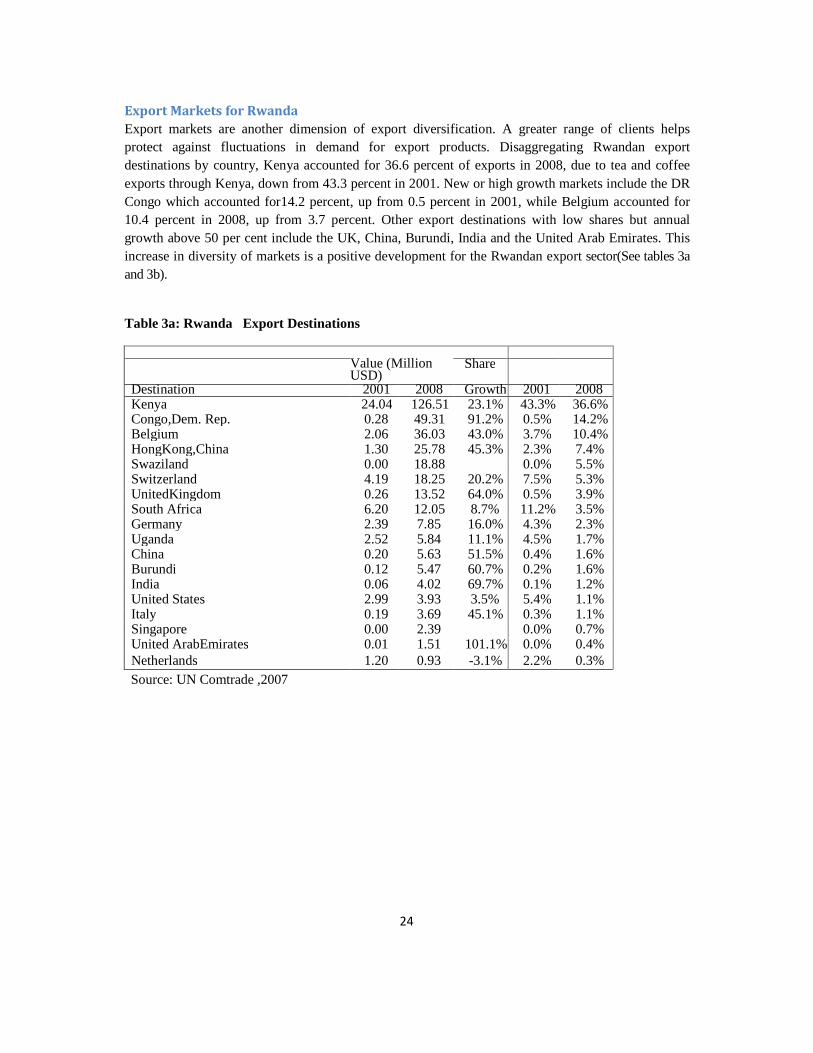
Export markets are another dimension of export diversification. A greater range of clients helps protect against fluctuations in demand for export products. Disaggregating Rwandan export destinations by country, Kenya accounted for 36.6 percent of exports in 2008, due to tea and coffee exports through Kenya, down from 43.3 percent in 2001. New or high growth markets include the DR Congo which accounted for14.2 percent, up from 0.5 percent in 2001, while Belgium accounted for 10.4 percent in 2008, up from 3.7 percent. Other export destinations with low shares but annual growth above 50 per cent include the UK, China, Burundi, India and the United Arab Emirates. This increase in diversity of markets is a positive development for the Rwandan export sector(See tables 3a and 3b).
Table 3a: Rwanda Export Destinations
Value (Million USD)
Share
Destination 2001 2008 Growth 2001 2008 Kenya 24.04 126.51 23.1% 43.3% 36.6% Congo,Dem. Rep. 0.28 49.31 91.2% 0.5% 14.2% Belgium 2.06 36.03 43.0% 3.7% 10.4% HongKong,China 1.30 25.78 45.3% 2.3% 7.4% Swaziland 0.00 18.88 0.0% 5.5% Switzerland 4.19 18.25 20.2% 7.5% 5.3% UnitedKingdom 0.26 13.52 64.0% 0.5% 3.9% South Africa 6.20 12.05 8.7% 11.2% 3.5% Germany 2.39 7.85 16.0% 4.3% 2.3% Uganda 2.52 5.84 11.1% 4.5% 1.7% China 0.20 5.63 51.5% 0.4% 1.6% Burundi 0.12 5.47 60.7% 0.2% 1.6% India 0.06 4.02 69.7% 0.1% 1.2% United States 2.99 3.93 3.5% 5.4% 1.1% Italy 0.19 3.69 45.1% 0.3% 1.1% Singapore 0.00 2.39 0.0% 0.7% United ArabEmirates 0.01 1.51 101.1% 0.0% 0.4% Netherlands 1.20 0.93 -3.1% 2.2% 0.3% Source: UN Comtrade ,2007
25
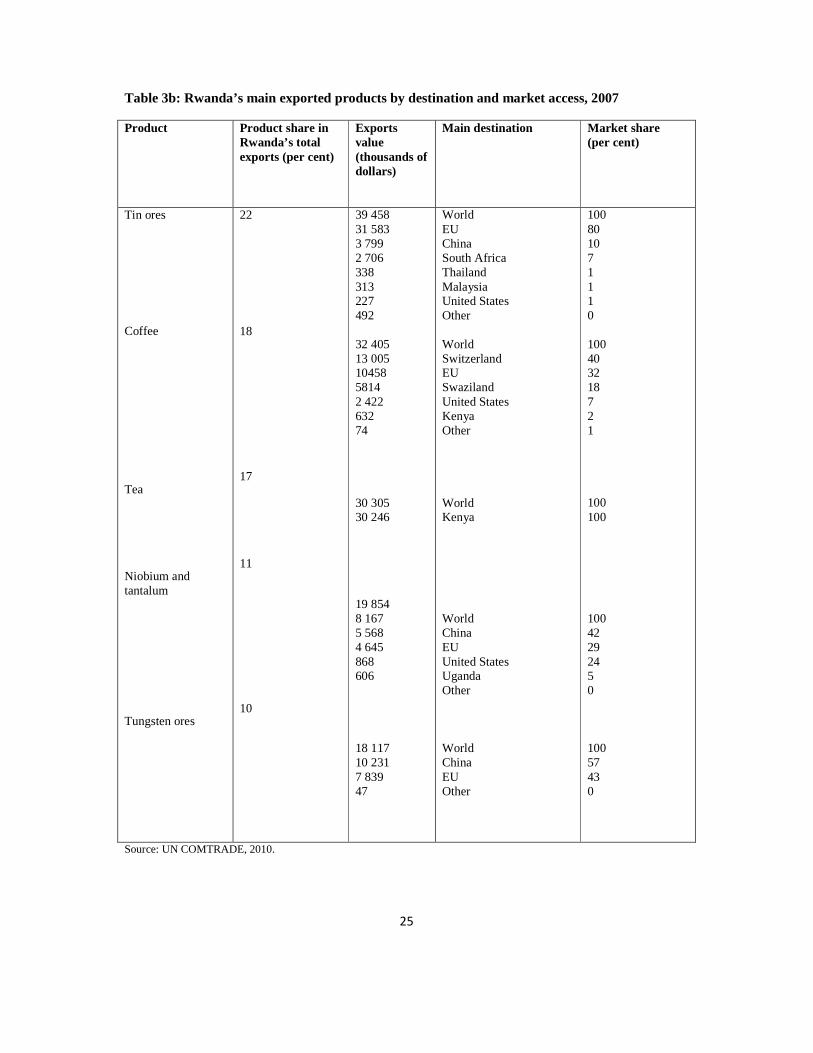
Table 3b: Rwanda’s main exported products by destination and market access, 2007 Product
Product share in Rwanda’s total exports (per cent)
Exports value (thousands of dollars)
Main destination
Market share (per cent)
Tin ores
Coffee Tea
Niobium and tantalum
Tungsten ores
22
18
17
11
10
39 458 31 583 3 799 2 706 338 313 227 492 32 405 13 005 10458 5814 2 422 632 74
30 305 30 246
19 854 8 167 5 568 4 645 868 606
18 117 10 231 7 839 47
World EU China South Africa Thailand Malaysia United States Other World Switzerland EU Swaziland United States Kenya Other
World Kenya
World China EU United States Uganda Other
World China EU Other
100 80 10 7 1 1 1 0 100 40 32 18 7 2 1
100 100
100 42 29 24 5 0
100 57 43 0
Source: UN COMTRADE, 2010.
26
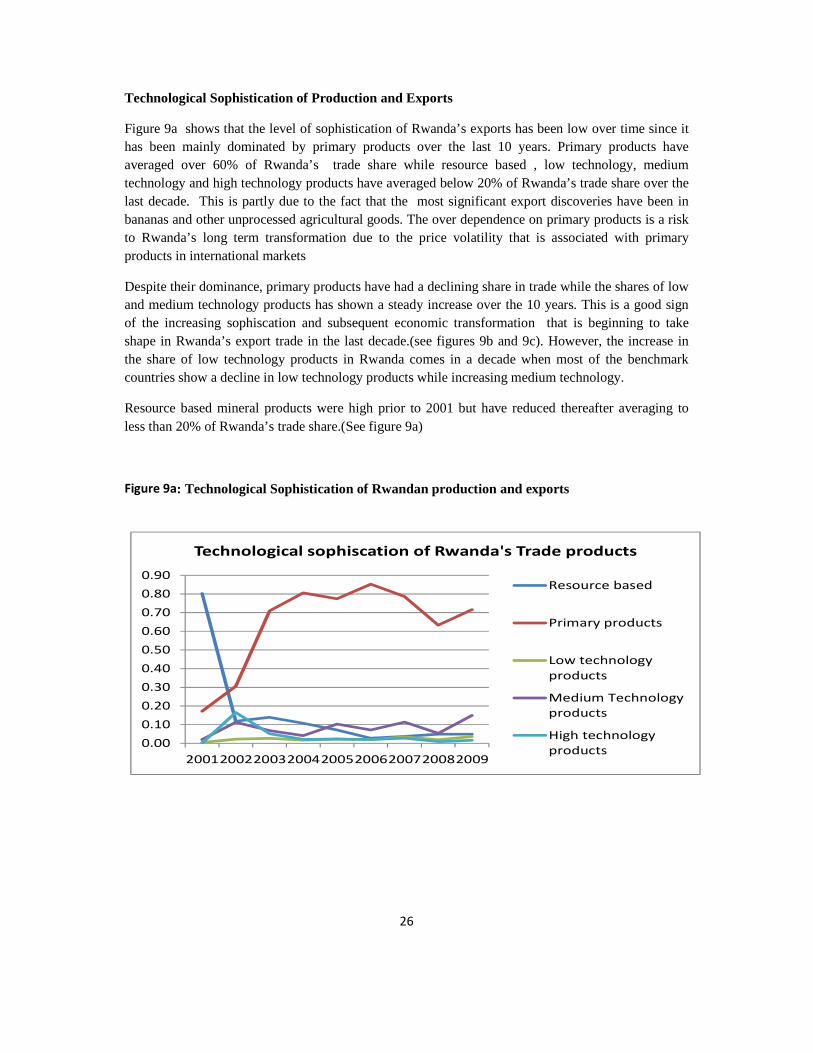
Technological Sophistication of Production and Exports
Figure 9a shows that the level of sophistication of Rwanda’s exports has been low over time since it has been mainly dominated by primary products over the last 10 years. Primary products have averaged over 60% of Rwanda’s trade share while resource based , low technology, medium technology and high technology products have averaged below 20% of Rwanda’s trade share over the last decade. This is partly due to the fact that the most significant export discoveries have been in bananas and other unprocessed agricultural goods. The over dependence on primary products is a risk to Rwanda’s long term transformation due to the price volatility that is associated with primary products in international markets
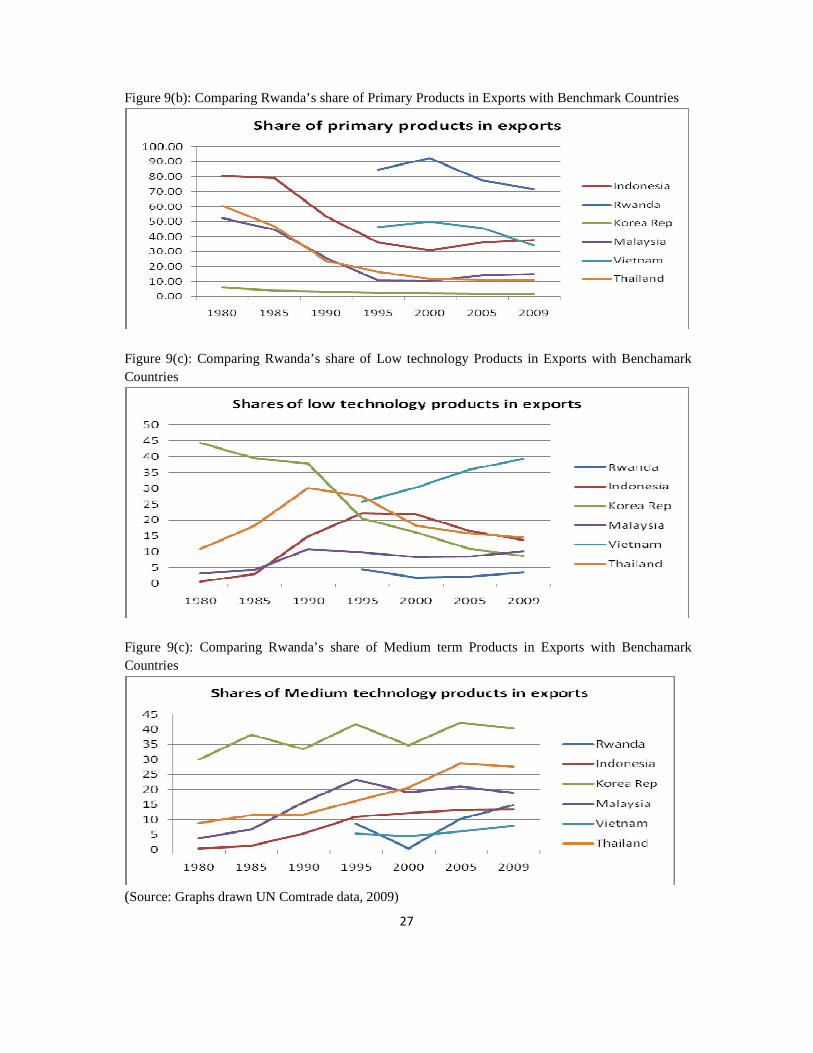
Despite their dominance, primary products have had a declining share in trade while the shares of low and medium technology products has shown a steady increase over the 10 years. This is a good sign of the increasing sophiscation and subsequent economic transformation that is beginning to take shape in Rwanda’s export trade in the last decade.(see figures 9b and 9c). However, the increase in the share of low technology products in Rwanda comes in a decade when most of the benchmark countries show a decline in low technology products while increasing medium technology.
Resource based mineral products were high prior to 2001 but have reduced thereafter averaging to less than 20% of Rwanda’s trade share.(See figure 9a)
Figure 9a: Technological Sophistication of Rwandan production and exports
0.00
0.10
0.20
0.30
0.40
0.50
0.60
0.70
0.80
0.90
200120022003200420052006200720082009
Technological sophiscation of Rwanda's Trade products
Resource based
Primary products
Low technology
products
Medium Technology
products
High technology
products
27
Figure 9(b): Comparing Rwanda’s share of Primary Products in Exports with Benchmark Countries
Figure 9(c): Comparing Rwanda’s share of Low technology Products in Exports with Benchamark Countries
Figure 9(c): Comparing Rwanda’s share of Medium term Products in Exports with Benchamark Countries
(Source: Graphs drawn UN Comtrade data, 2009)
28
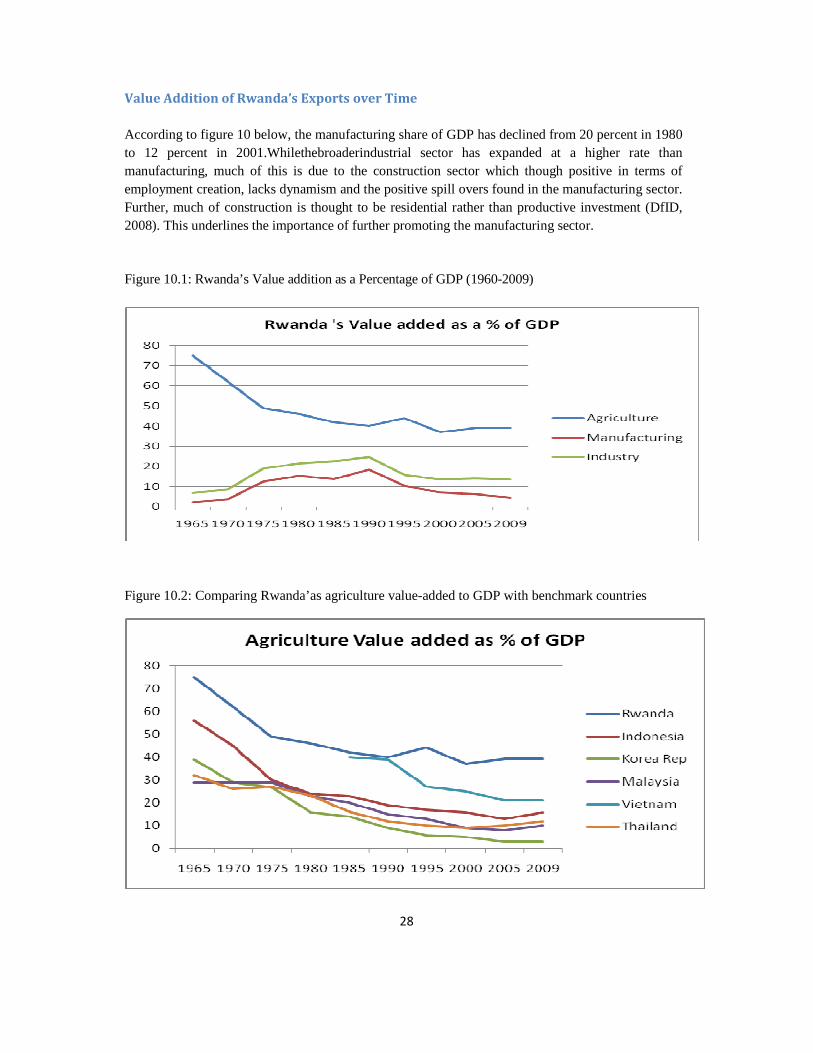
Value Addition of Rwanda’s Exports over Time
According to figure 10 below, the manufacturing share of GDP has declined from 20 percent in 1980 to 12 percent in 2001.Whilethebroaderindustrial sector has expanded at a higher rate than manufacturing, much of this is due to the construction sector which though positive in terms of employment creation, lacks dynamism and the positive spill overs found in the manufacturing sector. Further, much of construction is thought to be residential rather than productive investment (DfID, 2008). This underlines the importance of further promoting the manufacturing sector.
Figure 10.1: Rwanda’s Value addition as a Percentage of GDP (1960-2009)
Figure 10.2: Comparing Rwanda’as agriculture value-added to GDP with benchmark countries
29
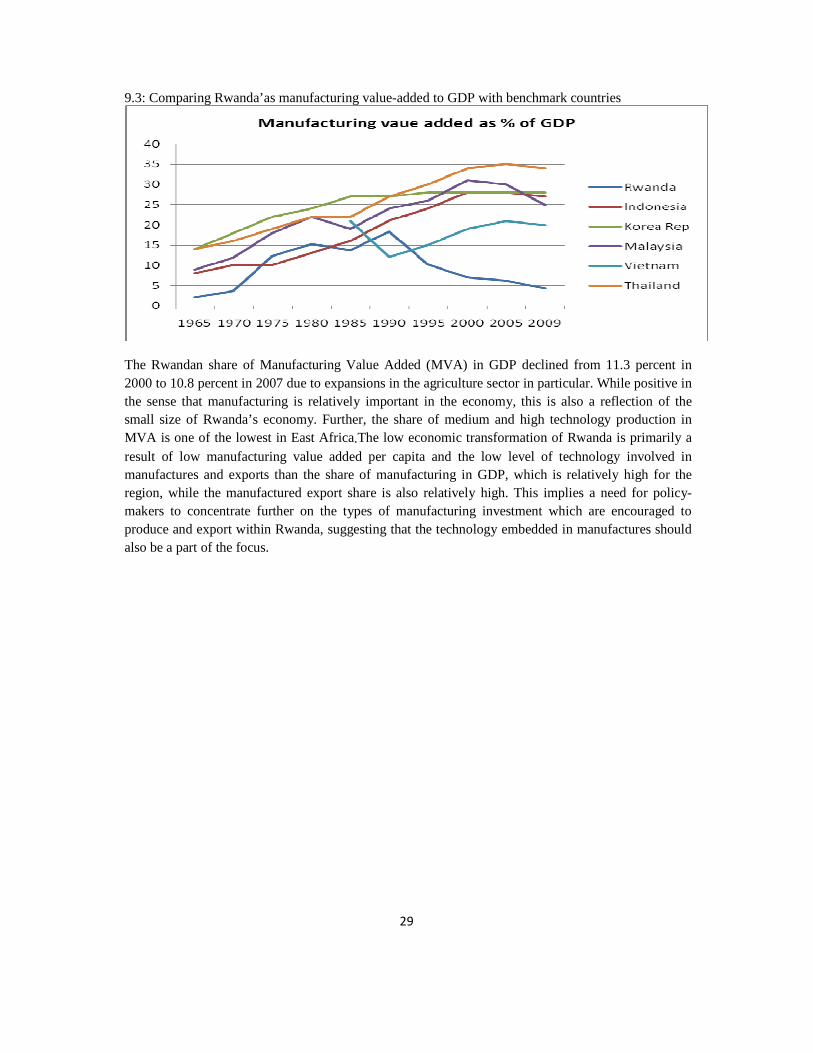
9.3: Comparing Rwanda’as manufacturing value-added to GDP with benchmark countries
The Rwandan share of Manufacturing Value Added (MVA) in GDP declined from 11.3 percent in 2000 to 10.8 percent in 2007 due to expansions in the agriculture sector in particular. While positive in the sense that manufacturing is relatively important in the economy, this is also a reflection of the small size of Rwanda’s economy. Further, the share of medium and high technology production in MVA is one of the lowest in East Africa.The low economic transformation of Rwanda is primarily a result of low manufacturing value added per capita and the low level of technology involved in manufactures and exports than the share of manufacturing in GDP, which is relatively high for the region, while the manufactured export share is also relatively high. This implies a need for policy-makers to concentrate further on the types of manufacturing investment which are encouraged to produce and export within Rwanda, suggesting that the technology embedded in manufactures should also be a part of the focus.
30
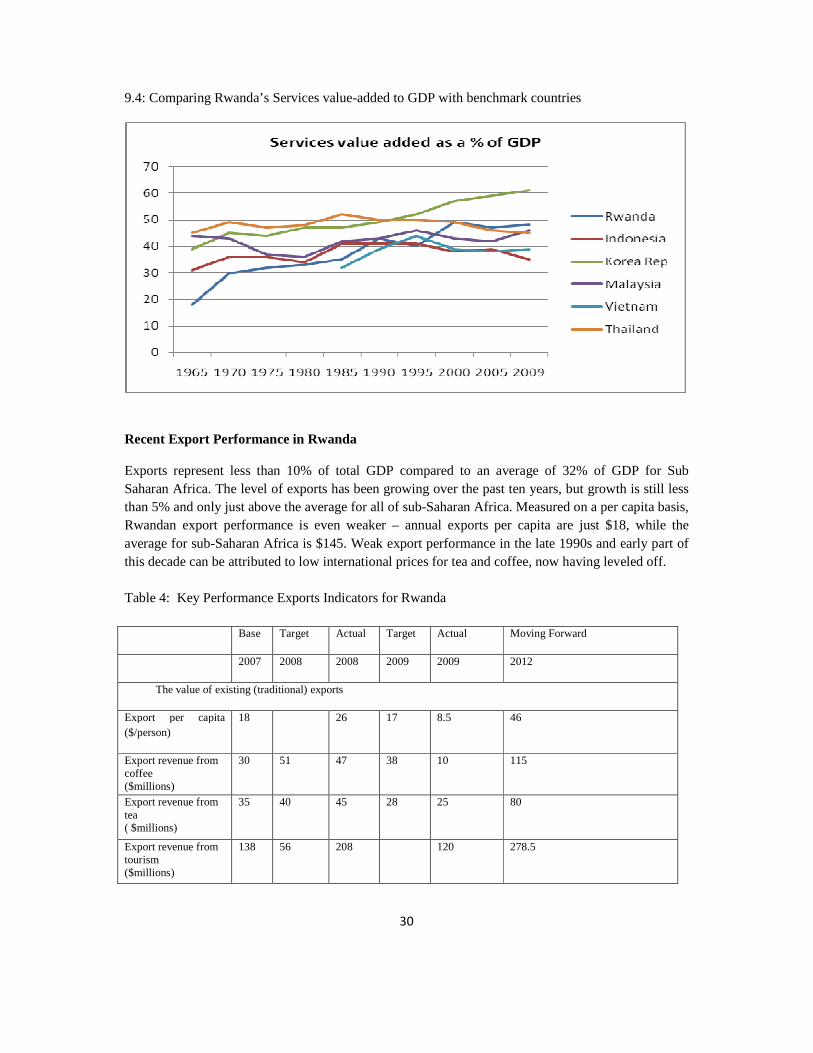
9.4: Comparing Rwanda’s Services value-added to GDP with benchmark countries
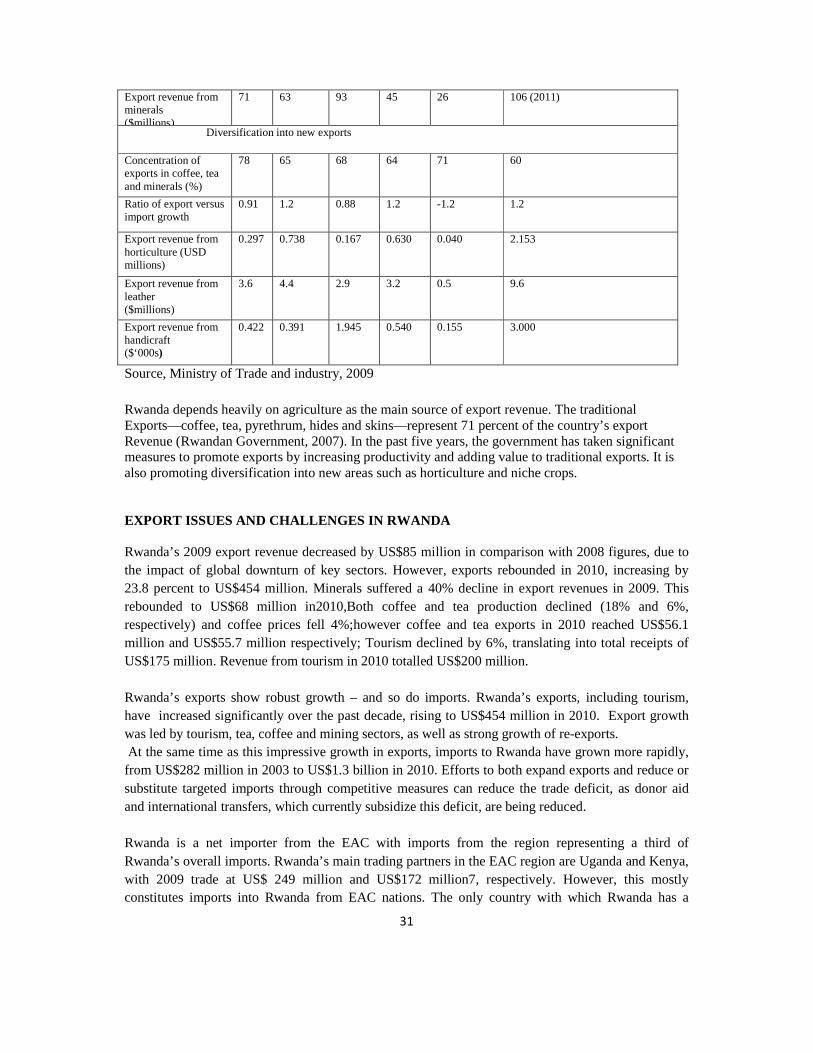
Recent Export Performance in Rwanda Exports represent less than 10% of total GDP compared to an average of 32% of GDP for Sub Saharan Africa. The level of exports has been growing over the past ten years, but growth is still less than 5% and only just above the average for all of sub-Saharan Africa. Measured on a per capita basis, Rwandan export performance is even weaker – annual exports per capita are just $18, while the average for sub-Saharan Africa is $145. Weak export performance in the late 1990s and early part of this decade can be attributed to low international prices for tea and coffee, now having leveled off. Table 4: Key Performance Exports Indicators for Rwanda Base Target Actual Target Actual Moving Forward
2007 2008 2008 2009 2009 2012
The value of existing (traditional) exports
Export per capita ($/person)
18 26 17 8.5 46
Export revenue from coffee ($millions)
30 51 47 38 10 115
Export revenue from tea ( $millions)
35 40 45 28 25 80
Export revenue from tourism ($millions)
138 56 208 120 278.5
31
Export revenue from minerals ($millions)
71 63 93 45 26 106 (2011)
Diversification into new exports
Concentration of exports in coffee, tea and minerals (%)
78 65 68 64 71 60
Ratio of export versus import growth
0.91 1.2 0.88 1.2 -1.2 1.2
Export revenue from horticulture (USD millions)
0.297 0.738 0.167 0.630 0.040 2.153
Export revenue from leather ($millions)
3.6 4.4 2.9 3.2 0.5 9.6
Export revenue from handicraft ($‘000s)
0.422 0.391 1.945 0.540 0.155 3.000
Source, Ministry of Trade and industry, 2009
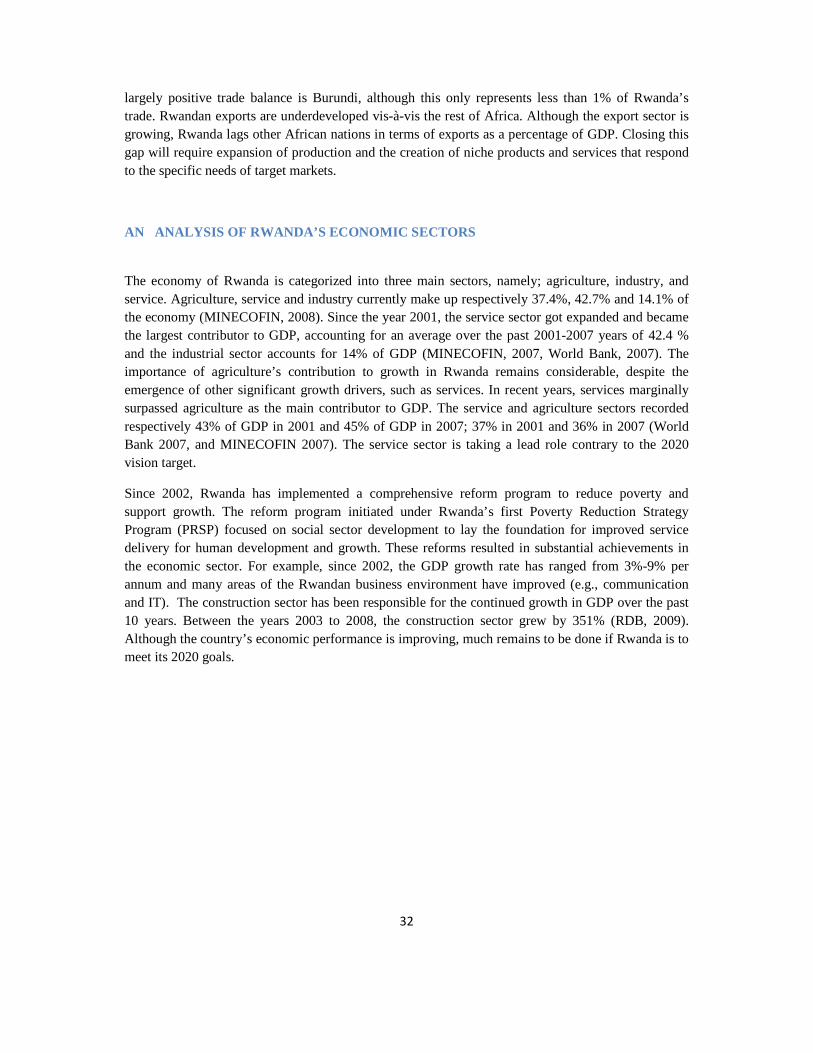
Rwanda depends heavily on agriculture as the main source of export revenue. The traditional Exports—coffee, tea, pyrethrum, hides and skins—represent 71 percent of the country’s export Revenue (Rwandan Government, 2007). In the past five years, the government has taken significant measures to promote exports by increasing productivity and adding value to traditional exports. It is also promoting diversification into new areas such as horticulture and niche crops. EXPORT ISSUES AND CHALLENGES IN RWANDA Rwanda’s 2009 export revenue decreased by US$85 million in comparison with 2008 figures, due to the impact of global downturn of key sectors. However, exports rebounded in 2010, increasing by 23.8 percent to US$454 million. Minerals suffered a 40% decline in export revenues in 2009. This rebounded to US$68 million in2010,Both coffee and tea production declined (18% and 6%, respectively) and coffee prices fell 4%;however coffee and tea exports in 2010 reached US$56.1 million and US$55.7 million respectively; Tourism declined by 6%, translating into total receipts of US$175 million. Revenue from tourism in 2010 totalled US$200 million. Rwanda’s exports show robust growth – and so do imports. Rwanda’s exports, including tourism, have increased significantly over the past decade, rising to US$454 million in 2010. Export growth was led by tourism, tea, coffee and mining sectors, as well as strong growth of re-exports. At the same time as this impressive growth in exports, imports to Rwanda have grown more rapidly, from US$282 million in 2003 to US$1.3 billion in 2010. Efforts to both expand exports and reduce or substitute targeted imports through competitive measures can reduce the trade deficit, as donor aid and international transfers, which currently subsidize this deficit, are being reduced. Rwanda is a net importer from the EAC with imports from the region representing a third of Rwanda’s overall imports. Rwanda’s main trading partners in the EAC region are Uganda and Kenya, with 2009 trade at US$ 249 million and US$172 million7, respectively. However, this mostly constitutes imports into Rwanda from EAC nations. The only country with which Rwanda has a
32
largely positive trade balance is Burundi, although this only represents less than 1% of Rwanda’s trade. Rwandan exports are underdeveloped vis-à-vis the rest of Africa. Although the export sector is growing, Rwanda lags other African nations in terms of exports as a percentage of GDP. Closing this gap will require expansion of production and the creation of niche products and services that respond to the specific needs of target markets.
AN ANALYSIS OF RWANDA’S ECONOMIC SECTORS
The economy of Rwanda is categorized into three main sectors, namely; agriculture, industry, and service. Agriculture, service and industry currently make up respectively 37.4%, 42.7% and 14.1% of the economy (MINECOFIN, 2008). Since the year 2001, the service sector got expanded and became the largest contributor to GDP, accounting for an average over the past 2001-2007 years of 42.4 % and the industrial sector accounts for 14% of GDP (MINECOFIN, 2007, World Bank, 2007). The importance of agriculture’s contribution to growth in Rwanda remains considerable, despite the emergence of other significant growth drivers, such as services. In recent years, services marginally surpassed agriculture as the main contributor to GDP. The service and agriculture sectors recorded respectively 43% of GDP in 2001 and 45% of GDP in 2007; 37% in 2001 and 36% in 2007 (World Bank 2007, and MINECOFIN 2007). The service sector is taking a lead role contrary to the 2020 vision target.
Since 2002, Rwanda has implemented a comprehensive reform program to reduce poverty and support growth. The reform program initiated under Rwanda’s first Poverty Reduction Strategy Program (PRSP) focused on social sector development to lay the foundation for improved service delivery for human development and growth. These reforms resulted in substantial achievements in the economic sector. For example, since 2002, the GDP growth rate has ranged from 3%-9% per annum and many areas of the Rwandan business environment have improved (e.g., communication and IT). The construction sector has been responsible for the continued growth in GDP over the past 10 years. Between the years 2003 to 2008, the construction sector grew by 351% (RDB, 2009). Although the country’s economic performance is improving, much remains to be done if Rwanda is to meet its 2020 goals.
33
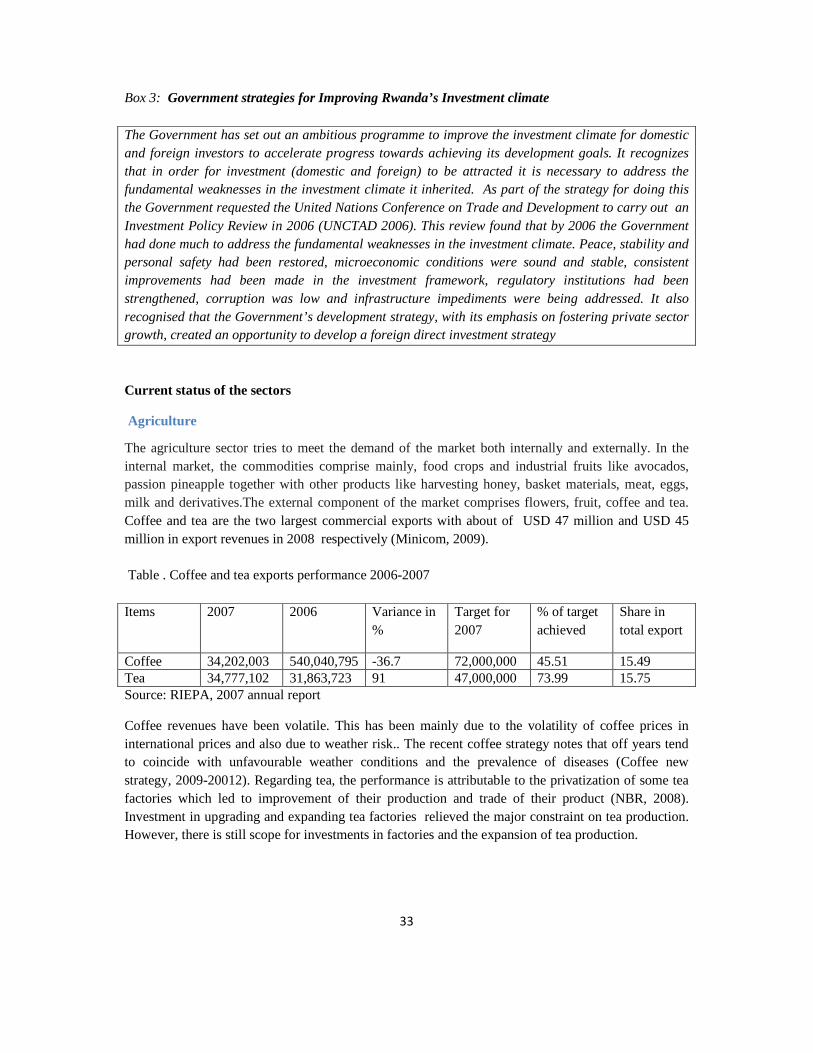
Box 3: Government strategies for Improving Rwanda’s Investment climate The Government has set out an ambitious programme to improve the investment climate for domestic and foreign investors to accelerate progress towards achieving its development goals. It recognizes that in order for investment (domestic and foreign) to be attracted it is necessary to address the fundamental weaknesses in the investment climate it inherited. As part of the strategy for doing this the Government requested the United Nations Conference on Trade and Development to carry out an Investment Policy Review in 2006 (UNCTAD 2006). This review found that by 2006 the Government had done much to address the fundamental weaknesses in the investment climate. Peace, stability and personal safety had been restored, microeconomic conditions were sound and stable, consistent improvements had been made in the investment framework, regulatory institutions had been strengthened, corruption was low and infrastructure impediments were being addressed. It also recognised that the Government’s development strategy, with its emphasis on fostering private sector growth, created an opportunity to develop a foreign direct investment strategy Current status of the sectors
Agriculture
The agriculture sector tries to meet the demand of the market both internally and externally. In the internal market, the commodities comprise mainly, food crops and industrial fruits like avocados, passion pineapple together with other products like harvesting honey, basket materials, meat, eggs, milk and derivatives.The external component of the market comprises flowers, fruit, coffee and tea. Coffee and tea are the two largest commercial exports with about of USD 47 million and USD 45 million in export revenues in 2008 respectively (Minicom, 2009).
Table . Coffee and tea exports performance 2006-2007
Items 2007 2006 Variance in %
Target for 2007
% of target achieved
Share in total export
Coffee 34,202,003 540,040,795 -36.7 72,000,000 45.51 15.49 Tea 34,777,102 31,863,723 91 47,000,000 73.99 15.75 Source: RIEPA, 2007 annual report
Coffee revenues have been volatile. This has been mainly due to the volatility of coffee prices in international prices and also due to weather risk.. The recent coffee strategy notes that off years tend to coincide with unfavourable weather conditions and the prevalence of diseases (Coffee new strategy, 2009-20012). Regarding tea, the performance is attributable to the privatization of some tea factories which led to improvement of their production and trade of their product (NBR, 2008).
Investment in upgrading and expanding tea factories relieved the major constraint on tea production. However, there is still scope for investments in factories and the expansion of tea production.
34
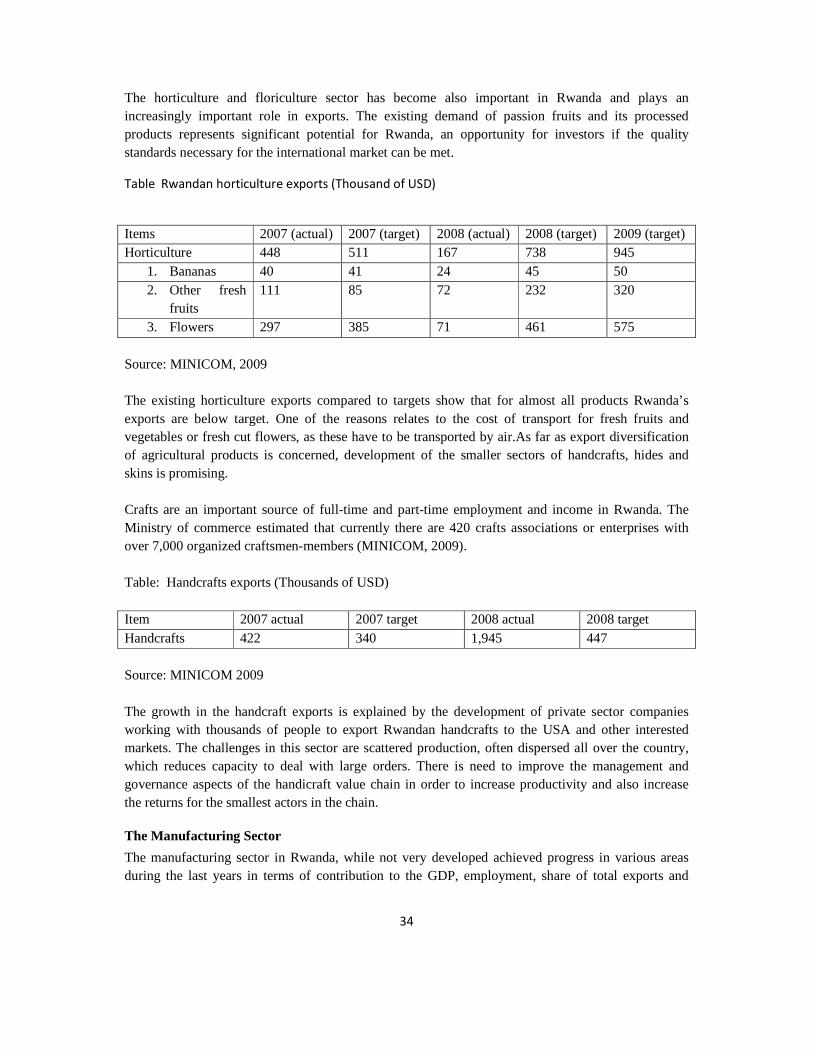
The horticulture and floriculture sector has become also important in Rwanda and plays an increasingly important role in exports. The existing demand of passion fruits and its processed products represents significant potential for Rwanda, an opportunity for investors if the quality standards necessary for the international market can be met.
Table Rwandan horticulture exports (Thousand of USD)
Items 2007 (actual) 2007 (target) 2008 (actual) 2008 (target) 2009 (target) Horticulture 448 511 167 738 945
1. Bananas 40 41 24 45 50 2. Other fresh
fruits 111 85 72 232 320
3. Flowers 297 385 71 461 575 Source: MINICOM, 2009 The existing horticulture exports compared to targets show that for almost all products Rwanda’s exports are below target. One of the reasons relates to the cost of transport for fresh fruits and vegetables or fresh cut flowers, as these have to be transported by air.As far as export diversification of agricultural products is concerned, development of the smaller sectors of handcrafts, hides and skins is promising. Crafts are an important source of full-time and part-time employment and income in Rwanda. The Ministry of commerce estimated that currently there are 420 crafts associations or enterprises with over 7,000 organized craftsmen-members (MINICOM, 2009). Table: Handcrafts exports (Thousands of USD) Item 2007 actual 2007 target 2008 actual 2008 target Handcrafts 422 340 1,945 447 Source: MINICOM 2009 The growth in the handcraft exports is explained by the development of private sector companies working with thousands of people to export Rwandan handcrafts to the USA and other interested markets. The challenges in this sector are scattered production, often dispersed all over the country, which reduces capacity to deal with large orders. There is need to improve the management and governance aspects of the handicraft value chain in order to increase productivity and also increase the returns for the smallest actors in the chain.
The Manufacturing Sector
The manufacturing sector in Rwanda, while not very developed achieved progress in various areas during the last years in terms of contribution to the GDP, employment, share of total exports and
35
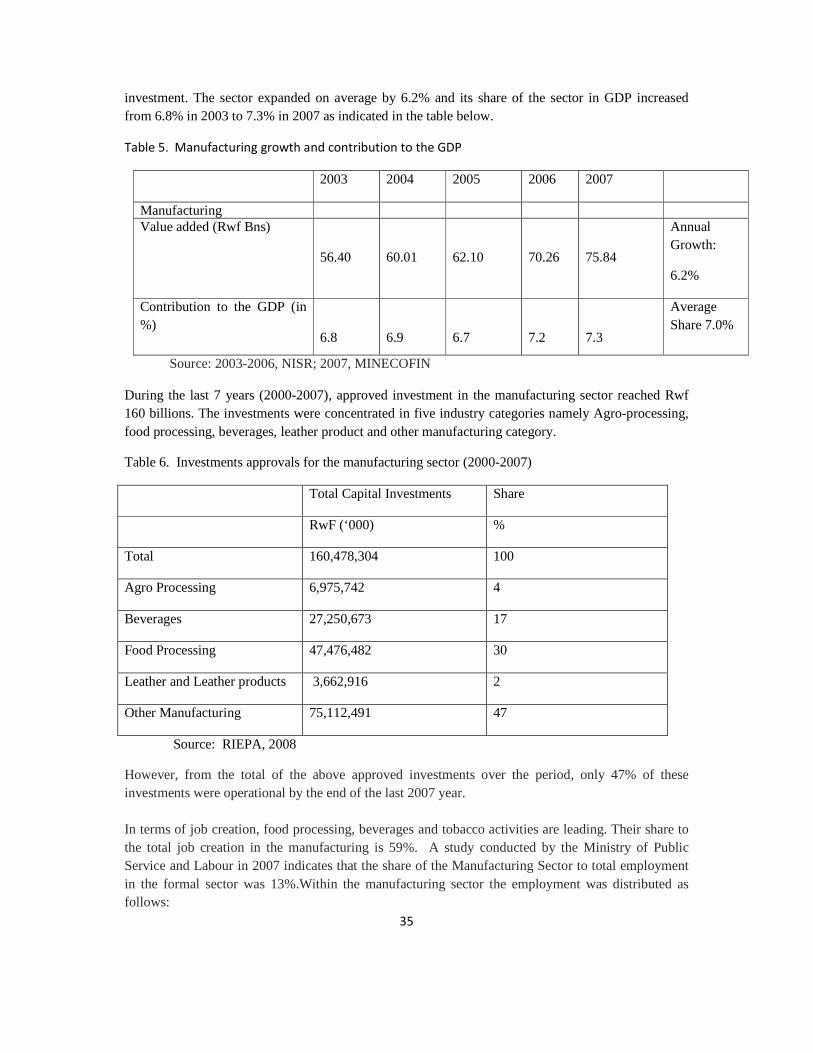
investment. The sector expanded on average by 6.2% and its share of the sector in GDP increased from 6.8% in 2003 to 7.3% in 2007 as indicated in the table below.
Table 5. Manufacturing growth and contribution to the GDP
2003 2004 2005 2006 2007
Manufacturing Value added (Rwf Bns)
56.40
60.01
62.10
70.26
75.84
Annual Growth:
6.2%
Contribution to the GDP (in %)
6.8
6.9
6.7
7.2
7.3
Average Share 7.0%
Source: 2003-2006, NISR; 2007, MINECOFIN
During the last 7 years (2000-2007), approved investment in the manufacturing sector reached Rwf 160 billions. The investments were concentrated in five industry categories namely Agro-processing, food processing, beverages, leather product and other manufacturing category.
Table 6. Investments approvals for the manufacturing sector (2000-2007)
Total Capital Investments Share
RwF (‘000) %
Total 160,478,304 100
Agro Processing 6,975,742 4
Beverages 27,250,673 17
Food Processing 47,476,482 30
Leather and Leather products 3,662,916 2
Other Manufacturing 75,112,491 47
Source: RIEPA, 2008
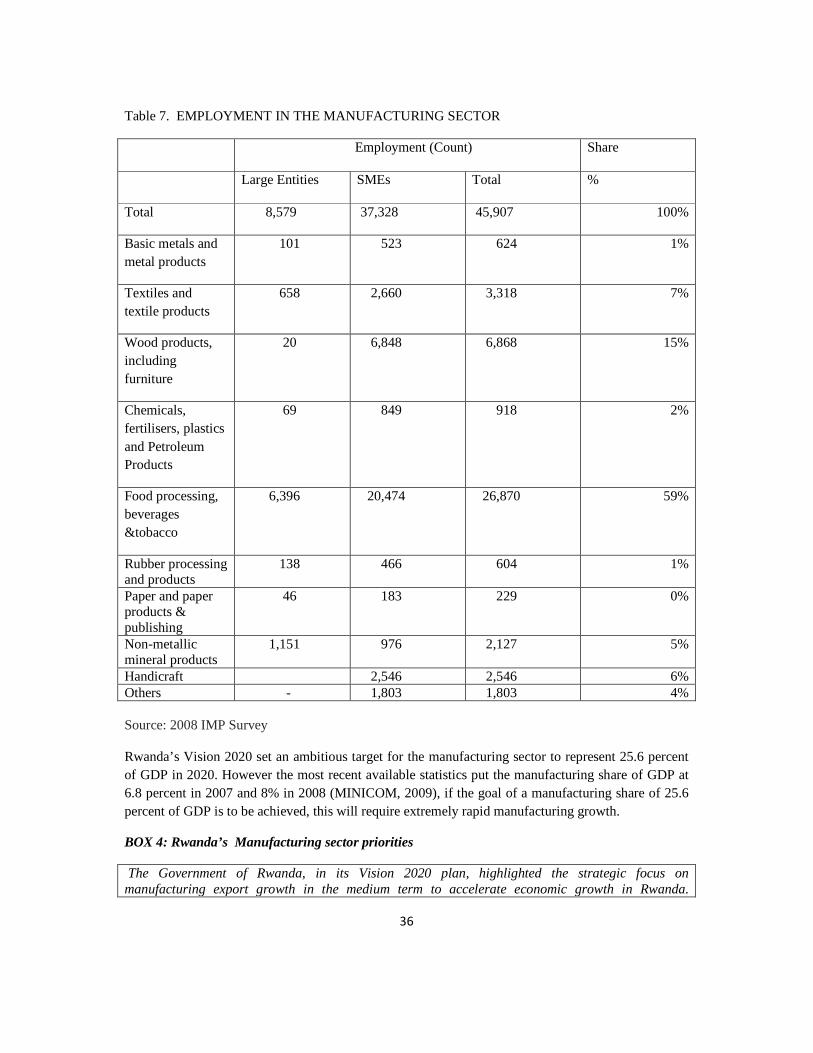
However, from the total of the above approved investments over the period, only 47% of these investments were operational by the end of the last 2007 year. In terms of job creation, food processing, beverages and tobacco activities are leading. Their share to the total job creation in the manufacturing is 59%. A study conducted by the Ministry of Public Service and Labour in 2007 indicates that the share of the Manufacturing Sector to total employment in the formal sector was 13%.Within the manufacturing sector the employment was distributed as follows:
36
Table 7. EMPLOYMENT IN THE MANUFACTURING SECTOR
Employment (Count) Share
Large Entities SMEs Total %
Total 8,579 37,328 45,907 100%
Basic metals and metal products
101 523 624 1%
Textiles and textile products
658 2,660 3,318 7%
Wood products, including furniture
20 6,848 6,868 15%
Chemicals, fertilisers, plastics and Petroleum Products
69 849 918 2%
Food processing, beverages &tobacco
6,396 20,474 26,870 59%
Rubber processing and products
138 466 604 1%
Paper and paper products & publishing
46 183 229 0%
Non-metallic mineral products
1,151 976 2,127 5%
Handicraft 2,546 2,546 6% Others - 1,803 1,803 4% Source: 2008 IMP Survey Rwanda’s Vision 2020 set an ambitious target for the manufacturing sector to represent 25.6 percent of GDP in 2020. However the most recent available statistics put the manufacturing share of GDP at 6.8 percent in 2007 and 8% in 2008 (MINICOM, 2009), if the goal of a manufacturing share of 25.6 percent of GDP is to be achieved, this will require extremely rapid manufacturing growth.
BOX 4: Rwanda’s Manufacturing sector priorities
The Government of Rwanda, in its Vision 2020 plan, highlighted the strategic focus on manufacturing export growth in the medium term to accelerate economic growth in Rwanda.
37
Although Investments have been increasing steadily since 2000, most recent investments however, have been in the hotels and tourism sectors – very few firms have entered or made significant investments in non-traditional exports of manufactures, while imports within manufacturing have been growing rapidly.
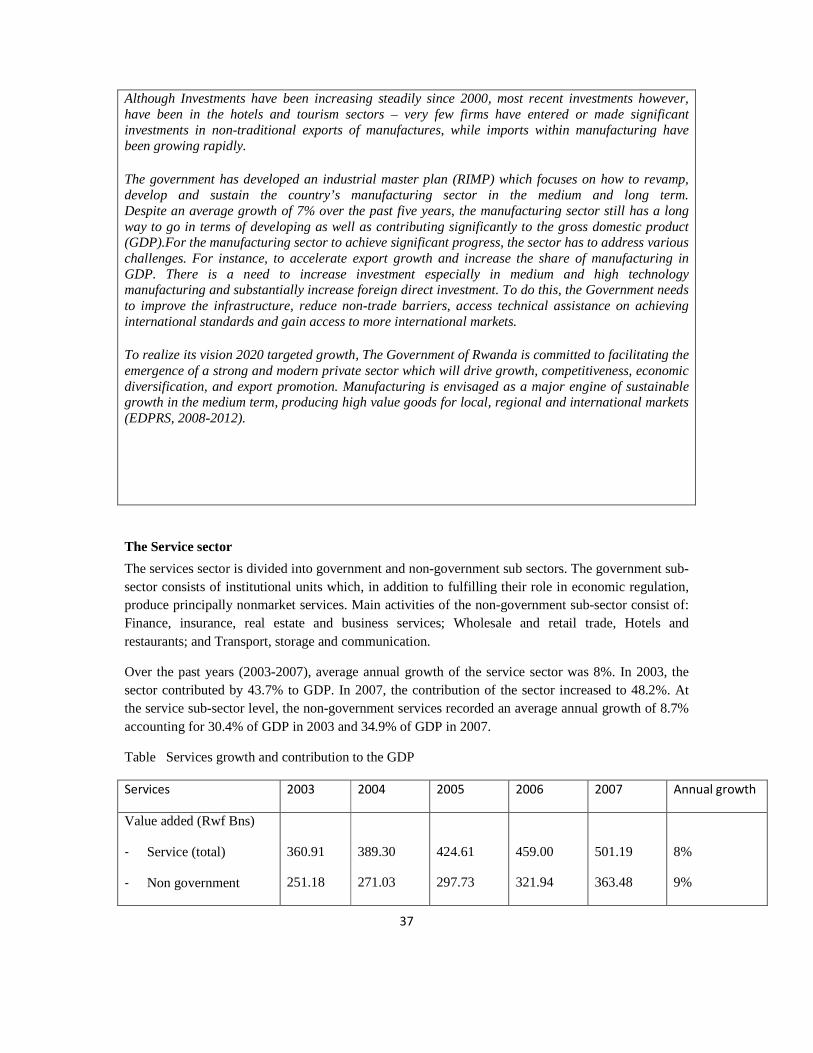
The government has developed an industrial master plan (RIMP) which focuses on how to revamp, develop and sustain the country’s manufacturing sector in the medium and long term. Despite an average growth of 7% over the past five years, the manufacturing sector still has a long way to go in terms of developing as well as contributing significantly to the gross domestic product (GDP).For the manufacturing sector to achieve significant progress, the sector has to address various challenges. For instance, to accelerate export growth and increase the share of manufacturing in GDP. There is a need to increase investment especially in medium and high technology manufacturing and substantially increase foreign direct investment. To do this, the Government needs to improve the infrastructure, reduce non-trade barriers, access technical assistance on achieving international standards and gain access to more international markets.
To realize its vision 2020 targeted growth, The Government of Rwanda is committed to facilitating the emergence of a strong and modern private sector which will drive growth, competitiveness, economic diversification, and export promotion. Manufacturing is envisaged as a major engine of sustainable growth in the medium term, producing high value goods for local, regional and international markets (EDPRS, 2008-2012).
The Service sector
The services sector is divided into government and non-government sub sectors. The government sub-sector consists of institutional units which, in addition to fulfilling their role in economic regulation, produce principally nonmarket services. Main activities of the non-government sub-sector consist of: Finance, insurance, real estate and business services; Wholesale and retail trade, Hotels and restaurants; and Transport, storage and communication.
Over the past years (2003-2007), average annual growth of the service sector was 8%. In 2003, the sector contributed by 43.7% to GDP. In 2007, the contribution of the sector increased to 48.2%. At the service sub-sector level, the non-government services recorded an average annual growth of 8.7% accounting for 30.4% of GDP in 2003 and 34.9% of GDP in 2007.
Table Services growth and contribution to the GDP
Services 2003 2004 2005 2006 2007 Annual growth
Value added (Rwf Bns)
- Service (total)
- Non government
360.91
251.18
389.30
271.03
424.61
297.73
459.00
321.94
501.19
363.48
8%
9%
38
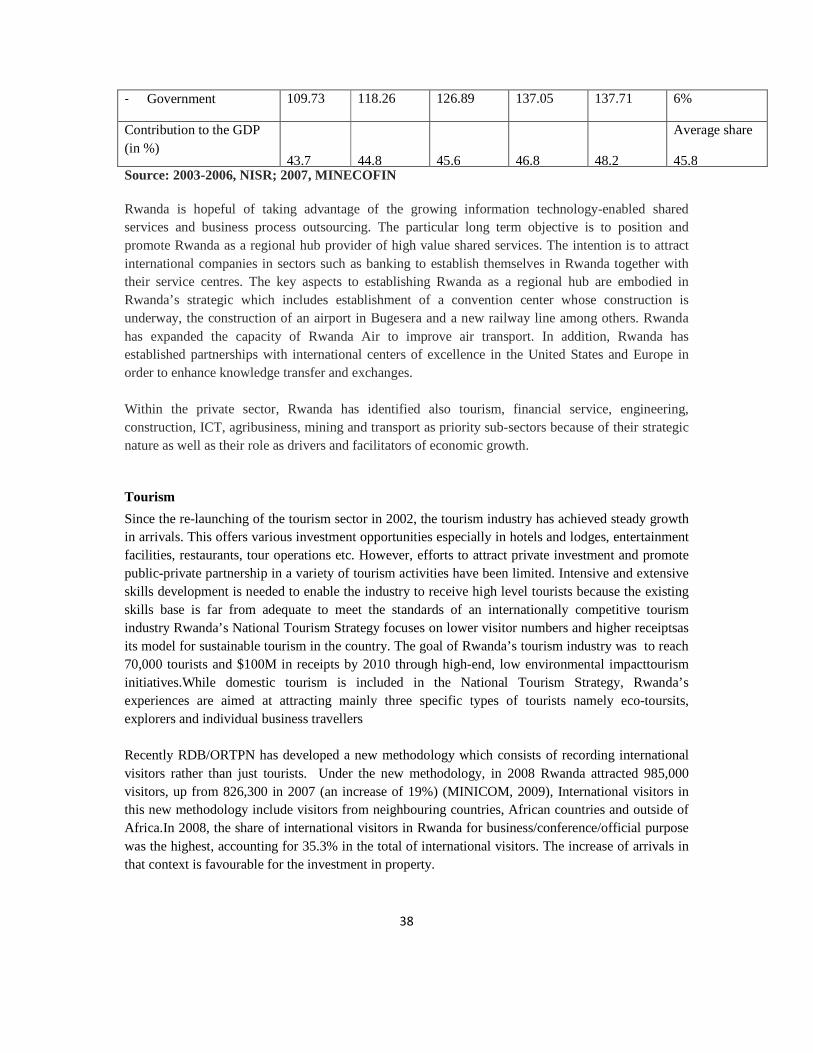
- Government 109.73 118.26 126.89 137.05 137.71 6%
Contribution to the GDP (in %)
43.7
44.8
45.6
46.8
48.2
Average share
45.8 Source: 2003-2006, NISR; 2007, MINECOFIN Rwanda is hopeful of taking advantage of the growing information technology-enabled shared services and business process outsourcing. The particular long term objective is to position and promote Rwanda as a regional hub provider of high value shared services. The intention is to attract international companies in sectors such as banking to establish themselves in Rwanda together with their service centres. The key aspects to establishing Rwanda as a regional hub are embodied in Rwanda’s strategic which includes establishment of a convention center whose construction is underway, the construction of an airport in Bugesera and a new railway line among others. Rwanda has expanded the capacity of Rwanda Air to improve air transport. In addition, Rwanda has established partnerships with international centers of excellence in the United States and Europe in order to enhance knowledge transfer and exchanges. Within the private sector, Rwanda has identified also tourism, financial service, engineering, construction, ICT, agribusiness, mining and transport as priority sub-sectors because of their strategic nature as well as their role as drivers and facilitators of economic growth.
Tourism
Since the re-launching of the tourism sector in 2002, the tourism industry has achieved steady growth in arrivals. This offers various investment opportunities especially in hotels and lodges, entertainment facilities, restaurants, tour operations etc. However, efforts to attract private investment and promote public-private partnership in a variety of tourism activities have been limited. Intensive and extensive skills development is needed to enable the industry to receive high level tourists because the existing skills base is far from adequate to meet the standards of an internationally competitive tourism industry Rwanda’s National Tourism Strategy focuses on lower visitor numbers and higher receiptsas its model for sustainable tourism in the country. The goal of Rwanda’s tourism industry was to reach 70,000 tourists and $100M in receipts by 2010 through high-end, low environmental impacttourism initiatives.While domestic tourism is included in the National Tourism Strategy, Rwanda’s experiences are aimed at attracting mainly three specific types of tourists namely eco-toursits, explorers and individual business travellers Recently RDB/ORTPN has developed a new methodology which consists of recording international visitors rather than just tourists. Under the new methodology, in 2008 Rwanda attracted 985,000 visitors, up from 826,300 in 2007 (an increase of 19%) (MINICOM, 2009), International visitors in this new methodology include visitors from neighbouring countries, African countries and outside of Africa.In 2008, the share of international visitors in Rwanda for business/conference/official purpose was the highest, accounting for 35.3% in the total of international visitors. The increase of arrivals in that context is favourable for the investment in property.
39
Information Communications and Technology (ICT)
The government is particularly keen on attracting investors in ICT related activities given the business development needs. The ICT development is favourable for business development in various areas especially, business development services to support entrepreneurship and promote business opportunities, exchange of information with potential suppliers/customers, marketing local products,access to market prices,consultative decision making, combating bureaucracy,keeping updated accounting information to name just few.The country has undertaken reforms including reforms in telecommunications, with the aim to increase competitiveness in telecommunication industry and to attract foreign investment. This contributed to the increase of telecom network operators. Facilitating the development of the private sector in ICT service requires an investor-friendly environment together with increasing market liberalization (full privatization of incumbent, licensing of other operators). Competition and privatisation in telecommunications is vital for the sector to offer a remarkable impact.
Financial Services
The financial sectors is small, comprising height commercial banks, three specialised banks (BHR, BRD), one microfinance bank, 122 microfinance institutions, 8 insurance companies, one public pension fund and 12 growing private pension funds (NBR, 2009). Following significant restructuring and the recent privatization of three major retail banks, the financial sector experienced healthy growth in terms of new customers and new banks over timeWith the growth in retail and wholesale businesses as well as the boom in construction, significant opportunities for investment exist in this sub-sector.
Construction and civil engineering This sector is a buoyant sector in Rwanda and it is the major contribution of the tax revenue in the country. The construction industry contributed about 8% to the Rwanda GDP in 2007. In order to stimulate and encourage investment in this sector, the government has encouraged strategic partnership between local and foreign companies.
Mining
During the years 2006-2008, the mining and quarrying activities have registered an exceptional performance. In 2006, the Rwandan Minerals Industry set revenue targets of $54 million and $63 million for 2007 and 2008 respectively. The targets were exceeded with revenues of $71 million in 2007 and $93 million in 2008 (MINICOM, 2009). The performance of this sector is due to strengthened supervison regulation, availability of new data for investor’s interest and the support for value addition in metallic ores and quarries.
Box 5: Business reforms in Rwanda
The Government’s targeted policy of business climate reform has undoubtedly been successful if the measure of success is ranking on Doing Business. However, there are still areas that need improvement even on that measure and as the PSF (2008) pointed out all aspects of improving the business climate need to be tackled at once. Furthermore reforming the regulatory and legal framework does little to tackle the three areas that seen of major concern to the private sector, access
40
to finance, availability of skilled and experienced workers and infrastructure.
There is some evidence that investment has increased since the introduction of the reform programme, both FDI and local investment. However, there are a number of confounding factors so the increase cannot necessarily be attributed to the reforms
41
Employment in Rwanda
In this section we look at the quality and quantity of available workers, the quality and quantity of available jobs and the matching process linking workers and jobs. From our analysis we conclude that there is an excess supply of labour that is low-skilled and poorly educated and a deficit of decent jobs, with some evidence that the process matching workers and jobs is not optimal. There is also evidence of a decline in the proportion of adults in employment, accounted for by increased participation in education, and a sectoral shift out of subsistence agriculture into non-farm work and farm labouring. According to the 2007 OPM /NISR labour analysis of the 2006 EICV survey, 1.2% of the adult population was unemployed in 2006, (i.e. not working but seeking work in the long reference period of 12 months. This was 0.2% higher than the corresponding figure in 2000/01. Since 2000 there has been a decline in the proportion of workers employed in the primary sector (mainly agriculture) and an increase in employment in the secondary sector (manufacturing) and the tertiary sector (services). Employment in agriculture fell from 90 per cent in 2000 to 77 per cent in 2006, while in manufacturing and the service sector it increased1. The most notable increase was in the service sector which increased its share of employment from less than a tenth of all jobs in 2000 to nearly a fifth in 2006 (Strode et al 2007). Non-agricultural jobs are on average better paid than agricultural jobs, although many non-agricultural jobs were lower-paying in 2006 compared to pay levels in 2000 (Strode et al 2007).
There was an increase in wage employment in the same period, from 11 per cent to 21 per cent, driven by an increase in wage farm employment (from 4% to 8%) as well as non-farm waged employment (from 7% to 11%). There was also an increase in employment in independent non-farm enterprises (from 5% to 10%). The causal mechanisms for this shift have not been extensively researched but are likely to be a combination of push factors, landholdings too small to support the household and the availability of wage employment in agriculture and non-agriculture (Clay and Kampayana 1997). This conclusion is supported by the estimation that the shift from working on a family farming enterprise to other types of employment accommodated the additional half million workers that came on to the labour market between 2000 and 2006 (Strode et al 2007).
Considering jobs started in the last five years (excluding independent farmers) we can see that just under half (45%) were as unpaid farm worker while 12 per cent were in paid farm work; thus over 40 per cent were in non-farm employment. Twenty-three per cent were in paid non-farm employment and 19 per cent in independent non-farm work (16% as operator and 3% as dependent worker). Independent non-farm work together with waged non-farm was especially important for young people aged 21 to 30 years, with just over fifty percent of them starting non-farm employment (Abbot et al, 2010).
The Rwandan labour market, however, continues to be characterised by a deficit of decent work, with the numbers of working poor remaining high. Forty per cent of working adults have more than one
1 This is based on a comparison of EICV1 and EICV2 data. However, the questions on employment differed between the two surveys and it
is likely that the shift out of agriculture is exaggerated in the comparison. EVIC2 also seems to have been more successful in collecting
instances of agricultural wage labour and so the increase may also be an exaggeration.
42
source of ‘income’ with those in rural areas being more likely to have more than one job and men more so than women (NISR 2006, P28). In order to understand the labour market in Rwanda it is important to take account of time-related underemployment as well as unemployment. The former can provide information on the extent to which the economy can provide full employment for all those who want it and thus a better understanding of the true employment situation (International Labour Organisation 2004).
There is low unemployment (people available for and seeking work), but high under-employment, especially amongst men in rural areas2. The average number of hours worked a week in all jobs is 31 (men 35, women 28) but this falls to 27 (30 men, 25 women) for those whose main occupation is agriculture (NIRS 2006, P28). However, women, in addition, spend well over 20 hours a week on domestic duties while men spend only around five3 (NISR 2006, P30). Assuming a normal working week of 40 hours in productive labour this suggests that up to a quarter of the adult workforce is in reality surplus to requirements, with the vast majority residing in rural areas4. However, we must exercise some caution because, as Fox and Gaal (2008) point out, measuring labour force participation in countries like Rwanda is problematic give the variety of activities in which people engage across the day, especially in rural areas, and the pattern of work across the seasons.
Whilst most men and women engage in productive labour there is a concern that underemployment may be turning into unemployment for a growing number of young people, especially in rural areas. If this is not addressed there may be even greater migration to urban areas, and a large number of marginalised young people could present problems for the authorities. A 2009 report (Education Development Centre 2009) found that there is a growing pool of unemployed/marginally employed young people, especially men, who have, migrated from rural areas to urban areas, including Kigali. The Centre for Support to Small and Medium Enterprises in Rwanda (CAPMER) estimate that 85 per cent of Rwandan young people are in reality ‘unemployed’ with most young people in rural areas being surplus labour
There is a low level of human capital and the workforce is poorly educated, with a majority of the population having primary school education or none and only just over two-thirds of the population declare themselves as literate (71.5% of men and 60.1% of women). Literacy rates are much lower in rural areas than in Kigali or other urban areas (Ministry of Health et al 2009; NISR 2006). Education attainment is poor even amongst younger age groups, with many of those who have only attended primary school being barely literate (Education Development Centre 2009).
2 When we talk about workers we are generally referring to those above 15 years of age, unless we explicitly state otherwise. In 2006 about
10 percent of children aged 11 to 15 years were in ‘employment’, 51.2 percent of young adults aged 16 to 20 years and 80.6 percent of adults 21 years and over (NISR 2006, P29). It is of course likely that that many children, especially in rural areas contribute to the livelihood work of the household, and boys as well as girls contribute to domestic labour, including fetching wood and water (NISR 2006 Ps 29 -30).. 3 According to the latest version of the United Nations Guidelines on Calculating GDP many of these activities count as economic activities but statistical agencies rarely consider them as such and households do not consider then as economic activities either (Fox and Gaal 2008). 4 The International Labour Organisation (2004) point out that the questions asked in surveys in Rwanda does not make it possible to calculate underemployment within the norms set by the ILO, but it is possible to calculate a pseudo underemployment rate. Using a 35 hour week they calculate that at the time of the 1988/89 Labour Force Survey that 47 per cent of the adult population was underemployed, 42 per cent men and 53 per cent women, with 93 per cent residing in rural areas (P 20).
43
Rwanda’s Labor Markets, features and Participation constraints
Paul Cichello et al (World Bank, 2010) characterize Rwanda’s labour market as one of high labour force participation and low unemployment, the resulting recommendation being improving the quality rather than overall quantity of jobs. However, this contradicts , projections from the 2006 National labour market study which show that young workers will become an increasing feature of the labor market. Between 2006 and 2011, another one million children will become 15 years old. In 2006 only 100,000 of them were economically active. These numbers will increase dramatically as the birth rates rise and death rates fall, and as result both the quality and quantity of jobs will have to be increased so as to catch up with this growing labour force (NISR,2006). According to the National Labor Market Survey in 2006, 3.7 million workers live in rural areas, where 86% work in agriculture, forestry or fishing as their main jobs. Nationally the number of employed people grew by almost a quarter. While the majority of new work opportunities are still on farms, almost a quarter of jobs taken since the 2001 are non‐farm waged work, while 19% of jobs are in small enterprises.
Barriers to participation in Rwanda’s labour market s
Segmentation: The labor market in Rwanda is segmented by gender in that more young women stay at home on the family farm in greater numbers than young men. They also enter wage employment at a lower rate than their male counterparts. According to the National Labor Survey of 2006, 58% of young men between 15 and 20 years worked on the family farm as compared to 73% of young women.
Barriers to Internal labor migration: In Rwanda, rural-urban migration in search for employment is limited by the inadequate availability of basic services like housing and sanitation in the cities where immigrants move. Of the 550,000 adults who migrated in early 2006, 500,000 were internal migrants.(NISR, 2006) Skills shortage and skill mismatches; Rwanda generally suffers from a shortage of skilled workers. According the USAID’s Rwanda youth employment assessment report (2009), the fastest growing sectors identified to absorb unemployment youths (subject to skills training) in Rwanda include agro-processing, construction, the service industry (tourism and commerce) and the ICT sector. Unemployed youth in Rwanda fall into three categories of educational levels i.e. ‐ those with no education, those with some primary education, and those with some secondary or vocational training. Each of the categories has their own strengths, skills needs, and challenges for participation in a youth development programs and subsequent labor markets.
There is also a mismatch between the skills of those seeking employment and the skills employers are looking for, with a shortage of skilled labour at all levels from technical and vocational to higher education (HIDA 2009; Abbott and Rwirahira 2010). It is estimated that there is a 60 per cent skills gap in the private sector and a 30 per cent skills gap in the public sector.
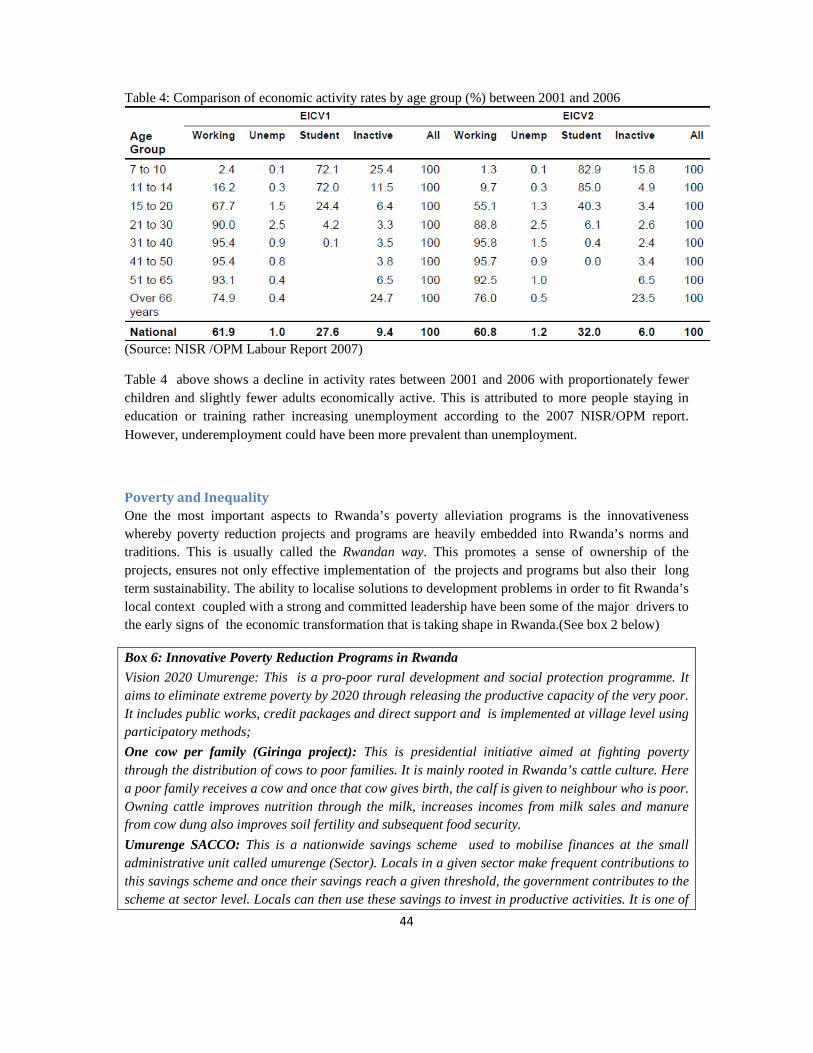
44
Table 4: Comparison of economic activity rates by age group (%) between 2001 and 2006
(Source: NISR /OPM Labour Report 2007)
Table 4 above shows a decline in activity rates between 2001 and 2006 with proportionately fewer children and slightly fewer adults economically active. This is attributed to more people staying in education or training rather increasing unemployment according to the 2007 NISR/OPM report. However, underemployment could have been more prevalent than unemployment.
Poverty and Inequality
One the most important aspects to Rwanda’s poverty alleviation programs is the innovativeness whereby poverty reduction projects and programs are heavily embedded into Rwanda’s norms and traditions. This is usually called the Rwandan way. This promotes a sense of ownership of the projects, ensures not only effective implementation of the projects and programs but also their long term sustainability. The ability to localise solutions to development problems in order to fit Rwanda’s local context coupled with a strong and committed leadership have been some of the major drivers to the early signs of the economic transformation that is taking shape in Rwanda.(See box 2 below)
Box 6: Innovative Poverty Reduction Programs in Rwanda
Vision 2020 Umurenge: This is a pro-poor rural development and social protection programme. It aims to eliminate extreme poverty by 2020 through releasing the productive capacity of the very poor. It includes public works, credit packages and direct support and is implemented at village level using participatory methods;
One cow per family (Giringa project): This is presidential initiative aimed at fighting poverty through the distribution of cows to poor families. It is mainly rooted in Rwanda’s cattle culture. Here a poor family receives a cow and once that cow gives birth, the calf is given to neighbour who is poor. Owning cattle improves nutrition through the milk, increases incomes from milk sales and manure from cow dung also improves soil fertility and subsequent food security.
Umurenge SACCO: This is a nationwide savings scheme used to mobilise finances at the small administrative unit called umurenge (Sector). Locals in a given sector make frequent contributions to this savings scheme and once their savings reach a given threshold, the government contributes to the scheme at sector level. Locals can then use these savings to invest in productive activities. It is one of
45
the programs aimed at improving access to finance at the local village level in Rwanda.
Umuganda Evaluations; One of the recently introduced procedures for evaluation of progress towards achieving the MDGs by communities themselves provides useful information for monitoring and evaluation. Once a month after community work (Umuganda5) information for indicative monitoring of progress towards achieving the MDGs will be collected, including: under-five mortality; maternal mortality; antenatal visits; children attending school; nutritional status of children; take-up of family planning; area of cultivated land and livestock holdings; and membership of enterprise cooperatives. This enables communities themselves to evaluate progress towards achieving MDGs and EDPRS targets in their community. It also raises awareness of the MDGs and, even more importantly, of these key issues. It also builds understanding of and capacity for using services and adopting a healthy lifestyle. It builds collective ownership for improving the health and well-being of all members of the community and enable communities to put forward proposals proactively for the more user-friendly delivery of services as well as the development of self-help strategies.
Performance contracts (Imihigo)
It’s through performance contracts that local authorities are accountable to Government and the local population for reaching agreed EDPRS performance targets. Citizen empowerment is a central element in the implementation of the Rwanda’s Poverty reduction Strategy. Imihigo seeks to promote self government and greater citizen engagement in matters of governance as well as building social capital and encouraging entrepreneurship. Citizens actively participate in defining their preferences and priorities and are empowered to hold national government and the ministries accountable against commitments made. Local communities are also encouraged to come up with their own solutions to problems.
Despite the implemented reforms and poverty alleviation programs , there is widespread agreement that although growth has been sustained in Rwanda post- genocide, it has been limited at reducing poverty. According to the NISR 2007 report, an increase in inequality as measured by the gini coefficient was the important part of limitation of growth in reducing poverty. The level of inequality was already high in 2000/01, with a Gini coefficient of 0.47, and this rose to 0.51 in 2005/06. The high initial level of inequality, and the fact that inequality worsened over this period, were important factors making the consumption growth less effective in terms of poverty reduction through, lowering the growth elasticity of poverty reduction (NISR, 2007 Poverty Assessment for EDPRS).
According to the 2010 household survey poverty has reduced from 57% in 2006 to 44.9% in 2010.. Ansom (2005) evaluated the economic performance of the Rwanda economy with respect to projected targets from both the PRSP-1 (2002-2005). Her findings show that the impact of economic growth on poverty reduction in Rwanda has been relatively weak. With a growth elasticity of poverty of –0,40 for the 2001-2006 period, the pro-poor character of Rwandan economic growth remained exceptionally low, despite the implementation of PRSP policies. The strength of the growth - poverty connection can be roughly determined by comparing the Rwandan growth elasticity of poverty with
5 Umuganda takes place on the last Saturday in the month and all able-bodied residents under 65 years of age are expected to take part in
general maintenance work in their own community.
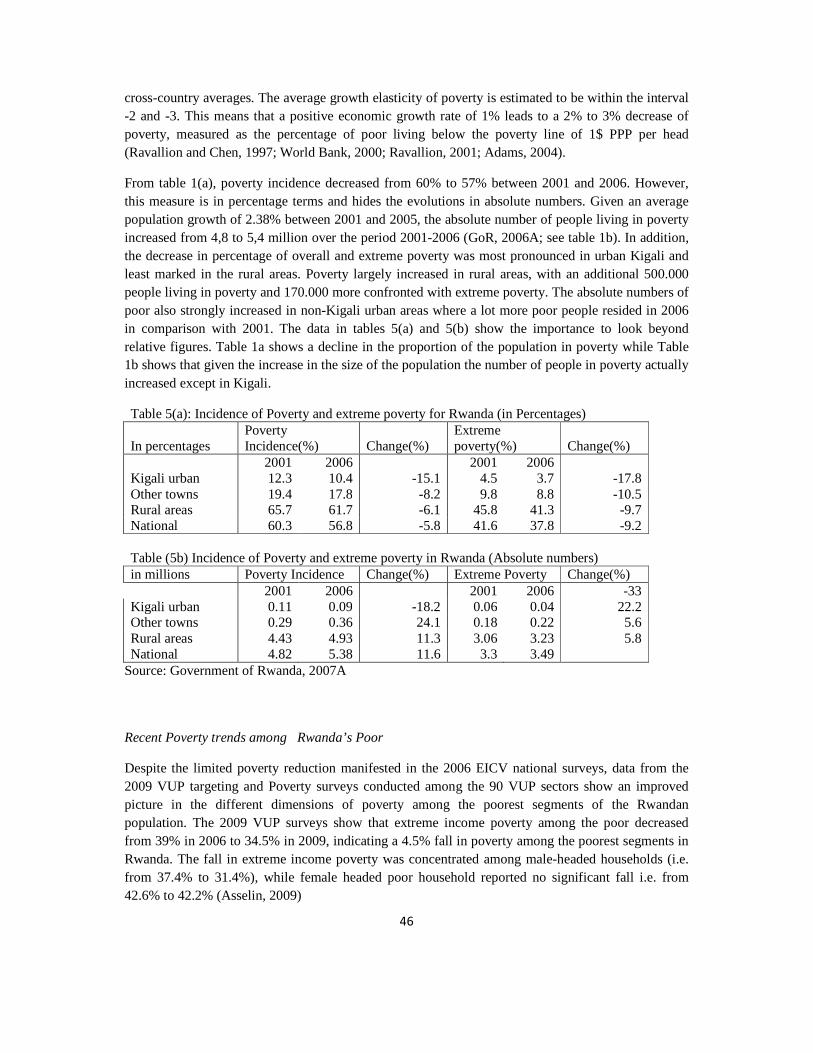
46
cross-country averages. The average growth elasticity of poverty is estimated to be within the interval -2 and -3. This means that a positive economic growth rate of 1% leads to a 2% to 3% decrease of poverty, measured as the percentage of poor living below the poverty line of 1$ PPP per head (Ravallion and Chen, 1997; World Bank, 2000; Ravallion, 2001; Adams, 2004).
From table 1(a), poverty incidence decreased from 60% to 57% between 2001 and 2006. However, this measure is in percentage terms and hides the evolutions in absolute numbers. Given an average population growth of 2.38% between 2001 and 2005, the absolute number of people living in poverty increased from 4,8 to 5,4 million over the period 2001-2006 (GoR, 2006A; see table 1b). In addition, the decrease in percentage of overall and extreme poverty was most pronounced in urban Kigali and least marked in the rural areas. Poverty largely increased in rural areas, with an additional 500.000 people living in poverty and 170.000 more confronted with extreme poverty. The absolute numbers of poor also strongly increased in non-Kigali urban areas where a lot more poor people resided in 2006 in comparison with 2001. The data in tables 5(a) and 5(b) show the importance to look beyond relative figures. Table 1a shows a decline in the proportion of the population in poverty while Table 1b shows that given the increase in the size of the population the number of people in poverty actually increased except in Kigali.
Table 5(a): Incidence of Poverty and extreme poverty for Rwanda (in Percentages)
In percentages Poverty Incidence(%) Change(%)
Extreme poverty(%) Change(%)
2001 2006 2001 2006 Kigali urban 12.3 10.4 -15.1 4.5 3.7 -17.8 Other towns 19.4 17.8 -8.2 9.8 8.8 -10.5 Rural areas 65.7 61.7 -6.1 45.8 41.3 -9.7 National 60.3 56.8 -5.8 41.6 37.8 -9.2 Table (5b) Incidence of Poverty and extreme poverty in Rwanda (Absolute numbers) in millions Poverty Incidence Change(%) Extreme Poverty Change(%) 2001 2006 2001 2006 -33 Kigali urban 0.11 0.09 -18.2 0.06 0.04 22.2 Other towns 0.29 0.36 24.1 0.18 0.22 5.6 Rural areas 4.43 4.93 11.3 3.06 3.23 5.8 National 4.82 5.38 11.6 3.3 3.49
Source: Government of Rwanda, 2007A
Recent Poverty trends among Rwanda’s Poor
Despite the limited poverty reduction manifested in the 2006 EICV national surveys, data from the 2009 VUP targeting and Poverty surveys conducted among the 90 VUP sectors show an improved picture in the different dimensions of poverty among the poorest segments of the Rwandan population. The 2009 VUP surveys show that extreme income poverty among the poor decreased from 39% in 2006 to 34.5% in 2009, indicating a 4.5% fall in poverty among the poorest segments in Rwanda. The fall in extreme income poverty was concentrated among male-headed households (i.e. from 37.4% to 31.4%), while female headed poor household reported no significant fall i.e. from 42.6% to 42.2% (Asselin, 2009)
47
In addition, the VUP surveys show significant changes in social poverty proxied by the net graduation within the Ubudehe6 system used for poverty targeting under the VUP. The bottom two Ubudehe categories decreased globally from 34.2% in 2007 to 28.2% in 2009 indicating a 6% fall in social poverty. However these preliminary results must be treated with caution since the VUP program targets only the poorest segments of the population and not the poor in the whole of the Rwandan population.
Bottlenecks to Economic Transformation in Rwanda
a) Infrastructure:
According to the Diagnostic Trade Integration Survey, the poor state of infrastructure and low production are the major binding constraints to pro-poor growth and economic transformation in Rwanda. These not only undermine private returns but also increase the cost of finance. According to firm survey subjective measures, the state of infrastructure, access and cost of finance, tax rates and skills of workers are ranked as higher business obstacles when compared to factors that affect approriability such as macroeconomic instability, corruption and anti-competitive practices.
b) Inequality in incomes and assets
Another impediment to the translation of growth into sustainable economic transformation in Rwanda is inequality. According to the 2010 ILO report, one of the most important challenges facing Rwanda today is to make development inclusive through reversing the trend of high and increasing income and asset inequality. (ILO, 2010). This is because 40 per cent of the rural households have less than 0.3 hectares of land and for these rural households, non-farm sources of income are a must if they are to achieve sustainable economic transformation. The unequal land distribution and the existence of a large number of near-landless agricultural households imply that a dynamic development of agriculture will only be pro-poor if there are strong links to the non-agriculture sector, with strong growth in this sector (World Bank, 2007). Given that the transforming traditional agriculture is critical for growth , economic transformation and poverty reduction, farmers need to acquire education, skills and knowledge in order to improve traditional practices and to access productive non-farm employment.
c) The impact of Land /Agricultural policies on economic transformation in Rwanda Rwanda’s land and agricultural reform is one of the key policies that have impacted economic transformation and the livelihoods of poor people. This land reform policy is aimed at increasing agricultural productivity on land by replacing subsistence farming by a fully monetized, commercial agricultural sector by 2020. The Strategic Plan for the Transformation of Agriculture (SPAT) provides the operational framework for agricultural development within the EDPRS. However, SPAT strategies seem to be tailor-made for larger farmers whose farm structure and risk-coping abilities
6Ubudehe” is a subjective community based system which identifies poor households using some kinds of consensus within communities. Changes in social poverty are measured by net Obudehe graduation which computed as the percentage of Households that moved into higher poverty classes minus the percentage that moved down to lower poverty classes.
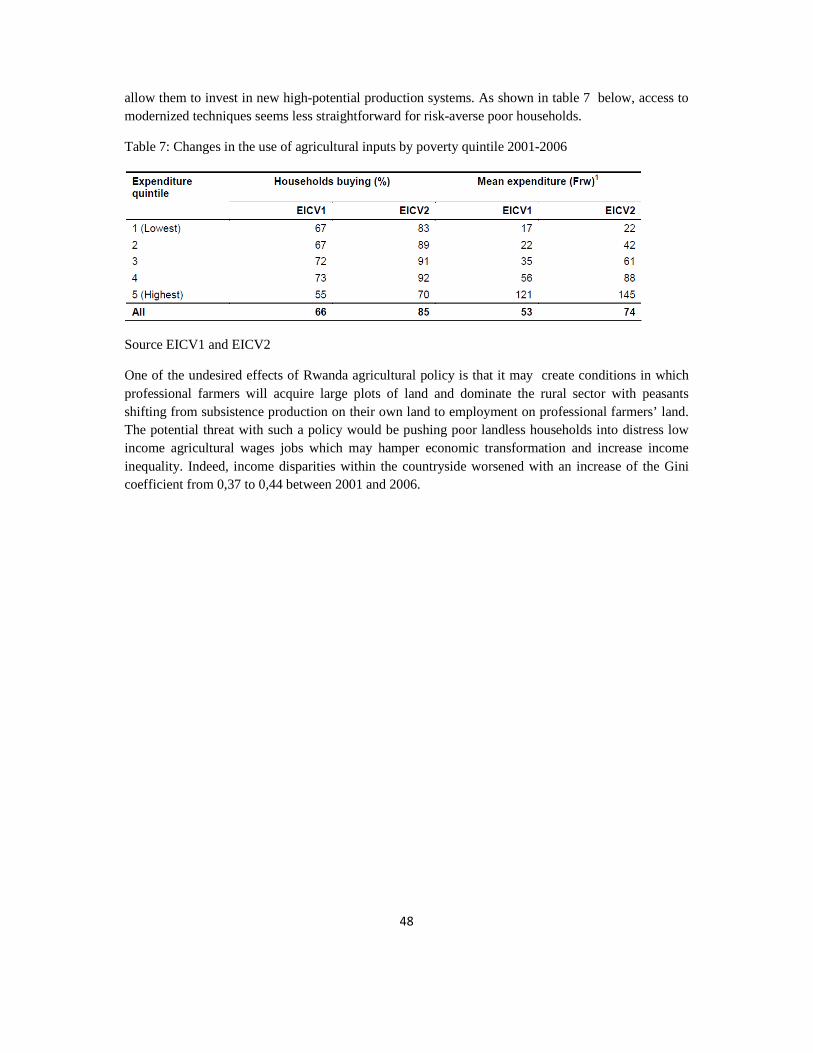
48
allow them to invest in new high-potential production systems. As shown in table 7 below, access to modernized techniques seems less straightforward for risk-averse poor households.
Table 7: Changes in the use of agricultural inputs by poverty quintile 2001-2006
Source EICV1 and EICV2
One of the undesired effects of Rwanda agricultural policy is that it may create conditions in which professional farmers will acquire large plots of land and dominate the rural sector with peasants shifting from subsistence production on their own land to employment on professional farmers’ land. The potential threat with such a policy would be pushing poor landless households into distress low income agricultural wages jobs which may hamper economic transformation and increase income inequality. Indeed, income disparities within the countryside worsened with an increase of the Gini coefficient from 0,37 to 0,44 between 2001 and 2006.
49
III. Institutional Environment for Transformation
Review of the institutional context for economic transformation
State Capacity
Political Stability: Rwanda is one the success stories of a post-conflict state in Africa. After the 1994 genocide, the Rwandan government has restored peace, stability and security. Elections are held at presidential, parliamentary and grassroot level in a democratic way and leaders are accountable to the electorate via a system in which they sign performance contracts with the masses and report back on progress every year. Although Rwanda has come a long way towards reforming its civil service, the low skills capacity result into high turn over rates for cival services, a problem which affects continuity of government programs more so at middle level government position. Turnover rates at higher positions within the civil service are generally lower.
Institutional capacity for planning and budgeting in the civil service in Rwanda is generally low due capacity constraints resulting from the low skills base, the high turnover in the civil service, limited harmony in incentive pay structure in the civil service and competition for the skilled staff from the private sectors and NGOs.
Governments economic transformation plan: The government of Rwanda has rightly identified the limitations of a solely growth–driven development strategy and is currently implementing a strategic Investments Plan. This plan aims at boosting Rwanda’s export growth through selected investments including the electricity roll-out programme, the restructuring of Rwandair, the Isaka-Kigali railway and Bugesera airport, the construction of the Kigali Convention Complex and the ICT infrastructure network. The Strategic Investment Plan represents the longer term plan for diversifying into high value added exports and transforming Rwanda into a service based economy.
A key component of the forward looking priorities by the Rwandan government, the Strategic Investments Plan aims at boosting Rwanda’s export growth through selected investments above and is going to be partly financed through non-concessional borrowing, which will have an impact on debt sustainability. The joint GoR/IMF analysis shows that Rwanda will remain at moderate risk of debt distress. This strategic plan when fully implemented will go a long way in not only increasing Rwanda’s economic growth but also Rwanda’s economic transformation in terms of generating jobs, increasing exports and increasing incomes for a large section of the population. In order to coordinate and plan national priorities and strategies, the Rwandan Government usually organises an annual Leadership Retreat in which all priorities for each cluster are identified. The retreat involves the President and heads of government ministries and parastatals and addresses priority issues aimed at achieving private sector-led growth in Rwanda. With respect to the private sector, The Rwandan Government mainly plays a facilitator role which entails identifying the key constraints to private sector development within specific sub-sectors and facilitating their removal. Examples of Government’s support to the development SMEs include reducing the cost of complying with taxation, facilitating their access to existing and scattered funds; working with business
50
development services providers to address SME difficulties in accessing market information and facilitating SMEs access to skilled labour. According to the Rwandan Government, there are linkages between the Leadership Retreat priorities and the Strategic Investment Plan. However, while the Strategic Investment Plan represents the longer term plan for diversifying into high value added exports and transform Rwanda into a service base economy, the Leadership Retreat identifies a number of shorter term priorities and quick wins, such as increasing agricultural productivity, which in turn would also reduce food insecurity(JBSR, 2010). 2) Economic transformation in Rwanda is a top government priority. This is exhibited through the setting up of the Rwanda Development Board , a one stop centre for attracting foreign direct investment and increasing jobs in the different sectors of the economy. Another is the strategic investment plan which is a long term plan to increase export diversification and volumes in Rwanda and the industrial master plan to create industrial zones within the country. In addition medium term sectoral allocations in the national budget are in line with Rwanda’s poverty reduction strategy( the EDPRS) and focus on the development of physical infrastructure to enable the business environment; the development of productive sectors with a focus on agricultural supply, agri-business, land reform and promotion of value addition exports; retaining momentum in human development and social sectors and maintain and improve good governance. A Cabinet decision has been made relating to capping tertiary education spending to increase funding to basic education and TVET. In addition, a new SMEs strategy will come on stream during 2010/11 in order to boost the private sector. 3) Policy reforms and environment for economic transformation: As part of the efforts to Improve the policy environment for the economic transformation of the industrial and the private sector, the Rwandan government has launched a number of reforms, industrial policy documents and strategies, with actions to promote investment and exports and cut the bureaucratic procedures required to start a business. The focus of reforms is on increasing the value of existing exports, diversifying into new exports, facilitating trade through EAC integration, increasing investment, and improving the business environment(MINICOM, 2009).These include an Industrial Policy Review, the formulation of an Industrial Master Plan, as well as reformulation of the MINICOM Strategic Plan. This comes at the same time as the Rwanda Development Board (RDB)has been established as a one stop centre with one important goal being private sector development through investment and export promotion. One of the issues is that these reforms depend on an industrial and manufacturing sector which remains small and weak, operating under a r constraining factors such as serving a limited domestic market. As a result of Rwanda being one the high performing countries in terms policy end economic management for economic transformation, the IMF has approved a Policy Support Instrument (PSI), whose components are include maintaining fiscal stability, particularly through raising additional revenues; maintaining price stability and continuing the structural reforms to deepen the financial sector; diversify the export base and improve the business environment.
51
Institutional mechanism for Planning and Budgeting Looking at public financial management and fiscal decentralisation, a recent joint visit by development partners and government officials on the Joint budget support review committee has commended the Rwandan government for filling key positions in ministries but highlighted that the high staff turnover in districts undermines the delivery of public services. The visit also showed that there has been progress in district capacity, although some concerns remain over the relationship between central agencies priorities and district work.
In terms of financing the Rwandan government foresees a reduction in aid dependency. The Government of Rwanda has projected a significant increase in tax revenues and a medium term reduction in external grants as percentage of the budget which will significantly increase the share of the budget that is domestically financed as opposed to externally financed. Despite the foreseen reduced aid dependency in the medium term, there are still considerable gaps in confirmed grants for budget years 2011/12and 2012/13.Should these required grants not materialise, government would have to resort to domestic financing or reduce spending (Joint Budget Support Review report, 2010). Coordination: Coordination is one of the on the many challenges involved in the process of fiscal decentralisation and enabling economic transformation to the grassroots in Rwanda. One of government’s key priorities is to strengthen the linkages between Central Government and Local Government, particularly improving the interaction and communication between line ministries and districts. These interactions vary in quality and this is partly dependent on the clarity with which line ministries and districts agree on measuring progress, on funds receipt, actions and implementation. Government is currently working towards strengthening these linkages through consultative meetings and active planning with central and local governments. Despite the coordination challenges good progress made in improving the overall quality of the policy dialogue within the sectors of the Rwandan economy. This resulted from an increased effort made by both Government and Development Partners in harmonising performance across sectors, including through issuing detailed guidance for sector working groups. Good progress has been made in mainstreaming cross cutting issues at the sector level. Sector working groups do recognise the importance of cross cutting issues and are increasing their effort to collect, for example, gender, age, or disability disaggregated data .One of the issues which should be addressed in order to improve high-level policy dialogue is the quality of monitoring and evaluation systems, which still need improvement (, Joint Budget Sector Review report, 2010). Statistical Capacity: A 2010 DFID assessment of the National Institute of Statistics of Rwanda (NISR) rates the fiduciary risks moderate. One of the constraints they find in the assessment is Weak capacity in the NISR makes it difficult to implement planned activities. This problem is however not exclusive to NISR . It is faced in a number of government departments. They find that NISR does not have adequate numbers of staff trained in to handle increased Public Financial Management activities envisaged under National Strategy for The Development of Statistics. NISR is currently mitigating these problems by implementing a new
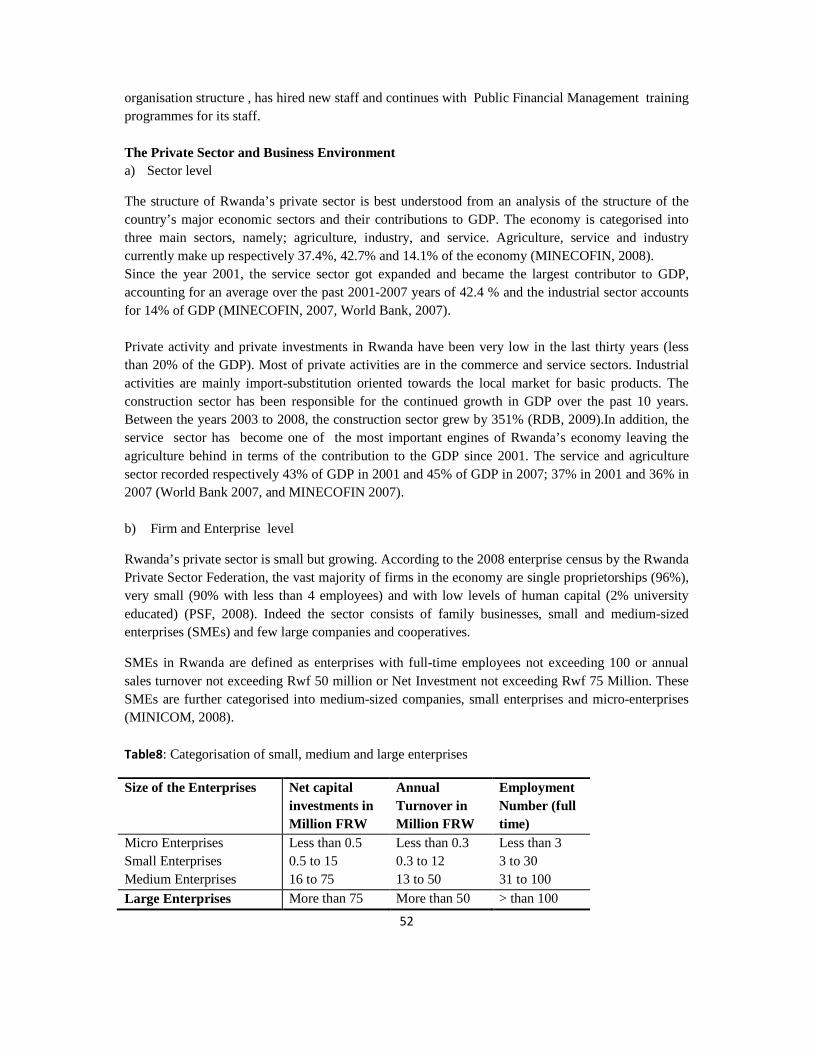
52
organisation structure , has hired new staff and continues with Public Financial Management training programmes for its staff. The Private Sector and Business Environment a) Sector level
The structure of Rwanda’s private sector is best understood from an analysis of the structure of the country’s major economic sectors and their contributions to GDP. The economy is categorised into three main sectors, namely; agriculture, industry, and service. Agriculture, service and industry currently make up respectively 37.4%, 42.7% and 14.1% of the economy (MINECOFIN, 2008). Since the year 2001, the service sector got expanded and became the largest contributor to GDP, accounting for an average over the past 2001-2007 years of 42.4 % and the industrial sector accounts for 14% of GDP (MINECOFIN, 2007, World Bank, 2007). Private activity and private investments in Rwanda have been very low in the last thirty years (less than 20% of the GDP). Most of private activities are in the commerce and service sectors. Industrial activities are mainly import-substitution oriented towards the local market for basic products. The construction sector has been responsible for the continued growth in GDP over the past 10 years. Between the years 2003 to 2008, the construction sector grew by 351% (RDB, 2009).In addition, the service sector has become one of the most important engines of Rwanda’s economy leaving the agriculture behind in terms of the contribution to the GDP since 2001. The service and agriculture sector recorded respectively 43% of GDP in 2001 and 45% of GDP in 2007; 37% in 2001 and 36% in 2007 (World Bank 2007, and MINECOFIN 2007). b) Firm and Enterprise level
Rwanda’s private sector is small but growing. According to the 2008 enterprise census by the Rwanda Private Sector Federation, the vast majority of firms in the economy are single proprietorships (96%), very small (90% with less than 4 employees) and with low levels of human capital (2% university educated) (PSF, 2008). Indeed the sector consists of family businesses, small and medium-sized enterprises (SMEs) and few large companies and cooperatives.
SMEs in Rwanda are defined as enterprises with full-time employees not exceeding 100 or annual sales turnover not exceeding Rwf 50 million or Net Investment not exceeding Rwf 75 Million. These SMEs are further categorised into medium-sized companies, small enterprises and micro-enterprises (MINICOM, 2008). Table8: Categorisation of small, medium and large enterprises
Size of the Enterprises Net capital investments in Million FRW
Annual Turnover in Million FRW
Employment Number (full time)
Micro Enterprises Less than 0.5 Less than 0.3 Less than 3 Small Enterprises 0.5 to 15 0.3 to 12 3 to 30 Medium Enterprises 16 to 75 13 to 50 31 to 100
Large Enterprises More than 75 More than 50 > than 100
53
Source: MINICOM2008 In December 2007 there were 72,994 establishments in the manufacturing, services and agriculture sectors, of which 71,899 (98.5%) comprised SMEs (PSF2008). In this PSF census, individual owned businesses account for 96.39% of the entire business universe in Rwanda with formally registered businesses accounting for less than 1% and cooperatives 2.89%.There is an acute shortage of formal and healthy SMEs in Rwanda. Businesses employing less than 4 persons account for close to 90% of total businesses in the country, micro enterprises are the largest employer in the private sector employing 53% of the total employees from the private sector, followed by small enterprises (36%).
The business environment in Rwanda
As far as reforms are concerned, Rwanda has recently seen a great success in the World Bank Doing Business 2010 report. For the first time since Doing Business started tracking reforms, Rwanda, led the world reforms. Overall, major reforms that have been implemented to assist the business community include easing the process of starting a business, register property, protect investors, trade across borders, access credit and paying taxes. These reforms made Rwanda to rise from 143rd to 67th place on the ease of doing business rankings 2010.
Getting credit was made easier with a new secured transactions act and insolvency act to make secured lending more flexible, allowing a wider range of assets to be used as collateral and a general description of debts and obligations. In addition, out-of-court enforcement of collateral has become available to secured creditors, who also now have top priority within bankruptcy. A new company law has strengthened investor protections by requiring greater corporate disclosure, director liability, and shareholder access to information.
Property registration was simplified by decreasing the number of days required to transfer a property. Business start-up was eased by eliminating a notarization requirement; introducing standardized memorandums of association; enabling online publication; consolidating name checking, registration fee payment, tax registration, and company registration procedures; and shortening the time required to process completed applications.
By implementing administrative changes-such as increased operating hours and enhanced cooperation at the border, along with the removal of some documentation requirements for importers and exporters Rwanda has improved trading times. Lastly, paying taxes was made easier by introducing online applications and tax clearance certificates and decentralized tax information and payer services.The implementation of these various policies and reforms contributed to the Rwanda’s improved ranking in the World Bank’s 2010 doing business report.
Rwanda’s Rankings on different aspects of the Business environment
In terms of economic freedom Rwanda is ranked 10th out of 46 economies in the sub-Saharan region by the Heritage Foundation (2010) and was fourth most improved economy on the 2010 index.7. In terms of ease of doing business, Rwanda moved from 143rd to 67th in 2009 and 58th in 2010 (The
7 Heritage Foundation www.hertigage foundation.org/index/country/rwanda last accessed 01/05/2010
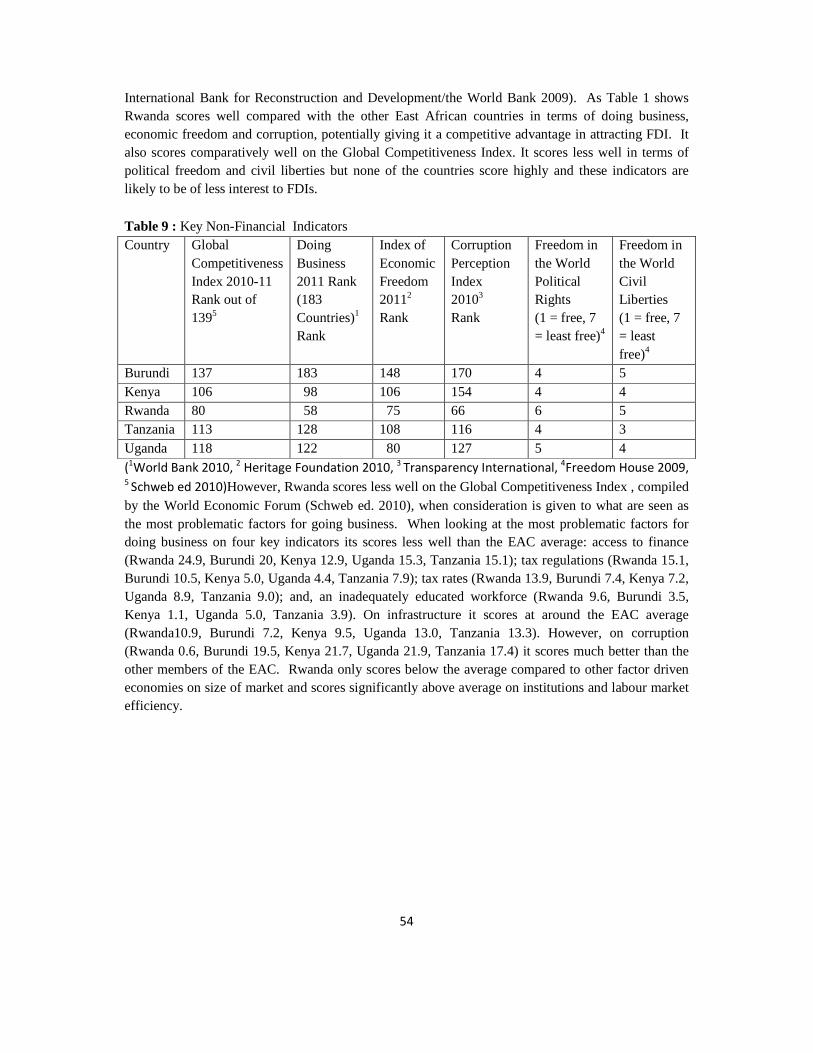
54
International Bank for Reconstruction and Development/the World Bank 2009). As Table 1 shows Rwanda scores well compared with the other East African countries in terms of doing business, economic freedom and corruption, potentially giving it a competitive advantage in attracting FDI. It also scores comparatively well on the Global Competitiveness Index. It scores less well in terms of political freedom and civil liberties but none of the countries score highly and these indicators are likely to be of less interest to FDIs.
Table 9 : Key Non-Financial Indicators Country Global
Competitiveness Index 2010-11 Rank out of 1395
Doing Business 2011 Rank (183 Countries)1
Rank
Index of Economic Freedom 20112
Rank
Corruption Perception Index 20103 Rank
Freedom in the World Political Rights (1 = free, 7 = least free)4
Freedom in the World Civil Liberties (1 = free, 7 = least free)4
Burundi 137 183 148 170 4 5 Kenya 106 98 106 154 4 4 Rwanda 80 58 75 66 6 5 Tanzania 113 128 108 116 4 3 Uganda 118 122 80 127 5 4 (1World Bank 2010, 2 Heritage Foundation 2010, 3 Transparency International, 4Freedom House 2009, 5 Schweb ed 2010)However, Rwanda scores less well on the Global Competitiveness Index , compiled by the World Economic Forum (Schweb ed. 2010), when consideration is given to what are seen as the most problematic factors for going business. When looking at the most problematic factors for doing business on four key indicators its scores less well than the EAC average: access to finance (Rwanda 24.9, Burundi 20, Kenya 12.9, Uganda 15.3, Tanzania 15.1); tax regulations (Rwanda 15.1, Burundi 10.5, Kenya 5.0, Uganda 4.4, Tanzania 7.9); tax rates (Rwanda 13.9, Burundi 7.4, Kenya 7.2, Uganda 8.9, Tanzania 9.0); and, an inadequately educated workforce (Rwanda 9.6, Burundi 3.5, Kenya 1.1, Uganda 5.0, Tanzania 3.9). On infrastructure it scores at around the EAC average (Rwanda10.9, Burundi 7.2, Kenya 9.5, Uganda 13.0, Tanzania 13.3). However, on corruption (Rwanda 0.6, Burundi 19.5, Kenya 21.7, Uganda 21.9, Tanzania 17.4) it scores much better than the other members of the EAC. Rwanda only scores below the average compared to other factor driven economies on size of market and scores significantly above average on institutions and labour market efficiency.
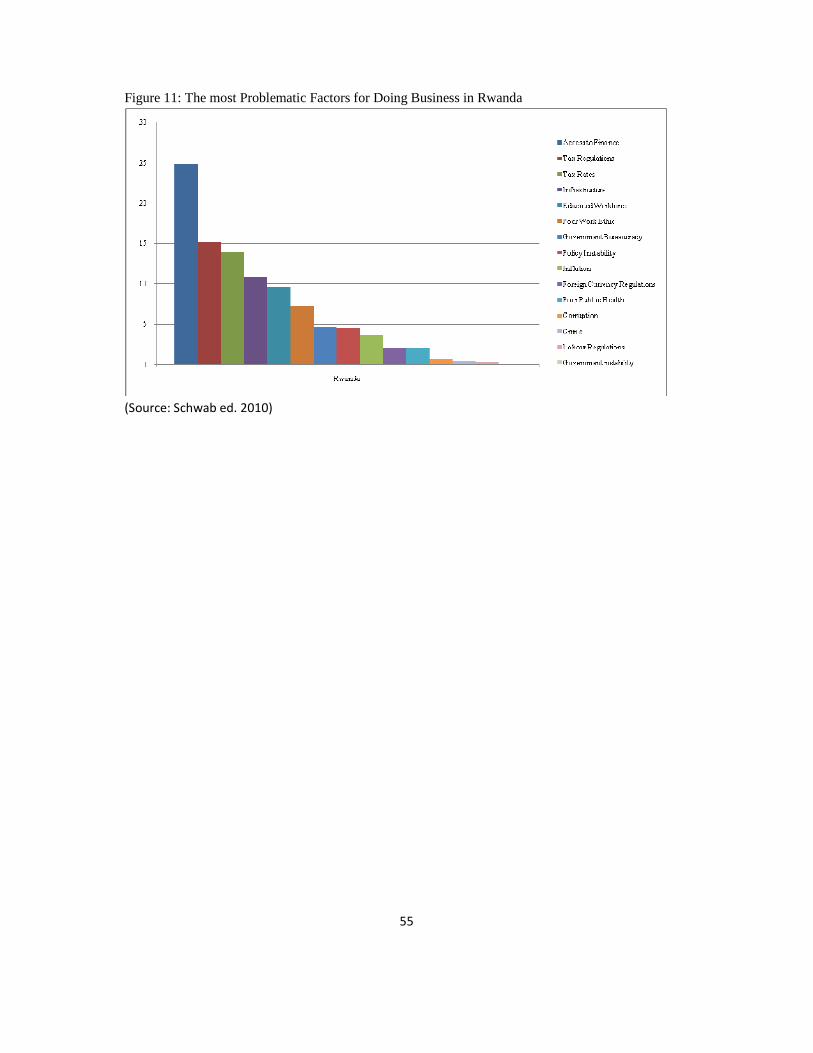
55
Figure 11: The most Problematic Factors for Doing Business in Rwanda
(Source: Schwab ed. 2010)
56
IV. Prospects for Transformation
Identification of export activities in which Rwanda can increase its international export competitiveness or diversify into (with additional efforts)
Rwanda Development Board (RDB) has undertaken a cluster selection exercise to identify alternative industries in which Rwanda has a chance of competing. Following analysis undertaken by OTF Group, six clusters have been selected for immediate action including mining services, niche tourism services and business process outsourcing in the service sector; and silk textiles, fruits and vegetable processing and dairy in the manufacturing sector. At commodity level, horticulture, hides and skins, handicrafts and pyrethrum are the sectors established by the government as priorities for investment promotion. Within the service sector, Rwanda has identified also tourism, financial service, engineering, construction, ICT, agribusiness, mining and transport as priority sub-sectors because of their strategic nature as well as their role as drivers and facilitators of economic growth and transformation.
i) Tourism
Rwanda Development Board has developed a new methodology which consists of recording international visitors rather than just tourists. International visitors in this new methodology include visitors from neighbouring countries, African countries and outside of Africa. Under the new methodology, in 2008 Rwanda attracted 985,000 visitors, up from 826,300 in 2007 (MINICOM, 2009).In 2008, the share of international visitors in Rwanda for business/conference/official purpose was the highest, accounting for 35.3% in the total of international visitors. The increase of arrivals in that context is favourable for the investment in property. Rwanda’s experiences are aimed at attracting mainly three specific types of tourists namely;
Eco-Tourists: These are visitors enjoy that nature-based activities and are particularly interested in Rwanda’s primates, animals and birds in the national parks and specialized circuit for example primate discovery tour; Explorers: These are visitors interested in Rwanda’s history and culture and who have desire to experience the real Rwandan beauty fall in this category. Individual Business Travellers: who are visitors coming to Rwanda for events and conferences and briefly tour the country as well as those seeking investment opportunities in the country. Since the re-launching of the tourism sector in 2002, the tourism industry has achieved steady growth in arrivals. This offers various investment opportunities especially in hotels and lodges, entertainment facilities, restaurants, tour operations etc. However, efforts to attract private investment and promote public-private partnership in a variety of tourism activities have been limited by skills gaps in the sector. Intensive and extensive skills development is needed to enable the industry to receive high level tourists because the existing skills base is far from adequate to meet the standards of an internationally competitive tourism industry
57
ii) Handicrafts: Handicrafts exports are also potentially important export sectors in the immediate and medium terms and a lot of efforts are being put in place to explore more opportunities in the world market.
V. What is to be Done
Recommendations on seizing identified opportunities for speeding economic transformation
Sustainable economic transformation will not only require Rwanda to move up the value chain in its major exports but also increase the ability of Rwanda to seize opportunities from the global economy by engaging with other countries and regions on mutually beneficial terms. The following are the recommendations needed for Rwanda to seize opportunities for speeding economic transformation. 1) Joined-up thinking in investment promotion and investment after-care activities; Past export promotion activities have been uncoordinated and of low impact. While the Government of Rwanda, through the RDB is becoming more coordinated with export promotion activities, the activities had previously not been executed in a coordinated manner. There is still scope for joined-up thinking in the way investment promotion activities and programs are coordinated in Rwanda in order to promote and retain both local and foreign direct investments which are critical for economic transformation.
2) Increasing the value of existing exports Given Rwanda’s concentrated export mix, small share of exports in the economy and low export growth, the government has made efforts to diversify exports in Rwanda. Although a number of new exports exist in Rwanda, the challenge of export diversification in Rwanda is not about the number of new export discoveries but rather that fact that Rwanda’s export discoveries are many but small(World Bank 2007).Thus, in light of its endowments, stage of development, and geography, Rwanda’s problem of export diversification is primarily a lack of scale in products other than coffee and minerals. Except for coffee, tea and minerals, other exports have relatively small values in terms of export revenues. In order to add value to their existing exports, Rwanda’s coffee, tea and tourism sectors should focus on moving towards the more stable value added or specialty segments of their respective export markets. Led by tea, coffee, mining and re-exports Rwanda’s exports have increased significantly over the past decade, rising to $262 million in 2008 which is close to a 50per cent growth rate since 2007. This marks an acceleration of an impressive trend in nominal export revenue growth since 2003. Although Rwanda has had an impressive growth in exports, imports to Rwanda have grown faster, from $325 million in2003 to $1,142 million in 2008 leading to a large trade deficit relative to neighbouring countries like Uganda, Kenya and Tanzania. Efforts to both expand exports more rapidly and at the same time reduce or substitute for imports are critical to reduce the trade deficit and ensure a stable macro-economic climate which is crucial for sustainable economic transformation. The large trade deficit is currently financed by international transfers. This is not sustainable and reduces the ability for the government to finance investments using these transfers
58
3) Diversify into new exports and develop Rwanda as a regional hub Since manufactures dominate global exports, it implies that there are opportunities in the large and expanding world markets in manufactures. In addition, communication and transport costs are falling and this has led to the fragmentation of much of manufacturing production into trade in tasks over time. The opportunity to trade in tasks represents a simplified entry point to international markets for industrial late-comers such as Rwanda who no longer need vertically integrated industries to enter into world trade. In order to promote trade in tasks, Rwanda should take advantage of the growing information technology-enabled shared services and business process outsourcing. In addition, Rwanda should continue pursuing its long term objective of positioning and promoting itself as a regional hub and a location which provides lower costs for high value shared services. This will enable Rwanda to attract international companies in sectors such as banking to establish themselves in Rwanda together with their service centres. This will help speed up economic transformation in the short and medium term. The second aspect of diversification relates to markets. Research has shown that the majority of export growth at the extensive margin is achieved not through new products (discovery) but by expanding existing exports to new markets (Brenton & Newfarmer, 2009). Most developing countries like Rwanda export to a relatively narrow range of markets, far fewer than developed countries exporting in the same sector. Expanding market reach in products that have already proven to be competitive in some export markets can offer a substantial channel for growth. To achieve this Rwanda typically requires overcoming some barriers to competitiveness such as transport costs, standards, or access to market information.(Rwanda)
4) Deepen regional integration and international trade in order to facilitate and increase exports. Rwanda is a landlocked country that is located a big distance from the ports through which it trades i.e.1800km from Mombasa and 1400km for Dar Es Salam. Due to this limitation, Rwanda should continue to deepen its efforts in facilitating trade and promoting conformity with standards in order to increase exports both in regional and international markets. The Rwandan government has reduced tarrif barriers through the negotiations in the East African community trade block. However, a number of non-tarrif barriers to trade at both regional and international level still remain. At regional level, Rwanda faces the highest costs for exporting containers in the East African Community. The time taken to export a container in Rwanda takes 42 days compared to 24 days in Tanzania. The cost of transporting a container from Mombasa to Kigali (including all customs payments) amounts to 53 per cent of its value. The extensive length of time it takes for containers arriving in Mombasa and Dares Salaam to reach Kigali results not only from poor road infrastructure, but also from the many weigh bridges and police roadblocks along the route(BICS survey). It also results from lengthy bureaucratic procedures for customs, health and standards clearance within Rwanda. These factors constitute non-tariff barriers that can be addressed through increased bilateral and regional negotiations Rwandan exporters must meet high standards of quality control and packaging required in international markets According to the ministry of commerce strategic plan, there are two main challenges for Rwandan food products exported to the European Union. They include the quality control of processed food products and packaging.
59
The use of traditional technology to process different products has revealed challenges in exporting to the European market. The EU requires the use of Hazard Analysis and Critical Control Points (HACCP) as a minimum for the processing of food, but importers often apply private standards which are much more onerous. Packaging: Although packaging is common issue to all exporters, it affects exports of fruits and vegetables more. Rwanda’s exporters have to first import packaging before they can export since there is no packaging plant in Kigali. However, the ban on the import of plastics has meant that exporters struggle to import the optimal packaging products. There should be continued efforts to encourage investors to invest in packaging plants which will produce packages of high standards in order to expand exports and increase economic transformation in Rwanda 5) Increase the level and quality of investment in productive sectors For Rwanda to speed economic transformation it must increase the level and quality of investment in the productive sectors like manufacturing. Two areas that are useful in developing manufactured (low technology) and resource-based exports. These are the development of skills necessary for manufacturing, and the development of infrastructure to offset the land-lockedness as a disadvantage faced by Rwandan exporters. 6) Import substitution: Much of the efforts in transforming Rwanda’s economy have been geared towards increasing exports . However there is still room to close the trade deficit in Rwanda by manufacturing some of the products that Rwanda exports locally. Products in which Rwanda has an opportunity to locally produce and substitute for imports include the cement and the vegetable oil. These are mainly imported from Uganda and Kenya at the moment. 7) Deepening the integration of Rwanda’s export sector and the overall economy; In order to achieve broad-based economic growth coupled with economic transformation an important issue is how Rwanda translates export trade into growth and poverty reduction. One leading indicator is the degree to which a country’s export sector is integrated with its wider economy, particularly through forward and backward supply linkages. To this end, these linkages between Rwanda’s manufacturing export sector and the rural agricultural sector are still limited. Indeed, while an enclave sector may contribute to employment and foreign exchange earnings, it is much less likely to deliver the critical, dynamic benefits of exporting. A well-integrated sector, by contrast, should be in a better position to access technology and knowledge spill-overs while also benefitting from greater direct and indirect employment and output opportunities. The linkages between Foreign direct investment and the local supply chains (a relevant proxy for the export sector) in Rwanda is low. – The intensity of these linkages is an important driver of industrial development (c.f. Rodriguez-Clare, 1995; Markusen and Venables, 1999) and Rwanda Development Board, the institution mandated with increasing investment should coordinate with relevant ministries like that of commerce, agriculture and finance to help strengthen these linkages by identifying potential sectors which generate this broad based growth. This is because not all sectors are equally predisposed to contribute to broad-based economic growth.
60
Conclusion Due to sustained government efforts to improve and regulate the business and investment climate the livelihoods, Rwanda has had impressive economic growth in terms of GDP and exports in the past ten years. However the translation of this economic growth into sustained economic transformation that increases income and employment for a large size of the population has been limited. With policies and reforms that have been implemented so far, Rwanda is on the right path in terms of positioning and structuring the economy for long term economic transformation. However some challenges still remain including a large trade deficit, low added value of manufacturing sector and dependency of external aid. Addressing these limitations is crucial in both the short and long term in order to achieve sustained economic transformation.

61
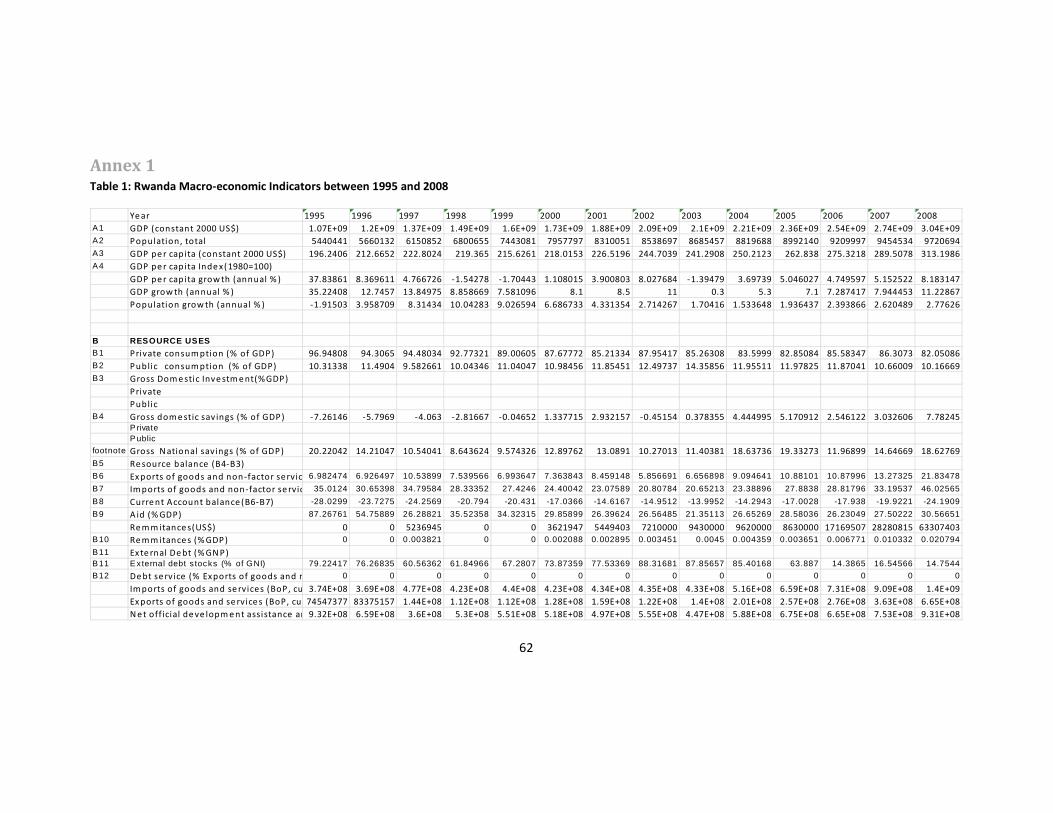
62
Annex 1 Table 1: Rwanda Macro-economic Indicators between 1995 and 2008
Ye ar 1995 1996 1997 1998 1999 2000 2001 2002 2003 2004 2005 2006 2007 2008
A1 GDP (constant 2000 US$) 1.07E+09 1.2E+09 1.37E+09 1.49E+09 1.6E+09 1.73E+09 1.88E+09 2.09E+09 2.1E+09 2.21E+09 2.36E+09 2.54E+09 2.74E+09 3.04E+09
A2 Population, total 5440441 5660132 6150852 6800655 7443081 7957797 8310051 8538697 8685457 8819688 8992140 9209997 9454534 9720694
A3 GDP pe r capita (constant 2000 US$) 196.2406 212.6652 222.8024 219.365 215.6261 218.0153 226.5196 244.7039 241.2908 250.2123 262.838 275.3218 289.5078 313.1986
A4 GDP pe r capita Inde x(1980=100)
GDP pe r capita grow th (annual % ) 37.83861 8.369611 4.766726 -1.54278 -1.70443 1.108015 3.900803 8.027684 -1.39479 3.69739 5.046027 4.749597 5.152522 8.183147
GDP grow th (annual % ) 35.22408 12.7457 13.84975 8.858669 7.581096 8.1 8.5 11 0.3 5.3 7.1 7.287417 7.944453 11.22867
Population grow th (annual % ) -1.91503 3.958709 8.31434 10.04283 9.026594 6.686733 4.331354 2.714267 1.70416 1.533648 1.936437 2.393866 2.620489 2.77626
B RESOURCE USESB1 Private consum ption (% of GDP) 96.94808 94.3065 94.48034 92.77321 89.00605 87.67772 85.21334 87.95417 85.26308 83.5999 82.85084 85.58347 86.3073 82.05086
B2 Public consum ption (% of GDP) 10.31338 11.4904 9.582661 10.04346 11.04047 10.98456 11.85451 12.49737 14.35856 11.95511 11.97825 11.87041 10.66009 10.16669
B3 Gross Dom e stic Inve stm e nt(% GDP)
Private
Public
B4 Gross dom e stic sav ings (% of GDP) -7.26146 -5.7969 -4.063 -2.81667 -0.04652 1.337715 2.932157 -0.45154 0.378355 4.444995 5.170912 2.546122 3.032606 7.78245P rivateP ublic
footnote Gross N ational savings (% of GDP) 20.22042 14.21047 10.54041 8.643624 9.574326 12.89762 13.0891 10.27013 11.40381 18.63736 19.33273 11.96899 14.64669 18.62769
B5 Re source balance (B4-B3)
B6 Ex ports of goods and non-factor service s(% GDP)6.982474 6.926497 10.53899 7.539566 6.993647 7.363843 8.459148 5.856691 6.656898 9.094641 10.88101 10.87996 13.27325 21.83478
B7 Im ports of goods and non-factor se rvice s (% GDP)35.0124 30.65398 34.79584 28.33352 27.4246 24.40042 23.07589 20.80784 20.65213 23.38896 27.8838 28.81796 33.19537 46.02565
B8 Curre nt Account balance (B6-B7) -28.0299 -23.7275 -24.2569 -20.794 -20.431 -17.0366 -14.6167 -14.9512 -13.9952 -14.2943 -17.0028 -17.938 -19.9221 -24.1909
B9 A id (% GDP) 87.26761 54.75889 26.28821 35.52358 34.32315 29.85899 26.39624 26.56485 21.35113 26.65269 28.58036 26.23049 27.50222 30.56651
Re m m itance s(US$) 0 0 5236945 0 0 3621947 5449403 7210000 9430000 9620000 8630000 17169507 28280815 63307403
B10 Re m m itance s (% GDP) 0 0 0.003821 0 0 0.002088 0.002895 0.003451 0.0045 0.004359 0.003651 0.006771 0.010332 0.020794
B11 Ex te rnal De bt (% GN P)B11 E xternal debt s tocks (% of GNI) 79.22417 76.26835 60.56362 61.84966 67.2807 73.87359 77.53369 88.31681 87.85657 85.40168 63.887 14.3865 16.54566 14.7544
B12 De bt se rvice (% Exports of goods and non-factor se rvices)0 0 0 0 0 0 0 0 0 0 0 0 0 0
Im ports of goods and se rvices (BoP, curre nt US$)3.74E+08 3.69E+08 4.77E+08 4.23E+08 4.4E+08 4.23E+08 4.34E+08 4.35E+08 4.33E+08 5.16E+08 6.59E+08 7.31E+08 9.09E+08 1.4E+09
Ex ports of goods and se rvice s (BoP, curre nt US$)74547377 83375157 1.44E+08 1.12E+08 1.12E+08 1.28E+08 1.59E+08 1.22E+08 1.4E+08 2.01E+08 2.57E+08 2.76E+08 3.63E+08 6.65E+08
N e t official de ve lopm e nt assistance and official aid re ce ive d (constant 2008 US$)9.32E+08 6.59E+08 3.6E+08 5.3E+08 5.51E+08 5.18E+08 4.97E+08 5.55E+08 4.47E+08 5.88E+08 6.75E+08 6.65E+08 7.53E+08 9.31E+08
63
References
1. World Bank, (2010), World Bank Development Indicators (WDI) database, World Bank, Washington DC
2. World Bank, (2007), Rwanda Toward Sustained Growth and Competitiveness (in two volumes) Volumes II: Main Report, Poverty Reduction and Economic Management 3, AFCC2, Africa Region
3. DFID, (2008), Source and obstacles to economic growth in Rwanda: An analytical overview, discussion draft for working meeting of 30/31 January 2008, UK Department for International Development
4. World Bank, (2010), Doing Business Report, World Bank Washington DC 5. MINECOFIN, (2008), Annual Report on the implementation of the EDPRS. Kigali, Government
of Rwanda 6. MINICOM, (2009), Rwanda craft. Industry sector strategic plan (2008-2009), Kigali,
Government of Rwanda 7. MINICOM, (2002), National Investment Strategy, Kigali, Government of Rwanda 8. MINICOM, (2006), Trade policy and strategies, Kigali, Government of Rwanda 9. MINICOM, (2009), Rwanda Industrial Capacity & Performance, Kigali, Government of Rwanda 10. NISR, (2008), Rwanda Development Indicators, Kigali, Government of Rwanda 11. MINICOM, (2005), Diagnostic Trade Integration study, Kigali, Government of Rwanda 12. MINAGRI and MINICOM, (2008), Rwanda National coffee strategy 2009-2012, Kigali,
Government of Rwanda 13. PSF, (2008), Business Census 2007-08, Kigali, Private Sector Federation 14. MINECOFIN (2007), Economic Development Poverty Reduction Strategy, Kigali, Government
of Rwanda 15. World Bank, (2007), World Development Indicators, Washington DC 16. RIEPA, (2007), Annual Report, Kigali, RIEPA 17. Privatization Secretariat, (2006), Annual Report, Kigali, Privatisation Secretariat 18. MINICOM, (2008) Investment Promotion Strategy, Kigali, Rwanda Government 19. UNCTAD, (2006) An Investment Guide to Rwanda, New York and Geneva, United Nations 20. UNCTAD, (2006), Investment Policy Review: Rwanda, New York, United Nations 21. BNR, (2007), Annual Report, Kigali, Rwanda Government 22. IFC, (2005), Market Industrial Assessment Report, Washington DC 23. MINICOM, (2009), Joint Sector Review, Kigali, Rwanda Government 24. World Bank, (2009) Doing Business, Washington DC 25. World Bank, (2010, Doing Business, Washington DC 26. PSF, (2008), Cutting the cost of red tape for business growth in Rwanda, Kigali, Private Sector
Federation 27. MINECOFIN, (2008), Annual Economic Report, Kigali, Rwanda Government 28. Chandra, Vandana, I. Osorio, M. Desai, and Y. Li, (2006), Export Diversification Rwanda too
many export discoveries, too little scaling-up (Background paper for the Rwanda Country Economic Memorandum).
29. MINICOM, (2008), Industrial Master Plan Survey, Kigali, Government of Rwanda 30. Cichello, P. and Sienaert, A. (2009). Making Work Pay in Rwanda: Employment, Growth and
Poverty Reduction.Washington DC: The World Bank.
64
31. NISR, (2006), National Labour Market Survey, Kigali, Rwanda Government
32. Education Development Centre (EDC) (2009). Rwanda Youth Employment Assessment. Washington DC: USAID.
33. NISR, (2007), Poverty Assessment for EDPRS, Kigali, Rwanda Government
34. Foreign Investment Advisory Service (FIAS) (2006) Sources of Informal Economic Activity in Rwanda. Kigali: National Institute of Statistics of Rwanda.
35. Strode, M, Wylde, E. and Murangwa, Y. (2007) Labour Market and Economic Activity Trends in Rwanda. Kigali: National Institute of Statistics of Rwanda.