Embed Size (px)
Citation preview
1
INSTITUTE FOR WORLD ECONOMICS
HUNGARIAN ACADEMY OF SCIENCES
W o r k i n g P a p e r s
No. 136 June 2003
Kálmán Dezséri
BUSINESS-CYCLE DEVELOPMENTIN HUNGARY AND EUROPE:
THE CONSEQUENCES OF EU AND EMUACCESSION FOR HUNGARY’S LABOUR MARKET
1014 Budapest, Orszagház u. 30.Tel.: (36-1) 224-6760 • Fax: (36-1) 224-6761 • E-mail: [email protected]

2
SUMMARY
Structural similarities and differences betweena country and the economic integrationframework to which it belongs show the de-gree to which the country may be exposed toasymmetric shocks. Synchronization of busi-ness cycles implies that asymmetric shock isprecluded, or offset by national monetarypolicies. After joining a monetary union thesituation changes. Where synchronization ofbusiness cycles is lacking, a common mone-tary policy will tend to exacerbate differencesin the cycles and adversely affect economicperformance.
In the case of the EU and EMU, want ofsynchronization between the business cyclesof a candidate country and the EU can be off-set partly by labour-market flexibility. Joiningthe EU may mean foregoing some flexibility inthe labour market, because the EU labourmarkets have become rigid and need reformsand greater flexibility themselves.
Methodologically, the time series of GDPand industrial-production growth rates can beused to measure this synchronization. In thecase of Hungary, the EU–Hungarian business-cycle convergence had been no less than theconvergence among EU countries. Althoughthe results of the analyses using differentmethods vary but all of them show that thissynchronization has been increasing since themid-1990s.
Synchronization of national business cy-cles and national catching-up processes dis-guise regional differences in synchronizationand convergence of development levels. Sev-eral recent analyses and studies have shown acombination of convergence of economic de-velopment levels among countries and in-creasing divergence among regions withincountries to be a feature of the present globaleconomic situation. The presence or absenceof such a feature in Hungary will have far-
reaching consequences to its integration intothe EU.
Some major questions arise about othereconomic-policy options instead of adjustingexchange and interest rates, which EMU pre-cludes. It can be seen that wages have to bearthe brunt of adjustment under EMU and needto react flexibly to shocks, lest differences innational unemployment rates develop. Wagestherefore have to be highly flexible and differ-entiated in the various economic zones ofEMU. An important governmental task in EUcountries is to make the national labour mar-kets more flexible, which could be donethrough institutional reforms aimed at re-ducing unemployment.
Although Hungary’s economy has visiblyconverged on those of the EU countries, po-tential adverse effects of EU accession andEMU could bring about serious economic dif-ficulties. Participation of Hungary in EMUcalls for an economy able to adjust eitherthrough market forces or adequate economicpolicy.
The structural differences of labour-market supply and demand are likely to re-main on the Hungarian labour market forquite a long time. Labour markets usually re-act to negative demand shocks by reducingthe participation rate and increasing the shareof the inactive population. Due to the struc-tural problems in the Hungarian labour force,much of the inactive population cannot beconsidered as potential labour in periods ofeconomic prosperity or in the medium term.All these features will have effects on the toolsof adjustment policy to cope with shocks afterHungary’s accession to the EU and EMU.

5
INTRODUCTION
Hungary, like all Central and Eastern European(CEE) countries has undergone radical eco-nomic changes in the transition process of thelast 13 years, affecting its economic structureand reallocating its labour force. The forth-coming accession to the EU and subsequentparticipation in the Economic and MonetaryUnion (EMU) herald further deep-seatedchanges. As the country prepares, the issuesraised include catching up with EU levels ofdevelopment, greater structural similarities,and synchronization of business cycles.
Structural similarities and differencesbetween a country and the economic integra-tion framework to which it belongs show thedegree to which the country may be exposed toasymmetric shocks. Synchronization of busi-ness cycles implies that asymmetric shock isprecluded, or offset by national monetary poli-cies. The situation in this respect may be anindication as to whether the optimum cur-rency-area theory applies to that economy.Where synchronization of business cycles islacking, a common monetary policy will tendto exacerbate differences in the cycles and ad-versely affect economic performance.
In the case of the EU and EMU, want ofsynchronization between the business cycles ofa candidate country and the EU can be offsetpartly by labour-market flexibility. Joining theEU may mean foregoing some flexibility in thelabour market, because the EU labour marketshave become rigid and need reforms andgreater flexibility themselves.
This paper discusses some important is-sues of adjustment mechanisms under theconditions of EMU. Part 1 presents some chal-lenges of EU membership and EMU participa-tion. Part 2 analyses the relations between thebusiness cycles and Part 3 shows regional dis-parities within Hungary. Part 4 describes whatEU and EMU membership entails, and Part 5
the salient features of the Hungarian labourmarket. Part 6 shows the likely consequences.
1) CHALLENGES BY EU MEMBERSHIPAND EMU PARTICIPATION
Accession to the EU will have positive andnegative effects on the economies and societiesof the CEE countries. The benefits will out-weigh the costs, especially in the long run, butpressure on certain economic, social and po-litical groups will intensify. These can be iden-tified in terms of geographical locations or re-gions, social strata and occupational groups.The optimum accession policy would aim atmaximizing the benefits and minimizing theadverse consequences, so that accession willcertainly bring further policy adjustments.
Identification of the potential beneficiar-ies of accession and the groups at risk is a keyintegration issue for policy makers and thegeneral public. This is the initial stage in for-mulating the measures for alleviating the costsfor losers and increasing the number of win-ners.
One urgent need is for a strategy to dis-seminate information about the expected ad-vantages and drawbacks of accession. EU ac-cession will raise several new economic socialand political issues or exacerbate existing eco-nomic, political and social issues and prob-lems. The economic aspects of these will bedetermined by the completion of free move-ment of production factors (goods, services,capital and labour). Special areas of these areagriculture and EMU. The social problems willinclude a deepening crisis for vulnerable socialgroups determined by age structure, educa-tional background, already existing povertyand inequality, and occupational and paystructures. The accession will affect a widerange of political mechanisms and elements.The success of the accession and the optimiza-tion of winners’ and losers’ positions will de-pend much on the preparedness of the publicadministration, the activity and efficiency of

6
non-governmental organizations, the qualityof pubic education, and not at least, the in-volvement of the public in the accession proc-ess.
Participation in EMU has more complexconsequences. In a monetary union, exchangeand interest rates can no longer be used asadjustment measures for differences of eco-nomic development between member coun-tries. Such differences may emerge due toasymmetric shocks affecting the members orthrough diverging business cycles. A shockwill cause production and employment to fallrapidly. Before EMU, countries were able todevalue their currencies and so regain eco-nomic competitiveness. Now the range of pos-sible policy measures has been reduced.
2) RELATIONS BETWEEN THEHUNGARIAN AND EU BUSINESS CYCLES
Hungary developed strong depend-ence on the EU economy in the1990s, as the transition to a marketeconomy transferred its economicties there from the former Come-con countries. The reorientationin its economic relations hasrested on increasing merchandisetrading with EU countries andmounting flows of inward FDIfrom Western European compa-nies.
The structure of the Hun-garian economy has become very similar tothat of the twelve EMU countries. This can beshown in the sector distribution of value addedand of employment (Table 2)
It is important to know whether Hun-gary’s business cycle has converged with thatof the EU over the last decade. Methodologi-cally, the time series of GDP and industrial-production growth rates can be used to meas-ure this synchronization, on which several
studies have been published in recent years.1Although their methods of analysis differed,the general conclusion in most cases was thatthe EU–Hungarian business-cycle convergencehad been no less than the convergence amongEU countries. This synchronization has beenincreasing since the mid-1990s.
Table 1Hungary’s foreign trade with the world
and with the EU
Exports(USD mn)
Imports (USD mn)
World EU
EU(%) World EU
EU(%)
1991 10187 4659 45.7 11382 4682 41.11992 10705 5327 49.8 11079 4734 42.71993 8907 4140 46.5 12530 5024 40.11994 10701 5457 51.0 14554 6600 45.31995 12867 8080 62.8 15466 9515 61.51996 13145 8250 62.8 16209 9685 59.81996* 15704 10949 69.7 18144 11301 62.31997* 19100 13602 71.2 21234 13326 62.81998* 23005 16782 72.9 25706 16479 64.11999* 25013 19068 76.2 28002 18049 64.52000* 28092 21117 75.2 32079 18761 58.52001* 30498 22651 74.3 33682 19464 57.8* Including foreign trade in industrial free-trade zones.Source: Central Statistical Office (CSO), Budapest.
EU Commission analyses have shownthat Hungary’s GDP growth rate has achieveda fairly high correlation of 0.79 with that ofthe EU 15 (Table 3). Indeed, it had the strong-est coefficient found among the 13 applicantcountries, where the others showed lower,very low or even negative correlations. Com-paring the trends of pure GDP growth ratessuggests that the cyclical movements of the 1 E.g. Frenkel, Nickel and Schmidt (1999), Boone andMaurel (1999), IMF (2000), EU Commission (2001),and Fidrmuc and Korhonen (2001).
Table 2Sector structure of value added and employment in Hungary and
the EMU countries, 2000, %
Value added EmploymentSector EMU 12* Hungary EMU 12* HungaryAgriculture, forestry 2.9 4.4 5.3 5.9Industry (incl. energy) 23.2 28.0 20.4 28.1Construction 5.5 4.8 7.3 6.4Wholesale, retail, transport,hotels, restaurants 21.3 22.3 25.0 24.5
Finance, real estate 26.1 20.9 13.0 7.2Other services 21.0 19.2 29.1 27.9* Weighted average.Sources: OECD, Eurostat and CSO.

7
Hungarian economy and the EU economieswere usually being influenced by the sameeconomic factors over the last decade.
Table 3Correlation between the GDP growth rates of Hun-
gary and of the EU
Average GDP (monthly values, annualgrowth rates), 1994–2000 3.5
Correlation coefficient with EU 15,January 1996–February 2001 0.79
Source: EU Commission (2001).
The synchronized movements of GDPgrowth rates in Hungary and the EU duringthe first half of the 1990s were not broughtabout by symmetrical economic shocks. Theslowdown in Hungary’s economic growth ratewas caused partly by the systemic change andpartly by the economic recession in the EU,which was resulted by German reunification.Much has changed since then, so that truesimilarities could be observed in their businesscycles in the second half of the 1990s. Bothwere affected by the Russian crises and thesubsequent slowdown in economic growthrates, and finally by the global slowdown ineconomic performance.
The same conclusion can be drawn froma comparison of the seasonally adjusted realGDP figures (Figure 1).
Figure 1Seasonally adjusted real GDP growth rates
(quarterly data)
Source: Csajbók and Csermely (2002).
A more precise presentation of the syn-chronization of business cycles could beachieved by separating the trends for GDPgrowth (potential GDP) and for output gap,
but shortcomings in the statistical data preventthis being done in Hungary’s case.
Industrial-production trends can alsoprovide useful information. Looking at Hun-gary’s quarterly data, the long-term time seriesreveals an increasing correlation with the EUindustrial cycle. The result of the calculation ofthis made by the EU Commission is comparablewith the correlation result for GDP growthrates. The correlation has increased over thelast decade. At the same time, the amplitude ofthe Hungarian industrial-production cycle hasincreased beyond the value for the EU. Thisimplies a firm positive correspondence be-tween the EU economy and the Hungarianeconomy, so that further catching up by Hun-gary would be more easily attained in the pres-ence of strong GDP growth rate in the EUcountries.
Table 4Correlation of Hungary’s industrial-production
growth rates with those of the EU
1994–71997–June2001
Change
Average industrial pro-duction (monthly values,annual growth rates) 7.2 13.0 5.8
Correlation coefficientwith EU-15 0.577 0.66 0.09
Standard deviation (multi-ple of EU standard devia-tion) 2.5 3.2 0.7
Source: EU Commission (2001).
The Hungarian National Bank, in its cal-culations, replaced the trend in GDP growth(potential GDP) and output gap with analysisof industrial-production data, and determinedthe business cycles with the Baxter-King filter2
and logarithms of real quarterly data.3 Al-though industrial production is only part oftotal output, it makes a good indicator of thebusiness cycle. International experience hasshown that between GDP and industrial pro-duction there is a strong correlation. Moreo-
2 The two parameters of the filter were 6 and 32, whicheliminated cycles shorter than one-and-a-half andlonger than eight years.3 Csajbók and Csermely (2002).

8
ver, there are more frequent and reliable in-dustrial production time series than GDP data.
Hungary and the EU showed oppositetrends in their business cycles in the early1990s, as German unification was still havingpositive effects on industrial demand in the EU,while Hungary was dominated by the effects ofthe transformation recession. Later, the EMScrisis of 1993 triggered an economic recessionin the EU countries, but this affected the al-ready-recovering level of Hungarian industrialproduction only slightly.
The connection between the industrialproduction cycles of the EU and Hungary hadchanged substantially by the mid-1990s. Thepreviously dominant contrasting trends weregradually replaced by synchronized cycles.This change was mainly brought about by theshift in the structure of foreign trade. After thecollapse of Hungary’s Comecon-related trade,the share of the EU rapidly increased to 50–70per cent of exports and imports. In parallelwith this, the correlation coefficient betweenthe industrial-production cycles of the EU andHungary gradually increased from 0.22 percent in 1992 to 0.66 in 2000. During thewhole decade, Hungarian business cyclesshowed greater volatility than those of the EU,due to the higher growth rates of the transitionperiod.
Figure 2Cyclical component of industrial production in the
EU 15 and Hungary
Source: Based on Csajbók and Csermely (2002).
Business-cycle development can also beanalysed in a way that distinguishes supply-side and demand-side effects, for instance withstructural vector auto-regressive (VAR) mod-els. This method has two advantages. (i) Thesupply-side shocks can be considered autono-mous factors and always affect an economy in
the same way, irrespective of whether it be-longs to a monetary union or not. The reasonfor this is that the effects of a monetary policyalways appear on the demand side, where thesymmetry of shocks is usually influenced bydifferences of reaction to the single monetarypolicy by members of the monetary union. Sothe demand-side shocks and the symmetryhave less relevance under monetary-unionconditions to evaluating their possible symme-try. (ii) The separation of supply and demand-side shocks explicitly distinguishes long-term(supply-side) and short-term (demand-side)effects. The supply shocks can be consideredlong lasting because many result from devel-opment or changes in production technologies.This is important because modern under-standing of monetary policy defines the pri-mary task differently: monetary policy shouldsmooth temporary fluctuations, not influencemain trends. So it can achieve price stabilityand contribute to a permanent increase of out-put by offsetting demand shocks. That meansthe optimality of a currency zone depends onthe similarity of demand shocks.
The two arguments come to different,perhaps contradictory conclusions and theirrelevance may differ from various vantagepoints. In Hungary’s case, the second argu-ment has more relevance, because of the radi-cal structural changes of the 1990s gave a se-ries of country-specific supply shocks, deter-mined basically by imports of technology. Sothere were fewer or more limited synchronizedmovements among the supply effects in the EUand Hungary. However, the catching-up proc-ess in Hungary will reduce such supply-sideasymmetries and increase the correlation ofsupply-side cycles in the near future.
In Hungary’s case, a generally used cal-culation and analytical method was applied.4The separation of supply and demand rests onthe simple assumption that demand-led price-level increases result in a temporary increasein output and supply-led price-level increasesin a lasting decrease in output. First, demandand supply shocks were calculated for each EUcountry from quarterly data. Then three types
4 Based on Blachard and Quah (1989) and developed byBayoumi and Eichengreen (1993).

9
of characteristic weighted averages were cal-culated so that the variance of the time serieswas determined by (a) the first main compo-nent (coefficient) (b) inflation, or (c) theshares of EU countries in total Hungarian ex-ports.
The result of the calculation based on (a)was that the demand-side correlation showed alevel of symmetry corresponding to that ofmost present EU members. The supply-sidecorrelation showed a weaker level, however.This implies that the possibility of exchange-rate adjustment may still be a useful policyweapon for adjusting the Hungarian economy.The situation may improve after EU accession,as the features of the catching-up process al-ready mentioned will increase the symmetry offuture supply-side shocks.
The calculation using inflation (b) asweights showed that the supply and demandcorrelation between Hungary and the EU in-creased. The correlation coefficient for the pe-riod from the first quarter of 1992 to thefourth quarter of 2000 was about 0.23 and forthe period from the first quarter of 1996 to thefourth quarter of 2000 it was 0.7.
Figure 3Average demand shocks in Hungary and the EU
(quarterly data)
Source: Based on Csajbók and Csermely (2002).
Figure 4Average supply shocks in Hungary and the EU
(quarterly data)
Source: Based on Csajbók and Csermely (2002).
The demand for Hungarian exports in-fluenced significantly the development of thebusiness cycle and external balances, whichmeans that shares of EU countries in totalHungarian exports (c) can be reasonableweights for constructing a specific, weightedaverage time series of demand and supplyshocks. The symmetry between the supply anddemand fluctuations of the Hungarian econ-omy and its main trading partners can bemeasured under the condition of disability toadjust by using own exchange-rate policy.
With the time series calculated with ex-port shares (c) as weights, there is a weakercorrelation between the supply and demandshocks, mainly because the symmetry betweenthe Hungarian business cycle and that of itstwo main trading partners, Germany and Aus-tria, was rather limited for the whole of the lastdecade. However, the supply and demandcorrelation between the Hungarian and Ger-man data increased slightly.
Table 5Supply and demand correlation between Hungary
and the EU(1Q/1992–4Q/2000)
Country Demand Supply Share in Hungary’sexports (%)
GermanyAustriaItalyFranceNetherlandsBelgiumFinlandSpain
0.120.100.360.390.150.030.230.17
-0.08-0.070.230.190.170.330.050.17
52.111.39.18.66.64.82.94.8
EU* 0.22 0.04* Weighted average.Source: Csajbók and Csermely (2002).
Besides the National Bank of Hungary,similar SVAR-model analyses were made byFidrmuc and Korhonen (2001) and Frenkel,Nickel and Schmidt (1999). A thorough com-parison of their results could provide a moreaccurate description, as there are significantdifferences between them. However, theyagree in saying that there is increasing sym-metry and a strengthening correlation betweenthe business cycles of Hungary and the EU.
10
3) REGIONAL DISPARITIES IN HUNGARYAND POTENTIAL CONSEQUENCES OF
THEM
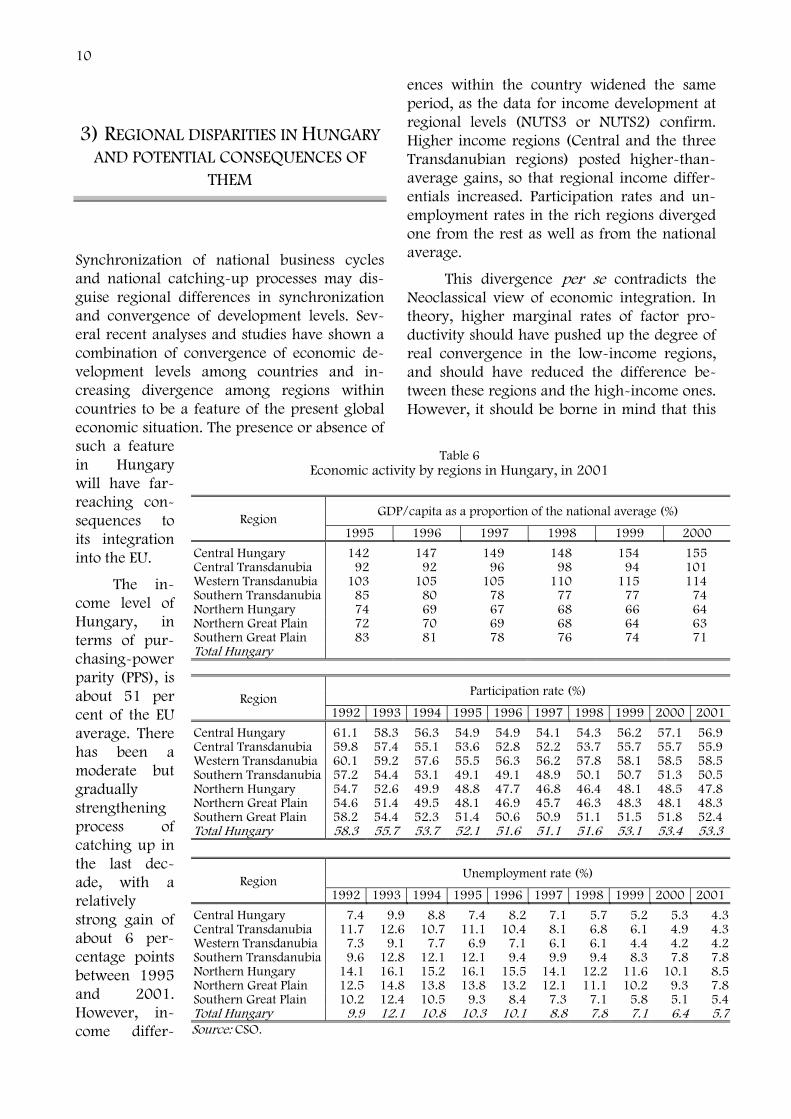
Synchronization of national business cyclesand national catching-up processes may dis-guise regional differences in synchronizationand convergence of development levels. Sev-eral recent analyses and studies have shown acombination of convergence of economic de-velopment levels among countries and in-creasing divergence among regions withincountries to be a feature of the present globaleconomic situation. The presence or absence ofsuch a featurein Hungarywill have far-reaching con-sequences toits integrationinto the EU.
The in-come level ofHungary, interms of pur-chasing-powerparity (PPS), isabout 51 percent of the EUaverage. Therehas been amoderate butgraduallystrengtheningprocess ofcatching up inthe last dec-ade, with arelativelystrong gain ofabout 6 per-centage pointsbetween 1995and 2001.However, in-come differ-
ences within the country widened the sameperiod, as the data for income development atregional levels (NUTS3 or NUTS2) confirm.Higher income regions (Central and the threeTransdanubian regions) posted higher-than-average gains, so that regional income differ-entials increased. Participation rates and un-employment rates in the rich regions divergedone from the rest as well as from the nationalaverage.
This divergence per se contradicts theNeoclassical view of economic integration. Intheory, higher marginal rates of factor pro-ductivity should have pushed up the degree ofreal convergence in the low-income regions,and should have reduced the difference be-tween these regions and the high-income ones.However, it should be borne in mind that this
Table 6Economic activity by regions in Hungary, in 2001
GDP/capita as a proportion of the national average (%)Region
1995 1996 1997 1998 1999 2000
Central Hungary 142 147 149 148 154 155Central Transdanubia 92 92 96 98 94 101Western Transdanubia 103 105 105 110 115 114Southern Transdanubia 85 80 78 77 77 74Northern Hungary 74 69 67 68 66 64Northern Great Plain 72 70 69 68 64 63Southern Great Plain 83 81 78 76 74 71Total Hungary
Participation rate (%)Region
1992 1993 1994 1995 1996 1997 1998 1999 2000 2001
Central Hungary 61.1 58.3 56.3 54.9 54.9 54.1 54.3 56.2 57.1 56.9Central Transdanubia 59.8 57.4 55.1 53.6 52.8 52.2 53.7 55.7 55.7 55.9Western Transdanubia 60.1 59.2 57.6 55.5 56.3 56.2 57.8 58.1 58.5 58.5Southern Transdanubia 57.2 54.4 53.1 49.1 49.1 48.9 50.1 50.7 51.3 50.5Northern Hungary 54.7 52.6 49.9 48.8 47.7 46.8 46.4 48.1 48.5 47.8Northern Great Plain 54.6 51.4 49.5 48.1 46.9 45.7 46.3 48.3 48.1 48.3Southern Great Plain 58.2 54.4 52.3 51.4 50.6 50.9 51.1 51.5 51.8 52.4Total Hungary 58.3 55.7 53.7 52.1 51.6 51.1 51.6 53.1 53.4 53.3
Unemployment rate (%)Region
1992 1993 1994 1995 1996 1997 1998 1999 2000 2001
Central Hungary 7.4 9.9 8.8 7.4 8.2 7.1 5.7 5.2 5.3 4.3Central Transdanubia 11.7 12.6 10.7 11.1 10.4 8.1 6.8 6.1 4.9 4.3Western Transdanubia 7.3 9.1 7.7 6.9 7.1 6.1 6.1 4.4 4.2 4.2Southern Transdanubia 9.6 12.8 12.1 12.1 9.4 9.9 9.4 8.3 7.8 7.8Northern Hungary 14.1 16.1 15.2 16.1 15.5 14.1 12.2 11.6 10.1 8.5Northern Great Plain 12.5 14.8 13.8 13.8 13.2 12.1 11.1 10.2 9.3 7.8Southern Great Plain 10.2 12.4 10.5 9.3 8.4 7.3 7.1 5.8 5.1 5.4Total Hungary 9.9 12.1 10.8 10.3 10.1 8.8 7.8 7.1 6.4 5.7Source: CSO.

11
is a long-term, equilibrium view that does nottake into account the specificity of transforma-tion and temporary, transformation-relatedcosts in terms of lower incomes. These argu-ments support the view that a catching-upprocess in a region will initially increase ine-quality within a country, but the inequalitywill start to diminish later.
4) SOME LABOUR-MARKET EFFECTS OFEU MEMBERSHIP AND EMU
PARTICIPATION
From the point of view of the effects of eco-nomic shocks, the homogeneity and heteroge-neity of the economic structures of EMU mem-ber countries are important. Homogeneity ofstructures means that shocks in these countriesare correlated and their economies interde-pendent. Several analyses have shown thepositive effects of participating in the EU inte-gration. First, it has had a positive and asym-metric effects on long-term economic growth –relatively higher rates for poorer membercountries (e.g. Crespo-Cuaresma et al. 2002).Secondly, it has increased the correlation ofoutput, stock-market indices and prices withinEMU (e.g. Angeloni and Dedola 1999). How-ever, heterogeneity has remained in somecountries, such as the UK. It is important toknow whether a monetary union will bringabout a greater specialization in space (Krug-man 1993) or make the economic structuremore homogenous.
Some major questions arise about othereconomic-policy options instead of adjustingexchange and interest rates, which EMU pre-cludes. The first option is to replace currencydevaluation with labour migration, but al-though the four freedoms prevail in the EUsingle market, labour migration from de-pressed to prospering countries remains lim-ited by language and cultural diversity. It is notlikely to play more than a modest role as anadjustment mechanism. Capital mobility doesnot make a good substitute for labour migra-
tion, because it accentuates development di-vergence and increases competition amonglocations. This leaves the option of relativeprice changes. Competitiveness can be im-proved by real depreciation (falling relativeprices of non-tradables) and stimulating pro-duction of tradables.
This means that wages bear the brunt ofadjustment under EMU and need to reactflexibly to shocks, lest differences in nationalunemployment rates develop. The shock-absorbing role should then be taken over byfinancial transfers, but the current system ofEU financial transfers cannot cope with this orthe financial needs of adjustment. Wagestherefore have to be highly flexible and differ-entiated in the various economic zones ofEMU. An important governmental task in EUcountries is to make the national labour mar-kets more flexible, which could be donethrough institutional reforms aimed at reduc-ing unemployment. Few EU countries have yetmanaged to introduce the kind of genuine re-forms required by a monetary union.
Policy-making comes under constantpressure from economic lobbies and interestgroups. Institutional changes on the labourmarket generate political debate and opposi-tion from certain economic and political inter-ests, while others seek to shape the system ofthe labour markets and wage bargaining on anational or even EU level. The alternatives be-fore labour-market reform – national or jointwage and employment policies – would createsignificantly different conditions for the futurefunctioning of EMU.
A joint European wage policy runscounter to the economic rationale of a mone-tary union, which calls for decentralization ofwage formation, so that regional competitive-ness can be restored and unemployment re-duced whenever asymmetric shocks occur.With a joint wage policy, political pressure onmonetary policy will inevitably increase when-ever the jobless rate exceeds a level perceivedas politically tolerable. Solving unemploymentis not and should not be a task assigned tomonetary policy. An easy-money policy willundermine price stability in EMU. EU coun-tries need to have wage policies and a possibly

12
harmonized employment policy as policy tools,based on their different unemployment rates,labour market conditions and national ap-proaches.5
5) MAIN FEATURES OF THE HUNGARIANLABOUR MARKET
The labour market is an area of the Hungarianeconomy that has undergone radical changesduring the transition period. Unemploymentrose in the early 1990s from virtually zero in1989 to double digits, i.e. to levels prevalent inthe EU countries. The employment structurehas also changed profoundly, in occupationaland geographical terms.
Interestingly, Okun’s Law seems to haveapplied in a limited way. Large, one-offchanges in labour participation wreaked havocwith the figures, but more so with the linkbetween output and employment than betweenoutput and unemployment. Quite substantial
5 The employment chapter added to the EU Treaty at theAmsterdam summit can be interpreted in this way.
declines in unemployment have occurred since1997.
Under central planning, there were highrates of male and female labour participation.The transition to market economy broughtradical changes in perceptions of the benefitsand costs of being active and of job opportuni-ties. These led to a dramatic decline in labourparticipation rates in the years following theeconomic transformation. However, Hungary’sparticipation rate has remained above the av-erage for OECD economies at similar levels ofdevelopment, but more comparable with thoseof EU countries. Male participation has sunkbelow the EU level, while female participationremains considerably higher. Employmentrates in Hungary are roughly comparable withthose of OECD and EU countries (To a largeextent, high unemployment rates can be at-tributed to above-average labour participa-tion.)
The unprecedented rearrangement ofeconomic activity during the transformationnot only put labour out of work and abolishedworkplaces, but also reallocated resources toother uses. Only a modest reduction in indus-
Table 7Sectoral structure of employment, %
1992 1993 1994 1999 2000 2001 July 2002Agriculture, forestry 11.27 9.13 8.73 7.09 6.54 6.20 6.19Mining 1.29 1.10 1.04 0.64 0.50 0.34 0.39Manufacturing 25.80 24.50 23.69 24.37 24.20 24.76 24.79Electricity, gas, water 2.65 2.75 2.89 2.36 2.08 2.06 1.86Construction 5.31 5.41 5.36 6.64 6.96 7.07 6.97Industry 35.05 33.76 32.98 34.00 33.73 34.23 34.00Wholesale, retail trade 11.77 12.27 12.46 13.58 14.05 14.21 14.33Hotels, restaurant 2.83 2.88 2.95 3.49 3.46 3.71 3.55Transport, telecom 8.48 8.79 8.38 8.09 8.10 8.06 8.12Financial intermediation 1.68 1.90 1.94 2.12 2.17 2.04 1.98Real estate, renting 3.44 3.60 3.35 4.82 32 0.69 5.93Public administration, defence,social security 7.19 7.83 8.54 7.92 7.77 0.50 7.57
Education 7.64 8.96 9.03 8.05 8.26 8.03 8.08Health, social work 5.79 6.31 6.37 6.28 6.28 6.09 6.09Other community, social andpersonal service 4.75 4.54 5.26 4.54 4.32 4.25 4.17
Services 53.57 57.07 58.27 58.90 59.73 59.57 59.8199.89 99.96 99.98 100.00 100.00 100.00 100.00
Total number of employed 4082.70 3827.30 3751.50 3811.50 3849.10 3859.50 3858.90Source: CSO.

13
trial employment was observable in Hungary,because the service sector was already impor-tant. However, there was a marked shift awayfrom agriculture.
Regional-mismatch unemployment isinterpreted as reflecting a big deficit in labourmobility and travel-related infrastructure(roads, highways, trains, buses, etc.), as well asthe nature of social insurance and family net-works. The effective commuting radius ofHungarian workers is severely limited by in-frastructural considerations.
The transition to a market economy in-cludes aspirations to avoid substantial inequal-ity by means of state-managed social welfare.Political demands for social insurance wereenhanced by the mounting strains on indi-viduals during the course of the transition.Unemployment compensation (e.g. early re-tirement, benefits and severance payments)were introduced in the early phase of transi-tion, before the full force of the transformationwas felt and without much consideration forpotential costs. One of the big challenges wasto develop alternative systems of social insur-ance to cover basic needs. At the same time,the aim was to ensure that labour mobility wasnot impeded, which was a central element oftransition to market economy.
The transition to a market economy ne-cessitated redeploying the labour force, withassociated losses of human capital and reduc-tions in expected lifetime income. Historicalexperience has shown that most attempts toprotect a displaced labour force are made atthe expense of postponing needful structuraladjustment. The mobility deriving from struc-
tural adjustment is not restricted to movinglabour resources from overmanned manufac-turing to underdeveloped services. Mobility isalso needed within industry – labour has to berelocated from shrinking and failing firms tonew and growing ones, often in the same in-dustry. An elaborate welfare net can reducethe cost of failing to act and make a wait-and-see policy more attractive, thereby raising theimplicit costs of mobility.
The development of total employmentin Hungary has changed significantly. Thetransformation shock increased unemploymentin the first half of the 1990s, but between1995 and 2000, there was an employment in-crease of about 5 per cent. The alterationseems to be accountable largely in terms ofcorresponding differences in economic activ-ity. However, statistics shows that employmentfollowed increases in output only weakly andfalteringly. Overall growth was driven mainlyby improvements in productivity levels ratherthan increases of labour inputs.
The productivity increase of the 1990sexceeded the rate sustainable in the long termand tended to reflect rapid, massive initial re-structuring of the economy. In a sense, thissignificant increase came about more throughslow employment creation due to labour-market rigidities. Comparing the period 1990–97 with 1997–2001, there was a pronouncedslowdown in the rate of productivity increase.This at first sight could be evidence against thepresence of Schumpeterian creative destruc-tion, which would bring a gradually rising rateof increase in labour productivity over the pe-riod. However, the slowing of the improve-ment is consistent with the presence of rigidi-
ties on the Hungarian la-bour market.
6) POSSIBLECONSEQUENCES OF EUACCESSION AND EMU
FOR HUNGARY’S
Table 8Economic activity of the Hungarian population –
unemployment rate, participation rate, %
Male Female TotalUnemploy-
mentPartici-pation
Unemploy-ment
Partici-pation
Unemploy-ment
Partici-pation
1992 10.7 66.7 8.7 51.1 9.8 58.61993 13.2 64.3 10.4 54.5 11.9 56.11994 11.8 62.4 9.4 46.3 10.7 54.11995 11.3 61.7 8.7 43.8 10.2 52.41996 10.7 61.1 8.8 43.4 9.9 51.81997 9.5 60.4 7.8 42.8 8.7 51.21998 8.5 60.1 7.1 44.1 7.8 51.71999 7.5 61.4 6.3 45.4 7.1 53.12000 7.1 61.9 5.6 45.8 6.4 53.52001 6.3 61.7 5.1 45.6 5.7 53.3July 2002 6.1 61.6 5.1 45.8 5.6 53.4Source: CSO.

14
LABOUR MARKET
The OCA theory lists several criteria foreconomies to fulfil before they can integratetheir monetary systems without suffering em-ployment losses and labour-market problems.Hungary’s economy has visibly converged onthose of the EU countries. Its structure hasapproached closely to the EU average. The EUis by far its most important trading partner,and the business cycles have become verysimilar. Nevertheless, the appearance ofasymmetric shocks cannot be excluded.Despite the similarities that have developed inthe last decade, potential adverse effects of EUaccession and EMU could bring about seriouseconomic difficulties. Participation in EMUcalls for an economy able to adjust eitherthrough market forces or adequate economicpolicy. Exchange-rate policy ceases to beavailable as an economic-policy tool, beingreplaced by flexible price and wage adjustmentor labour migration. Fiscal policy remains as away of smoothing the fluctuations in thebusiness cycle.
The following special features of theHungarian economy and economic policy canbe detected in terms of the OCA criteria:
(a) Asymmetric shocks occur more on a re-gional than a national level.
(b) There is rather limited empirical evidenceof price flexibility. Some findings suggestthat it is probably high by internationalstandards, but this cannot really be provedbecause the market economy only has adecade’s history, in which relatively highinflation rates will have distorted meas-urements of flexibility.
(c) Wage and labour-market flexibility israted by the OECD as fairly flexible byEuropean standards.6 Pay negotiations atnational level include representatives ofthree social partners (government, em-ployees and employers), who agree upon asuggested annual average pay increase in
6 Nioletti, G., et al. (2000).
the private sector and some general as-pects of labour-market policy. The effec-tive decisions are then taken at companylevel by management and employee rep-resentatives, who may take into accountproductivity developments in the firm.This system contains no element thatmight hinder wage flexibility during orafter EU or EMU accession. The unem-ployment elasticity of real wages in Hun-gary has undergone changes in the lastdecade. Pay in the early 1990s declined inthe regions more exposed to the shocks ofthe transformation process. Within a fewyears, the unemployment elasticity ofwages grew from – 0.015 to – 0.1, whichis a level common in market economies.Some years later, during the course of sta-bilization and completion of transforma-tion, these regions lost much of the ad-vantage they derived from lower labourcosts, as the productivity advantages of re-gions with lower unemployment ratesgradually increased. The unemploymentelasticity of wages has decreased since1996 and the causality between wagesand unemployment has weakened.
(d) Contrary to some views, labour migration,as a form of adjustment to asymmetricshocks within a monetary union, shouldbe on a comparable scale among countrieswithin the EU or EMU and among regionswithin any country. Migration has par-ticular importance because nominal wagesare supposed to be sticky downwards andunable to adjust when an adverse ornegative demand shock occurs. This maylead to an increase in unemployment.However, migration can be a substitute forhigher unemployment. Some analysesquestion the link between migration andmonetary union, arguing that migrationcannot bring adjustment to shocks, whichcan only be handled by monetary policy.Monetary policy can smooth, above all,temporary demand shocks. Moreover, mi-gration is inflexible because it is unlikelythat reversed migration will take place assoon as a temporary negative demandshock is over. In the longer term, a short-age of skilled labour may come to hinder

15
the development of the region from whichthe migration takes place. This means thatprice and pay flexibility should be themain means of adjustment. Of course, mi-gration may be necessary as an adjustmentto permanent shock effects, in which case,it will take place as an adjustment mecha-nism both in a monetary union and in acountry with an autonomous monetarypolicy. The extent of migration dependsmuch on factors such as structural policy,education and retraining, languageknowledge and real estate-market mobil-ity.
Analyses of current and future cross-border and domestic migration by the Hun-garian labour force give a mixed picture, butthe labour force turns out to be rather immo-bile.
(a) EU accession implies additional structuralshocks to the whole economy, particularlyagriculture and certain industrial andservice industries, which have alreadybeen subjected to transformation shocks.The accession could also bring higher un-employment, because adjustment will bemuch slower to the new steady state. Sev-eral analysts emphasise that without a fastcatching-up process in the next couple ofdecades, a possible detour would be anoutward flow of labour, particularly to theEU. This would be a possible constraint onreal catching up, as it would result in a nettransfer of human capital to more devel-oped EU regions. The more sustained thisprocess is, the more serious problems willbe. Various arguments for and against thepotential migration can be mentioned. Theexperience of catching-up countries inprevious rounds of enlargement points torelatively small migration effects being in-duced by accession. However, economicsituations, such as wage differentials andgeographical proximity to important EUlabour markets, may not be fully compa-rable. In the last decade, net migrationfrom Hungary to the EU has been rela-tively moderate and Hungarian surveydata based on interviews do not suggestthat a big increase or a radical alterationin the trend will ensue. A study by Bauer
and Zimmermann (1999) assessing vari-ous prospects and labour-market implica-tions of EU migration after enlargementsuggested that the economic and demo-graphic situation in the EU and the appli-cant countries would make further migra-tion unavoidable. Most migration pressureis expected to be on Germany and Austria.According to their calculations, 2–3 percent of the acceding countries’ population(about 3 million people) is expected to mi-grate to the West within the next 10–15years. This means an East-West flow ofabout 200,000 people a year, which ifdistributed evenly, would mean a flow outof Hungary of about 20,000 people ayear.7 This scale of migration cannot beconsidered an adequate adjustmentmechanism in the case of an asymmetricshock.
(b) Migration inflows may be another matter,as immigration of ethnic Hungarians fromneighbouring countries has been increas-ing, and in some years, reached substantialnumbers. The trend may continue after EUaccession.
(c) Domestic migration has not been insignifi-cant: 3.5–4.6 per cent of the populationmoved regions in the 1990–95 period. Butthis did not reduce the regional unem-ployment differences. According to statis-tical calculations, if this rate of migrationis sustained for 20 years, a 20 per centdifference in unemployment rates will fallto 13–15 per cent. The differences in re-gional unemployment rates, pay and in-come levels have been substantial and sta-ble in Hungary in the last decade. Amongthe main reasons has been the skill struc-ture of the labour force and immobility onthe real-estate market. The differencescould not be reduced by commuting be-cause of the transport infrastructure andthe high cost of travel.
7 The population of the 12 acceding countries is about106 million and that of Hungary about 10 million.
16
Table 9Regional differences in the Hungarian labour mar-
ket – unemployment, income, migration
Differences inregional un-employment
rates (percent-age points)
Differences ingross monthlyregional in-comes (%)
Regional mi-gration among
15–59 agegroup (% oftotal popula-
tion)1989199219931994199519961997199819992000
6.77.17.39.18.27.96.67.15.9
21.138.935.838.239.741.141.948.548.455.8
2.22.32.32.32.32.22.32.42.42.6
Source: Csajbók and Csermely (2002).
The Hungarian labour market is markedby relatively low employment (56 per cent in2000) and participation rates by comparisonwith the EU average (63.1 per cent in 2000),which in turn is relatively low internationally.The EU aims to increase its employment rate to67 per cent by 2005. The low Hungarian ratesarose from the structural changes of thetransformation process, the regional disparitiesbetween created and lost jobs, and regionalskill-structure problems.
The structural differences of labour-market supply and demand are likely to re-main on the Hungarian labour market forquite a long time. Labour markets usually reactto negative demand shocks by reducing theparticipation rate and increasing the share ofthe inactive population. Due to the structuralproblems in the Hungarian labour force, muchof the inactive population cannot be consid-ered as potential labour in periods of economicprosperity or in the medium term. All thesefeatures will have effects on the tools of ad-justment policy to cope with shocks after Hun-gary’s accession to the EU and EMU.
* * * * *
REFERENCES
Angeloni, I. and L. Dedola (1999): From theERM to the Euro: New Evidence on Eco-nomic and Policy Convergence amongEU Countries. ECB Working Paper No.4.Frankfurt/M: ECB.
Bauer, T., and K. Zimmermann (1999): As-sessment of Possible Migration Pressureand Its Labour Market Impact FollowingEU Enlargement To CEE. Research ReportNo.139. Bonn: DfEE.
Bayoumi, T.A., and B.J. Eichengreen (1993):‘Shocking Aspects of European MonetaryIntegration’, in Giavazzi, F. and F.Torres(ed.): Growth and Adjustment in theEuropean Monetary Union, CambridgeUniversity PressT
Blachard, O. and D. Quah (1989): ‘The Dy-namic Effects of Aggregate Demand andSupply Disturbances’, American Eco-nomic Review, Vol. 79
Boone, L. and M. Maurel (1999): An OptimalCurrency Area Perspective of the EU En-largement to the CEECs. CEPR DiscussionPaper, No. 2119, London: CEPR
Burda, M. (1998): The Consequences of EUenlargement for Central and East Euro-pean Labour Markets. CEPR DiscussionPaper, No. 1881, London: CEPR.
Crespo-Cuaresma, J. et al. (2002): Growth,Convergence and EU Membership. ÖNBWorking Paper, No. 62, Vienna: ÖNB.
Csajbók, A., and Á. Csermely, eds. (2002): Azeuró hazai bevezetésének várható hasz-na, költségei és időzítése (Likely Utility,Costs and Timing of Euro Introductioninto Hungary). National Bank of Hun-gary Workshop Studies, No. 24, Buda-pest: National Bank of Hungary.

17
EC (1998): The Future European Labour Sup-ply. Employment & Social Affairs, Em-ployment and European Social Fund Re-search Paper, Brussels: EC.
EU Commission (2001): ‘Real Convergence inCandidate Countries – Past Performanceand Scenarios’, in: The Pre-AccessionEconomic Programmes, ECFIN/708/01-EN, Brussels: EU Commission.
Fidrmuc, J., and I. Korhonen (2001): ‘Similar-ity of Supply and Demand Shocks be-tween the Euro Area and the AccessionCountries’, in: ÖNB East-West Confer-ence 2001, Vienna: ÖNB.
Frenkel, M.C., C. Nickel and G. Schmidt(1999): Some Shocking Aspects of EMUEnlargement. DBResearch Note No.99/4.Frankfurt/M: DBR.
Krugman, P. (1993): ‘Six Sceptical Propositionsabout EMU’. Greek Economic Review 15(1), pp. 93–104.
Nicoletti, G., S. Scarpetta and O. Boylaud(2000): Summary Indicators of ProductMarket Regulation with an EmploymentProtection Legislation. Economics De-partment Working Papers, No. 226,Paris: OECD


![Welcome [business.uc.edu] · Registration Deadlines Registration Deadlines (flexibly scheduled classes): • Two types of flexibly scheduled classes • Seven-week classes (1st or](https://img.pdfslide.us/doc/110x75/5eca29297213a25c807eb450/welcome-registration-deadlines-registration-deadlines-flexibly-scheduled-classes.jpg)