Embed Size (px)
DESCRIPTION
This study examines the effects of San Francisco’s recent paid sick days legislation onemployees and employers. New survey evidence is presented on how paid sick daysare being used, the costs and benefits for employees and employers, and rates of employercompliance. The research represents part of a broader body of work undertakenby the Institute for Women’s Policy Research on the costs and benefits of proposedpaid sick days legislation. The research was made possible by grants from the PublicWelfare Foundation, the Ford Foundation, and the Annie E. Casey Foundation.
Citation preview
San Francisco’s Paid Sick Leave Ordinance:Outcomes for Employers and Em ployees
Robert Drago and Vicky Lovell
About This Report
This study examines the effects of San Francisco’s recent paid sick days legislation onemployees and employers. New survey evidence is presented on how paid sick daysare being used, the costs and benefits for employees and employers, and rates of em-ployer compliance. The research represents part of a broader body of work undertakenby the Institute for Women’s Policy Research on the costs and benefits of proposedpaid sick days legislation. The research was made possible by grants from the PublicWelfare Foundation, the Ford Foundation, and the Annie E. Casey Foundation.
About the Institute for Women’s Policy Research
The Institute for Women’s Policy Research (IWPR) conducts rigorous research and dis-seminates its findings to address the needs of women, promote public dialogue, andstrengthen families, communities, and societies. The Institute works with policymakers,scholars, and public interest groups to design, execute, and disseminate research that il-luminates economic and social policy issues affecting women and their families, and tobuild a network of individuals and organizations that conduct and use women-orientedpolicy research. IWPR’s work is supported by foundation grants, government grants andcontracts, donations from individuals, and contributions from organizations and corpo-rations. IWPR is a 501(c)(3) tax-exempt organization that also works in affiliation withthe women’s studies and public policy programs at George Washington University.
Acknowledgments
The authors would like to thank the many individuals who contributed their time andeffort to make this report possible. Deborah Leff, former President of the Public Wel-fare Foundation, provided core funding for this project, as well as ongoing support andencouragement. Anna Wadia and Helen Neuborne of the Ford Foundation provided ad-ditional grant support and valuable guidance on the report and its release. IWPR Sen-ior Research Associate Jeff Hayes and Research Analyst Claudia Williams conducted thedata analysis, and Senior Research Associate Kevin Miller provided helpful comments onthe draft report.
The authors thank the members of the project’s advisory group: Dr. Jennifer Greeneof the University of Illinois at Urbana-Champaign, Dr. William H. Dow of the Universityof California at Berkeley’s School of Public Health, Mr. Greg Asay of the San FranciscoOffice of Labor Standards Enforcement, Dr. Rajiv Bhatia of the San Francisco Depart-ment of Public Health, Mr. Rael Silva of Young Workers United, Ms. Sasha Hammad ofPublic Interest Projects, Ms. Shelley Waters Boots of SWB Strategic Solutions LLC, Dr.Gregory Acs of the Urban Institute, Ms. Sara Flocks of the California Labor Federation,and Dr. Jonathan Heller of Human Impact Partners.
The following individuals collaborated with IWPR in writing the employer survey ques-tions : Dr. William H. Dow of the University of California at Berkeley Population Cen-ter and School of Public Health, Dr. Arindrajit Dube of the University of Massachusettsat Amherst, and Dr. Carrie Hoverman Colla of the Dartmouth University Center forHealth Policy Research. The authors also thank Randy Albelda of the University of Mas-sachusetts at Boston, Ellen Bravo of Family Values @ Work, Vicki Shabo of the NationalPartnership for Women and Families, and Melissa Josephs of Women Employed for theirvaluable comments on the draft report.
Heidi Hartmann, IWPR President, and Barbara Gault, IWPR Executive Director, pro-vided guidance and feedback throughout the course of the project. Vicky Lovell, formerIWPR Acting Director of Research, initiated the project during her time at IWPR.
Board of Directors
Lenora Cole, ChairUniversity of Maryland University College
Esmeralda O. Lyn, Vice ChairHofstra University
Carol Greene Vincent, TreasurerPricewaterhouse Coopers LLP
Cynthia Lloyd, SecretaryPopulation Council
Bill BaerBloomingdale’s
Mariam ChamberlainNational Council for Research on Women
Bob CortiAvon Foundation
Ellen DelanyDelany, Siegel, Zorn & Associates Inc.
Holly FechnerCovington & Burling LLP
Lynn GitlitzBusiness Development Consultant
David A. GoslinAmerican Institutes for Research
Ellen KarpAnerca
Susan MeadePhillips Oppenheim
Emily van AgtmaelVan Agtmael Interiors
Sheila W. WellingtonNew York University
Marcia Worthing
Heidi Hartmann, PresidentInstitute for Women’s Policy Research
Barbara Gault, Vice PresidentInstitute for Women’s Policy Research
IWPR A138, February 2011ISBN 978-1-933161-03-7$10.00© Copyright 2011 by the Institute for Women’sPolicy Research, Washington, DC.All rights reserved.Printed in the United States of America.
Institute for Women’s Policy Research1200 18th Street NW, Suite 301
Washington, DC 20036202/785-5100 • 202/833.4362 fax
www.iwpr.org
San Francisco’s Paid Sick Leave Ordinance:Outcomes for Employers and Em ployees
Robert Drago, Ph.D. and Vicky Lovell, Ph.D.

Table of Contents
Executive Summary ......................................................................................................................... 1
Introduction...................................................................................................................................... 3
Background .......................................................................................................................................5
Paid Sick Days Promote Health at Low Cost for Employees and Their Families .......................5
Paid Sick Days Provide Benefits at Low Cost to Employers ......................................................5
Paid Sick Days Improve Public Health........................................................................................6
Findings: Workers and the Paid Sick Leave Ordinance ................................................................7
Paid Sick Days Are Important for Workers .................................................................................7
How Was the PSLO Used? ..........................................................................................................8
Workers and Their Families Benefited from the PSLO.............................................................11
Few Workers Were Negatively Affected by the PSLO...............................................................12
Employees Report That Most Employers Are Compliant .........................................................13
Employers and the Paid Sick Leave Ordinance ...........................................................................17
Few Employers Had to Change Policies for the PSLO..............................................................17
Employers Had Little Difficulty Implementing the PSLO........................................................17
Employer Benefits from the Paid Sick Leave Ordinance ..........................................................19
Net Effects and Employer Support for the PSLO......................................................................20
Conclusion: How Well Is the Paid Sick Leave Ordinance Working? ..........................................25
Appendix A: Methodology for the Survey of Workers .................................................................27
Appendix B: Methodology for the Survey of Employers .............................................................29
Notes.................................................................................................................................................35
List of Tables and Figures
Table 1. Percentage and Characteristics of Workers Reporting the Need for PSD.............................8
Table 2. Median Number of PSD Used and Share of Workers Not Using PSD in the Last 12 Months............................................................................................................9
Table 3. Reasons for Using Leave, of Workers Using PSD in the Last 12 Months ..........................10
Table 4. Workers’ Reported Benefits from PSD...............................................................................11
Table 5. Possible Negative Effects of Increased PSD .......................................................................13
Table 6. Employees Reporting Improper Implementation of the PSLO...........................................14
Table 7. Characteristics of Workers Who Were Asked for Documentation for Using PSD..............15
Table 8. Firms Providing PSD Before and After the PSLO..............................................................17
Table 9. Firms’ Reports of Difficulty Implementing the PSLO .......................................................18
Table 10. Effect of PSLO on the Predictability of Absence..............................................................20
Table 11. Effect of PSLO on Profitability ........................................................................................21
Table 12. Employer Changes to Compensation in Response to the PSLO.......................................22
Table 13. Percentage of Firms Supporting the PSLO .......................................................................24
Figure 1. Characteristics of Workers Reporting the Need for PSD ....................................................7
Figure 2. Median Number of PSD Used in the Last 12 Months.........................................................8
Figure 3. Share of Workers Who Did Not Use PSD in the Last 12 Months .......................................9
Figure 4. Workers Who Benefited Most from the PSLO....................................................................4
Figure 5. Firms Reporting Hiring Replacements for Workers Using PSD.......................................19
Figure 6. Firms Supporting the PSLO ..............................................................................................23
Appendix Table A: Sample Sizes and Weighted Distribution, Worker Survey.................................27
Appendix Table B: Sample Sizes and Weighted Distribution, Employer Survey.............................29
Appendix Table 1: Workers Who Can Use for Specified Purpose and Earn at the Required Rate........30
Appendix Table 2: How Firms Changed Their PSD Policies in Response to the PSLO ..................32
Appendix Table 3: Firms Rarely Hire Replacement Workers...........................................................33
Appendix Table 4: Effect of the PSLO on Business Operations.......................................................34
1
San Francisco’s Paid Sick Leave Ordinance
Executive Summary
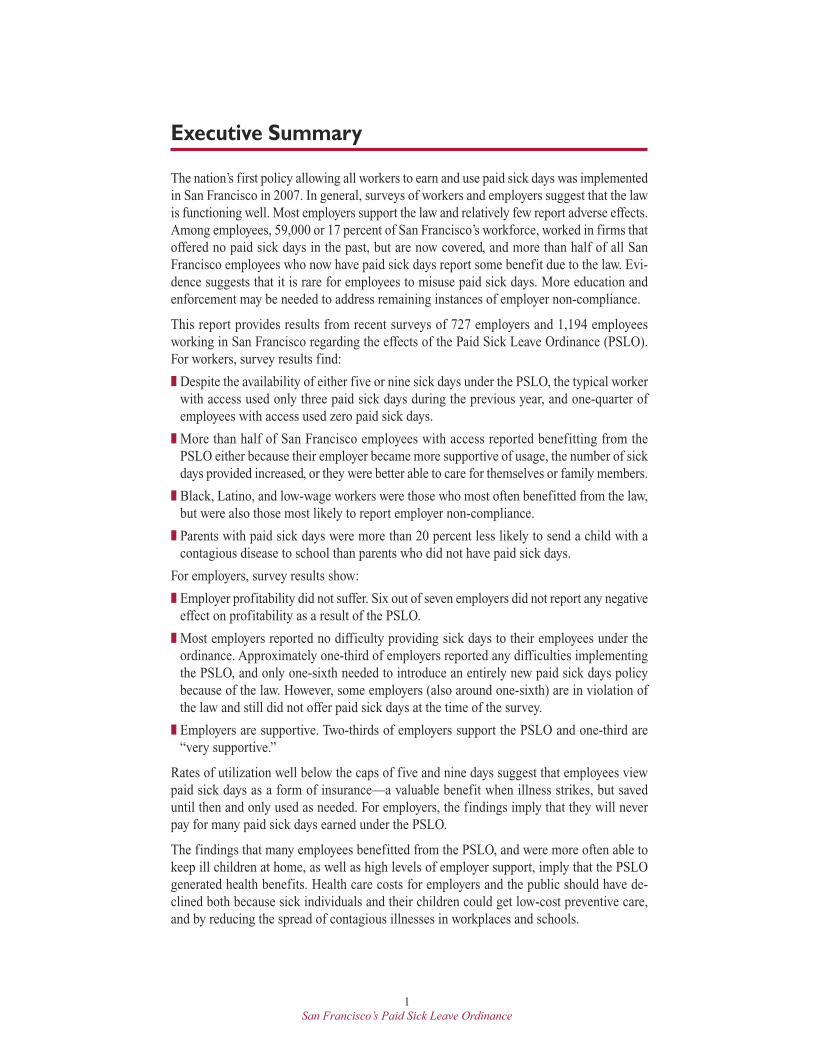
The nation’s first policy allowing all workers to earn and use paid sick days was implementedin San Francisco in 2007. In general, surveys of workers and employers suggest that the lawis functioning well. Most employers support the law and relatively few report adverse effects.Among employees, 59,000 or 17 percent of San Francisco’s workforce, worked in firms thatoffered no paid sick days in the past, but are now covered, and more than half of all SanFrancisco employees who now have paid sick days report some benefit due to the law. Evi-dence suggests that it is rare for employees to misuse paid sick days. More education andenforcement may be needed to address remaining instances of employer non-compliance.
This report provides results from recent surveys of 727 employers and 1,194 employeesworking in San Francisco regarding the effects of the Paid Sick Leave Ordinance (PSLO).For workers, survey results find:
� Despite the availability of either five or nine sick days under the PSLO, the typical workerwith access used only three paid sick days during the previous year, and one-quarter ofemployees with access used zero paid sick days.
� More than half of San Francisco employees with access reported benefitting from thePSLO either because their employer became more supportive of usage, the number of sickdays provided increased, or they were better able to care for themselves or family members.
� Black, Latino, and low-wage workers were those who most often benefitted from the law,but were also those most likely to report employer non-compliance.
� Parents with paid sick days were more than 20 percent less likely to send a child with acontagious disease to school than parents who did not have paid sick days.
For employers, survey results show:
� Employer profitability did not suffer. Six out of seven employers did not report any negativeeffect on profitability as a result of the PSLO.
� Most employers reported no difficulty providing sick days to their employees under theordinance. Approximately one-third of employers reported any difficulties implementingthe PSLO, and only one-sixth needed to introduce an entirely new paid sick days policybecause of the law. However, some employers (also around one-sixth) are in violation ofthe law and still did not offer paid sick days at the time of the survey.
� Employers are supportive. Two-thirds of employers support the PSLO and one-third are“very supportive.”
Rates of utilization well below the caps of five and nine days suggest that employees viewpaid sick days as a form of insurance—a valuable benefit when illness strikes, but saveduntil then and only used as needed. For employers, the findings imply that they will neverpay for many paid sick days earned under the PSLO.
The findings that many employees benefitted from the PSLO, and were more often able tokeep ill children at home, as well as high levels of employer support, imply that the PSLOgenerated health benefits. Health care costs for employers and the public should have de-clined both because sick individuals and their children could get low-cost preventive care,and by reducing the spread of contagious illnesses in workplaces and schools.

3
San Francisco’s Paid Sick Leave Ordinance
Introduction
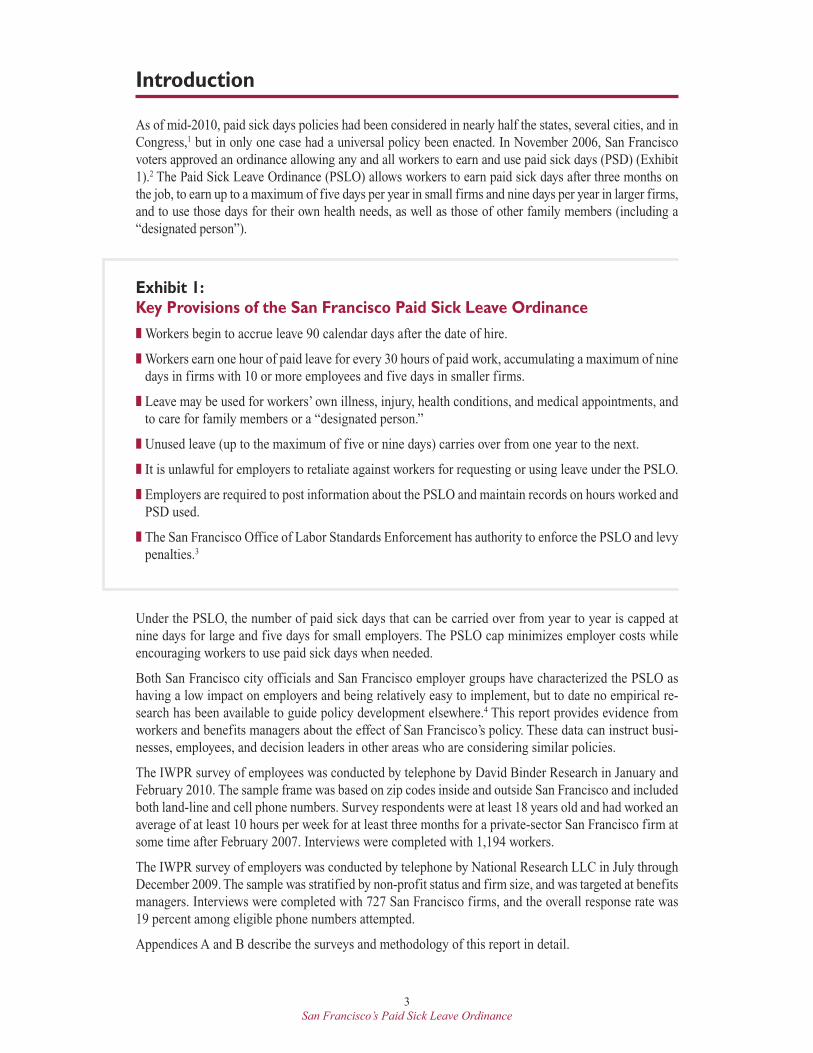
As of mid-2010, paid sick days policies had been considered in nearly half the states, several cities, and inCongress,1 but in only one case had a universal policy been enacted. In November 2006, San Franciscovoters approved an ordinance allowing any and all workers to earn and use paid sick days (PSD) (Exhibit1).2 The Paid Sick Leave Ordinance (PSLO) allows workers to earn paid sick days after three months onthe job, to earn up to a maximum of five days per year in small firms and nine days per year in larger firms,and to use those days for their own health needs, as well as those of other family members (including a“designated person”).
Exhibit 1:
Key Provisions of the San Francisco Paid Sick Leave Ordinance
� Workers begin to accrue leave 90 calendar days after the date of hire.
� Workers earn one hour of paid leave for every 30 hours of paid work, accumulating a maximum of ninedays in firms with 10 or more employees and five days in smaller firms.
� Leave may be used for workers’ own illness, injury, health conditions, and medical appointments, andto care for family members or a “designated person.”
� Unused leave (up to the maximum of five or nine days) carries over from one year to the next.
� It is unlawful for employers to retaliate against workers for requesting or using leave under the PSLO.
� Employers are required to post information about the PSLO and maintain records on hours worked andPSD used.
� The San Francisco Office of Labor Standards Enforcement has authority to enforce the PSLO and levypenalties.3
Under the PSLO, the number of paid sick days that can be carried over from year to year is capped atnine days for large and five days for small employers. The PSLO cap minimizes employer costs whileencouraging workers to use paid sick days when needed.
Both San Francisco city officials and San Francisco employer groups have characterized the PSLO ashaving a low impact on employers and being relatively easy to implement, but to date no empirical re-search has been available to guide policy development elsewhere.4 This report provides evidence fromworkers and benefits managers about the effect of San Francisco’s policy. These data can instruct busi-nesses, employees, and decision leaders in other areas who are considering similar policies.
The IWPR survey of employees was conducted by telephone by David Binder Research in January andFebruary 2010. The sample frame was based on zip codes inside and outside San Francisco and includedboth land-line and cell phone numbers. Survey respondents were at least 18 years old and had worked anaverage of at least 10 hours per week for at least three months for a private-sector San Francisco firm atsome time after February 2007. Interviews were completed with 1,194 workers.
The IWPR survey of employers was conducted by telephone by National Research LLC in July throughDecember 2009. The sample was stratified by non-profit status and firm size, and was targeted at benefitsmanagers. Interviews were completed with 727 San Francisco firms, and the overall response rate was19 percent among eligible phone numbers attempted.
Appendices A and B describe the surveys and methodology of this report in detail.

5
San Francisco’s Paid Sick Leave Ordinance
Background
Research suggests that paid sick days policies could create various benefits and costs for workers, employers,and the general public.
Paid Sick Days Promote Health at Low Cost for Employees and Their Families
Paid sick days reduce the prevalence of employees attending work when they or a family member are ill.Workers recover from health problems faster when they can take time to recuperate.5 As such these poli-cies are like insurance: Many people do not become ill in a given month or even year, but if they worklong enough, at some point they will need paid sick days, and use them if they are available.
One criticism of paid sick days legislation is that it is unnecessary because workers already stay homewhen they or other family members are ill. But in many employment situations, workers face the pressuresof “presenteeism,” or the practice of workers being on the job when they have a contagious illness.6 Re-search indicates that paid sick days policies reduce presenteeism.7 Some workers report going to workwhile sick because they can’t afford to take unpaid time off, which should also occur less frequentlyunder paid sick days policies because employees do not lose earnings while they are out sick.8
Policies that support employees’ health needs may also reduce stress, increase loyalty, and improvemorale,9 thereby improving the quality of employees’ lives and improving their performance on the job.
Sending children to school or child care when they have a contagious illness is equivalent to presenteeismfor workers: It spreads disease to other children and their families, as well as to teachers.10 Having paidleave is the primary factor in parents’ decisions about staying home when their children are sick,11 andresearch suggests that having paid sick days is more effective than vacation leave in allowing parents tostay home with sick children.12 These effects may exist because some vacation leave policies are not flex-ible enough to be used when children become sick.
The paid sick days legislation in San Francisco might involve costs for employees. For example, employerscould legally reduce all employees’ wages,13 or require that all employees work harder to make up forpaid sick days. However, if employers obstruct paid sick days policies by requiring individual employeesto make up for lost time, or requiring medical certification of illness when it is not legally permitted, ordocking employee wages for time out of work that is supposed to be paid, they are out of compliancewith the law.
Paid Sick Days Provide Benefits at Low Cost to Employers
Some employers are concerned about the possible implementation costs and increased paperwork of paidsick days legislation. For employers paying workers on an hourly basis, existing work hours tracking sys-tems may need to be expanded to count earned paid sick days. Additionally, payroll costs can increasedirectly among employers who provided unpaid sick days in the past and need to switch to a paid sickdays approach, or if the employer needs to hire replacement workers when employees are out sick. Somepeople fear that an increase in payroll costs due to paid sick days legislation will lead employers, andparticularly small businesses, to engage in less hiring or to lay-off existing employees.14
Employers also enjoy benefits from paid sick days. Personnel experts note that the costs of presenteeisminclude not just lost productivity—sick workers are paid their full salary, but can’t perform at their peak—but also a greater likelihood of injuries and mistakes.15 Employers can experience “an even greater re-duction in productivity” if an illness spreads through a workplace because of presenteeism.16 Researchfollowing the 2009 H1N1 pandemic in the United States suggested that more than one-quarter of privatesector employees who contracted the disease did so because of others coming to work while infected,17
causing unnecessary suffering, deaths, and productivity losses. Paid sick days may allow workers to ad-dress their health needs more quickly and miss less work overall.
6
San Francisco’s Paid Sick Leave Ordinance
Paid sick days are likely to improve job satisfaction. Higher job satisfaction is in turn associated withhigher business profitability, and employment benefits affect job satisfaction.18
Paid sick days offer an additional benefit to employers in terms of scheduling. Absences that are notplanned in advance are more difficult and costly for employers to deal with than scheduled time off—and are nearly half again as expensive in terms of lost productivity.19 Workers with the right to use paidsick days may be more likely to let their managers know in advance about time needed for family healthcare or medical appointments, rather than calling in at the last minute.
Finally, workers with paid sick days are less likely than others to switch jobs, and workers with paid leaveare more likely to return to work after serious health problems.20 Turnover is costly to employers, involvingexpenses for advertising, interviewing, testing, and training new workers.21
Some employers may respond to paid sick days by trying to contain costs or expand revenues. For ex-ample, an employer might lay employees off, reduce employee compensation or other benefits (e.g.,vacation days), require that employees work harder in order to cover for any lost but paid working time,or raise prices.
Paid Sick Days Improve Public Health
Public health may improve due to paid sick days. As mentioned earlier, presenteeism leads employees toattend work while contagious, needlessly spreading disease and adversely affecting public health. Sendingchildren to school or child care when they have a contagious illness spreads disease to children, teachers,and their families.22
Some researchers expect that paid sick days policies will have longer-term positive effects by increasingpreventive care, reducing emergency room visits by allowing people to go to the doctor during workinghours, and improving the management of chronic diseases, such as diabetes. These effects could reducehealth care costs for workers and their families, employers, and the public, but it is difficult to calculatea dollar value for these effects with available data.
7
San Francisco’s Paid Sick Leave Ordinance
Findings: Workers and the Paid Sick Leave Ordinance
Paid Sick Days Are Important for Workers
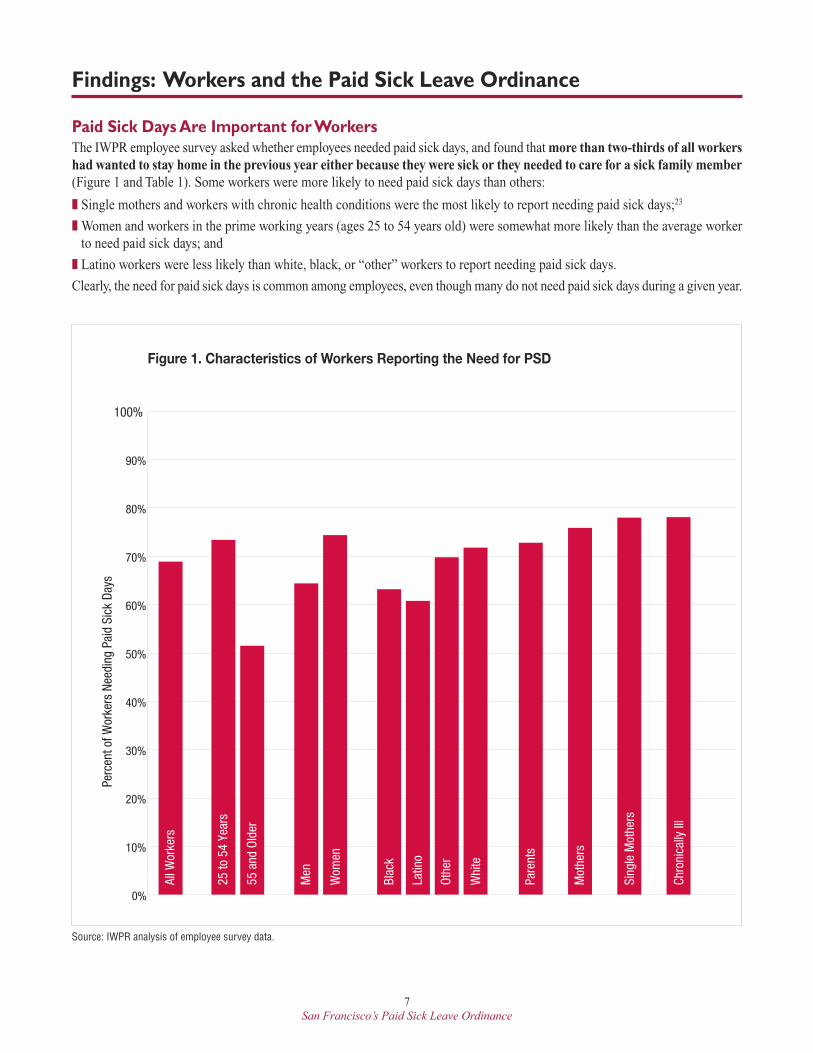
The IWPR employee survey asked whether employees needed paid sick days, and found that more than two-thirds of all workershad wanted to stay home in the previous year either because they were sick or they needed to care for a sick family member(Figure 1 and Table 1). Some workers were more likely to need paid sick days than others:
� Single mothers and workers with chronic health conditions were the most likely to report needing paid sick days;23
� Women and workers in the prime working years (ages 25 to 54 years old) were somewhat more likely than the average workerto need paid sick days; and
� Latino workers were less likely than white, black, or “other” workers to report needing paid sick days.
Clearly, the need for paid sick days is common among employees, even though many do not need paid sick days during a given year.
Figure 1. Characteristics of Workers Reporting the Need for PSD
0%
10%
20%
30%
40%
50%
60%
70%
80%
90%
100%
Perc
ent o
f Wor
kers
Nee
ding
Pai
d Si
ck D
ays
All W
orke
rs
25 to
54
Year
s
55 a
nd O
lder
Men
Wom
en
Blac
k
Latin
o
Othe
r
Whi
te
Pare
nts
Mot
hers
Sing
le M
othe
rs
Chro
nica
lly Il
l
Source: IWPR analysis of employee survey data.
8
San Francisco’s Paid Sick Leave Ordinance
0
1
2
3
4
All W
orke
rs w
ith P
SD
25 to
54
Year
s
55 a
nd O
lder
Men
Wom
en
Blac
k
Latin
o
Othe
r
Whi
te
Pare
nts
Mot
hers
Sing
le M
othe
rs
Chro
nica
lly Il
l
Unio
n M
embe
rs
Med
ian
Num
ber o
f Pai
d Si
ck D
ays
Used
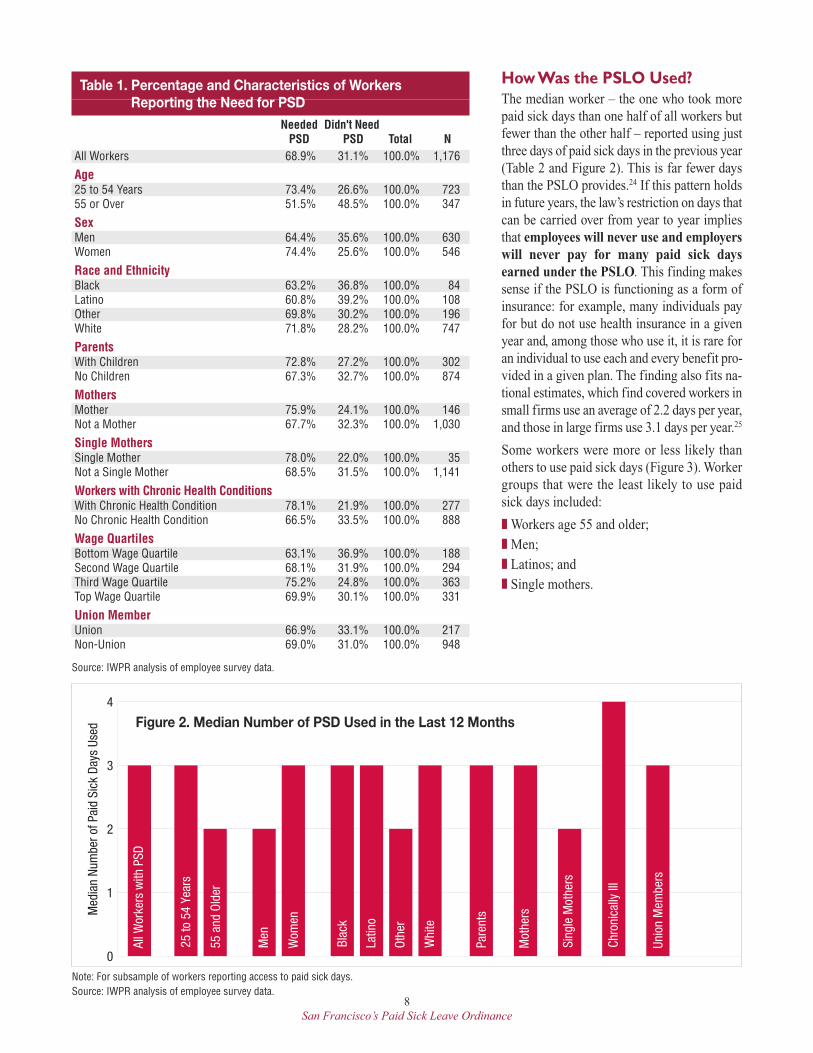
How Was the PSLO Used?
The median worker – the one who took morepaid sick days than one half of all workers butfewer than the other half – reported using justthree days of paid sick days in the previous year(Table 2 and Figure 2). This is far fewer daysthan the PSLO provides.24 If this pattern holdsin future years, the law’s restriction on days thatcan be carried over from year to year impliesthat employees will never use and employerswill never pay for many paid sick daysearned under the PSLO. This finding makessense if the PSLO is functioning as a form ofinsurance: for example, many individuals payfor but do not use health insurance in a givenyear and, among those who use it, it is rare foran individual to use each and every benefit pro-vided in a given plan. The finding also fits na-tional estimates, which find covered workers insmall firms use an average of 2.2 days per year,and those in large firms use 3.1 days per year.25
Some workers were more or less likely thanothers to use paid sick days (Figure 3). Workergroups that were the least likely to use paidsick days included:
� Workers age 55 and older;� Men; � Latinos; and� Single mothers.
Figure 2. Median Number of PSD Used in the Last 12 Months
Table 1. Percentage and Characteristics of Workers Reporting the Need for PSD
Needed Didn't NeedPSD PSD Total N
All Workers 68.9% 31.1% 100.0% 1,176
Age25 to 54 Years 73.4% 26.6% 100.0% 72355 or Over 51.5% 48.5% 100.0% 347
SexMen 64.4% 35.6% 100.0% 630Women 74.4% 25.6% 100.0% 546
Race and EthnicityBlack 63.2% 36.8% 100.0% 84Latino 60.8% 39.2% 100.0% 108Other 69.8% 30.2% 100.0% 196White 71.8% 28.2% 100.0% 747
ParentsWith Children 72.8% 27.2% 100.0% 302No Children 67.3% 32.7% 100.0% 874
MothersMother 75.9% 24.1% 100.0% 146Not a Mother 67.7% 32.3% 100.0% 1,030
Single MothersSingle Mother 78.0% 22.0% 100.0% 35Not a Single Mother 68.5% 31.5% 100.0% 1,141
Workers with Chronic Health ConditionsWith Chronic Health Condition 78.1% 21.9% 100.0% 277No Chronic Health Condition 66.5% 33.5% 100.0% 888
Wage QuartilesBottom Wage Quartile 63.1% 36.9% 100.0% 188Second Wage Quartile 68.1% 31.9% 100.0% 294Third Wage Quartile 75.2% 24.8% 100.0% 363Top Wage Quartile 69.9% 30.1% 100.0% 331
Union MemberUnion 66.9% 33.1% 100.0% 217Non-Union 69.0% 31.0% 100.0% 948
Source: IWPR analysis of employee survey data.
Note: For subsample of workers reporting access to paid sick days.Source: IWPR analysis of employee survey data.
9
San Francisco’s Paid Sick Leave Ordinance
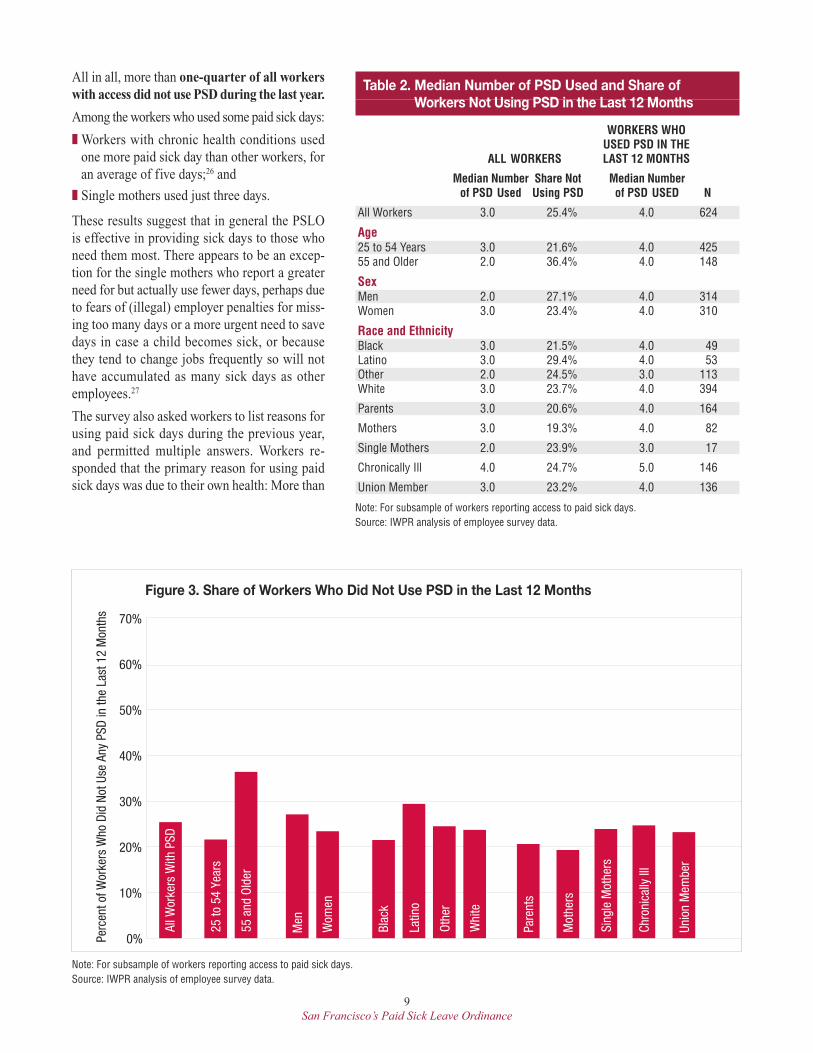
All in all, more than one-quarter of all workerswith access did not use PSD during the last year.
Among the workers who used some paid sick days:
� Workers with chronic health conditions usedone more paid sick day than other workers, foran average of five days;26 and
� Single mothers used just three days.
These results suggest that in general the PSLOis effective in providing sick days to those whoneed them most. There appears to be an excep-tion for the single mothers who report a greaterneed for but actually use fewer days, perhaps dueto fears of (illegal) employer penalties for miss-ing too many days or a more urgent need to savedays in case a child becomes sick, or becausethey tend to change jobs frequently so will nothave accumulated as many sick days as otheremployees.27
The survey also asked workers to list reasons forusing paid sick days during the previous year,and permitted multiple answers. Workers re-sponded that the primary reason for using paidsick days was due to their own health: More than
0%
10%
20%
30%
40%
50%
60%
70%
All W
orke
rs W
ith P
SD
25 to
54
Year
s
55 a
nd O
lder
Men
Wom
en
Blac
k
Latin
o
Othe
r
Whi
te
Pare
nts
Mot
hers
Sing
le M
othe
rs
Chro
nica
lly Il
l
Unio
n M
embe
r
Perc
ent o
f Wor
kers
Who
Did
Not
Use
Any
PSD
in th
e La
st 1
2 M
onth
s
Figure 3. Share of Workers Who Did Not Use PSD in the Last 12 Months
Note: For subsample of workers reporting access to paid sick days.Source: IWPR analysis of employee survey data.
Table 2. Median Number of PSD Used and Share of Workers Not Using PSD in the Last 12 Months
WORKERS WHOUSED PSD IN THE
ALL WORKERS LAST 12 MONTHS
Median Number Share Not Median Numberof PSD Used Using PSD of PSD USED N
All Workers 3.0 25.4% 4.0 624
Age25 to 54 Years 3.0 21.6% 4.0 42555 and Older 2.0 36.4% 4.0 148
SexMen 2.0 27.1% 4.0 314Women 3.0 23.4% 4.0 310
Race and EthnicityBlack 3.0 21.5% 4.0 49Latino 3.0 29.4% 4.0 53Other 2.0 24.5% 3.0 113White 3.0 23.7% 4.0 394
Parents 3.0 20.6% 4.0 164
Mothers 3.0 19.3% 4.0 82
Single Mothers 2.0 23.9% 3.0 17
Chronically Ill 4.0 24.7% 5.0 146
Union Member 3.0 23.2% 4.0 136
Note: For subsample of workers reporting access to paid sick days.Source: IWPR analysis of employee survey data.
10
San Francisco’s Paid Sick Leave Ordinance
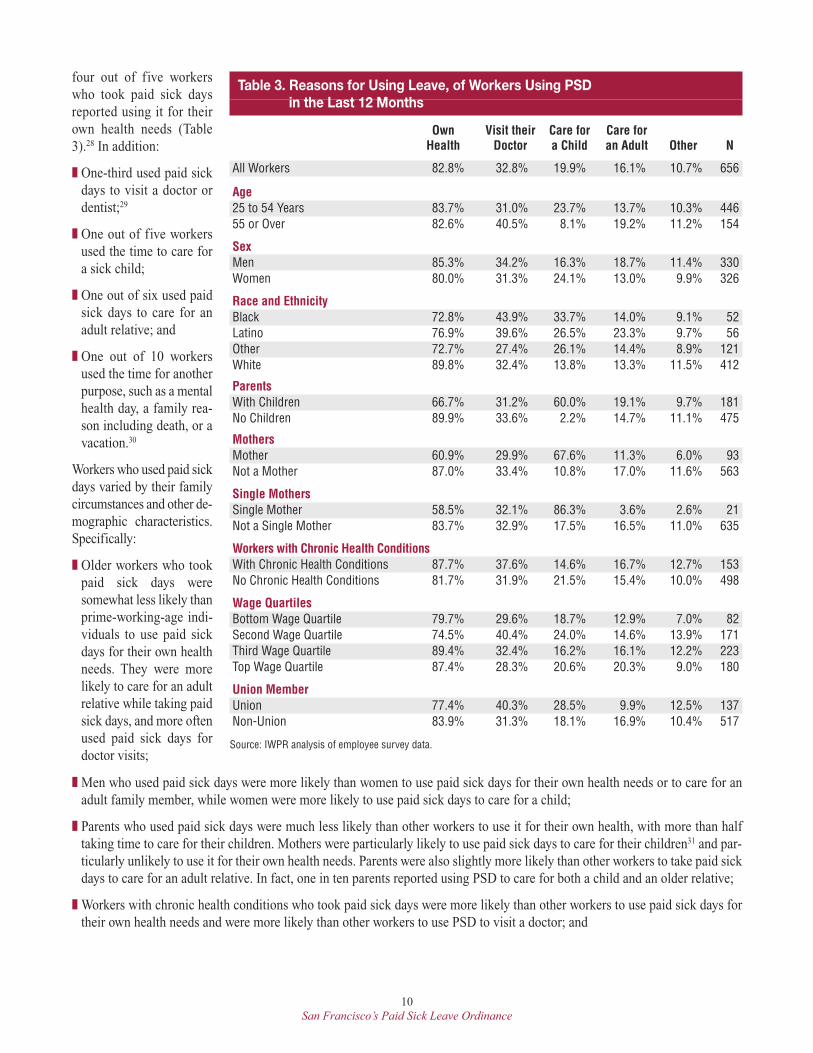
� Men who used paid sick days were more likely than women to use paid sick days for their own health needs or to care for anadult family member, while women were more likely to use paid sick days to care for a child;
� Parents who used paid sick days were much less likely than other workers to use it for their own health, with more than halftaking time to care for their children. Mothers were particularly likely to use paid sick days to care for their children31 and par-ticularly unlikely to use it for their own health needs. Parents were also slightly more likely than other workers to take paid sickdays to care for an adult relative. In fact, one in ten parents reported using PSD to care for both a child and an older relative;
� Workers with chronic health conditions who took paid sick days were more likely than other workers to use paid sick days fortheir own health needs and were more likely than other workers to use PSD to visit a doctor; and
Table 3. Reasons for Using Leave, of Workers Using PSD in the Last 12 Months
Own Visit their Care for Care forHealth Doctor a Child an Adult Other N
All Workers 82.8% 32.8% 19.9% 16.1% 10.7% 656
Age25 to 54 Years 83.7% 31.0% 23.7% 13.7% 10.3% 44655 or Over 82.6% 40.5% 8.1% 19.2% 11.2% 154
SexMen 85.3% 34.2% 16.3% 18.7% 11.4% 330Women 80.0% 31.3% 24.1% 13.0% 9.9% 326
Race and EthnicityBlack 72.8% 43.9% 33.7% 14.0% 9.1% 52Latino 76.9% 39.6% 26.5% 23.3% 9.7% 56Other 72.7% 27.4% 26.1% 14.4% 8.9% 121White 89.8% 32.4% 13.8% 13.3% 11.5% 412
ParentsWith Children 66.7% 31.2% 60.0% 19.1% 9.7% 181No Children 89.9% 33.6% 2.2% 14.7% 11.1% 475
MothersMother 60.9% 29.9% 67.6% 11.3% 6.0% 93Not a Mother 87.0% 33.4% 10.8% 17.0% 11.6% 563
Single MothersSingle Mother 58.5% 32.1% 86.3% 3.6% 2.6% 21Not a Single Mother 83.7% 32.9% 17.5% 16.5% 11.0% 635
Workers with Chronic Health ConditionsWith Chronic Health Conditions 87.7% 37.6% 14.6% 16.7% 12.7% 153No Chronic Health Conditions 81.7% 31.9% 21.5% 15.4% 10.0% 498
Wage QuartilesBottom Wage Quartile 79.7% 29.6% 18.7% 12.9% 7.0% 82Second Wage Quartile 74.5% 40.4% 24.0% 14.6% 13.9% 171Third Wage Quartile 89.4% 32.4% 16.2% 16.1% 12.2% 223Top Wage Quartile 87.4% 28.3% 20.6% 20.3% 9.0% 180
Union MemberUnion 77.4% 40.3% 28.5% 9.9% 12.5% 137Non-Union 83.9% 31.3% 18.1% 16.9% 10.4% 517
Source: IWPR analysis of employee survey data.
four out of five workerswho took paid sick daysreported using it for theirown health needs (Table3).28 In addition:
� One-third used paid sickdays to visit a doctor ordentist;29
� One out of five workersused the time to care fora sick child;
� One out of six used paidsick days to care for anadult relative; and
� One out of 10 workersused the time for anotherpurpose, such as a mentalhealth day, a family rea-son including death, or avacation.30
Workers who used paid sickdays varied by their familycircumstances and other de-mographic characteristics.Specifically:
� Older workers who tookpaid sick days weresomewhat less likely thanprime-working-age indi-viduals to use paid sickdays for their own healthneeds. They were morelikely to care for an adultrelative while taking paidsick days, and more oftenused paid sick days fordoctor visits;
11
San Francisco’s Paid Sick Leave Ordinance
� Of all racial/ethnic groups, black workers who took paid sick days were the least likely to use it for their own health, but themost likely to take it to visit a doctor or to care for a child. Latino workers who used paid sick days were the most likely of allrace/ethnic groups to use the leave to care for an adult and were more likely than workers overall to use PSD to see a doctor.
These findings suggest that many employees make trade-offs when using paid sick days. Workers with caregiving commitments,whether for children or other adults in need, tend to use paid sick days to care for others, perhaps using less time for their own healthneeds. The PSLO is designed to permit this sort of flexibility, so it supports families in ways that traditional sick days systems—per-mitting absence only for one’s own illness or injury—formally do not.32 Further, much of the caregiving for others and many of thedoctor visits are likely preventive in nature, indicating that access to paid sick days is likely to improve health over time, improve jobperformance, and reduce future absences.33
Workers and Their Families Benefited from the PSLO
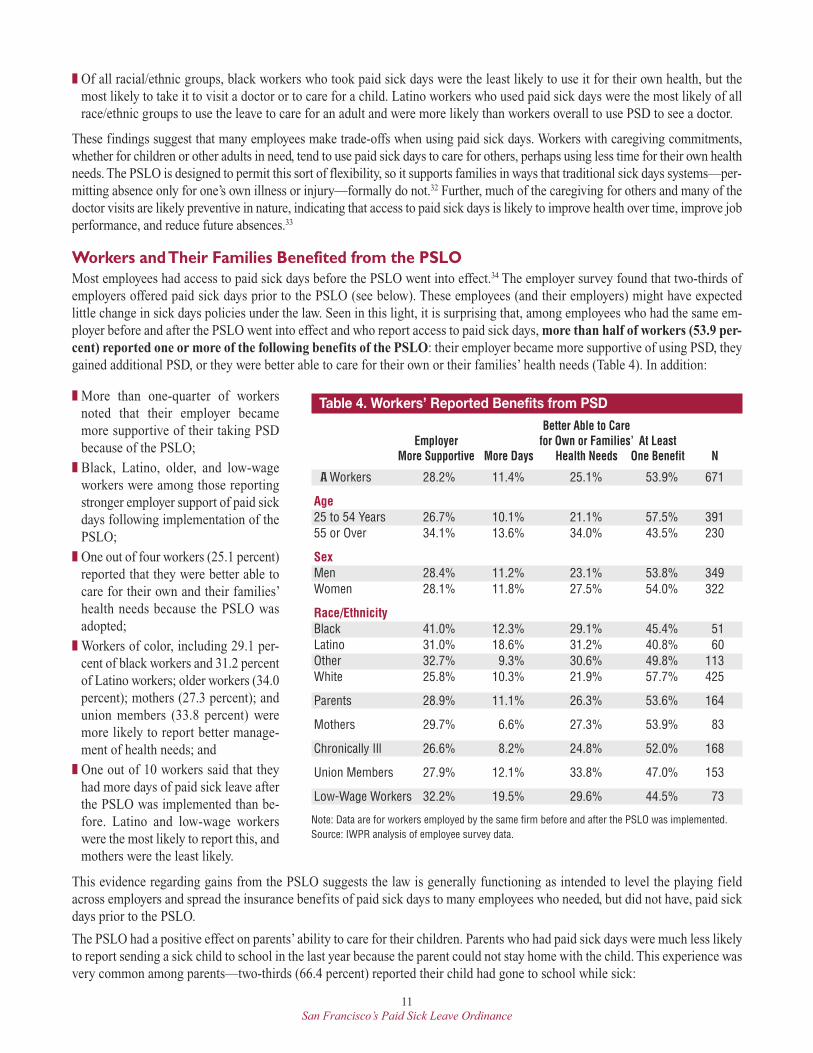
Most employees had access to paid sick days before the PSLO went into effect.34 The employer survey found that two-thirds ofemployers offered paid sick days prior to the PSLO (see below). These employees (and their employers) might have expectedlittle change in sick days policies under the law. Seen in this light, it is surprising that, among employees who had the same em-ployer before and after the PSLO went into effect and who report access to paid sick days, more than half of workers (53.9 per-cent) reported one or more of the following benefits of the PSLO: their employer became more supportive of using PSD, theygained additional PSD, or they were better able to care for their own or their families’ health needs (Table 4). In addition:
Table 4. Workers’ Reported Benefits from PSD
Better Able to CareEmployer for Own or Families’ At Least
More Supportive More Days Health Needs One Benefit N
All Workers 28.2% 11.4% 25.1% 53.9% 671
Age25 to 54 Years 26.7% 10.1% 21.1% 57.5% 39155 or Over 34.1% 13.6% 34.0% 43.5% 230
SexMen 28.4% 11.2% 23.1% 53.8% 349Women 28.1% 11.8% 27.5% 54.0% 322
Race/EthnicityBlack 41.0% 12.3% 29.1% 45.4% 51Latino 31.0% 18.6% 31.2% 40.8% 60Other 32.7% 9.3% 30.6% 49.8% 113White 25.8% 10.3% 21.9% 57.7% 425
Parents 28.9% 11.1% 26.3% 53.6% 164
Mothers 29.7% 6.6% 27.3% 53.9% 83
Chronically Ill 26.6% 8.2% 24.8% 52.0% 168
Union Members 27.9% 12.1% 33.8% 47.0% 153
Low-Wage Workers 32.2% 19.5% 29.6% 44.5% 73
Note: Data are for workers employed by the same firm before and after the PSLO was implemented. Source: IWPR analysis of employee survey data.
� More than one-quarter of workersnoted that their employer becamemore supportive of their taking PSDbecause of the PSLO;
� Black, Latino, older, and low-wageworkers were among those reportingstronger employer support of paid sickdays following implementation of thePSLO;
� One out of four workers (25.1 percent)reported that they were better able tocare for their own and their families’health needs because the PSLO wasadopted;
� Workers of color, including 29.1 per-cent of black workers and 31.2 percentof Latino workers; older workers (34.0percent); mothers (27.3 percent); andunion members (33.8 percent) weremore likely to report better manage-ment of health needs; and
� One out of 10 workers said that theyhad more days of paid sick leave afterthe PSLO was implemented than be-fore. Latino and low-wage workerswere the most likely to report this, andmothers were the least likely.
This evidence regarding gains from the PSLO suggests the law is generally functioning as intended to level the playing fieldacross employers and spread the insurance benefits of paid sick days to many employees who needed, but did not have, paid sickdays prior to the PSLO.
The PSLO had a positive effect on parents’ ability to care for their children. Parents who had paid sick days were much less likelyto report sending a sick child to school in the last year because the parent could not stay home with the child. This experience wasvery common among parents—two-thirds (66.4 percent) reported their child had gone to school while sick:
12
San Francisco’s Paid Sick Leave Ordinance
� Most parents who lacked paid sick days (75.9 percent) had sent a sick child to school; while
� Half of parents who had paid sick days had done so (53.8 percent). The reduction in the behavior is over 20 full percentage points.
It should be noted that those who believe they lack paid sick days are in fact covered by the law. Although knowledge of paid sickdays coverage dramatically reduces the rates of sick children being sent to school, the rates of parents sending a contagious childto school remain high even among those who know they have access to the PSLO. This may reflect a pressure that workers feelnot to take many sick days even when they are available, or parents whose children became ill after all available paid sick dayswere used up.
One of the major reasons for passing the PSLO was the hope that it would particularly benefit employees who interact with thepublic. Anecdotal evidence suggested that, before the PSLO was adopted, many workers in low-wage occupations that involvepublic contact—food service, for instance—were not able to stay home when they were sick.35 Presenteeism among these workerscould lead to the spread of disease among the general public.
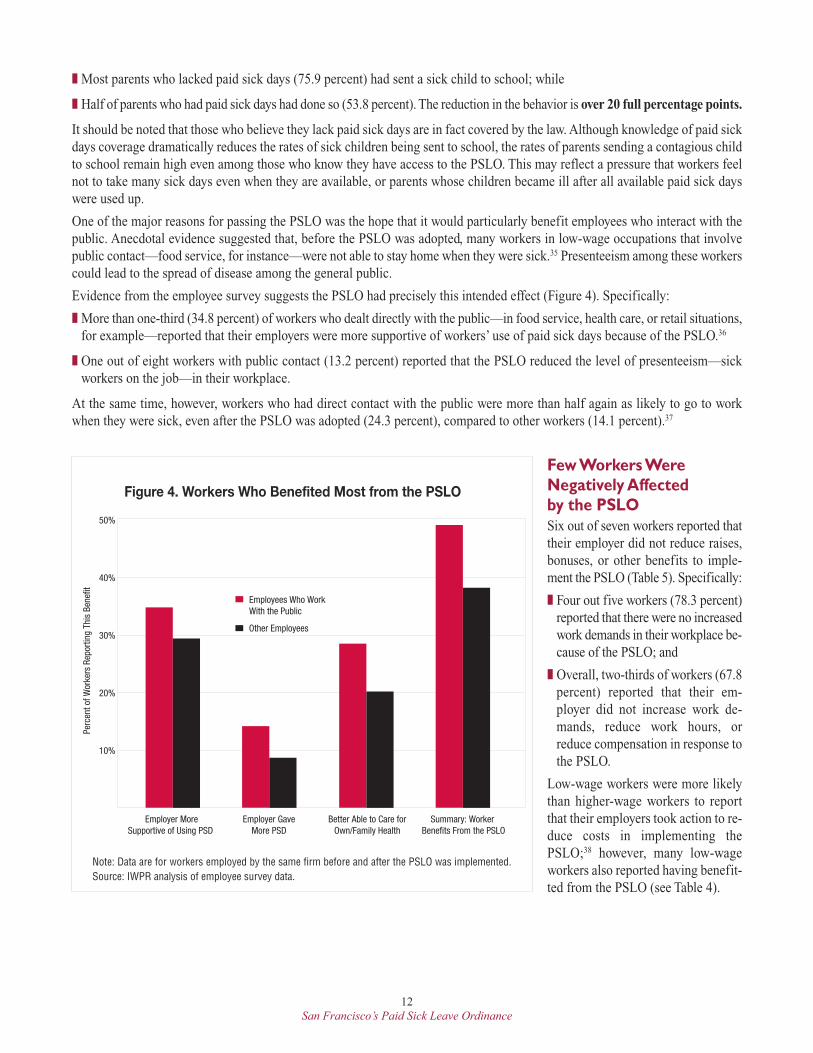
Evidence from the employee survey suggests the PSLO had precisely this intended effect (Figure 4). Specifically:
� More than one-third (34.8 percent) of workers who dealt directly with the public—in food service, health care, or retail situations,for example—reported that their employers were more supportive of workers’ use of paid sick days because of the PSLO.36
� One out of eight workers with public contact (13.2 percent) reported that the PSLO reduced the level of presenteeism—sickworkers on the job—in their workplace.
At the same time, however, workers who had direct contact with the public were more than half again as likely to go to workwhen they were sick, even after the PSLO was adopted (24.3 percent), compared to other workers (14.1 percent).37
10%
20%
30%
40%
50%
Employer MoreSupportive of Using PSD
Employer GaveMore PSD
Better Able to Care forOwn/Family Health
Summary: Worker Benefits From the PSLO
Perc
ent o
f Wor
kers
Rep
ortin
g Th
is B
enef
it
Employees Who WorkWith the Public
Other Employees
Figure 4. Workers Who Benefited Most from the PSLO
Note: Data are for workers employed by the same firm before and after the PSLO was implemented.Source: IWPR analysis of employee survey data.
Few Workers Were
Negatively Affected
by the PSLO
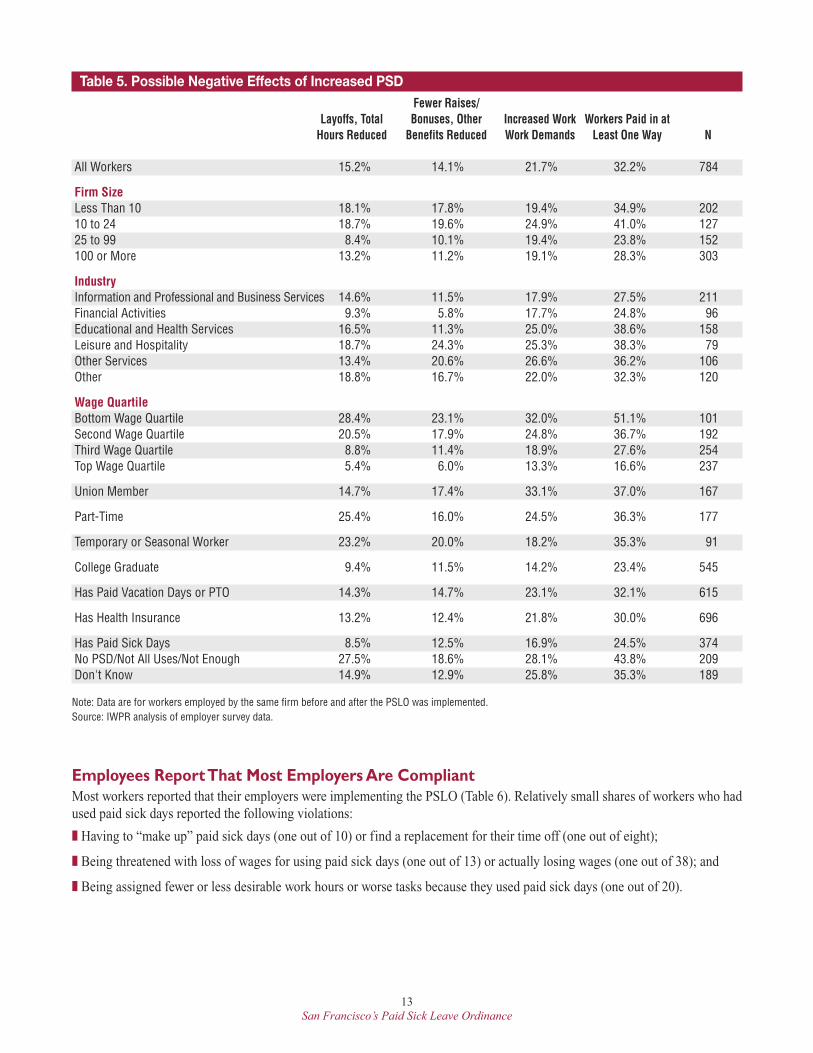
Six out of seven workers reported thattheir employer did not reduce raises,bonuses, or other benefits to imple-ment the PSLO (Table 5). Specifically:
� Four out five workers (78.3 percent)reported that there were no increasedwork demands in their workplace be-cause of the PSLO; and
� Overall, two-thirds of workers (67.8percent) reported that their em-ployer did not increase work de-mands, reduce work hours, orreduce compensation in response tothe PSLO.
Low-wage workers were more likelythan higher-wage workers to reportthat their employers took action to re-duce costs in implementing thePSLO;38 however, many low-wageworkers also reported having benefit-ted from the PSLO (see Table 4).
13
San Francisco’s Paid Sick Leave Ordinance
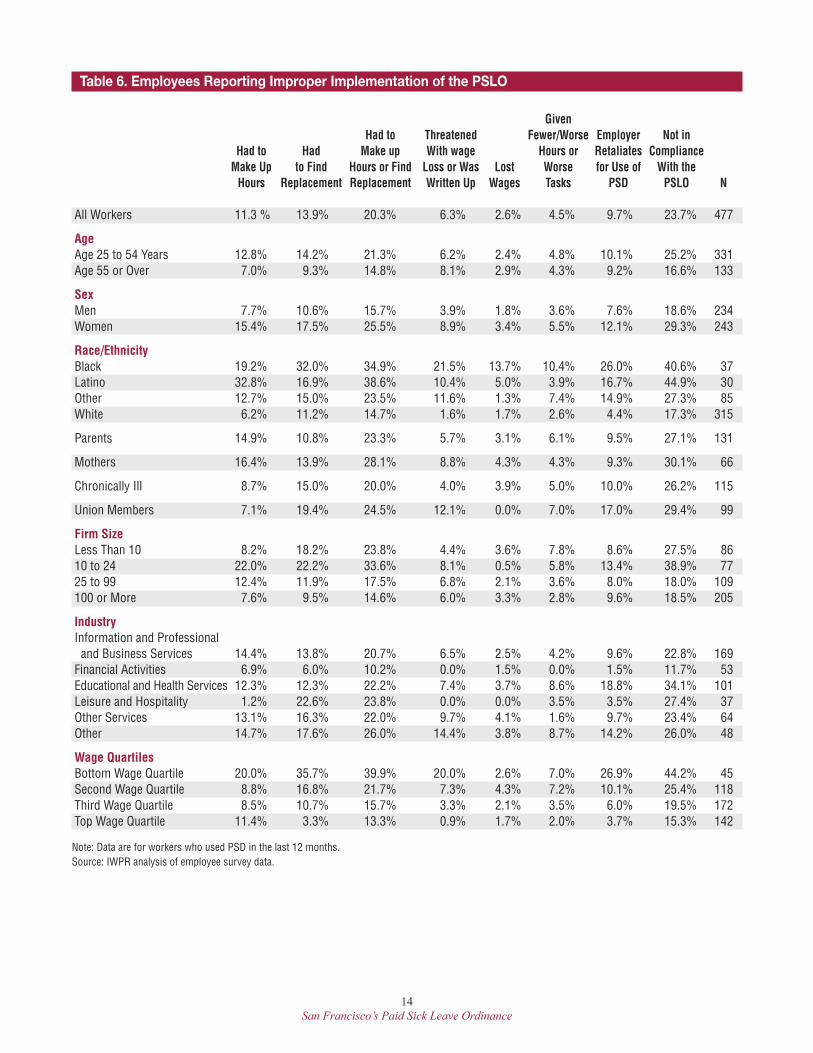
Employees Report That Most Employers Are Compliant
Most workers reported that their employers were implementing the PSLO (Table 6). Relatively small shares of workers who hadused paid sick days reported the following violations:
� Having to “make up” paid sick days (one out of 10) or find a replacement for their time off (one out of eight);
� Being threatened with loss of wages for using paid sick days (one out of 13) or actually losing wages (one out of 38); and
� Being assigned fewer or less desirable work hours or worse tasks because they used paid sick days (one out of 20).
Table 5. Possible Negative Effects of Increased PSDFewer Raises/
Layoffs, Total Bonuses, Other Increased Work Workers Paid in atHours Reduced Benefits Reduced Work Demands Least One Way N
All Workers 15.2% 14.1% 21.7% 32.2% 784
Firm SizeLess Than 10 18.1% 17.8% 19.4% 34.9% 20210 to 24 18.7% 19.6% 24.9% 41.0% 12725 to 99 8.4% 10.1% 19.4% 23.8% 152100 or More 13.2% 11.2% 19.1% 28.3% 303
IndustryInformation and Professional and Business Services 14.6% 11.5% 17.9% 27.5% 211Financial Activities 9.3% 5.8% 17.7% 24.8% 96Educational and Health Services 16.5% 11.3% 25.0% 38.6% 158Leisure and Hospitality 18.7% 24.3% 25.3% 38.3% 79Other Services 13.4% 20.6% 26.6% 36.2% 106Other 18.8% 16.7% 22.0% 32.3% 120
Wage QuartileBottom Wage Quartile 28.4% 23.1% 32.0% 51.1% 101Second Wage Quartile 20.5% 17.9% 24.8% 36.7% 192Third Wage Quartile 8.8% 11.4% 18.9% 27.6% 254Top Wage Quartile 5.4% 6.0% 13.3% 16.6% 237
Union Member 14.7% 17.4% 33.1% 37.0% 167
Part-Time 25.4% 16.0% 24.5% 36.3% 177
Temporary or Seasonal Worker 23.2% 20.0% 18.2% 35.3% 91
College Graduate 9.4% 11.5% 14.2% 23.4% 545
Has Paid Vacation Days or PTO 14.3% 14.7% 23.1% 32.1% 615
Has Health Insurance 13.2% 12.4% 21.8% 30.0% 696
Has Paid Sick Days 8.5% 12.5% 16.9% 24.5% 374No PSD/Not All Uses/Not Enough 27.5% 18.6% 28.1% 43.8% 209Don't Know 14.9% 12.9% 25.8% 35.3% 189
Note: Data are for workers employed by the same firm before and after the PSLO was implemented.Source: IWPR analysis of employer survey data.
14
San Francisco’s Paid Sick Leave Ordinance
Table 6. Employees Reporting Improper Implementation of the PSLO
GivenHad to Threatened Fewer/Worse Employer Not in
Had to Had Make up With wage Hours or Retaliates ComplianceMake Up to Find Hours or Find Loss or Was Lost Worse for Use of With theHours Replacement Replacement Written Up Wages Tasks PSD PSLO N
All Workers 11.3 % 13.9% 20.3% 6.3% 2.6% 4.5% 9.7% 23.7% 477
AgeAge 25 to 54 Years 12.8% 14.2% 21.3% 6.2% 2.4% 4.8% 10.1% 25.2% 331Age 55 or Over 7.0% 9.3% 14.8% 8.1% 2.9% 4.3% 9.2% 16.6% 133
SexMen 7.7% 10.6% 15.7% 3.9% 1.8% 3.6% 7.6% 18.6% 234Women 15.4% 17.5% 25.5% 8.9% 3.4% 5.5% 12.1% 29.3% 243
Race/EthnicityBlack 19.2% 32.0% 34.9% 21.5% 13.7% 10.4% 26.0% 40.6% 37Latino 32.8% 16.9% 38.6% 10.4% 5.0% 3.9% 16.7% 44.9% 30Other 12.7% 15.0% 23.5% 11.6% 1.3% 7.4% 14.9% 27.3% 85White 6.2% 11.2% 14.7% 1.6% 1.7% 2.6% 4.4% 17.3% 315
Parents 14.9% 10.8% 23.3% 5.7% 3.1% 6.1% 9.5% 27.1% 131
Mothers 16.4% 13.9% 28.1% 8.8% 4.3% 4.3% 9.3% 30.1% 66
Chronically Ill 8.7% 15.0% 20.0% 4.0% 3.9% 5.0% 10.0% 26.2% 115
Union Members 7.1% 19.4% 24.5% 12.1% 0.0% 7.0% 17.0% 29.4% 99
Firm SizeLess Than 10 8.2% 18.2% 23.8% 4.4% 3.6% 7.8% 8.6% 27.5% 8610 to 24 22.0% 22.2% 33.6% 8.1% 0.5% 5.8% 13.4% 38.9% 7725 to 99 12.4% 11.9% 17.5% 6.8% 2.1% 3.6% 8.0% 18.0% 109100 or More 7.6% 9.5% 14.6% 6.0% 3.3% 2.8% 9.6% 18.5% 205
IndustryInformation and Professionaland Business Services 14.4% 13.8% 20.7% 6.5% 2.5% 4.2% 9.6% 22.8% 169Financial Activities 6.9% 6.0% 10.2% 0.0% 1.5% 0.0% 1.5% 11.7% 53Educational and Health Services 12.3% 12.3% 22.2% 7.4% 3.7% 8.6% 18.8% 34.1% 101Leisure and Hospitality 1.2% 22.6% 23.8% 0.0% 0.0% 3.5% 3.5% 27.4% 37Other Services 13.1% 16.3% 22.0% 9.7% 4.1% 1.6% 9.7% 23.4% 64Other 14.7% 17.6% 26.0% 14.4% 3.8% 8.7% 14.2% 26.0% 48
Wage QuartilesBottom Wage Quartile 20.0% 35.7% 39.9% 20.0% 2.6% 7.0% 26.9% 44.2% 45Second Wage Quartile 8.8% 16.8% 21.7% 7.3% 4.3% 7.2% 10.1% 25.4% 118Third Wage Quartile 8.5% 10.7% 15.7% 3.3% 2.1% 3.5% 6.0% 19.5% 172Top Wage Quartile 11.4% 3.3% 13.3% 0.9% 1.7% 2.0% 3.7% 15.3% 142
Note: Data are for workers who used PSD in the last 12 months. Source: IWPR analysis of employee survey data.
15
San Francisco’s Paid Sick Leave Ordinance
Women, black, and Latino workers; parents;and low-wage workers were more likely toreport having to “make up” their PSD orfind a worker to fill in for their leave. Work-ers in the leisure and hospitality industryand “other” industries were the most likelyto report one of these situations.
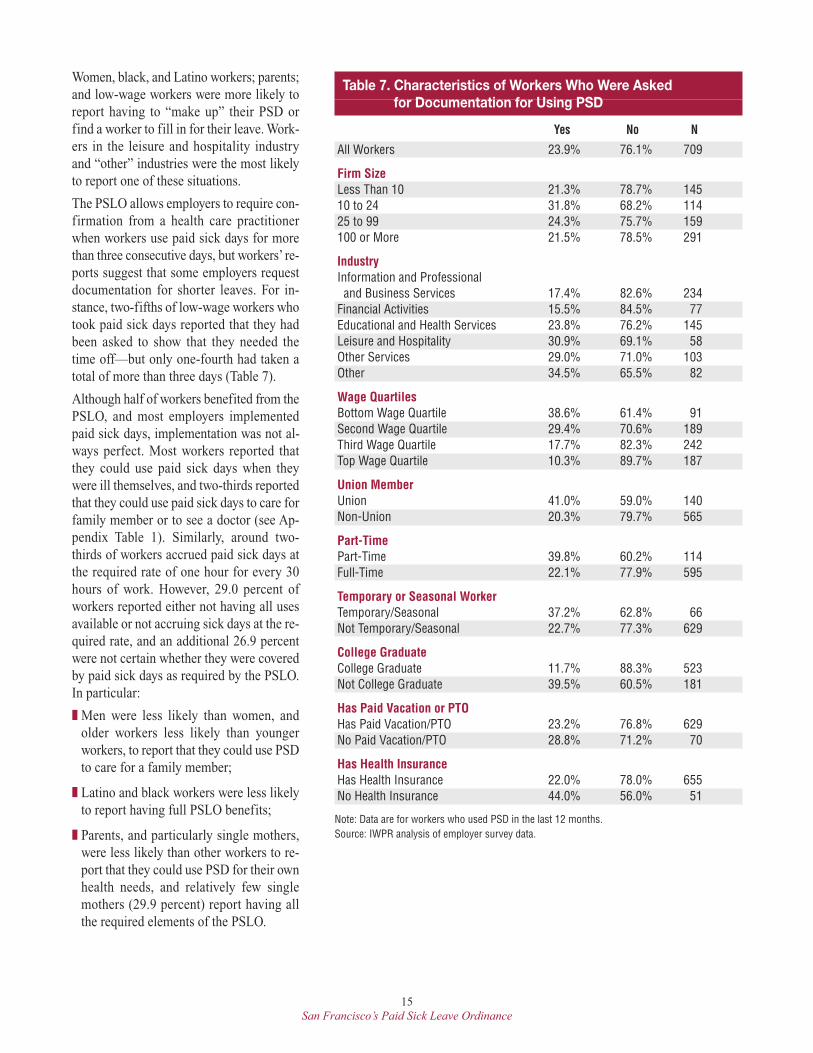
The PSLO allows employers to require con-firmation from a health care practitionerwhen workers use paid sick days for morethan three consecutive days, but workers’ re-ports suggest that some employers requestdocumentation for shorter leaves. For in-stance, two-fifths of low-wage workers whotook paid sick days reported that they hadbeen asked to show that they needed thetime off—but only one-fourth had taken atotal of more than three days (Table 7).
Although half of workers benefited from thePSLO, and most employers implementedpaid sick days, implementation was not al-ways perfect. Most workers reported thatthey could use paid sick days when theywere ill themselves, and two-thirds reportedthat they could use paid sick days to care forfamily member or to see a doctor (see Ap-pendix Table 1). Similarly, around two-thirds of workers accrued paid sick days atthe required rate of one hour for every 30hours of work. However, 29.0 percent ofworkers reported either not having all usesavailable or not accruing sick days at the re-quired rate, and an additional 26.9 percentwere not certain whether they were coveredby paid sick days as required by the PSLO.In particular:
� Men were less likely than women, andolder workers less likely than youngerworkers, to report that they could use PSDto care for a family member;
� Latino and black workers were less likelyto report having full PSLO benefits;
� Parents, and particularly single mothers,were less likely than other workers to re-port that they could use PSD for their ownhealth needs, and relatively few singlemothers (29.9 percent) report having allthe required elements of the PSLO.
Table 7. Characteristics of Workers Who Were Asked for Documentation for Using PSD
Yes No N
All Workers 23.9% 76.1% 709
Firm SizeLess Than 10 21.3% 78.7% 14510 to 24 31.8% 68.2% 11425 to 99 24.3% 75.7% 159100 or More 21.5% 78.5% 291
IndustryInformation and Professional and Business Services 17.4% 82.6% 234Financial Activities 15.5% 84.5% 77Educational and Health Services 23.8% 76.2% 145Leisure and Hospitality 30.9% 69.1% 58Other Services 29.0% 71.0% 103Other 34.5% 65.5% 82
Wage QuartilesBottom Wage Quartile 38.6% 61.4% 91Second Wage Quartile 29.4% 70.6% 189Third Wage Quartile 17.7% 82.3% 242Top Wage Quartile 10.3% 89.7% 187
Union MemberUnion 41.0% 59.0% 140Non-Union 20.3% 79.7% 565
Part-TimePart-Time 39.8% 60.2% 114Full-Time 22.1% 77.9% 595
Temporary or Seasonal WorkerTemporary/Seasonal 37.2% 62.8% 66Not Temporary/Seasonal 22.7% 77.3% 629
College GraduateCollege Graduate 11.7% 88.3% 523Not College Graduate 39.5% 60.5% 181
Has Paid Vacation or PTOHas Paid Vacation/PTO 23.2% 76.8% 629No Paid Vacation/PTO 28.8% 71.2% 70
Has Health InsuranceHas Health Insurance 22.0% 78.0% 655No Health Insurance 44.0% 56.0% 51
Note: Data are for workers who used PSD in the last 12 months. Source: IWPR analysis of employer survey data.

17
San Francisco’s Paid Sick Leave Ordinance
Employers and the Paid Sick Leave Ordinance
Few Employers Had to Change Policies for the PSLO
Patterns of employer sick leave provision and compliance reflected in the employer survey are consistent with reports from em-ployees. As was found in the employee survey results, it should be the case that most employers already offered paid sick dayspolicies. Other employers should have responded to the ordinance with a new or expanded paid sick days policy. The employeesurvey results also suggest that non-compliance will be concentrated among small businesses. The employer survey results fitthese expectations.
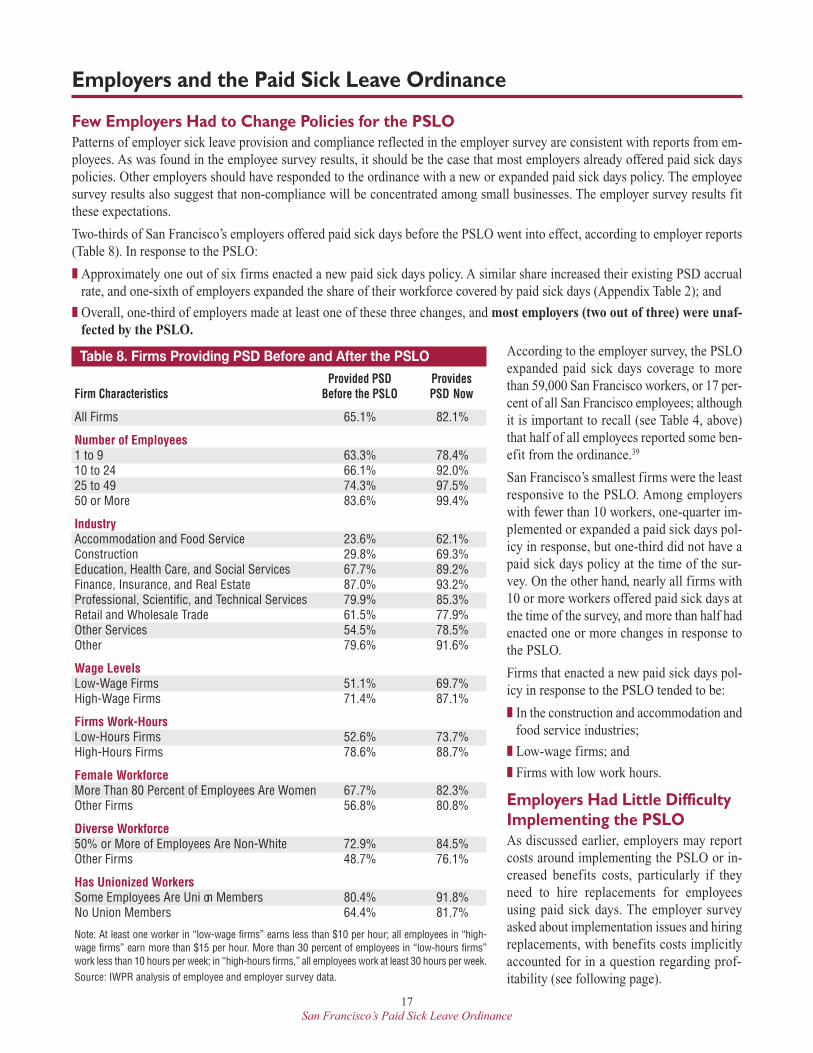
Two-thirds of San Francisco’s employers offered paid sick days before the PSLO went into effect, according to employer reports(Table 8). In response to the PSLO:
� Approximately one out of six firms enacted a new paid sick days policy. A similar share increased their existing PSD accrualrate, and one-sixth of employers expanded the share of their workforce covered by paid sick days (Appendix Table 2); and
� Overall, one-third of employers made at least one of these three changes, and most employers (two out of three) were unaf-fected by the PSLO.
According to the employer survey, the PSLOexpanded paid sick days coverage to morethan 59,000 San Francisco workers, or 17 per-cent of all San Francisco employees; althoughit is important to recall (see Table 4, above)that half of all employees reported some ben-efit from the ordinance.39
San Francisco’s smallest firms were the leastresponsive to the PSLO. Among employerswith fewer than 10 workers, one-quarter im-plemented or expanded a paid sick days pol-icy in response, but one-third did not have apaid sick days policy at the time of the sur-vey. On the other hand, nearly all firms with10 or more workers offered paid sick days atthe time of the survey, and more than half hadenacted one or more changes in response tothe PSLO.
Firms that enacted a new paid sick days pol-icy in response to the PSLO tended to be:
� In the construction and accommodation andfood service industries;
� Low-wage firms; and
� Firms with low work hours.
Employers Had Little Difficulty
Implementing the PSLO
As discussed earlier, employers may reportcosts around implementing the PSLO or in-creased benefits costs, particularly if theyneed to hire replacements for employeesusing paid sick days. The employer surveyasked about implementation issues and hiringreplacements, with benefits costs implicitlyaccounted for in a question regarding prof-itability (see following page).
Table 8. Firms Providing PSD Before and After the PSLO
Provided PSD ProvidesFirm Characteristics Before the PSLO PSD Now
All Firms 65.1% 82.1%
Number of Employees1 to 9 63.3% 78.4%10 to 24 66.1% 92.0%25 to 49 74.3% 97.5%50 or More 83.6% 99.4%
IndustryAccommodation and Food Service 23.6% 62.1%Construction 29.8% 69.3%Education, Health Care, and Social Services 67.7% 89.2%Finance, Insurance, and Real Estate 87.0% 93.2%Professional, Scientific, and Technical Services 79.9% 85.3%Retail and Wholesale Trade 61.5% 77.9%Other Services 54.5% 78.5%Other 79.6% 91.6%
Wage LevelsLow-Wage Firms 51.1% 69.7%High-Wage Firms 71.4% 87.1%
Firms Work-HoursLow-Hours Firms 52.6% 73.7%High-Hours Firms 78.6% 88.7%
Female WorkforceMore Than 80 Percent of Employees Are Women 67.7% 82.3%Other Firms 56.8% 80.8%
Diverse Workforce50% or More of Employees Are Non-White 72.9% 84.5%Other Firms 48.7% 76.1%
Has Unionized WorkersSome Employees Are Uni on Members 80.4% 91.8%No Union Members 64.4% 81.7%
Note: At least one worker in “low-wage firms” earns less than $10 per hour; all employees in “high-wage firms” earn more than $15 per hour. More than 30 percent of employees in “low-hours firms”work less than 10 hours per week; in “high-hours firms,” all employees work at least 30 hours per week. Source: IWPR analysis of employee and employer survey data.
18
San Francisco’s Paid Sick Leave Ordinance
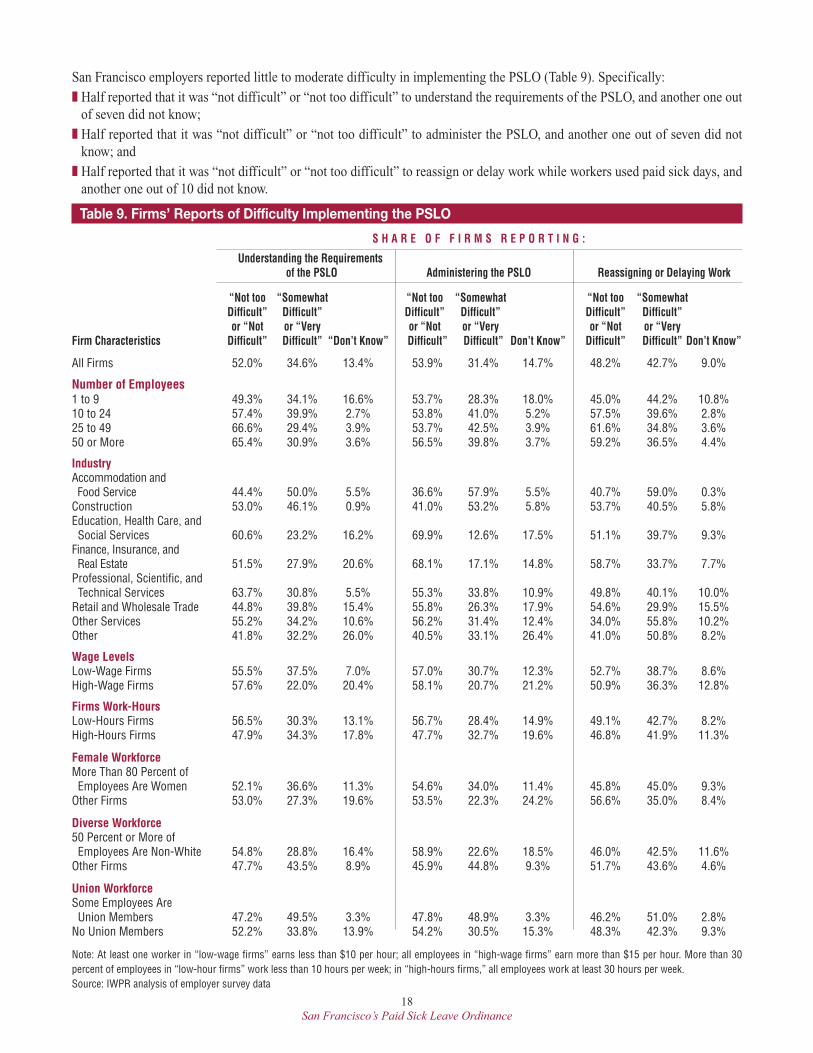
San Francisco employers reported little to moderate difficulty in implementing the PSLO (Table 9). Specifically:� Half reported that it was “not difficult” or “not too difficult” to understand the requirements of the PSLO, and another one outof seven did not know;
� Half reported that it was “not difficult” or “not too difficult” to administer the PSLO, and another one out of seven did notknow; and
� Half reported that it was “not difficult” or “not too difficult” to reassign or delay work while workers used paid sick days, andanother one out of 10 did not know.
Table 9. Firms’ Reports of Difficulty Implementing the PSLO
S H A R E O F F I R M S R E P O R T I N G :
Understanding the Requirementsof the PSLO Administering the PSLO Reassigning or Delaying Work
“Not too “Somewhat “Not too “Somewhat “Not too “SomewhatDifficult” Difficult” Difficult” Difficult” Difficult” Difficult”or “Not or “Very or “Not or “Very or “Not or “Very
Firm Characteristics Difficult” Difficult” “Don’t Know” Difficult” Difficult” Don’t Know” Difficult” Difficult” Don’t Know”
All Firms 52.0% 34.6% 13.4% 53.9% 31.4% 14.7% 48.2% 42.7% 9.0%
Number of Employees1 to 9 49.3% 34.1% 16.6% 53.7% 28.3% 18.0% 45.0% 44.2% 10.8%10 to 24 57.4% 39.9% 2.7% 53.8% 41.0% 5.2% 57.5% 39.6% 2.8%25 to 49 66.6% 29.4% 3.9% 53.7% 42.5% 3.9% 61.6% 34.8% 3.6%50 or More 65.4% 30.9% 3.6% 56.5% 39.8% 3.7% 59.2% 36.5% 4.4%
IndustryAccommodation and Food Service 44.4% 50.0% 5.5% 36.6% 57.9% 5.5% 40.7% 59.0% 0.3%Construction 53.0% 46.1% 0.9% 41.0% 53.2% 5.8% 53.7% 40.5% 5.8%Education, Health Care, and Social Services 60.6% 23.2% 16.2% 69.9% 12.6% 17.5% 51.1% 39.7% 9.3%Finance, Insurance, and Real Estate 51.5% 27.9% 20.6% 68.1% 17.1% 14.8% 58.7% 33.7% 7.7%Professional, Scientific, and Technical Services 63.7% 30.8% 5.5% 55.3% 33.8% 10.9% 49.8% 40.1% 10.0%Retail and Wholesale Trade 44.8% 39.8% 15.4% 55.8% 26.3% 17.9% 54.6% 29.9% 15.5%Other Services 55.2% 34.2% 10.6% 56.2% 31.4% 12.4% 34.0% 55.8% 10.2%Other 41.8% 32.2% 26.0% 40.5% 33.1% 26.4% 41.0% 50.8% 8.2%
Wage LevelsLow-Wage Firms 55.5% 37.5% 7.0% 57.0% 30.7% 12.3% 52.7% 38.7% 8.6%High-Wage Firms 57.6% 22.0% 20.4% 58.1% 20.7% 21.2% 50.9% 36.3% 12.8%
Firms Work-HoursLow-Hours Firms 56.5% 30.3% 13.1% 56.7% 28.4% 14.9% 49.1% 42.7% 8.2%High-Hours Firms 47.9% 34.3% 17.8% 47.7% 32.7% 19.6% 46.8% 41.9% 11.3%
Female WorkforceMore Than 80 Percent of Employees Are Women 52.1% 36.6% 11.3% 54.6% 34.0% 11.4% 45.8% 45.0% 9.3%Other Firms 53.0% 27.3% 19.6% 53.5% 22.3% 24.2% 56.6% 35.0% 8.4%
Diverse Workforce50 Percent or More of Employees Are Non-White 54.8% 28.8% 16.4% 58.9% 22.6% 18.5% 46.0% 42.5% 11.6%Other Firms 47.7% 43.5% 8.9% 45.9% 44.8% 9.3% 51.7% 43.6% 4.6%
Union WorkforceSome Employees Are Union Members 47.2% 49.5% 3.3% 47.8% 48.9% 3.3% 46.2% 51.0% 2.8%No Union Members 52.2% 33.8% 13.9% 54.2% 30.5% 15.3% 48.3% 42.3% 9.3%
Note: At least one worker in “low-wage firms” earns less than $10 per hour; all employees in “high-wage firms” earn more than $15 per hour. More than 30percent of employees in “low-hour firms” work less than 10 hours per week; in “high-hours firms,” all employees work at least 30 hours per week. Source: IWPR analysis of employer survey data
19
San Francisco’s Paid Sick Leave Ordinance
It is possible that one response to these difficulties lay in non-compliance, and one-quarter of employers who reported difficultiesimplementing the PSLO also reported providing no paid sick days in the survey.
Smaller firms reported finding it easier to administer the PSLO, but more difficult to adjust workload for absent workers. Theywere also much more likely to answer that they did not know whether it was difficult to understand or implement the PSLO or tomanage workload when workers used paid sick days. The restaurant and hospitality industry showed higher rates of difficultyimplementing the PSLO, perhaps because few employers had paid sick days before the ordinance, or because they often neededto hire replacement workers.
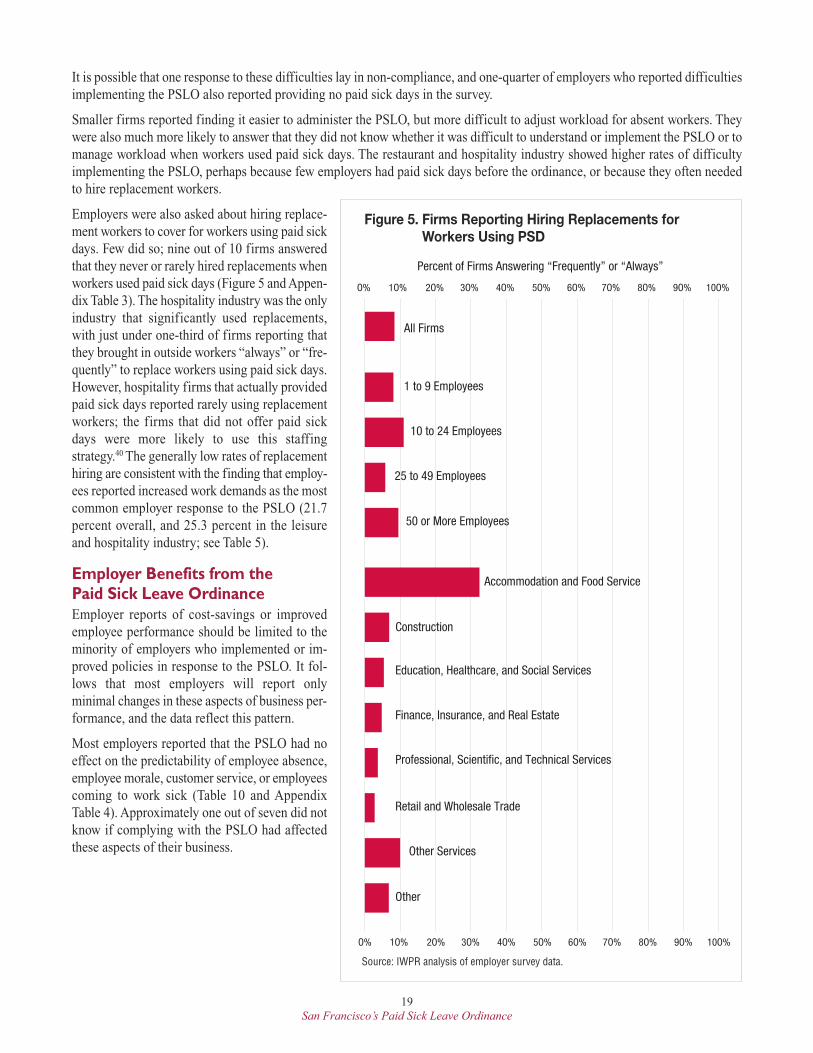
Employers were also asked about hiring replace-ment workers to cover for workers using paid sickdays. Few did so; nine out of 10 firms answeredthat they never or rarely hired replacements whenworkers used paid sick days (Figure 5 and Appen-dix Table 3). The hospitality industry was the onlyindustry that significantly used replacements,with just under one-third of firms reporting thatthey brought in outside workers “always” or “fre-quently” to replace workers using paid sick days.However, hospitality firms that actually providedpaid sick days reported rarely using replacementworkers; the firms that did not offer paid sickdays were more likely to use this staffingstrategy.40 The generally low rates of replacementhiring are consistent with the finding that employ-ees reported increased work demands as the mostcommon employer response to the PSLO (21.7percent overall, and 25.3 percent in the leisureand hospitality industry; see Table 5).
Employer Benefits from the
Paid Sick Leave Ordinance
Employer reports of cost-savings or improvedemployee performance should be limited to theminority of employers who implemented or im-proved policies in response to the PSLO. It fol-lows that most employers will report onlyminimal changes in these aspects of business per-formance, and the data reflect this pattern.
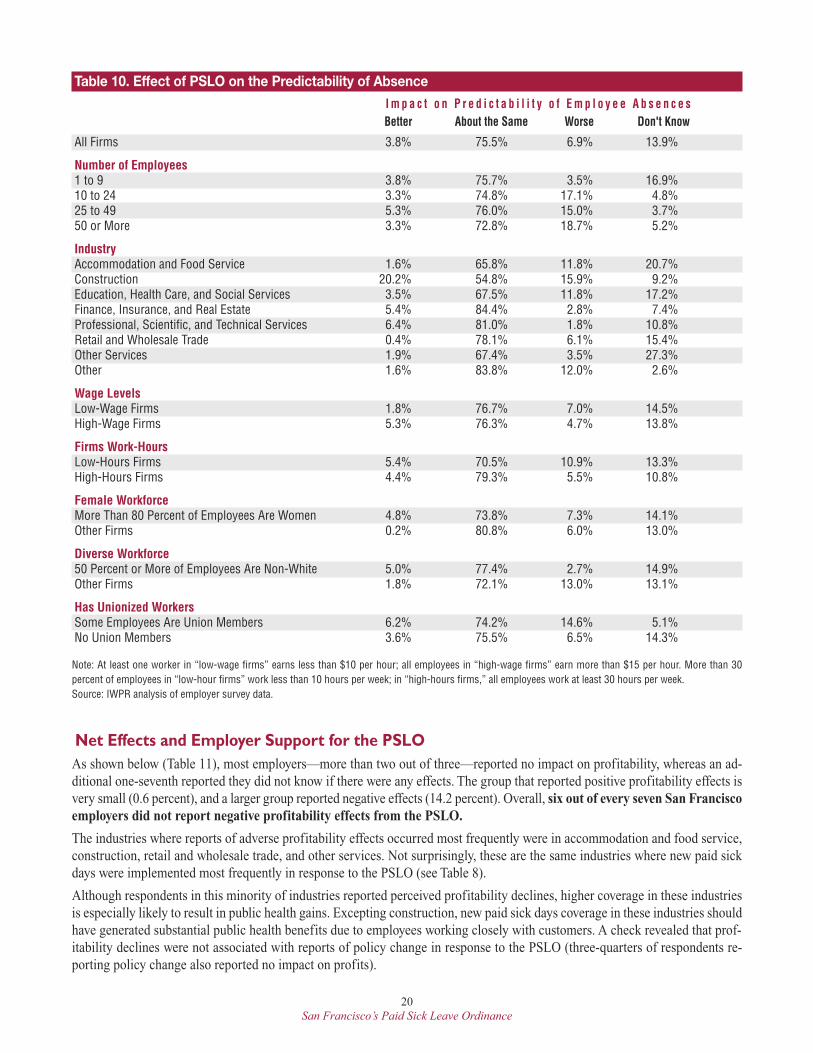
Most employers reported that the PSLO had noeffect on the predictability of employee absence,employee morale, customer service, or employeescoming to work sick (Table 10 and AppendixTable 4). Approximately one out of seven did notknow if complying with the PSLO had affectedthese aspects of their business.
All Firms
1 to 9 Employees
10 to 24 Employees
25 to 49 Employees
50 or More Employees
Accommodation and Food Service
Construction
Education, Healthcare, and Social Services
Finance, Insurance, and Real Estate
Professional, Scientific, and Technical Services
Retail and Wholesale Trade
Other
Other Services
O% 1O% 2O% 3O% 4O% 5O% 6O% 7O% 8O% 9O% 10O%
Percent of Firms Answering “Frequently” or “Always”
O% 1O% 2O% 3O% 4O% 5O% 6O% 7O% 8O% 9O% 10O%
Figure 5. Firms Reporting Hiring Replacements for Workers Using PSD
Source: IWPR analysis of employer survey data.
20
San Francisco’s Paid Sick Leave Ordinance
Net Effects and Employer Support for the PSLO
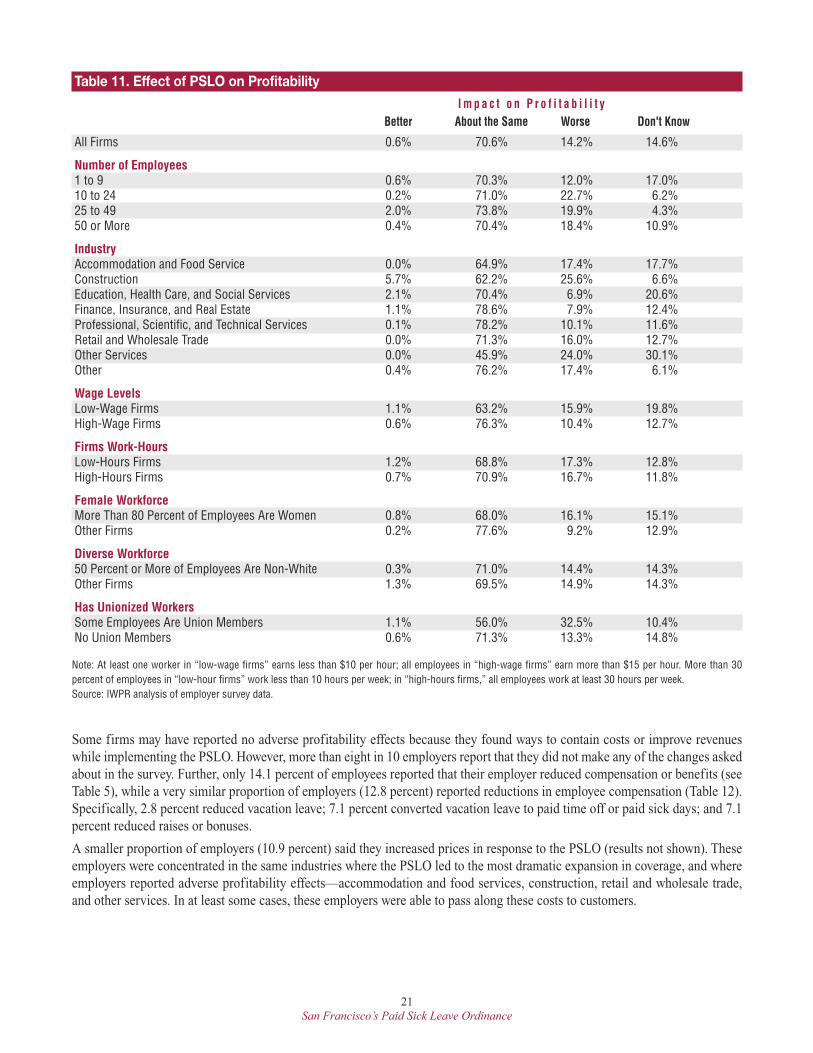
As shown below (Table 11), most employers—more than two out of three—reported no impact on profitability, whereas an ad-ditional one-seventh reported they did not know if there were any effects. The group that reported positive profitability effects isvery small (0.6 percent), and a larger group reported negative effects (14.2 percent). Overall, six out of every seven San Franciscoemployers did not report negative profitability effects from the PSLO.
The industries where reports of adverse profitability effects occurred most frequently were in accommodation and food service,construction, retail and wholesale trade, and other services. Not surprisingly, these are the same industries where new paid sickdays were implemented most frequently in response to the PSLO (see Table 8).
Although respondents in this minority of industries reported perceived profitability declines, higher coverage in these industriesis especially likely to result in public health gains. Excepting construction, new paid sick days coverage in these industries shouldhave generated substantial public health benefits due to employees working closely with customers. A check revealed that prof-itability declines were not associated with reports of policy change in response to the PSLO (three-quarters of respondents re-porting policy change also reported no impact on profits).
Table 10. Effect of PSLO on the Predictability of Absence
I m p a c t o n P r e d i c t a b i l i t y o f Em p l o y e e A b s e n c e sBetter About the Same Worse Don't Know
All Firms 3.8% 75.5% 6.9% 13.9%
Number of Employees1 to 9 3.8% 75.7% 3.5% 16.9%10 to 24 3.3% 74.8% 17.1% 4.8%25 to 49 5.3% 76.0% 15.0% 3.7%50 or More 3.3% 72.8% 18.7% 5.2%
IndustryAccommodation and Food Service 1.6% 65.8% 11.8% 20.7%Construction 20.2% 54.8% 15.9% 9.2%Education, Health Care, and Social Services 3.5% 67.5% 11.8% 17.2%Finance, Insurance, and Real Estate 5.4% 84.4% 2.8% 7.4%Professional, Scientific, and Technical Services 6.4% 81.0% 1.8% 10.8%Retail and Wholesale Trade 0.4% 78.1% 6.1% 15.4%Other Services 1.9% 67.4% 3.5% 27.3%Other 1.6% 83.8% 12.0% 2.6%
Wage LevelsLow-Wage Firms 1.8% 76.7% 7.0% 14.5%High-Wage Firms 5.3% 76.3% 4.7% 13.8%
Firms Work-HoursLow-Hours Firms 5.4% 70.5% 10.9% 13.3%High-Hours Firms 4.4% 79.3% 5.5% 10.8%
Female WorkforceMore Than 80 Percent of Employees Are Women 4.8% 73.8% 7.3% 14.1%Other Firms 0.2% 80.8% 6.0% 13.0%
Diverse Workforce50 Percent or More of Employees Are Non-White 5.0% 77.4% 2.7% 14.9%Other Firms 1.8% 72.1% 13.0% 13.1%
Has Unionized WorkersSome Employees Are Union Members 6.2% 74.2% 14.6% 5.1%No Union Members 3.6% 75.5% 6.5% 14.3%
Note: At least one worker in “low-wage firms” earns less than $10 per hour; all employees in “high-wage firms” earn more than $15 per hour. More than 30percent of employees in “low-hour firms” work less than 10 hours per week; in “high-hours firms,” all employees work at least 30 hours per week. Source: IWPR analysis of employer survey data.
21
San Francisco’s Paid Sick Leave Ordinance
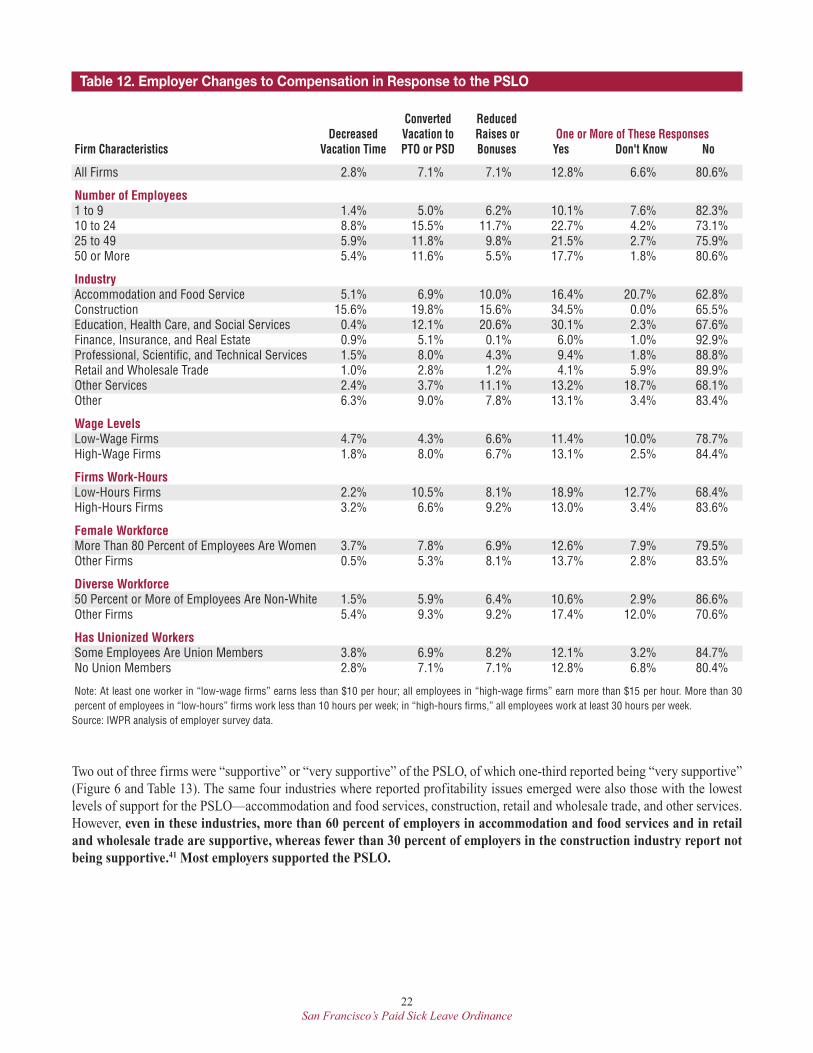
Some firms may have reported no adverse profitability effects because they found ways to contain costs or improve revenueswhile implementing the PSLO. However, more than eight in 10 employers report that they did not make any of the changes askedabout in the survey. Further, only 14.1 percent of employees reported that their employer reduced compensation or benefits (seeTable 5), while a very similar proportion of employers (12.8 percent) reported reductions in employee compensation (Table 12).Specifically, 2.8 percent reduced vacation leave; 7.1 percent converted vacation leave to paid time off or paid sick days; and 7.1percent reduced raises or bonuses.
A smaller proportion of employers (10.9 percent) said they increased prices in response to the PSLO (results not shown). Theseemployers were concentrated in the same industries where the PSLO led to the most dramatic expansion in coverage, and whereemployers reported adverse profitability effects—accommodation and food services, construction, retail and wholesale trade,and other services. In at least some cases, these employers were able to pass along these costs to customers.
Table 11. Effect of PSLO on Profitability
I m p a c t o n P r o f i t a b i l i t yBetter About the Same Worse Don't Know
All Firms 0.6% 70.6% 14.2% 14.6%
Number of Employees1 to 9 0.6% 70.3% 12.0% 17.0%10 to 24 0.2% 71.0% 22.7% 6.2%25 to 49 2.0% 73.8% 19.9% 4.3%50 or More 0.4% 70.4% 18.4% 10.9%
IndustryAccommodation and Food Service 0.0% 64.9% 17.4% 17.7%Construction 5.7% 62.2% 25.6% 6.6%Education, Health Care, and Social Services 2.1% 70.4% 6.9% 20.6%Finance, Insurance, and Real Estate 1.1% 78.6% 7.9% 12.4%Professional, Scientific, and Technical Services 0.1% 78.2% 10.1% 11.6%Retail and Wholesale Trade 0.0% 71.3% 16.0% 12.7%Other Services 0.0% 45.9% 24.0% 30.1%Other 0.4% 76.2% 17.4% 6.1%
Wage LevelsLow-Wage Firms 1.1% 63.2% 15.9% 19.8%High-Wage Firms 0.6% 76.3% 10.4% 12.7%
Firms Work-HoursLow-Hours Firms 1.2% 68.8% 17.3% 12.8%High-Hours Firms 0.7% 70.9% 16.7% 11.8%
Female WorkforceMore Than 80 Percent of Employees Are Women 0.8% 68.0% 16.1% 15.1%Other Firms 0.2% 77.6% 9.2% 12.9%
Diverse Workforce50 Percent or More of Employees Are Non-White 0.3% 71.0% 14.4% 14.3%Other Firms 1.3% 69.5% 14.9% 14.3%
Has Unionized WorkersSome Employees Are Union Members 1.1% 56.0% 32.5% 10.4%No Union Members 0.6% 71.3% 13.3% 14.8%
Note: At least one worker in “low-wage firms” earns less than $10 per hour; all employees in “high-wage firms” earn more than $15 per hour. More than 30percent of employees in “low-hour firms” work less than 10 hours per week; in “high-hours firms,” all employees work at least 30 hours per week.Source: IWPR analysis of employer survey data.
22
San Francisco’s Paid Sick Leave Ordinance
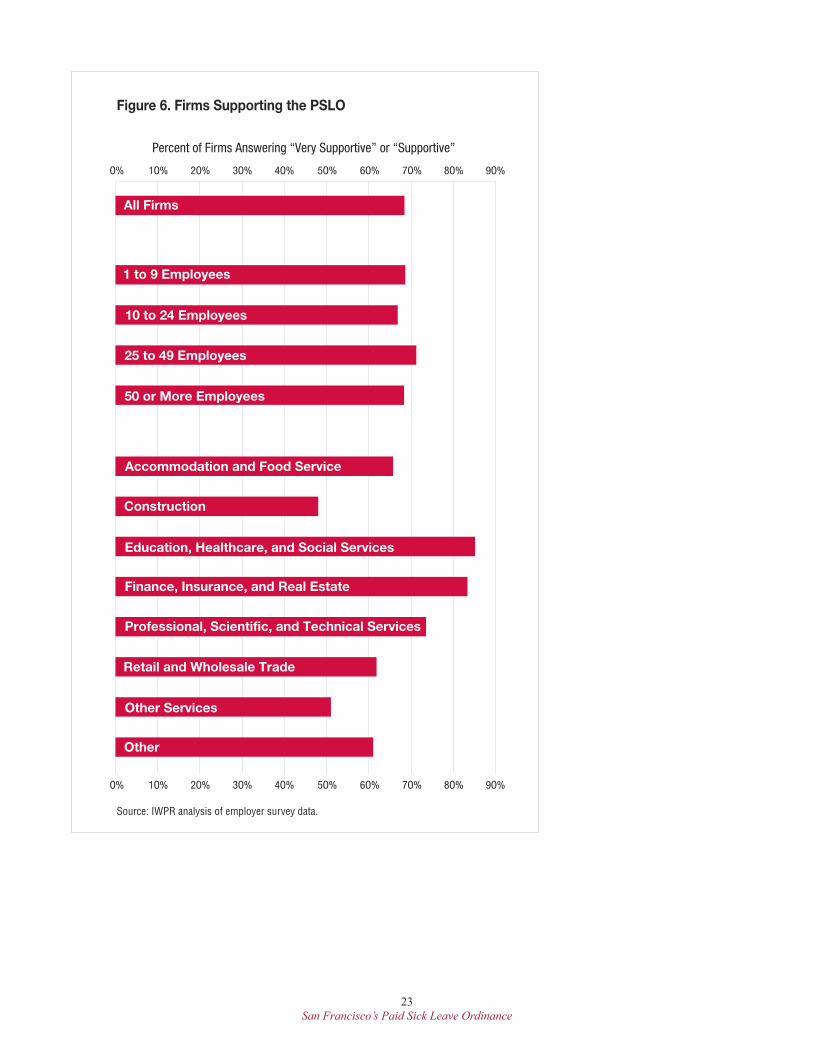
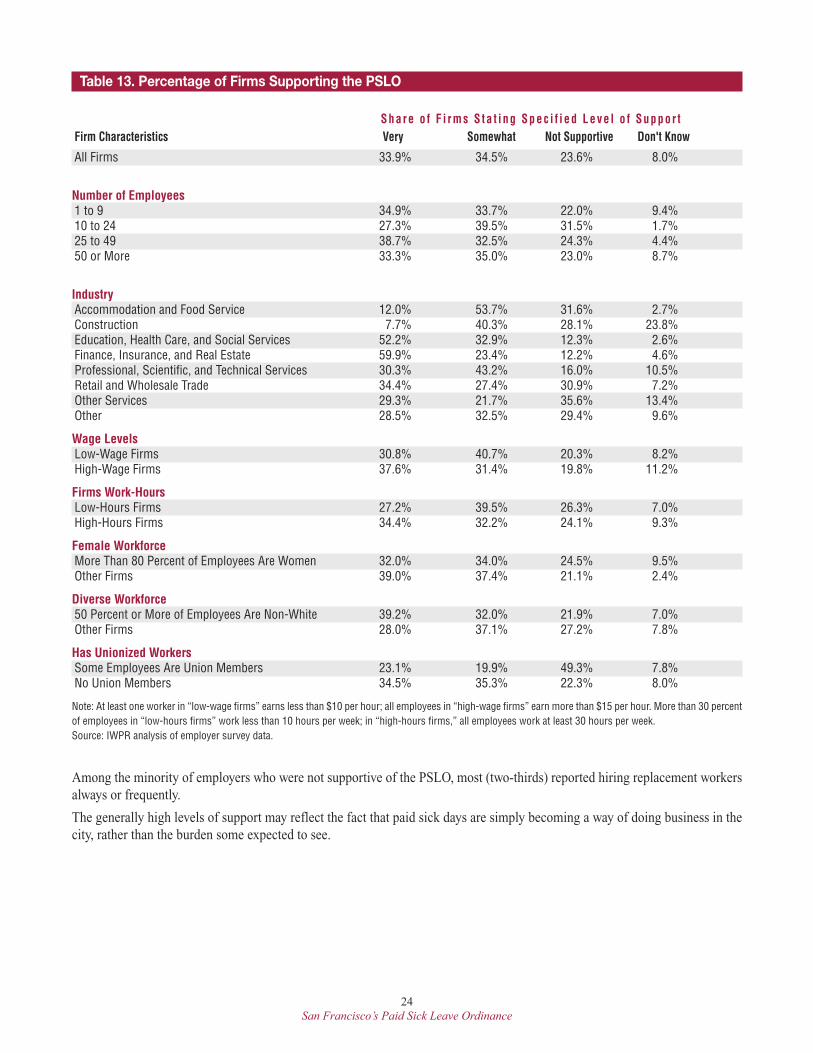
Two out of three firms were “supportive” or “very supportive” of the PSLO, of which one-third reported being “very supportive”(Figure 6 and Table 13). The same four industries where reported profitability issues emerged were also those with the lowestlevels of support for the PSLO—accommodation and food services, construction, retail and wholesale trade, and other services.However, even in these industries, more than 60 percent of employers in accommodation and food services and in retailand wholesale trade are supportive, whereas fewer than 30 percent of employers in the construction industry report notbeing supportive.41 Most employers supported the PSLO.
Table 12. Employer Changes to Compensation in Response to the PSLO
Converted ReducedDecreased Vacation to Raises or One or More of These Responses
Firm Characteristics Vacation Time PTO or PSD Bonuses Yes Don't Know No
All Firms 2.8% 7.1% 7.1% 12.8% 6.6% 80.6%
Number of Employees1 to 9 1.4% 5.0% 6.2% 10.1% 7.6% 82.3%10 to 24 8.8% 15.5% 11.7% 22.7% 4.2% 73.1%25 to 49 5.9% 11.8% 9.8% 21.5% 2.7% 75.9%50 or More 5.4% 11.6% 5.5% 17.7% 1.8% 80.6%
IndustryAccommodation and Food Service 5.1% 6.9% 10.0% 16.4% 20.7% 62.8%Construction 15.6% 19.8% 15.6% 34.5% 0.0% 65.5%Education, Health Care, and Social Services 0.4% 12.1% 20.6% 30.1% 2.3% 67.6%Finance, Insurance, and Real Estate 0.9% 5.1% 0.1% 6.0% 1.0% 92.9%Professional, Scientific, and Technical Services 1.5% 8.0% 4.3% 9.4% 1.8% 88.8%Retail and Wholesale Trade 1.0% 2.8% 1.2% 4.1% 5.9% 89.9%Other Services 2.4% 3.7% 11.1% 13.2% 18.7% 68.1%Other 6.3% 9.0% 7.8% 13.1% 3.4% 83.4%
Wage LevelsLow-Wage Firms 4.7% 4.3% 6.6% 11.4% 10.0% 78.7%High-Wage Firms 1.8% 8.0% 6.7% 13.1% 2.5% 84.4%
Firms Work-HoursLow-Hours Firms 2.2% 10.5% 8.1% 18.9% 12.7% 68.4%High-Hours Firms 3.2% 6.6% 9.2% 13.0% 3.4% 83.6%
Female WorkforceMore Than 80 Percent of Employees Are Women 3.7% 7.8% 6.9% 12.6% 7.9% 79.5%Other Firms 0.5% 5.3% 8.1% 13.7% 2.8% 83.5%
Diverse Workforce50 Percent or More of Employees Are Non-White 1.5% 5.9% 6.4% 10.6% 2.9% 86.6%Other Firms 5.4% 9.3% 9.2% 17.4% 12.0% 70.6%
Has Unionized WorkersSome Employees Are Union Members 3.8% 6.9% 8.2% 12.1% 3.2% 84.7%No Union Members 2.8% 7.1% 7.1% 12.8% 6.8% 80.4%
Note: At least one worker in “low-wage firms” earns less than $10 per hour; all employees in “high-wage firms” earn more than $15 per hour. More than 30percent of employees in “low-hours” firms work less than 10 hours per week; in “high-hours firms,” all employees work at least 30 hours per week. Source: IWPR analysis of employer survey data.
23
San Francisco’s Paid Sick Leave Ordinance
1 to 9 Employees
10 to 24 Employees
25 to 49 Employees
50 or More Employees
Accommodation and Food Service
Construction
Education, Healthcare, and Social Services
Finance, Insurance, and Real Estate
Professional, Scientific, and Technical Services
Retail and Wholesale Trade
Other
Other Services
Percent of Firms Answering “Very Supportive” or “Supportive”
O% 1O% 2O% 3O% 4O% 5O% 6O% 7O% 8O% 9O%
O% 1O% 2O% 3O% 4O% 5O% 6O% 7O% 8O% 9O%
All Firms
Figure 6. Firms Supporting the PSLO
Source: IWPR analysis of employer survey data.
24
San Francisco’s Paid Sick Leave Ordinance
Table 13. Percentage of Firms Supporting the PSLO
Sha re o f F i rms S ta t i ng Spec i f i ed Leve l o f Suppo r tFirm Characteristics Very Somewhat Not Supportive Don't Know
All Firms 33.9% 34.5% 23.6% 8.0%
Number of Employees1 to 9 34.9% 33.7% 22.0% 9.4%10 to 24 27.3% 39.5% 31.5% 1.7%25 to 49 38.7% 32.5% 24.3% 4.4%50 or More 33.3% 35.0% 23.0% 8.7%
IndustryAccommodation and Food Service 12.0% 53.7% 31.6% 2.7%Construction 7.7% 40.3% 28.1% 23.8%Education, Health Care, and Social Services 52.2% 32.9% 12.3% 2.6%Finance, Insurance, and Real Estate 59.9% 23.4% 12.2% 4.6%Professional, Scientific, and Technical Services 30.3% 43.2% 16.0% 10.5%Retail and Wholesale Trade 34.4% 27.4% 30.9% 7.2%Other Services 29.3% 21.7% 35.6% 13.4%Other 28.5% 32.5% 29.4% 9.6%
Wage LevelsLow-Wage Firms 30.8% 40.7% 20.3% 8.2%High-Wage Firms 37.6% 31.4% 19.8% 11.2%
Firms Work-HoursLow-Hours Firms 27.2% 39.5% 26.3% 7.0%High-Hours Firms 34.4% 32.2% 24.1% 9.3%
Female WorkforceMore Than 80 Percent of Employees Are Women 32.0% 34.0% 24.5% 9.5%Other Firms 39.0% 37.4% 21.1% 2.4%
Diverse Workforce50 Percent or More of Employees Are Non-White 39.2% 32.0% 21.9% 7.0%Other Firms 28.0% 37.1% 27.2% 7.8%
Has Unionized WorkersSome Employees Are Union Members 23.1% 19.9% 49.3% 7.8%No Union Members 34.5% 35.3% 22.3% 8.0%
Note: At least one worker in “low-wage firms” earns less than $10 per hour; all employees in “high-wage firms” earn more than $15 per hour. More than 30 percentof employees in “low-hours firms” work less than 10 hours per week; in “high-hours firms,” all employees work at least 30 hours per week. Source: IWPR analysis of employer survey data.
Among the minority of employers who were not supportive of the PSLO, most (two-thirds) reported hiring replacement workersalways or frequently.
The generally high levels of support may reflect the fact that paid sick days are simply becoming a way of doing business in thecity, rather than the burden some expected to see.
25
San Francisco’s Paid Sick Leave Ordinance
Conclusion: How Well Is the Paid Sick Leave Ordinance Working?
San Francisco’s Paid Sick Leave Ordinance expanded paid sick leave to thousands of employees, accord-ing to both employee and employer reports, although only one in six employers implemented a new paidsick days policy to comply with the ordinance.42 Most San Francisco employers reported that implement-ing the PSLO was not difficult and that it did not negatively affect their profitability. Half of San Franciscoworkers benefited directly from the PSLO in terms of their ability to use paid sick days—even thoughmore than one-third of workers said they did not use any paid sick days in the previous year. Thus, theevidence presented in this report suggests that the PSLO is functioning as intended to level the playingfield across employers and spread the benefits of paid sick days to employees who previously neededbut did not have paid sick days.
The PSLO created costs for a relatively small share of employers and employees. Only one in seven em-ployers reported adverse effects on profitability, and a similar proportion of employees reported fewerraises or bonuses or reductions in other benefits. In part, it appears that many employers offset potentialcosts by having co-workers fill in when others were absent, rather than hiring replacement workers. Ofcourse, these employers may ultimately benefit due to reductions in employee turnover, and by having ahealthier and more productive workforce.
The finding that so few employers were adversely affected contradicts speculation from employer groupsthat paid sick days policies would increase costs among employers who already had paid sick days systemsin place.43 The reason this speculation turned out to be unfounded is simple: employees in San Franciscouse fewer than half of the sick days available under the PSLO, and employers will never pay for many ofthese unused days. This finding is not surprising, given the way that workers earn paid time off under thePSLO. Employees can earn a maximum of up to five or nine paid sick days, and carry up to that manydays over from one year to the next. This structure gives employees an incentive to treat paid sick daysas a form of insurance, saving paid sick days in case they need the time for their own illness or that of afamily member. Many workers will end up not having to use any paid sick days in a given year.
Workers’ reports of their reasons for using paid sick days suggest that many employees make strategictrade-offs in taking this leave. For instance, workers with caregiving commitments, whether for childrenor other adults in need, tend to use paid sick days to care for others, not themselves. This underscores theimportance of the PSLO’s design, as compared to sick leave policies that can be used only for a worker’sown illness or injury.
Employer and worker reports suggest that some challenges remain in order to fully implement the PSLO;however, extending public and employer education about the law and employer compliance are para-mount. Although most employers appear to be in compliance with the requirements of the PSLO and aresupportive of the law, a significant minority of workers report that they still lack paid sick days (see Ap-pendix Table 1). And nearly one in five employers report that they do not offer paid sick days. Finally, itappears that many employers and workers are not familiar with the requirements of the PSLO, despitethe outreach conducted by several public agencies to familiarize employers and workers with the law.44
If there is a bottom line to San Francisco employer responses to the PSLO, it does not necessarily lie inperceptions of costs, benefits, or profitability, but in whether they support the law. Although most busi-nesses already provide paid sick days in the United States, employer organizations have often opposedmandates such as the PSLO.45 However, two-thirds of employers in the only city with experience with apaid sick days mandate for all workers are supportive of the policy.

27
San Francisco’s Paid Sick Leave Ordinance
Appendix A: Methodology for the Survey of Workers
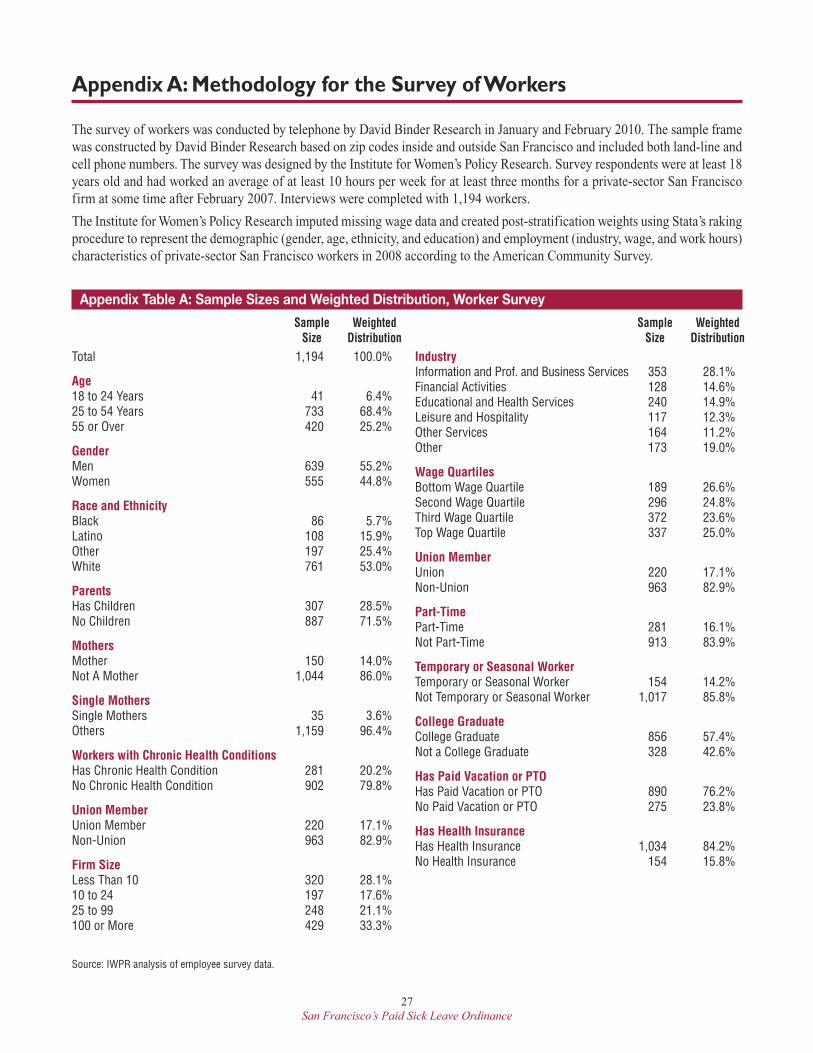
The survey of workers was conducted by telephone by David Binder Research in January and February 2010. The sample framewas constructed by David Binder Research based on zip codes inside and outside San Francisco and included both land-line andcell phone numbers. The survey was designed by the Institute for Women’s Policy Research. Survey respondents were at least 18years old and had worked an average of at least 10 hours per week for at least three months for a private-sector San Franciscofirm at some time after February 2007. Interviews were completed with 1,194 workers.
The Institute for Women’s Policy Research imputed missing wage data and created post-stratification weights using Stata’s rakingprocedure to represent the demographic (gender, age, ethnicity, and education) and employment (industry, wage, and work hours)characteristics of private-sector San Francisco workers in 2008 according to the American Community Survey.
Total 1,194 100.0%
Age18 to 24 Years 41 6.4%25 to 54 Years 733 68.4%55 or Over 420 25.2%
GenderMen 639 55.2%Women 555 44.8%
Race and EthnicityBlack 86 5.7%Latino 108 15.9%Other 197 25.4%White 761 53.0%
ParentsHas Children 307 28.5%No Children 887 71.5%
MothersMother 150 14.0%Not A Mother 1,044 86.0%
Single MothersSingle Mothers 35 3.6%Others 1,159 96.4%
Workers with Chronic Health ConditionsHas Chronic Health Condition 281 20.2%No Chronic Health Condition 902 79.8%
Union MemberUnion Member 220 17.1%Non-Union 963 82.9%
Firm SizeLess Than 10 320 28.1%10 to 24 197 17.6%25 to 99 248 21.1%100 or More 429 33.3%
IndustryInformation and Prof. and Business Services 353 28.1%Financial Activities 128 14.6%Educational and Health Services 240 14.9%Leisure and Hospitality 117 12.3%Other Services 164 11.2%Other 173 19.0%
Wage QuartilesBottom Wage Quartile 189 26.6%Second Wage Quartile 296 24.8%Third Wage Quartile 372 23.6%Top Wage Quartile 337 25.0%
Union MemberUnion 220 17.1%Non-Union 963 82.9%
Part-TimePart-Time 281 16.1%Not Part-Time 913 83.9%
Temporary or Seasonal WorkerTemporary or Seasonal Worker 154 14.2%Not Temporary or Seasonal Worker 1,017 85.8%
College GraduateCollege Graduate 856 57.4%Not a College Graduate 328 42.6%
Has Paid Vacation or PTOHas Paid Vacation or PTO 890 76.2%No Paid Vacation or PTO 275 23.8%
Has Health InsuranceHas Health Insurance 1,034 84.2%No Health Insurance 154 15.8%
Appendix Table A: Sample Sizes and Weighted Distribution, Worker Survey
Source: IWPR analysis of employee survey data.
Sample WeightedSize Distribution
Sample WeightedSize Distribution

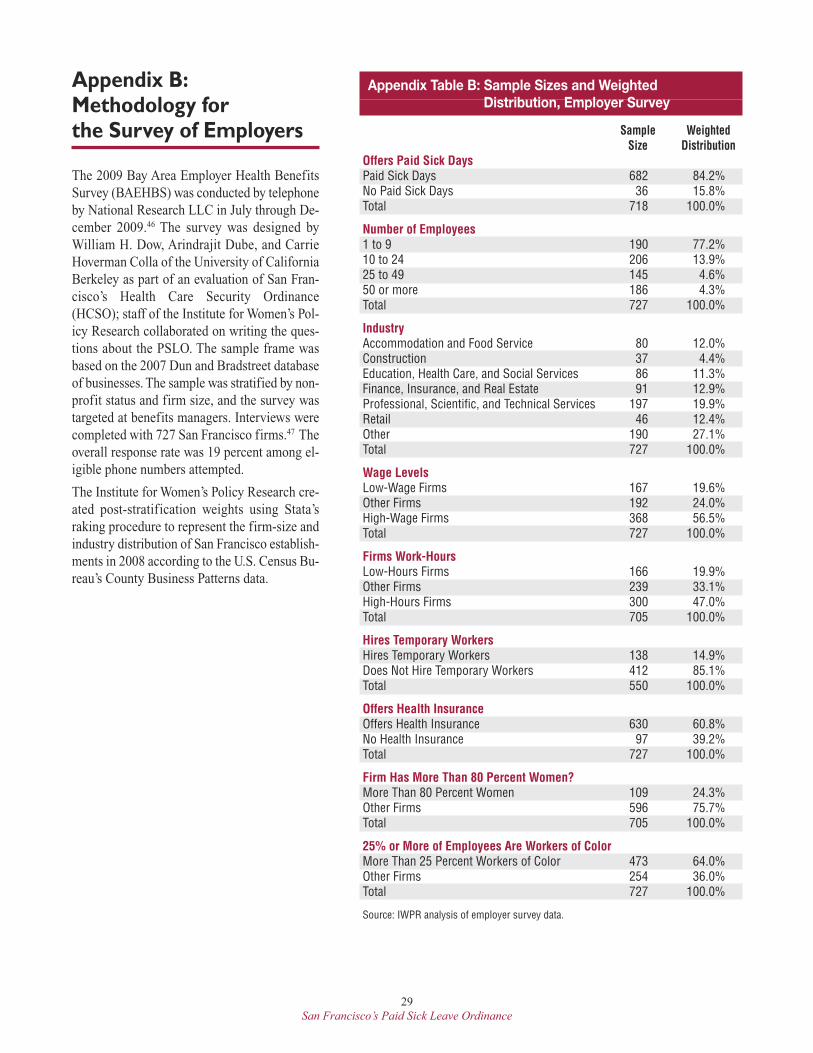
29
San Francisco’s Paid Sick Leave Ordinance
Appendix B: Methodology for the Survey of Employers
The 2009 Bay Area Employer Health BenefitsSurvey (BAEHBS) was conducted by telephoneby National Research LLC in July through De-cember 2009.46 The survey was designed byWilliam H. Dow, Arindrajit Dube, and CarrieHoverman Colla of the University of CaliforniaBerkeley as part of an evaluation of San Fran-cisco’s Health Care Security Ordinance(HCSO); staff of the Institute for Women’s Pol-icy Research collaborated on writing the ques-tions about the PSLO. The sample frame wasbased on the 2007 Dun and Bradstreet databaseof businesses. The sample was stratified by non-profit status and firm size, and the survey wastargeted at benefits managers. Interviews werecompleted with 727 San Francisco firms.47 Theoverall response rate was 19 percent among el-igible phone numbers attempted.
The Institute for Women’s Policy Research cre-ated post-stratification weights using Stata’sraking procedure to represent the firm-size andindustry distribution of San Francisco establish-ments in 2008 according to the U.S. Census Bu-reau’s County Business Patterns data.
Appendix Table B: Sample Sizes and Weighted Distribution, Employer Survey
Sample WeightedSize Distribution
Offers Paid Sick DaysPaid Sick Days 682 84.2%No Paid Sick Days 36 15.8%Total 718 100.0%
Number of Employees1 to 9 190 77.2%10 to 24 206 13.9%25 to 49 145 4.6%50 or more 186 4.3%Total 727 100.0%
IndustryAccommodation and Food Service 80 12.0%Construction 37 4.4%Education, Health Care, and Social Services 86 11.3%Finance, Insurance, and Real Estate 91 12.9%Professional, Scientific, and Technical Services 197 19.9%Retail 46 12.4%Other 190 27.1%Total 727 100.0%
Wage LevelsLow-Wage Firms 167 19.6%Other Firms 192 24.0%High-Wage Firms 368 56.5%Total 727 100.0%
Firms Work-HoursLow-Hours Firms 166 19.9%Other Firms 239 33.1%High-Hours Firms 300 47.0%Total 705 100.0%
Hires Temporary WorkersHires Temporary Workers 138 14.9%Does Not Hire Temporary Workers 412 85.1%Total 550 100.0%
Offers Health InsuranceOffers Health Insurance 630 60.8%No Health Insurance 97 39.2%Total 727 100.0%
Firm Has More Than 80 Percent Women?More Than 80 Percent Women 109 24.3%Other Firms 596 75.7%Total 705 100.0%
25% or More of Employees Are Workers of ColorMore Than 25 Percent Workers of Color 473 64.0%Other Firms 254 36.0%Total 727 100.0%
Source: IWPR analysis of employer survey data.
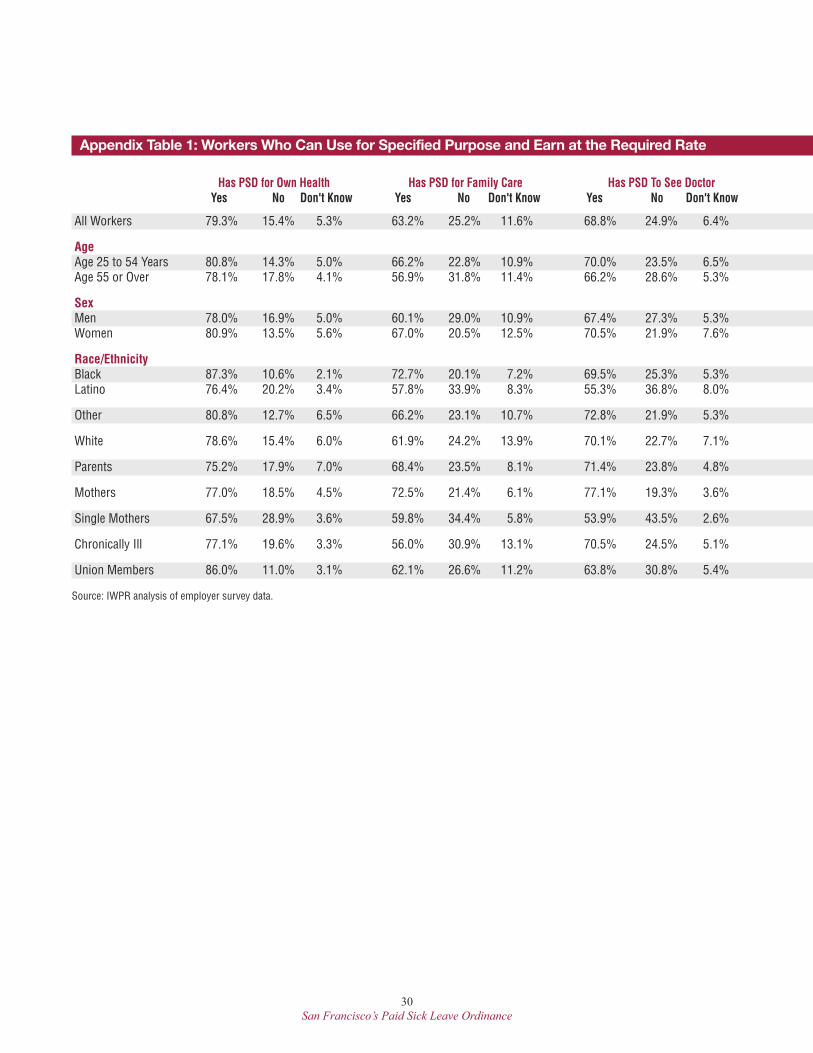
30
San Francisco’s Paid Sick Leave Ordinance
Appendix Table 1: Workers Who Can Use for Specified Purpose and Earn at the Required Rate
Has PSD for Own Health Has PSD for Family Care Has PSD To See Doctor Yes No Don't Know Yes No Don't Know Yes No Don't Know
All Workers 79.3% 15.4% 5.3% 63.2% 25.2% 11.6% 68.8% 24.9% 6.4%
AgeAge 25 to 54 Years 80.8% 14.3% 5.0% 66.2% 22.8% 10.9% 70.0% 23.5% 6.5% Age 55 or Over 78.1% 17.8% 4.1% 56.9% 31.8% 11.4% 66.2% 28.6% 5.3%
SexMen 78.0% 16.9% 5.0% 60.1% 29.0% 10.9% 67.4% 27.3% 5.3%Women 80.9% 13.5% 5.6% 67.0% 20.5% 12.5% 70.5% 21.9% 7.6%
Race/EthnicityBlack 87.3% 10.6% 2.1% 72.7% 20.1% 7.2% 69.5% 25.3% 5.3%Latino 76.4% 20.2% 3.4% 57.8% 33.9% 8.3% 55.3% 36.8% 8.0%
Other 80.8% 12.7% 6.5% 66.2% 23.1% 10.7% 72.8% 21.9% 5.3%
White 78.6% 15.4% 6.0% 61.9% 24.2% 13.9% 70.1% 22.7% 7.1%
Parents 75.2% 17.9% 7.0% 68.4% 23.5% 8.1% 71.4% 23.8% 4.8%
Mothers 77.0% 18.5% 4.5% 72.5% 21.4% 6.1% 77.1% 19.3% 3.6%
Single Mothers 67.5% 28.9% 3.6% 59.8% 34.4% 5.8% 53.9% 43.5% 2.6%
Chronically Ill 77.1% 19.6% 3.3% 56.0% 30.9% 13.1% 70.5% 24.5% 5.1%
Union Members 86.0% 11.0% 3.1% 62.1% 26.6% 11.2% 63.8% 30.8% 5.4%
Source: IWPR analysis of employer survey data.
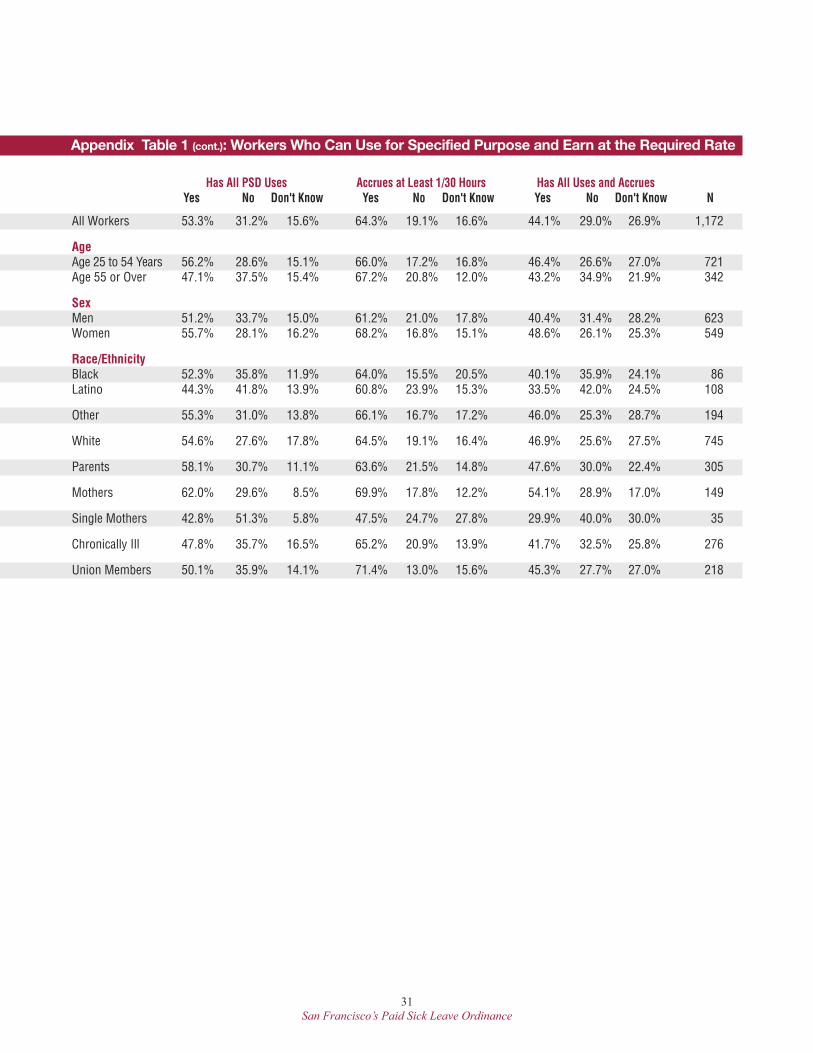
31
San Francisco’s Paid Sick Leave Ordinance
Appendix Table 1 (cont.): Workers Who Can Use for Specified Purpose and Earn at the Required Rate
Has All PSD Uses Accrues at Least 1/30 Hours Has All Uses and Accrues Yes No Don't Know Yes No Don't Know Yes No Don't Know N
All Workers 53.3% 31.2% 15.6% 64.3% 19.1% 16.6% 44.1% 29.0% 26.9% 1,172
Age Age 25 to 54 Years 56.2% 28.6% 15.1% 66.0% 17.2% 16.8% 46.4% 26.6% 27.0% 721 Age 55 or Over 47.1% 37.5% 15.4% 67.2% 20.8% 12.0% 43.2% 34.9% 21.9% 342
SexMen 51.2% 33.7% 15.0% 61.2% 21.0% 17.8% 40.4% 31.4% 28.2% 623Women 55.7% 28.1% 16.2% 68.2% 16.8% 15.1% 48.6% 26.1% 25.3% 549
Race/EthnicityBlack 52.3% 35.8% 11.9% 64.0% 15.5% 20.5% 40.1% 35.9% 24.1% 86Latino 44.3% 41.8% 13.9% 60.8% 23.9% 15.3% 33.5% 42.0% 24.5% 108
Other 55.3% 31.0% 13.8% 66.1% 16.7% 17.2% 46.0% 25.3% 28.7% 194
White 54.6% 27.6% 17.8% 64.5% 19.1% 16.4% 46.9% 25.6% 27.5% 745
Parents 58.1% 30.7% 11.1% 63.6% 21.5% 14.8% 47.6% 30.0% 22.4% 305
Mothers 62.0% 29.6% 8.5% 69.9% 17.8% 12.2% 54.1% 28.9% 17.0% 149
Single Mothers 42.8% 51.3% 5.8% 47.5% 24.7% 27.8% 29.9% 40.0% 30.0% 35
Chronically Ill 47.8% 35.7% 16.5% 65.2% 20.9% 13.9% 41.7% 32.5% 25.8% 276
Union Members 50.1% 35.9% 14.1% 71.4% 13.0% 15.6% 45.3% 27.7% 27.0% 218
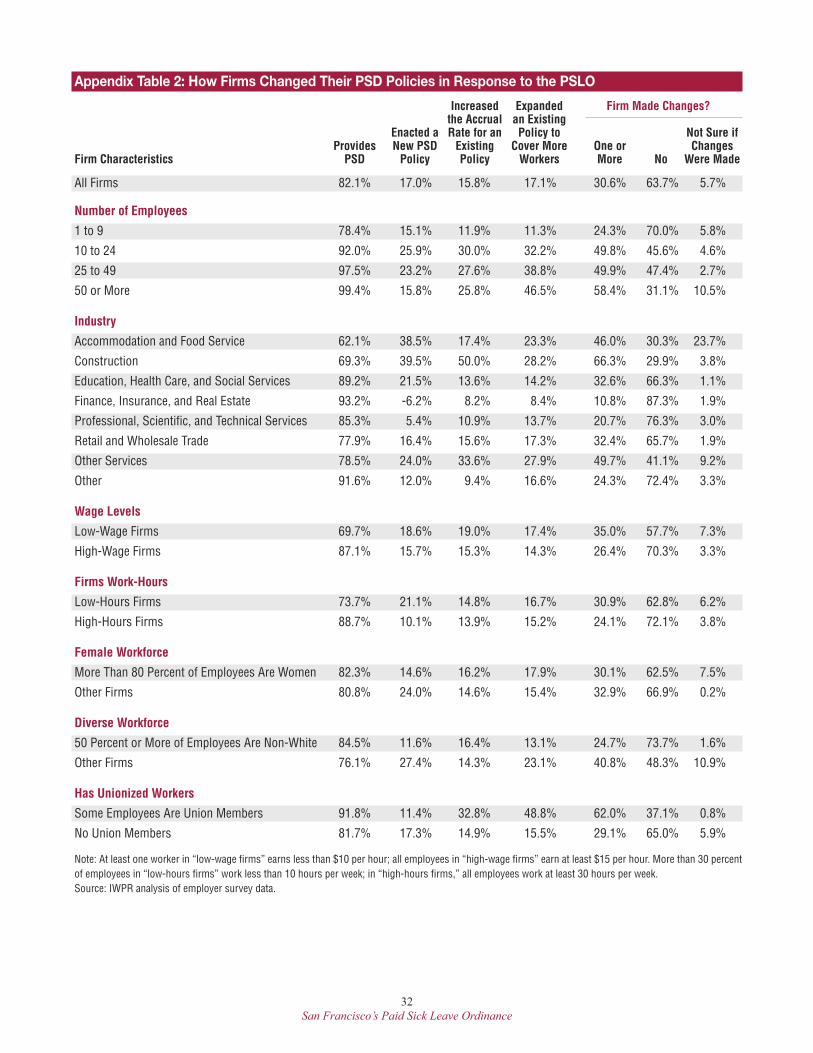
32
San Francisco’s Paid Sick Leave Ordinance
Appendix Table 2: How Firms Changed Their PSD Pol icies in Response to the PSLO
Increased Expanded Firm Made Changes?the Accrual an Existing
Enacted a Rate for an Policy to Not Sure ifProvides New PSD Existing Cover More One or Changes
Firm Characteristics PSD Policy Policy Workers More No Were Made
All Firms 82.1% 17.0% 15.8% 17.1% 30.6% 63.7% 5.7%
Number of Employees
1 to 9 78.4% 15.1% 11.9% 11.3% 24.3% 70.0% 5.8%
10 to 24 92.0% 25.9% 30.0% 32.2% 49.8% 45.6% 4.6%
25 to 49 97.5% 23.2% 27.6% 38.8% 49.9% 47.4% 2.7%
50 or More 99.4% 15.8% 25.8% 46.5% 58.4% 31.1% 10.5%
Industry
Accommodation and Food Service 62.1% 38.5% 17.4% 23.3% 46.0% 30.3% 23.7%
Construction 69.3% 39.5% 50.0% 28.2% 66.3% 29.9% 3.8%
Education, Health Care, and Social Services 89.2% 21.5% 13.6% 14.2% 32.6% 66.3% 1.1%
Finance, Insurance, and Real Estate 93.2% -6.2% 8.2% 8.4% 10.8% 87.3% 1.9%
Professional, Scientific, and Technical Services 85.3% 5.4% 10.9% 13.7% 20.7% 76.3% 3.0%
Retail and Wholesale Trade 77.9% 16.4% 15.6% 17.3% 32.4% 65.7% 1.9%
Other Services 78.5% 24.0% 33.6% 27.9% 49.7% 41.1% 9.2%
Other 91.6% 12.0% 9.4% 16.6% 24.3% 72.4% 3.3%
Wage Levels
Low-Wage Firms 69.7% 18.6% 19.0% 17.4% 35.0% 57.7% 7.3%
High-Wage Firms 87.1% 15.7% 15.3% 14.3% 26.4% 70.3% 3.3%
Firms Work-Hours
Low-Hours Firms 73.7% 21.1% 14.8% 16.7% 30.9% 62.8% 6.2%
High-Hours Firms 88.7% 10.1% 13.9% 15.2% 24.1% 72.1% 3.8%
Female Workforce
More Than 80 Percent of Employees Are Women 82.3% 14.6% 16.2% 17.9% 30.1% 62.5% 7.5%
Other Firms 80.8% 24.0% 14.6% 15.4% 32.9% 66.9% 0.2%
Diverse Workforce
50 Percent or More of Employees Are Non-White 84.5% 11.6% 16.4% 13.1% 24.7% 73.7% 1.6%
Other Firms 76.1% 27.4% 14.3% 23.1% 40.8% 48.3% 10.9%
Has Unionized Workers
Some Employees Are Union Members 91.8% 11.4% 32.8% 48.8% 62.0% 37.1% 0.8%
No Union Members 81.7% 17.3% 14.9% 15.5% 29.1% 65.0% 5.9%
Note: At least one worker in “low-wage firms” earns less than $10 per hour; all employees in “high-wage firms” earn at least $15 per hour. More than 30 percentof employees in “low-hours firms” work less than 10 hours per week; in “high-hours firms,” all employees work at least 30 hours per week. Source: IWPR analysis of employer survey data.
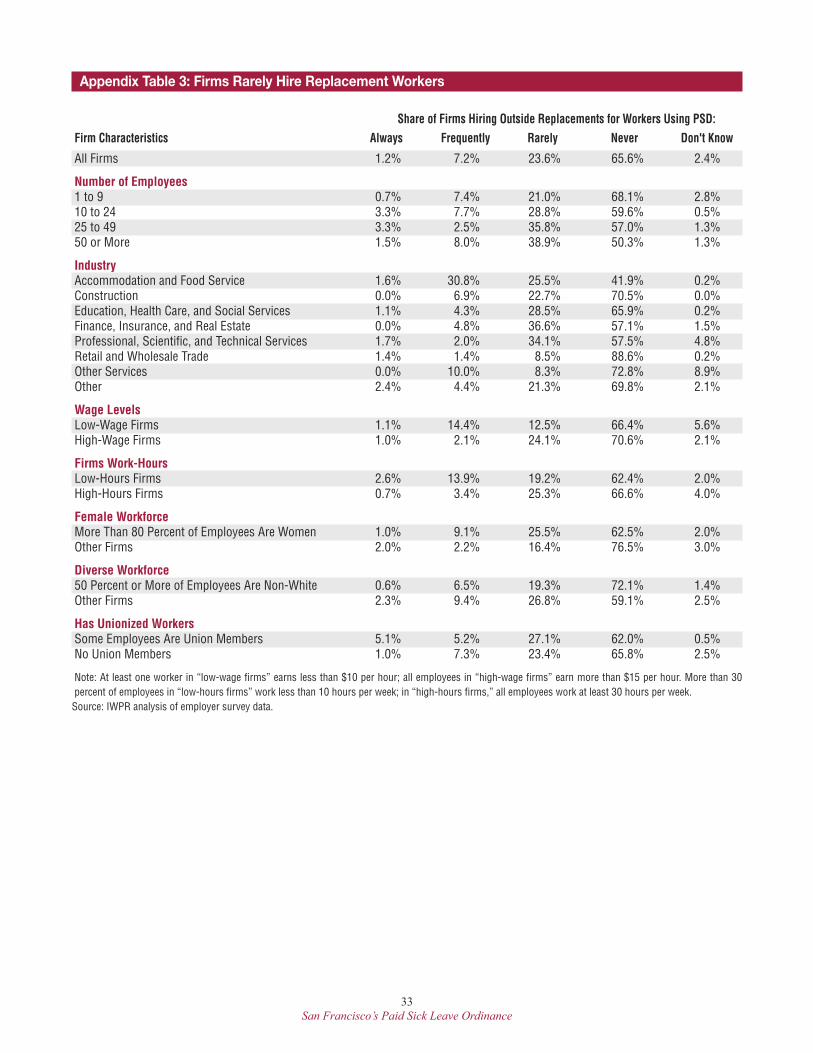
33
San Francisco’s Paid Sick Leave Ordinance
Appendix Table 3: Firms Rarely Hire Replacement Workers
Share of Firms Hiring Outside Replacements for Workers Using PSD:Firm Characteristics Always Frequently Rarely Never Don't Know
All Firms 1.2% 7.2% 23.6% 65.6% 2.4%
Number of Employees1 to 9 0.7% 7.4% 21.0% 68.1% 2.8%10 to 24 3.3% 7.7% 28.8% 59.6% 0.5%25 to 49 3.3% 2.5% 35.8% 57.0% 1.3%50 or More 1.5% 8.0% 38.9% 50.3% 1.3%
IndustryAccommodation and Food Service 1.6% 30.8% 25.5% 41.9% 0.2%Construction 0.0% 6.9% 22.7% 70.5% 0.0%Education, Health Care, and Social Services 1.1% 4.3% 28.5% 65.9% 0.2%Finance, Insurance, and Real Estate 0.0% 4.8% 36.6% 57.1% 1.5%Professional, Scientific, and Technical Services 1.7% 2.0% 34.1% 57.5% 4.8%Retail and Wholesale Trade 1.4% 1.4% 8.5% 88.6% 0.2%Other Services 0.0% 10.0% 8.3% 72.8% 8.9%Other 2.4% 4.4% 21.3% 69.8% 2.1%
Wage LevelsLow-Wage Firms 1.1% 14.4% 12.5% 66.4% 5.6%High-Wage Firms 1.0% 2.1% 24.1% 70.6% 2.1%
Firms Work-HoursLow-Hours Firms 2.6% 13.9% 19.2% 62.4% 2.0%High-Hours Firms 0.7% 3.4% 25.3% 66.6% 4.0%
Female WorkforceMore Than 80 Percent of Employees Are Women 1.0% 9.1% 25.5% 62.5% 2.0%Other Firms 2.0% 2.2% 16.4% 76.5% 3.0%
Diverse Workforce50 Percent or More of Employees Are Non-White 0.6% 6.5% 19.3% 72.1% 1.4%Other Firms 2.3% 9.4% 26.8% 59.1% 2.5%
Has Unionized WorkersSome Employees Are Union Members 5.1% 5.2% 27.1% 62.0% 0.5%No Union Members 1.0% 7.3% 23.4% 65.8% 2.5%
Note: At least one worker in “low-wage firms” earns less than $10 per hour; all employees in “high-wage firms” earn more than $15 per hour. More than 30percent of employees in “low-hours firms” work less than 10 hours per week; in “high-hours firms,” all employees work at least 30 hours per week. Source: IWPR analysis of employer survey data.
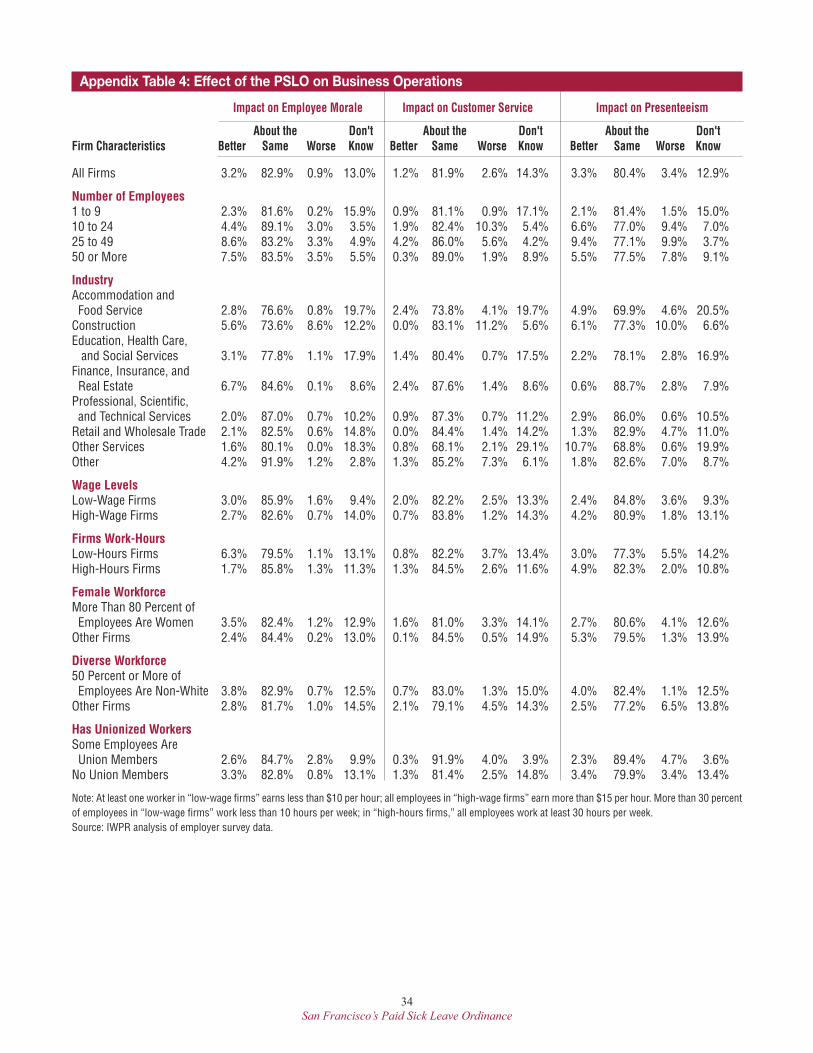
34
San Francisco’s Paid Sick Leave Ordinance
Appendix Table 4: Effect of the PSLO on Business Operations
Impact on Employee Morale Impact on Customer Service Impact on Presenteeism
About the Don't About the Don't About the Don'tFirm Characteristics Better Same Worse Know Better Same Worse Know Better Same Worse Know
All Firms 3.2% 82.9% 0.9% 13.0% 1.2% 81.9% 2.6% 14.3% 3.3% 80.4% 3.4% 12.9%
Number of Employees1 to 9 2.3% 81.6% 0.2% 15.9% 0.9% 81.1% 0.9% 17.1% 2.1% 81.4% 1.5% 15.0%10 to 24 4.4% 89.1% 3.0% 3.5% 1.9% 82.4% 10.3% 5.4% 6.6% 77.0% 9.4% 7.0%25 to 49 8.6% 83.2% 3.3% 4.9% 4.2% 86.0% 5.6% 4.2% 9.4% 77.1% 9.9% 3.7%50 or More 7.5% 83.5% 3.5% 5.5% 0.3% 89.0% 1.9% 8.9% 5.5% 77.5% 7.8% 9.1%
IndustryAccommodation and Food Service 2.8% 76.6% 0.8% 19.7% 2.4% 73.8% 4.1% 19.7% 4.9% 69.9% 4.6% 20.5%Construction 5.6% 73.6% 8.6% 12.2% 0.0% 83.1% 11.2% 5.6% 6.1% 77.3% 10.0% 6.6%Education, Health Care,and Social Services 3.1% 77.8% 1.1% 17.9% 1.4% 80.4% 0.7% 17.5% 2.2% 78.1% 2.8% 16.9%
Finance, Insurance, and Real Estate 6.7% 84.6% 0.1% 8.6% 2.4% 87.6% 1.4% 8.6% 0.6% 88.7% 2.8% 7.9%Professional, Scientific, and Technical Services 2.0% 87.0% 0.7% 10.2% 0.9% 87.3% 0.7% 11.2% 2.9% 86.0% 0.6% 10.5%Retail and Wholesale Trade 2.1% 82.5% 0.6% 14.8% 0.0% 84.4% 1.4% 14.2% 1.3% 82.9% 4.7% 11.0%Other Services 1.6% 80.1% 0.0% 18.3% 0.8% 68.1% 2.1% 29.1% 10.7% 68.8% 0.6% 19.9%Other 4.2% 91.9% 1.2% 2.8% 1.3% 85.2% 7.3% 6.1% 1.8% 82.6% 7.0% 8.7%
Wage LevelsLow-Wage Firms 3.0% 85.9% 1.6% 9.4% 2.0% 82.2% 2.5% 13.3% 2.4% 84.8% 3.6% 9.3%High-Wage Firms 2.7% 82.6% 0.7% 14.0% 0.7% 83.8% 1.2% 14.3% 4.2% 80.9% 1.8% 13.1%
Firms Work-HoursLow-Hours Firms 6.3% 79.5% 1.1% 13.1% 0.8% 82.2% 3.7% 13.4% 3.0% 77.3% 5.5% 14.2%High-Hours Firms 1.7% 85.8% 1.3% 11.3% 1.3% 84.5% 2.6% 11.6% 4.9% 82.3% 2.0% 10.8%
Female WorkforceMore Than 80 Percent of Employees Are Women 3.5% 82.4% 1.2% 12.9% 1.6% 81.0% 3.3% 14.1% 2.7% 80.6% 4.1% 12.6%Other Firms 2.4% 84.4% 0.2% 13.0% 0.1% 84.5% 0.5% 14.9% 5.3% 79.5% 1.3% 13.9%
Diverse Workforce50 Percent or More of Employees Are Non-White 3.8% 82.9% 0.7% 12.5% 0.7% 83.0% 1.3% 15.0% 4.0% 82.4% 1.1% 12.5%Other Firms 2.8% 81.7% 1.0% 14.5% 2.1% 79.1% 4.5% 14.3% 2.5% 77.2% 6.5% 13.8%
Has Unionized WorkersSome Employees Are Union Members 2.6% 84.7% 2.8% 9.9% 0.3% 91.9% 4.0% 3.9% 2.3% 89.4% 4.7% 3.6%No Union Members 3.3% 82.8% 0.8% 13.1% 1.3% 81.4% 2.5% 14.8% 3.4% 79.9% 3.4% 13.4%
Note: At least one worker in “low-wage firms” earns less than $10 per hour; all employees in “high-wage firms” earn more than $15 per hour. More than 30 percentof employees in “low-wage firms” work less than 10 hours per week; in “high-hours firms,” all employees work at least 30 hours per week. Source: IWPR analysis of employer survey data.
35
San Francisco’s Paid Sick Leave Ordinance
NOTES1 National Partnership for Women & Families. “Current Paid Sick Days Laws.” <http://www.nationalpartnership.org/site/Page-Server?page-name=psd_campaigns >. (modified July 2010).
2 Employees who perform work in the City/County of San Francisco are covered by the PSLO beginning 90 calendar days after the date ofhire, regardless of where their employer or usual workplace is located. Note that federal, state, and city/county government workers in SanFrancisco had paid sick days before the PSLO was adopted.
3 San Francisco Administrative Code Chapter 12W. 4 DeBare, Ilana. 2008. “S.F. Sick Leave Law Celebrates 1 Year,” The San Francisco Chronicle, February 6. Interviews with 26 employers inMarch 2008 found that “most employers were able to implement [the PSLO] with minimal impacts on their business in the first year.” Wa-ters Boots, Shelley, Karin Martinson, and Anna Danziger. 2009. Employers’ Perspectives on San Francisco’s Paid Sick Leave Policy.Washington, DC: The Urban Institute, 12.
5 Grinyer, Anne and Vicky Singleton. 2000. “Sickness Absence as Risk-Taking Behavior: A Study of Organizational and Cultural Factors inthe Public Sector,” Health, Risk & Society 2 (March):14.
6 Grinyer, Anne and Vicky Singleton. 2000. “Sickness Absence as Risk-Taking Behavior: A Study of Organizational and Cultural Factors inthe Public Sector,” Health, Risk & Society 2 (March):8.
7 Li, Jiehui, Guthrie S. Birkhead, David S. Strogatz, and R. Bruce Coles. 1996. “Impact of Institution Size, Staffing Patterns, and Infection Con-trol Practices on Communicable Disease Outbreaks in New York State Nursing Homes.” American Journal of Epidemiology 143 (May): 1047.
8 NPR, Kaiser Family Foundation, and the Harvard School of Public Health. 2008. Health Care and the Economy in Two Swing States: ALook at Ohio and Florida. Menlo Park, CA: Kaiser Family Foundation, 4.
9 Centers for Disease Control and Prevention. 2010. “Benefits of Health Promotion Programs.” <http://www.cdc.gov/workplacehealthpro-motion/businesscase/benefits/index.html> (accessed March 11, 2010).
10 Heymann, S. Jody, Alison Earle, and Brian Egleston.1996. “Parental Availability for the Care of Sick Children.” Pediatrics 98 (August):229.11 Heymann, S. Jody. 2000. The Widening Gap: Why America’s Working Families Are in Jeopardy and What Can Be Done About It. NewYork: Basic Books, 59.
12 Clemans-Cope, Lisa, Cynthia D. Perry, Genevieve M. Kenney, Jennifer E. Pelletier, and Matthew S. Pantell. 2008. “Access to and Use ofPaid Sick Leave Among Low-Income Families with Children.” Pediatrics 122 (August):e484.
13 Although wages could not be reduced below the legal minimum.14 Phillips, Bruce D. 2008. AB2716, The CA Healthy Workplaces Act of 2008: Economic and Small Business Effects. Nashville, TN: NFIBResearch Foundation (June).
15 CCH. 2007. “CCH Survey Finds Most Employees Call in “Sick” for Reasons Other Than Illness; Poor Morale Adds Up to Even MoreNo-Shows.” <http://hr.cch.com/press/releases/20071010h.asp> (accessed January 26, 2011).
16 Smith, Sandy. 2004. “Vast Majority of Employees Work While Sick.” EHSToday. <http://ehstoday.com/news/ehs_imp_36898/> (accessedJanuary 26, 2011).
17 Drago, Robert and Kevin Miller. 2010. Sick at Work: Infected Employees in the Workplace During the H1N1 Pandemic. IWPR Publication#B264. Washington, DC: Institute for Women’s Policy Research.
18 Harter, James K., Frank L. Schmidt, and Theodore L. Hayes. 2002. “Business-Unit-Level Relationship Between Employee Satisfaction,Employee Engagement, and Business Outcomes: A Meta-Analysis.” Journal of Applied Psychology 87(2): 273; Artz, Benjamin. 2010.“Fringe Benefits and Job Satisfaction.” International Journal of Manpower 31(6): 626-27.
19 Mercer. 2008. The Total Financial Impact of Employee Absences: Survey Highlights. New York: Kronos, 6. <http://www.kronos.com/ab-senceanonymous/media/mercer-survey-highlights.pdf> (accessed January 22, 2011).
20 Cooper, Philip F. and Alan C. Monheit. 1993. “Does Employment-Related Health Insurance Inhibit Job Mobility?” Inquiry 30 (Win-ter):409; Earle, Alison, John Z. Ayanian, and Jody Heymann. 2006. “Work Resumption After Newly Diagnosed Coronary Heart Disease:Findings on the Importance of Paid Leave.” Journal of Women’s Health 15(4): 436.
21 Phillips, J. Douglas. 1990. “The Price Tag on Turnover.” Personnel Journal 69 (December): 58.22 Heymann, S. Jody, Alison Earle, and Brian Egleston. 1996. “Parental Availability for the Care of Sick Children,” Pediatrics 98 (August):229.23 ”Chronic health conditions” are conditions like heart disease, asthma, or diabetes that require continuous treatment, are not curable, and maylast for a lifetime.
24 The PSLO provides that workers accrue leave at the rate of one hour of leave for every 30 hours worked, to a maximum of five days forworkers in firms with fewer than 10 employees and nine days for workers in larger firms. If a worker uses some of that accrued time, ac-crual begins again, with the same caps on the amount that can be accrued. San Francisco Office of Labor Standards Enforcement. 2007.San Francisco Paid Sick Leave Ordinance, Administrative Code Chapter 12W, Frequently Asked Questions (September 28), 5–6. An indi-vidual working 40 hours a week throughout the year would accrue just under nine days (40 hours per week x 52 weeks per year, dividedby 30 hours worked per paid sick days earned, equals 8.7 days). Workers use a median of three paid sick days per year regardless of estab-lishment size. We estimate that 28 percent of workers are in small establishments where they earn an average of five days (leaving twodays unused), while the remaining 72 percent of workers earn nine days (leaving six days unused). Weighting unused days by the relevantproportions of workers yields an average of 4.9 unused days each year, compared with three days used.
36
San Francisco’s Paid Sick Leave Ordinance
25 Institute for Women’s Policy Research. 2010. Analysis of data from the 2008 National Health Interview Survey.26 Older workers are nearly twice as likely to have a chronic health condition (30.5 percent do) as prime-working-age workers (17.4 per-cent), but other research shows that older workers are less likely to have acute illnesses, injuries, or accidents than younger workers. Edel-stein, Barry A., Ronald R. Martin, and Lesley P. Koven. 2003. “Psychological Assessment in Geriatric Settings,” in Handbook ofPsychology, Volume 10: Assessment Psychology, ed. John R. Graham, Jack A. Naglieri, and Irving B. Weiner. Hoboken, NJ: John Wiley &Sons, Inc., 390. These facts may explain why older workers were more likely than younger workers to report not using any PSD, but, atthe same time, to report using more days, if they did take PSD.
27 For example, single parents and low-income families are associated with low rates of job tenure. See Holzer, Harry J. and Karin Martin-son. 2005. Can We Improve Job Retention and Advancement Among Low-Income Working Parents? Washington, DC: The Urban Institute, 3.
28 Survey respondents were asked to report a reason for every leave they took, so the percentages taking different types of leave sum to morethan 100 percent.
29 These visits could have been for either the respondent or a family member.30 The PSLO does not mandate paid leave for these uses, but they may have been authorized by the policies for these particular workers. Forinstance, paid sick days may be provided under a general paid time off or PTO plan, and some employers may allow their workers to usepaid sick days for vacation time.
31 Some parents may try not to use PSD for themselves, saving their paid time off for when their children will need care.32 To some extent, workers in San Francisco had that flexibility before the PSLO was passed. Under a California law passed before thePSLO, employers are required to allow workers to use up to half of their accrued sick leave to care for sick family members. Labor Proj-ect for Working Families. 2008. Use of Sick Leave for Family Care/Kin Care (March). <http://www.working-families.org/learnmore/paid-familyleave/e_sick.pdf> (accessed January 4, 2011).
33 Preventive care has been found to be associated with fewer employee days of unplanned absences, lower productivity loss due to presen-teeism, and higher returns to shareholders. See National Business Group on Health and Towers Watson. 2010. 2009/2010 Staying@WorkReport: The Health and Productivity Advantage. New York: Watson Wyatt Worldwide.
34 Data in this section are for workers who had the same employer before and after the PSLO went into effect.35 Labor Project for Working Families. May 10, 2008. “Working Moms Speak Out for Paid Sick Days.” Press Release. <http://www.paid-sickdaysca.org/media/press/press_release5_08.pdf> (accessed January 25, 2011).
36 Close to half (45.9 percent) of workers who interacted with the public were employed in the education or leisure and hospitality industries.In contrast, workers without public contact were primarily employed in the information and financial activities industries (59.7 percent).
37 Perhaps this result is explained by employees who are reliant upon customers’ tips needing that income, and so come to work while sick.38 Low-wage workers were those in the bottom wage quartile, who earned less than $15 per hour (2010 dollars). There were 118,000 low-wage workers in San Francisco in 2009.
39 This estimate assumes that all employers starting new PSD policies provided PSD to all their employees. It does not reflect the effect ofemployers extending their existing PSD policies to cover more workers.
40 Among the two-thirds of hospitality firms that actually provided paid sick days, just 3.6 percent reported hiring replacements “fre-quently” or “always” for workers using sick leave, implying that employers who had not implemented the PSLO were those hiring re-placement workers most frequently.
41 Note that many employers in the construction industry (just under one-quarter) reported “don’t know” in terms of support, whereas 51.0percent of employers in the other services industry were supportive of the PSLO.
42 17.9 percent of employers said that they did not have a paid sick days policy at the time of the survey, 18 months after the ordinance wentinto effect.
43 Partnership for New York City. 2010. Impact of Paid Sick Leave on NYC Businesses: A Survey of New York City Employers (September), 6.44 For example, the San Francisco Office of Labor Standards Enforcement (OLSE) conducted a public rulemaking process for the PSLO;the OLSE and San Francisco’s Mayor’s Office of Economic and Workforce Development distributed informational brochures and em-ployee fact sheets to employers and advertised the PSLO in local newspapers and in bus shelters; the OLSE and the San Francisco De-partment of Public Health and the OLSE worked with community-based organizations to educate workers about the PSLO. New YorkCity Council Committee on Civil Service and Labor. 2009. Transcript of the Minutes of the Committee on Civil Service and Labor: Provi-sion of Paid Sick Time Earned by Employees (November 17), 4.
45 For example, a study conducted by the Partnership for New York City was anything but supportive of a proposed New York City law thatwas similar to the PSLO, and the Society for Human Resource Management has opposed similar legislation at the national level. SeePartnership for New York City. 2010. Impact of Paid Sick Leave on NYC Businesses: A Survey of New York City Employers (September);and Society for Human Resource Management. 2009. SHRM to Seek Alternative to Healthy Families Act to Encourage Paid Leave (May18). <http://www.shrm.org/about/pressroom/PressReleases/Pages/AlternativetoHealthyFamiliesAct.aspx> (accessed January 1, 2011).
46 For more information about the BAEHBS, see Dow, William H., Arindrajit Dube, and Carrie Hoverman Colla. 2010. 2009 Bay Area Em-ployer Health Benefits Survey: Health Benefits Report 2009. Berkeley: University of California, Berkeley School of Public Health (May).
47 In addition, 283 non-San Francisco firms completed surveys.
IWPR ProgramAdvisory Committee
Barbara BergmannAmerican University
Nancy Duff CampbellNational Women’s Law Center
Joe CordesThe George Washington University
Nikki DaruwalaAmerican Rights at Work
Cynthia DeitchThe George Washington University
David FasenfestWayne State University
Sarah GotbaumSCG Associates
Caren GrownAmerican University
Cindy HallWomen’s Policy Inc.
Cynthia HarrisonThe George Washington University
Rufina HernandezNational Education Association
Catherine HillAmerican Association of University Women
Lisalyn JacobsLegal Momentum
Joan KurianskyWider Opportunities for Women
Sara MeléndezSavage/Meléndez & Associates LLC
Christine OwensNational Employment Law Project
Elena SilvaEducation Sector
Deborah WeinsteinCoalition on Human Needs
Nancy ZirkinLeadership Conference on Civil and Human Rights
Become a Member(Benefits vary according to membership level)
Student: $35� Quarterly newsletter, fact sheets, and Research-In-Briefs� 50% discount off an annual subscription to the Journal of Women, Politics & Policy*� 20% discount on IWPR publications� Special IWPR conference rate
Friend: $75Regular subscription to the IWPR Information Network
� Quarterly newsletter, fact sheets, and Research-In-Briefs� 50% discount off an annual subscription to the Journal of Women, Politics & Policy*� 20% discount on IWPR publications� 20% discount on one registration for an IWPR conference
Sustainer: $175Enhanced subscription to the IWPR Information Network
� Research News Reporter Online� Quarterly newsletter, fact sheets, and Research-In-Briefs� 50% discount off an annual subscription to the Journal of Women, Politics & Policy*� 20% discount on IWPR publications � 20% discount on one registration for an IWPR conference
Partner: $250Comprehensive subscription to the IWPR Information Network
� Complimentary copies of all IWPR major reports� Research News Reporter Online� Quarterly newsletter, fact sheets, and Research-In-Briefs� 50% discount off an annual subscription to the Journal of Women, Politics & Policy*� 20% discount on IWPR publications� 20% discount on one registration for an IWPR conference
Affiliate: $350Organizational subscription to the IWPR Information Network($200 for nonprofits with operating budgets under $500,000)
� Complimentary copies of all IWPR major reports� Research News Reporter Online� Quarterly newsletter, fact sheets, and Research-In-Briefs� 50% discount off an annual subscription to the Journal of Women, Politics & Policy*� 20% discount on IWPR publications� 20% discount on three registrations for an IWPR conference
Corporate Affiliate: $1,000Corporate subscription to the IWPR Information Network($500 for corporations with revenue under $1 million)
� Complimentary copies of all IWPR major reports� Research News Reporter Online� Quarterly newsletter, fact sheets, and Research-In-Briefs� 50% discount off an annual subscription to the Journal of Women, Politics & Policy*� 20% discount on IWPR publications� 20% discount on five registrations for an IWPR conference
Eleanor Roosevelt Policy CouncilMembers of IWPR’s premier giving circle receive a comprehensivesubscription, special acknowledgement in select IWPR publications, a 50%discount off an annual subscription to the Journal of Women, Politics & Policy,*and exclusive invitations to IWPR events across the country.
� Community Council, $500-$999� Institute Council, $1,000-$2,499� Leadership Council, $2,500-$4,999� President’s Council, $5,000 and up
For more information contact Membership Services.
The Institute for Women’s Policy Research is a 501(c)(3) charitableorganization. Donations and membership fees are tax-deductible to the extent allowed by law.
Printed on recycled paper usingvegetable-based inks and 100% wind power.

1200 18th Street NW, Suite 301Washington, DC 20036
202/785-5100 • 202/833.4362 faxiwpr.org