Embed Size (px)
Citation preview
Institute for Atmospheric ScienceSCHOOL OF EARTH AND ENVIRONMENT
Comparison of Measurements from the SCOUT-O3 Darwin and AMMA Campaigns with a 3-D Chemical
Transport Model
Wuhu Feng and Martyn Chipperfield
ACTIVE/SCOUT-O3/TWP-ICE/AMMA meeting, 9-11 January, Manchester
Acknowledgments: SCOUT-O3, H.Boenisch, C. Hoyle, B.M. Sinnhuber
OUTLINE
• Brief dscription of SLIMCAT/TOMCAT 3D CTM• Tracer Transport Experiment
- SCOUT WP 6.2• ‘Full chemistry’ TOMCAT runs
- SCOUT-O3- AMMA
• Conclusions
SLIMCAT/TOMCAT 3D CTM
Off-line chemical transport model with many different options.
Key points here:
• Extends to surface using hybrid - (SLIMCAT), -p (TOMCAT).
• Variable horizontal/vertical resolution.
• Horizontal winds and temperatures from (ECMWF) analyses.
• Vertical motion from diagnosed heating rates (SLIMCAT) or divergence (TOMCAT).
• Tropospheric physics: Tiedtke convection,
PBL: 2 Schemes: Louis / Holtslag and Boville
• Option of detailed tropospheric chemistry:
http://www.see.leeds.ac.uk/slimcat
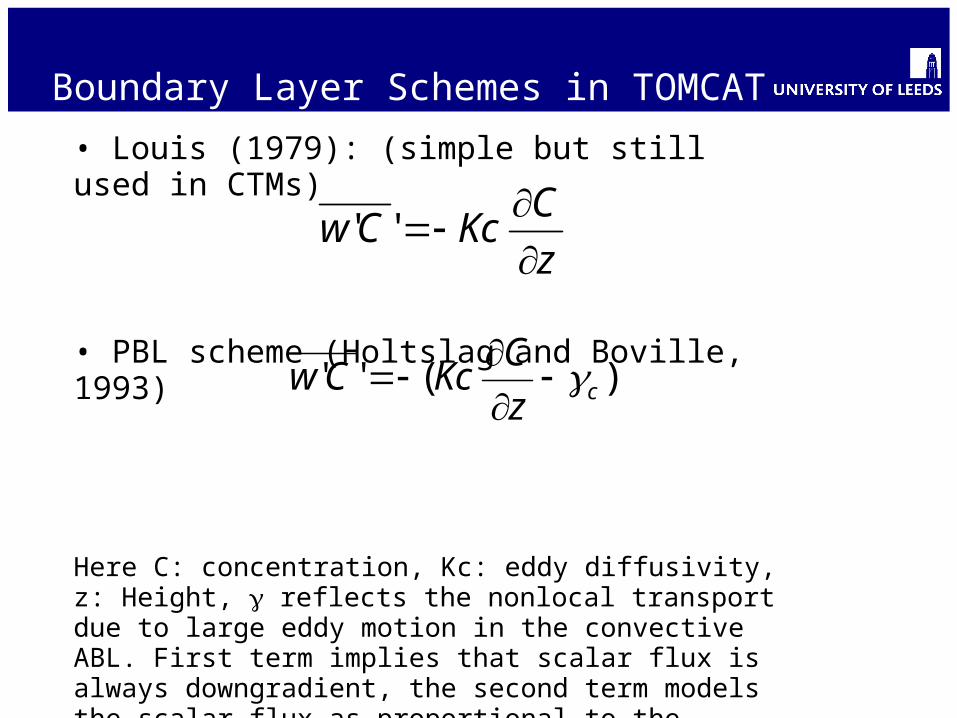
• Louis (1979): (simple but still used in CTMs)
• PBL scheme (Holtslag and Boville, 1993)
Here C: concentration, Kc: eddy diffusivity, z: Height, reflects the nonlocal transport due to large eddy motion in the convective ABL. First term implies that scalar flux is always downgradient, the second term models the scalar flux as proportional to the strength of chemical flux of C from the surface
More information in Wang et al. (1999)
Boundary Layer Schemes in TOMCAT
z
CKcCw
''
)('' cz
CKcCw
SCOUT WP6.2: Idealised Tracer Experiments
SCOUT WP 6.2 is examining how well various CTMs capture transport to and within the TTL. The SCOUT CTMs are running idealised tracers, such as surface-emitted species with fixed lifetimes, to allow a direct comparison between the models.
More information: Chris Hoyle’s talk on Tuesday.
Tracers include:
• Tracers T5 (with 5 day lifetime) and T20 (20 day lifetime).• Idealised CO (prescribed OH loss and fixed surface mixing ratio).
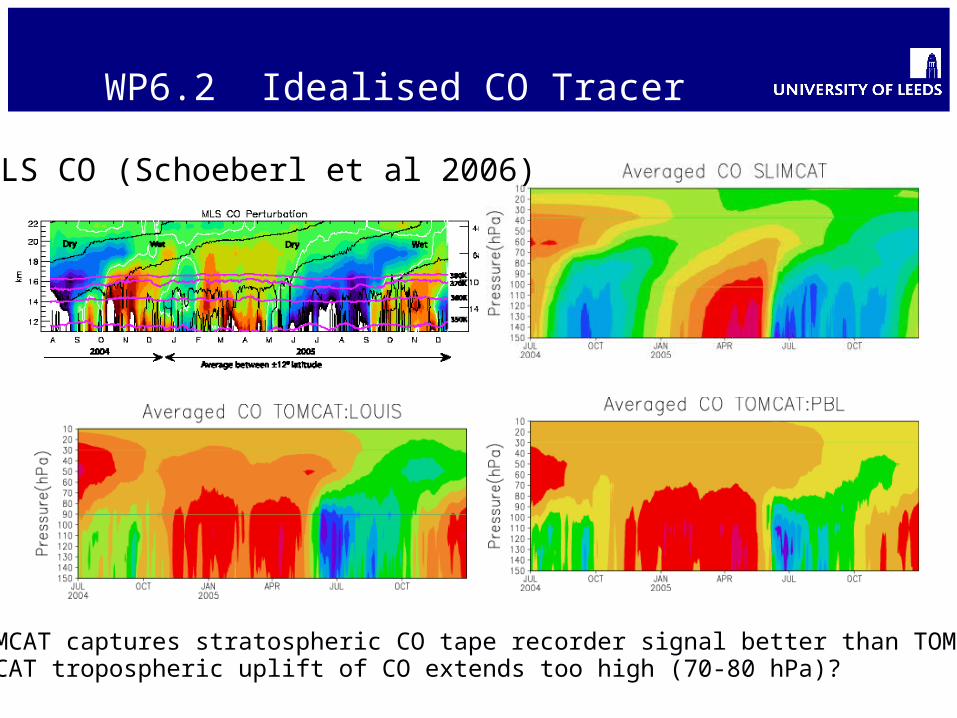
WP6.2 Idealised CO Tracer
MLS CO (Schoeberl et al 2006)
SLIMCAT captures stratospheric CO tape recorder signal better than TOMCAT TOMCAT tropospheric uplift of CO extends too high (70-80 hPa)?
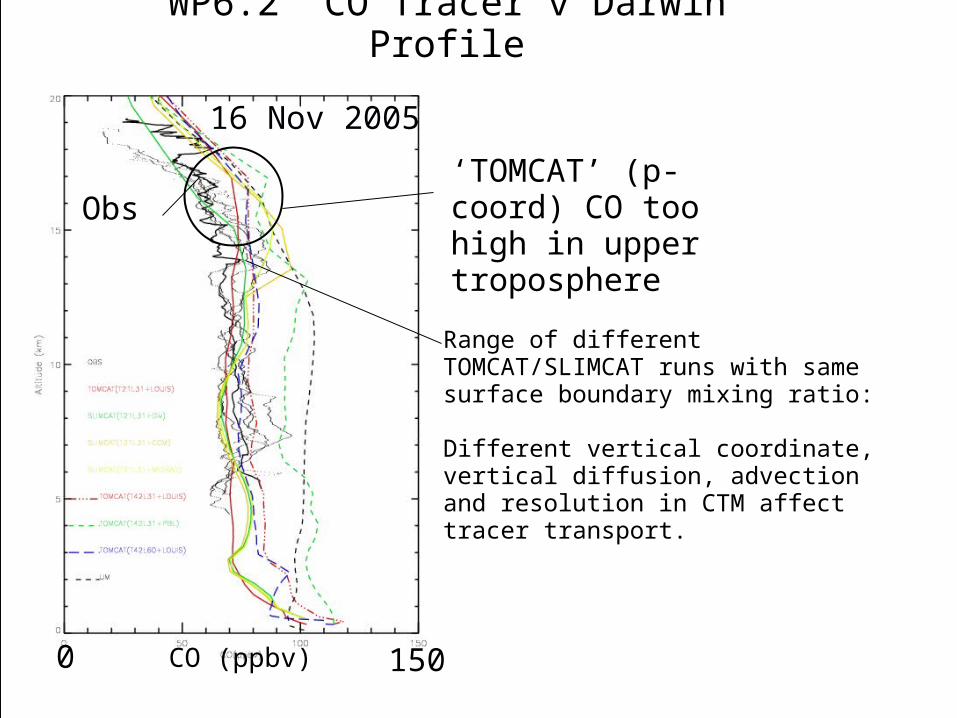
WP6.2 CO Tracer v Darwin Profile
Range of different TOMCAT/SLIMCAT runs with same surface boundary mixing ratio:
Different vertical coordinate, vertical diffusion, advection and resolution in CTM affect tracer transport.
16 Nov 2005
CO (ppbv) 1500
Obs‘TOMCAT’ (p-coord) CO too high in upper troposphere
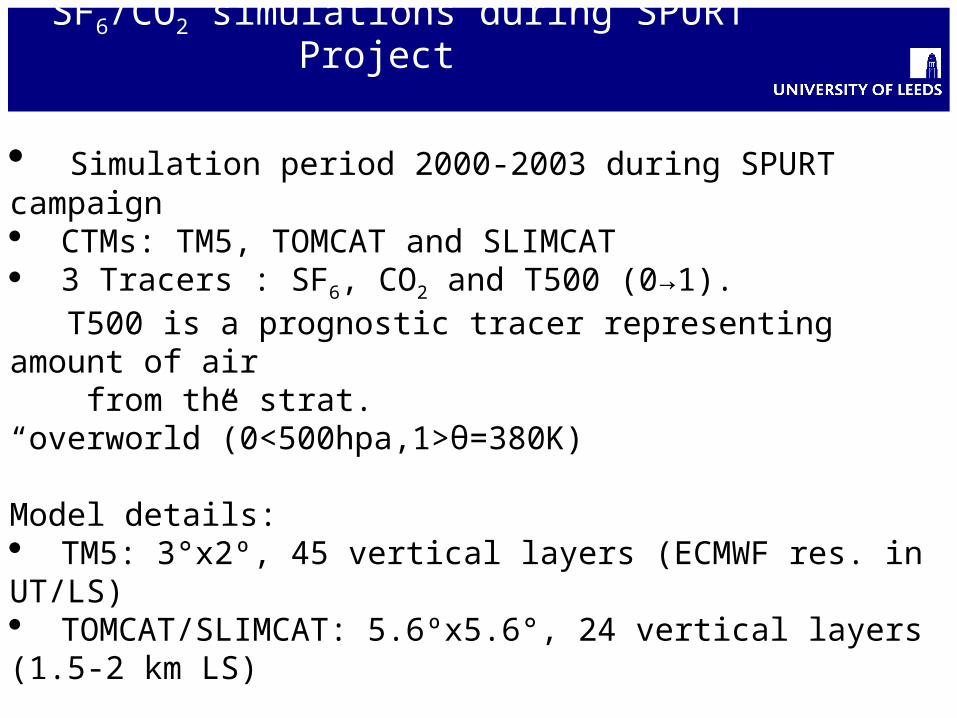
SF6/CO2 simulations during SPURT Project
Simulation period 2000-2003 during SPURT campaign CTMs: TM5, TOMCAT and SLIMCAT 3 Tracers : SF6, CO2 and T500 (0→1). T500 is a prognostic tracer representing amount of air from the strat. “overworld”(0<500hpa,1>θ=380K)
Model details: TM5: 3°x2º, 45 vertical layers (ECMWF res. in UT/LS) TOMCAT/SLIMCAT: 5.6ºx5.6°, 24 vertical layers (1.5-2 km LS)
Comparisons in Bönisch et al., submitted, JGR.
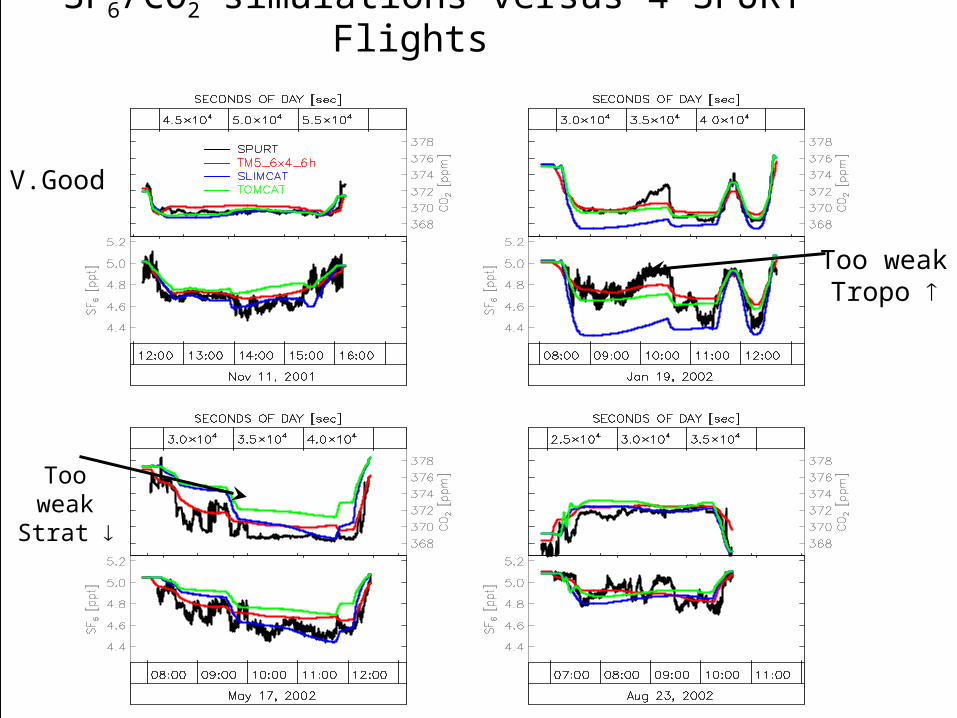
SF6/CO2 simulations versus 4 SPURT Flights
Too weakStrat
Too weakTropo
V.Good
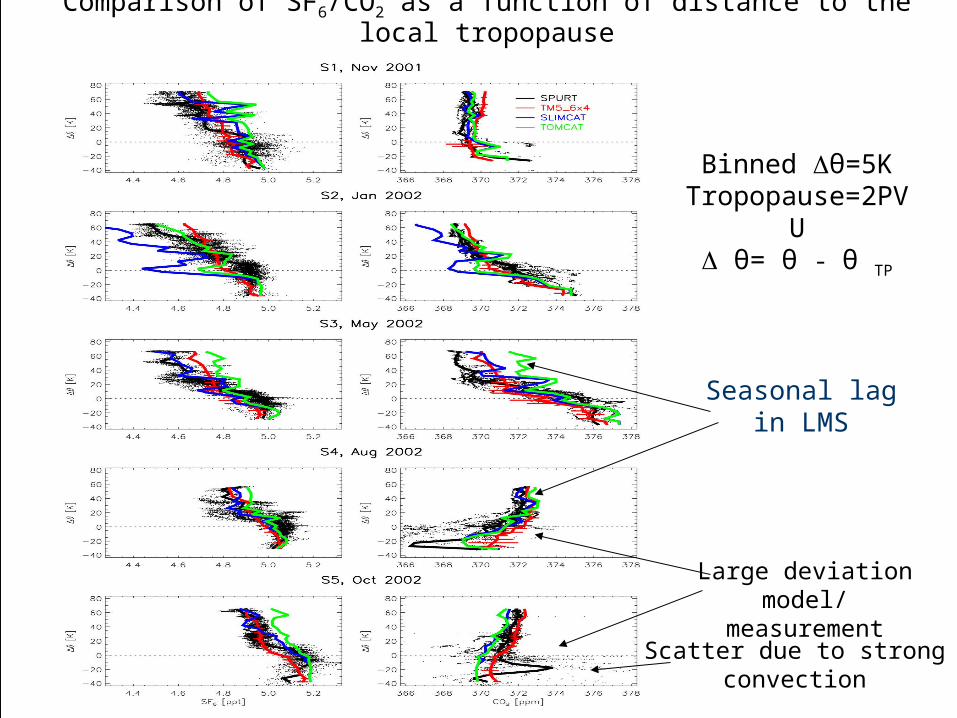
Comparison of SF6/CO2 as a function of distance to the local tropopause
Binned θ=5KTropopause=2PVU
θ= θ - θ TP
Seasonal lagin LMS
Large deviationmodel/measurement
Scatter due to strongconvection
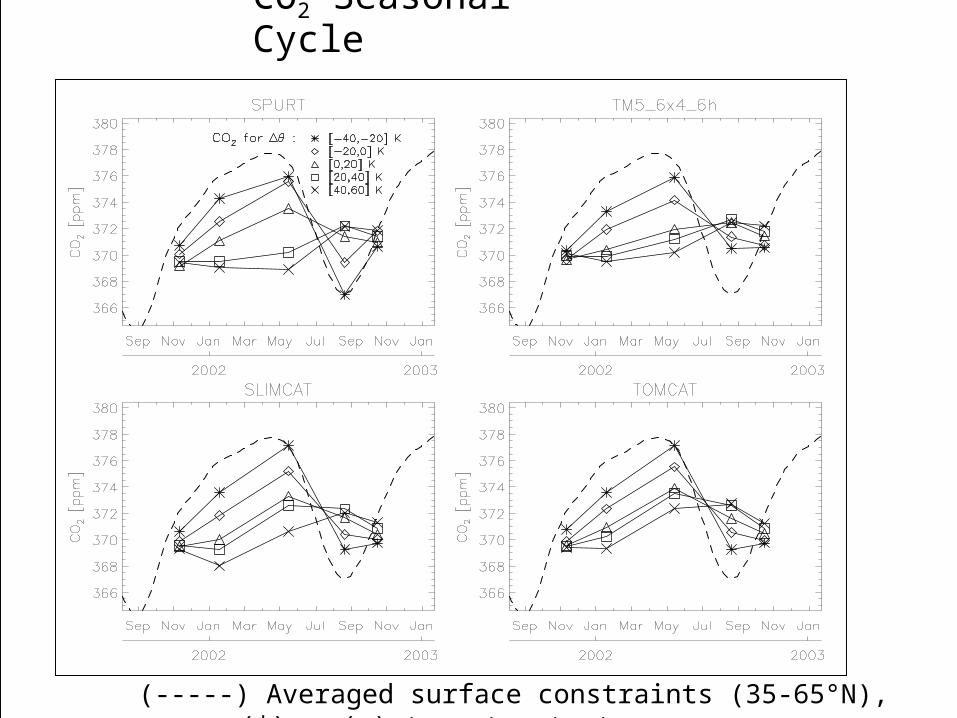
CO2 Seasonal Cycle
(-----) Averaged surface constraints (35-65°N), (*) (x) trop to strat.
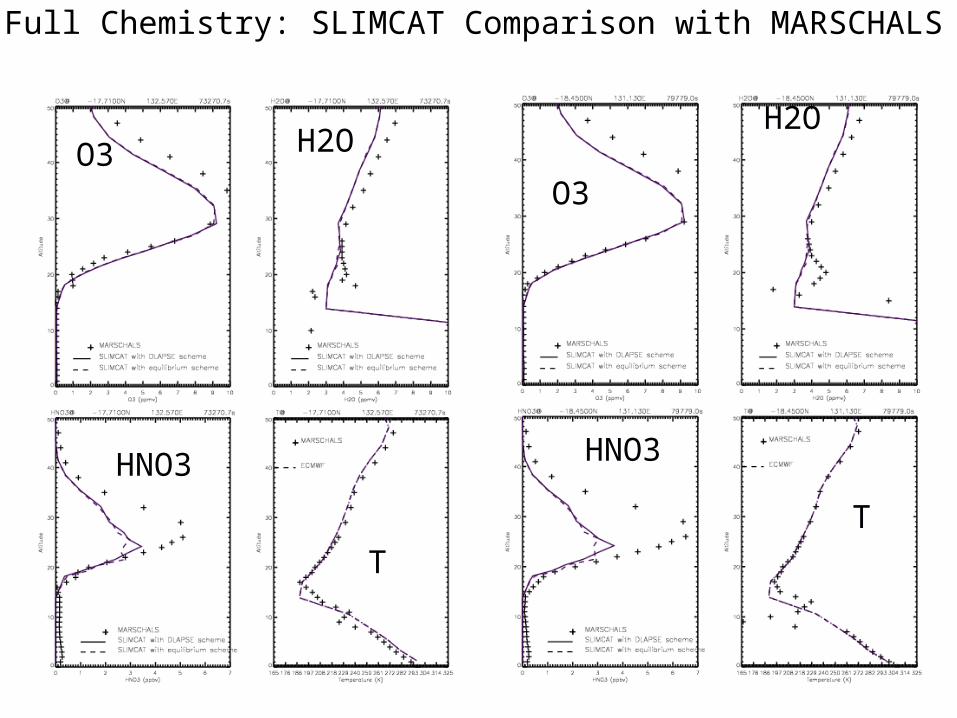
O3O3 H2O
H2O
HNO3
T
T
HNO3
Full Chemistry: SLIMCAT Comparison with MARSCHALS
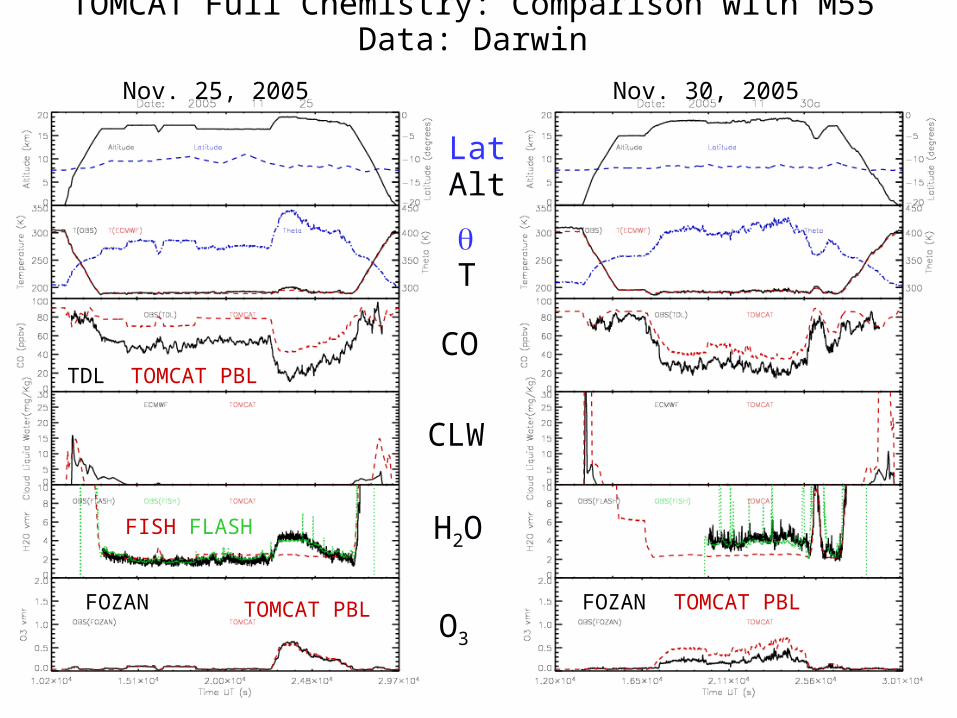
TOMCAT Full Chemistry: Comparison with M55 Data: Darwin
H2O
O3
CLW
CO
T
LatAlt
Nov. 25, 2005 Nov. 30, 2005
FOZAN
FISH FLASH
TDL TOMCAT PBL
TOMCAT PBLTOMCAT PBL FOZAN
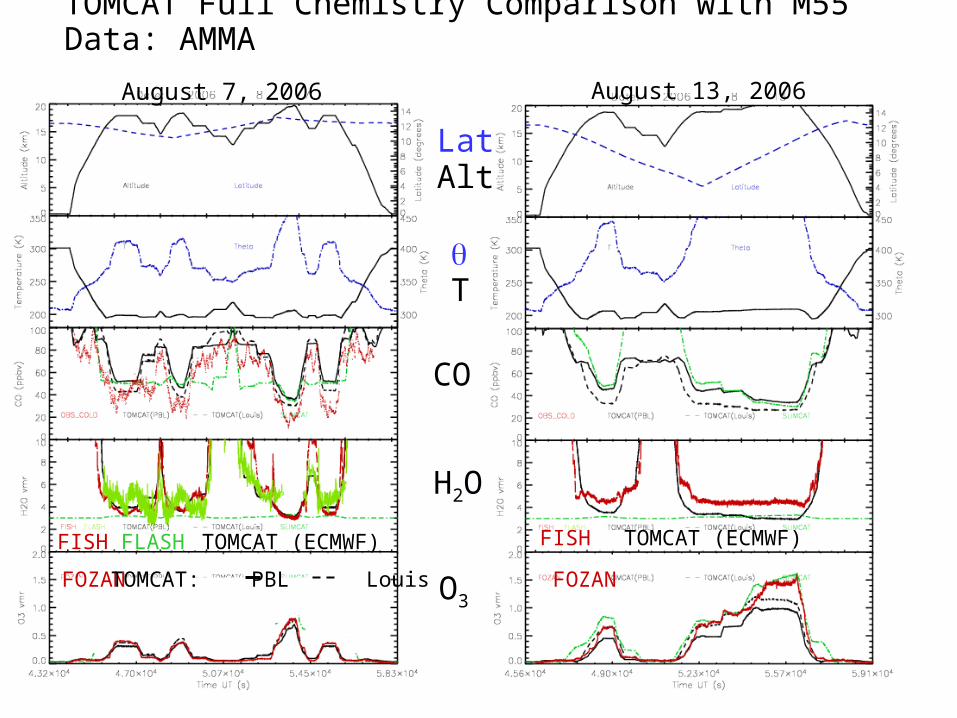
TOMCAT Full Chemistry Comparison with M55 Data: AMMA
O3
H2O
CO
T
LatAlt
August 7, 2006 August 13, 2006
FISH FLASH TOMCAT (ECMWF) TOMCAT (ECMWF)FISH
FOZAN TOMCAT: PBL Louis FOZAN
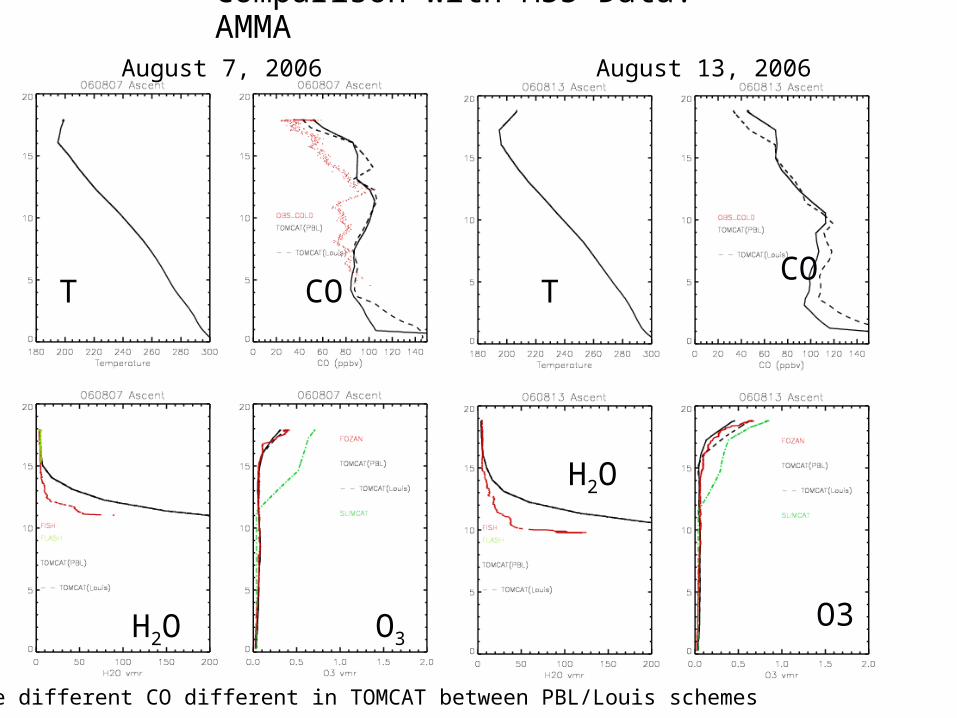
COCOT T
H2O
O3O3H2O
Comparison with M55 Data: AMMA
Large different CO different in TOMCAT between PBL/Louis schemes
August 7, 2006 August 13, 2006
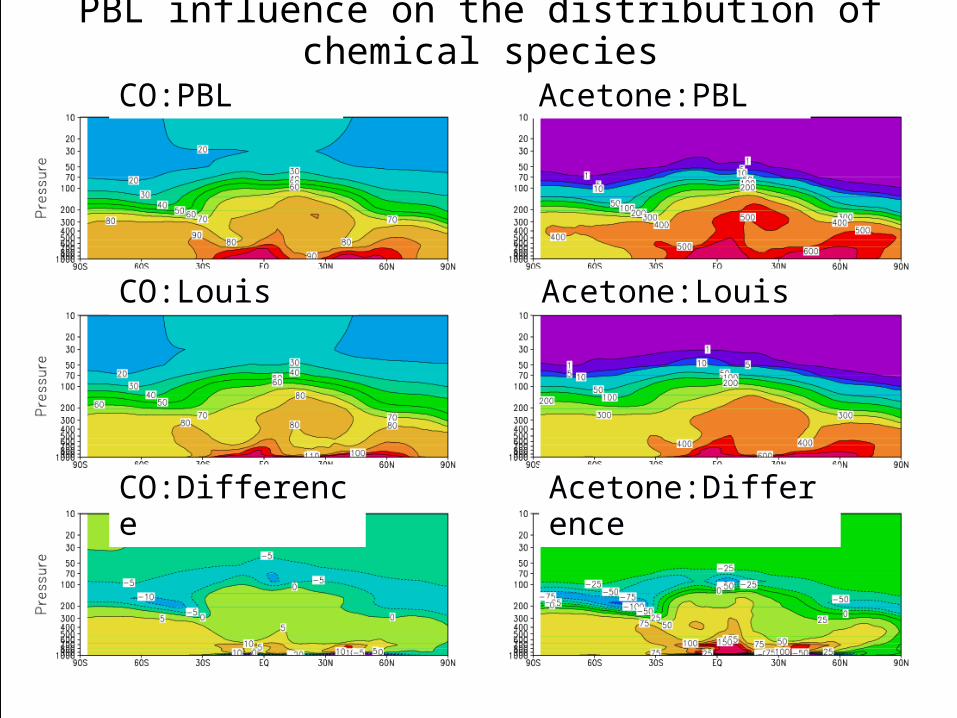
PBL influence on the distribution of chemical speciesCO:PBL
CO:Louis
CO:Difference
Acetone:PBL
Acetone:Louis
Acetone:Difference
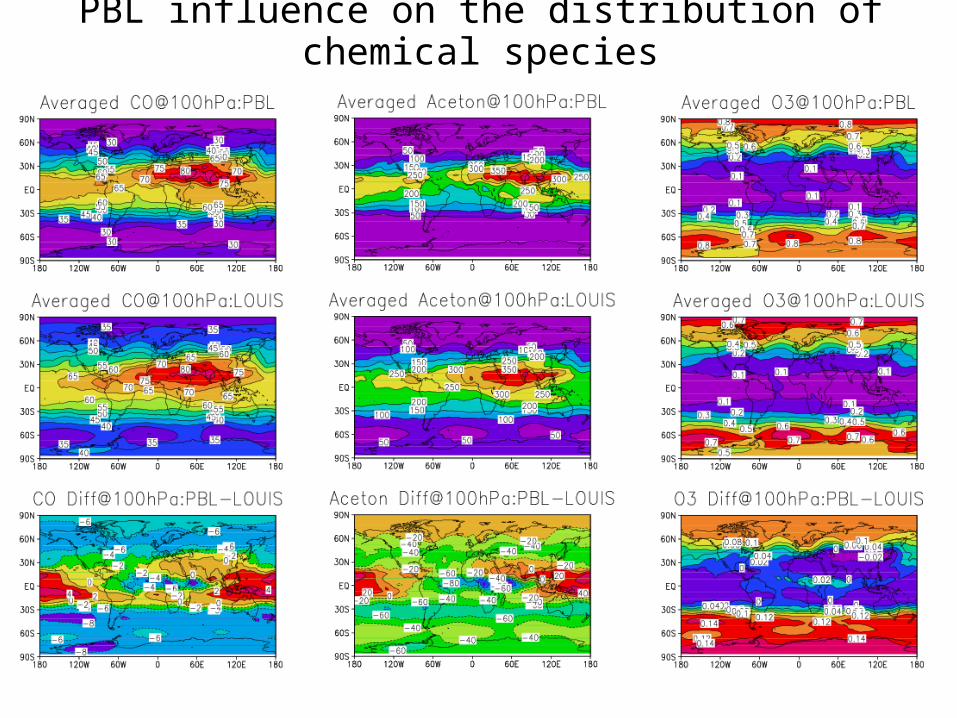
PBL influence on the distribution of chemical species
Conclusions
• SLIMCAT () has more realistic diagnosed stratospheric CO tape recorder than TOMCAT (p) confirming it gives better representation of stratospheric tracer transport than TOMCAT.
• Different vertical coordinate, vertical diffusion, advection and resolution in same CTM all affect tracer transport process (to different extents). (Bear in mind for model-model comparisons).
• Basic TOMCAT tropospheric model overestimates vertical transport to top of TTL (CO profiles).
Extra Slides
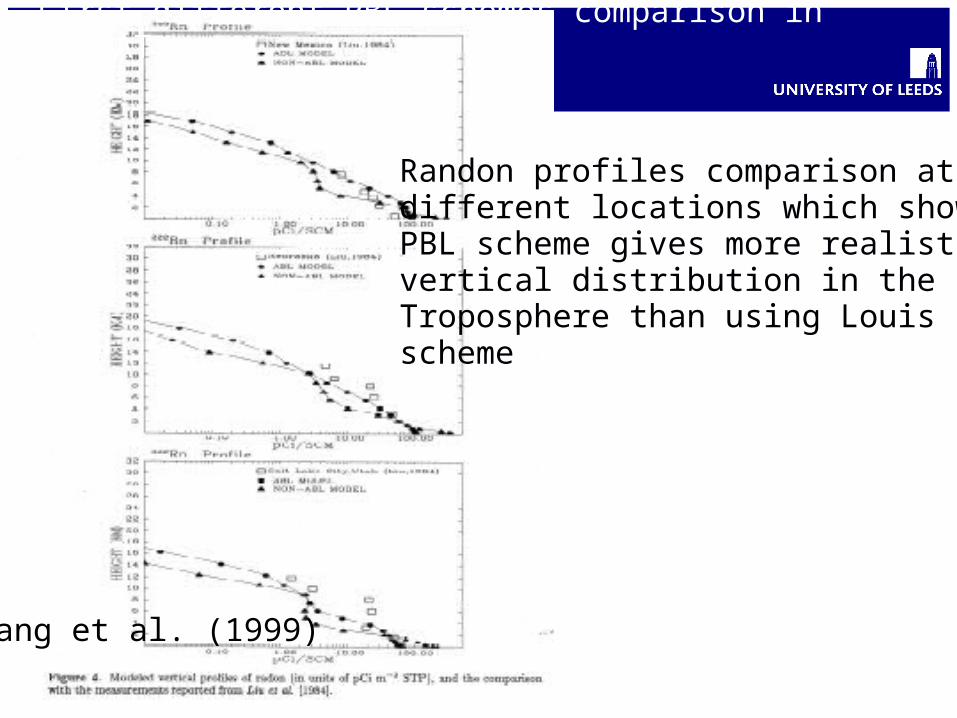
First different PBL schemes comparison in TOMCAT
Wang et al. (1999)
Randon profiles comparison at different locations which shows PBL scheme gives more realisticvertical distribution in the Troposphere than using Louisscheme
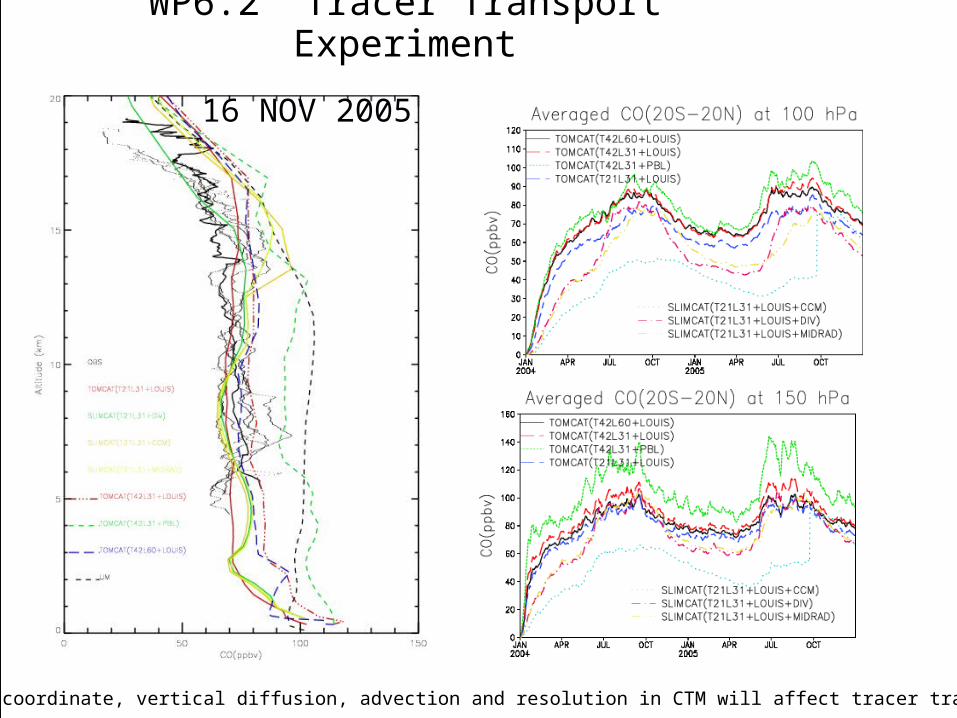
WP6.2 Tracer Transport Experiment
Different vertical coordinate, vertical diffusion, advection and resolution in CTM will affect tracer transport process
16 NOV 2005
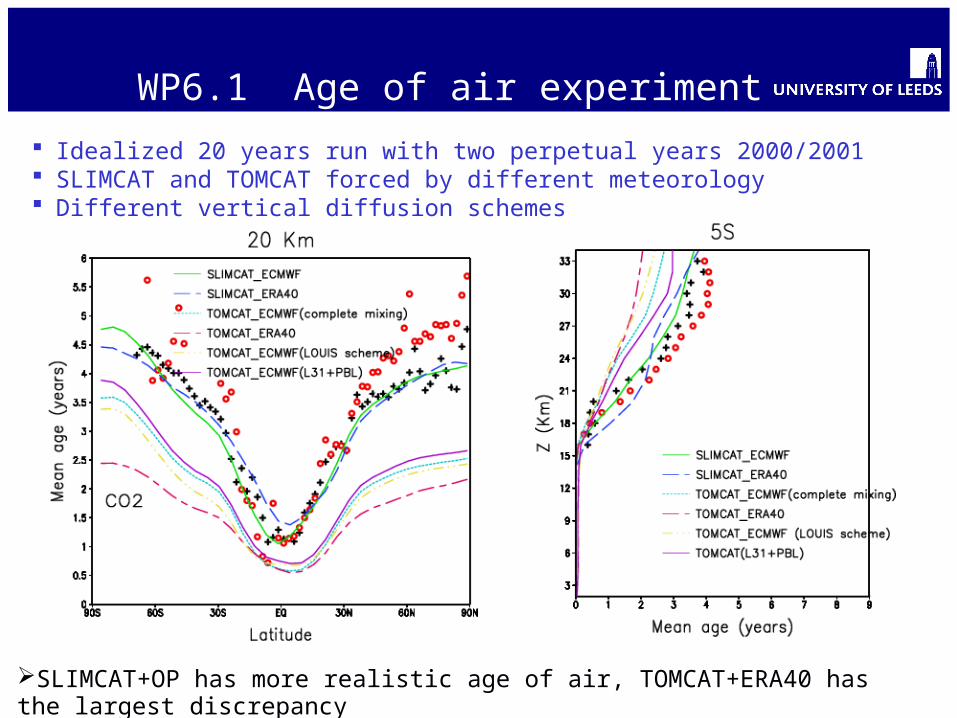
Idealized 20 years run with two perpetual years 2000/2001 SLIMCAT and TOMCAT forced by different meteorology Different vertical diffusion schemes
WP6.1 Age of air experiment
SLIMCAT+OP has more realistic age of air, TOMCAT+ERA40 has the largest discrepancy
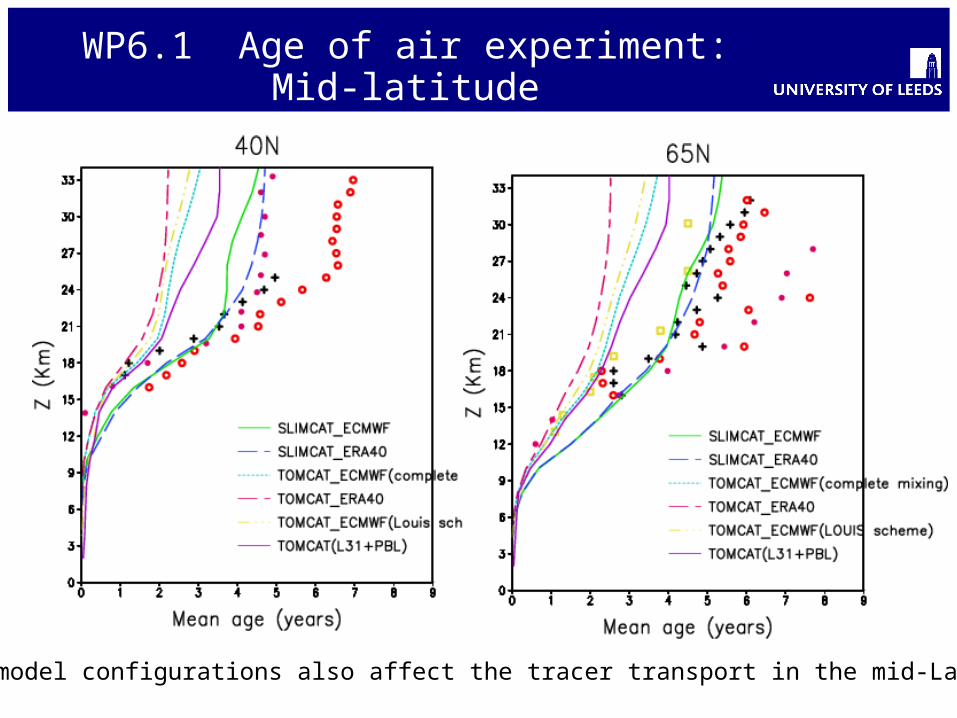
WP6.1 Age of air experiment: Mid-latitude
Different model configurations also affect the tracer transport in the mid-Latitude