Embed Size (px)
Citation preview

Institut Pierre-Simon Laplace (IPSL)
Bringing together key laboratories of the Paris area in the field of
environmental studies

IPSL = a federation of 6 laboratories in the Paris area
• LATMOS: atmospheric chemistry, mesoscale processes• LISA: atmospheric chemistry, air quality• LMD: atmospheric dynamics, climate studies• LOCEAN: physical and biogeochemical studies of the
ocean• LPMAA: High altitude atmosphere• LSCE: paleoclimatology, geochemical cycles, climate
impacts
in total about 1000 persons (permanent + temporary researchers; permanent + temporary support)

Key areas of the IPSL action
• Modeling studies
• Observational studies: in situ and from space
• Prepare the tools which are necessary for focused scientific studies: participation to the IPCC, field campaigns, planetary sciences

19 vert. levels
30 vert. levels
IPSL Climate ModelAtmosphere and Continental surfaces
(LMDZ - ORCHIDEE)
Ocean and sea-ice(ORCA-LIM)
coupler(OASIS)
Résolution:
Atm: 3.75°x2.5° (~350 km)
Oce: 2°x2°

Participation to IPCC Simulations
[GIEC 2007]
Earth System Model
Physics
CarbonCycle
Chemistry
Atmospheric Circulatioèn
Circulation OcéaniqueGlace de mer
Biogéochimie etbiologie marine
Carbon
DMS
Nutriments
ChemistryGases
&
Aérosols
CO2
Continental surface
sols et végétation
LMDZ
Orchidée LMDZT
ORCALIM
INCA
STOMATE PISCES
éBiochemistry
Carbon
CH4, COV,
Aérosols
Aérosols Sels marins
Continents Atmosphere Oceans


Atmospheric CO2 seasonal cycle : eg. Mauna Loa
IPSL-CM4-LOOPGLODAP
DIC Penetration in Atlantic Ocean
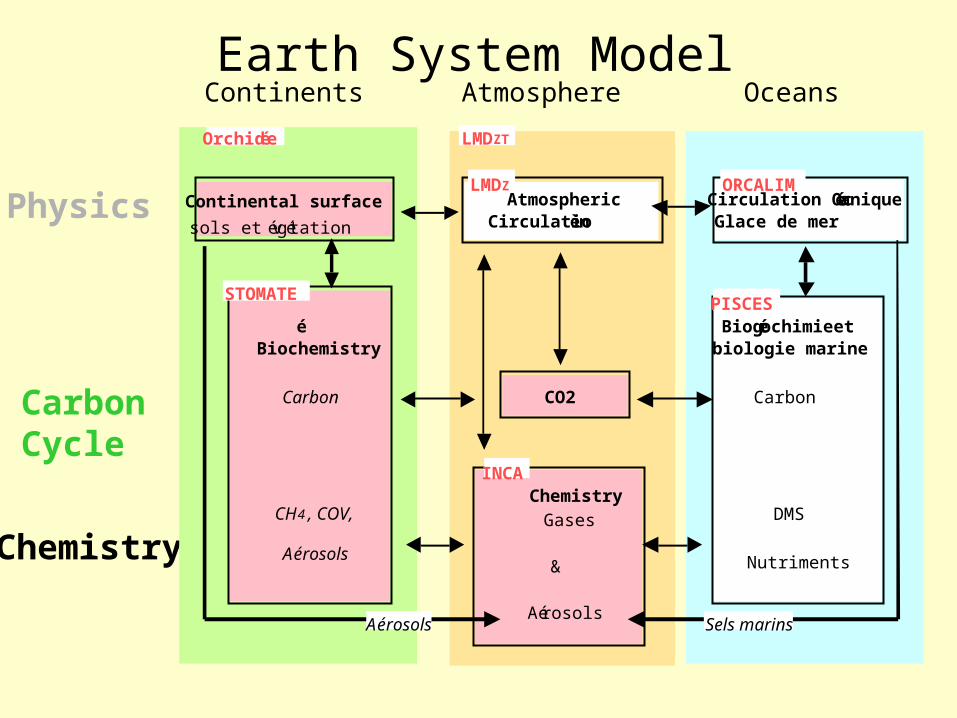
The chemistry-transport model CHIMERE (IPSL/LMD)
CHIMERE is a chemistry-transport model for the calculation of concentrations fields as: ozone, NOx, COVs, aerosols, dust...
More than 100 users More than 20 institutes are using CHIMERE for daily forecast More than 35 institutes for research More than 50 papers in peer-reviewed journals
Involved in numerous European projects such as GEMS, PROMOTE, City-Delta, Euro-Delta, CIRCE, AMMA, GEOMON, NATAIR.
Used for analysis, forecast, pollution peaks and trends, direct or adjoijnt modelling, data assimilation.
A communitary model in free access http://euler.lmd.polytechnique.fr/chimere
Example of daily forecast experimental (at LMD):
- France (GEMS)- Africa, Atlantic and Europe: CHIMERE-DUST for minreal dust
operational: PREVAIR french nationla plat-form (INERIS)
One of the forecast web sites
Vertical cross-section of a dust event over
Ukraine (March 2007)
CHIMERE users in Europe
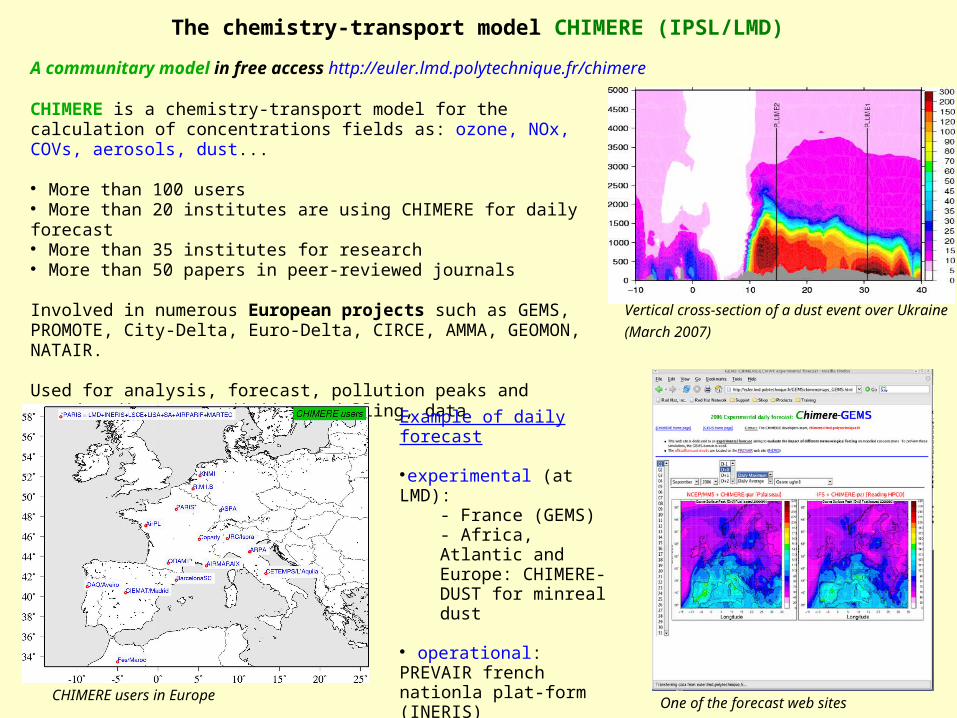
Objectives: Bring together and provide access to remote sensing instruments; provide access to observations Observe physical processes in the troposphere using instrument synergies:
Long-term routine measurements Field campaigns
Provide experimental teaching and outreach
Site d’observation: L’exemple du SIRTA
• Mid-latitudes: 48,7°N - 2,2°E• Urban-rural region
Sensitivities and trends in physical
parameters
Cloud radiative effect
Cloud optical thickness
Cloud and aerosol physical process
studies
Lidar backscatter
Ground-Satellite Synergies
Lidar LeosphereLidar LMD
Instrument development,
comparisons, and qualification
Applications:
http://www.sirta.fr

Illustration des 6 satellites composant l'A-train. De gauche à droite : Aura, Parasol, Calipso, Cloudsat, Aqua, OCO. Crédits : CNES octobre 2004, illustration P. Carril

Observations satellitaires:
exemple du bilan radiatif par ScaraB

P r e m i è r e o b s e r v a t i o n s p a t i a l e d e l a c o n c e n t r a t i o n e n C O 2 d e l ’ a t m o s p h è r e – S a t e l l i t e s p o l a i r e s N O A A P é r i o d e c o u v e r t e : 0 7 / 1 9 8 7 à 0 7 / 1 9 9 1 – Z o n e i n t e r t r o p i c a l e
F i g . 1 : E x e m p l e s d e r e s u l t a t s p o u r 2 m o i s . A v r i l 1 9 8 8 ( m a x i m u m s a i s o n n i e r d e l ’ h é m i s p h è r e n o r d ) e t S e p t e m b r e 1 9 8 8 ( m i n i m u m s a i s o n n i e r ) .
F i g . 2 b : E v o l u t i o n d e l ’ i n d i c e « E l N i n o O s c i l l a t i o n A u s t r a l e » ( S O I ) e n f o n c t i o n d u t e m p s . S O I n é g a t i f : p h a s e c h a u d e d e l ’ o s c i l l a t i o n ( E l N i n o ) ; S O I p o s i t i f : p h a s e f r o i d e d e l ’ o s c i l l a t i o n ( L a N i n a ) . L a c o r r é l a t i o n a v e c l e t a u x d e c r o i s s a n c e d e C O 2 e s t é v i d e n t e .
F i g . 2 a : A n a l y s e à p a r t i r d e s o b s e r v a t i o n s s p a t i a l e s d u t a u x d e c r o i s s a n c e d e l a c o n c e n t r a t i o n e n C O 2 d e l ’ a t m o s p h è r e ( J u i l l e t 1 9 8 7 – J u i l l e t 1 9 9 1 ) . T r a i t p l e i n : 0 - 2 5 N ; t r a i t p o i n t i l l é : 0 - 2 5 S
Satellite measurements of CO2

Key issues
• Data distribution, outreach
• Combination of various tools for specific aims