Embed Size (px)
Citation preview
Installation of a Deinking Plant to
Increase Paper Machine Production:
Financial Analysis and Final Report
Prepared for Carolina Pulp and Paper
April 10th, 2015
2
Table of Contents
Executive Summary .............................................................................................................. 5
Project Background and Description ................................................................................... 6
Current Mill Situation .................................................................................................... 6
Proposed Capital Projects .............................................................................................. 7
Supporting Information ....................................................................................................... 8
Wastepaper Supply, Demand, and Cost ........................................................................ 8
Process Steps in the Deinking of Ledger Wastepaper Grades ..................................... 11
Repulping ............................................................................................................... 11
Decontaminating.................................................................................................... 11
Deinking ................................................................................................................. 12
Case Studies and Precedents ....................................................................................... 16
Scope of Work, Decisions, and Project Options ................................................................ 18
High-Capital Solution: Flotation Deinking .................................................................... 18
Low-Capital Solution: MDIP Usage .............................................................................. 23
Results of Process Modeling .............................................................................................. 24
Environmental Impacts ................................................................................................ 25
Fresh Water............................................................................................................ 26
Effluent ................................................................................................................... 26
Solid Waste ............................................................................................................ 27
Throughput Impacts ..................................................................................................... 27
Low-Capital: Deinked Market Pulp Usage ............................................................. 27
High-Capital: Deinking Plant Installation ............................................................... 28
Quality Impacts ............................................................................................................ 29
Strength.................................................................................................................. 29
Runnability ............................................................................................................. 30
Optical Properties .................................................................................................. 30
Economic Evaluation .......................................................................................................... 31
Capital Cost Estimation ................................................................................................ 31
Low-Capital Solution: MDIP Usage ........................................................................ 31
High-Capital Solution: Flotation Deinking .............................................................. 32
Project Impacts on Operating Costs and Earnings ....................................................... 32
Low-Capital Solution: MDIP Usage ........................................................................ 32
High-Capital Solution: Flotation Deinking .............................................................. 33
Profitability and Sensitivity Analysis ............................................................................ 34
Low-Capital Solution: MDIP Usage ........................................................................ 34
High-Capital Solution: Flotation Deinking .............................................................. 35
Discussion........................................................................................................................... 37
Conclusions ........................................................................................................................ 38
Recommendations ............................................................................................................. 39
Future Work ....................................................................................................................... 39
Literature Cited .................................................................................................................. 41
Appendix ............................................................................................................................ 45
3
Table of Figures
Figure 1: Current Operating and Max Capacities ................................................................ 6
Figure 2: Projected Mill Free Cash Flow until 2030 ............................................................ 7
Figure 3: Locations of MDIP producers in North America .................................................. 9
Figure 4: Recovered paper statistics since 1992 ................................................................ 10
Figure 5: Costs (FOB seller’s dock) of relevant wastepaper grades .................................. 10
Figure 6: Andritz flotation cell ........................................................................................... 13
Figure 7: Illustration of particles on air bubbles in flotation cell ....................................... 15
Figure 8: Dirt removal vs. flotation pH for alkaline-pulped wastepaper .......................... 15
Figure 9: Process flow through proposed deinking plant .................................................. 19
Figure 10: WinGEMS representation of coarse screening system .................................... 20
Figure 11: WinGEMS representation of fine screening system ......................................... 20
Figure 12: WinGEMS representation of kneading through washing unit operations ....... 22
Figure 13: WinGEMS representation of secondary deinking loop .................................... 23
Figure 14: Flowsheet for MDIP repulping .......................................................................... 24
Figure 15: WinGEMS representation of pulper makedown system .................................. 24
Figure 16: Parameter Changes for Low-Capital Alternative .............................................. 27
Figure 17: Parameter Changes for High-Capital Alternative ............................................. 28
Figure 18: Factored Estimate for MDIP Usage Alternative ................................................ 31
Figure 19: Factored Estimate for Flotation Deinking Alternative ..................................... 32
Figure 20: Incremental Cost Summary for Low-Capital Alternative (MDIP)...................... 33
Figure 21: Incremental Cost Summary for High-Capital Alternative (Flotation) ............... 34
Figure 22: Sensitivity Analysis for Low-Capital Alternative ............................................... 35
Figure 23: Sensitivity Analysis for High-Capital Alternative ............................................... 36
Figure 24: Free Cash Flow for High-Capital Alternative ..................................................... 36
Figure 25: Incremental EBITDA for High-Capital Alternative ............................................. 37
Figure 26: Removal efficiency of different deinking method versus particle size ............ 48
Figure 27: Illustration of Metso drum pulper .................................................................... 49
Figure 28: Andritz deflaker ................................................................................................ 50
Figure 29: Illustration of a Metso cleaner ......................................................................... 50
Figure 30: Metso fine screening system ........................................................................... 51
Figure 31: Andritz coarse screen and Andritz dual fine and coarse screen ...................... 51
Figure 32: Illustration of countercurrent and cocurrent flotation columns ...................... 52
Figure 33: Photomicrographs of deposits before and after cavitation-jet treatment ..... 53
Figure 34: COD and solids content of recycled deinking effluents .................................... 58
4
Table of Tables
Table 1: Key Recovery Boiler Information .......................................................................... 6
Table 2: Paper Machine Specifications ............................................................................... 7
Table 3: List of North American Companies Producing Deinked Market Pulp .................... 9
Table 4: Influence of printing process and drying mechanism on deinkability ................. 13
Table 5: Decisions Made as a Result of Discussions with CPP ........................................... 18
Table 6: Reconciliation of WinGEMS Model with Mill Data .............................................. 25
Table 7: Summary of Environmental Effects of MDIP Usage............................................. 26
Table 8: Summary of Environmental Effects of Flotation Deinking .................................. 26
Table 9: Equipment List with Delivered Costs for Low-Capital Alternative ....................... 31
Table 10: Summary of Key Performance Metrics .............................................................. 39
Table 11: Common removal methods for various ink particle sizes .................................. 48
Table 12: Compositions of Several Deinking, Bleached Sludge Samples........................... 57
Table 13: Voith Deinking Plant Quote Information ........................................................... 60
Table 14: Cost and Revenue Summary Table – Low-Capital Solution ............................... 62
Table 15: Cost and Revenue Summary Table – High-Capital Solution .............................. 63
Table 16: Profitability Summary Table – Low-Capital Alternative ..................................... 64
Table 17: Sensitivity Analysis IRR Values for Low-Capital Alternative .............................. 64
Table 18: Profitability Summary Table – High-Capital Alternative .................................... 65
Table 19: Sensitivity Analysis IRR Values for High-Capital Alternative .............................. 65
5
Executive Summary
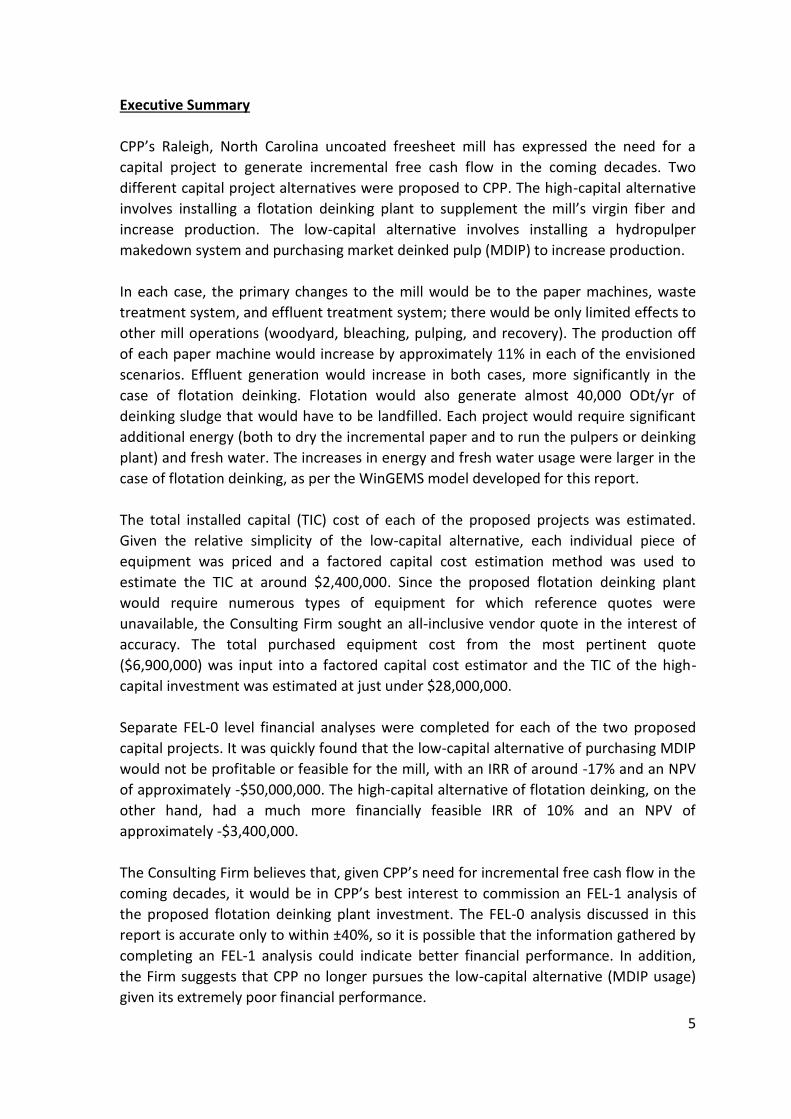
CPP’s Raleigh, North Carolina uncoated freesheet mill has expressed the need for a
capital project to generate incremental free cash flow in the coming decades. Two
different capital project alternatives were proposed to CPP. The high-capital alternative
involves installing a flotation deinking plant to supplement the mill’s virgin fiber and
increase production. The low-capital alternative involves installing a hydropulper
makedown system and purchasing market deinked pulp (MDIP) to increase production.
In each case, the primary changes to the mill would be to the paper machines, waste
treatment system, and effluent treatment system; there would be only limited effects to
other mill operations (woodyard, bleaching, pulping, and recovery). The production off
of each paper machine would increase by approximately 11% in each of the envisioned
scenarios. Effluent generation would increase in both cases, more significantly in the
case of flotation deinking. Flotation would also generate almost 40,000 ODt/yr of
deinking sludge that would have to be landfilled. Each project would require significant
additional energy (both to dry the incremental paper and to run the pulpers or deinking
plant) and fresh water. The increases in energy and fresh water usage were larger in the
case of flotation deinking, as per the WinGEMS model developed for this report.
The total installed capital (TIC) cost of each of the proposed projects was estimated.
Given the relative simplicity of the low-capital alternative, each individual piece of
equipment was priced and a factored capital cost estimation method was used to
estimate the TIC at around $2,400,000. Since the proposed flotation deinking plant
would require numerous types of equipment for which reference quotes were
unavailable, the Consulting Firm sought an all-inclusive vendor quote in the interest of
accuracy. The total purchased equipment cost from the most pertinent quote
($6,900,000) was input into a factored capital cost estimator and the TIC of the high-
capital investment was estimated at just under $28,000,000.
Separate FEL-0 level financial analyses were completed for each of the two proposed
capital projects. It was quickly found that the low-capital alternative of purchasing MDIP
would not be profitable or feasible for the mill, with an IRR of around -17% and an NPV
of approximately -$50,000,000. The high-capital alternative of flotation deinking, on the
other hand, had a much more financially feasible IRR of 10% and an NPV of
approximately -$3,400,000.
The Consulting Firm believes that, given CPP’s need for incremental free cash flow in the
coming decades, it would be in CPP’s best interest to commission an FEL-1 analysis of
the proposed flotation deinking plant investment. The FEL-0 analysis discussed in this
report is accurate only to within ±40%, so it is possible that the information gathered by
completing an FEL-1 analysis could indicate better financial performance. In addition,
the Firm suggests that CPP no longer pursues the low-capital alternative (MDIP usage)
given its extremely poor financial performance.
6
Project Background and Description
Current Mill Situation
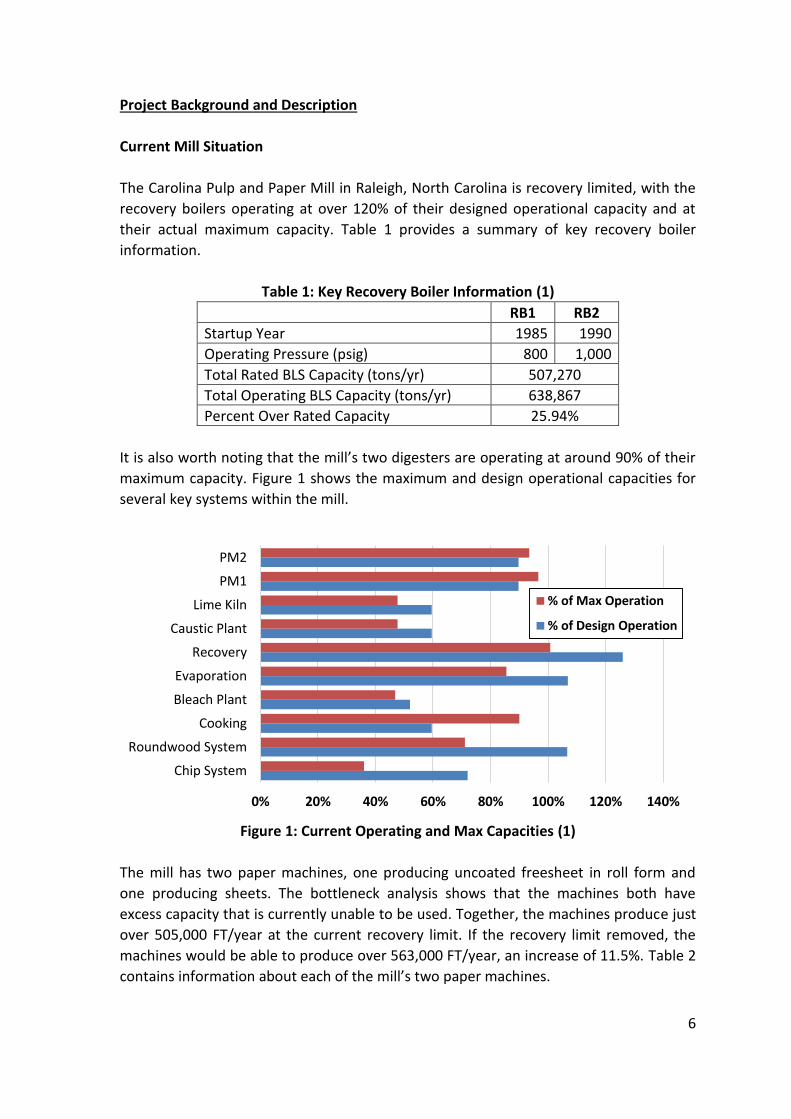
The Carolina Pulp and Paper Mill in Raleigh, North Carolina is recovery limited, with the
recovery boilers operating at over 120% of their designed operational capacity and at
their actual maximum capacity. Table 1 provides a summary of key recovery boiler
information.
Table 1: Key Recovery Boiler Information (1)
RB1 RB2
Startup Year 1985 1990
Operating Pressure (psig) 800 1,000
Total Rated BLS Capacity (tons/yr) 507,270
Total Operating BLS Capacity (tons/yr) 638,867
Percent Over Rated Capacity 25.94%
It is also worth noting that the mill’s two digesters are operating at around 90% of their
maximum capacity. Figure 1 shows the maximum and design operational capacities for
several key systems within the mill.
Figure 1: Current Operating and Max Capacities (1)
The mill has two paper machines, one producing uncoated freesheet in roll form and
one producing sheets. The bottleneck analysis shows that the machines both have
excess capacity that is currently unable to be used. Together, the machines produce just
over 505,000 FT/year at the current recovery limit. If the recovery limit removed, the
machines would be able to produce over 563,000 FT/year, an increase of 11.5%. Table 2
contains information about each of the mill’s two paper machines.
0% 20% 40% 60% 80% 100% 120% 140%
Chip System
Roundwood System
Cooking
Bleach Plant
Evaporation
Recovery
Caustic Plant
Lime Kiln
PM1
PM2
% of Max Operation
% of Design Operation
7
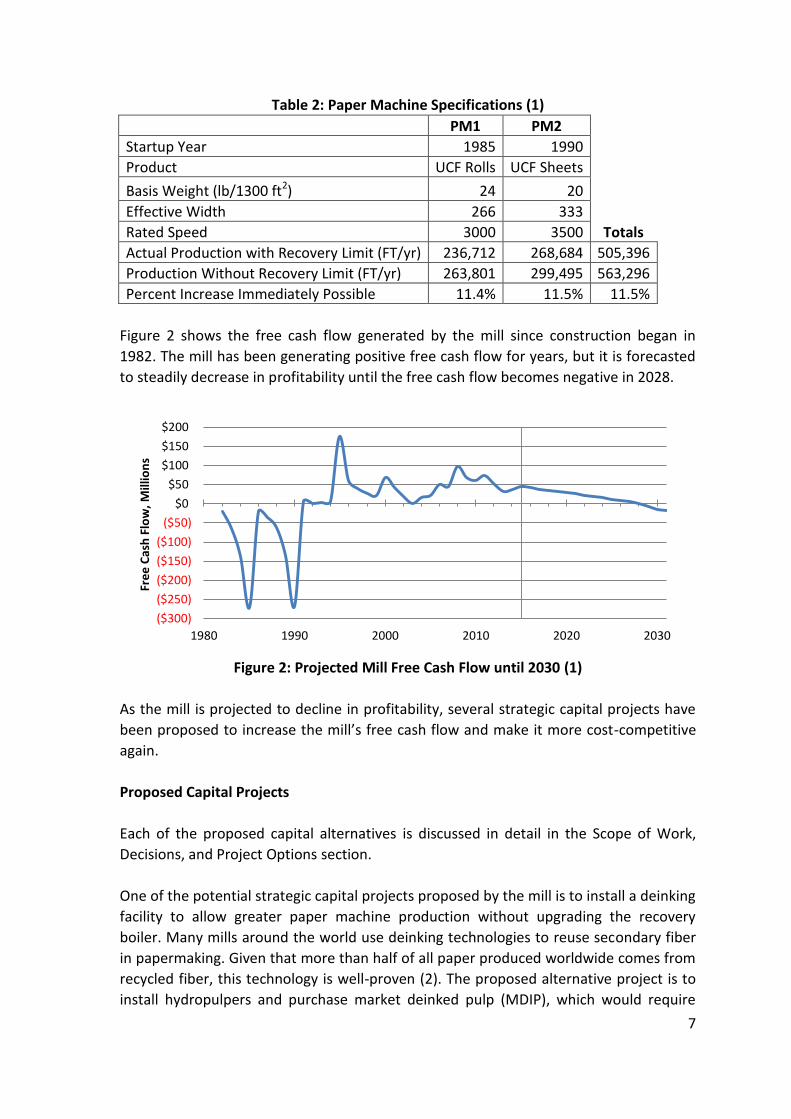
Table 2: Paper Machine Specifications (1)
PM1 PM2 Startup Year 1985 1990 Product UCF Rolls UCF Sheets Basis Weight (lb/1300 ft2) 24 20 Effective Width 266 333 Rated Speed 3000 3500 Totals
Actual Production with Recovery Limit (FT/yr) 236,712 268,684 505,396
Production Without Recovery Limit (FT/yr) 263,801 299,495 563,296
Percent Increase Immediately Possible 11.4% 11.5% 11.5%
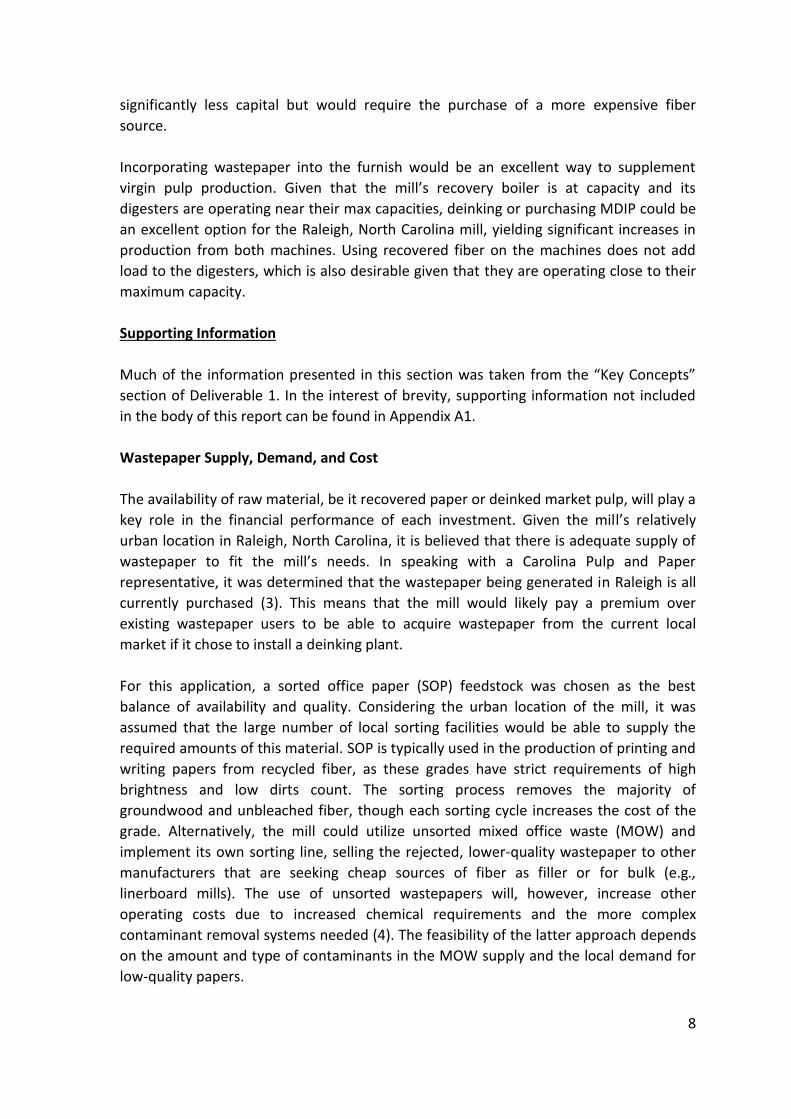
Figure 2 shows the free cash flow generated by the mill since construction began in
1982. The mill has been generating positive free cash flow for years, but it is forecasted
to steadily decrease in profitability until the free cash flow becomes negative in 2028.
Figure 2: Projected Mill Free Cash Flow until 2030 (1)
As the mill is projected to decline in profitability, several strategic capital projects have
been proposed to increase the mill’s free cash flow and make it more cost-competitive
again.
Proposed Capital Projects
Each of the proposed capital alternatives is discussed in detail in the Scope of Work,
Decisions, and Project Options section.
One of the potential strategic capital projects proposed by the mill is to install a deinking
facility to allow greater paper machine production without upgrading the recovery
boiler. Many mills around the world use deinking technologies to reuse secondary fiber
in papermaking. Given that more than half of all paper produced worldwide comes from
recycled fiber, this technology is well-proven (2). The proposed alternative project is to
install hydropulpers and purchase market deinked pulp (MDIP), which would require
($300)
($250)
($200)
($150)
($100)
($50)
$0
$50
$100
$150
$200
1980 1990 2000 2010 2020 2030
Fre
e C
ash
Flo
w, M
illio
ns
8
significantly less capital but would require the purchase of a more expensive fiber
source.
Incorporating wastepaper into the furnish would be an excellent way to supplement
virgin pulp production. Given that the mill’s recovery boiler is at capacity and its
digesters are operating near their max capacities, deinking or purchasing MDIP could be
an excellent option for the Raleigh, North Carolina mill, yielding significant increases in
production from both machines. Using recovered fiber on the machines does not add
load to the digesters, which is also desirable given that they are operating close to their
maximum capacity.
Supporting Information
Much of the information presented in this section was taken from the “Key Concepts”
section of Deliverable 1. In the interest of brevity, supporting information not included
in the body of this report can be found in Appendix A1.
Wastepaper Supply, Demand, and Cost
The availability of raw material, be it recovered paper or deinked market pulp, will play a
key role in the financial performance of each investment. Given the mill’s relatively
urban location in Raleigh, North Carolina, it is believed that there is adequate supply of
wastepaper to fit the mill’s needs. In speaking with a Carolina Pulp and Paper
representative, it was determined that the wastepaper being generated in Raleigh is all
currently purchased (3). This means that the mill would likely pay a premium over
existing wastepaper users to be able to acquire wastepaper from the current local
market if it chose to install a deinking plant.
For this application, a sorted office paper (SOP) feedstock was chosen as the best
balance of availability and quality. Considering the urban location of the mill, it was
assumed that the large number of local sorting facilities would be able to supply the
required amounts of this material. SOP is typically used in the production of printing and
writing papers from recycled fiber, as these grades have strict requirements of high
brightness and low dirts count. The sorting process removes the majority of
groundwood and unbleached fiber, though each sorting cycle increases the cost of the
grade. Alternatively, the mill could utilize unsorted mixed office waste (MOW) and
implement its own sorting line, selling the rejected, lower-quality wastepaper to other
manufacturers that are seeking cheap sources of fiber as filler or for bulk (e.g.,
linerboard mills). The use of unsorted wastepapers will, however, increase other
operating costs due to increased chemical requirements and the more complex
contaminant removal systems needed (4). The feasibility of the latter approach depends
on the amount and type of contaminants in the MOW supply and the local demand for
low-quality papers.
9
Deinked market pulp is not widely produced in North America. According to the RISI Mill
Asset Database, only those mills listed in Table 3 produce deinked market pulp (5). The
nearest deinked market pulp producer, Resolute Forest Products, is located over 400
miles from Raleigh in Fairmont, West Virginia. This mill also happens to produce dried
MDIP, which is much cheaper to transport than wet-lap, meaning it would likely be a
preferable MDIP supplier for the Raleigh mill.
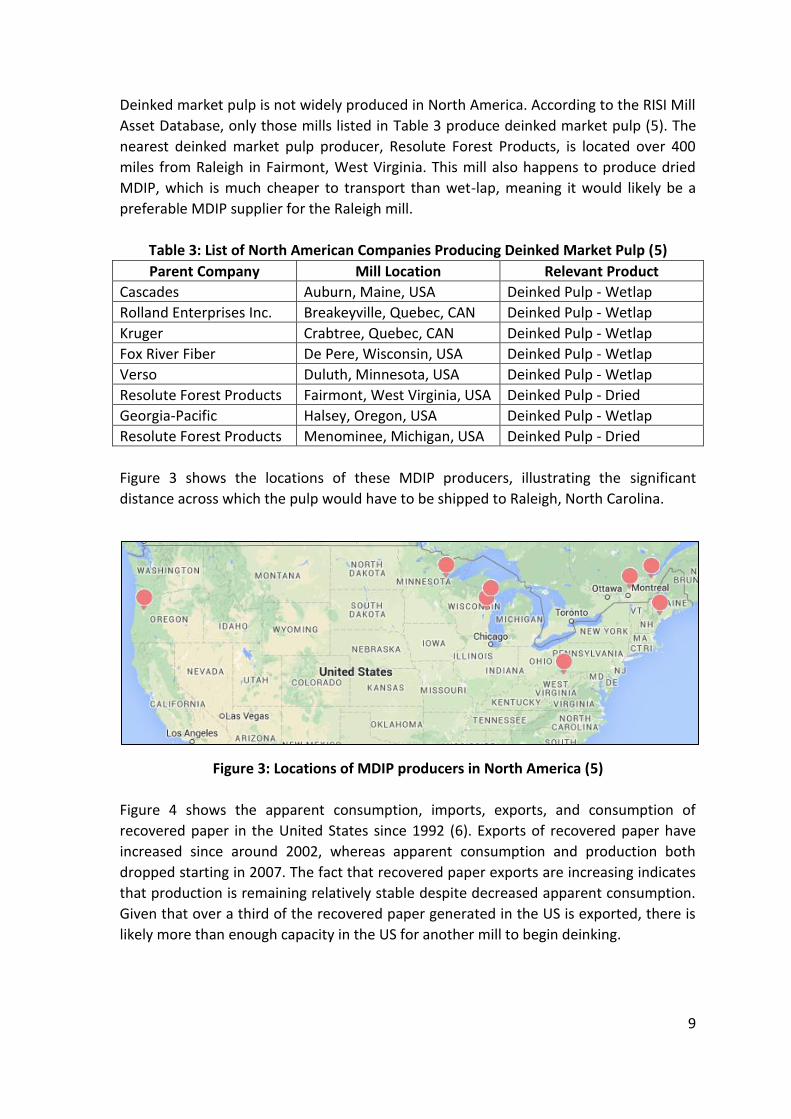
Table 3: List of North American Companies Producing Deinked Market Pulp (5)
Parent Company Mill Location Relevant Product
Cascades Auburn, Maine, USA Deinked Pulp - Wetlap
Rolland Enterprises Inc. Breakeyville, Quebec, CAN Deinked Pulp - Wetlap
Kruger Crabtree, Quebec, CAN Deinked Pulp - Wetlap
Fox River Fiber De Pere, Wisconsin, USA Deinked Pulp - Wetlap
Verso Duluth, Minnesota, USA Deinked Pulp - Wetlap
Resolute Forest Products Fairmont, West Virginia, USA Deinked Pulp - Dried
Georgia-Pacific Halsey, Oregon, USA Deinked Pulp - Wetlap
Resolute Forest Products Menominee, Michigan, USA Deinked Pulp - Dried
Figure 3 shows the locations of these MDIP producers, illustrating the significant
distance across which the pulp would have to be shipped to Raleigh, North Carolina.
Figure 3: Locations of MDIP producers in North America (5)
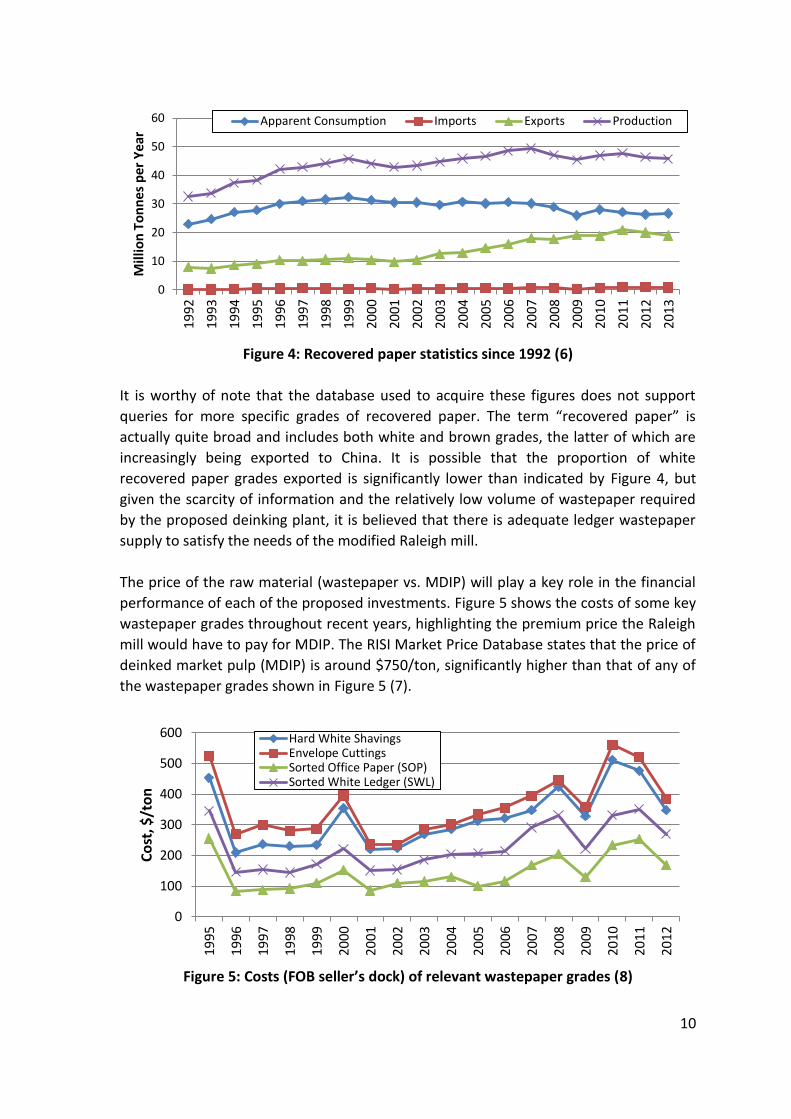
Figure 4 shows the apparent consumption, imports, exports, and consumption of
recovered paper in the United States since 1992 (6). Exports of recovered paper have
increased since around 2002, whereas apparent consumption and production both
dropped starting in 2007. The fact that recovered paper exports are increasing indicates
that production is remaining relatively stable despite decreased apparent consumption.
Given that over a third of the recovered paper generated in the US is exported, there is
likely more than enough capacity in the US for another mill to begin deinking.
10
Figure 4: Recovered paper statistics since 1992 (6)
It is worthy of note that the database used to acquire these figures does not support
queries for more specific grades of recovered paper. The term “recovered paper” is
actually quite broad and includes both white and brown grades, the latter of which are
increasingly being exported to China. It is possible that the proportion of white
recovered paper grades exported is significantly lower than indicated by Figure 4, but
given the scarcity of information and the relatively low volume of wastepaper required
by the proposed deinking plant, it is believed that there is adequate ledger wastepaper
supply to satisfy the needs of the modified Raleigh mill.
The price of the raw material (wastepaper vs. MDIP) will play a key role in the financial
performance of each of the proposed investments. Figure 5 shows the costs of some key
wastepaper grades throughout recent years, highlighting the premium price the Raleigh
mill would have to pay for MDIP. The RISI Market Price Database states that the price of
deinked market pulp (MDIP) is around $750/ton, significantly higher than that of any of
the wastepaper grades shown in Figure 5 (7).
Figure 5: Costs (FOB seller’s dock) of relevant wastepaper grades (8)
0
10
20
30
40
50
60
19
92
19
93
19
94
19
95
19
96
19
97
19
98
19
99
20
00
200
1
20
02
20
03
20
04
20
05
20
06
20
07
20
08
20
09
20
10
201
1
20
12
20
13
Mill
ion
To
nn
es p
er Y
ear
Apparent Consumption Imports Exports Production
0
100
200
300
400
500
600
1995
1996
1997
1998
1999
2000
2001
2002
200
3
2004
2005
2006
2007
2008
2009
2010
2011
201
2
Co
st, $
/to
n
Hard White ShavingsEnvelope CuttingsSorted Office Paper (SOP)Sorted White Ledger (SWL)
11
In addition, the price of recovered paper appears to be decreasing in the US Southeast.
These trends are supported further by the data previously discussed in Figure 4.
Unfortunately, historical pricing data beyond the previous two years was not available
for MDIP. It is clear from Figure 5 that the price of recovered paper is declining, which
favors the installation of a deinking plant over the installation of pulpers for MDIP use.
Sorted office paper (SOP), the most likely candidate for use in the proposed deinking
plant, will likely cost under $200/ton if it continues to follow the trend shown in Figure
5. Since fiber cost is the largest variable cost of production, the major difference in the
costs of MDIP and recovered paper sources will play a key role in determining which of
the two proposed solutions yield better financial performance. More detailed financial
analyses are in development.
It should also be noted that on October 31, 2012, Mississippi River Pulp closed down
their Natchez MDIP mill, decreasing North American MDIP production by 131,000
annual tonnes (9). Given the relatively few MDIP producers remaining in North America
(as shown in Figure 3 and Table 3), this major decrease in supply likely means the price
of MDIP will remain stable or even increase in the next few years. Although it is not
immediately clear which of the two proposed solutions would yield better financial
performance, the high price and low supply of MDIP do not bode well for the low-capital
alternative of installing hydropulpers and purchasing deinked market pulp. Although
installing a flotation deinking facility would require significant capital, the Raleigh mill
would enjoy significantly reduced variable cost of production on the incremental tons of
paper produced.
Process Steps in the Deinking of Ledger Wastepaper Grades
Repulping (2, 10)
The first and arguably most important step in the deinking of recovered paper is
repulping. Furnish (baled or loose) is converted into a slurry, ink is detached from fibers,
and large contaminants are removed from the stream. The temperature, pH, residence
time, consistency, chemical load, fiber type, and contaminant composition during the
pulping stage strongly affect the efficiency of the separation of fibers and contaminants
during the latter stages of deinking (11).
Decontaminating (2, 10)
A designated screening section in a drum pulper removes large contaminants before the
pulp is discharged and moves further into the deinking process, so a separate detrashing
unit is not necessary. The advent of drum pulpers has greatly improved removal
efficiency and pulp quality, and this technology is almost always used in new and
upgraded deinking plants. While these units are more expensive than vat pulpers and
require more space, they consume approximately half as much power and have far
lower maintenance costs than rotor rebuilds.
12
Lightweight contaminants such as stickies are removed in the pressure screens, which
operate based on differences in size and shape between the contaminants and the
fibers. These devices are equipped with slotted baskets that are designed to filter out
individual fibers from contaminants and rotors that create pressure pulses to prevent
the slots in the baskets from plugging. The coarse screens have wider slots and are
typically set up in a feedforward configuration to maximize fiber yield. The fine screens
have baskets with narrower slots and usually operate in a countercurrent mode (where
accepts from later stages return to feed an earlier stage) to maximize separation
efficiency. Over the past ten years, the slot size in the screen baskets has decreased by
about half, allowing for decreased residual refuse size and improved separation of
stickies from the exiting pulp stream. Stock consistency and temperature, pH,
contaminant composition, pressure drop, and slot size can influence the effectiveness of
both the fine and coarse screening operations.
Kneading and dispersion are crucial steps in the removal of ink and dirt from the pulp, as
well as the size reduction of stickies. These units operate similarly to refiners, but
kneaders rotate at slower speeds and with a larger plate gap to avoid fiber cutting.
Kneaders increase final brightness via further separation of contaminants. They typically
precede flotation and washing steps, and contaminants exit at a size that flotation cells
can efficiently remove. Dispersers run at high speeds with smaller plate gaps. Debris and
visible ink particles still present in the pulp are reduced, resulting in a more uniform
sheet but decreasing brightness. Dispersers are usually placed near the end of the
process, prior to pulp storage. Both of these units typically operate at around 35%
consistency, so a belt or screw press is usually used upstream to thicken the stock.
Peroxide bleaching is often more effective at this point in the process due to the
increased pulp consistency. In kneaders and dispersers alike, the consistency, pH,
temperature, power, plate design, and rotational speed determine the overall
performance of the unit.
Deinking
Flotation cells remove hydrophobic contaminants (primarily ink particles) via the
injection of air into the pulp slurry. The contaminants adhere to the air bubbles, rather
than the pulp, and float to the surface of the unit where they can be removed. Flotation
aids, such as soaps and surfactants, are typically added before flotation cells to improve
the adhesion between the air bubbles and contaminants and to strengthen the bubbles
so they reach the surface of the unit. The size distribution of these bubbles is also
important for effective ink removal, in that bubbles that are too large or too small
compared to the contaminants can lead to fiber loss or contaminant carryover,
respectively. Water hardness is an important determinant in the effectiveness of the
flotation stage. Lime milk is often added to impart hydrophobicity to ink particles and
ensure a correct size distribution (12). In addition to residence time, water hardness, pH,
consistency, particle size, and temperature in the flotation unit, the upstream pulper
13
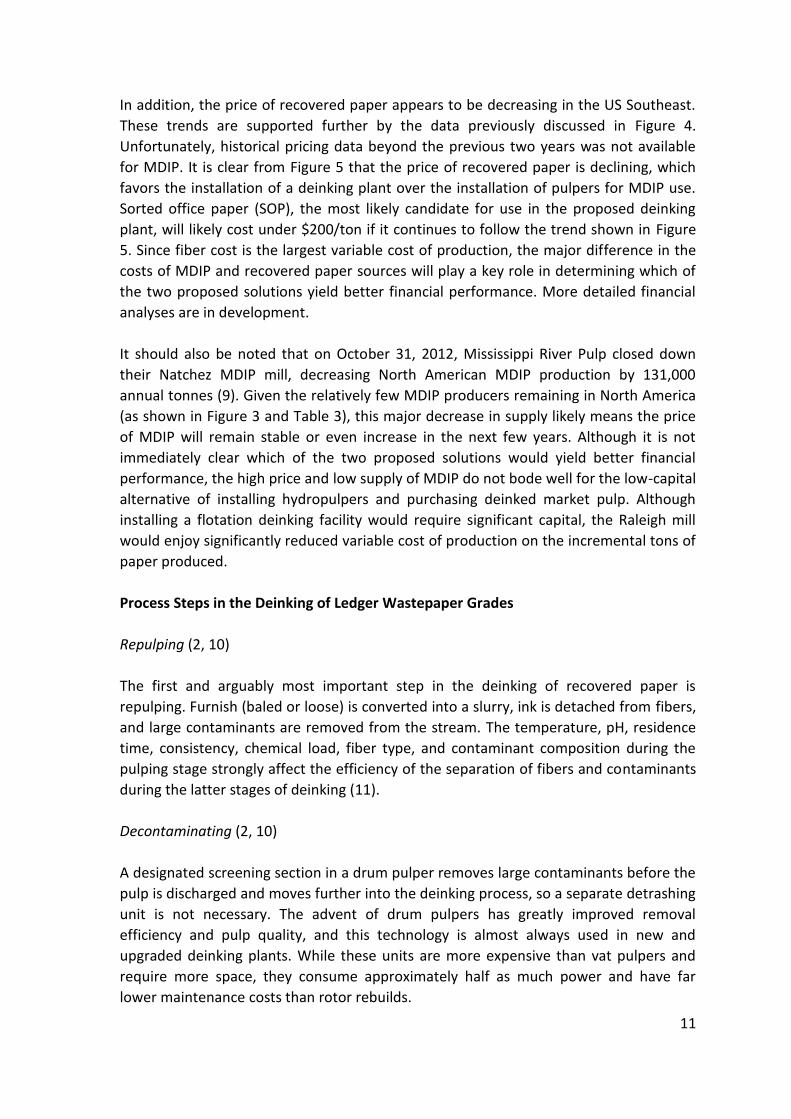
conditions also affect the ink removal efficiency during flotation. Figure 6 is an
illustration of an Andritz flotation cell.
Figure 6: Andritz flotation cell (2)
Sophisticated deinking plants typically have two to three loops, with flotation and
washing stages within each, for maximum deinking efficiency and pulp brightness. The
advent of new flotation cell designs and more effective recycling chemicals has
decreased the need for washing as a separate, independent pulp cleaning operation. As
such, new flotation cells are typically installed alongside vacuum, drum or belt washers,
which, though less effective than their predecessors at removing ink and other
contaminants, exhibit much less dramatic yield loss.
The effectiveness of deinking is influenced by the type of ink being removed, the printing
technique and conditions, the age of the print, and the paper surface properties. The key
findings of a study of the effects of different printing processes and drying parameters
on deinkability are summarized in Table 4. (13)
Table 4: Influence of printing process and drying mechanism on deinkability (13)
Printing process Drying mechanisms Deinkability
Offset newspaper Letterpress Offset sheet fed Offset heat-set
Absorption (and oxidation) Absorption and oxidation Absorption, evaporation, and oxidation
Good if not aged. After aging, bad ink detachment, smeared pulp, and specks
Rotogravure Evaporation Good, possibility of colored pulp (dyes)
Laser printers, copiers U.V. and I.R.
Radiation curing Bad toner detachment, strong speck contamination
In addition to mechanical forces, there are numerous chemicals that can aid in the
deinking process. Chelating agents have been used to aid in the deinking of papers
printed with flexographic printing ink. Flexographic printing ink is an electrostatically-
14
stabilized, colloidal dispersion and is thus extremely stable within the alkaline pH range
(14). Since conventional deinking processes operate under alkaline conditions, this is
problematic (2, 13). Some researchers have found that flexographic inks can be
flocculated and more easily removed via reduction of steric stabilization forces when ink
particles are chelated with cupric chloride (II) (14). This method is similar to others in
that it utilizes salts, but it stands out in terms of its effectiveness.
Another chemical treatment common in deinking processes is the addition of non-ionic
surfactants during the pulping stage to control issues caused by hydrophilic, sub-micron-
sized ink particles (15). The rationale behind such treatments is that adding a surfactant
can strengthen air bubbles so they can carry more ink particles upwards and out of the
bulk liquid, where the ink can be efficiently removed. Further, non-ionic surfactants can
help prevent fibers from attaching to air bubbles, potentially increasing deinking yield
(15).
The extent and efficiency of deinking are very sensitive to a number of process
parameters, from the pulping of the recovered paper to the characteristics of the
flotation cell itself. Some of the parameters with dramatic effects on deinking are the
pulping conditions, the relative ink and fiber sizes in the recovered paper and the pH,
temperature, air bubble size, water hardness, and duration of flotation.
One study found the optimal pulping conditions with respect to deinking efficiency to be
2% consistency, 50 °C, 1 minute duration, and pH 3.5 with 60 rpm agitation (16).
Increasing the duration of pulping detaches more ink but reduces the size of the
particles, making them more difficult to remove during deinking.
The quality of the recovered paper used in the process has a significant effect on
deinking. Deinking is less effective, overall, when the feedstock is a mix of papers printed
with different types of ink. When the wastepaper mix includes papers printed with liquid
toner inks, the total dirt speck area after flotation increases dramatically (17).
The size of the air bubbles generated within a flotation cell can have an effect on the
quality of deinking. Small air bubbles are generated at the bottom of flotation cells.
These air bubbles move slowly upwards, sometimes agglomerating with other bubbles
and increasing in size. Only very small particles can attach to these tiny air bubbles long
enough to rise into the frothy area at the top of a flotation cell, where they are
removed. These particles are typically hydrophobic in nature and include inks, fillers,
contaminated fines, and extractives. However, if the air bubbles are too large, entire
fibers can become attached to them. Attachment of fibers and fines to air bubbles is the
main cause of deinking yield loss, often over 25%. If air bubble size and velocity are not
controlled effectively, deinking yield can suffer dramatically, substantially increasing the
price per finished ton of production. (18)
15
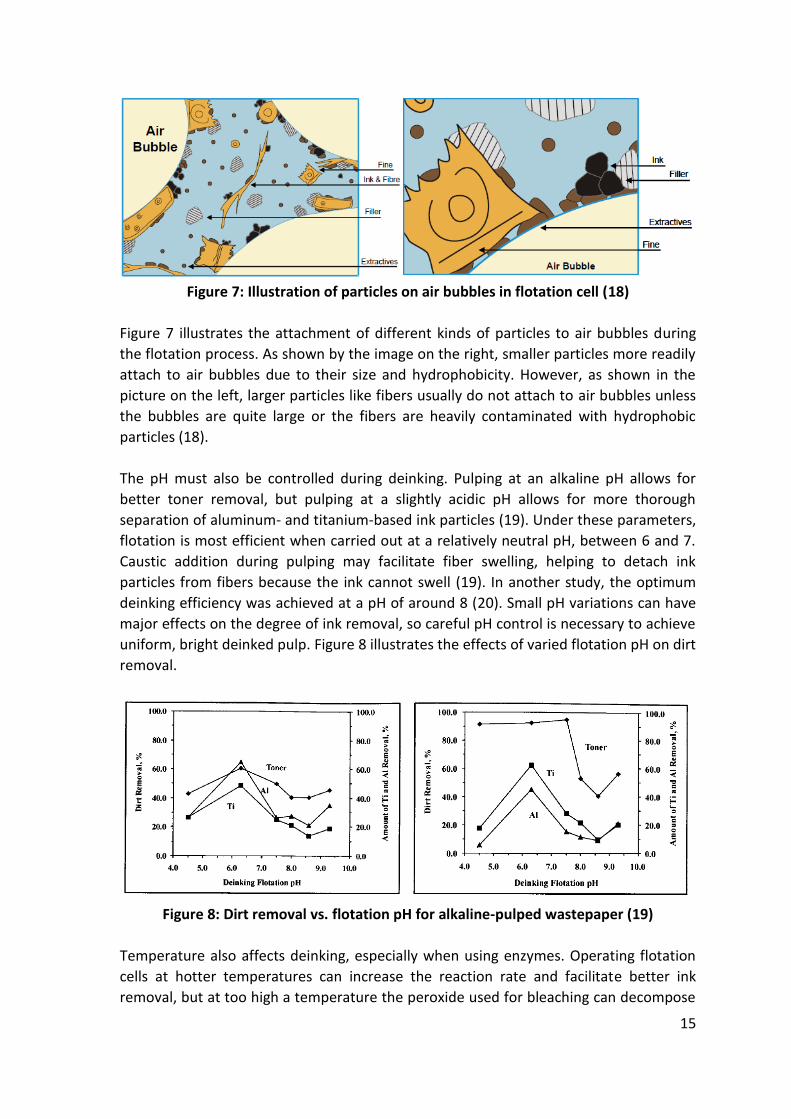
Figure 7: Illustration of particles on air bubbles in flotation cell (18)
Figure 7 illustrates the attachment of different kinds of particles to air bubbles during
the flotation process. As shown by the image on the right, smaller particles more readily
attach to air bubbles due to their size and hydrophobicity. However, as shown in the
picture on the left, larger particles like fibers usually do not attach to air bubbles unless
the bubbles are quite large or the fibers are heavily contaminated with hydrophobic
particles (18).
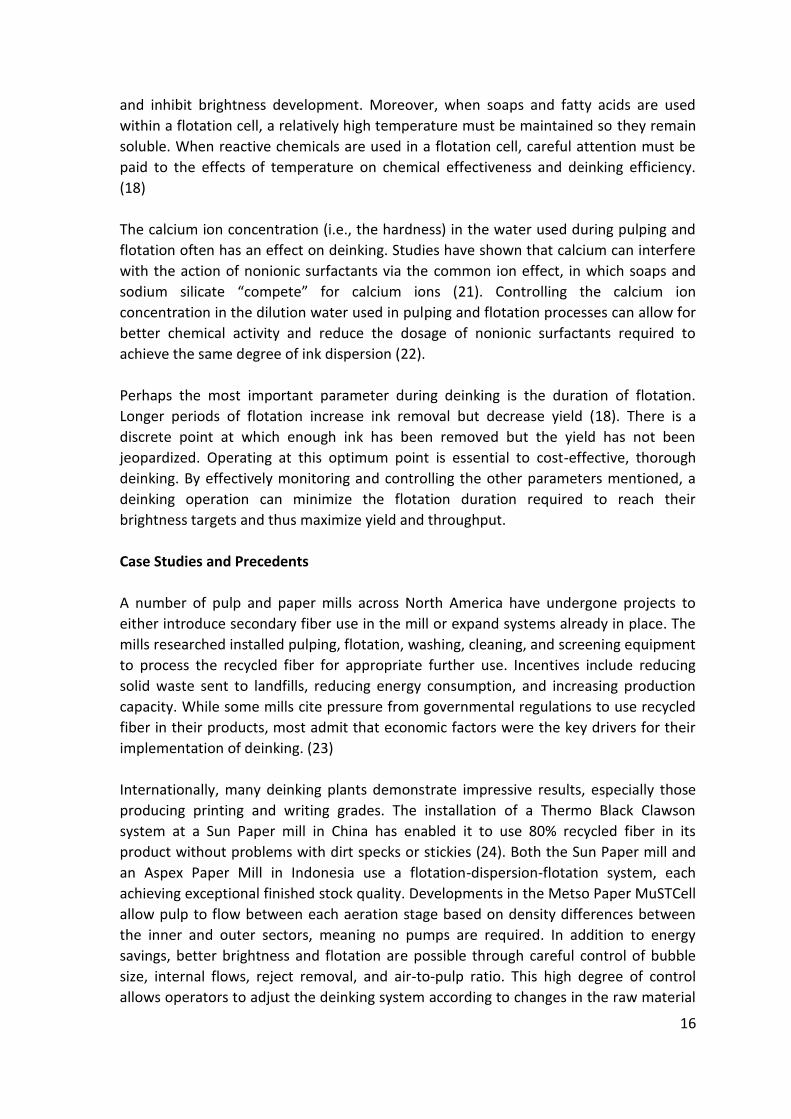
The pH must also be controlled during deinking. Pulping at an alkaline pH allows for
better toner removal, but pulping at a slightly acidic pH allows for more thorough
separation of aluminum- and titanium-based ink particles (19). Under these parameters,
flotation is most efficient when carried out at a relatively neutral pH, between 6 and 7.
Caustic addition during pulping may facilitate fiber swelling, helping to detach ink
particles from fibers because the ink cannot swell (19). In another study, the optimum
deinking efficiency was achieved at a pH of around 8 (20). Small pH variations can have
major effects on the degree of ink removal, so careful pH control is necessary to achieve
uniform, bright deinked pulp. Figure 8 illustrates the effects of varied flotation pH on dirt
removal.
Figure 8: Dirt removal vs. flotation pH for alkaline-pulped wastepaper (19)
Temperature also affects deinking, especially when using enzymes. Operating flotation
cells at hotter temperatures can increase the reaction rate and facilitate better ink
removal, but at too high a temperature the peroxide used for bleaching can decompose
16
and inhibit brightness development. Moreover, when soaps and fatty acids are used
within a flotation cell, a relatively high temperature must be maintained so they remain
soluble. When reactive chemicals are used in a flotation cell, careful attention must be
paid to the effects of temperature on chemical effectiveness and deinking efficiency.
(18)
The calcium ion concentration (i.e., the hardness) in the water used during pulping and
flotation often has an effect on deinking. Studies have shown that calcium can interfere
with the action of nonionic surfactants via the common ion effect, in which soaps and
sodium silicate “compete” for calcium ions (21). Controlling the calcium ion
concentration in the dilution water used in pulping and flotation processes can allow for
better chemical activity and reduce the dosage of nonionic surfactants required to
achieve the same degree of ink dispersion (22).
Perhaps the most important parameter during deinking is the duration of flotation.
Longer periods of flotation increase ink removal but decrease yield (18). There is a
discrete point at which enough ink has been removed but the yield has not been
jeopardized. Operating at this optimum point is essential to cost-effective, thorough
deinking. By effectively monitoring and controlling the other parameters mentioned, a
deinking operation can minimize the flotation duration required to reach their
brightness targets and thus maximize yield and throughput.
Case Studies and Precedents
A number of pulp and paper mills across North America have undergone projects to
either introduce secondary fiber use in the mill or expand systems already in place. The
mills researched installed pulping, flotation, washing, cleaning, and screening equipment
to process the recycled fiber for appropriate further use. Incentives include reducing
solid waste sent to landfills, reducing energy consumption, and increasing production
capacity. While some mills cite pressure from governmental regulations to use recycled
fiber in their products, most admit that economic factors were the key drivers for their
implementation of deinking. (23)
Internationally, many deinking plants demonstrate impressive results, especially those
producing printing and writing grades. The installation of a Thermo Black Clawson
system at a Sun Paper mill in China has enabled it to use 80% recycled fiber in its
product without problems with dirt specks or stickies (24). Both the Sun Paper mill and
an Aspex Paper Mill in Indonesia use a flotation-dispersion-flotation system, each
achieving exceptional finished stock quality. Developments in the Metso Paper MuSTCell
allow pulp to flow between each aeration stage based on density differences between
the inner and outer sectors, meaning no pumps are required. In addition to energy
savings, better brightness and flotation are possible through careful control of bubble
size, internal flows, reject removal, and air-to-pulp ratio. This high degree of control
allows operators to adjust the deinking system according to changes in the raw material
17
supplied to the plant, which translates to excellent deinking and higher pulp quality.
Similarly, the Voith EcoCell has proven itself invaluable to manufacturers seeking
continuous capacity increases because of its modular design. The simple addition of
multiple cells allows for increases in deinked pulp processing. (25)
Recent deinking plant installation case studies have proven difficult to acquire as many
mills have chosen not to disclose much information about the execution and
performance of their capital projects. However, in the past, mills have been more
generous with their information. Georgia-Pacific installed a flotation deinking facility in
one of their Michigan mills in as early as 1976 (26). The nineties were also a period
during which many North American mills looked to deinking – Boise Paper installed a
deinking mill in Jackson, Alabama and International Paper started up a deinking plant
using proprietary technology in Selma, Alabama (27, 28).
The Kalamazoo, Michigan flotation deinking startup by Georgia-Pacific was one of the
first large-scale North American deinking operations. G-P installed two Voith 55-tpd
deinking lines and started them up in late 1976. Interestingly, Voith was one of the key
suppliers responsible for popularizing flotation deinking in North America (29). Since this
startup nearly four decades ago, the basic concepts behind flotation deinking have
changed little, but the technologies associated with each unit operation have been
vastly improved, allowing significantly better deinking yield and efficiency at a fraction of
the cost and space. (26)
More recently, International Paper spent $325 million on a project including a 400-tpd
deinking plant installation at their Riverdale mill in 1995. At the time, the company
stated that they recognized that an increase in their reprographic paper production
capacity would be required in order for them to remain competitive in that market. The
deinking plant was installed to reduce the amount of bleached kraft market pulp
required to run the two existing machines, producing approximately 1800-tpd uncoated
printing papers containing a fraction of recycled paper. With the capacity added by the
new deinking plant, IP ultimately decided to install a brand new paper machine,
Riverdale 16, rated for 1,090 tpd production at 4,000 fpm. (27)
Just as International Paper was installing significant deinking capabilities and new paper
machine capacity, Boise Paper looked to deinking as a driver of future revenue. Their
Jackson, Alabama deinking plant started up in April of 1995. With added deinking
capacity and the excess virgin pulping capacity available at the Jackson facility, Boise
Paper was able to build a new paper machine, “J3”, to fully utilize its deinking capacity.
Again, the process by which the pulp was deinked was largely the same as it is today. As
mentioned previously, deinking technologies have been significantly improved
throughout the past years, but the general concepts have remained relatively constant.
(28)
18
Scope of Work, Decisions, and Project Options
Much of the information presented in this section was previously discussed in
Deliverable 2. In the interest of brevity, some additional information not included in the
body of this report is included in Appendix A2. Table 5 shows a summary of the decisions
and assumptions made in the process of creating this report.
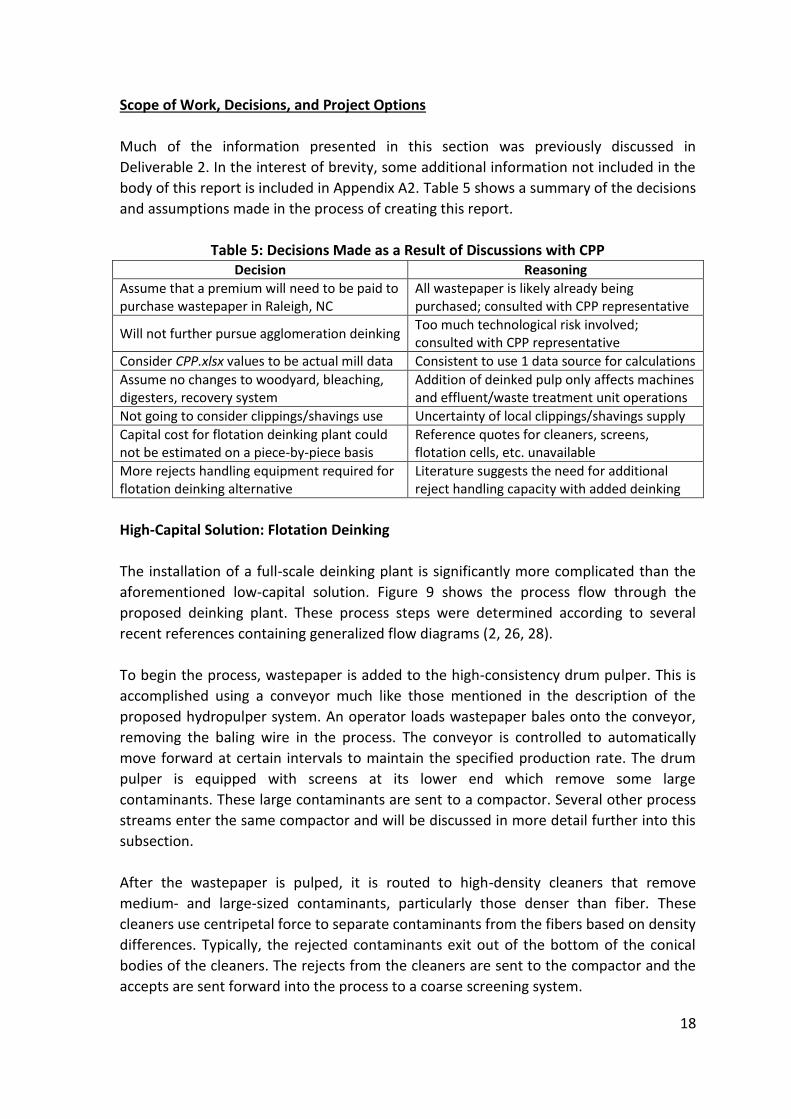
Table 5: Decisions Made as a Result of Discussions with CPP Decision Reasoning
Assume that a premium will need to be paid to purchase wastepaper in Raleigh, NC
All wastepaper is likely already being purchased; consulted with CPP representative
Will not further pursue agglomeration deinking Too much technological risk involved; consulted with CPP representative
Consider CPP.xlsx values to be actual mill data Consistent to use 1 data source for calculations
Assume no changes to woodyard, bleaching, digesters, recovery system
Addition of deinked pulp only affects machines and effluent/waste treatment unit operations
Not going to consider clippings/shavings use Uncertainty of local clippings/shavings supply
Capital cost for flotation deinking plant could not be estimated on a piece-by-piece basis
Reference quotes for cleaners, screens, flotation cells, etc. unavailable
More rejects handling equipment required for flotation deinking alternative
Literature suggests the need for additional reject handling capacity with added deinking
High-Capital Solution: Flotation Deinking
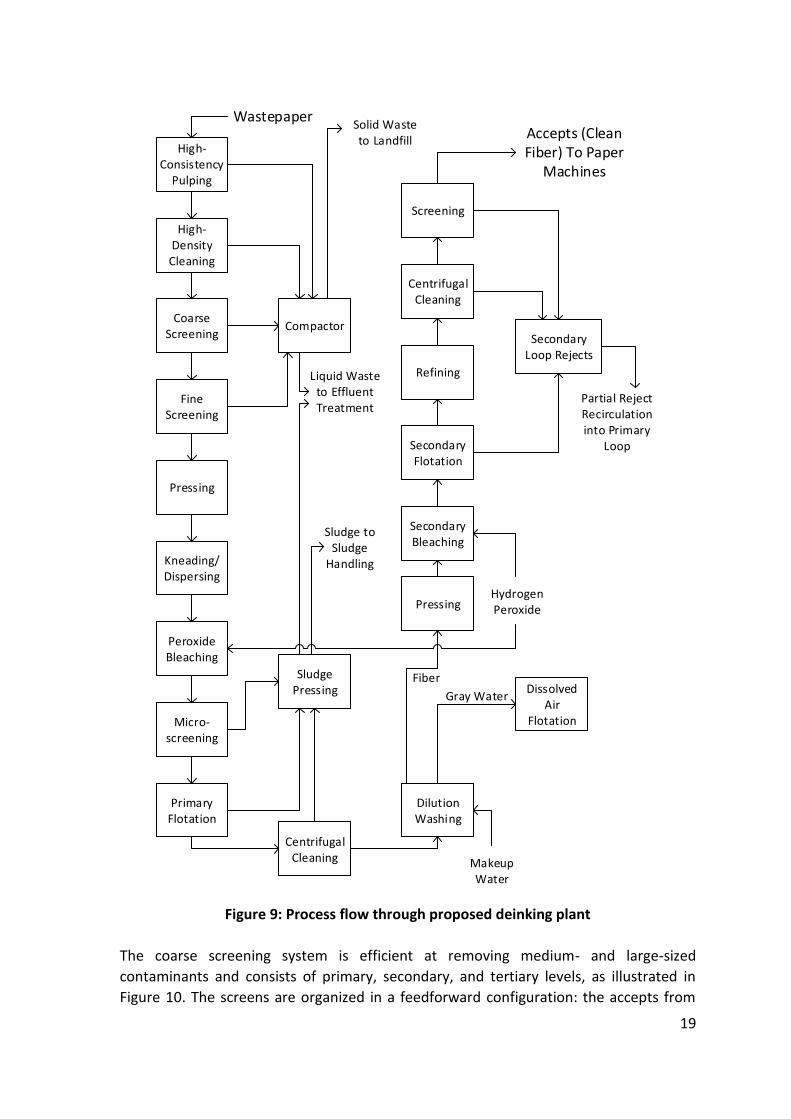
The installation of a full-scale deinking plant is significantly more complicated than the
aforementioned low-capital solution. Figure 9 shows the process flow through the
proposed deinking plant. These process steps were determined according to several
recent references containing generalized flow diagrams (2, 26, 28).
To begin the process, wastepaper is added to the high-consistency drum pulper. This is
accomplished using a conveyor much like those mentioned in the description of the
proposed hydropulper system. An operator loads wastepaper bales onto the conveyor,
removing the baling wire in the process. The conveyor is controlled to automatically
move forward at certain intervals to maintain the specified production rate. The drum
pulper is equipped with screens at its lower end which remove some large
contaminants. These large contaminants are sent to a compactor. Several other process
streams enter the same compactor and will be discussed in more detail further into this
subsection.
After the wastepaper is pulped, it is routed to high-density cleaners that remove
medium- and large-sized contaminants, particularly those denser than fiber. These
cleaners use centripetal force to separate contaminants from the fibers based on density
differences. Typically, the rejected contaminants exit out of the bottom of the conical
bodies of the cleaners. The rejects from the cleaners are sent to the compactor and the
accepts are sent forward into the process to a coarse screening system.
19
High-Consistency
Pulping
High-Density
Cleaning
Coarse Screening
Fine Screening
Pressing
Kneading/ Dispersing
Peroxide Bleaching
Micro-screening
Primary Flotation
Centrifugal Cleaning
Dilution Washing
Pressing
Secondary Bleaching
Secondary Flotation
Refining
Centrifugal Cleaning
Screening
Accepts (Clean Fiber) To Paper
Machines
Wastepaper
Compactor
Liquid Waste to Effluent Treatment
Sludge Pressing
Makeup Water
Solid Waste to Landfill
Sludge to Sludge
Handling
Hydrogen Peroxide
Secondary Loop Rejects
Partial Reject Recirculation into Primary
Loop
Dissolved Air
Flotation
Gray Water
Fiber
Figure 9: Process flow through proposed deinking plant
The coarse screening system is efficient at removing medium- and large-sized
contaminants and consists of primary, secondary, and tertiary levels, as illustrated in
Figure 10. The screens are organized in a feedforward configuration: the accepts from
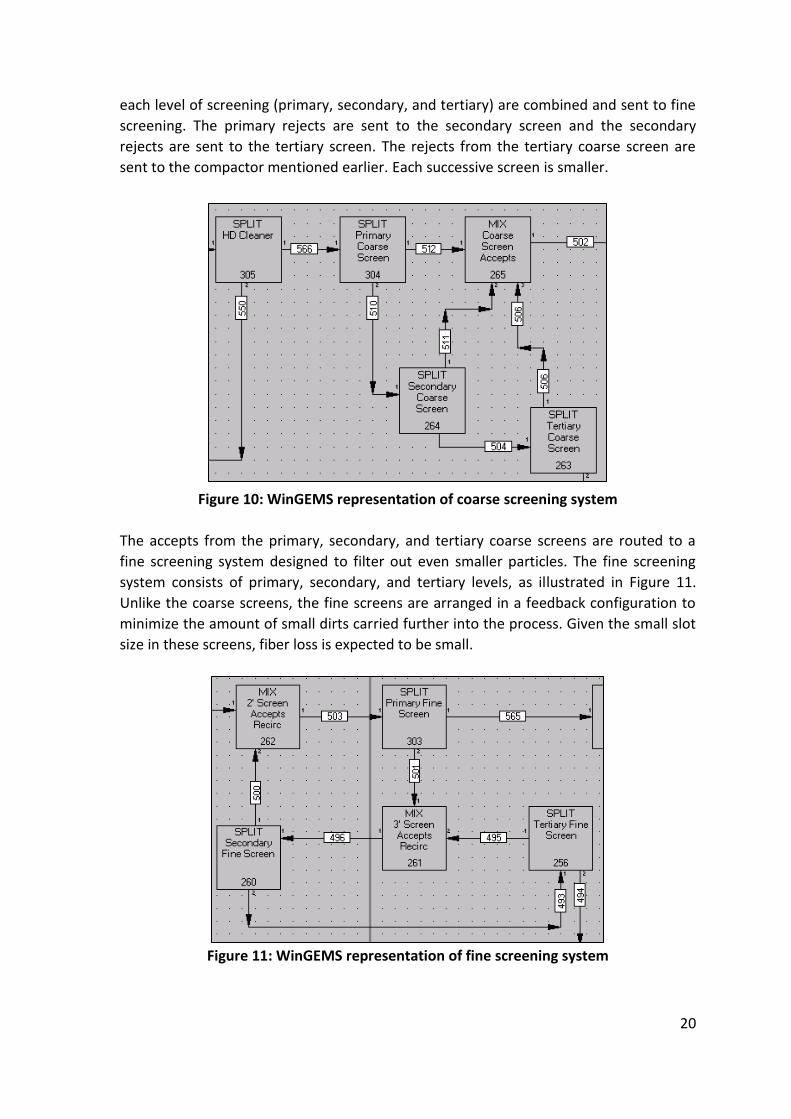
20
each level of screening (primary, secondary, and tertiary) are combined and sent to fine
screening. The primary rejects are sent to the secondary screen and the secondary
rejects are sent to the tertiary screen. The rejects from the tertiary coarse screen are
sent to the compactor mentioned earlier. Each successive screen is smaller.
Figure 10: WinGEMS representation of coarse screening system
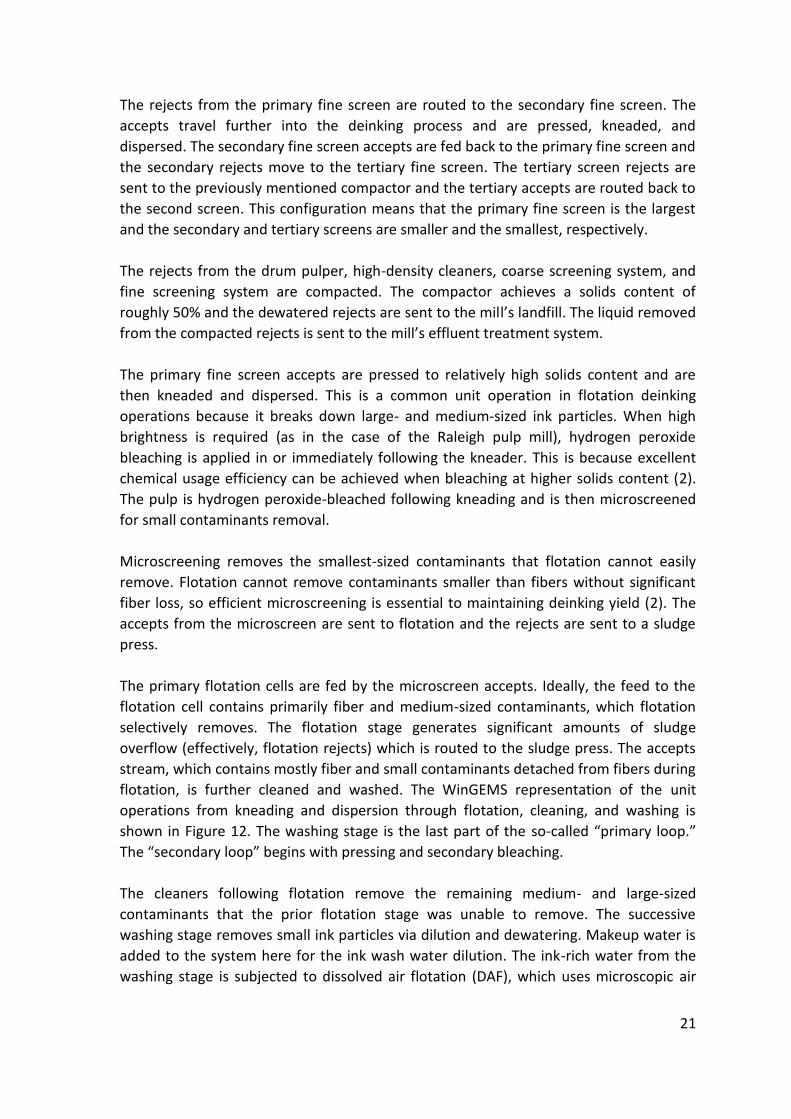
The accepts from the primary, secondary, and tertiary coarse screens are routed to a
fine screening system designed to filter out even smaller particles. The fine screening
system consists of primary, secondary, and tertiary levels, as illustrated in Figure 11.
Unlike the coarse screens, the fine screens are arranged in a feedback configuration to
minimize the amount of small dirts carried further into the process. Given the small slot
size in these screens, fiber loss is expected to be small.
Figure 11: WinGEMS representation of fine screening system
21
The rejects from the primary fine screen are routed to the secondary fine screen. The
accepts travel further into the deinking process and are pressed, kneaded, and
dispersed. The secondary fine screen accepts are fed back to the primary fine screen and
the secondary rejects move to the tertiary fine screen. The tertiary screen rejects are
sent to the previously mentioned compactor and the tertiary accepts are routed back to
the second screen. This configuration means that the primary fine screen is the largest
and the secondary and tertiary screens are smaller and the smallest, respectively.
The rejects from the drum pulper, high-density cleaners, coarse screening system, and
fine screening system are compacted. The compactor achieves a solids content of
roughly 50% and the dewatered rejects are sent to the mill’s landfill. The liquid removed
from the compacted rejects is sent to the mill’s effluent treatment system.
The primary fine screen accepts are pressed to relatively high solids content and are
then kneaded and dispersed. This is a common unit operation in flotation deinking
operations because it breaks down large- and medium-sized ink particles. When high
brightness is required (as in the case of the Raleigh pulp mill), hydrogen peroxide
bleaching is applied in or immediately following the kneader. This is because excellent
chemical usage efficiency can be achieved when bleaching at higher solids content (2).
The pulp is hydrogen peroxide-bleached following kneading and is then microscreened
for small contaminants removal.
Microscreening removes the smallest-sized contaminants that flotation cannot easily
remove. Flotation cannot remove contaminants smaller than fibers without significant
fiber loss, so efficient microscreening is essential to maintaining deinking yield (2). The
accepts from the microscreen are sent to flotation and the rejects are sent to a sludge
press.
The primary flotation cells are fed by the microscreen accepts. Ideally, the feed to the
flotation cell contains primarily fiber and medium-sized contaminants, which flotation
selectively removes. The flotation stage generates significant amounts of sludge
overflow (effectively, flotation rejects) which is routed to the sludge press. The accepts
stream, which contains mostly fiber and small contaminants detached from fibers during
flotation, is further cleaned and washed. The WinGEMS representation of the unit
operations from kneading and dispersion through flotation, cleaning, and washing is
shown in Figure 12. The washing stage is the last part of the so-called “primary loop.”
The “secondary loop” begins with pressing and secondary bleaching.
The cleaners following flotation remove the remaining medium- and large-sized
contaminants that the prior flotation stage was unable to remove. The successive
washing stage removes small ink particles via dilution and dewatering. Makeup water is
added to the system here for the ink wash water dilution. The ink-rich water from the
washing stage is subjected to dissolved air flotation (DAF), which uses microscopic air
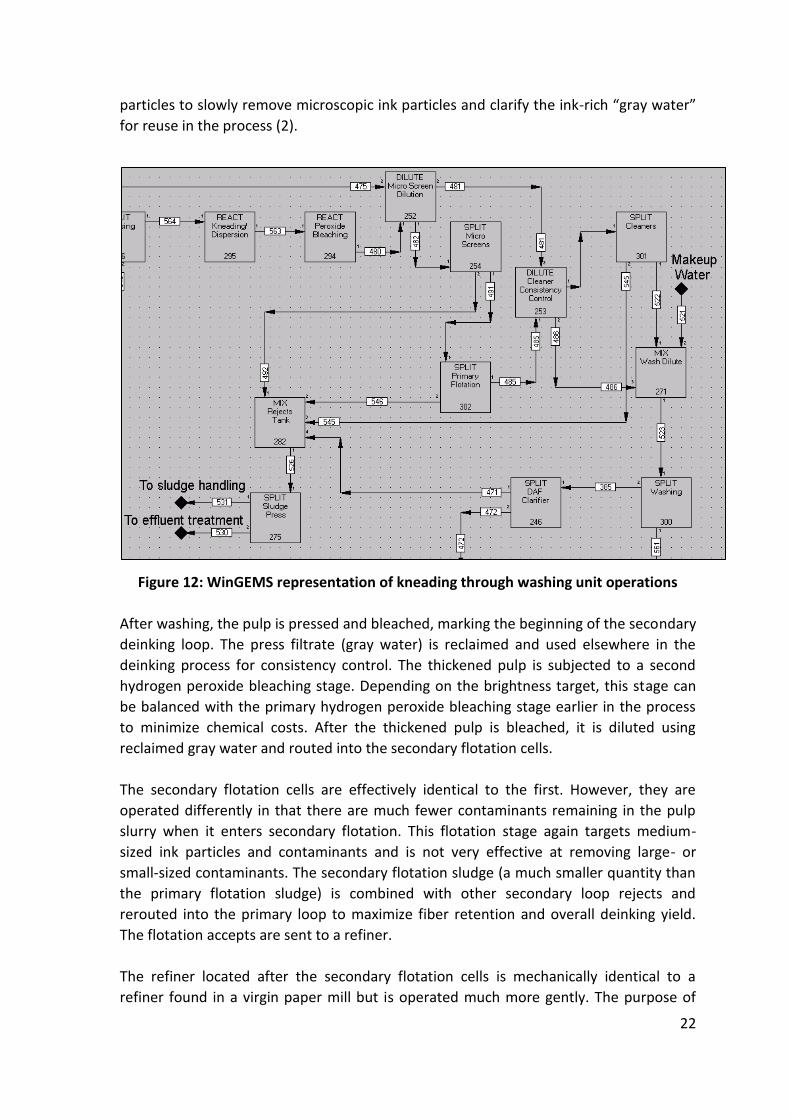
22
particles to slowly remove microscopic ink particles and clarify the ink-rich “gray water”
for reuse in the process (2).
Figure 12: WinGEMS representation of kneading through washing unit operations
After washing, the pulp is pressed and bleached, marking the beginning of the secondary
deinking loop. The press filtrate (gray water) is reclaimed and used elsewhere in the
deinking process for consistency control. The thickened pulp is subjected to a second
hydrogen peroxide bleaching stage. Depending on the brightness target, this stage can
be balanced with the primary hydrogen peroxide bleaching stage earlier in the process
to minimize chemical costs. After the thickened pulp is bleached, it is diluted using
reclaimed gray water and routed into the secondary flotation cells.
The secondary flotation cells are effectively identical to the first. However, they are
operated differently in that there are much fewer contaminants remaining in the pulp
slurry when it enters secondary flotation. This flotation stage again targets medium-
sized ink particles and contaminants and is not very effective at removing large- or
small-sized contaminants. The secondary flotation sludge (a much smaller quantity than
the primary flotation sludge) is combined with other secondary loop rejects and
rerouted into the primary loop to maximize fiber retention and overall deinking yield.
The flotation accepts are sent to a refiner.
The refiner located after the secondary flotation cells is mechanically identical to a
refiner found in a virgin paper mill but is operated much more gently. The purpose of
23
this refiner is to break up fiber flocs and grind residual large- and medium-sized
contaminants into smaller ones rather than to introduce fibrillation. After refining, the
pulp slurry is routed to a final cleaner bank and screen before it is sent to storage.
The secondary loop cleaners are, much like the previously described cleaners, designed
to remove medium- and small-sized contaminants from the pulp slurry before it is
routed to storage and mixed into the two machine chests. The rejects are combined
with the secondary flotation rejects and rerouted to the primary deinking loop. The
accepts are sent forward to the final dirt removal stage in the deinking plant.
The dirt removal in the deinking plant is performed by a set of screens. These screens
provide a final effort to remove large contaminants remaining in the pulp slurry. The
pulp is relatively clean at this point in the process, so the screens are somewhat of a
precautionary unit operation. The main contaminants that may still be present in the
pulp at this point are stickies, which can extrude through screen openings and are
difficult to remove in flotation and centrifugal cleaning steps because their density is
similar to that of water. These contaminants can create troublesome deposits further
downstream if they are not efficiently removed (10). Secondary loop screening rejects
are partially rerouted to the primary deinking loop to maximize deinking yield.
Secondary loop screening accepts are sent to deinked pulp storage, from which the
deinked pulp is appropriately proportioned and added to the respective machine chests
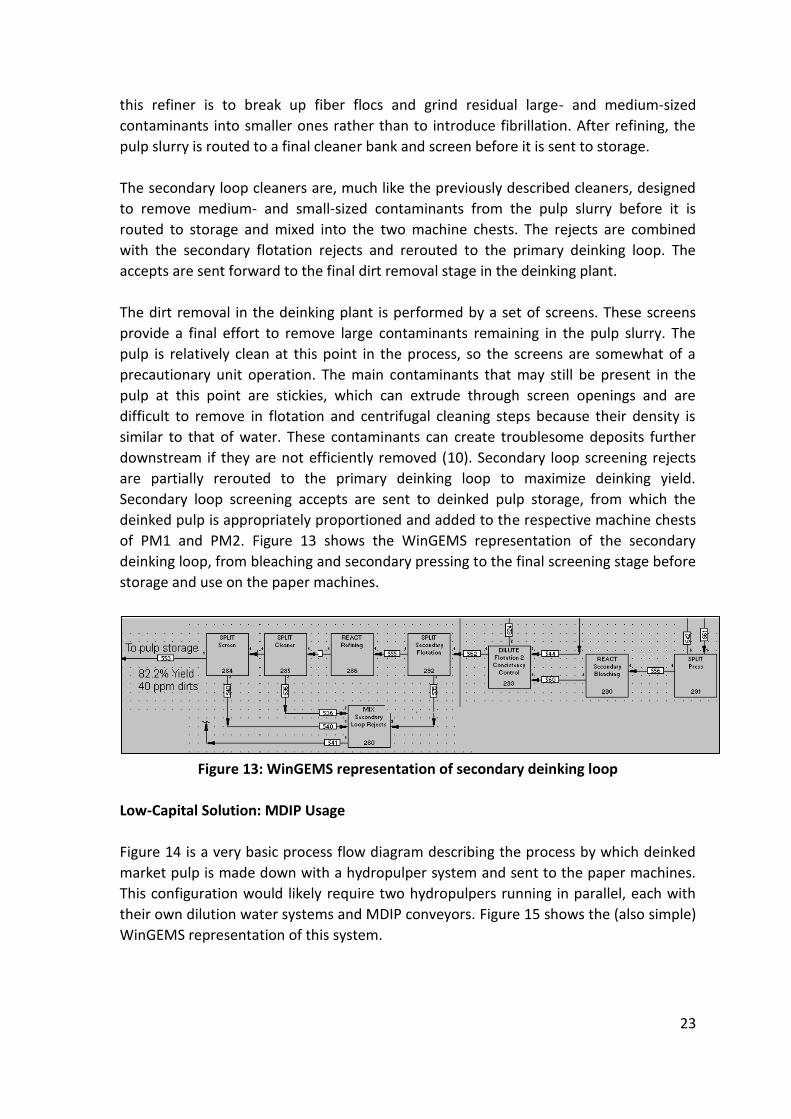
of PM1 and PM2. Figure 13 shows the WinGEMS representation of the secondary
deinking loop, from bleaching and secondary pressing to the final screening stage before
storage and use on the paper machines.
Figure 13: WinGEMS representation of secondary deinking loop
Low-Capital Solution: MDIP Usage
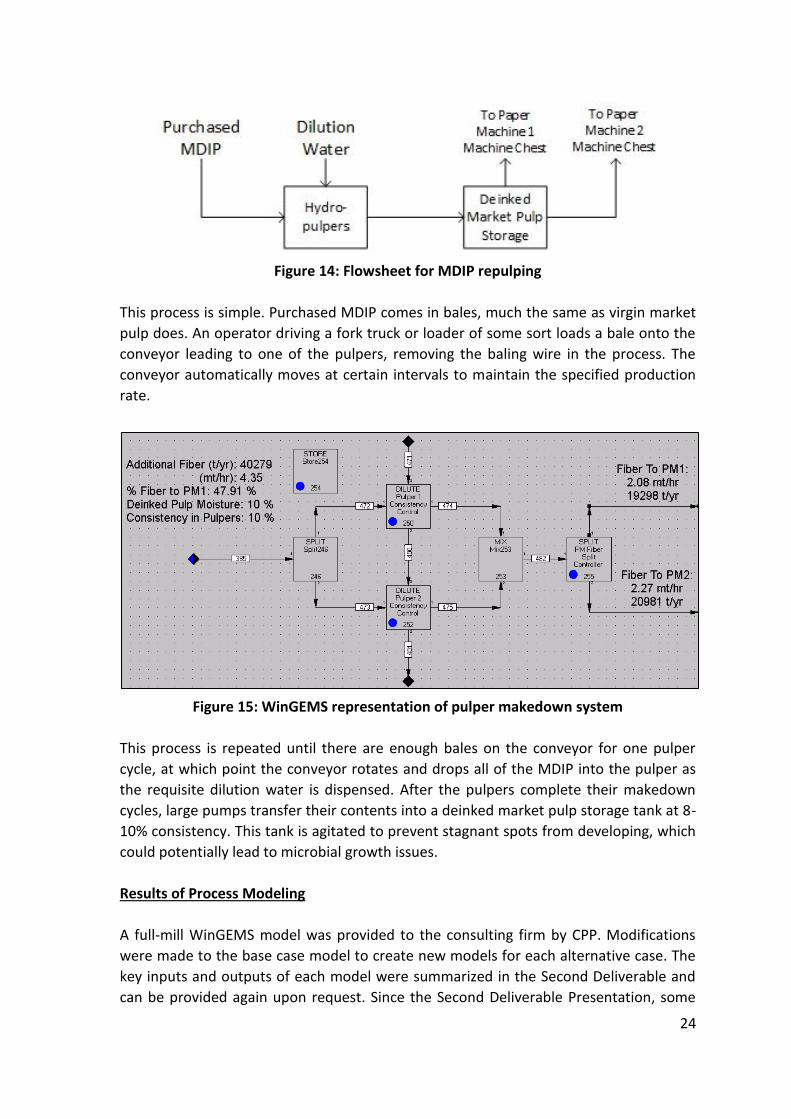
Figure 14 is a very basic process flow diagram describing the process by which deinked
market pulp is made down with a hydropulper system and sent to the paper machines.
This configuration would likely require two hydropulpers running in parallel, each with
their own dilution water systems and MDIP conveyors. Figure 15 shows the (also simple)
WinGEMS representation of this system.
24
Figure 14: Flowsheet for MDIP repulping
This process is simple. Purchased MDIP comes in bales, much the same as virgin market
pulp does. An operator driving a fork truck or loader of some sort loads a bale onto the
conveyor leading to one of the pulpers, removing the baling wire in the process. The
conveyor automatically moves at certain intervals to maintain the specified production
rate.
Figure 15: WinGEMS representation of pulper makedown system
This process is repeated until there are enough bales on the conveyor for one pulper
cycle, at which point the conveyor rotates and drops all of the MDIP into the pulper as
the requisite dilution water is dispensed. After the pulpers complete their makedown
cycles, large pumps transfer their contents into a deinked market pulp storage tank at 8-
10% consistency. This tank is agitated to prevent stagnant spots from developing, which
could potentially lead to microbial growth issues.
Results of Process Modeling
A full-mill WinGEMS model was provided to the consulting firm by CPP. Modifications
were made to the base case model to create new models for each alternative case. The
key inputs and outputs of each model were summarized in the Second Deliverable and
can be provided again upon request. Since the Second Deliverable Presentation, some
25
changes have been made to the WinGEMS models and corresponding analysis as per
data kindly provided by an industry representative (30).
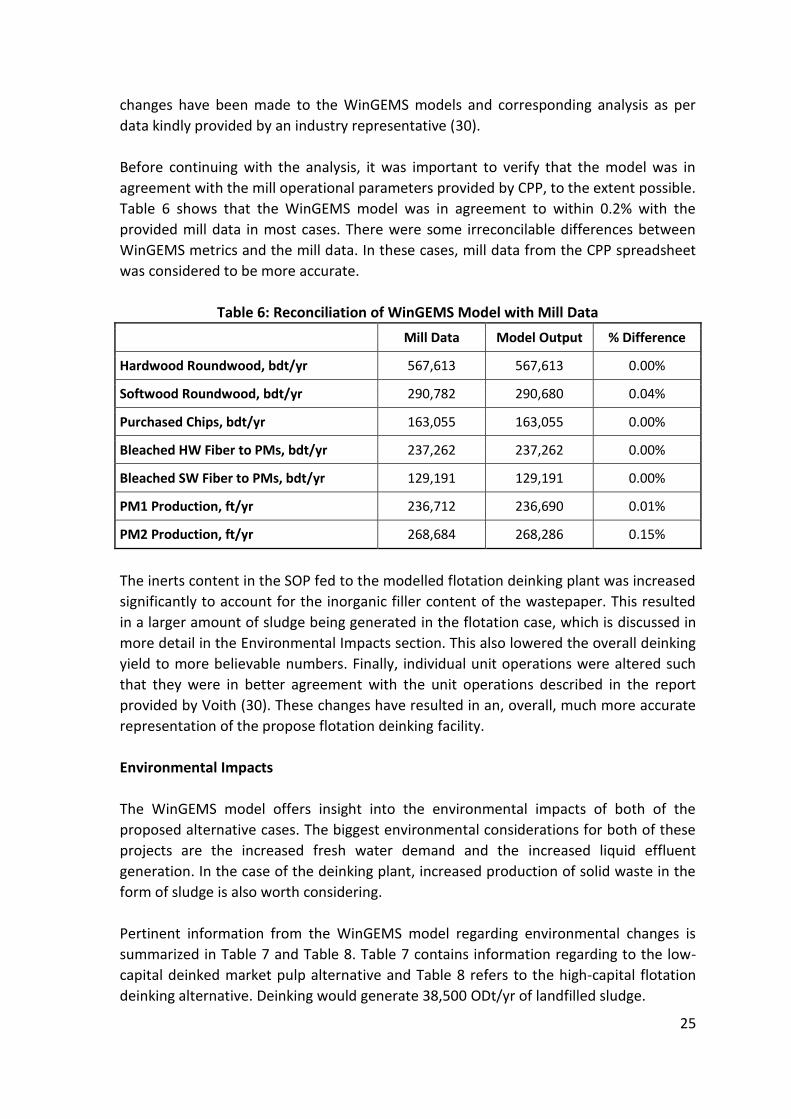
Before continuing with the analysis, it was important to verify that the model was in
agreement with the mill operational parameters provided by CPP, to the extent possible.
Table 6 shows that the WinGEMS model was in agreement to within 0.2% with the
provided mill data in most cases. There were some irreconcilable differences between
WinGEMS metrics and the mill data. In these cases, mill data from the CPP spreadsheet
was considered to be more accurate.
Table 6: Reconciliation of WinGEMS Model with Mill Data
Mill Data Model Output % Difference
Hardwood Roundwood, bdt/yr 567,613 567,613 0.00%
Softwood Roundwood, bdt/yr 290,782 290,680 0.04%
Purchased Chips, bdt/yr 163,055 163,055 0.00%
Bleached HW Fiber to PMs, bdt/yr 237,262 237,262 0.00%
Bleached SW Fiber to PMs, bdt/yr 129,191 129,191 0.00%
PM1 Production, ft/yr 236,712 236,690 0.01%
PM2 Production, ft/yr 268,684 268,286 0.15%
The inerts content in the SOP fed to the modelled flotation deinking plant was increased
significantly to account for the inorganic filler content of the wastepaper. This resulted
in a larger amount of sludge being generated in the flotation case, which is discussed in
more detail in the Environmental Impacts section. This also lowered the overall deinking
yield to more believable numbers. Finally, individual unit operations were altered such
that they were in better agreement with the unit operations described in the report
provided by Voith (30). These changes have resulted in an, overall, much more accurate
representation of the propose flotation deinking facility.
Environmental Impacts
The WinGEMS model offers insight into the environmental impacts of both of the
proposed alternative cases. The biggest environmental considerations for both of these
projects are the increased fresh water demand and the increased liquid effluent
generation. In the case of the deinking plant, increased production of solid waste in the
form of sludge is also worth considering.
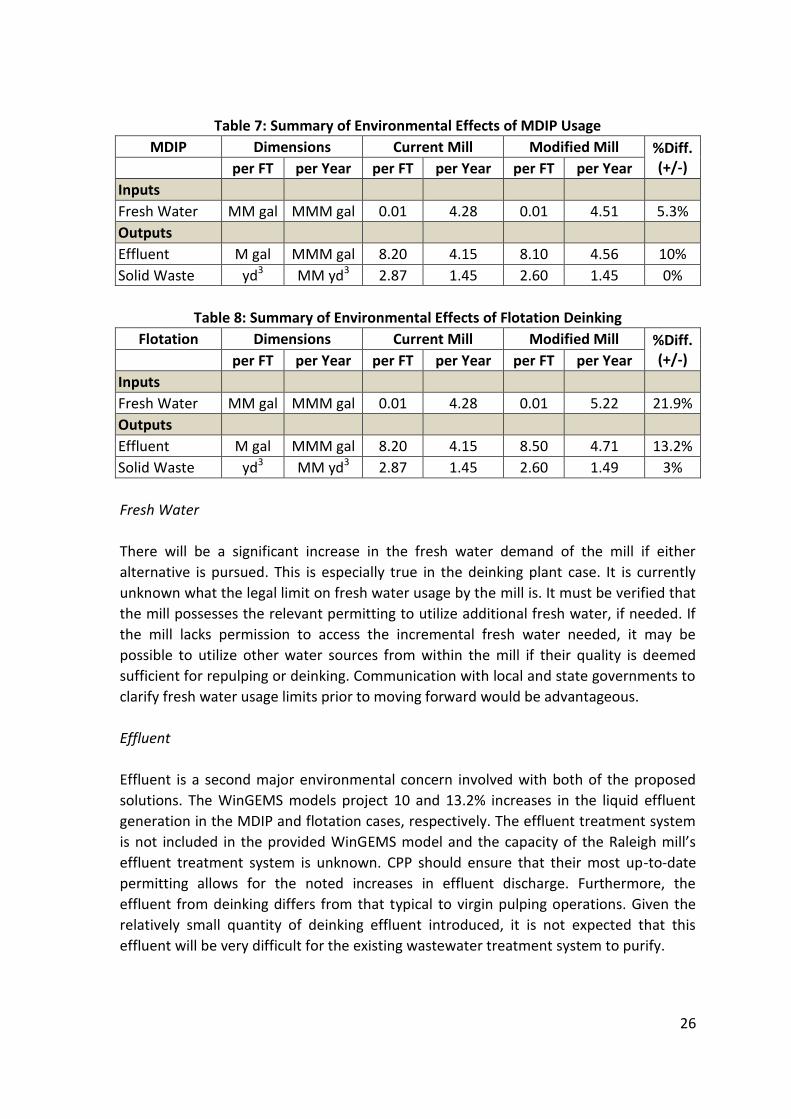
Pertinent information from the WinGEMS model regarding environmental changes is
summarized in Table 7 and Table 8. Table 7 contains information regarding to the low-
capital deinked market pulp alternative and Table 8 refers to the high-capital flotation
deinking alternative. Deinking would generate 38,500 ODt/yr of landfilled sludge.
26
Table 7: Summary of Environmental Effects of MDIP Usage
MDIP Dimensions Current Mill Modified Mill %Diff. (+/-) per FT per Year per FT per Year per FT per Year
Inputs
Fresh Water MM gal MMM gal 0.01 4.28 0.01 4.51 5.3%
Outputs
Effluent M gal MMM gal 8.20 4.15 8.10 4.56 10%
Solid Waste yd3 MM yd3 2.87 1.45 2.60 1.45 0%
Table 8: Summary of Environmental Effects of Flotation Deinking
Flotation Dimensions Current Mill Modified Mill %Diff. (+/-) per FT per Year per FT per Year per FT per Year
Inputs
Fresh Water MM gal MMM gal 0.01 4.28 0.01 5.22 21.9%
Outputs
Effluent M gal MMM gal 8.20 4.15 8.50 4.71 13.2%
Solid Waste yd3 MM yd3 2.87 1.45 2.60 1.49 3%
Fresh Water
There will be a significant increase in the fresh water demand of the mill if either
alternative is pursued. This is especially true in the deinking plant case. It is currently
unknown what the legal limit on fresh water usage by the mill is. It must be verified that
the mill possesses the relevant permitting to utilize additional fresh water, if needed. If
the mill lacks permission to access the incremental fresh water needed, it may be
possible to utilize other water sources from within the mill if their quality is deemed
sufficient for repulping or deinking. Communication with local and state governments to
clarify fresh water usage limits prior to moving forward would be advantageous.
Effluent
Effluent is a second major environmental concern involved with both of the proposed
solutions. The WinGEMS models project 10 and 13.2% increases in the liquid effluent
generation in the MDIP and flotation cases, respectively. The effluent treatment system
is not included in the provided WinGEMS model and the capacity of the Raleigh mill’s
effluent treatment system is unknown. CPP should ensure that their most up-to-date
permitting allows for the noted increases in effluent discharge. Furthermore, the
effluent from deinking differs from that typical to virgin pulping operations. Given the
relatively small quantity of deinking effluent introduced, it is not expected that this
effluent will be very difficult for the existing wastewater treatment system to purify.
27
Solid Waste
There will be an increase in solid waste production in the case of flotation deinking. The
increase in solid waste generation cited in Table 8 is significant. This waste will likely
have to be landfilled or shipped to nearby municipal landfill facilities, depending on the
mill’s solids disposal capabilities. Some alternatives to landfilling were discussed in the
Effects of Flotation Deinking on Solid Waste and Wastewater Treatment section found in
Appendix A2. In addition to sludge, trash from the pulper, high-density cleaners, and
screens will have to be disposed of. These two refuse streams combined represent
around 20,000 OD tons per year of solid waste, based on the WinGEMS model, an
increase of 38,500 total tons per year over the base case.
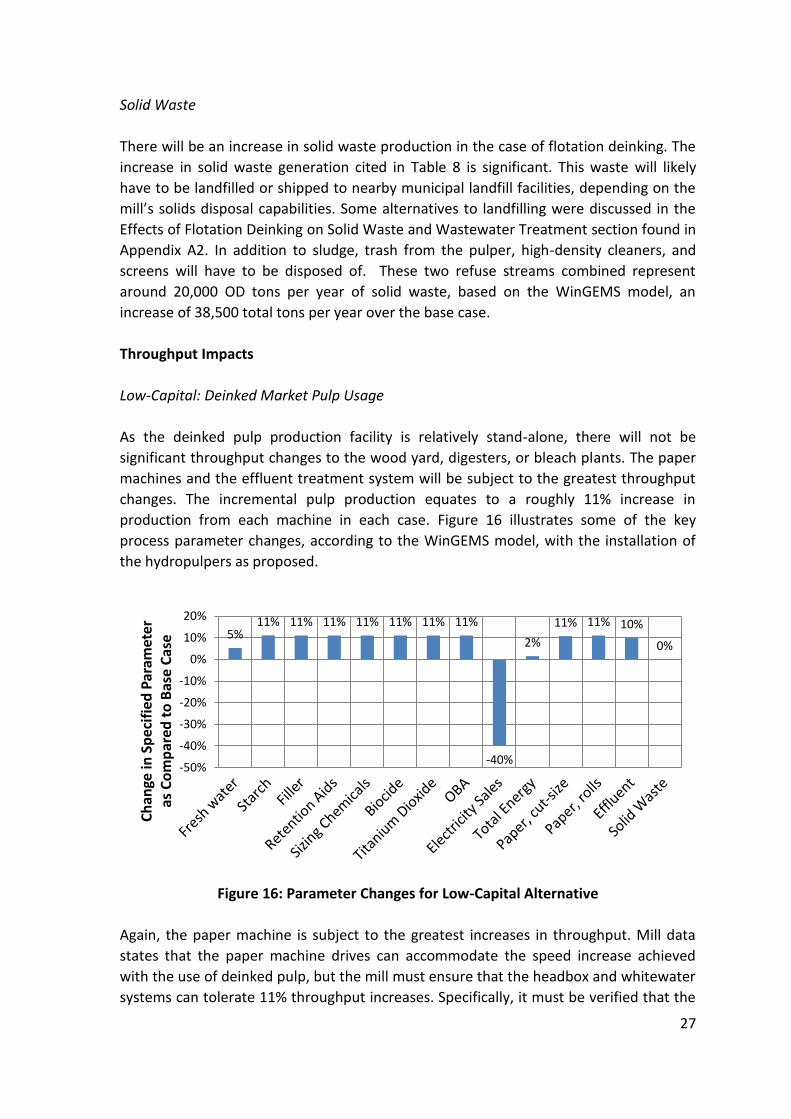
Throughput Impacts
Low-Capital: Deinked Market Pulp Usage
As the deinked pulp production facility is relatively stand-alone, there will not be
significant throughput changes to the wood yard, digesters, or bleach plants. The paper
machines and the effluent treatment system will be subject to the greatest throughput
changes. The incremental pulp production equates to a roughly 11% increase in
production from each machine in each case. Figure 16 illustrates some of the key
process parameter changes, according to the WinGEMS model, with the installation of
the hydropulpers as proposed.
Figure 16: Parameter Changes for Low-Capital Alternative
Again, the paper machine is subject to the greatest increases in throughput. Mill data
states that the paper machine drives can accommodate the speed increase achieved
with the use of deinked pulp, but the mill must ensure that the headbox and whitewater
systems can tolerate 11% throughput increases. Specifically, it must be verified that the
5% 11% 11% 11% 11% 11% 11% 11%
-40%
2%
11% 11% 10%
0%
-50%
-40%
-30%
-20%
-10%
0%
10%
20%
Ch
ange
in S
pec
ifie
d P
aram
eter
as
Co
mp
ared
to
Bas
e C
ase
28
headbox can dispense the additional pulp without adverse effects on formation,
drainage, or wet web strength. This could be achieved with a mill trial.
The mill must do a trial to determine if the presses can achieve the same solids level
without overly densifying or crushing the sheet. If the presses are not able to achieve
the same solids without adversely affecting sheet quality, the proposed change will not
be possible as it is described.
There will be increased demand for steam by the dryers with greater production. It must
be verified that the mill’s multi-stage extraction turbines can provide enough additional
steam to meet the increased drying demand. The energy used to dry the incremental
tons and the energy required to run the new pulpers, unfortunately, will significantly
decrease excess power generation by the mill, decreasing energy sales by around 40%.
Increased liquid effluent generation is expected with increased paper production. The
WinGEMS model indicates a roughly 10% increase in the amount of liquid effluent
generated by the mill. Before moving forward, it must be verified that the Raleigh mill
has adequate wastewater treatment capacity to handle a 10% increase in effluent
discharge. It is not expected that solid waste treatment will be adversely affected
because it was assumed that the deinked market pulp purchased would be used as-is.
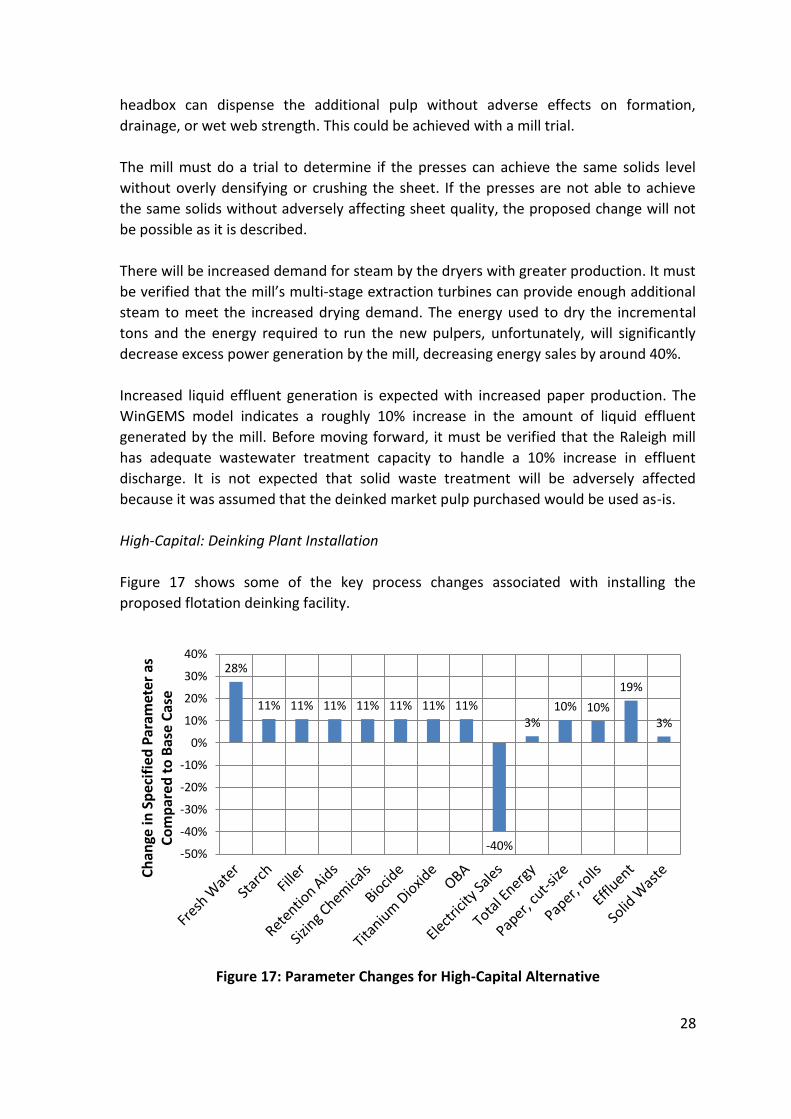
High-Capital: Deinking Plant Installation
Figure 17 shows some of the key process changes associated with installing the
proposed flotation deinking facility.
Figure 17: Parameter Changes for High-Capital Alternative
28%
11% 11% 11% 11% 11% 11% 11%
-40%
3% 10% 10%
19%
3%
-50%
-40%
-30%
-20%
-10%
0%
10%
20%
30%
40%
Ch
ange
in S
pec
ifie
d P
aram
eter
as
Co
mp
ared
to
Bas
e C
ase
29
Again, the paper machine throughput will increase by roughly 11%, so the mill must
verify that the PM1 and PM2 headboxes, presses, and the dryer steam generation
system have enough excess capacity to handle the proposed incremental production.
In terms of throughput, one key difference between the high-capital and low-capital
alternatives is the additional solid waste generation from the flotation deinking plant.
Although the WinGEMS model indicates that solid waste generation will only increase by
3%, this waste must be landfilled. The Raleigh team must make sure that their solid
waste treatment systems can handle the added waste. It is theoretically possible that
the sludge from flotation could be incinerated, but this would likely require additional
capital to prevent excessive boiler tube scaling and fouling, so it was conservatively
assumed that the waste would be landfilled.
Running a flotation deinking plant requires a lot of water, so the mill fresh water usage is
estimated to increase by approximately 22%. Although there is not a large cost
associated with this extra water usage, a throughput increase this significant should not
be overlooked. It is possible that excess whitewater or other relatively clean effluent
streams from elsewhere in the mill could be used instead of fresh water in the deinking
plant, but it was conservatively assumed that fresh water will be required.
Quality Impacts
Using recycled fiber will affect the quality of the final product sold to customers in
several ways. The primary quality considerations made in this report are with respect to
the sheet strength, runnability on the machines, and the optical properties of the sheet.
Each of these are typically affected by the inclusion of deinked pulp in the furnish, but
unfortunately, cannot easily be quantitatively modeled using WinGEMS.
Strength
With increased dirts and other contaminants content stemming from the use of recycled
fiber, inter-fiber bonding will be diminished. Bonding strength will also decrease due to
the irreversible hornification that recycled fibers have undergone. This influences both
machine runnability (discussed more in the following subsection) and the end uses of
the sheet itself. For example, uncoated free sheet in roll form requires excellent tensile
strength or it will be susceptible to breaks during offset printing operations, which often
run at very high speeds. Cut-size sheets are also subject to substantial tensile stresses
inside of printers and copy machines, and poor strength and curl properties can cause
tearing and jamming in these applications as well.
There are numerous chemicals available to offset the potential decreases in strength.
Careful evaluation of the mill’s wet-end chemistry could help to determine the
appropriate strength aids to apply, if any. Unfortunately, it will be difficult to predict
30
exactly how much strength loss will be associated with the use of deinked fiber because
there is no good way to run a machine-scale trial with deinked pulp.
Runnability
Paper machine runnability will suffer as a result of recycled fiber usage in the sheet.
Including deinked pulp in the furnish will reduce the strength of the web on the wet end
of the machine, causing more frequent breaks and reducing availability. More stickies
and deposits should also be expected. The anticipated decrease in availability was
accounted for in the WinGEMS model by increasing production losses due to breaks by
2%. Given the nonhomogeneous nature of recycled paper, it is unlikely that these breaks
will be consistent, so the mill should be prepared for relatively unexpected breaks in the
event that particularly contaminated wastepaper is introduced into the process. This
issue could largely be alleviated by adequate monitoring of the quality (i.e., the
approximate stickies and dirts contents) of the recovered paper being introduced into
the deinking plant. In addition, detackifiers like talc could prove useful for the mill, by
eliminating deposits and stickies, in the event that breaks become an issue. If microbial
growth becomes a problem, the mill could also increase the dosage of biocide on the
paper machine.
Accurate tracking of breaks, with comparison to the quality of the recycled material,
should be maintained if a deinking plant is installed. Correlations between recycled
material properties and break frequency will allow CPP process engineers to better
predict when and why breaks will occur.
Optical Properties
Another point of concern is the dirts content in the post-consumer waste-containing
sheet. It is uncertain to what degree this will affect the optical properties of the final
sheet. The dirts content in the sheet will undoubtedly increase, but the WinGEMS model
indicates that it will be by only a few parts per million. It is essential that customers are
made aware of the change in the furnish in advance and that the mill closely monitors
the brightness of the sheet when deinked pulp is introduced.
It is likely that the final sheet brightness will decrease as a result of the increased dirts
content. If this becomes problematic, the mill can dose more titanium dioxide or optical
brightening agent (OBA) to counteract some of the brightness loss. Accurate prediction
of the brightness with the incorporation of deinked pulp has proven difficult, but the
consulting firm does not expect any major brightness decrease at the given sheet dirts
content. The mill must bear in mind the fact that the WinGEMS model cannot be used to
quantitatively model brightness.
31
Economic Evaluation
Capital Cost Estimation
Low-Capital Solution: MDIP Usage
Estimating the capital cost of the MDIP usage project was relatively simple given that
there were very few pieces of equipment involved. Table 9 shows the expected
delivered costs for the equipment associated with the proposed low-capital solution,
each estimated using the Peters and Timmerhaus online tool (31).
Table 9: Equipment List with Delivered Costs for Low-Capital Alternative (31)
Eq. # Quantity Description Deliv.
Cost ($)
1 2 Wastepaper Conveyors into Pulpers, 40 m 297,000
2 2 Pulper Dilution Water Pumps, 3000 gpm 29,000
3 2 Hydropulper, 10000 gal, ~1000 AD lb batches every 15 min 220,000
4 2 Pulper Discharge Pumps, 3000 gpm 33,000
5 1 Repulped MDIP Storage Tank, 40000 gal 56,000
TOTAL 635,000
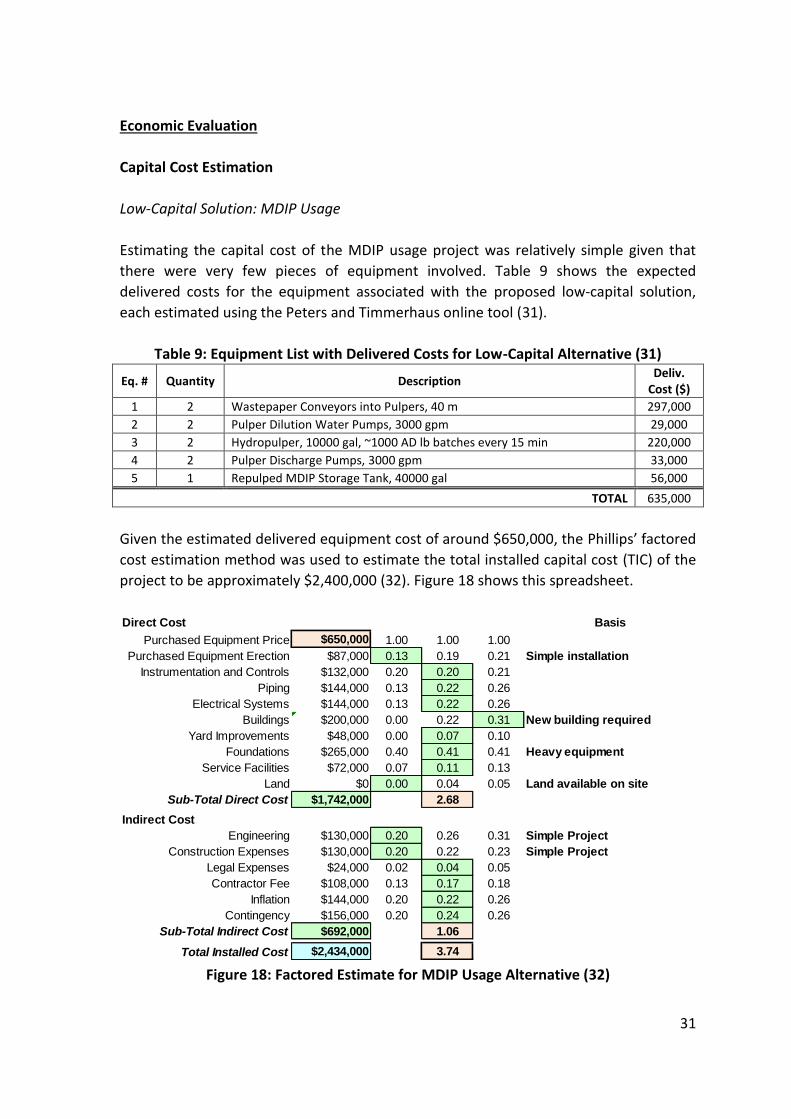
Given the estimated delivered equipment cost of around $650,000, the Phillips’ factored
cost estimation method was used to estimate the total installed capital cost (TIC) of the
project to be approximately $2,400,000 (32). Figure 18 shows this spreadsheet.
Figure 18: Factored Estimate for MDIP Usage Alternative (32)
Direct Cost Basis
Purchased Equipment Price $650,000 1.00 1.00 1.00
Purchased Equipment Erection $87,000 0.13 0.19 0.21 Simple installation
Instrumentation and Controls $132,000 0.20 0.20 0.21
Piping $144,000 0.13 0.22 0.26
Electrical Systems $144,000 0.13 0.22 0.26
Buildings $200,000 0.00 0.22 0.31 New building required
Yard Improvements $48,000 0.00 0.07 0.10
Foundations $265,000 0.40 0.41 0.41 Heavy equipment
Service Facilities $72,000 0.07 0.11 0.13
Land $0 0.00 0.04 0.05 Land available on site
Sub-Total Direct Cost $1,742,000 2.68
Indirect Cost
Engineering $130,000 0.20 0.26 0.31 Simple Project
Construction Expenses $130,000 0.20 0.22 0.23 Simple Project
Legal Expenses $24,000 0.02 0.04 0.05
Contractor Fee $108,000 0.13 0.17 0.18
Inflation $144,000 0.20 0.22 0.26
Contingency $156,000 0.20 0.24 0.26
Sub-Total Indirect Cost $692,000 1.06
Total Installed Cost $2,434,000 3.74
32
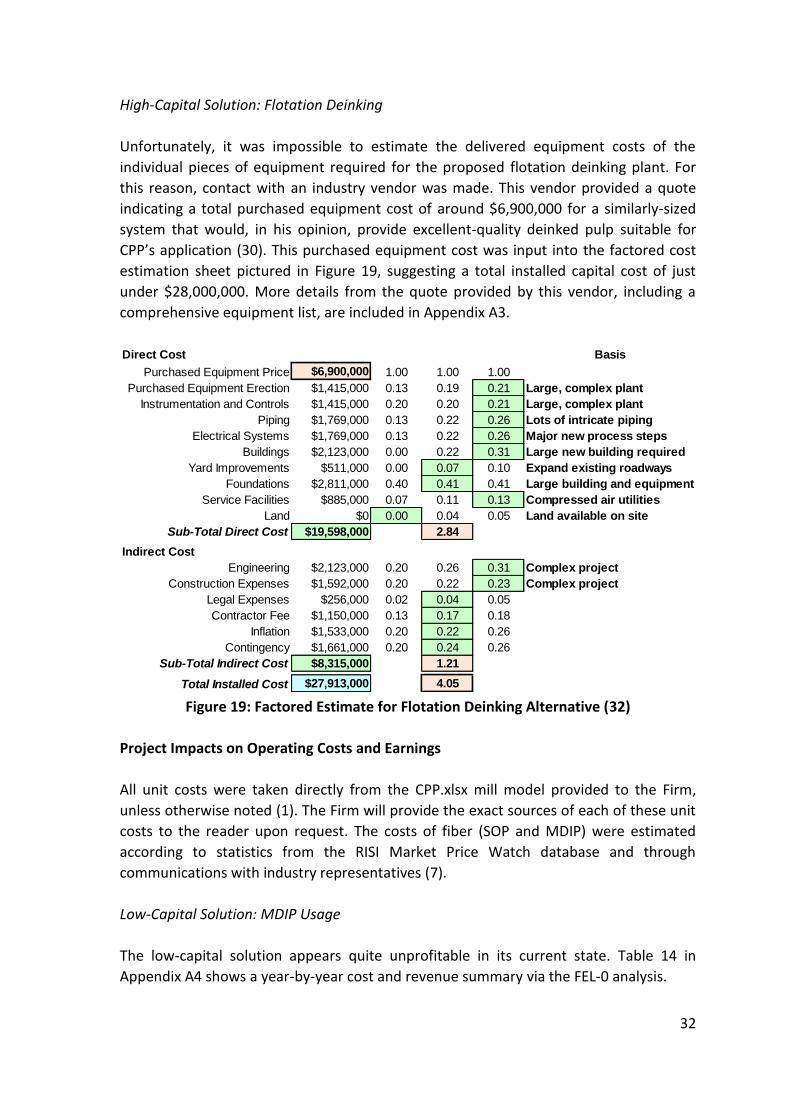
High-Capital Solution: Flotation Deinking
Unfortunately, it was impossible to estimate the delivered equipment costs of the
individual pieces of equipment required for the proposed flotation deinking plant. For
this reason, contact with an industry vendor was made. This vendor provided a quote
indicating a total purchased equipment cost of around $6,900,000 for a similarly-sized
system that would, in his opinion, provide excellent-quality deinked pulp suitable for
CPP’s application (30). This purchased equipment cost was input into the factored cost
estimation sheet pictured in Figure 19, suggesting a total installed capital cost of just
under $28,000,000. More details from the quote provided by this vendor, including a
comprehensive equipment list, are included in Appendix A3.
Figure 19: Factored Estimate for Flotation Deinking Alternative (32)
Project Impacts on Operating Costs and Earnings
All unit costs were taken directly from the CPP.xlsx mill model provided to the Firm,
unless otherwise noted (1). The Firm will provide the exact sources of each of these unit
costs to the reader upon request. The costs of fiber (SOP and MDIP) were estimated
according to statistics from the RISI Market Price Watch database and through
communications with industry representatives (7).
Low-Capital Solution: MDIP Usage
The low-capital solution appears quite unprofitable in its current state. Table 14 in
Appendix A4 shows a year-by-year cost and revenue summary via the FEL-0 analysis.
Direct Cost Basis
Purchased Equipment Price $6,900,000 1.00 1.00 1.00
Purchased Equipment Erection $1,415,000 0.13 0.19 0.21 Large, complex plant
Instrumentation and Controls $1,415,000 0.20 0.20 0.21 Large, complex plant
Piping $1,769,000 0.13 0.22 0.26 Lots of intricate piping
Electrical Systems $1,769,000 0.13 0.22 0.26 Major new process steps
Buildings $2,123,000 0.00 0.22 0.31 Large new building required
Yard Improvements $511,000 0.00 0.07 0.10 Expand existing roadways
Foundations $2,811,000 0.40 0.41 0.41 Large building and equipment
Service Facilities $885,000 0.07 0.11 0.13 Compressed air utilities
Land $0 0.00 0.04 0.05 Land available on site
Sub-Total Direct Cost $19,598,000 2.84
Indirect Cost
Engineering $2,123,000 0.20 0.26 0.31 Complex project
Construction Expenses $1,592,000 0.20 0.22 0.23 Complex project
Legal Expenses $256,000 0.02 0.04 0.05
Contractor Fee $1,150,000 0.13 0.17 0.18
Inflation $1,533,000 0.20 0.22 0.26
Contingency $1,661,000 0.20 0.24 0.26
Sub-Total Indirect Cost $8,315,000 1.21
Total Installed Cost $27,913,000 4.05
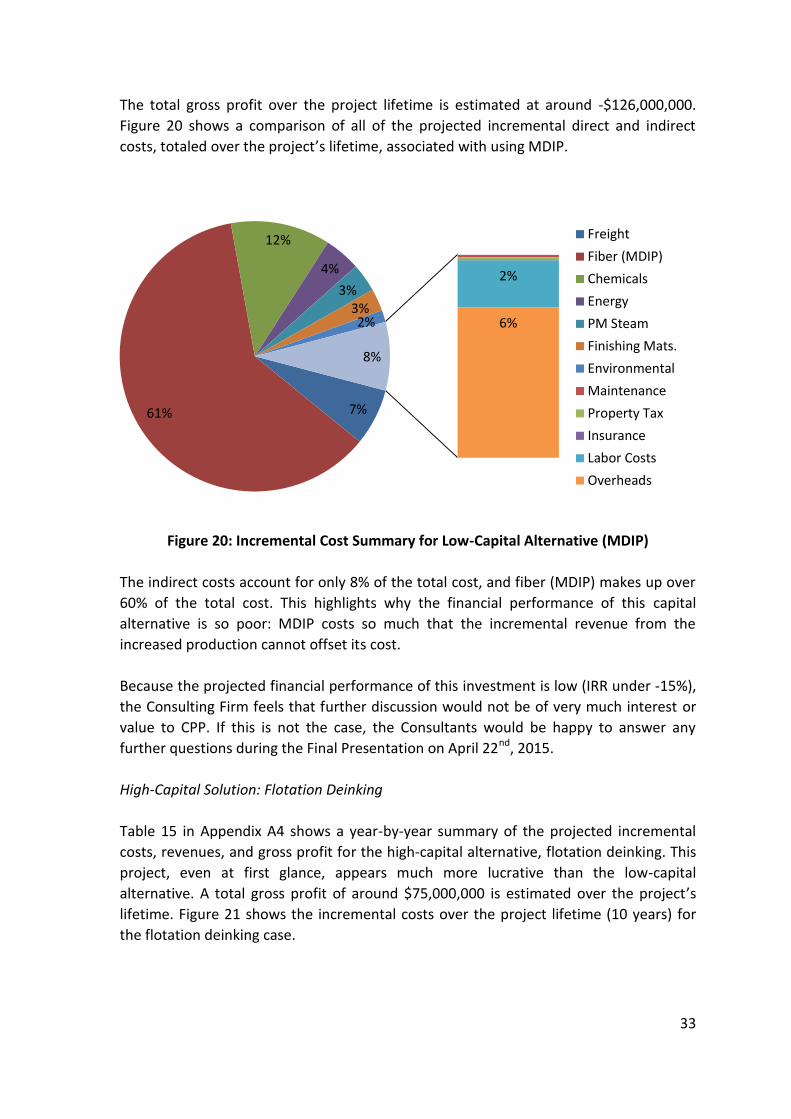
33
The total gross profit over the project lifetime is estimated at around -$126,000,000.
Figure 20 shows a comparison of all of the projected incremental direct and indirect
costs, totaled over the project’s lifetime, associated with using MDIP.
Figure 20: Incremental Cost Summary for Low-Capital Alternative (MDIP)
The indirect costs account for only 8% of the total cost, and fiber (MDIP) makes up over
60% of the total cost. This highlights why the financial performance of this capital
alternative is so poor: MDIP costs so much that the incremental revenue from the
increased production cannot offset its cost.
Because the projected financial performance of this investment is low (IRR under -15%),
the Consulting Firm feels that further discussion would not be of very much interest or
value to CPP. If this is not the case, the Consultants would be happy to answer any
further questions during the Final Presentation on April 22nd, 2015.
High-Capital Solution: Flotation Deinking
Table 15 in Appendix A4 shows a year-by-year summary of the projected incremental
costs, revenues, and gross profit for the high-capital alternative, flotation deinking. This
project, even at first glance, appears much more lucrative than the low-capital
alternative. A total gross profit of around $75,000,000 is estimated over the project’s
lifetime. Figure 21 shows the incremental costs over the project lifetime (10 years) for
the flotation deinking case.
7% 61%
12%
4%
3% 3% 2%
2%
6%
8%
Freight
Fiber (MDIP)
Chemicals
Energy
PM Steam
Finishing Mats.
Environmental
Maintenance
Property Tax
Insurance
Labor Costs
Overheads
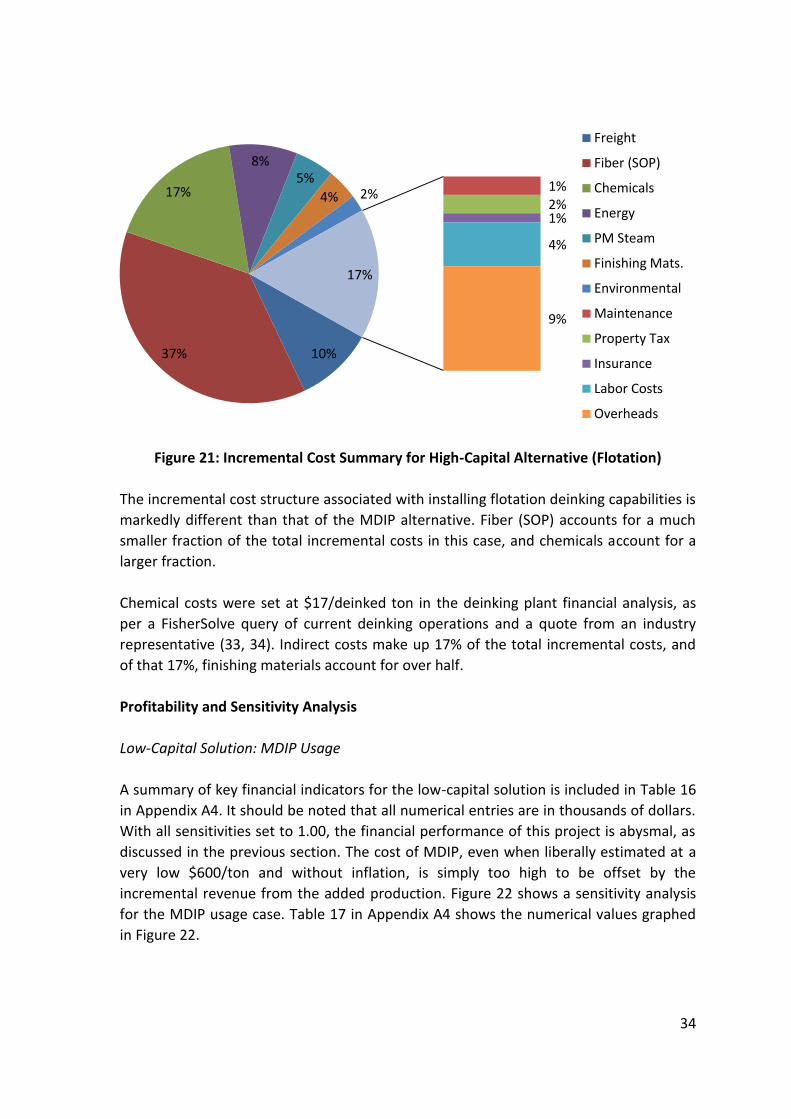
34
Figure 21: Incremental Cost Summary for High-Capital Alternative (Flotation)
The incremental cost structure associated with installing flotation deinking capabilities is
markedly different than that of the MDIP alternative. Fiber (SOP) accounts for a much
smaller fraction of the total incremental costs in this case, and chemicals account for a
larger fraction.
Chemical costs were set at $17/deinked ton in the deinking plant financial analysis, as
per a FisherSolve query of current deinking operations and a quote from an industry
representative (33, 34). Indirect costs make up 17% of the total incremental costs, and
of that 17%, finishing materials account for over half.
Profitability and Sensitivity Analysis
Low-Capital Solution: MDIP Usage
A summary of key financial indicators for the low-capital solution is included in Table 16
in Appendix A4. It should be noted that all numerical entries are in thousands of dollars.
With all sensitivities set to 1.00, the financial performance of this project is abysmal, as
discussed in the previous section. The cost of MDIP, even when liberally estimated at a
very low $600/ton and without inflation, is simply too high to be offset by the
incremental revenue from the added production. Figure 22 shows a sensitivity analysis
for the MDIP usage case. Table 17 in Appendix A4 shows the numerical values graphed
in Figure 22.
10% 37%
17%
8% 5%
4% 2% 1% 2% 1%
4%
9%
17%
Freight
Fiber (SOP)
Chemicals
Energy
PM Steam
Finishing Mats.
Environmental
Maintenance
Property Tax
Insurance
Labor Costs
Overheads
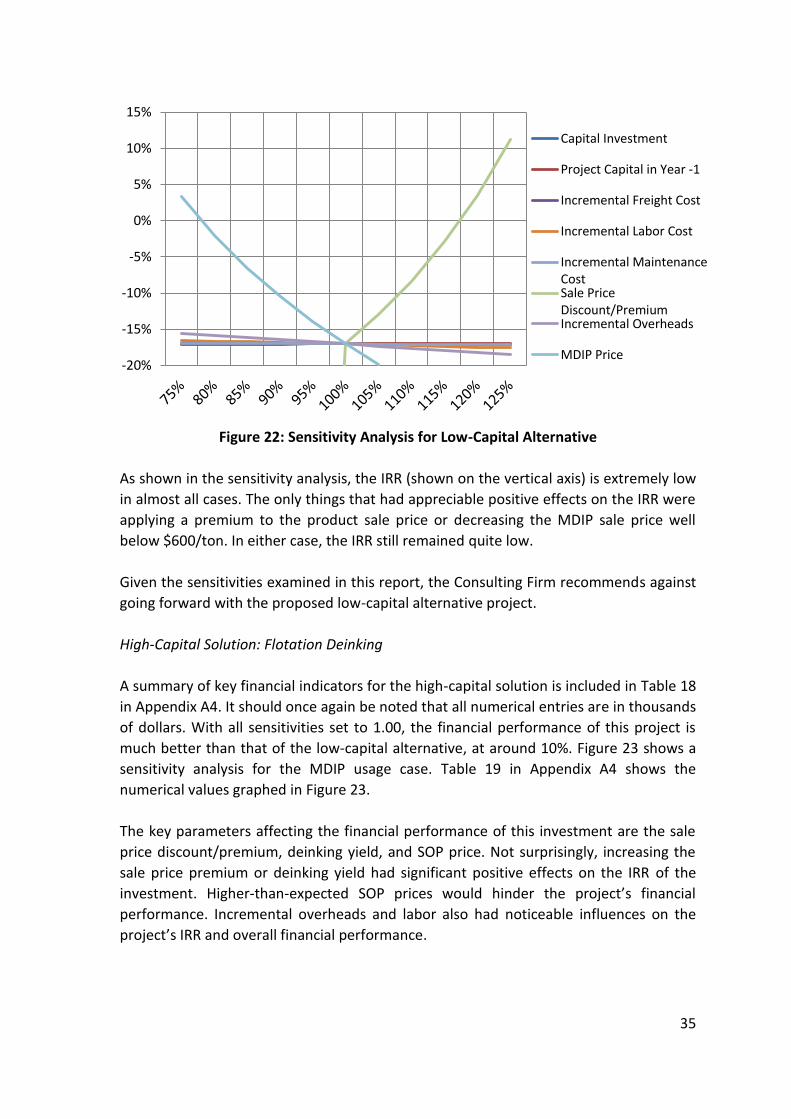
35
Figure 22: Sensitivity Analysis for Low-Capital Alternative
As shown in the sensitivity analysis, the IRR (shown on the vertical axis) is extremely low
in almost all cases. The only things that had appreciable positive effects on the IRR were
applying a premium to the product sale price or decreasing the MDIP sale price well
below $600/ton. In either case, the IRR still remained quite low.
Given the sensitivities examined in this report, the Consulting Firm recommends against
going forward with the proposed low-capital alternative project.
High-Capital Solution: Flotation Deinking
A summary of key financial indicators for the high-capital solution is included in Table 18
in Appendix A4. It should once again be noted that all numerical entries are in thousands
of dollars. With all sensitivities set to 1.00, the financial performance of this project is
much better than that of the low-capital alternative, at around 10%. Figure 23 shows a
sensitivity analysis for the MDIP usage case. Table 19 in Appendix A4 shows the
numerical values graphed in Figure 23.
The key parameters affecting the financial performance of this investment are the sale
price discount/premium, deinking yield, and SOP price. Not surprisingly, increasing the
sale price premium or deinking yield had significant positive effects on the IRR of the
investment. Higher-than-expected SOP prices would hinder the project’s financial
performance. Incremental overheads and labor also had noticeable influences on the
project’s IRR and overall financial performance.
-20%
-15%
-10%
-5%
0%
5%
10%
15%
Capital Investment
Project Capital in Year -1
Incremental Freight Cost
Incremental Labor Cost
Incremental MaintenanceCostSale PriceDiscount/PremiumIncremental Overheads
MDIP Price
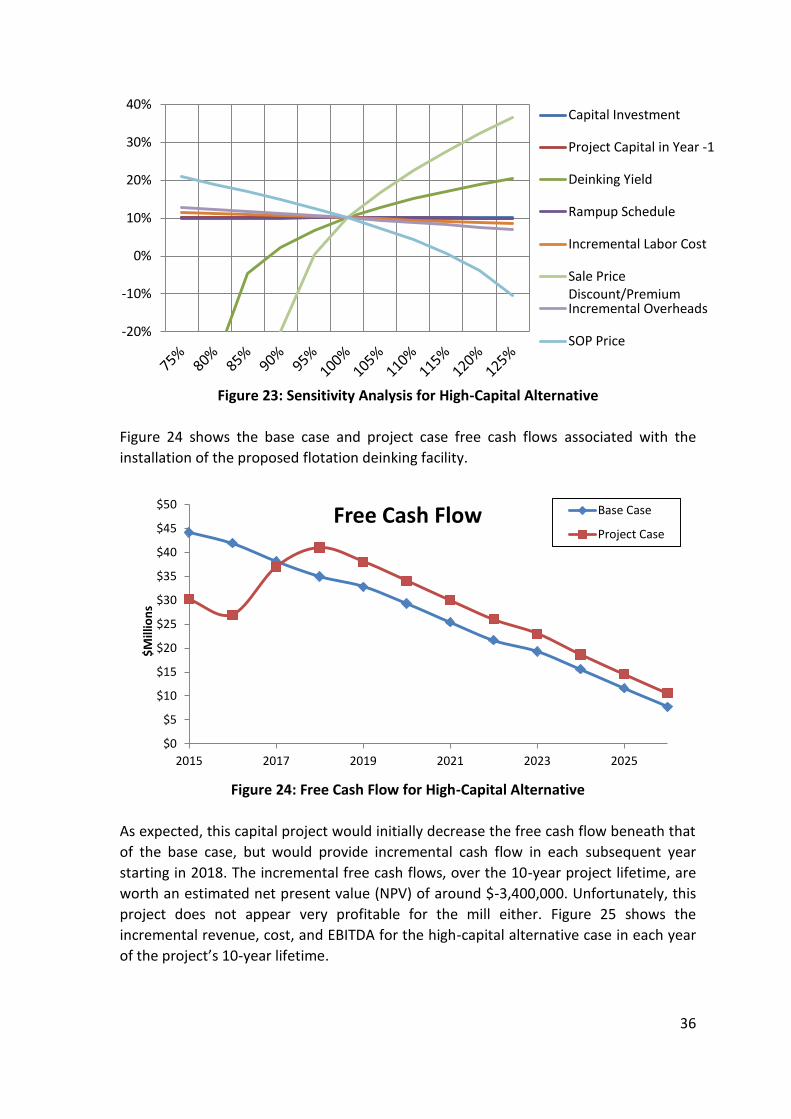
36
Figure 23: Sensitivity Analysis for High-Capital Alternative
Figure 24 shows the base case and project case free cash flows associated with the
installation of the proposed flotation deinking facility.
Figure 24: Free Cash Flow for High-Capital Alternative
As expected, this capital project would initially decrease the free cash flow beneath that
of the base case, but would provide incremental cash flow in each subsequent year
starting in 2018. The incremental free cash flows, over the 10-year project lifetime, are
worth an estimated net present value (NPV) of around $-3,400,000. Unfortunately, this
project does not appear very profitable for the mill either. Figure 25 shows the
incremental revenue, cost, and EBITDA for the high-capital alternative case in each year
of the project’s 10-year lifetime.
-20%
-10%
0%
10%
20%
30%
40%Capital Investment
Project Capital in Year -1
Deinking Yield
Rampup Schedule
Incremental Labor Cost
Sale PriceDiscount/PremiumIncremental Overheads
SOP Price
$0
$5
$10
$15
$20
$25
$30
$35
$40
$45
$50
2015 2017 2019 2021 2023 2025
$M
illio
ns
Free Cash Flow Base Case
Project Case
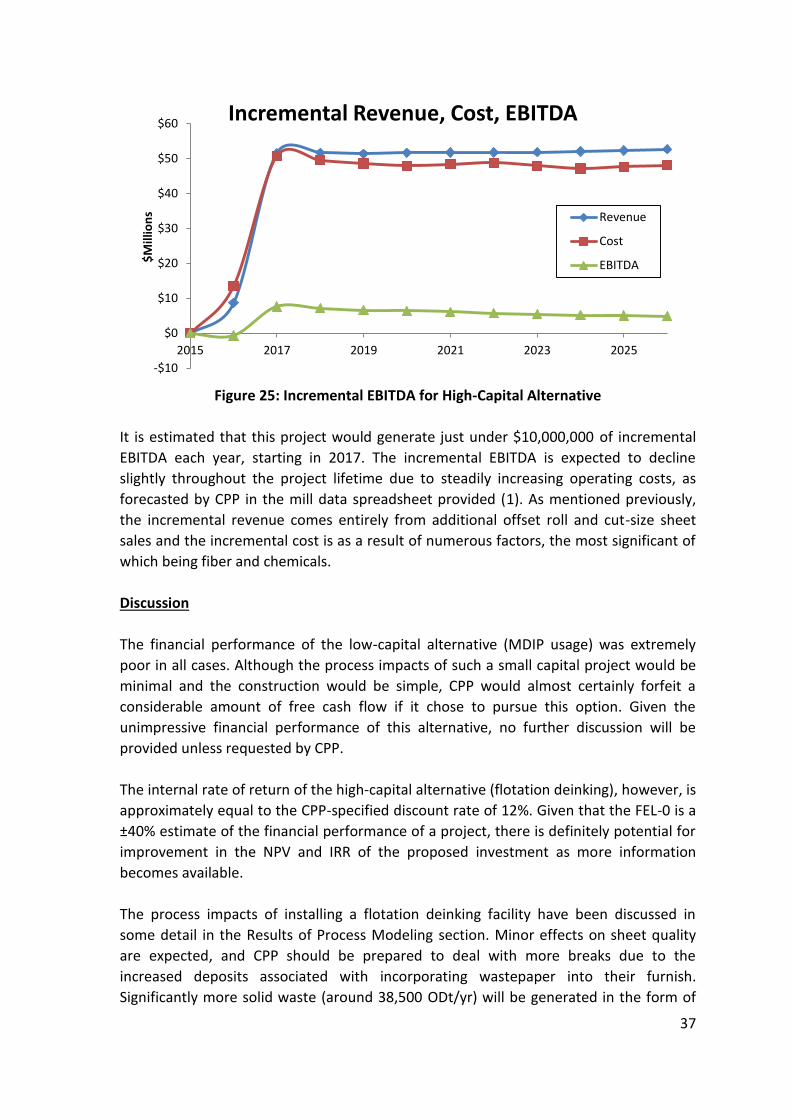
37
Figure 25: Incremental EBITDA for High-Capital Alternative
It is estimated that this project would generate just under $10,000,000 of incremental
EBITDA each year, starting in 2017. The incremental EBITDA is expected to decline
slightly throughout the project lifetime due to steadily increasing operating costs, as
forecasted by CPP in the mill data spreadsheet provided (1). As mentioned previously,
the incremental revenue comes entirely from additional offset roll and cut-size sheet
sales and the incremental cost is as a result of numerous factors, the most significant of
which being fiber and chemicals.
Discussion
The financial performance of the low-capital alternative (MDIP usage) was extremely
poor in all cases. Although the process impacts of such a small capital project would be
minimal and the construction would be simple, CPP would almost certainly forfeit a
considerable amount of free cash flow if it chose to pursue this option. Given the
unimpressive financial performance of this alternative, no further discussion will be
provided unless requested by CPP.
The internal rate of return of the high-capital alternative (flotation deinking), however, is
approximately equal to the CPP-specified discount rate of 12%. Given that the FEL-0 is a
±40% estimate of the financial performance of a project, there is definitely potential for
improvement in the NPV and IRR of the proposed investment as more information
becomes available.
The process impacts of installing a flotation deinking facility have been discussed in
some detail in the Results of Process Modeling section. Minor effects on sheet quality
are expected, and CPP should be prepared to deal with more breaks due to the
increased deposits associated with incorporating wastepaper into their furnish.
Significantly more solid waste (around 38,500 ODt/yr) will be generated in the form of
-$10
$0
$10
$20
$30
$40
$50
$60
2015 2017 2019 2021 2023 2025
$M
illio
ns
Incremental Revenue, Cost, EBITDA
Revenue
Cost
EBITDA
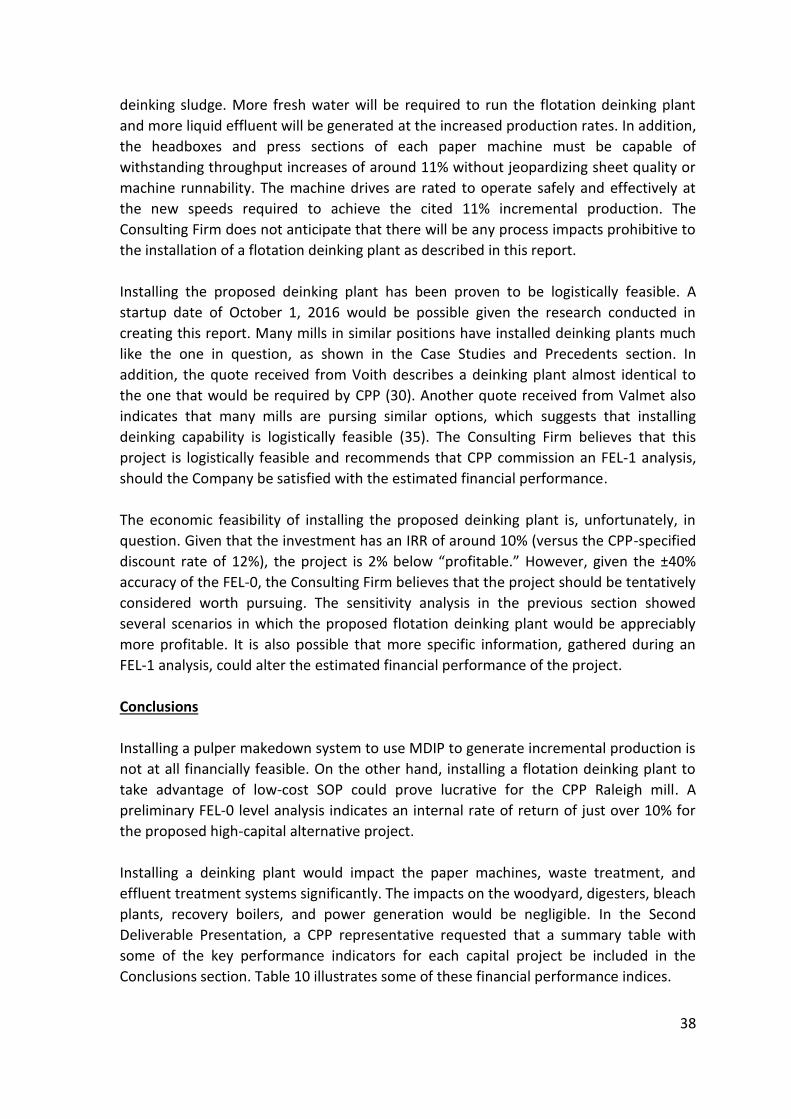
38
deinking sludge. More fresh water will be required to run the flotation deinking plant
and more liquid effluent will be generated at the increased production rates. In addition,
the headboxes and press sections of each paper machine must be capable of
withstanding throughput increases of around 11% without jeopardizing sheet quality or
machine runnability. The machine drives are rated to operate safely and effectively at
the new speeds required to achieve the cited 11% incremental production. The
Consulting Firm does not anticipate that there will be any process impacts prohibitive to
the installation of a flotation deinking plant as described in this report.
Installing the proposed deinking plant has been proven to be logistically feasible. A
startup date of October 1, 2016 would be possible given the research conducted in
creating this report. Many mills in similar positions have installed deinking plants much
like the one in question, as shown in the Case Studies and Precedents section. In
addition, the quote received from Voith describes a deinking plant almost identical to
the one that would be required by CPP (30). Another quote received from Valmet also
indicates that many mills are pursing similar options, which suggests that installing
deinking capability is logistically feasible (35). The Consulting Firm believes that this
project is logistically feasible and recommends that CPP commission an FEL-1 analysis,
should the Company be satisfied with the estimated financial performance.
The economic feasibility of installing the proposed deinking plant is, unfortunately, in
question. Given that the investment has an IRR of around 10% (versus the CPP-specified
discount rate of 12%), the project is 2% below “profitable.” However, given the ±40%
accuracy of the FEL-0, the Consulting Firm believes that the project should be tentatively
considered worth pursuing. The sensitivity analysis in the previous section showed
several scenarios in which the proposed flotation deinking plant would be appreciably
more profitable. It is also possible that more specific information, gathered during an
FEL-1 analysis, could alter the estimated financial performance of the project.
Conclusions
Installing a pulper makedown system to use MDIP to generate incremental production is
not at all financially feasible. On the other hand, installing a flotation deinking plant to
take advantage of low-cost SOP could prove lucrative for the CPP Raleigh mill. A
preliminary FEL-0 level analysis indicates an internal rate of return of just over 10% for
the proposed high-capital alternative project.
Installing a deinking plant would impact the paper machines, waste treatment, and
effluent treatment systems significantly. The impacts on the woodyard, digesters, bleach
plants, recovery boilers, and power generation would be negligible. In the Second
Deliverable Presentation, a CPP representative requested that a summary table with
some of the key performance indicators for each capital project be included in the
Conclusions section. Table 10 illustrates some of these financial performance indices.
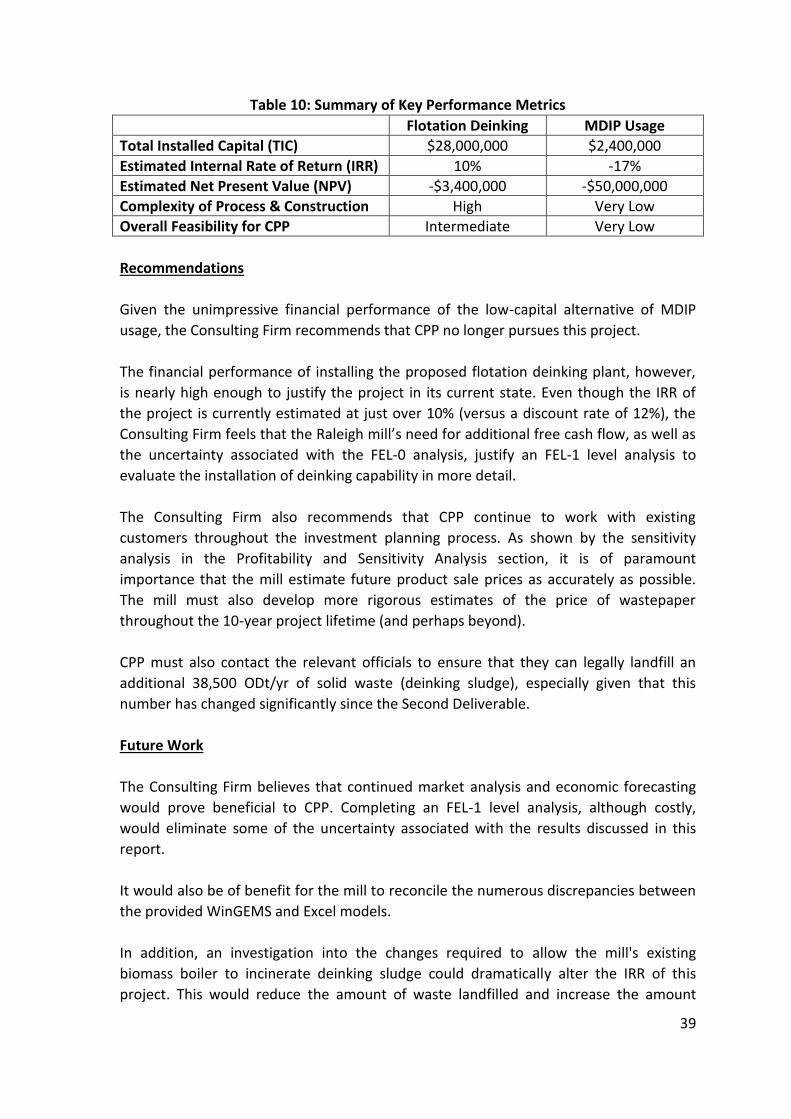
39
Table 10: Summary of Key Performance Metrics
Flotation Deinking MDIP Usage
Total Installed Capital (TIC) $28,000,000 $2,400,000
Estimated Internal Rate of Return (IRR) 10% -17%
Estimated Net Present Value (NPV) -$3,400,000 -$50,000,000
Complexity of Process & Construction High Very Low
Overall Feasibility for CPP Intermediate Very Low
Recommendations
Given the unimpressive financial performance of the low-capital alternative of MDIP
usage, the Consulting Firm recommends that CPP no longer pursues this project.
The financial performance of installing the proposed flotation deinking plant, however,
is nearly high enough to justify the project in its current state. Even though the IRR of
the project is currently estimated at just over 10% (versus a discount rate of 12%), the
Consulting Firm feels that the Raleigh mill’s need for additional free cash flow, as well as
the uncertainty associated with the FEL-0 analysis, justify an FEL-1 level analysis to
evaluate the installation of deinking capability in more detail.
The Consulting Firm also recommends that CPP continue to work with existing
customers throughout the investment planning process. As shown by the sensitivity
analysis in the Profitability and Sensitivity Analysis section, it is of paramount
importance that the mill estimate future product sale prices as accurately as possible.
The mill must also develop more rigorous estimates of the price of wastepaper
throughout the 10-year project lifetime (and perhaps beyond).
CPP must also contact the relevant officials to ensure that they can legally landfill an
additional 38,500 ODt/yr of solid waste (deinking sludge), especially given that this
number has changed significantly since the Second Deliverable.
Future Work
The Consulting Firm believes that continued market analysis and economic forecasting
would prove beneficial to CPP. Completing an FEL-1 level analysis, although costly,
would eliminate some of the uncertainty associated with the results discussed in this
report.
It would also be of benefit for the mill to reconcile the numerous discrepancies between
the provided WinGEMS and Excel models.
In addition, an investigation into the changes required to allow the mill's existing
biomass boiler to incinerate deinking sludge could dramatically alter the IRR of this
project. This would reduce the amount of waste landfilled and increase the amount
40
electricity sold to the grid. This consideration would be especially important if the mill's
current permitting does not allow for the disposal of the additional solid waste that
would be generated by the flotation deinking plant. Andritz sells both bubbling fluidized
bed (BFB) and circulating fluidized bed (CFB) boilers able to combust deinking sludge, as
well as CFB gasifiers that can create syngas from rejects usable in the lime kiln (36).
Voith’s controlled thermal conversion (CTC) technology can be used to process deinking
sludge; extracts minerals, such as kaolin and carbonate, for sale to other industries; and
generates steam that can be sent elsewhere in the process or used to generate power
(37). Both of these nonconventional options for handling the mill's incremental refuse
streams represent potential additional revenue and cost savings.
41
Literature Cited
1. Phillips, R. B. (2015). “CPP.xlsx,” Excel Spreadsheet. Provided by Carolina Pulp and
Paper Company. Accessed Wednesday, March 4th, 2015.
2. Bajpai, P. (2013). "Recycling and Deinking of Recovered Paper," Elsevier, Waltham,
MA.
3. Venditti, Richard. (2015). Personal Communication. Monday, February 23, 2015.
North Carolina State University, Raleigh, NC.
4. Erkenswick, J. L. (1994). "Sorted Office Paper Definitions Facilitate Collection, End
Use," Pulp & Paper 68(4), 67-69.
5. RISI. (2015). “Mill Asset Database,” online database. Accessed February 23, 2015 at
<http://www.risiinfo.com/millassets/millLanding.html>.
6. RISI. (2015). “RISI Global Industry Statistics Database,” online database. Accessed
February 23, 2015 at <http://www.risiinfo.com/content-gateway/pricewatch/
northamerica.html>
7. RISI. (2015). “Market Price Watch,” online database. Accessed February 23, 2015 at
<http://www.risiinfo.com/content-gateway/globalIndustryStatisticsDatabase.html>
8. Phillips, R. B. (2015). Personal Communication. Excel Spreadsheet containing pricing,
supply, and demand data. Wednesday, March 4th, 2015.
9. RISI Editorial Staff. (2012). “Mississippi River Pulp to Close 131,000 tonnes/yr MDIP
Mill at Natchez,” RISI Pulp and Paper Week, Friday, October 26th, 2012.
10. Ferguson, L. (1999). "Tutorial: Recycling and Deinking 101," TAPPI Pulping
Conference Proceedings. American Fiber Resources, Fairmont, WV.
11. Jiang, C., and Ma, J. (2000). "De-Inking of Waste Paper: Flotation," Enzymatic
Deinking Technologies, Norcross, Georgia; Academic Press, pp. 2537-2544.
12. Moe, S. T., and Røring, A. (2001). "Theory and Practice of Flotation Deinking," Sixth
Research Forum on Recycling, Magog, Quebec, Canada.
13. Carre, B., Magnin, L., Galland, G., and Vernac, Y. (2000). “Deinking Difficulties Related
to Ink Formulation, Printing Process, and Type of Paper,” Centre Technique du
Papier, Domaine Universitaire, Grenoble, France.
14. Fernandez, E. O., and Hodgson, K. T. (2013). “Deinking Flexographic-Printed Papers:
Destabilization of Flexographic Ink Dispersions with Copper Compounds,” TAPPI
Journal 12(11): 29-35.
15. Hsieh, J. (2012). “Deinking of Inkjet Digital Nonimpact Printing,” TAPPI Journal 11(9):
9-15.
16. Lee, C. K., Ibrahim, D., Omar, I. C., and Rosli, W. D. W. (2011). “Pilot Scale Enzymatic
Deinking of Mixed Office Wastepaper and Old Newspaper,” BioResources 6(4): 3809-
3823.
42
17. Hirsch, G., Voss, D., Putz, H. J., and Schable, S. (2014). "Effect of Poorly Deinkable
Paper on Deinked Pulp Quality," TAPPI Journal 13(9): 41-48.
18. TAPPI. (2011).”Deinking Review,” Progress in Paper Recycling 20(1): 1-43.
19. Azevedo, M. A. D., Drelich, J., and Miller, J. D. (1999). "The Effect of pH on Pulping
and Flotations of Mixed Office Wastepaper," Journal of Pulp and Paper Science
25(9): 317-320.
20. Lee, C. L., Darah, I., and Ibrahim, C. O. (2007). “Enzymatic Deinking of Laser Printed
Office Waste Papers: Governing Parameters of Deinking Efficiency,” Biores. Tech. 98:
1684-1689.
21. Pauck, J., and Marsh, J. (2002). “The Roles of Sodium Silicate in the Deinking of
Newsprint at Mondi Merebank,” Website. Accessed November 23, 2014
<http://www.tappsa.co.za/archive/Journal_papers/The_role_of_sodium/
the_role_of_sodium.html>.
22. Pauck, J., and Marsh, J. (2002). “The Role of Sodium Silicate in Newsprint Deinking,”
Website. Accessed November 23, 2014 <http://www.tappsa.co.za/archive
/APPW2002/Title/The_role_of_sodium_silicate/the_role_of_sodium_silicate.html>.
23. McMillan, M., Bettis, S., Proznik, L., & Graham, R. (1991). In J. R. Thrift (Chair). Impact
on steam and power requirements when secondary fiber capacity is added to an
existing mill. TAPPI Proceedings Engineering conference.
24. James, R. (2014). "Sorting out the latest DIP news," Pulp and Paper International.
May 2000: n. page. Web. 26 Nov. 2014.
25. Jewitt, C. (2014). "Deinking orders dazzle industry suppliers." Pulp and Paper
International. Apr 2001: Web. 26 Nov. 2014.
26. Hanson, J. P. (1977). “GP Starts up Flotation Deinking Lines at Kalamazoo, Mich.,
Mill,” Pulp & Paper July 1997, 98-100.
27. Ferguson, K. H. (1995). “IP Focuses on Reprographic Market with World’s Largest
Machine at Selma,” Pulp & Paper 69(6): 47-52.
28. Finchem, K. J. (1996). “Boise Designs Jackson Deinking Mill for Low-Quality Fiber,
High-Quality Pulp,” Pulp & Paper 70(5): 101-107.
29. McKinney, R. (1998). “A Better Insight Could Help Flotation Technology Take Off,”
Pulp and Paper International: June.
30. Spielbauer, J. (2015). Personal Communication. Monday, March 30, 2015. Voith
Paper Inc., Appleton, WI.
31. Peters, M. S., Timmerhaus, K. D., and West, R. E. (2002). “Equipment Costs: Plant
Design and Economics for Chemical Engineers,” Online. Accessed Monday, March
2nd, 2015 at <http://www.mhhe.com/engcs/chemical/peters/data/>.
32. Phillips, R. B. (2015). “Phillips Installed Cost Estimator.xlsx,” Excel Spreadsheet.
Provided by Carolina Pulp and Paper Company. Accessed Monday, March 2nd, 2015.
43
33. Lenski, M. J. (2015). "Deinking Chemical Costs 2014_Q2," Excel Spreadsheet. Sourced
from FisherSolve Software. Accessed Thursday, April 2nd, 2015.
34. Buchanan, J. (2015). Personal Communication. Monday, March 2, 2015. Akzo Nobel
Pulp and Performance Chemicals Inc., Marietta, GA.
35. Belair, B. (2015). Personal Communication. Monday, March 30, 2015. Valmet Inc.,
Norcross, GA.
36. Andritz. (2011). "From Trash to Treasure," Website. Accessed April 7, 2015
<http://spectrum.andritz.com/index/iss_23/art_23_31.htm>.
37. Voith. (2011). "Greater added value thanks to CTC technology," Website. Accessed
April 7, 2015
<http://voith.com/en/twogether-article-32-en-60-ctc-technologie.pdf>.
38. Carroll, W. P., and McCool, M. A. (1990). "Pressurized Deinking Module", TAPPI
Pulping Conference Proceedings. Beloit Corporation, Dalton, MA.
39. Vashisth, S., Bennington, C. P. J., Grace, J. R., and Kerekes, R. J. (2011). “Column
Flotation Deinking: State-of-the-art and Opportunities,” Resources, Convservation
and Recycling 55, 1154-1177
40. Pala, H., Mota, M., and Gama, F. M. (2004). “Enzymatic Versus Chemical Deinking of
Non-Impact Ink Printed Paper,” Journal of Biotechnology 108: 79-89.
41. Welt, T., and Dinus, R. J. (1994). “IPST Technical Paper Series Number 542: Enzymatic
Deinking – A Review,” Institute of Paper Science and Technology, Georgia Institute of
Technology, Atlanta, Georgia.
42. Goto, S., Tsjui, H., Onodera, I., Watanabe, K., and Ono, K. (2014). "Cavitation-Jet
Deinking: A New Technology for Deinking of Recovered Paper," TAPPI Journal 13(9):
9-17.
43. Goto, S., Tsuji, H., Onodera, I., Watanabe, K., and Ono, K. (2014). “Pilot-Scale
Development of Cavitation-Jet Deinking,” Progress in Paper Recycling 13(9): 19-25.
44. AkzoNobel EKA. (2014). "Deinking Chemicals," Website. Accessed November 17,
2014 <https://www.akzonobel.com/eka/products/pulp_chemicals/
deinking_chemicals/>.
45. Buckman. (2014). "Deinking," Website. Accessed November 17, 2014
<http://www.buckman.com/ core-businesses-paper/paper-technologies/paper-
applications/deinking>.
46. EDT. (2014). "Deinking - Enzymatic Treatments for Processing Recovered Paper,"
Website. Accessed November 17, 2014 <http://www.edt-
enzymes.com/deinking.html>.
44
47. Kemira. (2014). "Fennoflot for Enhanced Ink Removal," Website. Accessed November
17, 2014 <http://www.kemira.com/en/industries-
applications/Pages/fennoflot.aspx>.
48. Thiele Kaolin Company. (2014). "DEKA Deinking Products," Website. Accessed
November 17, 2014 <http://www.thielekaolin.com/index.php/markets/paper/
dekadeinkingprods>.
49. Andritz. (2014). "Deinking Systems," Website. Accessed November 17, 2014
<http://www.andritz.com/products-and-services/pf-detail.htm?productid=12079>.
50. Kadant. (2014). "Deinking," Website. Accessed November 16, 2014
<http://www.kadant.com/en/products/deinking>.
51. Voith. (2014). "Flotation," Website. Accessed November 17, 2014
<http://www.voith.com/en/ products-services/paper/process-steps/stock-
preparation/flotation-10647.html>.
52. Borchardt, J. K., Matalamaki, D. W., Lott, V. G., and Grimes, D. B. (1997). “Pilot Plant
Studies: Two Methods for Deinking Sorted Office Paper,” TAPPI Journal 80(10), 269-
277.
53. Chen, H. (2014). “Process Development and Fundamental Study on Enzymatic
Hydrolysis of Cellulosic Biomass to Fermentable Sugars for Ethanol Production,” PhD
Dissertation. Accessed online February 23, 2015 at
<http://repository.lib.ncsu.edu/ir/bitstream/1840.16/9673/1/etd.pdf>.
54. Woodward, T. W. (1996). “Water Reuse Levels, Solids Buildup Barriers to Deinking
Plant Closure,” Pulp & Paper. February 1, 1996. Accessed online February 23, 2015 at
<http://www.risiinfo.com/db_area/archive/p_p_mag/1996/9602/96020127.htm>.
55. Economides, D. G., Vlyssides, A. G., Simonetis, S. I., and Philippakopoulou, Th. L.
(1998). “Reuse of Effluent from a Wastepaper Wash-Deinking Process,”
Environmental Pollution 103(2-3), 229-237.

45
Appendix
46
Appendix Contents
Appendix A1 – Additional Supporting Information from Deliverable 1
Appendix A2 – Additional Supporting Information from Deliverable 2
Appendix A3 – Additional Information from Voith Deinking Plant Quote
Appendix A4 – Oversized Economic Analysis Tables
47
Appendix A1
Additional Supporting Information from Deliverable 1
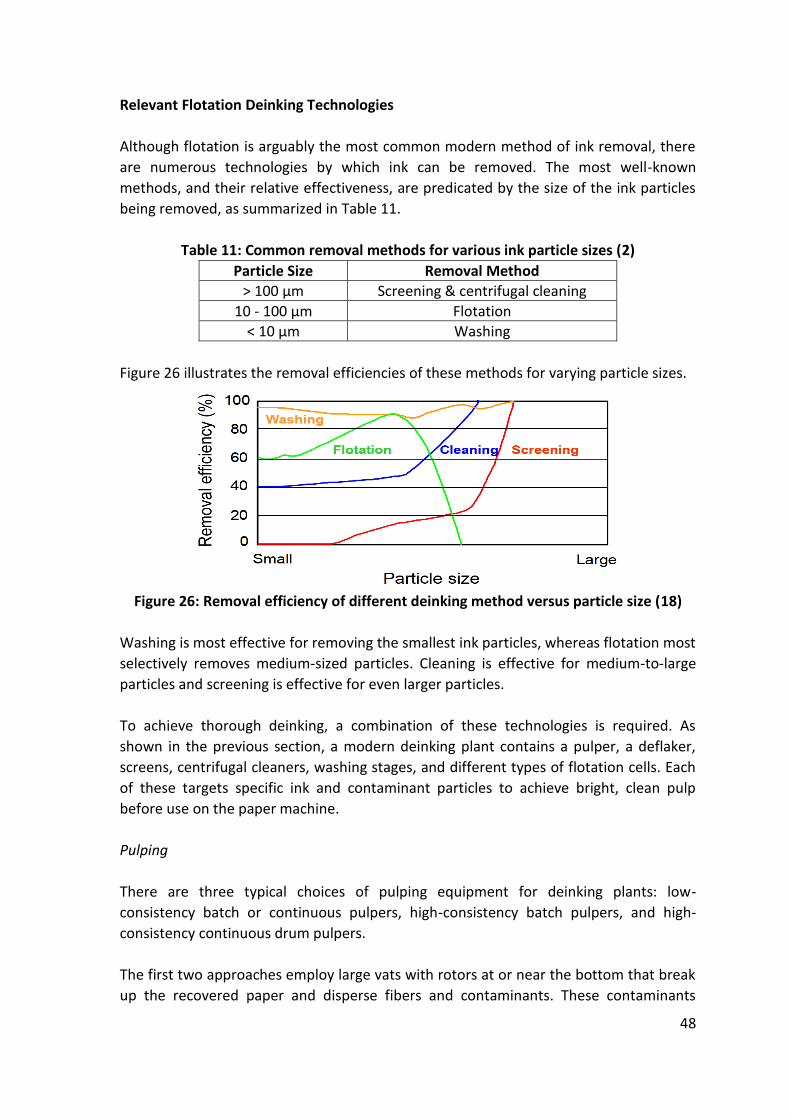
48
Relevant Flotation Deinking Technologies
Although flotation is arguably the most common modern method of ink removal, there
are numerous technologies by which ink can be removed. The most well-known
methods, and their relative effectiveness, are predicated by the size of the ink particles
being removed, as summarized in Table 11.
Table 11: Common removal methods for various ink particle sizes (2)
Particle Size Removal Method
> 100 μm Screening & centrifugal cleaning
10 - 100 μm Flotation
< 10 μm Washing
Figure 26 illustrates the removal efficiencies of these methods for varying particle sizes.
Figure 26: Removal efficiency of different deinking method versus particle size (18)
Washing is most effective for removing the smallest ink particles, whereas flotation most
selectively removes medium-sized particles. Cleaning is effective for medium-to-large
particles and screening is effective for even larger particles.
To achieve thorough deinking, a combination of these technologies is required. As
shown in the previous section, a modern deinking plant contains a pulper, a deflaker,
screens, centrifugal cleaners, washing stages, and different types of flotation cells. Each
of these targets specific ink and contaminant particles to achieve bright, clean pulp
before use on the paper machine.
Pulping
There are three typical choices of pulping equipment for deinking plants: low-
consistency batch or continuous pulpers, high-consistency batch pulpers, and high-
consistency continuous drum pulpers.
The first two approaches employ large vats with rotors at or near the bottom that break
up the recovered paper and disperse fibers and contaminants. These contaminants
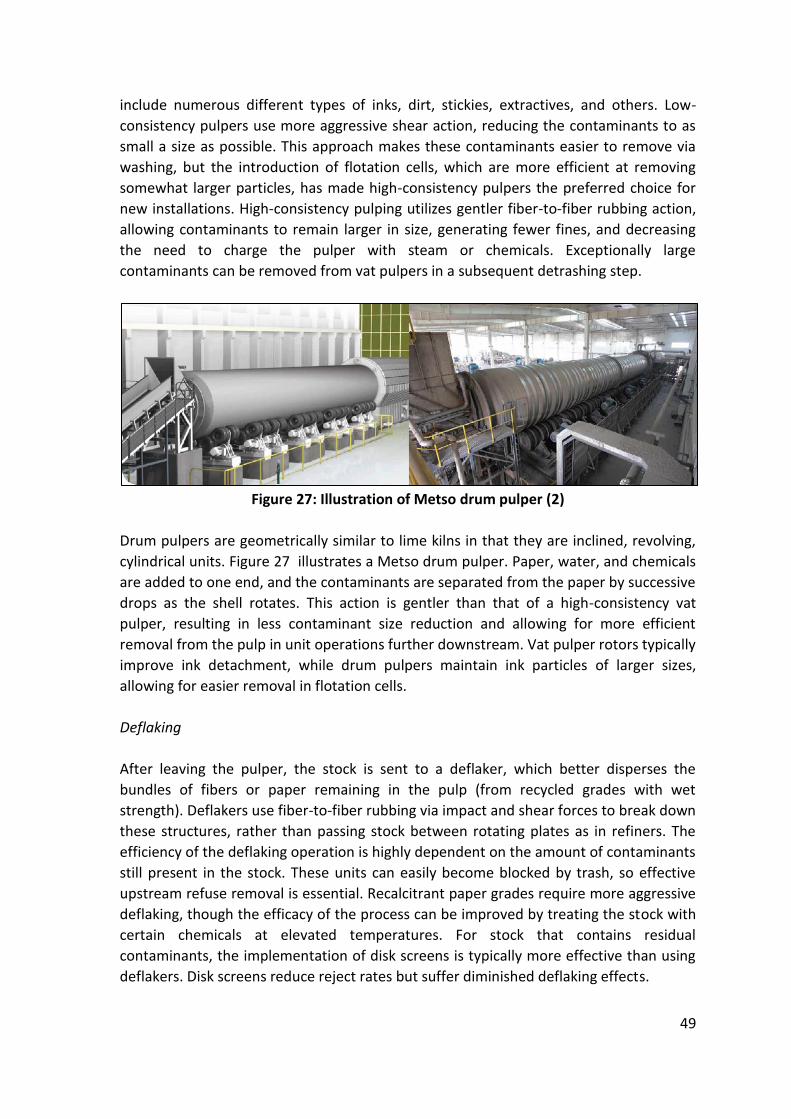
49
include numerous different types of inks, dirt, stickies, extractives, and others. Low-
consistency pulpers use more aggressive shear action, reducing the contaminants to as
small a size as possible. This approach makes these contaminants easier to remove via
washing, but the introduction of flotation cells, which are more efficient at removing
somewhat larger particles, has made high-consistency pulpers the preferred choice for
new installations. High-consistency pulping utilizes gentler fiber-to-fiber rubbing action,
allowing contaminants to remain larger in size, generating fewer fines, and decreasing
the need to charge the pulper with steam or chemicals. Exceptionally large
contaminants can be removed from vat pulpers in a subsequent detrashing step.
Figure 27: Illustration of Metso drum pulper (2)
Drum pulpers are geometrically similar to lime kilns in that they are inclined, revolving,
cylindrical units. Figure 27 illustrates a Metso drum pulper. Paper, water, and chemicals
are added to one end, and the contaminants are separated from the paper by successive
drops as the shell rotates. This action is gentler than that of a high-consistency vat
pulper, resulting in less contaminant size reduction and allowing for more efficient
removal from the pulp in unit operations further downstream. Vat pulper rotors typically
improve ink detachment, while drum pulpers maintain ink particles of larger sizes,
allowing for easier removal in flotation cells.
Deflaking
After leaving the pulper, the stock is sent to a deflaker, which better disperses the
bundles of fibers or paper remaining in the pulp (from recycled grades with wet
strength). Deflakers use fiber-to-fiber rubbing via impact and shear forces to break down
these structures, rather than passing stock between rotating plates as in refiners. The
efficiency of the deflaking operation is highly dependent on the amount of contaminants
still present in the stock. These units can easily become blocked by trash, so effective
upstream refuse removal is essential. Recalcitrant paper grades require more aggressive
deflaking, though the efficacy of the process can be improved by treating the stock with
certain chemicals at elevated temperatures. For stock that contains residual
contaminants, the implementation of disk screens is typically more effective than using
deflakers. Disk screens reduce reject rates but suffer diminished deflaking effects.
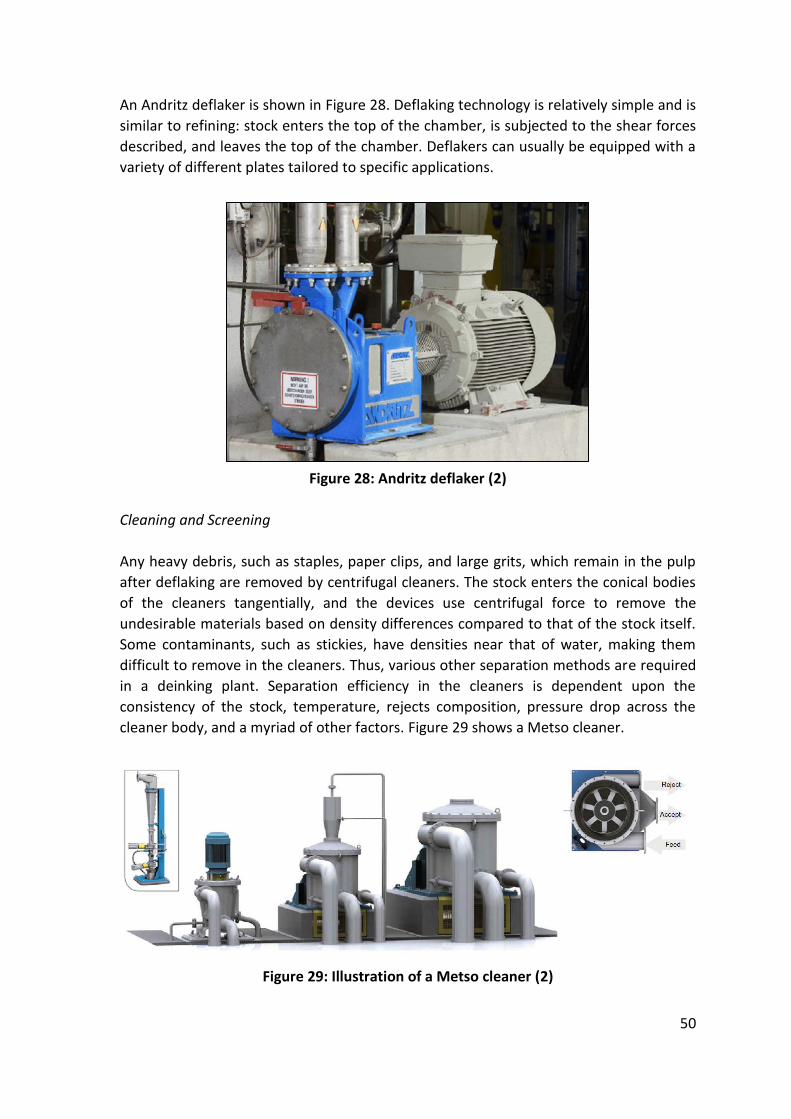
50
An Andritz deflaker is shown in Figure 28. Deflaking technology is relatively simple and is
similar to refining: stock enters the top of the chamber, is subjected to the shear forces
described, and leaves the top of the chamber. Deflakers can usually be equipped with a
variety of different plates tailored to specific applications.
Figure 28: Andritz deflaker (2)
Cleaning and Screening
Any heavy debris, such as staples, paper clips, and large grits, which remain in the pulp
after deflaking are removed by centrifugal cleaners. The stock enters the conical bodies
of the cleaners tangentially, and the devices use centrifugal force to remove the
undesirable materials based on density differences compared to that of the stock itself.
Some contaminants, such as stickies, have densities near that of water, making them
difficult to remove in the cleaners. Thus, various other separation methods are required
in a deinking plant. Separation efficiency in the cleaners is dependent upon the
consistency of the stock, temperature, rejects composition, pressure drop across the
cleaner body, and a myriad of other factors. Figure 29 shows a Metso cleaner.
Figure 29: Illustration of a Metso cleaner (2)
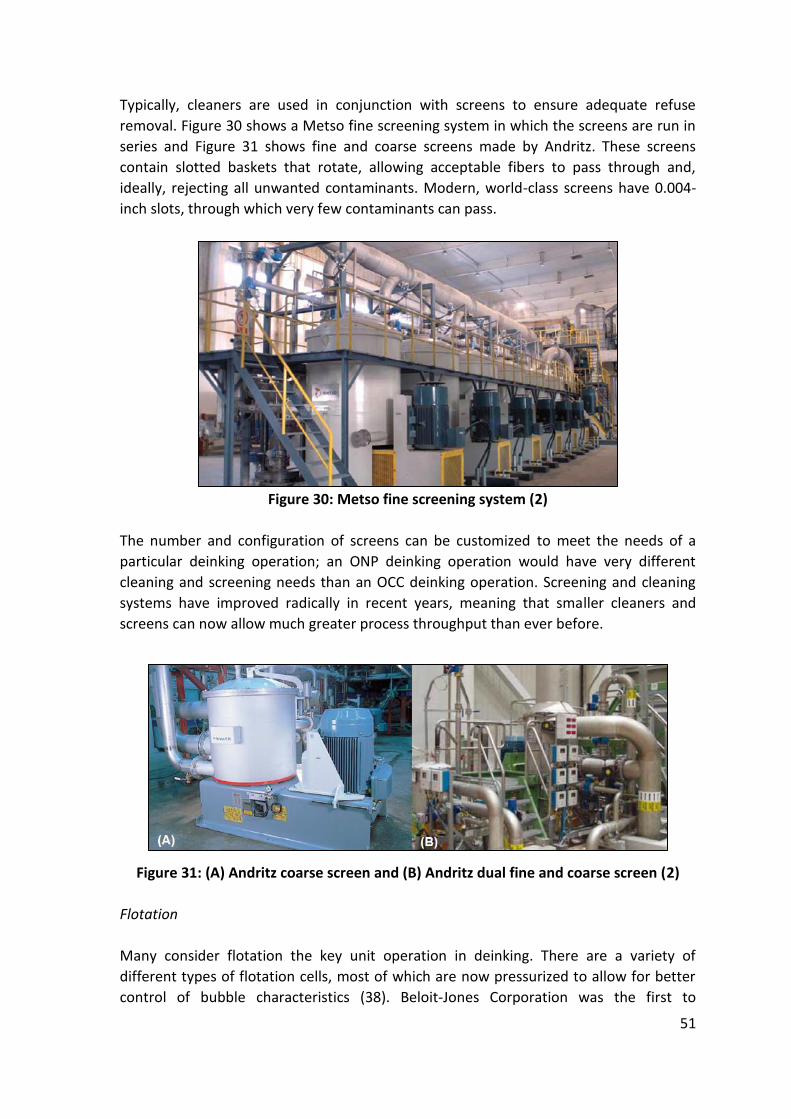
51
Typically, cleaners are used in conjunction with screens to ensure adequate refuse
removal. Figure 30 shows a Metso fine screening system in which the screens are run in
series and Figure 31 shows fine and coarse screens made by Andritz. These screens
contain slotted baskets that rotate, allowing acceptable fibers to pass through and,
ideally, rejecting all unwanted contaminants. Modern, world-class screens have 0.004-
inch slots, through which very few contaminants can pass.
Figure 30: Metso fine screening system (2)
The number and configuration of screens can be customized to meet the needs of a
particular deinking operation; an ONP deinking operation would have very different
cleaning and screening needs than an OCC deinking operation. Screening and cleaning
systems have improved radically in recent years, meaning that smaller cleaners and
screens can now allow much greater process throughput than ever before.
Figure 31: (A) Andritz coarse screen and (B) Andritz dual fine and coarse screen (2)
Flotation
Many consider flotation the key unit operation in deinking. There are a variety of
different types of flotation cells, most of which are now pressurized to allow for better
control of bubble characteristics (38). Beloit-Jones Corporation was the first to
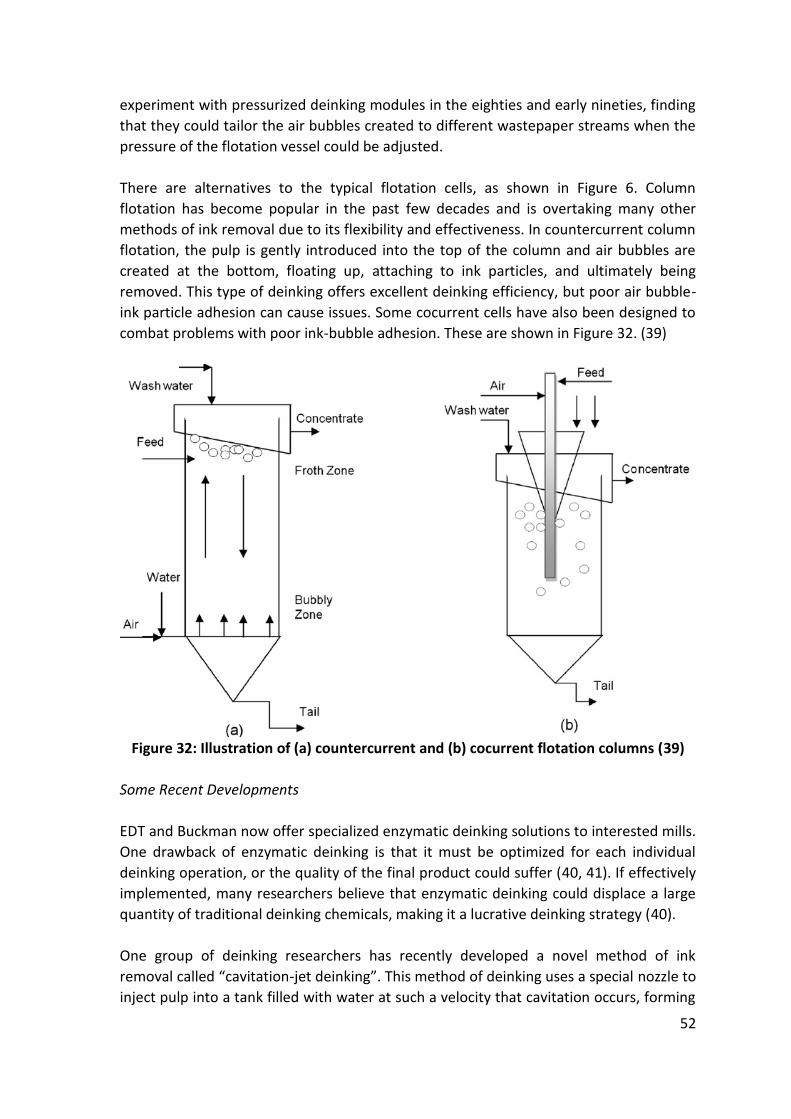
52
experiment with pressurized deinking modules in the eighties and early nineties, finding
that they could tailor the air bubbles created to different wastepaper streams when the
pressure of the flotation vessel could be adjusted.
There are alternatives to the typical flotation cells, as shown in Figure 6. Column
flotation has become popular in the past few decades and is overtaking many other
methods of ink removal due to its flexibility and effectiveness. In countercurrent column
flotation, the pulp is gently introduced into the top of the column and air bubbles are
created at the bottom, floating up, attaching to ink particles, and ultimately being
removed. This type of deinking offers excellent deinking efficiency, but poor air bubble-
ink particle adhesion can cause issues. Some cocurrent cells have also been designed to
combat problems with poor ink-bubble adhesion. These are shown in Figure 32. (39)
Figure 32: Illustration of (a) countercurrent and (b) cocurrent flotation columns (39)
Some Recent Developments
EDT and Buckman now offer specialized enzymatic deinking solutions to interested mills.
One drawback of enzymatic deinking is that it must be optimized for each individual
deinking operation, or the quality of the final product could suffer (40, 41). If effectively
implemented, many researchers believe that enzymatic deinking could displace a large
quantity of traditional deinking chemicals, making it a lucrative deinking strategy (40).
One group of deinking researchers has recently developed a novel method of ink
removal called “cavitation-jet deinking”. This method of deinking uses a special nozzle to
inject pulp into a tank filled with water at such a velocity that cavitation occurs, forming
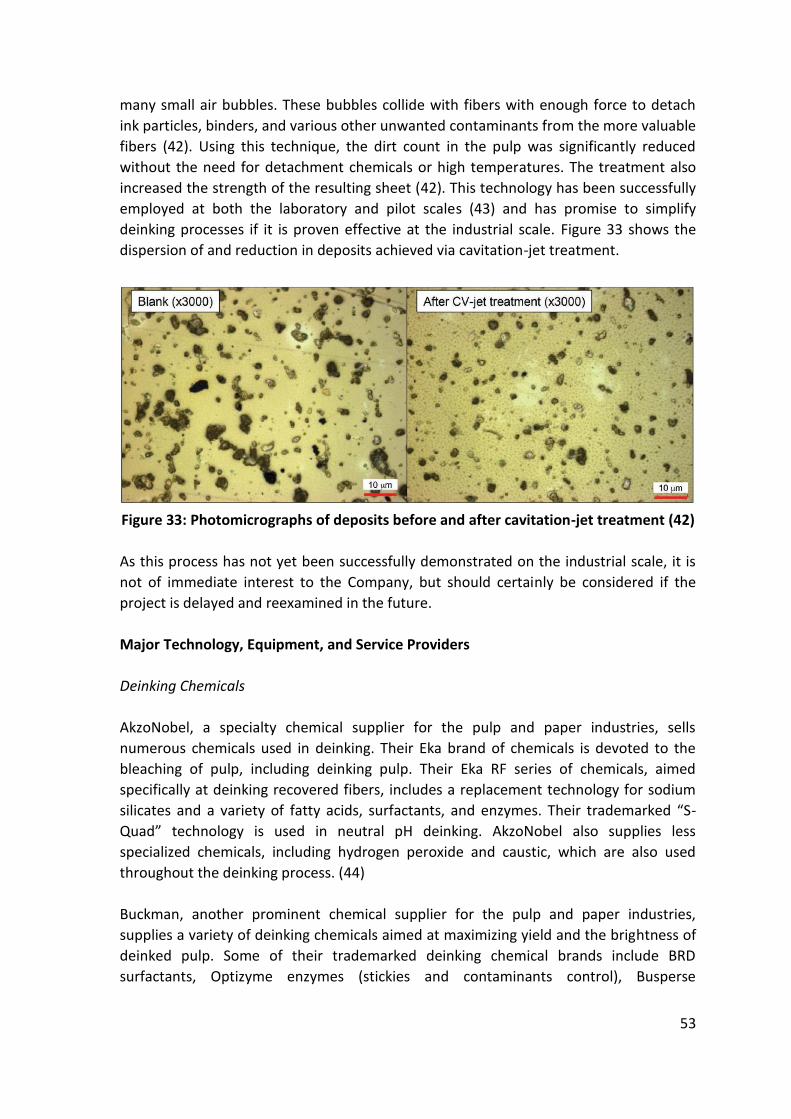
53
many small air bubbles. These bubbles collide with fibers with enough force to detach
ink particles, binders, and various other unwanted contaminants from the more valuable
fibers (42). Using this technique, the dirt count in the pulp was significantly reduced
without the need for detachment chemicals or high temperatures. The treatment also
increased the strength of the resulting sheet (42). This technology has been successfully
employed at both the laboratory and pilot scales (43) and has promise to simplify
deinking processes if it is proven effective at the industrial scale. Figure 33 shows the
dispersion of and reduction in deposits achieved via cavitation-jet treatment.
Figure 33: Photomicrographs of deposits before and after cavitation-jet treatment (42)
As this process has not yet been successfully demonstrated on the industrial scale, it is
not of immediate interest to the Company, but should certainly be considered if the
project is delayed and reexamined in the future.
Major Technology, Equipment, and Service Providers
Deinking Chemicals
AkzoNobel, a specialty chemical supplier for the pulp and paper industries, sells
numerous chemicals used in deinking. Their Eka brand of chemicals is devoted to the
bleaching of pulp, including deinking pulp. Their Eka RF series of chemicals, aimed
specifically at deinking recovered fibers, includes a replacement technology for sodium
silicates and a variety of fatty acids, surfactants, and enzymes. Their trademarked “S-
Quad” technology is used in neutral pH deinking. AkzoNobel also supplies less
specialized chemicals, including hydrogen peroxide and caustic, which are also used
throughout the deinking process. (44)
Buckman, another prominent chemical supplier for the pulp and paper industries,
supplies a variety of deinking chemicals aimed at maximizing yield and the brightness of
deinked pulp. Some of their trademarked deinking chemical brands include BRD
surfactants, Optizyme enzymes (stickies and contaminants control), Busperse
54
dispersants and chelants (deposit control and brightness stability), Busan microbiocides,
and Bufloc coagulants and flocculants (stickies control and water clarification). (45)
Enzymatic Deinking Technologies (EDT) supplies enzyme formulations intended to help
detach ink particles from fibers without yield loss. Their trademarked Enzynk brand of
enzyme formulations is the most relevant of their products to deinking. (46)
Kemira, a chemical supplier for water-intensive industries including pulp and paper, oil
and mining, and municipal and industrial water treatment, offers some deinking
chemicals. Their Fennoflot modified inorganic particle (MIP) deinking agent is designed
to outperform traditional soap and surfactant technology. (47)
Thiele Kaolin Company offers separate formulations for washing and flotation deinking
applications. Their deinking chemicals are modified kaolin particles bound with deinking
surfactants. The DEKA2000 product line is tailored for flotation deinking applications and
the DEKA3000 product line is tailored for wash deinking applications. Thiele Kaolin
Company advertises that their deinking product lines aid in ink particle collection and
stickies control. (48)
Deinking Equipment
Andritz has the capability to supply equipment for all aspects of the flotation deinking
process, starting at pulping and storage and extending through sludge and reject
treatment. The specific unit operations for which Andritz can provide equipment include
pulping (drum pulpers, low-consistency pulpers, and high-consistency pulpers);
screening (their ModuScreen product family); cleaning (a family of centrifugal cleaners);
bleaching (towers and associated equipment); dewatering (pulp screw presses);
dispersing (combined heating and feeding screws); flotation (SelectaFlot flotation cell);
thickening (disc filter, drum thickener, disc thickener, and various screens); ash washing
(rotary and drum washers); sludge dewatering (gravity-based and screw press); and
reject treatment. (49)
Kadant offers technology called the “MAK-C Compact Flotation Cell”, which they laud as
offering the maximum achievable deinking yield and efficiency. This technology is a
combination of multi-stage tank flotation and column flotation and does not require
secondary cells (i.e., it is standalone). Kadant claims that the MAK-C flotation cell can
accept a varied feed without detrimental effects on its performance. (50)
Voith offers several more specialized flotation cells for deinking. These include a two-cell
design trademarked “InjectaCell”, a more compact, single-cell design called
“InjectaCompact”, and a low-energy deinking unit called “LowEnergyFlotation”. They
also can provide a lab-scale flotation cell called the “Delta25 Laboratory Flotation Cell”.
Their products are tailored to remove ink, stickies, and wax from the fiber slurry with
minimal loss of valuable fiber. (51)

55
Appendix A2
Additional Supporting Information from Deliverable 2
56
Rationale for Choosing Flotation over Agglomeration
Given the relatively untested nature of industrial-scale agglomerative deinking, the risks
associated with installing poorly understood technology, and the excellent results
achieved by traditional flotation deinking, it is believed that the best technology choice
for the Raleigh mill would be a more traditional flotation deinking operation.
In the previously cited pilot-scale study (52), both flotation and agglomeration deinking
were shown to produce pulps of acceptable quality. Although industrial-scale
agglomeration deinking facilities do exist, their technologies appear to be proprietary
and it has been difficult to find information beyond the pilot scale. One pilot-scale study
discusses some of the issues with scaling up the agglomeration deinking processes they
examined: energy consumption and the physical size of the equipment required to
perform agglomeration deinking on the industrial scale are major technical questions
that are yet unanswered (19). This study further emphasizes the dependence of the
performance of agglomerative deinking on the choice of separators. Because the
mechanisms of agglomerative deinking are not thoroughly understood, accurately
forecasting the degree of ink removal achieved with a certain unit operation is difficult
(19). Choosing the wrong unit operations, or using them in a suboptimal order, could
prove catastrophic.
Given the wealth of information available regarding both the technology and excellent
performance of modern flotation deinking, it is believed that there would be
substantially less risk involved with flotation deinking than with agglomeration deinking.
The previous deliverable report contained information on some of the few publically-
available deinking plant case studies. These flotation facilities were all shown to have
achieved excellent deinking yield and product quality (24, 26, 27, 28).
Flotation cells are typically modular. They can be effectively bolted together, and
additional cells can be added in the event of additional deinking requirements. The
flexibility of flotation deinking is another advantage that it possesses over agglomeration
deinking.
Effects of Flotation Deinking on Solid Waste and Wastewater Treatment
The deinking of pulp generates significant quantities of solid waste. The composition of
the sludge generated during deinking varies widely, but one study of numerous sludge
samples from deinking-bleaching operations indicates that sludge is roughly 30-35%
solids, 35% of which are glucan (fiber), as shown in Table 12. The ash content in this
sludge is quite high, on the order of 30%. This ash contains large amounts of calcium
salts which can cause scaling in boilers and complicate solid waste and wastewater
treatment, making sludge incineration complicated. (53)
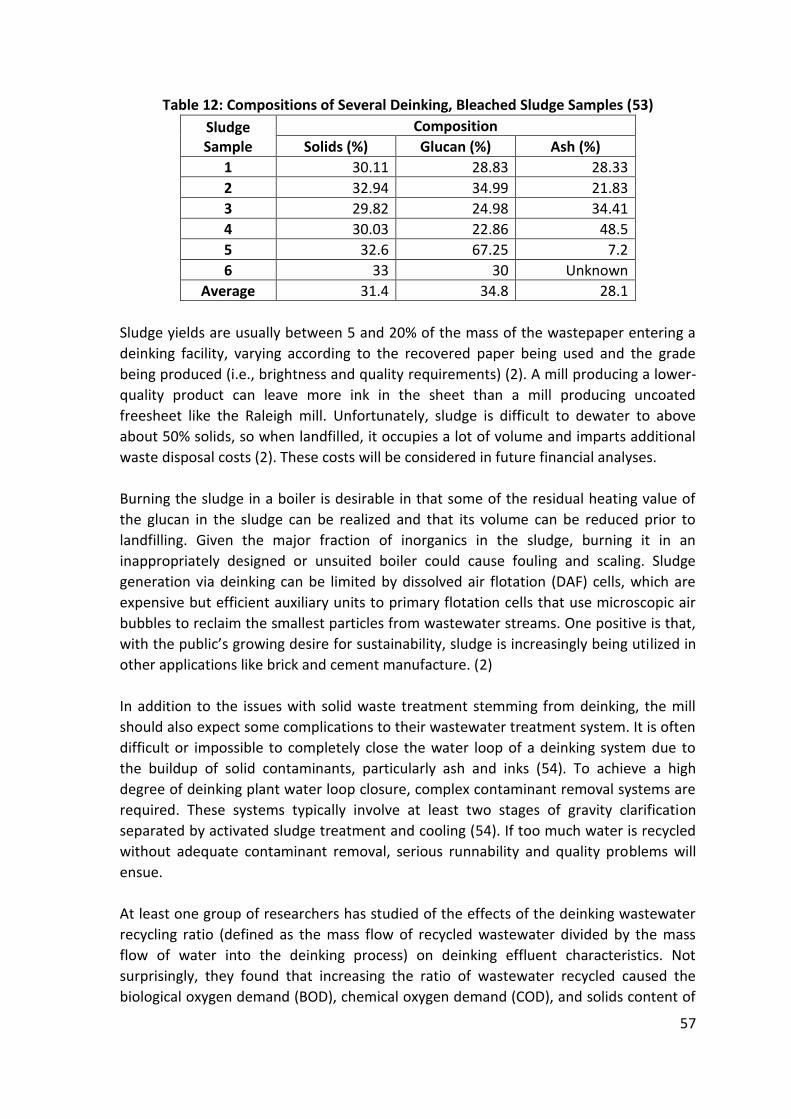
57
Table 12: Compositions of Several Deinking, Bleached Sludge Samples (53)
Sludge Sample
Composition
Solids (%) Glucan (%) Ash (%)
1 30.11 28.83 28.33
2 32.94 34.99 21.83
3 29.82 24.98 34.41
4 30.03 22.86 48.5
5 32.6 67.25 7.2
6 33 30 Unknown
Average 31.4 34.8 28.1
Sludge yields are usually between 5 and 20% of the mass of the wastepaper entering a
deinking facility, varying according to the recovered paper being used and the grade
being produced (i.e., brightness and quality requirements) (2). A mill producing a lower-
quality product can leave more ink in the sheet than a mill producing uncoated
freesheet like the Raleigh mill. Unfortunately, sludge is difficult to dewater to above
about 50% solids, so when landfilled, it occupies a lot of volume and imparts additional
waste disposal costs (2). These costs will be considered in future financial analyses.
Burning the sludge in a boiler is desirable in that some of the residual heating value of
the glucan in the sludge can be realized and that its volume can be reduced prior to
landfilling. Given the major fraction of inorganics in the sludge, burning it in an
inappropriately designed or unsuited boiler could cause fouling and scaling. Sludge
generation via deinking can be limited by dissolved air flotation (DAF) cells, which are
expensive but efficient auxiliary units to primary flotation cells that use microscopic air
bubbles to reclaim the smallest particles from wastewater streams. One positive is that,
with the public’s growing desire for sustainability, sludge is increasingly being utilized in
other applications like brick and cement manufacture. (2)
In addition to the issues with solid waste treatment stemming from deinking, the mill
should also expect some complications to their wastewater treatment system. It is often
difficult or impossible to completely close the water loop of a deinking system due to
the buildup of solid contaminants, particularly ash and inks (54). To achieve a high
degree of deinking plant water loop closure, complex contaminant removal systems are
required. These systems typically involve at least two stages of gravity clarification
separated by activated sludge treatment and cooling (54). If too much water is recycled
without adequate contaminant removal, serious runnability and quality problems will
ensue.
At least one group of researchers has studied of the effects of the deinking wastewater
recycling ratio (defined as the mass flow of recycled wastewater divided by the mass
flow of water into the deinking process) on deinking effluent characteristics. Not
surprisingly, they found that increasing the ratio of wastewater recycled caused the
biological oxygen demand (BOD), chemical oxygen demand (COD), and solids content of
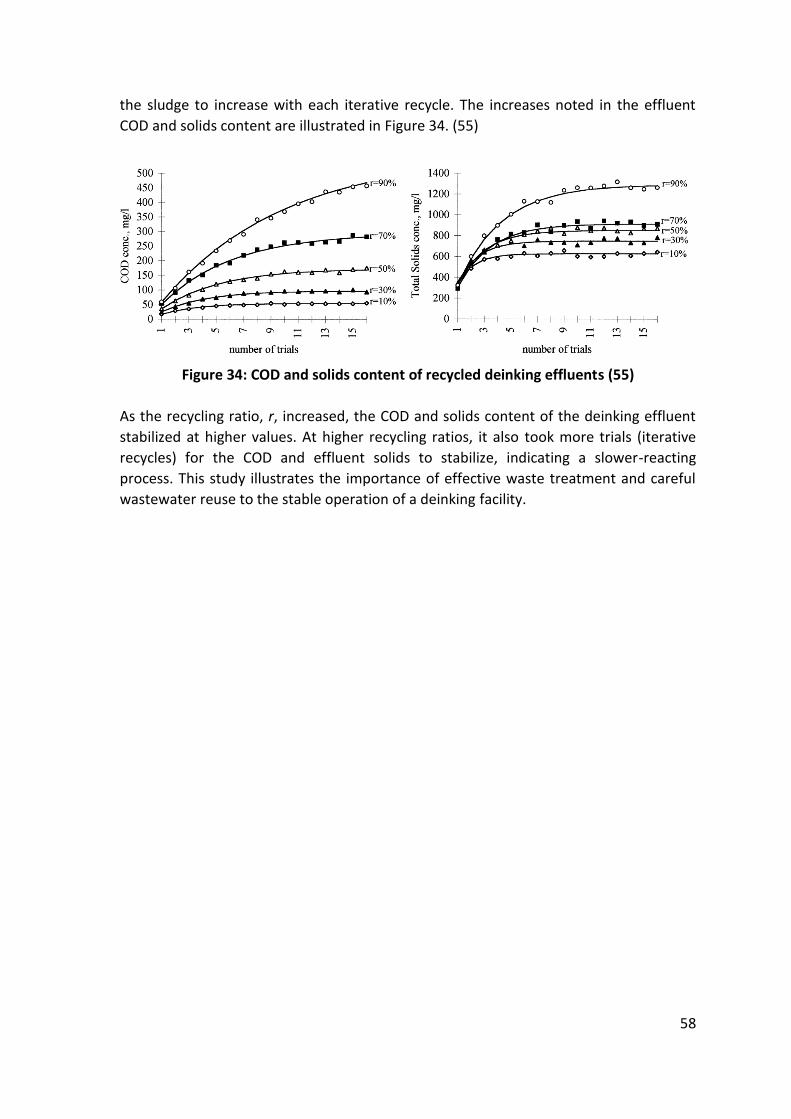
58
the sludge to increase with each iterative recycle. The increases noted in the effluent
COD and solids content are illustrated in Figure 34. (55)
Figure 34: COD and solids content of recycled deinking effluents (55)
As the recycling ratio, r, increased, the COD and solids content of the deinking effluent
stabilized at higher values. At higher recycling ratios, it also took more trials (iterative
recycles) for the COD and effluent solids to stabilize, indicating a slower-reacting
process. This study illustrates the importance of effective waste treatment and careful
wastewater reuse to the stable operation of a deinking facility.
59
Appendix A3
Additional Information from Voith Deinking Plant Quote
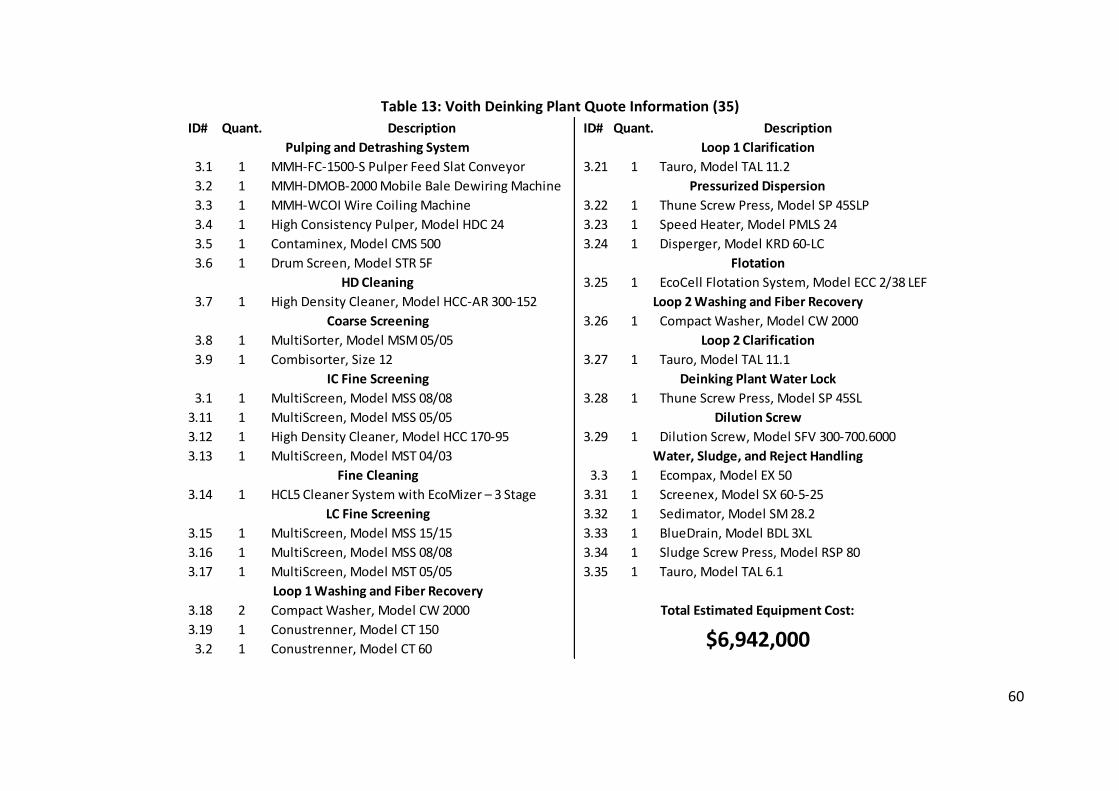
60
Table 13: Voith Deinking Plant Quote Information (35)
ID# Quant. Description ID# Quant. Description
3.1 1 MMH-FC-1500-S Pulper Feed Slat Conveyor 3.21 1 Tauro, Model TAL 11.2
3.2 1 MMH-DMOB-2000 Mobile Bale Dewiring Machine
3.3 1 MMH-WCOI Wire Coiling Machine 3.22 1 Thune Screw Press, Model SP 45SLP
3.4 1 High Consistency Pulper, Model HDC 24 3.23 1 Speed Heater, Model PMLS 24
3.5 1 Contaminex, Model CMS 500 3.24 1 Disperger, Model KRD 60-LC
3.6 1 Drum Screen, Model STR 5F
3.25 1 EcoCell Flotation System, Model ECC 2/38 LEF
3.7 1 High Density Cleaner, Model HCC-AR 300-152
3.26 1 Compact Washer, Model CW 2000
3.8 1 MultiSorter, Model MSM 05/05
3.9 1 Combisorter, Size 12 3.27 1 Tauro, Model TAL 11.1
3.1 1 MultiScreen, Model MSS 08/08 3.28 1 Thune Screw Press, Model SP 45SL
3.11 1 MultiScreen, Model MSS 05/05
3.12 1 High Density Cleaner, Model HCC 170-95 3.29 1 Dilution Screw, Model SFV 300-700.6000
3.13 1 MultiScreen, Model MST 04/03
3.3 1 Ecompax, Model EX 50
3.14 1 HCL5 Cleaner System with EcoMizer – 3 Stage 3.31 1 Screenex, Model SX 60-5-25
3.32 1 Sedimator, Model SM 28.2
3.15 1 MultiScreen, Model MSS 15/15 3.33 1 BlueDrain, Model BDL 3XL
3.16 1 MultiScreen, Model MSS 08/08 3.34 1 Sludge Screw Press, Model RSP 80
3.17 1 MultiScreen, Model MST 05/05 3.35 1 Tauro, Model TAL 6.1
3.18 2 Compact Washer, Model CW 2000
3.19 1 Conustrenner, Model CT 150
3.2 1 Conustrenner, Model CT 60 $6,942,000
Loop 1 Washing and Fiber Recovery
LC Fine Screening
Fine Cleaning
IC Fine Screening
Coarse Screening
Total Estimated Equipment Cost:
Pulping and Detrashing System
HD Cleaning
Loop 1 Clarification
Pressurized Dispersion
Water, Sludge, and Reject Handling
Dilution Screw
Deinking Plant Water Lock
Loop 2 Clarification
Loop 2 Washing and Fiber Recovery
Flotation
61
Appendix A4
Oversized Economic Analysis Tables
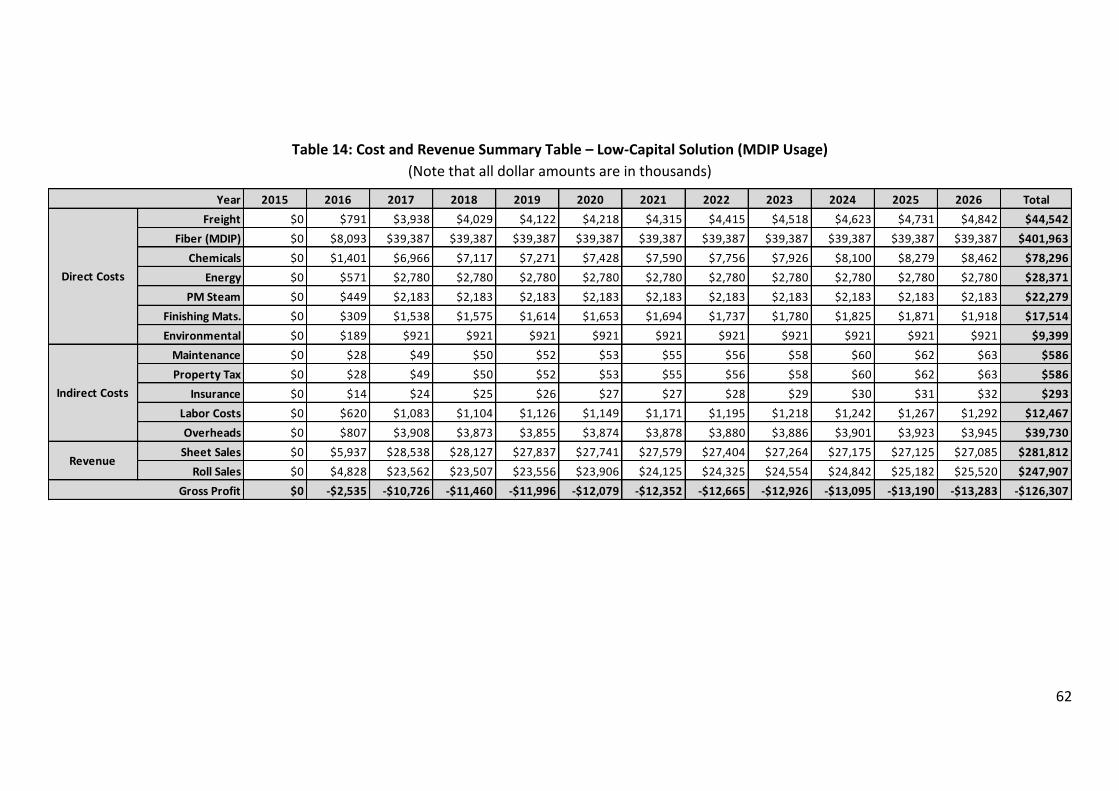
62
Table 14: Cost and Revenue Summary Table – Low-Capital Solution (MDIP Usage)
(Note that all dollar amounts are in thousands)
2015 2016 2017 2018 2019 2020 2021 2022 2023 2024 2025 2026 Total
Freight $0 $791 $3,938 $4,029 $4,122 $4,218 $4,315 $4,415 $4,518 $4,623 $4,731 $4,842 $44,542
Fiber (MDIP) $0 $8,093 $39,387 $39,387 $39,387 $39,387 $39,387 $39,387 $39,387 $39,387 $39,387 $39,387 $401,963
Chemicals $0 $1,401 $6,966 $7,117 $7,271 $7,428 $7,590 $7,756 $7,926 $8,100 $8,279 $8,462 $78,296
Energy $0 $571 $2,780 $2,780 $2,780 $2,780 $2,780 $2,780 $2,780 $2,780 $2,780 $2,780 $28,371
PM Steam $0 $449 $2,183 $2,183 $2,183 $2,183 $2,183 $2,183 $2,183 $2,183 $2,183 $2,183 $22,279
Finishing Mats. $0 $309 $1,538 $1,575 $1,614 $1,653 $1,694 $1,737 $1,780 $1,825 $1,871 $1,918 $17,514
Environmental $0 $189 $921 $921 $921 $921 $921 $921 $921 $921 $921 $921 $9,399
Maintenance $0 $28 $49 $50 $52 $53 $55 $56 $58 $60 $62 $63 $586
Property Tax $0 $28 $49 $50 $52 $53 $55 $56 $58 $60 $62 $63 $586
Insurance $0 $14 $24 $25 $26 $27 $27 $28 $29 $30 $31 $32 $293
Labor Costs $0 $620 $1,083 $1,104 $1,126 $1,149 $1,171 $1,195 $1,218 $1,242 $1,267 $1,292 $12,467
Overheads $0 $807 $3,908 $3,873 $3,855 $3,874 $3,878 $3,880 $3,886 $3,901 $3,923 $3,945 $39,730
Sheet Sales $0 $5,937 $28,538 $28,127 $27,837 $27,741 $27,579 $27,404 $27,264 $27,175 $27,125 $27,085 $281,812
Roll Sales $0 $4,828 $23,562 $23,507 $23,556 $23,906 $24,125 $24,325 $24,554 $24,842 $25,182 $25,520 $247,907
$0 -$2,535 -$10,726 -$11,460 -$11,996 -$12,079 -$12,352 -$12,665 -$12,926 -$13,095 -$13,190 -$13,283 -$126,307
Year
Direct Costs
Indirect Costs
Revenue
Gross Profit
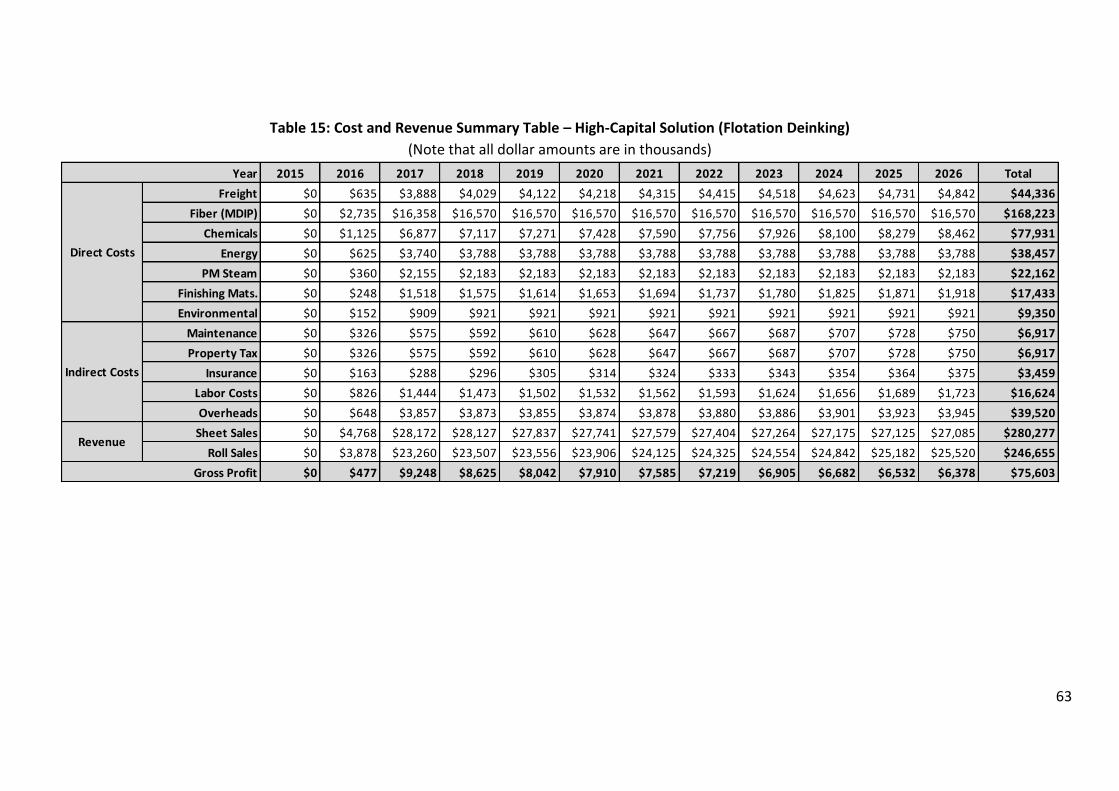
63
Table 15: Cost and Revenue Summary Table – High-Capital Solution (Flotation Deinking)
(Note that all dollar amounts are in thousands)
2015 2016 2017 2018 2019 2020 2021 2022 2023 2024 2025 2026 Total
Freight $0 $635 $3,888 $4,029 $4,122 $4,218 $4,315 $4,415 $4,518 $4,623 $4,731 $4,842 $44,336
Fiber (MDIP) $0 $2,735 $16,358 $16,570 $16,570 $16,570 $16,570 $16,570 $16,570 $16,570 $16,570 $16,570 $168,223
Chemicals $0 $1,125 $6,877 $7,117 $7,271 $7,428 $7,590 $7,756 $7,926 $8,100 $8,279 $8,462 $77,931
Energy $0 $625 $3,740 $3,788 $3,788 $3,788 $3,788 $3,788 $3,788 $3,788 $3,788 $3,788 $38,457
PM Steam $0 $360 $2,155 $2,183 $2,183 $2,183 $2,183 $2,183 $2,183 $2,183 $2,183 $2,183 $22,162
Finishing Mats. $0 $248 $1,518 $1,575 $1,614 $1,653 $1,694 $1,737 $1,780 $1,825 $1,871 $1,918 $17,433
Environmental $0 $152 $909 $921 $921 $921 $921 $921 $921 $921 $921 $921 $9,350
Maintenance $0 $326 $575 $592 $610 $628 $647 $667 $687 $707 $728 $750 $6,917
Property Tax $0 $326 $575 $592 $610 $628 $647 $667 $687 $707 $728 $750 $6,917
Insurance $0 $163 $288 $296 $305 $314 $324 $333 $343 $354 $364 $375 $3,459
Labor Costs $0 $826 $1,444 $1,473 $1,502 $1,532 $1,562 $1,593 $1,624 $1,656 $1,689 $1,723 $16,624
Overheads $0 $648 $3,857 $3,873 $3,855 $3,874 $3,878 $3,880 $3,886 $3,901 $3,923 $3,945 $39,520
Sheet Sales $0 $4,768 $28,172 $28,127 $27,837 $27,741 $27,579 $27,404 $27,264 $27,175 $27,125 $27,085 $280,277
Roll Sales $0 $3,878 $23,260 $23,507 $23,556 $23,906 $24,125 $24,325 $24,554 $24,842 $25,182 $25,520 $246,655
$0 $477 $9,248 $8,625 $8,042 $7,910 $7,585 $7,219 $6,905 $6,682 $6,532 $6,378 $75,603
Direct Costs
Revenue
Indirect Costs
Gross Profit
Year
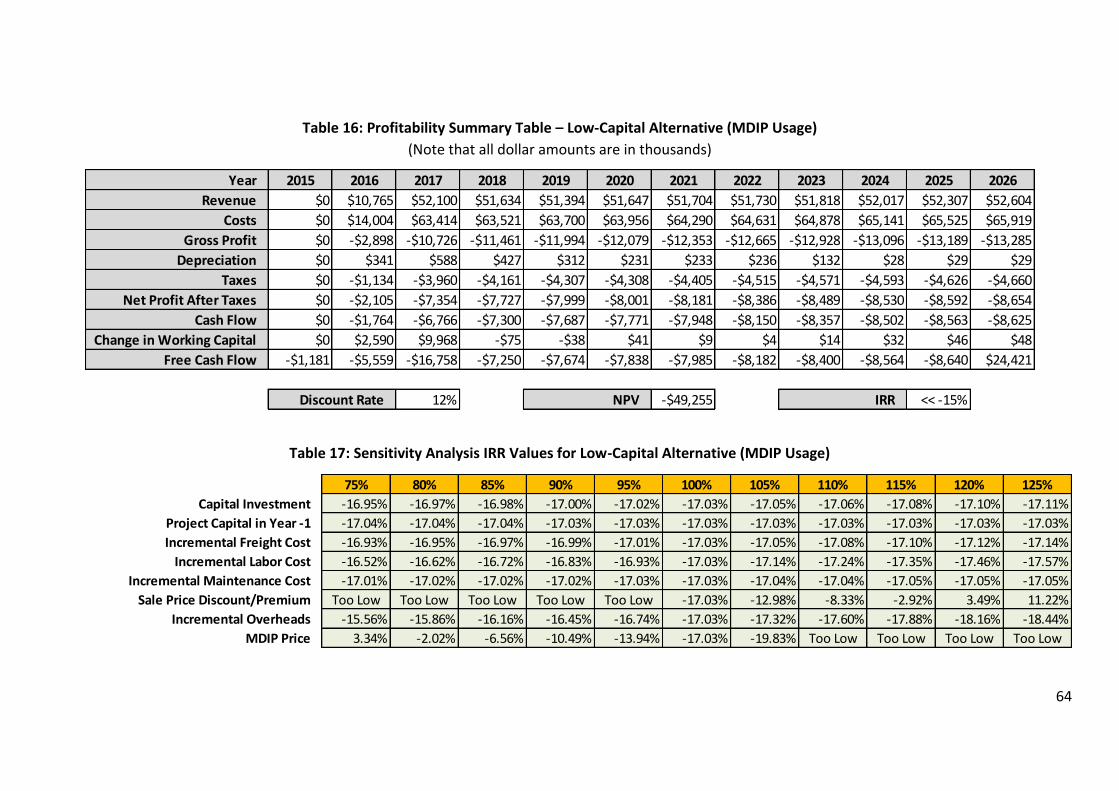
64
Table 16: Profitability Summary Table – Low-Capital Alternative (MDIP Usage)
(Note that all dollar amounts are in thousands)
Table 17: Sensitivity Analysis IRR Values for Low-Capital Alternative (MDIP Usage)
Year 2015 2016 2017 2018 2019 2020 2021 2022 2023 2024 2025 2026
Revenue $0 $10,765 $52,100 $51,634 $51,394 $51,647 $51,704 $51,730 $51,818 $52,017 $52,307 $52,604
Costs $0 $14,004 $63,414 $63,521 $63,700 $63,956 $64,290 $64,631 $64,878 $65,141 $65,525 $65,919
Gross Profit $0 -$2,898 -$10,726 -$11,461 -$11,994 -$12,079 -$12,353 -$12,665 -$12,928 -$13,096 -$13,189 -$13,285
Depreciation $0 $341 $588 $427 $312 $231 $233 $236 $132 $28 $29 $29
Taxes $0 -$1,134 -$3,960 -$4,161 -$4,307 -$4,308 -$4,405 -$4,515 -$4,571 -$4,593 -$4,626 -$4,660
Net Profit After Taxes $0 -$2,105 -$7,354 -$7,727 -$7,999 -$8,001 -$8,181 -$8,386 -$8,489 -$8,530 -$8,592 -$8,654
Cash Flow $0 -$1,764 -$6,766 -$7,300 -$7,687 -$7,771 -$7,948 -$8,150 -$8,357 -$8,502 -$8,563 -$8,625
Change in Working Capital $0 $2,590 $9,968 -$75 -$38 $41 $9 $4 $14 $32 $46 $48
Free Cash Flow -$1,181 -$5,559 -$16,758 -$7,250 -$7,674 -$7,838 -$7,985 -$8,182 -$8,400 -$8,564 -$8,640 $24,421
12% -$49,255 << -15%Discount Rate NPV IRR
75% 80% 85% 90% 95% 100% 105% 110% 115% 120% 125%
Capital Investment -16.95% -16.97% -16.98% -17.00% -17.02% -17.03% -17.05% -17.06% -17.08% -17.10% -17.11%
Project Capital in Year -1 -17.04% -17.04% -17.04% -17.03% -17.03% -17.03% -17.03% -17.03% -17.03% -17.03% -17.03%
Incremental Freight Cost -16.93% -16.95% -16.97% -16.99% -17.01% -17.03% -17.05% -17.08% -17.10% -17.12% -17.14%
Incremental Labor Cost -16.52% -16.62% -16.72% -16.83% -16.93% -17.03% -17.14% -17.24% -17.35% -17.46% -17.57%
Incremental Maintenance Cost -17.01% -17.02% -17.02% -17.02% -17.03% -17.03% -17.04% -17.04% -17.05% -17.05% -17.05%
Sale Price Discount/Premium Too Low Too Low Too Low Too Low Too Low -17.03% -12.98% -8.33% -2.92% 3.49% 11.22%
Incremental Overheads -15.56% -15.86% -16.16% -16.45% -16.74% -17.03% -17.32% -17.60% -17.88% -18.16% -18.44%
MDIP Price 3.34% -2.02% -6.56% -10.49% -13.94% -17.03% -19.83% Too Low Too Low Too Low Too Low
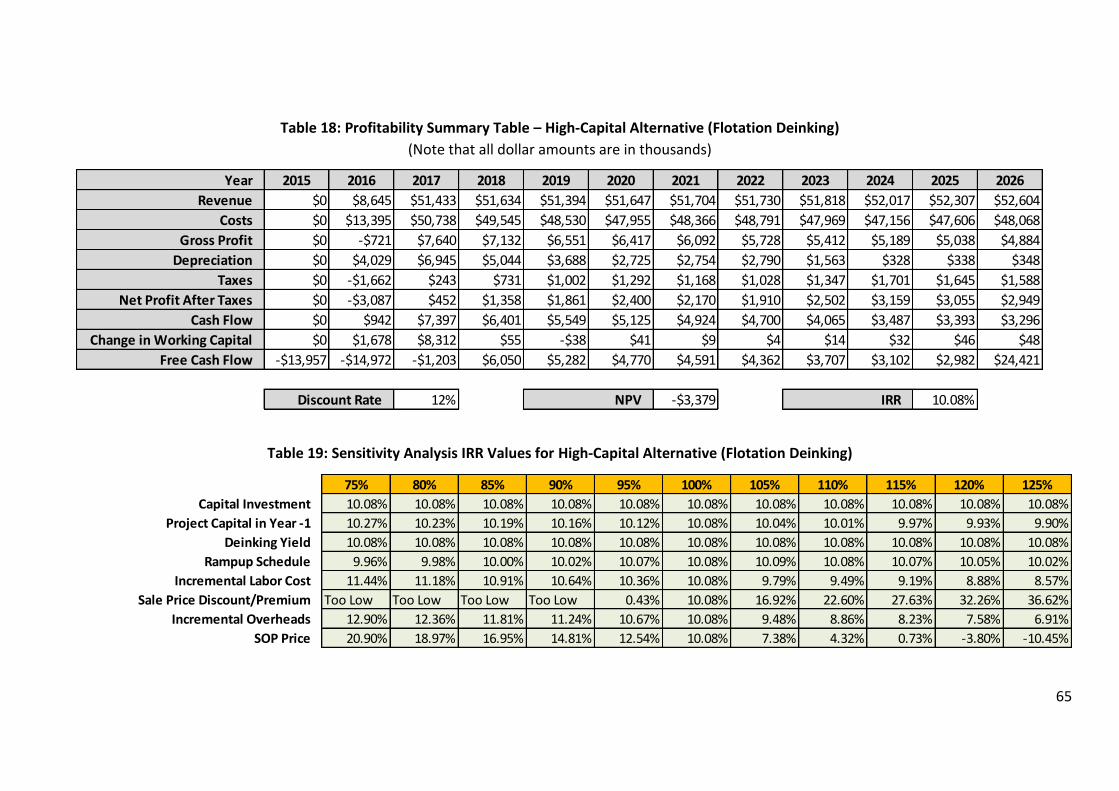
65
Table 18: Profitability Summary Table – High-Capital Alternative (Flotation Deinking)
(Note that all dollar amounts are in thousands)
Table 19: Sensitivity Analysis IRR Values for High-Capital Alternative (Flotation Deinking)
Year 2015 2016 2017 2018 2019 2020 2021 2022 2023 2024 2025 2026
Revenue $0 $8,645 $51,433 $51,634 $51,394 $51,647 $51,704 $51,730 $51,818 $52,017 $52,307 $52,604
Costs $0 $13,395 $50,738 $49,545 $48,530 $47,955 $48,366 $48,791 $47,969 $47,156 $47,606 $48,068
Gross Profit $0 -$721 $7,640 $7,132 $6,551 $6,417 $6,092 $5,728 $5,412 $5,189 $5,038 $4,884
Depreciation $0 $4,029 $6,945 $5,044 $3,688 $2,725 $2,754 $2,790 $1,563 $328 $338 $348
Taxes $0 -$1,662 $243 $731 $1,002 $1,292 $1,168 $1,028 $1,347 $1,701 $1,645 $1,588
Net Profit After Taxes $0 -$3,087 $452 $1,358 $1,861 $2,400 $2,170 $1,910 $2,502 $3,159 $3,055 $2,949
Cash Flow $0 $942 $7,397 $6,401 $5,549 $5,125 $4,924 $4,700 $4,065 $3,487 $3,393 $3,296
Change in Working Capital $0 $1,678 $8,312 $55 -$38 $41 $9 $4 $14 $32 $46 $48
Free Cash Flow -$13,957 -$14,972 -$1,203 $6,050 $5,282 $4,770 $4,591 $4,362 $3,707 $3,102 $2,982 $24,421
12% -$3,379 10.08%Discount Rate NPV IRR
75% 80% 85% 90% 95% 100% 105% 110% 115% 120% 125%
Capital Investment 10.08% 10.08% 10.08% 10.08% 10.08% 10.08% 10.08% 10.08% 10.08% 10.08% 10.08%
Project Capital in Year -1 10.27% 10.23% 10.19% 10.16% 10.12% 10.08% 10.04% 10.01% 9.97% 9.93% 9.90%
Deinking Yield 10.08% 10.08% 10.08% 10.08% 10.08% 10.08% 10.08% 10.08% 10.08% 10.08% 10.08%
Rampup Schedule 9.96% 9.98% 10.00% 10.02% 10.07% 10.08% 10.09% 10.08% 10.07% 10.05% 10.02%
Incremental Labor Cost 11.44% 11.18% 10.91% 10.64% 10.36% 10.08% 9.79% 9.49% 9.19% 8.88% 8.57%
Sale Price Discount/Premium Too Low Too Low Too Low Too Low 0.43% 10.08% 16.92% 22.60% 27.63% 32.26% 36.62%
Incremental Overheads 12.90% 12.36% 11.81% 11.24% 10.67% 10.08% 9.48% 8.86% 8.23% 7.58% 6.91%
SOP Price 20.90% 18.97% 16.95% 14.81% 12.54% 10.08% 7.38% 4.32% 0.73% -3.80% -10.45%