Embed Size (px)
Citation preview
INSTALLATION AND USER MANUAL TESS Photometer
Authors
Lucía García. Research Assistant. Universidad Complutense de Madrid (UCM)
Jaime Zamorano. Astrophysicist, Associate Professor. UCM
Carlos Tapia. Research and technical assistant in the laboratory of advanced scientific instrumentation. LICA-UCM.
Contents
1. Installation and configuration
1.1 General information 1.2. Setting TESS photometer
1.2.1. Online configuration 1.2.2. Local mode configuration.
1.3 Where and how to install TESS photometer 2. Use and data analysis
2.1. Sky brightness 2.2. Checking TESS data online 2.3. Checking TESS local data
2.3.1 Data tab 2.3.2 Graphics tab
2.3.2.1 Brightness 2.3.2.2 Temperature 2.3.2.3 Clouds
TESS photometer. Installation and configuration
1. General information
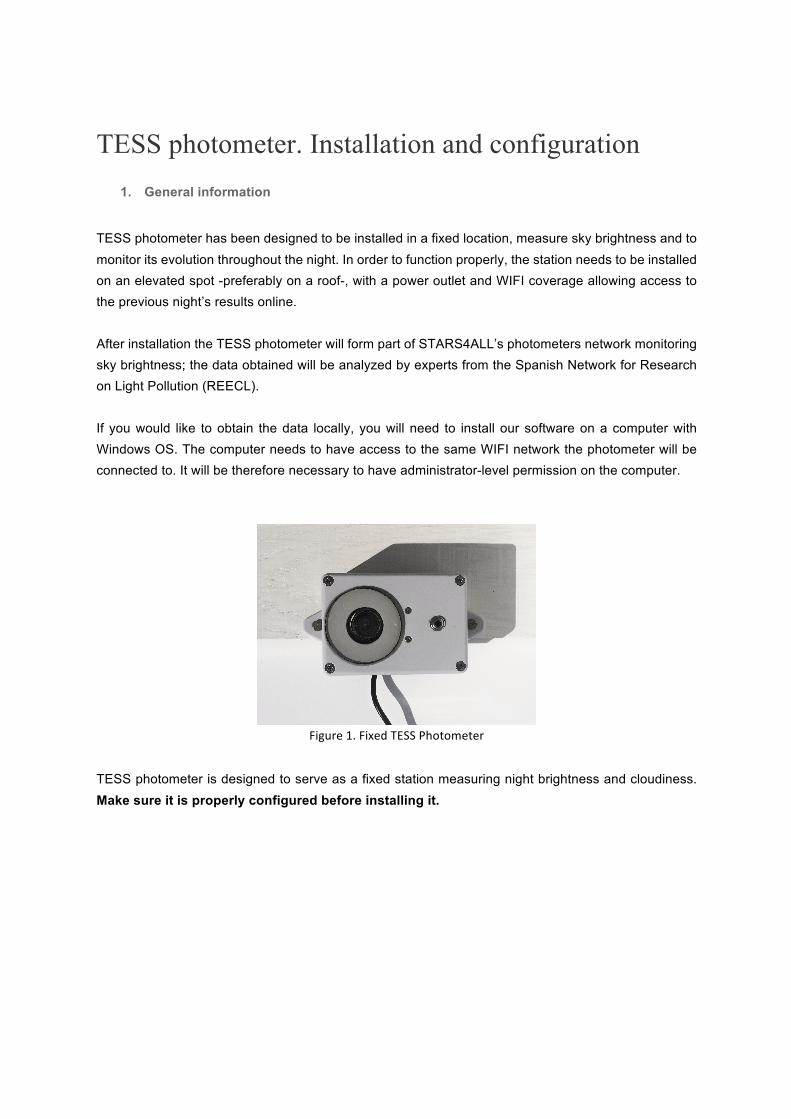
TESS photometer has been designed to be installed in a fixed location, measure sky brightness and to monitor its evolution throughout the night. In order to function properly, the station needs to be installed on an elevated spot -preferably on a roof-, with a power outlet and WIFI coverage allowing access to the previous night’s results online. After installation the TESS photometer will form part of STARS4ALL’s photometers network monitoring sky brightness; the data obtained will be analyzed by experts from the Spanish Network for Research on Light Pollution (REECL). If you would like to obtain the data locally, you will need to install our software on a computer with Windows OS. The computer needs to have access to the same WIFI network the photometer will be connected to. It will be therefore necessary to have administrator-level permission on the computer.
Figure1.FixedTESSPhotometer
TESS photometer is designed to serve as a fixed station measuring night brightness and cloudiness. Make sure it is properly configured before installing it.
2. Setting TESS photometer
2.1. WIFI configuration
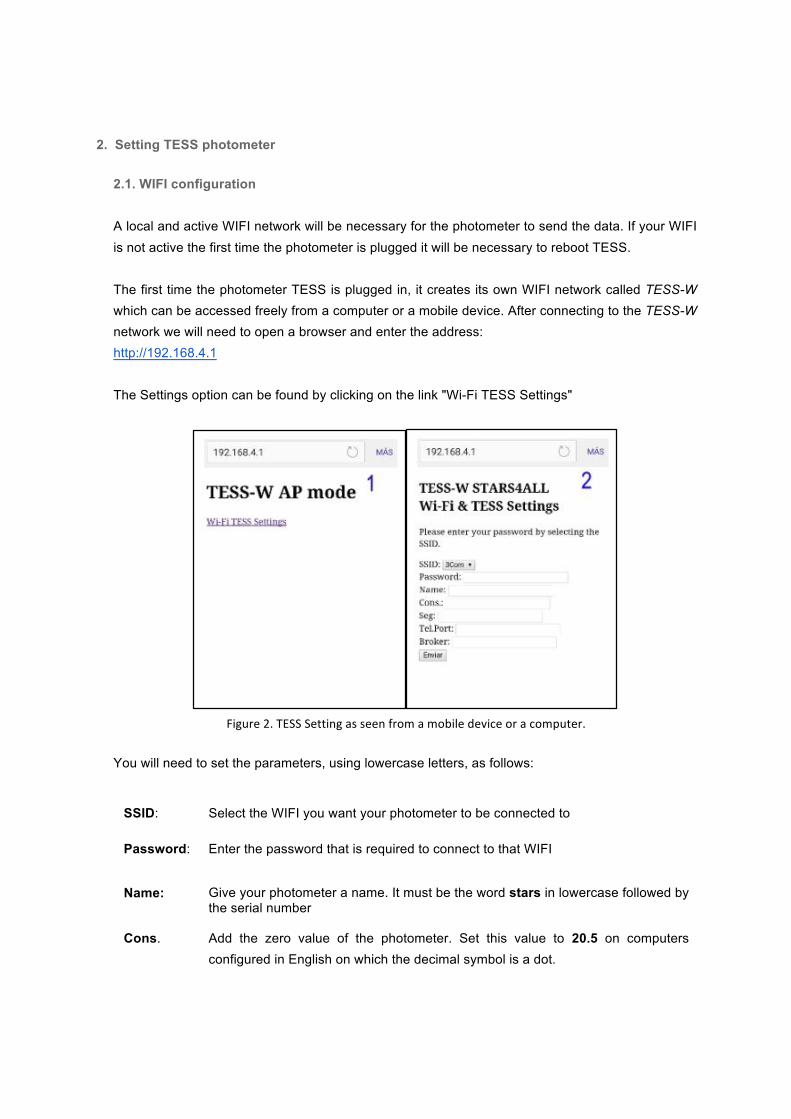
A local and active WIFI network will be necessary for the photometer to send the data. If your WIFI is not active the first time the photometer is plugged it will be necessary to reboot TESS. The first time the photometer TESS is plugged in, it creates its own WIFI network called TESS-W which can be accessed freely from a computer or a mobile device. After connecting to the TESS-W network we will need to open a browser and enter the address: http://192.168.4.1 The Settings option can be found by clicking on the link "Wi-Fi TESS Settings"
Figure2.TESSSettingasseenfromamobiledeviceoracomputer.
You will need to set the parameters, using lowercase letters, as follows:
SSID: Select the WIFI you want your photometer to be connected to
Password: Enter the password that is required to connect to that WIFI
Name: Give your photometer a name. It must be the word stars in lowercase followed by the serial number
Cons. Add the zero value of the photometer. Set this value to 20.5 on computers configured in English on which the decimal symbol is a dot.
Seg. This parameter determines the frequency the photometer is to take measurements. Please set this value to 60.
Tel. Port: Local access port. 23 by default.
Broker: To enable the remote observatory please set astrix.fis.ucm.es as server.
Once this part of the configuration is done it will be then necessary to unplug the photometer from the electricity outlet and plug it in again after 30 seconds. The configuration is completed now and TESS should take measurements and send the data to the Broker. Before taking the photometer TESS to the place where it will be finally installed it is advisable to check out the data being sent and whether they are duly received. Changing the settings In case you want to change the settings, such as after a password change in the wireless network, the photometer needs to be turned on in an environment in which the network is not available. To do this you can either switch off the network, or inhibit the WIFI signal, or uninstall the photometer from its location and switch it on out of the reach of the network signal. Once you have plugged the photometer again, on the page http://192.168.4.1 a reset message will appear asking you to do so. After the reset you will be able to access the "WIFI Tess Settings" menu if you unplug the photometer again and plug it within the range of the new wireless network. It is possible that the photometer will need a few minutes to find it.
2. 2 Local mode configuration.
To get your measurements locally you will need to run the software, which link is provided on the link below, on a computer connected to the same WIFI network the photometer is connected too. The application requires a computer with Windows OS: http://www.observatorioremoto.com/tess/tess.zip
To run it you will only need to unpack the zip file and run Tess.exe. Some antivirus software prevents TESS.exe installation and connection so it might be necessary to disable them temporarily. Before anything else, check whether the adjustments applied through the router connection function properly. In order to do so, go to the Settings tab
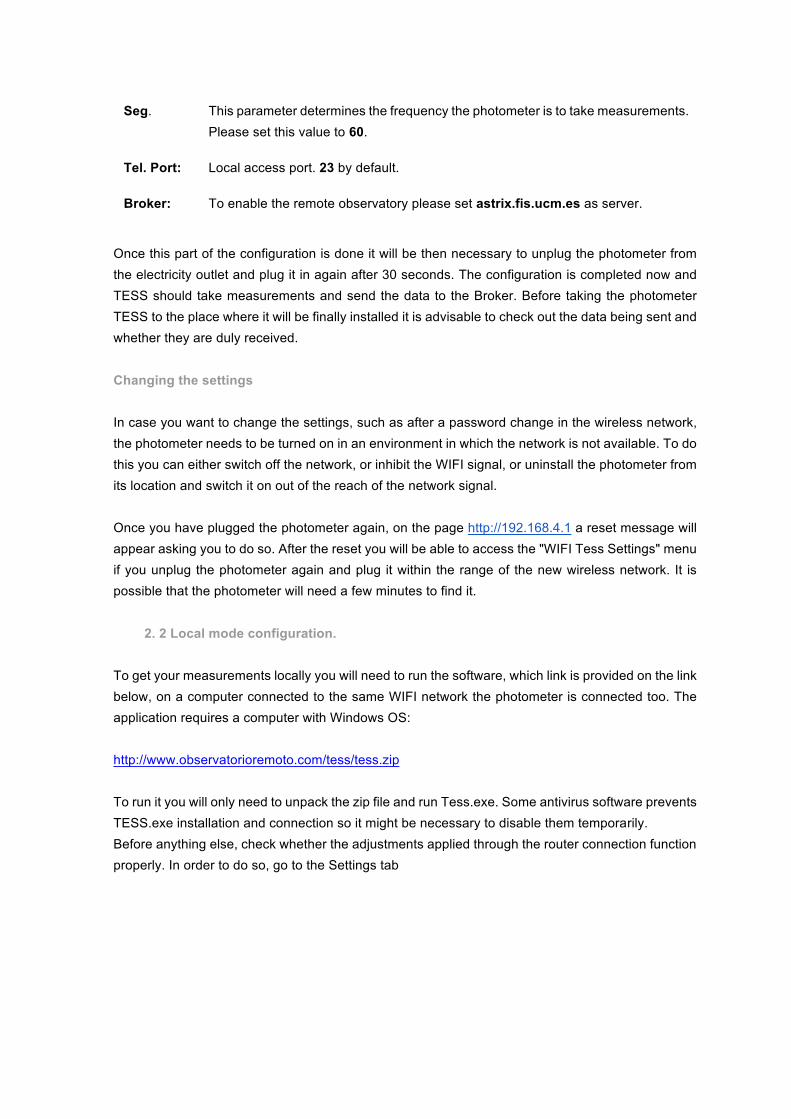
Settings tab Under this tab you will be able to establish the values corresponding to Alarms, Configuration and Control.
Figure3.Settingsscreenwiththeconfigurationparametersinserted.
Settings If you have already configured photometer TESS through http://192.168.4.1, the parameters will appear on this tab automatically. The COM port should be configured as COM: 0 if the computer is connected to the router by WIFI, and COM 4 if it is by wire. TESS photometer will need a free IP on the local network that had never been assigned to another device. To be sure it may be necessary to use to scan the local WIFI network with an application like “IP scanner” to check the IPs that have been already occupied. We will need you to fill the coordinates of your TESS location (latitude and longitude) so they appear in the data files. Please include them under the word SITE. A screenshot is supplied to provide the rest of the data, in case they might be accidentally modified.
Calibration Every photometer has a different zero point. Check in this section that the instrumental constant is the one the departamento de Astrofísica UCM has provided to you. (Use a dot to indicate decimal in all computers configured in English in which the default decimal symbol is a dot).
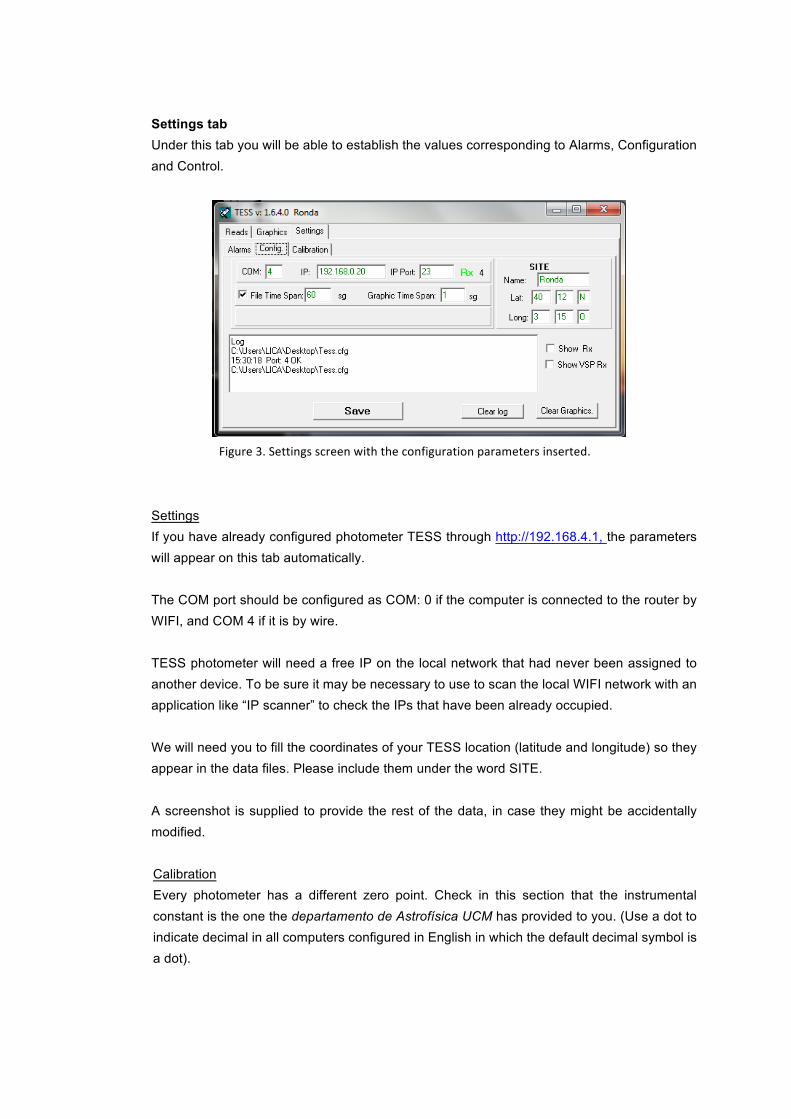
Although this photometer does not have accelerometer and magnetometer options please keep its parameters on the Calibration tab as initially established to ensure the photometer will work properly.
Figure4.Calibrationsettingsscreen.
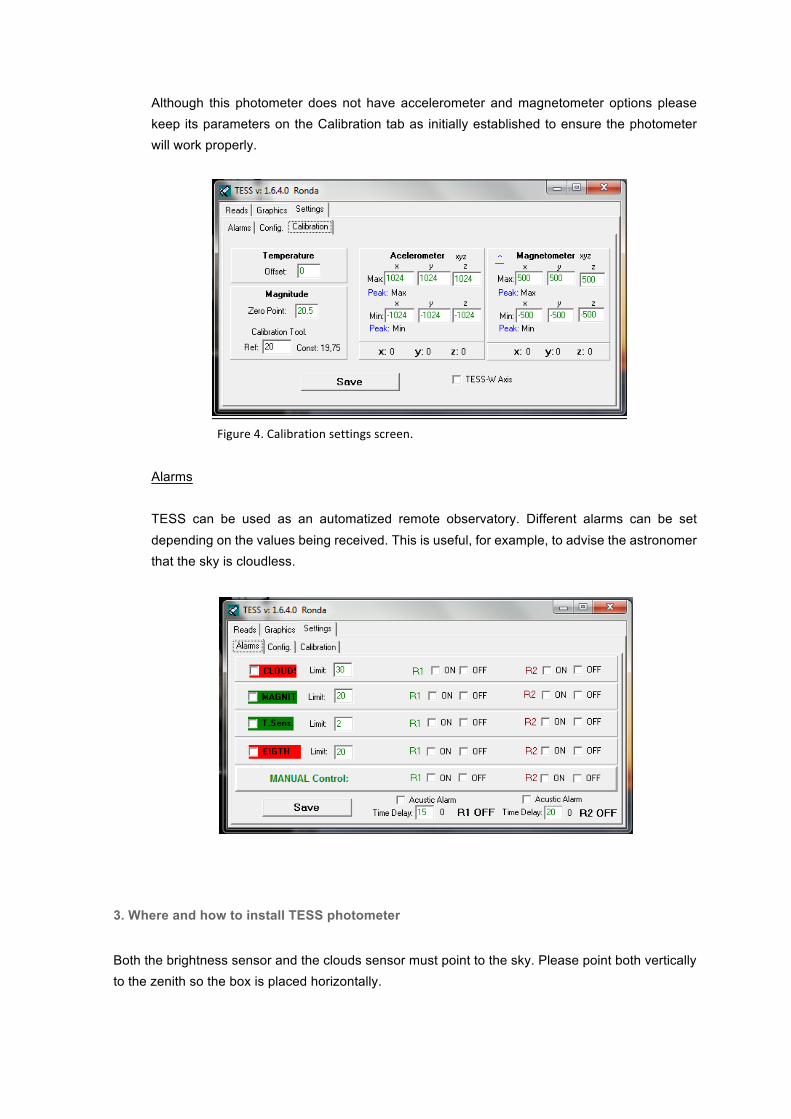
Alarms TESS can be used as an automatized remote observatory. Different alarms can be set depending on the values being received. This is useful, for example, to advise the astronomer that the sky is cloudless.
3. Where and how to install TESS photometer
Both the brightness sensor and the clouds sensor must point to the sky. Please point both vertically to the zenith so the box is placed horizontally.
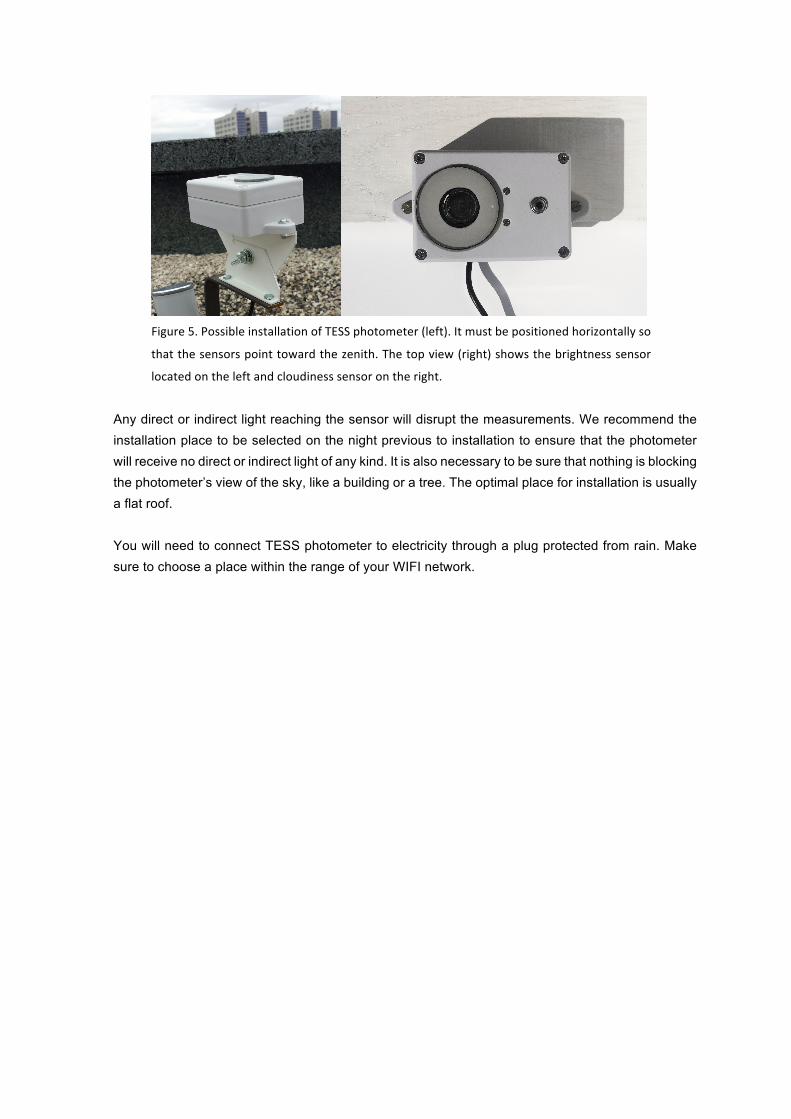
Figure5.PossibleinstallationofTESSphotometer(left).Itmustbepositionedhorizontallyso
thatthesensorspointtowardthezenith.Thetopview(right)showsthebrightnesssensor
locatedontheleftandcloudinesssensorontheright. Any direct or indirect light reaching the sensor will disrupt the measurements. We recommend the installation place to be selected on the night previous to installation to ensure that the photometer will receive no direct or indirect light of any kind. It is also necessary to be sure that nothing is blocking the photometer’s view of the sky, like a building or a tree. The optimal place for installation is usually a flat roof. You will need to connect TESS photometer to electricity through a plug protected from rain. Make sure to choose a place within the range of your WIFI network.
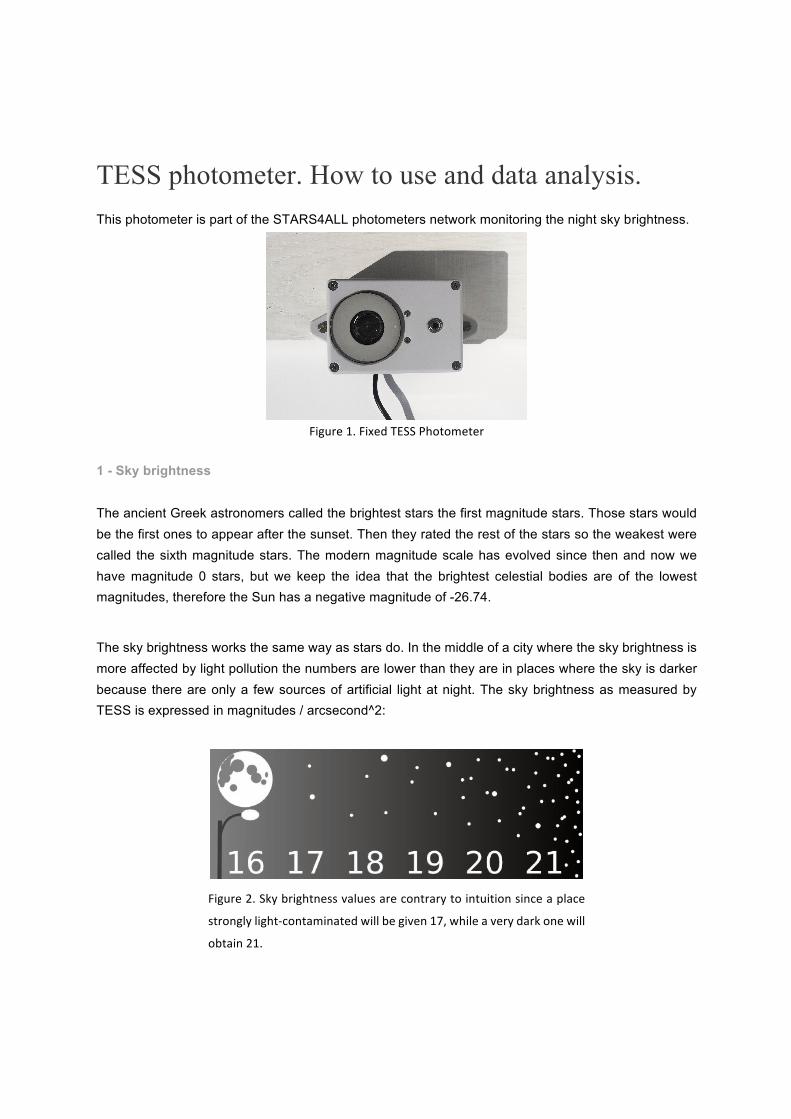
TESS photometer. How to use and data analysis. This photometer is part of the STARS4ALL photometers network monitoring the night sky brightness.
Figure1.FixedTESSPhotometer
1 - Sky brightness The ancient Greek astronomers called the brightest stars the first magnitude stars. Those stars would be the first ones to appear after the sunset. Then they rated the rest of the stars so the weakest were called the sixth magnitude stars. The modern magnitude scale has evolved since then and now we have magnitude 0 stars, but we keep the idea that the brightest celestial bodies are of the lowest magnitudes, therefore the Sun has a negative magnitude of -26.74.
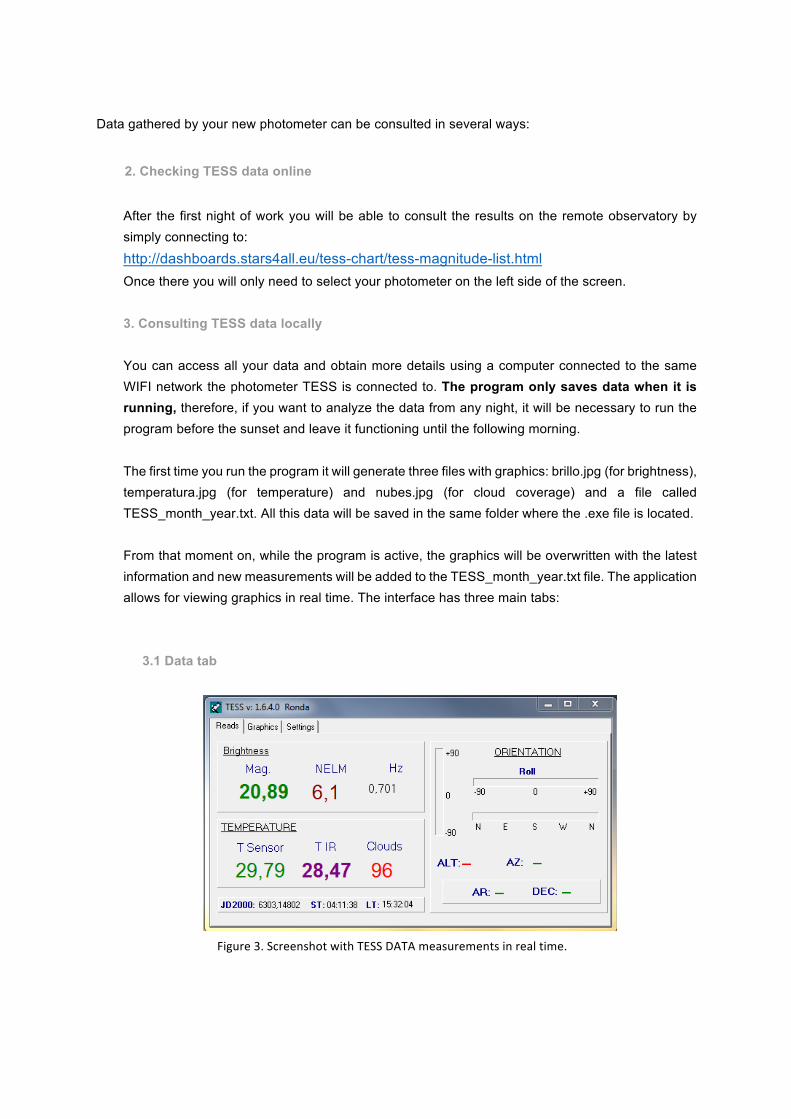
The sky brightness works the same way as stars do. In the middle of a city where the sky brightness is more affected by light pollution the numbers are lower than they are in places where the sky is darker because there are only a few sources of artificial light at night. The sky brightness as measured by TESS is expressed in magnitudes / arcsecond^2:
Figure2.Skybrightnessvaluesarecontrarytointuitionsinceaplace
stronglylight-contaminatedwillbegiven17,whileaverydarkonewill
obtain21.
Data gathered by your new photometer can be consulted in several ways:
2. Checking TESS data online
After the first night of work you will be able to consult the results on the remote observatory by simply connecting to: http://dashboards.stars4all.eu/tess-chart/tess-magnitude-list.html Once there you will only need to select your photometer on the left side of the screen. 3. Consulting TESS data locally You can access all your data and obtain more details using a computer connected to the same WIFI network the photometer TESS is connected to. The program only saves data when it is running, therefore, if you want to analyze the data from any night, it will be necessary to run the program before the sunset and leave it functioning until the following morning. The first time you run the program it will generate three files with graphics: brillo.jpg (for brightness), temperatura.jpg (for temperature) and nubes.jpg (for cloud coverage) and a file called TESS_month_year.txt. All this data will be saved in the same folder where the .exe file is located. From that moment on, while the program is active, the graphics will be overwritten with the latest information and new measurements will be added to the TESS_month_year.txt file. The application allows for viewing graphics in real time. The interface has three main tabs:
3.1 Data tab
Figure3.ScreenshotwithTESSDATAmeasurementsinrealtime.
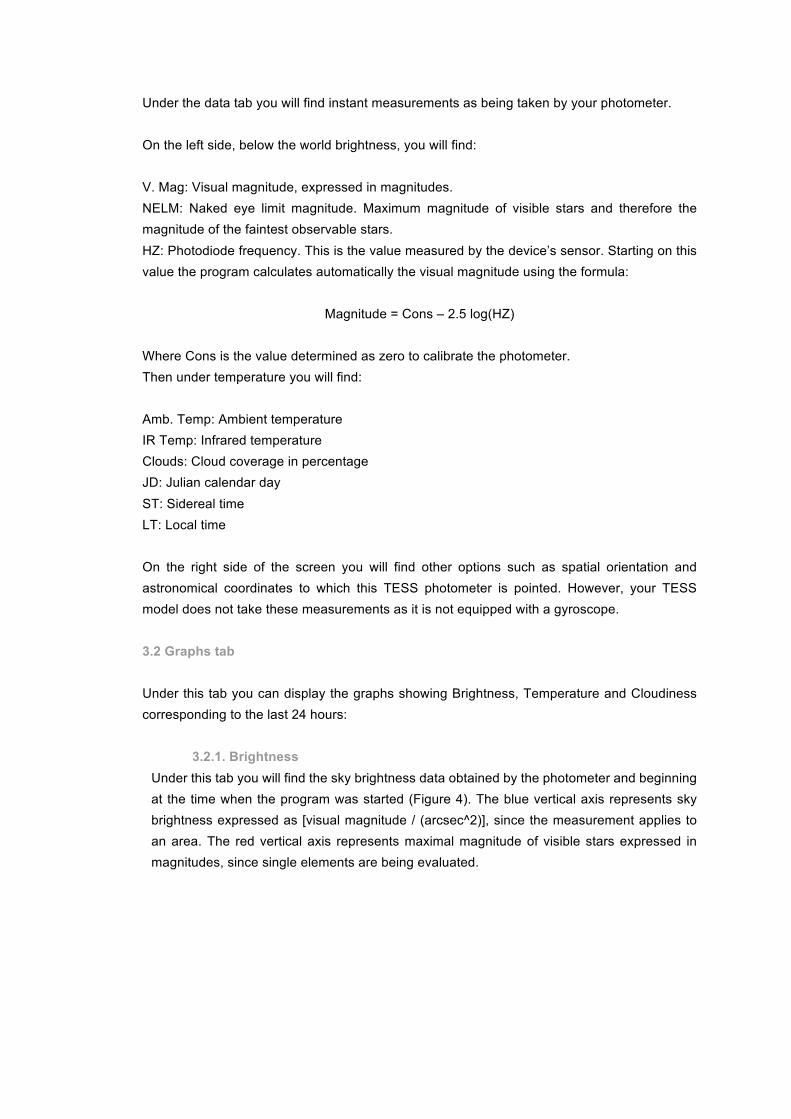
Under the data tab you will find instant measurements as being taken by your photometer. On the left side, below the world brightness, you will find: V. Mag: Visual magnitude, expressed in magnitudes. NELM: Naked eye limit magnitude. Maximum magnitude of visible stars and therefore the magnitude of the faintest observable stars. HZ: Photodiode frequency. This is the value measured by the device’s sensor. Starting on this value the program calculates automatically the visual magnitude using the formula:
Magnitude = Cons – 2.5 log(HZ)
Where Cons is the value determined as zero to calibrate the photometer. Then under temperature you will find: Amb. Temp: Ambient temperature IR Temp: Infrared temperature Clouds: Cloud coverage in percentage JD: Julian calendar day ST: Sidereal time LT: Local time On the right side of the screen you will find other options such as spatial orientation and astronomical coordinates to which this TESS photometer is pointed. However, your TESS model does not take these measurements as it is not equipped with a gyroscope.
3.2 Graphs tab Under this tab you can display the graphs showing Brightness, Temperature and Cloudiness corresponding to the last 24 hours: 3.2.1. Brightness
Under this tab you will find the sky brightness data obtained by the photometer and beginning at the time when the program was started (Figure 4). The blue vertical axis represents sky brightness expressed as [visual magnitude / (arcsec^2)], since the measurement applies to an area. The red vertical axis represents maximal magnitude of visible stars expressed in magnitudes, since single elements are being evaluated.
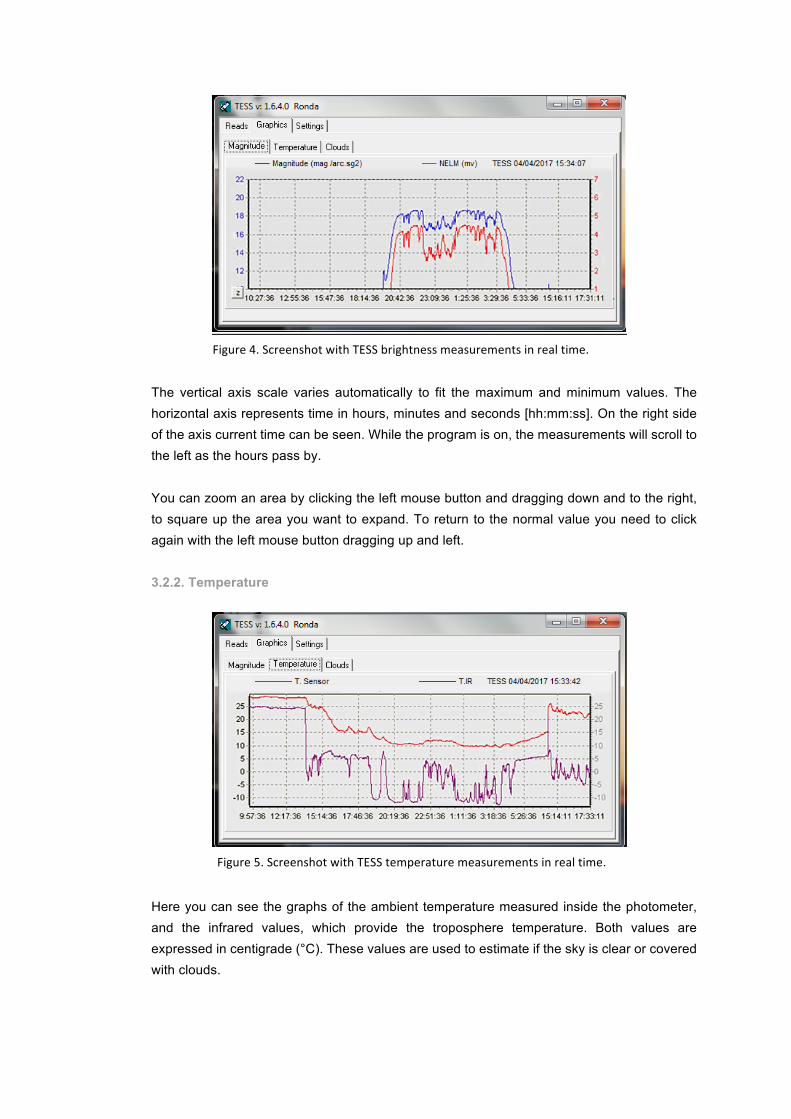
Figure4.ScreenshotwithTESSbrightnessmeasurementsinrealtime.
The vertical axis scale varies automatically to fit the maximum and minimum values. The horizontal axis represents time in hours, minutes and seconds [hh:mm:ss]. On the right side of the axis current time can be seen. While the program is on, the measurements will scroll to the left as the hours pass by.
You can zoom an area by clicking the left mouse button and dragging down and to the right, to square up the area you want to expand. To return to the normal value you need to click again with the left mouse button dragging up and left.
3.2.2. Temperature
Figure5.ScreenshotwithTESStemperaturemeasurementsinrealtime.
Here you can see the graphs of the ambient temperature measured inside the photometer, and the infrared values, which provide the troposphere temperature. Both values are expressed in centigrade (°C). These values are used to estimate if the sky is clear or covered with clouds.
3.2.3. Cloudiness
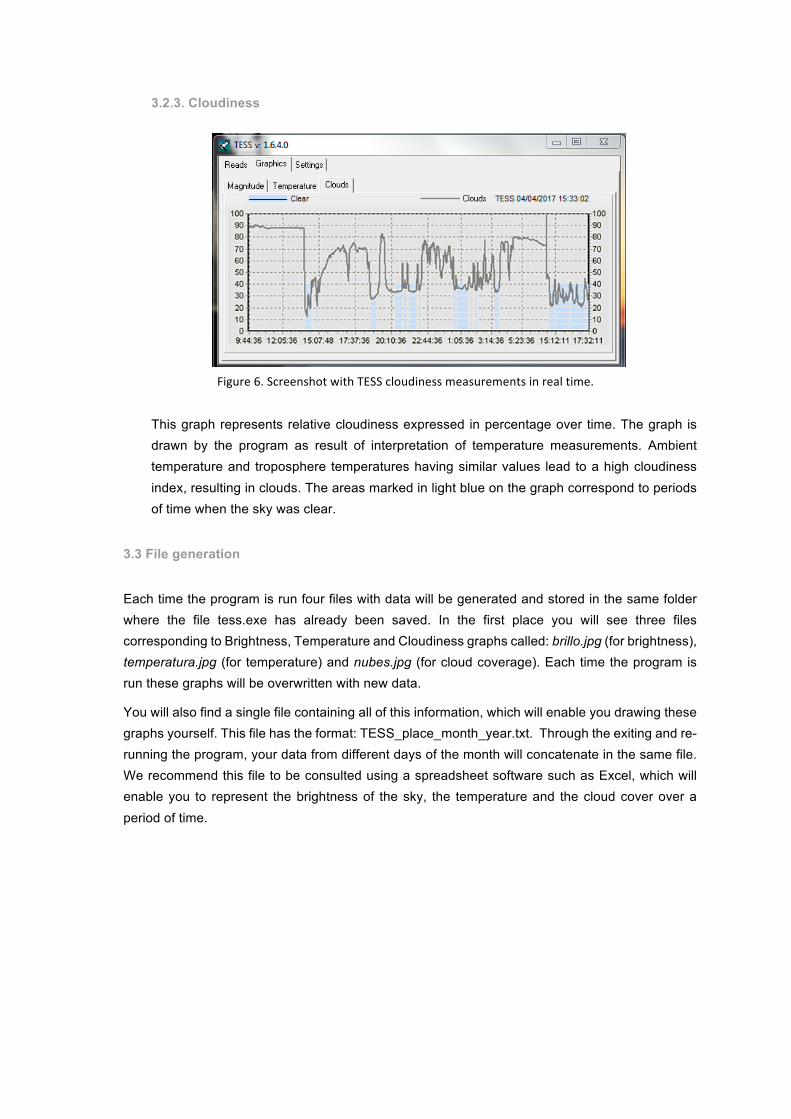
Figure6.ScreenshotwithTESScloudinessmeasurementsinrealtime.
This graph represents relative cloudiness expressed in percentage over time. The graph is drawn by the program as result of interpretation of temperature measurements. Ambient temperature and troposphere temperatures having similar values lead to a high cloudiness index, resulting in clouds. The areas marked in light blue on the graph correspond to periods of time when the sky was clear.
3.3 File generation
Each time the program is run four files with data will be generated and stored in the same folder where the file tess.exe has already been saved. In the first place you will see three files corresponding to Brightness, Temperature and Cloudiness graphs called: brillo.jpg (for brightness), temperatura.jpg (for temperature) and nubes.jpg (for cloud coverage). Each time the program is run these graphs will be overwritten with new data.
You will also find a single file containing all of this information, which will enable you drawing these graphs yourself. This file has the format: TESS_place_month_year.txt. Through the exiting and re-running the program, your data from different days of the month will concatenate in the same file. We recommend this file to be consulted using a spreadsheet software such as Excel, which will enable you to represent the brightness of the sky, the temperature and the cloud cover over a period of time.
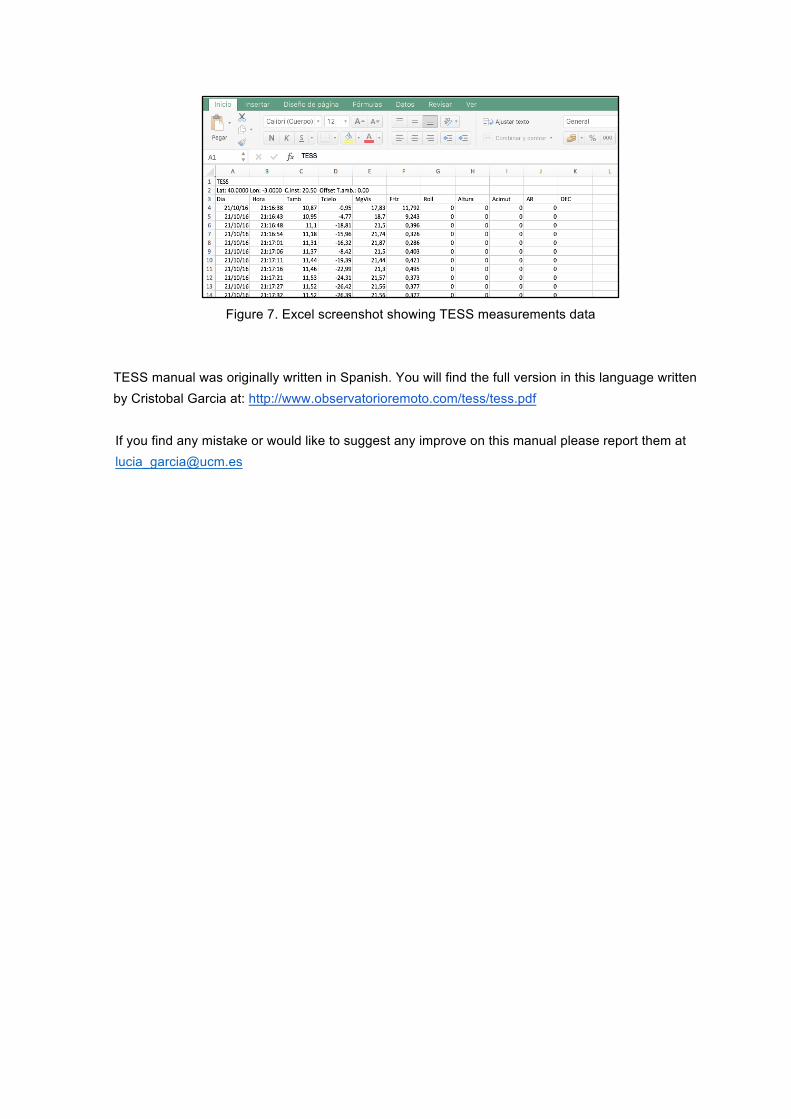
Figure 7. Excel screenshot showing TESS measurements data
TESS manual was originally written in Spanish. You will find the full version in this language written by Cristobal Garcia at: http://www.observatorioremoto.com/tess/tess.pdf
If you find any mistake or would like to suggest any improve on this manual please report them at [email protected]