Embed Size (px)
Citation preview
Working Paper
Inspection Targeting Issues for the California Department of Industrial Relations Division of Occupational Safety and Health
John Mendeloff and Seth Seabury
Center for Health and Safety in the Workplace RAND Safety and Justice Program
WR-1007-CHSWC October 2013 Prepared for the California Commission on Health and Safety and Workers’ Compensation
RAND working papers are intended to share researchers’ latest findings. Although this working paper has been peer reviewed and approved for circulation by the RAND Safety and Justice Program, the research should be treated as a work in progress. Unless otherwise indicated, working papers can be quoted and cited without permission of the author, provided the source is clearly referred to as a working paper. RAND’s publications do not necessarily reflect the opinions of its research clients and sponsors. is a registered trademark.


iii
Preface
This document was prepared at the request of the California Department of Industrial Relations and the California Commission on Health and Safety and Workers’ Compensation. Its objective is to examine the role of different inspection types in the enforcement program of the California Department of Industrial Relations Division of Occupational Safety and Health (Cal-OSHA) program and to identify changes that might be considered, as well as areas for further study. The chief audience for the study is the community concerned with occupational safety and health nationally, but especially in California.
RAND Center for Health and Safety in the Workplace The RAND Center for Health and Safety in the Workplace is dedicated to reducing
workplace injuries and illnesses. The center provides objective, innovative, cross-cutting research to improve understanding of the complex network of issues that affect occupational safety, health, and workers’ compensation. Its vision is to become the nation’s leader in improving workers’ health and safety policy. Program research is supported by government agencies, foundations, and the private sector.
The center is housed in the RAND Safety and Justice Program, which addresses all aspects of public safety and the criminal justice system, including violence, policing, corrections, courts and criminal law, substance abuse, occupational safety, and public integrity. The center also draws on the expertise in RAND Health, one of the most trusted sources of objective health policy research in the world.
Questions or comments about this report should be sent to the project leader, John Mendeloff ([email protected]). For more information on the RAND Center for Health and Safety in the Workplace, see http://www.rand.org/jie/centers/workplace-health-safety.html or contact the director ([email protected]).


v
Contents
Preface ............................................................................................................................................ iii Figures........................................................................................................................................... vii Tables ............................................................................................................................................. ix Summary ........................................................................................................................................ xi Acknowledgments ......................................................................................................................... xv Abbreviations .............................................................................................................................. xvii 1. Introduction ................................................................................................................................. 1 2. Cal-OSHA Inspections and Serious Violation Rates .................................................................. 5 3. Complaint Inspections and Injury Rates ................................................................................... 11 4. Disparities in Complaint Inspection Rates Between Northern and Southern California
Counties .................................................................................................................................. 15 5. Reporting of Accidents to Cal-OSHA ...................................................................................... 19 6. Multiple Inspections at the Same Establishment ...................................................................... 23 7. Conclusion ................................................................................................................................ 25 Appendix ....................................................................................................................................... 27 References ..................................................................................................................................... 29


vii
Figures
Figure 2.1: OSHA Inspections, by Type and Year ......................................................................... 5 Figure 3.1: Compared with Programmed Inspections, Complaint Inspections Take
Cal-OSHA to Establishments with Higher Injury Rates Within Their Industries ................ 14


ix
Tables
Table 2.1: Average Number of Serious Violations per Inspection, by Inspection Type: Accident Investigation or Complaint Inspection .................................................................... 8
Table 2.2: Average Number of Serious Violations per Inspection, Manufacturing Sector, by Size and Inspection Type ....................................................................................... 9
Table 2.3: Average Number of Serious Violations per Inspection, Construction Sector, by Size and Inspection Type ..................................................................................... 10
Table 3.1: Lost-Workday Injury Rates per 100 Workers, by Industry and Inspection Type, 2002–2010 .................................................................................................................. 12
Table 3.2: Percentage of California Inspections Accounted for by Each Type in Selected Industries, 1996–2010 ............................................................................................ 13
Table 4.1: Complaint Inspections per 1,000 Establishments, by County ..................................... 16 Table 4.2: Programmed Inspections per 1,000 Establishments, by County ................................. 17 Table 5.1: Accident Inspections in Construction per 1,000 Construction
Establishments ...................................................................................................................... 21 Table 6.1: Serious Violations per Inspection, by Inspection Type and Sequence:
Subsequent Inspections Cite Fewer Serious Violations ........................................................ 24


xi
Summary
This paper was commissioned by the California Department of Industrial Relations to examine the different types of inspections that the California Department of Industrial Relations Division of Occupational Safety and Health (Cal-OSHA) carries out and the roles that they play. It focuses on the three major inspection types in California: programmed (planned) inspections, complaint inspections, and accident investigations. It investigates several different issues:
• the average number of serious violations found during different inspection types and the average injury rates at the establishments that receive each type of inspection
• how those measures vary with establishment size and the sequence of the inspection • how rates of complaint and programmed inspections vary across counties • a comparison across counties of the rates of all accident investigations with the rates for
those limited to fatalities. Although we discuss programmed inspections, the focus of this study is on findings about
complaint and accident inspections. We summarize the chief findings from reviewing the data here.
The Number of Violations Cited and the Injury Rate at Inspected Establishments As is well known, programmed inspections in general industry cite substantially more serious
violations (and total violations) than other inspection types do. However, complaint inspections take inspectors to workplaces whose injury rates are higher.
The Frequency of Complaint Inspections The number of complaint inspections fell sharply after 1992, dropping from 8,000 per year to
fewer than 3,000 in recent years. However, because of changes in the method of responding to complaints, we do not know the change in the number of actual complaints for this period. Cal-OSHA (and OSHA) adopted a policy for dealing with “informal” complaints (defined as cases in which the complainant was unwilling to give his or her name) that relied primarily on a letter or fax to the employer rather than on an inspection. The employer was required to respond and to explain what it had done to abate the alleged hazard. One out of five of these fax-letter cases is supposed to be followed up by an inspection.
Unfortunately, neither Cal-OSHA nor OSHA maintains records on the number of these fax-letter complaints or on the subject of the hazard in its computerized files. In addition, there is no way to identify the inspections that were conducted to verify the employer’s compliance statements. Thus, we have almost no information on either the magnitude of this procedure or on how it is working.

xii
Variation in the Rate of Complaint Inspections Across Counties We also examined how the frequency of complaint inspections varied across counties. We
compared the number of inspections from 2002–2011 with the number of establishments in each county from the 2010 County Business Patterns data. In both construction and manufacturing, we found two-fold or greater differences (more in construction) across counties in the number of complaint inspections per 1,000 establishments (or, in construction, firms). The rates were lower in rural counties and in Southern California than in a dozen counties in the San Francisco–Sacramento region.
Cal-OSHA noted that it allocates its resources roughly in line with regional employment. As a result, the lower number of complaint inspections would be accompanied by a larger number of programmed inspections. When we looked at programmed inspections, however, we found that the southern and rural counties still had lower inspection rates, although the differences were much smaller.
Reporting of Hospitalizations and Amputations to the California Department of Industrial Relations Division of Occupational Safety and Health California requires that acute injuries that involve hospitalization for more than 24 hours
(except for observation) and amputations must, along with fatalities, be reported to Cal-OSHA within eight hours. Except for cases in which other law enforcement agencies have jurisdiction (assaults and highway crashes), Cal-OSHA is obligated to investigate these injuries. Although most believe that fatalities are well-reported, the quality of reporting of nonfatal cases is less clear. National data suggest that the number of hospitalizations is probably well above the roughly 2,000 cases reported in California.
We examined the number of accident investigations in construction carried out in each county (separately for fatal and nonfatal cases) and the percentages of the total that were investigations of fatal injuries. The figures ranged from ten nonfatal cases for each fatal case in San Francisco to three fatal cases for each nonfatal case in Kings County. Because the San Francisco figure is closer to what most experts believe is the truth and because many counties in rural areas and in Southern California share the Kings County pattern, the implication is that there is a great deal of underreporting of hospitalizations, at least in construction.
Multiple Inspections at the Same Establishment Earlier studies of federal OSHA inspections showed that the number of serious violations
cited per inspections fell by about 50 percent after the first inspection and more slowly thereafter. In California, the fall-off is not as fast and varies by inspection type. However, the results do suggest that it may be useful to put a priority on workplaces that have not had frequent inspections.

xiii
Recommendations Informed by our findings, we make the following recommendations:
• Cal-OSHA says that the fax-letter procedure is used to respond to complaints for which the complainant is unwilling to sign his or her name or leave contact information. Yet one idea behind the original fax-letter procedure was that the agency would check back with the complainant to see whether he or she was satisfied with what the employer had said and done. But Cal-OSHA cannot check back if it lacks contact information. The absence of that information makes it more important to maintain data on the complaints that are handled through the fax-letter procedure. Currently, there is no simple way to track the results of those one in five inspections that are carried out to validate employer compliance. In addition, for regular complaint inspections, Cal-OSHA should maintain information about the subject of the complaints; it could use that information to assess how good workers were at identifying different hazards.
• It is clear that workers in some counties are much less likely to submit written complaints to OSHA than workers in others. Cal-OSHA should consider whether it should do more to ensure that its services are provided to workers in in those counties.
• Workplaces in high-injury-rate industries that have not been inspected at all or not for many years should be identified and deserve some priority in programmed inspections.
• The Department of Industrial Relations needs to develop a system for identifying the hospitalizations (and amputations) that employers are supposed to immediately report to Cal-OSHA.
• The Department of Industrial Relations should evaluate the impact of devoting resources to accident investigations versus other uses.


xv
Acknowledgments
This research was supported by the California Commission on Health and Safety and Workers’ Compensation and by the Department of Industrial Relations. We thank Lachlan Taylor, Irina Nemirovsky, Christine Baker, and Amy Coombe for their assistance. We are grateful for discussions with several California Department of Industrial Relations Division of Occupational Safety and Health officials about enforcement practices. Wayne Gray, Frank Neuhauser, and Len Welsh commented on earlier drafts of this paper. Barbara Hennessey and Michelle Horner assisted in the preparation of the manuscript. Brian Jackson, Tom LaTourrette, and an outside reviewer provide useful comments.


xvii
Abbreviations
AI accident investigation
Cal-OSHA California Department of Industrial Relations Division of Occupational Safety and Health
CHSWC California Commission on Health and Safety and Workers’ Compensation
DART days away, restricted, or transferred
FY fiscal year
IMIS Integrated Management Information System
ODI Occupational Safety and Health Administration Data Initiative
OSHA Occupational Safety and Health Administration
SIC standard industrial classification
SO safety order

1
1. Introduction
This paper was commissioned by the California Department of Industrial Relations to examine the different types of inspections that the California Department of Industrial Relations Division of Occupational Safety and Health (Cal-OSHA) carries out and the roles that they play. It focuses on the three major inspection types in California: programmed (planned) inspections, complaint inspections, and accident investigations (AIs). It investigates several different issues:
• the average number of serious violations found during different inspection types and the average injury rates at the establishments that receive each type of inspection
• how those measures vary with establishment size and the sequence of the inspection • how rates of complaint and programmed inspections vary across counties • a comparison across counties of the rates of all AIs with the rates for those limited to
fatalities. The findings on these issues have a bearing on the how inspections should be allocated
across firms with different characteristics and across different types of inspections. The issue of allocating Cal-OSHA inspections can be addressed on several different levels:
• First, there is the issue of allocating inspections among different inspection types: responses to complaints, AIs, programmed inspections, follow-up inspections, and others.
• Second, if Cal-OSHA focuses on programmed inspections, rather than the “reactive” types, how should they be targeted across industries and establishments? Cal-OSHA is examining how to revise its targeting of programmed inspections.
• A third level is what has been called internal targeting: Once at a workplace, what are the aspects of the operation on which should inspectors focus?
All three of these levels are important. In this report, although the three are related, we focus on the first issue.1 The objective of the paper is to clarify the strengths and weaknesses of different inspection types.2 Some of the information here is familiar to Cal-OSHA officials, but other parts may not be. In addition, we hope that the analyses presented here are helpful for others who are trying to better understand the enforcement program.
1 For example, a belief that impact on safety comes chiefly through citing violations in order to remove hazards could suggest an emphasis on programmed inspections targeted at workplaces where the most (serious) violations could be cited. Once at the workplace, the inspector should focus on finding those hazards. A different approach might focus on getting employers to implement and improve their Injury and Illness Prevention Programs. Once on site, an inspector would focus on assessing how well that was working and make suggestions for what needed to be done. 2 We should note that, although this study is devoted to identifying problems and opportunities, it is important to recognize that the California program is a national leader in many respects. These include its standard-setting, its focus on safety programs, and its permit programs in construction.

2
Cal-OSHA is already examining possible new approaches to targeting programmed inspections. Although we discuss programmed inspections in relation to the other types, the chief focus of this paper is on complaint inspections and AIs. We have some new findings about both of these inspection types, and the findings have possible implications for policy.
For understanding the discussion presented here, readers need to keep in mind some of the ambiguities in Cal-OSHA’s objectives. Since legislation in 1993, the agency has been mandated to focus on “employers in high hazardous industries with the highest incidence of preventable occupational injuries and illnesses and workers’ compensation losses” (see California Commission on Health and Safety and Workers’ Compensation [CHSWC], 2008, pp. 35–39). One problem is that the industries with the highest frequency rates do not necessarily have the highest losses. At a more basic level, the prime objective of safety and health programs is to improve safety—i.e., to reduce injuries and illnesses—and researchers have not established whether this goal can best be reached by focusing on workplaces with the highest rates, the highest losses, the most-serious violations, or some other measures.
The objectives of enforcement are multiple and can be hard to measure. At the highest level, one goal is to prevent the most injury and illness losses. Yet, largely because it is difficult to measure the effect of enforcement activities on those outcomes, the objective is often redefined in terms of ones over which inspectors have more control: detecting and abating violations of standards, especially serious violations. Whether one focuses on injury outcomes or compliance outcomes, measuring the deterrent effect of inspections—the steps that employers take because of fear of being inspected and penalized for noncompliance—has proven difficult. Although we could do a better job of measuring the deterrent effect,3 it seems likely that, for the near future, the focus will remain on the effects of enforcement at inspected workplaces.
Different inspection types play somewhat different roles. The roles that AIs play are (1) punishing employers whose behavior contributed to a serious injury, (2) providing information to regulators about the causes of accidents, and (3) providing some general deterrent effect via the threat of a potentially costly inspection if a serious injury occurs at a workplace. The investigations may also provide evidence for lawsuits filed by injured workers outside the workers’ compensation system, although doing so is not an explicit purpose.
Complaint inspections provide a method for workers to try to protect themselves. To the extent that workers are willing to complain, they can greatly extend the scope of the Occupational Safety and Health Administration’s (OSHA’s) impact. A worker who complains and gives OSHA his or her name raises the probability of an inspection from a very low number to close to 100 percent. Thus, the implicit or explicit threat of a complaint provides leverage to employees for getting the managers to comply with OSHA standards without having an actual
3 The U.S. Department of Labor’s Draft Strategic Plan for Fiscal Years 2011–2016 stated that its agencies should carry out random surveys of compliance in order to be able to make determinations about whether compliance had improved.

3
inspection. Again, we have very little data about how often the threat of a complaint has induced employers to take preventive actions.4
Programmed inspections are those that are planned by the agency, rather than reacting to an accident or complaint.5 In California, these are carried out through several different mechanisms. For some workplaces, programmed inspections are targeted randomly within industries whose rate is at least twice the statewide average. There is also a much smaller program to target individual establishments whose workers’ compensation loss experience is much higher than the average for its category. These are targeted only if they refuse to request a consultation (a nonenforcement intervention) to help them. However, a majority of the programmed inspections in both manufacturing and construction are not randomly targeted. In the construction industry, many programmed inspections are targeted because inspectors came across active sites while they were traveling. There are also other sources for programmed inspections (e.g., the carcinogen registration list, the construction activity permittee list, and various special emphasis programs) (see CHSWC, 2008, pp. 35–39; and CHSWC, 2012).
The outline of this paper is as follows:
• In Section 2, we review the number of violations cited in different types of inspections in different sectors and in different size categories of establishments.
• In Section 3, we examine how the injury rates at inspected establishments differ depending on the type of inspection.
• In Section 4, we examine the large variations in the frequency of complaint inspections per 1,000 establishments across different California counties and the implications.
• In Section 5, we present evidence that the hospitalization cases that are supposed to be immediately reported to Cal-OSHA are underreported to a substantial degree, especially in rural counties and Southern California.
• In Section 6, we report on how the number of violations cited in an inspection declines depending on how many inspections an establishment has already had.
• In Section 7, we review the policy implications of the topics covered. • An appendix provides an excerpt of the California Labor Code that covers reporting of
work-related injury.
4 We do know that sometimes the threat leads an employer to take action against the complaining employee. In fiscal year (FY) 2011, more than 1,600 cases of employer retaliation were reported to OSHA; more than 400 were sustained or settled. See U.S. Department of Labor, 2013. 5 There are several other smaller inspection categories—e.g., follow-up inspections, referral inspections—that we ignore here.


5
2. Cal-OSHA Inspections and Serious Violation Rates
In the past 20 years in California, the annual number of Cal-OSHA inspections has declined substantially. As Figure 2.1 shows, the reduction has been greatest for complaint inspections, which accounted for about 5,000 of the 6,000 fewer inspections in 2011 than in 1992. However, these numbers may be somewhat misleading. Changes over time in the process for handling complaints include substituting a letter to the employer and to the complainant for an actual inspection.6 Cal-OSHA does not keep track of the number of complaints handled in this manner. (Neither does federal OSHA.) If it did, we might find that the number of complaint interventions has not declined so dramatically.
Figure 2.1: OSHA Inspections, by Type and Year
6 However, Cal-OSHA is supposed to conduct inspections for one of every five complaints handled through the letter/fax procedure.
0
1,000
2,000
3,000
4,000
5,000
6,000
7,000
8,000
9,000
10,000 Inspection Type by Year
Accident
Complaint
Programmed
Other
Inspection Type

6
Although Cal-OSHA has some discretion about the number of complaints to which it responds with inspections, the agency has less discretion about AIs because of California statutory requirements.7 However, it is important to consider AIs because, according to our analysis of the inspection database, they make up 23 percent of Cal-OSHA inspections and a larger share of its resources (because they are more time-consuming). No other state devotes nearly as much. AIs make up only 2 percent of federal OSHA inspections because OSHA limits them almost entirely to fatalities, while California also includes most cases in which workers are hospitalized or suffer amputations.8
We present evidence below that a substantial share (perhaps half) of hospitalizations that should be reported to Cal-OSHA are not reported. If true, this fact has important implications for the AI policy. If a large percentage of employers are escaping scrutiny—and the prospect of significant fines—by failing to report, then those employers that are obeying the rules have a reason to be upset. In addition, if the current program misses a large share of cases, then the implication is that a complete program would require a much larger investment than the sizable share of inspection resources already devoted to AIs.
Without additional resources, the larger share of resources for AIs has to come from reductions elsewhere. The flip side of California’s concentration on AIs is that the share of inspections that are programmed is the lowest of any state. At this time, we lack strong evidence about what allocation among inspection types would have the greatest preventive value. In California, for most of the past decade, programmed inspections have had several components. A minority are random inspections carried out at establishments within industries that have a rate of injuries with days away, restricted, or transferred (DART) at least twice the industry average in the state. Another, smaller category is made up of firms that have very high loss experience on their workers’ compensation policies and that have not agreed to have consultations at their worksites.
Planned inspections typically cite more violations than complaint inspections do (Gray and Mendeloff, 2005). Table 2.1 shows that this holds true in California.9 One reason is that complaint inspections are usually focused on the subject of the complaint, although inspectors may look at other hazards (1) in order to foster some uncertainty about which condition triggered the complaint and (2) if they think that the workplace is unusually hazardous. There have been periodic arguments from industry groups that complaint inspections are sometimes part of efforts
7 See the appendix for an excerpt of California law regarding the requirements for AI. 8 Specifically, federal OSHA investigations are generally limited to fatalities and “catastrophes.” The latter was once defined as an incident in which five or more workers were hospitalized; later, OSHA reduced the number to three or more. Even with the lower threshold, the number of catastrophes is less than 2 percent of the total number of accidents with hospitalizations, according to California data. 9 We also examined the number of serious violations per hour on site but found that they were not very different.

7
to harass the company.10 Although such cases are likely to have occurred, there is little reason to think that they play a substantial role.
Table 2.1 also shows that, within each inspection type, health inspections cite more-serious violations than safety inspections do. However, for the totals, the relationship is reversed. The explanation is that the bulk of all health inspections—more than 60 percent—are carried out as a result of complaints, which have a relatively low violation rate.
Tables 2.2 and 2.3 show that the relative effectiveness of complaint inspections versus programmed inspections in identifying hazards is quite different in construction than in manufacturing. In construction, complaint inspections cite more violations than programmed inspections.11 This finding is not very surprising when we consider that programmed inspections in construction often are chosen because the inspectors have identified them in the course of traveling.12 In contrast, in manufacturing, a sizable minority of programmed inspections are targeted because of the high injury rate of the industry or the bad experience of the firm.
Tables 2.2 and 2.3 also show the relationship of the number of serious violations cited and establishment size or, in the case of construction, firm size.13 Table 2.2 shows that establishment and firm size have a relatively small role to play in programmed inspections (although there is a sizable drop in the very largest establishments); however, Table 2.3 shows that, in complaint inspections, there is a marked decline in serious citations at larger establishments and firms. Those with fewer than 100 employees are cited for about twice the number of serious violations as firms or establishments above that size. About 20 percent of the inspected establishments had more than 100 workers.
10 Smith (1986, p. 35) wrote, The policies of the Occupational Safety and Health Administration (OSHA) toward the handling of worker complaints, however, have changed rather dramatically over time as governmental opinions of the usefulness of complaints have oscillated between two polar views. One view is that employees, having detailed knowledge of their employers’ operations, represent a valuable source of information about workplace risks and violations of federal standards. The other is that the ease with which complaints may be lodged and their guaranteed anonymity, encourage unions or disgruntled employees to harass their employers with trivial complaints.
11 The data used here and in subsequent tables come from inspections conducted in California from 2002 through early 2011. 12 This procedure was described to the authors by Cal-OSHA staff. 13 Our size data come from the inspectors’ entries in the Integrated Management Information System (IMIS) for number of workers at the establishment, the number covered by the inspection, and the number controlled by the firm. For fixed-site workplaces, we use the first of these to categorize workplaces. For construction, however, we use the third measure. The concept of an establishment in construction is defined in a way that makes it difficult to tell exactly what is covered. The firm level seemed to have the clearest meaning in that sector. See Mendeloff et al. (2006).

8
Table 2.1: Average Number of Serious Violations per Inspection, by Inspection Type: Accident Investigation or Complaint Inspection
Inspection Type Safety or Health Mean Number of Serious Violations per Inspection
N of Inspections
Accident Health 1.01 405
Safety 0.78 6,110
Total 0.79 6,515
Complaint Health 0.42 4,071
Safety 0.41 3,359
Total 0.42 7,430
Programmed Health 1.60 703
Safety 1.35 2,458
Total 1.40 3,161
NOTE: Based on a sample of inspections in standard industrial classifications (SICs) 20–51 and 80 from 1999 through early 2007. The differences among inspection types in the mean number of serious violations per inspection are all highly statistically significant (p < 0.0005).

9
Table 2.2: Average Number of Serious Violations per Inspection, Manufacturing Sector, by Size and Inspection Type
Programmed Inspections
Establishment Size Serious Violations per Inspection
Number of Inspections
<11 0.70 1,600
11–19 1.56 840
20–49 1.77 1,126
50–99 2.20 471
100–249 2.08 390
250–499 1.99 136
500–999 1.27 67
1,000+ 1.12 89
Total 1.43 4,719
Complaint Inspections
Establishment Size Serious Violations per Inspection
Number of Inspections
<11 0.58 1,056
11–19 0.71 464
20–49 0.70 942
50–99 0.68 658
100–249 0.58 880
250–499 0.46 324
500–999 0.38 212
1,000+ 0.21 281
Total 0.59 4,817
NOTE: California inspections, 2000–2010.

10
Table 2.3: Average Number of Serious Violations per Inspection, Construction Sector, by Size and Inspection Type
Programmed Inspections
Firm Size Serious Violations per Inspection
Number of Inspections
<11 0.18 6,984
11–19 0.35 1,114
20–49 0.32 2,187
50–99 0.38 1,231
100–249 0.25 1,962
250–499 0.33 544
500–999 0.30 243
1,000+ 0.14 469
Total 0.24 14,734
Complaint Inspections
Firm Size Serious Violations per Inspection
Number of Inspections
<11 0.48 3,425
11–19 0.57 540
20–49 0.48 1,095
50–99 0.39 592
100–249 0.28 812
250–499 0.30 196
500–999 0.08 132
1,000+ 0.15 256
Total 0.43 7,048
NOTE: California inspections, 2000–2010.

11
3. Complaint Inspections and Injury Rates
In this section, we explore another dimension of complaint inspections. Do they tend to take inspectors to workplaces that have above-average injury rates? The answer is that they do; average rates at establishments with complaint inspections are higher than the average rate in their industries and considerably higher than the injury rates of establishments that get programmed inspections. (See also Scherer and Owen, 1995.)
In order to arrive at this answer, we checked data for each facility inspected since 1996 to see whether there was information available about its injury rate in that year. For establishments in SIC categories above 1799 (i.e., excluding agriculture, mining, and construction), we matched 8,361 inspections with the related injury rate.14 We looked separately at AIs, complaint inspections, planned inspections, and all other inspection types. Table 3.1 shows the findings of this analysis for the four industries with the largest numbers of inspections during this period. The injury rates at establishments inspected in planned inspections are almost always lower than the rates of establishments inspected through any of the other inspection types. As we noted above, some business groups have argued that complaint inspections were often triggered by concerns unrelated to safety. For those holding this view, the finding that complaint inspections take inspectors, on average, to high-rate workplaces would be surprising. Although the injury rates at establishments getting planned inspections are lower than for the other major inspection types, we saw earlier that they cited the most violations. Thus, there appears to be little relationship between the injury rate and the likelihood of violations at inspected establishments.
14The injury data come from the OSHA Data Initiative (ODI), which is injury-rate data that OSHA has collected since 1996 from about 80,000 establishments each year. In some years, the collection is a census of all establishments in an industry above a certain size. In other cases, it includes only establishments whose rates were above a threshold in that year. These 8,361 observations represent OSHA inspections during 1996–2010 of establishments (SIC > 1799) that also have ODI data for that year and for which we have at least ten ODI records (nationwide) in that year for the four-digit SIC (so we can calculate a meaningful industry injury rate, which is calculated by excluding the inspected plant from the industry rate calculation). The rates we have actually include both injuries and illnesses. We looked at both the total recordable rate and the lost-workday/DART rates. The patterns are similar, and we show only the latter here.

12
Table 3.1: Lost-Workday Injury Rates per 100 Workers, by Industry and Inspection Type, 2002–2010
SIC Planned Complaint Accident Other
20 (food) 6.6 (187) 7.4 (188) 7.8 (420) 7.5 (87)
24 (wood) 5.3 (82) 8.5 (57) 9.2 (158) (18)
34 (metal fabrication) 4.3 (83) 6.6 (93) 6.9 (206) 5.7 (39)
37 (transportation equipment) 7.3 (113) 10.5 (148) 7.9 (113) 7.2 (54)
NOTE: The numbers of inspections are in parentheses. These were the four industries with the most cases in which inspection data could be matched with injury-rate data for that establishment in the year of the inspection from the ODI. We exclude the rate for “other” inspection types in SIC 24 because of the small number of cases.
There are two aspects of targeting to consider here. One is whether the industries that
complaints come from are high-rate industries. The other is whether the complaints come from establishments that have high injury rates for their industries. Table 3.2 provides some insights about the answer to the first question. The higher rate of AIs in an industry is a rough measure of the rate of serious injuries. The table confirms that programmed inspections and AIs are more concentrated in higher-rate sectors (agriculture, construction, and manufacturing) than complaint inspections are. Thus, for example, 20.6 percent of all complaint inspections took place in construction, while 29.9 percent of AIs occurred there. In contrast, 11.5 percent of all complaint inspections occurred in retail trade, where only 5.7 percent of AIs took place.15
15 Huber (2007) did find that establishments in industries with high injury rates were more likely to have complaint inspections than those in industries with lower rates. However, this is not inconsistent with the findings in Table 3.2 because inspections of other types are even more likely than complaints to come from sectors with higher rates.

13
Table 3.2: Percentage of California Inspections Accounted for by Each Type in Selected Industries, 1996–2010
Industry Accident Complaint Programmed
Agriculture and agricultural services 8.3 4.0 15.3
Construction 29.9 20.6 45.0
Manufacturing 25.6 16.4 17.0
Utilities, transport 12.3 12.0 3.3
Wholesale trade 4.3 3.7 0.6
Retail trade 5.7 11.5 3.6
Finance 0.6 2.3 0.1
Health care 0.9 6.1 0.3
Education 1.5 5.3 0.1
NOTE: Percentages are the industries’ share of all inspections of each type. Because not all industries are included, they do not add to 100 percent.
Another perspective on the injury rates at inspected establishments comes from asking how
the rates there compare with the average rates in the industry. Figure 3.1 is based on the same data as Table 3.1. For each inspection type, it shows what percentage of the establishments had rates ranging from less than one-third their industry average to more than three times their industry average. The left side of Figure 3.1 shows the percentage of all inspections, by inspection type, that are found among establishments in the safest category (those whose rate is less than one-third as high as the average rate for their four-digit SIC industries). Thus, 29 percent of all programmed inspections take place at establishments that are very safe compared with others within their industry; for complaints, the figure was under 19 percent. Not surprisingly, it is lowest in that injury-rate category for AIs. As we go to categories with higher rates than the industry average, AIs and complaint inspections become relatively more common. So the establishments inspected in programmed inspections are relatively safe within their industry but are in industries that tend to have high rates. Returning to the earlier discussion of targeting programmed inspections, one implication of Figure 3.1 is that it could be valuable to distinguish among the establishments in high-rate industries and inspect those with bad performance within their industries more heavily.
Another implication is that complaints have some ability to distinguish performance within an industry. They are more likely to come from poorer performers in terms of injury rates. An inspector is allowed to expand the scope of a complaint inspection if he or she believes that it would be worthwhile. More encouragement to do so might be useful. Or, when an inspector visits a workplace with a high injury rate but few expected violations, he or she could devote

14
more attention to examining the employer’s injury and illness prevention program (a program mandated by state regulations).
Figure 3.1: Compared with Programmed Inspections, Complaint Inspections Take Cal-OSHA to Establishments with Higher Injury Rates Within Their Industries
NOTE: Figure 3.1 is based on the 8,361 establishments for which we were able to match the California inspection data between 1996 and 2011 with DART injury rates available for the same year from the ODI. The establishments included in the ODI typically are limited to agricultural services, manufacturing, transport, utilities, wholesale trade,
hospitals, and nursing homes. They have often been limited to those with 40 or more employees. The industry injury rates used here are the rates calculated from the establishments in the ODI for an industry. If an industry had fewer
than 25 establishments in the sample, we did not include that industry in the analysis.
0
5
10
15
20
25
30
35
% o
f ins
pect
ons
of th
at ty
pe
Establishment rate/industry rate
Accident Complaint Planned Other
Inspection Type

15
4. Disparities in Complaint Inspection Rates Between Northern and Southern California Counties
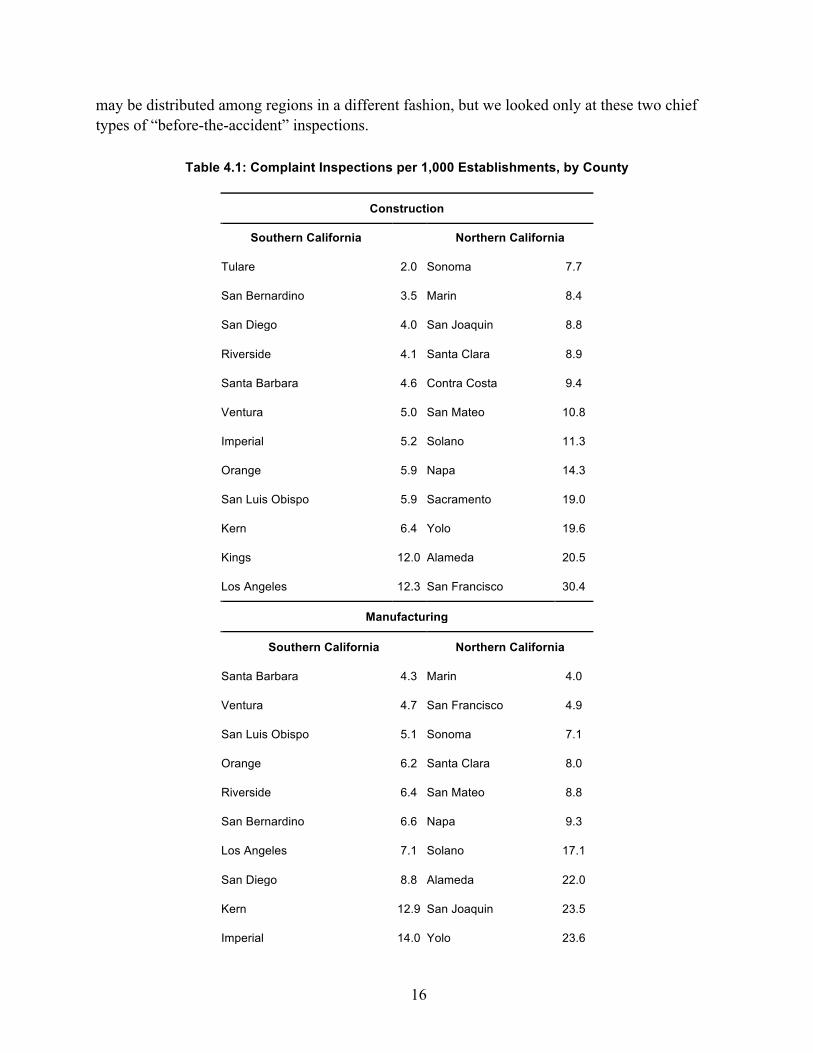
Low rates of worker complaints could indicate either that workers think that they do not need to contact OSHA or that they are inhibited from doing so. The top panel of Table 4.1 compares the number of complaint inspections per 1,000 construction establishments for counties in Southern California and in Northern California.16 As we noted above, complaints in which the complainant provided his or her name lead to formal inspections. Cases in which the complainant will not give his or her name are handled through the fax-letter procedure. Thus, the number of complaint inspections is a measure of the number of complaints for which the complainant gave their name. If we simply take the average inspection rate in each set of 12 counties, the average rate of coverage at counties in the north is about 140 percent higher than the average rate for counties in the south.17 We examined the possibility that Cal-OSHA offices in the Southern California counties were more likely to use the letter/fax procedure to respond to complaints, but we were told that the procedures are uniform.18
Table 4.1 also shows the rate of complaint inspections in manufacturing in the two regions. Although the difference in the average rates was not as large as in construction, the rate in the north was still 50 percent higher. When there is evidence that complaint inspections are relatively rare, it seems important to make sure that other mechanisms compensate.
Cal-OSHA officials noted that Cal-OSHA resources are allocated among districts based on the number of establishments; therefore, if there are fewer complaint inspections, there will be more inspections of other types. We did examine the rate of programmed inspections in each county. With programmed inspections, the average rates were closer for both construction and manufacturing than they were for complaint inspections; however, the average rates in the north were still about 25 percent higher for both sectors. There are other types of inspections, which
16 The number of establishments in each county comes from the online version of County Business Patterns (U.S. Census Bureau) using the number for 2010. Because the inspections counted here come from 2002–2011, the figures here differ somewhat from what a full count of each year’s establishments would give. The rates for counties where the number of establishments increased more quickly over this period would be treated as having more inspection coverage over the entire period than they actually did. Overall, construction employment declined from 2002 to 2011, but it declined more in Northern California than in the south, about 33 percent versus 17 percent. Considering these changes, the overall number of establishments for the whole period would be increased more for the north, leading to somewhat lower inspection rates there. The differences are small compared with the two- to three-fold differences found in Table 3.2 in Section 3. 17 In a national study, Huber (2007) found that the requests for inspections were less frequent in districts that were more conservative in their voting, had fewer unions, and had higher unemployment rates. 18 Interview with Cora Gherga, deputy director for enforcement, Cal-OSHA.
16
may be distributed among regions in a different fashion, but we looked only at these two chief types of “before-the-accident” inspections.
Table 4.1: Complaint Inspections per 1,000 Establishments, by County
Construction
Southern California Northern California
Tulare 2.0 Sonoma 7.7
San Bernardino 3.5 Marin 8.4
San Diego 4.0 San Joaquin 8.8
Riverside 4.1 Santa Clara 8.9
Santa Barbara 4.6 Contra Costa 9.4
Ventura 5.0 San Mateo 10.8
Imperial 5.2 Solano 11.3
Orange 5.9 Napa 14.3
San Luis Obispo 5.9 Sacramento 19.0
Kern 6.4 Yolo 19.6
Kings 12.0 Alameda 20.5
Los Angeles 12.3 San Francisco 30.4
Manufacturing
Southern California Northern California
Santa Barbara 4.3 Marin 4.0
Ventura 4.7 San Francisco 4.9
San Luis Obispo 5.1 Sonoma 7.1
Orange 6.2 Santa Clara 8.0
Riverside 6.4 San Mateo 8.8
San Bernardino 6.6 Napa 9.3
Los Angeles 7.1 Solano 17.1
San Diego 8.8 Alameda 22.0
Kern 12.9 San Joaquin 23.5
Imperial 14.0 Yolo 23.6

17
Tulare 18.4 Contra Costa 24.3
Kings 26.2 Sacramento 30.6
NOTE: Inspections from 2002–2011. Establishment figures from 2010.
Table 4.2: Programmed Inspections per 1,000 Establishments, by County
Construction
Southern California Northern California
Santa Barbara 8.8 Napa 10.0
Tulare 9.1 Santa Clara 11.7
Orange 9.2 San Mateo 13.9
Ventura 12.8 Contra Costa 15.9
San Luis Obispo 13.5 Marin 17.1
Kings 15.8 Sonoma 19.9
Los Angeles 16.8 San Joaquin 21.2
San Bernardino 16.8 Alameda 23.5
San Diego 17.3 Sacramento 29.8
Riverside 20.8 Solano 30.6
Kern 29.7 San Francisco 32.6
Imperial 42.6 Yolo 40.1
Manufacturing
Southern California Northern California
Kings 6.2 Santa Clara 2.6
San Luis Obispo 6.2 Marin 5.3
Riverside 6.7 San Mateo 8.7
Orange 6.8 Sonoma 8.9
Tulare 7.8 Napa 10.0
Santa Barbara 8.3 Sacramento 11.2
Ventura 8.7 Yolo 13.5
San Diego 12.3 Solano 16.7

18
Kern 12.4 Alameda 18.0
Los Angeles 13.4 San Joaquin 18.2
San Bernardino 15.3 San Francisco 19.2
Imperial 19.3 Contra Costa 19.4
NOTE: Inspections from 2002–2011. Establishment figures from 2010.

19
5. Reporting of Accidents to Cal-OSHA
Table 5.1 turns to the topic of AIs. It shows the number of them in construction per 1,000 construction establishments. California employers are required to notify Cal-OSHA within eight hours of any fatality, amputation, or event in which a worker is hospitalized for more than 24 hours (except for observation).19 The table shows that the Southern California counties have fewer AIs, suggesting that they may be safer. However, there are concerns about the completeness of employers’ compliance with the reporting requirement. For obvious reasons, fatalities are reported more fully than hospitalization cases. If we limit the analysis only to investigations of fatal accidents, we find the opposite result—AIs with fatalities per 1,000 establishments are lower in Northern California.
We are not treating this pattern as evidence that construction safety practices are better in the north or even that fatality rates are lower there; there are other factors for which this analysis does not control.20 However, these figures do provide very strong evidence that the quality of reporting of hospitalization cases to Cal-OSHA varies greatly among counties and is lower in Southern California. The available national data indicate that hospitalizations due to work injuries are at least ten to 15 times as common as traumatic work fatalities.21
The rightmost column of Table 5.1 shows the percentage of all AIs in the county that were in response to a fatality. In a majority of the counties in the north, deaths accounted for no more than 17 percent of the investigations; all the counties in the south had higher figures. At the extremes, San Francisco had ten reported nonfatal cases for each reported fatality; in Kings County, there were three reported fatalities for each reported nonfatal case. The San Francisco ratio is much closer to what most experts would expect. The implication is that most hospitalization cases that should be reported to Cal-OSHA for investigation are not reported in the south (and in many rural counties as well).
Cal-OSHA does cite firms (safety order [SO] 342) when it finds that they have not complied with the reporting requirement. From 2007 to 2010, just over 30 percent of establishments with
19 There are exclusions for those injured in highway crashes and by violence. We did examine whether the rates here would differ if we used employment instead of the number of establishments as the denominator. Because the average number of employees per establishment was the same in both regions, the rates did not change. (The southern counties had 2.05 times as many establishments as the northern counties and 2.04 times as many employees.) Other factors that could be examined are the number of self-employed workers in the north and south and possible differences in the types of construction work. 21 For example, the federal estimates of the number of workers who are hospitalized for work-related acute injuries (admitted through the emergency department) are in the range of 50,000 to 70,000 per year (Tyler and Jackson, 2003). The total number of traumatic fatalities has averaged about 5,000 per year. If we drop motor vehicle crashes and violence as causes, the total deaths are around 3,400. So the ratio of hospitalizations to deaths is probably 15:1 or 20:1.

20
investigations for hospitalizations were cited for failing to report the event within the time limits set by law.22
One way in which Cal-OSHA learns that firms have not complied is from reports filed by the emergency medical provider. Those providers are also required by law to report to Cal-OSHA whenever they transport an injured worker to the hospital. It seems plausible that reporting by providers is better when the staff are full-time professionals; those are found more often in urbanized areas, while more-rural areas are more likely to rely on volunteers. We did look at the percentage of AIs in each county in which SO 342 was cited. We found that the percentages were lower in more-rural counties (as measured by population density).
22 For fatalities, the number of SO 342 violations equaled about 12 percent of fatal accidents; for amputations, the figure was about 16 percent. The figures for hospitalizations were the same for construction and nonconstruction sectors. For fatalities and amputations, they were about one-third higher outside construction.

21
Table 5.1: Accident Inspections in Construction per 1,000 Construction Establishments
County Total AIs Fatal AIsa Fatal AIs as Percentage of Total AIs
Northern California
Alameda 9.8 1.7 17
Contra Costa 12.3 2.0 16
Marin 9.0 1.5 17
Napa 15.6 5.3 34
Sacramento 13.0 2.1 16
San Francisco 15.1 1.4 9
San Joaquin 11.0 4.8 45
San Mateo 9.8 1.6 16
Santa Clara 9.8 1.2 12
Solano 12.0 3.1 26
Sonoma 7.0 1.7 24
Yolo 22.4 7.1 32
Southern California
Imperial 20.0 9.4 47
Kern 14.0 6.4 46
Kings 12.0 9.2 77
Los Angeles 10.3 1.9 18
Orange 7.3 1.5 21
Riverside 9.7 2.5 26
San Bernardino 9.6 3.3 34
San Diego 8.2 1.8 22
San Luis Obispo 4.8 2.9 60
Santa Barbara 6.0 2.0 33
Tulare 8.8 5.4 61
Ventura 5.2 2.3 44
a A fatality investigation involving one or more fatality.


23
6. Multiple Inspections at the Same Establishment
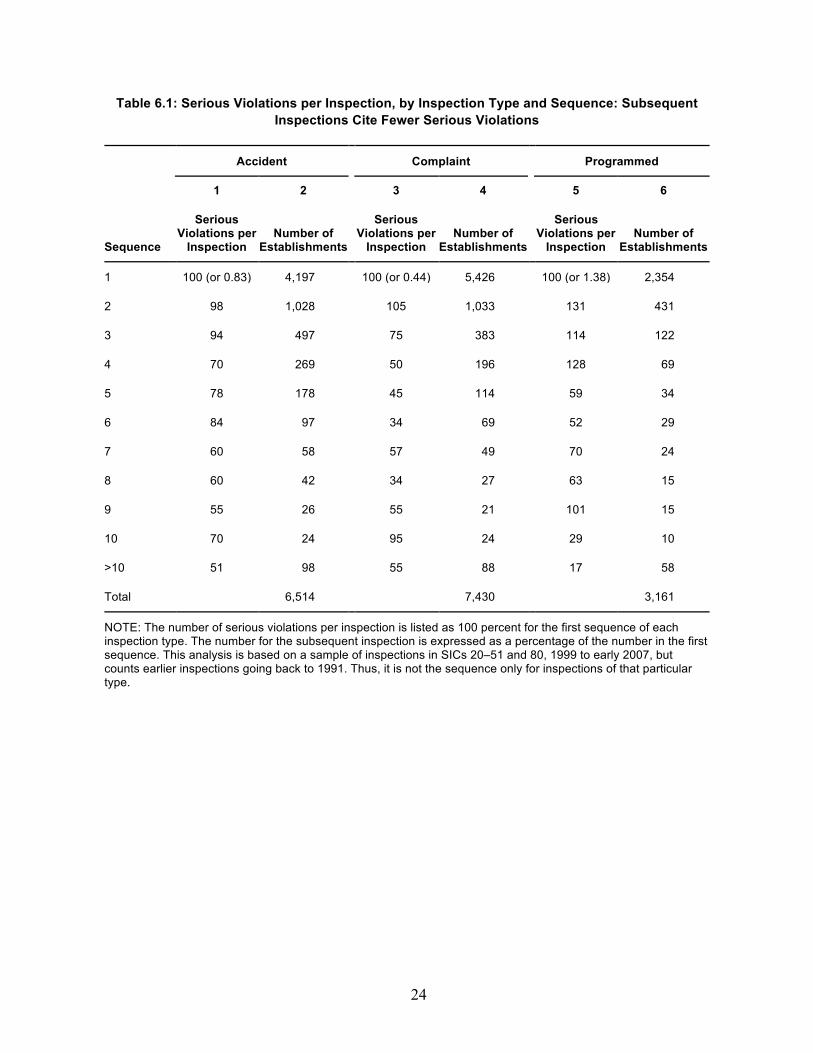
A study of federal OSHA inspections found that the number of violations cited declined by about 50 percent from the first to the second inspection at a workplace and then declined more slowly (Ko, Mendeloff, and Gray, 2010). To examine whether the pattern reflected lower intensity in subsequent inspections, that study controlled for the number of hours the inspector spent on site. Doing so did not change the finding. So it appeared that compliance improved in subsequent inspections. We examined the role of inspection sequence in California (Table 6.1) and found similar, though far weaker, effects.23 Depending on the inspection type, the number of serious violations declined after the second (complaints), the fourth (programmed), or the sixth (AIs) inspection. Because the declines occurred at a later sequence, their impact is not likely to be as important as it is for federal OSHA. However, over time, as more workplaces pass these inspection sequence thresholds, the importance of focusing on less inspected workplaces will grow.
One policy implication of the findings for federal OSHA inspections was that it could be more productive (in terms of citing violations) to inspect workplaces for the first time than to re-inspect. Of course, if the agency is choosing inspection sites based on their risk, then, over time, the pool of never-inspected workplaces will come to have smaller inherent risks.24 For California, although the argument is not quite as strong as for federal OSHA, the suggestion to give some priority to less frequently inspected workplaces probably remains a very good idea.
23 The table on inspection sequence does not provide information on how the “yield” of an inspection varies depending on the number of each type of prior inspection. What happens when the first programmed inspection comes after two complaint inspections? What happens when the second inspection is a programmed inspection that follows another programmed inspection? Also, the analysis here does not distinguish between safety and health inspections. 24 Of course, the inflow of newly created workplaces will modify this conclusion.
24
Table 6.1: Serious Violations per Inspection, by Inspection Type and Sequence: Subsequent Inspections Cite Fewer Serious Violations
Accident Complaint Programmed
1 2 3 4 5 6
Sequence
Serious Violations per
Inspection Number of
Establishments
Serious Violations per
Inspection Number of
Establishments
Serious Violations per
Inspection Number of
Establishments
1 100 (or 0.83) 4,197 100 (or 0.44) 5,426 100 (or 1.38) 2,354
2 98 1,028 105 1,033 131 431
3 94 497 75 383 114 122
4 70 269 50 196 128 69
5 78 178 45 114 59 34
6 84 97 34 69 52 29
7 60 58 57 49 70 24
8 60 42 34 27 63 15
9 55 26 55 21 101 15
10 70 24 95 24 29 10
>10 51 98 55 88 17 58
Total 6,514 7,430 3,161
NOTE: The number of serious violations per inspection is listed as 100 percent for the first sequence of each inspection type. The number for the subsequent inspection is expressed as a percentage of the number in the first sequence. This analysis is based on a sample of inspections in SICs 20–51 and 80, 1999 to early 2007, but counts earlier inspections going back to 1991. Thus, it is not the sequence only for inspections of that particular type.

25
7. Conclusion
The focus of this paper has been to contribute some insights about the role of complaint inspections and AIs in the Cal-OSHA program.
Cal-OSHA has relatively little information that would help it understand the impact of its responses to complaints. First, its current data procedures do not provide easily accessible information about the complaints that it handles through the fax-letter procedure. It does not track or report how many complaints have been handled this way or what the subjects of the complaints were. We also cannot tell from the reported data which inspections were carried out as part of the policy of inspecting 20 percent of fax-letter procedures to find out whether the employer’s response was accurate. Finally, even for regular complaint inspections, we do not know the subject of the complaint and thus cannot use the inspection results to assess how well workers are able to monitor noncompliance with different standards.
Cal-OSHA staff have noted that one reason for not tracking that information is that the information would become publicly available and that, if an employer knew the subject of a complaint, it could figure out who made the complaint. This argument may have some merit, although it is important to note that the fax-letter procedure requires describing the subject of the complaint to the employer. Thus, the current policies appear to be inconsistent.
We have shown that complaint inspections actually do a good job of taking inspectors to workplaces with high injury rates—the rates there are even higher than the rates at establishments currently subjected to programmed inspections. It may be worthwhile trying to think about how that strength could be leveraged. Perhaps complaint inspections at very high-rate workplaces should be expanded to focus more on the quality of the safety programs at those establishments.
Our findings also suggest that there is large-scale underreporting to Cal-OSHA of the hospitalization cases that are the basis for most AIs. Our analysis based this chiefly on the variations among counties in the ratio of investigated deaths to the total of investigated injuries. However, even in counties where the ratio is low—e.g., lower than 1 to 5—there still may be underreporting, and our relative comparison provides no insight into its presence or magnitude. There is a problem of fairness here. Employers that comply with the reporting requirement are very likely to be investigated and face a fairly high probability of getting a big fine. The failure to report appears to go undetected often. Until recently, even when an employer was caught, the fines were typically several hundred dollars, not the $5,000 required by statute. The Appeals Board is now more committed to levying the full penalty, but even that threat is probably unlikely to have a major effect in the absence of better methods of detection. Those methods may include more ongoing scrutiny of the hospital bills submitted to workers’ compensation insurers. More work on the feasibility of detecting nonreporting of serious injuries should be undertaken.
The underreporting of hospitalization cases raises another important policy issue. Suppose that better reporting would lead to a 50-percent increase in the number of reported cases. Should Cal-OSHA increase the percentage of inspections devoted to AIs from the current 25 percent to

26
37.5 percent or even higher? The current statute would seem to require that result. Effort needs to be devoted to examining whether the benefits of even the current level of injury investigations—far exceeding the percentage of inspections done in other states—justify the costs in forgone programmed inspections or other uses of those resources.

27
Appendix
§342. Reporting Work-Connected Fatalities and Serious Injuries (a) Every employer shall report immediately by telephone or telegraph to the nearest District Office of the Division of Occupational Safety and Health any serious injury or illness, or death, of an employee occurring in a place of employment or in connection with any employment.
Immediately means as soon as practically possible but not longer than eight hours after the employer knows or with diligent inquiry would have known of the death or serious injury or illness. If the employer can demonstrate that exigent circumstances exist, the time frame for the report may be made no longer than 24 hours after the incident.
Serious injury or illness is defined in section 330(h), Title 8, California Administrative Code. [Section 330(h) states that “Serious injury or illness” means any injury or illness occurring in a place of employment or in connection with any employment which requires inpatient hospitalization for a period in excess of 24 hours for other than medical observation or in which an employee suffers a loss of any member of the body or suffers any serious degree of permanent disfigurement, but does not include any injury or illness or death caused by the commission of a Penal Code violation, except the violation of Section 385 of the Penal Code, or an accident on a public street or highway.]
(b) Whenever a state, county, or local fire or police agency is called to an accident involving an employee covered by this part in which a serious injury, or illness, or death occurs, the nearest office of the Division of Occupational Safety and Health shall be notified by telephone immediately by the responding agency.
(c) When making such report, whether by telephone or telegraph, the reporting party shall include the following information, if available:
(1) Time and date of accident.
(2) Employer’s name, address and telephone number.
(3) Name and job title, or badge number of person reporting the accident.
(4) Address of site of accident or event.
(5) Name of person to contact at site of accident.
(6) Name and address of injured employee(s).
(7) Nature of injury.
(8) Location where injured employee(s) was (were) moved to.
(9) List and identity of other law enforcement agencies present at the site of accident.
(10) Description of accident and whether the accident scene or instrumentality has been altered.

28
(d) The reporting in (a) and (b) above, is in addition to any other reports required by law and may be made by any person authorized by the employers, state, county, or local agencies to make such reports.
NOTE: Authority cited: Sections 60.5, 6308 and 6409.1, Labor Code. Reference: Sections 6302(h), 6307, 6308, 6313 and 6409, Labor Code.

29
References
California Commission on Health and Safety and Workers’ Compensation, “Background Report on California Occupational Safety and Health Programs,” February 2008.
———, CHSWC 2012 Annual Report, December 2012. As of October 7, 2013: http://www.dir.ca.gov/chswc/Reports/2012/CHSWC_AnnualReport2012.pdf
CHSWC—See California Commission on Health and Safety and Workers’ Compensation.
Gray, Wayne B., and John M. Mendeloff, “The Declining Effects of OSHA Inspections on Manufacturing Injuries, 1979–1998,” Industrial and Labor Relations Review, Vol. 58, No. 4, July 2005, pp. 571–587.
Huber, Gregory A., The Craft of Bureaucratic Neutrality: Interests and Influence in Governmental Regulation of Occupational Safety, New York: Cambridge University Press, 2007.
Ko, Kilkon, John Mendeloff, and Wayne Gray, “The Role of Inspection Sequence in Compliance with the US Occupational Safety and Health Administration’s (OSHA) Standards: Interpretations and Implications,” Regulation and Governance, Vol. 4, No. 1, March 2010, pp. 48–70.
Levine, David I., Michael W. Toffel, and Matthew S. Johnson, “Randomized Government Safety Inspections Reduce Worker Injuries with No Detectable Job Loss,” Science, Vol. 336, No. 6083, May 18, 2012, pp. 907–911.
Mendeloff, John, Christopher Nelson, Kilkon Ko, and Amelia M. Haviland, Small Businesses and Workplace Fatality Risk: An Exploratory Analysis, Santa Monica, Calif.: RAND Corporation, TR-371-ICJ, 2006. As of October 6, 2013: http://www.rand.org/pubs/technical_reports/TR371.html
Mendeloff, John, and Seth Seabury, Evaluating Possible Deterrence Programs for the Department of Labor, Santa Monica, Calif.: RAND Corporation, unpublished research, February 2012.
Scherer, Robert F., and Crystal L. Owen, “OSHA Inspections: Process and Outcomes in Programmed Inspections Versus Complaint-Investigated Inspections,” Employee Responsibilities and Rights Journal, Vol. 8, No. 3, September 1995, pp. 245–254.
Smith, Robert Stewart, “Greasing the Squeaky Wheel: The Relative Productivity of OSHA Complaint Inspections,” Industrial and Labor Relations Review, Vol. 40, No. 1, October 1986, pp. 35–47.
Tyler, Keisha L., and Larry L. Jackson, “Hospitalized Occupational Injuries and Illnesses Treated in United States Emergency Departments,” 131st annual meeting of the American Public Health Association, Abstract 66617, November 17, 2003.

30
U.S. Department of Labor, “Whistleblower Investigation Data: FY2005–FY2013 Q3,” c. 2013. As of October 7, 2013: http://www.whistleblowers.gov/whistleblower/wb_data_FY05-13-Q3.pdf
U.S. Department of Labor, Office of the Secretary, “DOL Draft Strategic Plan for Fiscal Years 2011–2016,” 2010.