Embed Size (px)
Citation preview

Inspection of Complex Geometries Using the Full Matrix Capture Technique
Ray TEN GROTENHUIS, Andrew HONG, Alex SAKUTA, Ontario Power Generation Inc., Canada
ABSTRACT
Unlike the majority of PWR designs which utilize a single reactor pressure vessel, CANDU PHWR
nuclear units comprise many individual fuel channels. Each fuel channel is equipped with a separate
inlet and outlet pipe to supply coolant. Collectively these pipes are referred to as feeder pipes. The
feeder pipes have a range of sizes, configurations and orientations, the permutations of which create a
wide range of complex geometries. Flow Assisted Corrosion (FAC) has been identified as a degradation
mechanism within the feeders. Of particular concern is the area immediately under feeder welds and
adjacent the weld cap. Continued degradation has necessitated inspection for the purposes of supporting
Fitness For Service evaluation and component Life Cycle Management assessments.
A variety of inspection methods were assessed to identify an appropriate solution for the
inspection. Conventional inspection techniques were found to be incapable of providing the inspection
coverage to the accuracy required by the Inspection Specification. An entirely new inspection approach
was devised to address the feeder FAC inspection. The strategy is based upon the Full Matrix Capture
data acquisition technique. The defining attribute for this method is that for any given transducer
positioned relative to the target, all possible UT data is collected. The system developed at OPG is
based on a commercial data acquisition unit and includes a software suite developed in house, and custom
dual axis manipulators with associated peripherals. The system was integrated into a package and was
successfully deployed at OPG’s Pickering NGS Unit 4 campaign in 2011. The inspection achieved the
requirements of the Inspection Specification with excellent coverage. Due to increased autonomy, the
inspection system achieved substantial dose reduction compared to convention inspection tools.
KEYWORDS
Full Matrix Capture, Complex Geometry, Ultrasonic Testing
INTRODUCTION
The Canadian Deuterium Uranium (CANDU) PHWR design shares a number of design elements with
other PWRs. These elements include; a basic PHT loop, steam generators, a secondary side or steam
loop. The key difference between CANDUs and PWRs is the nature of the reactor Pressure Vessel. In
lieu of the single pressure vessel as used by PWRs, the CANDU employs numerous individual
pressurized fuel channels. This design feature is a key element in enabling on-line fuelling of the
reactor. The number of fuel channels varies based on reactor design however is in the range of 380 to
480 per unit. Each fuel channel is equipped with piping, known as feeders, to supply heavy water to the
channel and return the coolant to the header and thus the steam generator, see Figure 1.
4th International CANDU In-service Inspection Workshop and NDT in Canada 2012 Conference, 2012 June 18-21, Toronto, Ontario
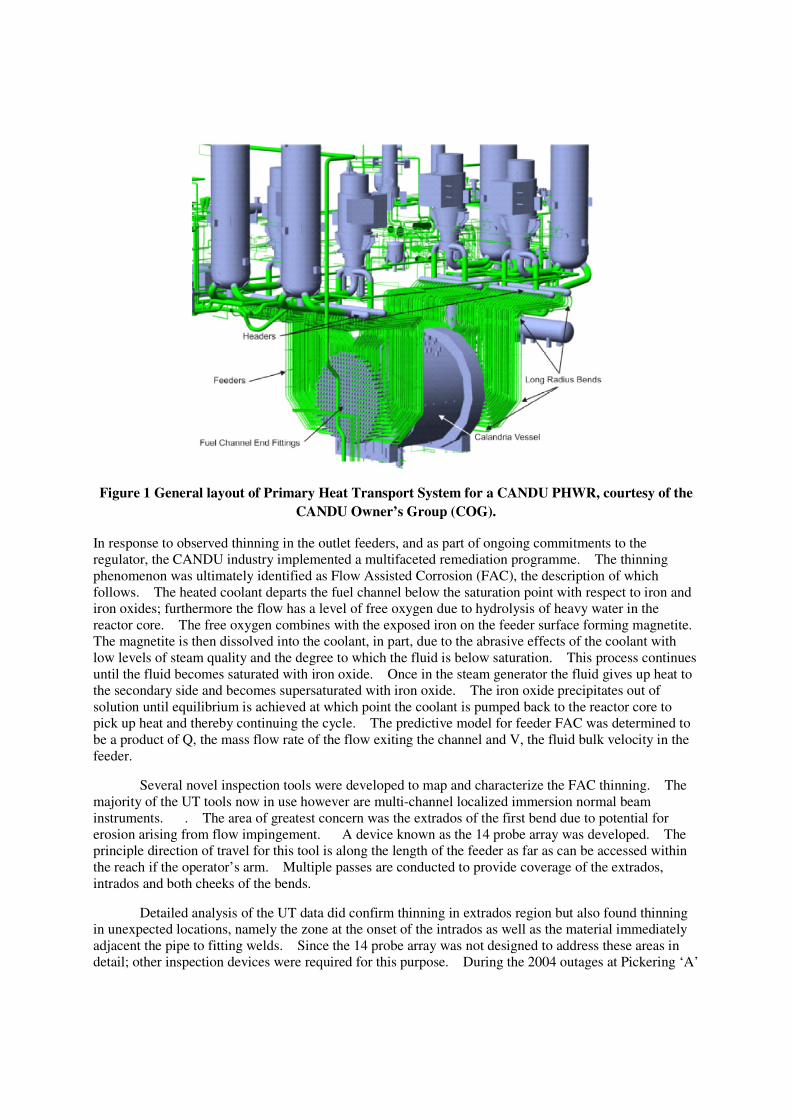
Figure 1 General layout of Primary Heat Transport System for a CANDU PHWR, courtesy of the
CANDU Owner’s Group (COG).
In response to observed thinning in the outlet feeders, and as part of ongoing commitments to the
regulator, the CANDU industry implemented a multifaceted remediation programme. The thinning
phenomenon was ultimately identified as Flow Assisted Corrosion (FAC), the description of which
follows. The heated coolant departs the fuel channel below the saturation point with respect to iron and
iron oxides; furthermore the flow has a level of free oxygen due to hydrolysis of heavy water in the
reactor core. The free oxygen combines with the exposed iron on the feeder surface forming magnetite.
The magnetite is then dissolved into the coolant, in part, due to the abrasive effects of the coolant with
low levels of steam quality and the degree to which the fluid is below saturation. This process continues
until the fluid becomes saturated with iron oxide. Once in the steam generator the fluid gives up heat to
the secondary side and becomes supersaturated with iron oxide. The iron oxide precipitates out of
solution until equilibrium is achieved at which point the coolant is pumped back to the reactor core to
pick up heat and thereby continuing the cycle. The predictive model for feeder FAC was determined to
be a product of Q, the mass flow rate of the flow exiting the channel and V, the fluid bulk velocity in the
feeder.
Several novel inspection tools were developed to map and characterize the FAC thinning. The
majority of the UT tools now in use however are multi-channel localized immersion normal beam
instruments. . The area of greatest concern was the extrados of the first bend due to potential for
erosion arising from flow impingement. A device known as the 14 probe array was developed. The
principle direction of travel for this tool is along the length of the feeder as far as can be accessed within
the reach if the operator’s arm. Multiple passes are conducted to provide coverage of the extrados,
intrados and both cheeks of the bends.
Detailed analysis of the UT data did confirm thinning in extrados region but also found thinning
in unexpected locations, namely the zone at the onset of the intrados as well as the material immediately
adjacent the pipe to fitting welds. Since the 14 probe array was not designed to address these areas in
detail; other inspection devices were required for this purpose. During the 2004 outages at Pickering ‘A’
NGS, several feeders were removed from service from Units 1 and 4. All feeders exhibited the expected
wide spread FAC type thinning, however most feeders also exhibited highly localized thinning on the
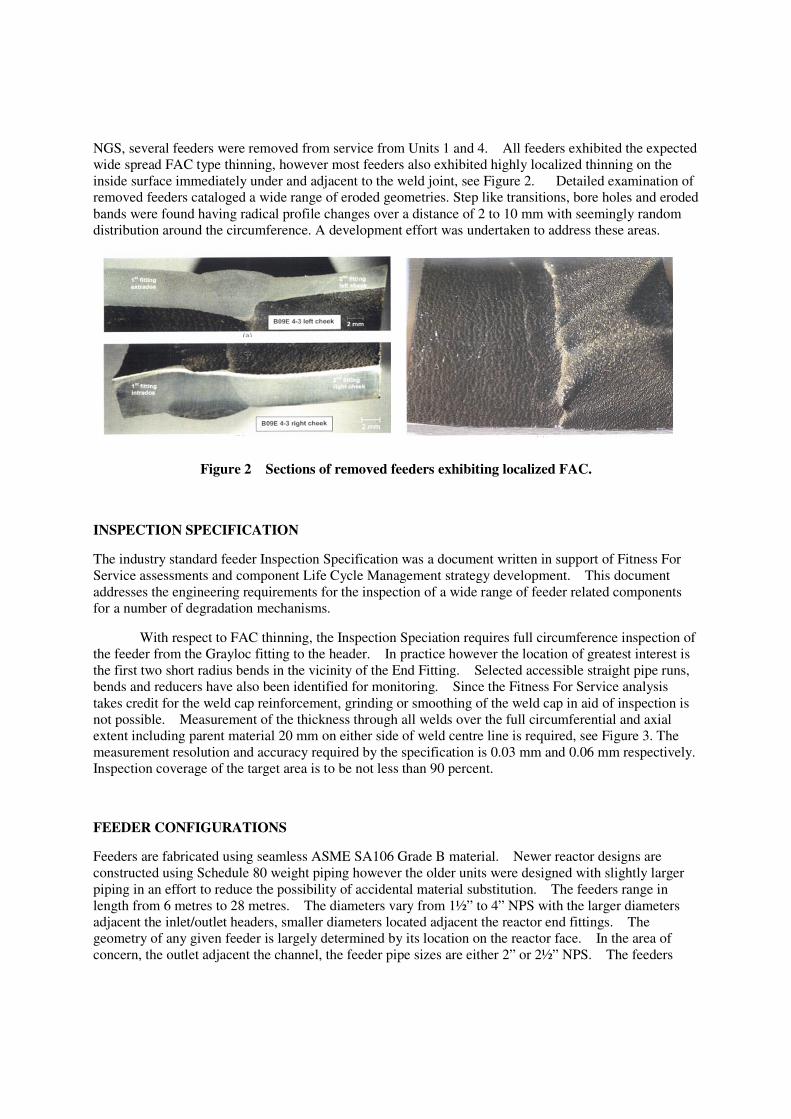
inside surface immediately under and adjacent to the weld joint, see Figure 2. Detailed examination of
removed feeders cataloged a wide range of eroded geometries. Step like transitions, bore holes and eroded
bands were found having radical profile changes over a distance of 2 to 10 mm with seemingly random
distribution around the circumference. A development effort was undertaken to address these areas.
Figure 2 Sections of removed feeders exhibiting localized FAC.
INSPECTION SPECIFICATION
The industry standard feeder Inspection Specification was a document written in support of Fitness For
Service assessments and component Life Cycle Management strategy development. This document
addresses the engineering requirements for the inspection of a wide range of feeder related components
for a number of degradation mechanisms.
With respect to FAC thinning, the Inspection Speciation requires full circumference inspection of
the feeder from the Grayloc fitting to the header. In practice however the location of greatest interest is
the first two short radius bends in the vicinity of the End Fitting. Selected accessible straight pipe runs,
bends and reducers have also been identified for monitoring. Since the Fitness For Service analysis
takes credit for the weld cap reinforcement, grinding or smoothing of the weld cap in aid of inspection is
not possible. Measurement of the thickness through all welds over the full circumferential and axial
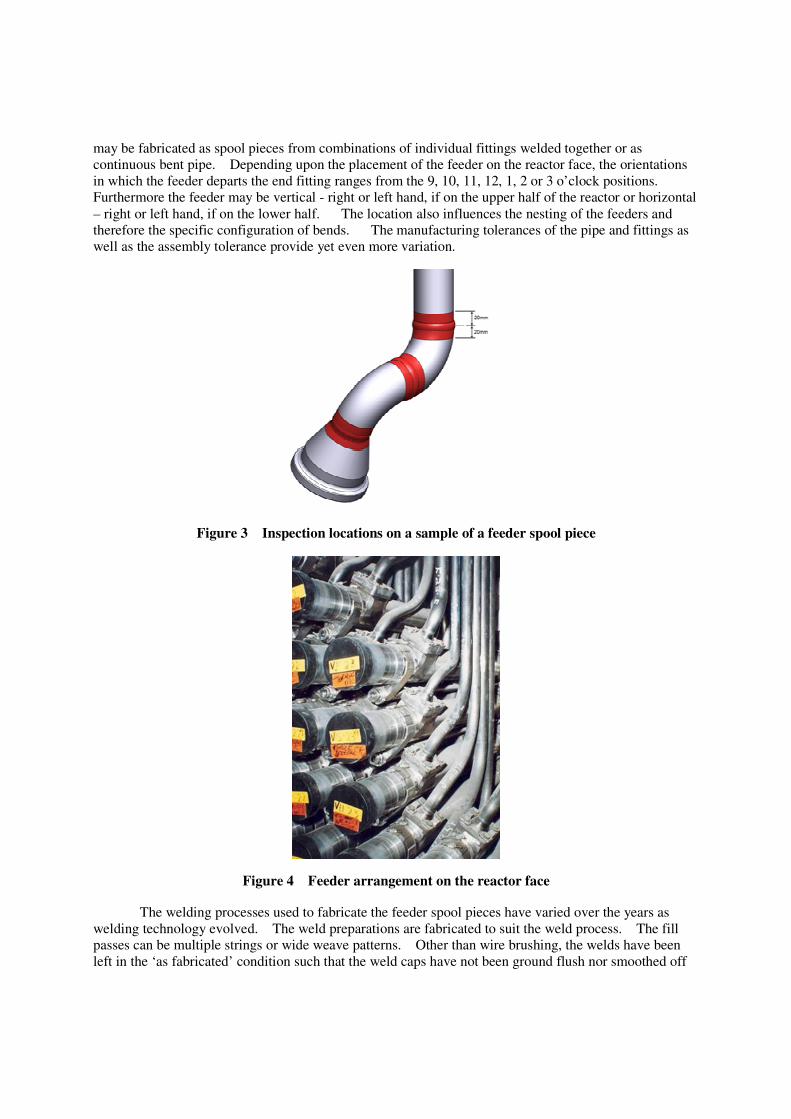
extent including parent material 20 mm on either side of weld centre line is required, see Figure 3. The
measurement resolution and accuracy required by the specification is 0.03 mm and 0.06 mm respectively.
Inspection coverage of the target area is to be not less than 90 percent.
FEEDER CONFIGURATIONS
Feeders are fabricated using seamless ASME SA106 Grade B material. Newer reactor designs are
constructed using Schedule 80 weight piping however the older units were designed with slightly larger
piping in an effort to reduce the possibility of accidental material substitution. The feeders range in
length from 6 metres to 28 metres. The diameters vary from 1½” to 4” NPS with the larger diameters
adjacent the inlet/outlet headers, smaller diameters located adjacent the reactor end fittings. The
geometry of any given feeder is largely determined by its location on the reactor face. In the area of
concern, the outlet adjacent the channel, the feeder pipe sizes are either 2” or 2½” NPS. The feeders
may be fabricated as spool pieces from combinations of individual fittings welded together or as
continuous bent pipe. Depending upon the placement of the feeder on the reactor face, the orientations
in which the feeder departs the end fitting ranges from the 9, 10, 11, 12, 1, 2 or 3 o’clock positions.
Furthermore the feeder may be vertical - right or left hand, if on the upper half of the reactor or horizontal
– right or left hand, if on the lower half. The location also influences the nesting of the feeders and
therefore the specific configuration of bends. The manufacturing tolerances of the pipe and fittings as
well as the assembly tolerance provide yet even more variation.
Figure 3 Inspection locations on a sample of a feeder spool piece
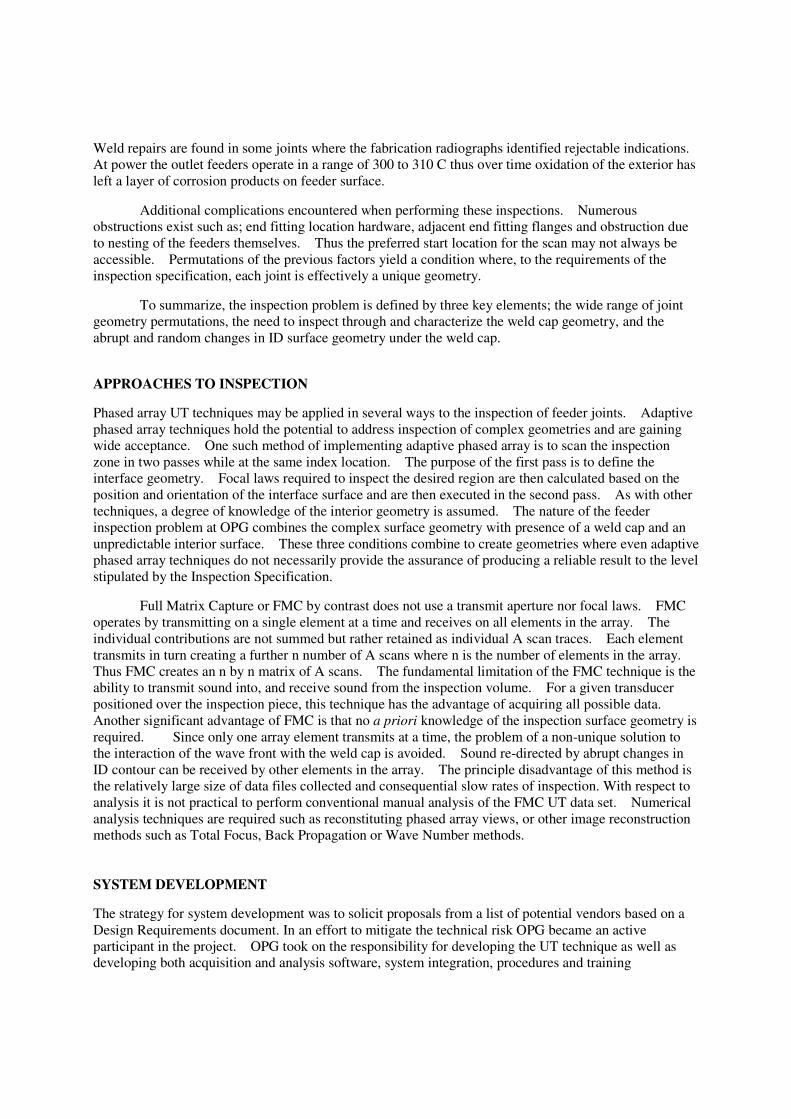
Figure 4 Feeder arrangement on the reactor face
The welding processes used to fabricate the feeder spool pieces have varied over the years as
welding technology evolved. The weld preparations are fabricated to suit the weld process. The fill
passes can be multiple strings or wide weave patterns. Other than wire brushing, the welds have been
left in the ‘as fabricated’ condition such that the weld caps have not been ground flush nor smoothed off
Weld repairs are found in some joints where the fabrication radiographs identified rejectable indications.
At power the outlet feeders operate in a range of 300 to 310 C thus over time oxidation of the exterior has
left a layer of corrosion products on feeder surface.
Additional complications encountered when performing these inspections. Numerous
obstructions exist such as; end fitting location hardware, adjacent end fitting flanges and obstruction due
to nesting of the feeders themselves. Thus the preferred start location for the scan may not always be
accessible. Permutations of the previous factors yield a condition where, to the requirements of the
inspection specification, each joint is effectively a unique geometry.
To summarize, the inspection problem is defined by three key elements; the wide range of joint
geometry permutations, the need to inspect through and characterize the weld cap geometry, and the
abrupt and random changes in ID surface geometry under the weld cap.
APPROACHES TO INSPECTION
Phased array UT techniques may be applied in several ways to the inspection of feeder joints. Adaptive
phased array techniques hold the potential to address inspection of complex geometries and are gaining
wide acceptance. One such method of implementing adaptive phased array is to scan the inspection
zone in two passes while at the same index location. The purpose of the first pass is to define the
interface geometry. Focal laws required to inspect the desired region are then calculated based on the
position and orientation of the interface surface and are then executed in the second pass. As with other
techniques, a degree of knowledge of the interior geometry is assumed. The nature of the feeder
inspection problem at OPG combines the complex surface geometry with presence of a weld cap and an
unpredictable interior surface. These three conditions combine to create geometries where even adaptive
phased array techniques do not necessarily provide the assurance of producing a reliable result to the level
stipulated by the Inspection Specification.
Full Matrix Capture or FMC by contrast does not use a transmit aperture nor focal laws. FMC
operates by transmitting on a single element at a time and receives on all elements in the array. The
individual contributions are not summed but rather retained as individual A scan traces. Each element
transmits in turn creating a further n number of A scans where n is the number of elements in the array.
Thus FMC creates an n by n matrix of A scans. The fundamental limitation of the FMC technique is the
ability to transmit sound into, and receive sound from the inspection volume. For a given transducer
positioned over the inspection piece, this technique has the advantage of acquiring all possible data.
Another significant advantage of FMC is that no a priori knowledge of the inspection surface geometry is
required. Since only one array element transmits at a time, the problem of a non-unique solution to
the interaction of the wave front with the weld cap is avoided. Sound re-directed by abrupt changes in
ID contour can be received by other elements in the array. The principle disadvantage of this method is
the relatively large size of data files collected and consequential slow rates of inspection. With respect to
analysis it is not practical to perform conventional manual analysis of the FMC UT data set. Numerical
analysis techniques are required such as reconstituting phased array views, or other image reconstruction
methods such as Total Focus, Back Propagation or Wave Number methods.
SYSTEM DEVELOPMENT
The strategy for system development was to solicit proposals from a list of potential vendors based on a
Design Requirements document. In an effort to mitigate the technical risk OPG became an active
participant in the project. OPG took on the responsibility for developing the UT technique as well as
developing both acquisition and analysis software, system integration, procedures and training
documentation. Other members of the development team were: Kinectrics Ltd., for manipulators and
electronics, Peak NDT, for the instrumentation, and Imasonic, for the transducers. The project delivered
three complete inspection systems, inclusive of manipulators and associated ancillaries, a fully populated
blade chassis for analysis. The duration of the development effort was approximately 20 months at a
cost of 5.8 million Canadian dollars.
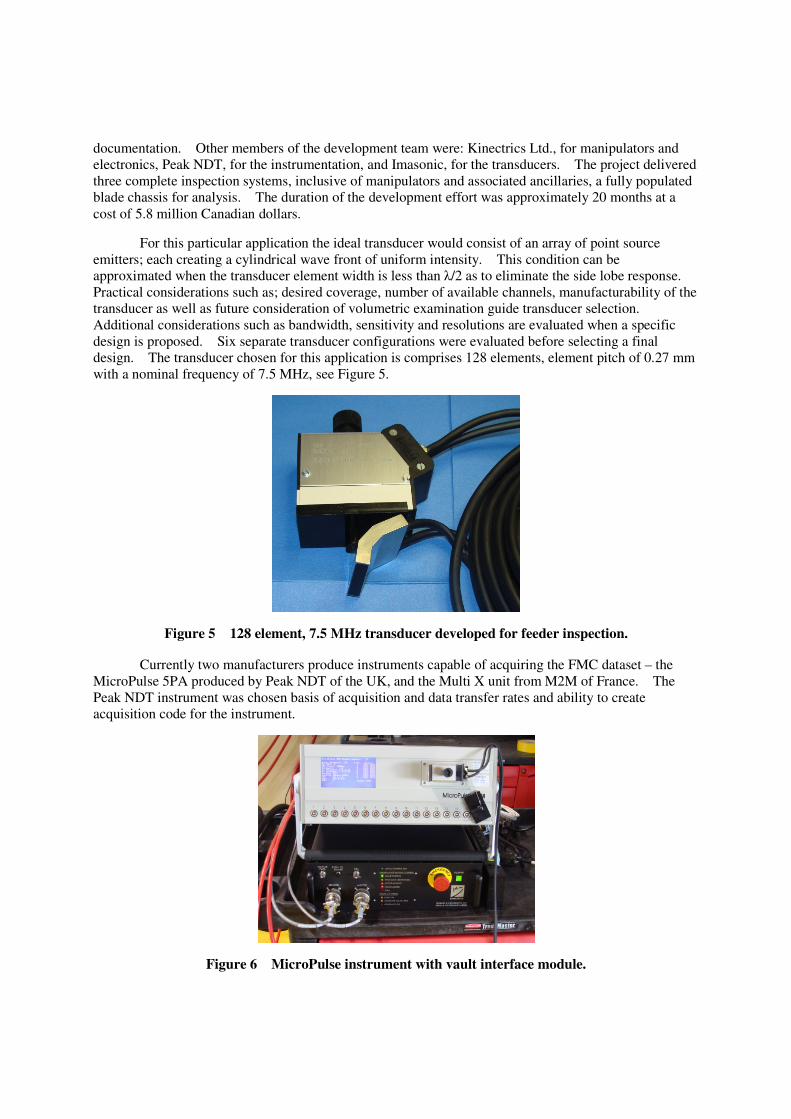
For this particular application the ideal transducer would consist of an array of point source
emitters; each creating a cylindrical wave front of uniform intensity. This condition can be
approximated when the transducer element width is less than λ/2 as to eliminate the side lobe response.
Practical considerations such as; desired coverage, number of available channels, manufacturability of the
transducer as well as future consideration of volumetric examination guide transducer selection.
Additional considerations such as bandwidth, sensitivity and resolutions are evaluated when a specific
design is proposed. Six separate transducer configurations were evaluated before selecting a final
design. The transducer chosen for this application is comprises 128 elements, element pitch of 0.27 mm
with a nominal frequency of 7.5 MHz, see Figure 5.
Figure 5 128 element, 7.5 MHz transducer developed for feeder inspection.
Currently two manufacturers produce instruments capable of acquiring the FMC dataset – the
MicroPulse 5PA produced by Peak NDT of the UK, and the Multi X unit from M2M of France. The
Peak NDT instrument was chosen basis of acquisition and data transfer rates and ability to create
acquisition code for the instrument.
Figure 6 MicroPulse instrument with vault interface module.
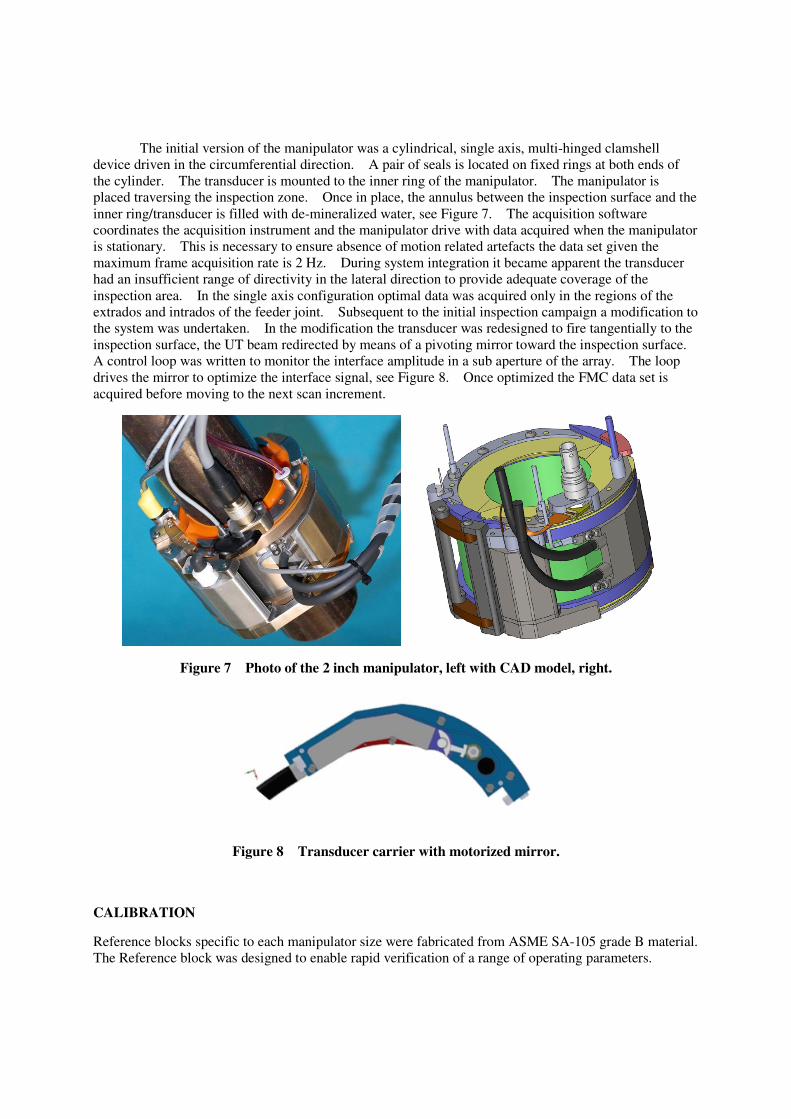
The initial version of the manipulator was a cylindrical, single axis, multi-hinged clamshell
device driven in the circumferential direction. A pair of seals is located on fixed rings at both ends of
the cylinder. The transducer is mounted to the inner ring of the manipulator. The manipulator is
placed traversing the inspection zone. Once in place, the annulus between the inspection surface and the
inner ring/transducer is filled with de-mineralized water, see Figure 7. The acquisition software
coordinates the acquisition instrument and the manipulator drive with data acquired when the manipulator
is stationary. This is necessary to ensure absence of motion related artefacts the data set given the
maximum frame acquisition rate is 2 Hz. During system integration it became apparent the transducer
had an insufficient range of directivity in the lateral direction to provide adequate coverage of the
inspection area. In the single axis configuration optimal data was acquired only in the regions of the
extrados and intrados of the feeder joint. Subsequent to the initial inspection campaign a modification to
the system was undertaken. In the modification the transducer was redesigned to fire tangentially to the
inspection surface, the UT beam redirected by means of a pivoting mirror toward the inspection surface.
A control loop was written to monitor the interface amplitude in a sub aperture of the array. The loop
drives the mirror to optimize the interface signal, see Figure 8. Once optimized the FMC data set is
acquired before moving to the next scan increment.
Figure 7 Photo of the 2 inch manipulator, left with CAD model, right.
Figure 8 Transducer carrier with motorized mirror.
CALIBRATION
Reference blocks specific to each manipulator size were fabricated from ASME SA-105 grade B material.
The Reference block was designed to enable rapid verification of a range of operating parameters.
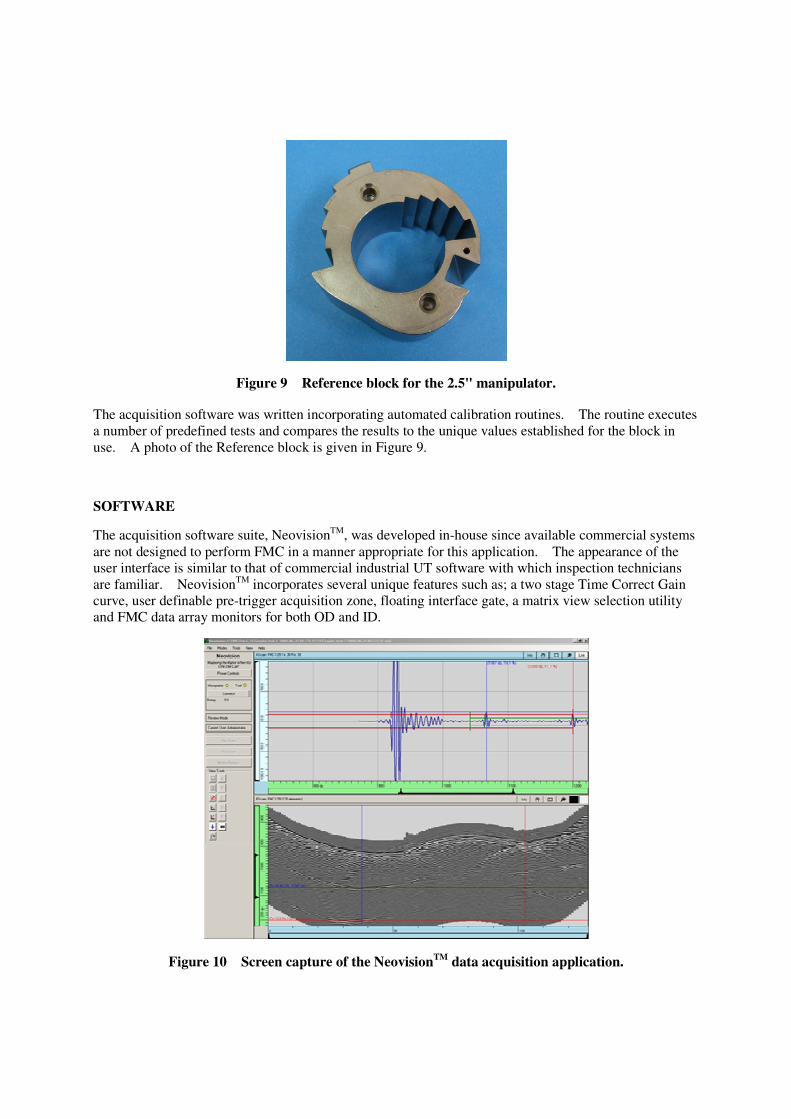
Figure 9 Reference block for the 2.5" manipulator.
The acquisition software was written incorporating automated calibration routines. The routine executes
a number of predefined tests and compares the results to the unique values established for the block in
use. A photo of the Reference block is given in Figure 9.
SOFTWARE
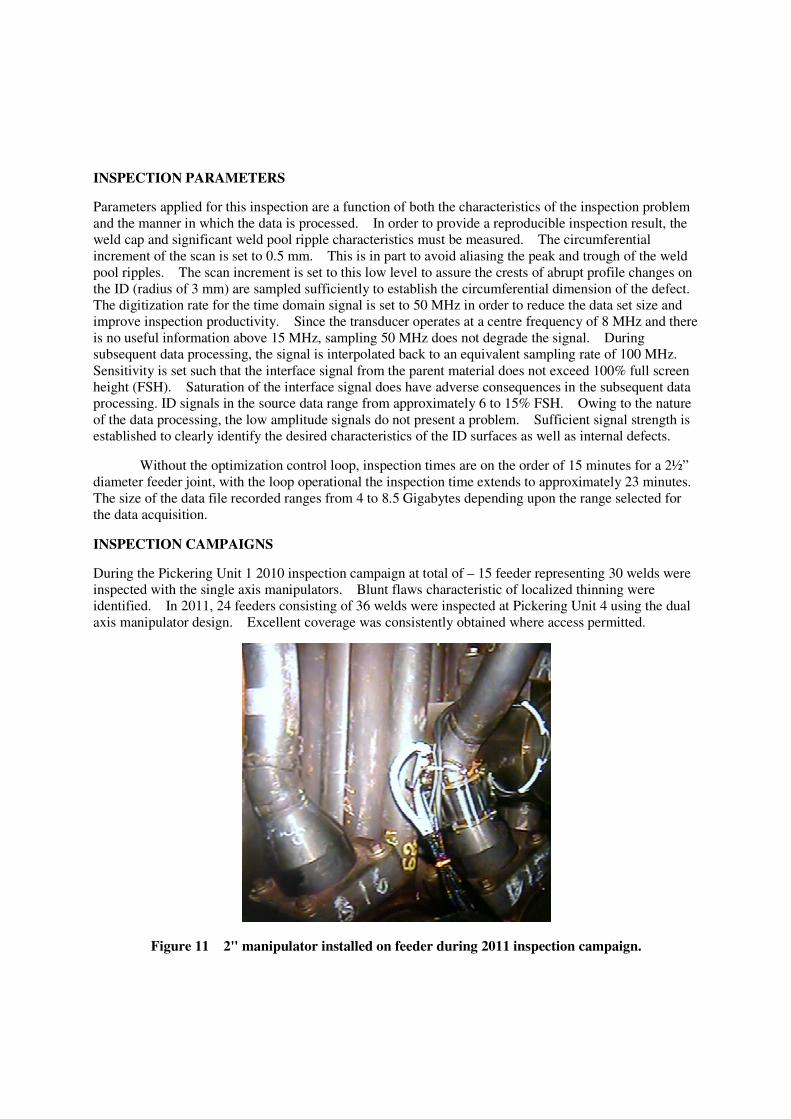
The acquisition software suite, NeovisionTM, was developed in-house since available commercial systems
are not designed to perform FMC in a manner appropriate for this application. The appearance of the
user interface is similar to that of commercial industrial UT software with which inspection technicians
are familiar. NeovisionTM
incorporates several unique features such as; a two stage Time Correct Gain
curve, user definable pre-trigger acquisition zone, floating interface gate, a matrix view selection utility
and FMC data array monitors for both OD and ID.
Figure 10 Screen capture of the NeovisionTM
data acquisition application.
INSPECTION PARAMETERS
Parameters applied for this inspection are a function of both the characteristics of the inspection problem
and the manner in which the data is processed. In order to provide a reproducible inspection result, the
weld cap and significant weld pool ripple characteristics must be measured. The circumferential
increment of the scan is set to 0.5 mm. This is in part to avoid aliasing the peak and trough of the weld
pool ripples. The scan increment is set to this low level to assure the crests of abrupt profile changes on
the ID (radius of 3 mm) are sampled sufficiently to establish the circumferential dimension of the defect.
The digitization rate for the time domain signal is set to 50 MHz in order to reduce the data set size and
improve inspection productivity. Since the transducer operates at a centre frequency of 8 MHz and there
is no useful information above 15 MHz, sampling 50 MHz does not degrade the signal. During
subsequent data processing, the signal is interpolated back to an equivalent sampling rate of 100 MHz.
Sensitivity is set such that the interface signal from the parent material does not exceed 100% full screen
height (FSH). Saturation of the interface signal does have adverse consequences in the subsequent data
processing. ID signals in the source data range from approximately 6 to 15% FSH. Owing to the nature
of the data processing, the low amplitude signals do not present a problem. Sufficient signal strength is
established to clearly identify the desired characteristics of the ID surfaces as well as internal defects.
Without the optimization control loop, inspection times are on the order of 15 minutes for a 2½”
diameter feeder joint, with the loop operational the inspection time extends to approximately 23 minutes.
The size of the data file recorded ranges from 4 to 8.5 Gigabytes depending upon the range selected for
the data acquisition.
INSPECTION CAMPAIGNS
During the Pickering Unit 1 2010 inspection campaign at total of – 15 feeder representing 30 welds were
inspected with the single axis manipulators. Blunt flaws characteristic of localized thinning were
identified. In 2011, 24 feeders consisting of 36 welds were inspected at Pickering Unit 4 using the dual
axis manipulator design. Excellent coverage was consistently obtained where access permitted.
Figure 11 2" manipulator installed on feeder during 2011 inspection campaign.
PROPOSED ENHANCEMENTS
Several enhancements are planned for the system addressing acquisition rate improvements. The
proposed improvements would see the time needed for inspection drop from 23 minutes to less than 8
minutes. Other improvements address manipulator robustness, streamlining of the user interface and
further automation of the set-up and scanning processes. Extension to other applications such as;
dissimilar metal welds, nozzles and weldolets has been proposed.
CONCLUSIONS
Full Matrix Capture technology has been developed and successfully deployed in two separate feeder
inspection campaigns. Following suitable numerical analysis the positive attributes of this approach are:
• Excellent coverage of the inspection zone has been obtained though complex, variable geometries
with ‘as fabricated’ weld pool
• Other than physical obstructions and mechanical limitations, the sole constraint encountered was
the ability to introduce sound to, and receive sound from the inspection region.
• Accuracy and precision exceed that of the Inspection Specification requirements.
• Clear imaging of the exterior and interior surface profiles has been obtained.
• Highly automated operation of the manipulator requiring minimal operator intervention
The FMC technique however does produce exceptionally large data files and is consequently slower with
respect to speed of acquisition. Further development will significantly improve inspection speed while
making the tool more robust.
REFERENCES
1. L. W. Schmerr, Fundamentals of Ultrasonic Nondestructive Evaluation;, Plenum, New York 1998
2. B. D. Drinkwater and P.D. Wilcox, “Ultrasonic arrays for non-destructive evaluation: A review”;
NDT & E International 39, 525-541, 2006
3. R. Y. Chiao and L. J. Thomas, “Analytical evaluation of sampled aperture ultrasonic imaging
techniques for NDE”; IEEE Transactions on ultrasonics ferroelectrics and frequency control vol.
41, no. 4, 484-493, 1994
4. J. Krautkramer, H. Krautkramer, Ultrasonic Testing 4th ed. Springer, Berlin 1990